 Chunping Miao
 Aiwei Cui1
 Wei Chen
- 1CAS Key Laboratory of Forest Ecology and Management, Institute of Applied Ecology, Chinese Academy of Sciences, Shenyang, China
- 2Shenyang Arboretum, Chinese Academy of Sciences, Shenyang, China
- 3University of Chinese Academy of Sciences, Beijing, China
Urban forest is considered an effective strategy for mitigating urban air pollution via deposition, absorption and dispersion processes. However, previous studies had focused mainly on the deposition effect or removal capacity near the ground, while the net effect of the urban forest on air quality is rarely evaluated in the vertical dimension. In this study, PM2.5 (particulate matter with diameter less than 2.5), PM10 (particulate matter with diameter less than 10 μm), carbon monoxide (CO), sulfur dioxide (SO2), nitrogen dioxide (NO2), and ozone (O3) concentrations, air temperature, relative humidity, and atmospheric pressure at 0, 2.5, 5, 10, 15, 20, 30, 40, 60, 80, and 100 m in urban forest, street, and community areas were collected by unmanned aerial vehicles (UAVs) equipped with Sniffer4D V2 on overcast and sunny days. The PM, CO, NO2, and O3 concentrations increased with height below 20 m and then slightly decreased with height on an overcast day, whereas SO2 concentrations decreased with height within 20 m. The urban forest increased PM concentrations in the morning of an overcast day, whereas it decreased PM concentrations in the afternoon of the overcast day. The forest obstructed PM dispersion from the canopy when PM concentrations grew lower in the morning, but it hindered PM from deposition when PM concentrations grew higher in the afternoon.
Introduction
The United Nations (UN) Sustainable Development Goals (SDGs) state that good health and wellbeing of people, sustainable cities, and communities are indispensable to achieving the SDGs (United Nations, 2015; Diao et al., 2021) for which they were formulated. The continuous urban expansion and industrial development have made air pollution a serious problem in urban areas (Llaguno-Munitxa et al., 2017; Ren et al., 2022; Xiong et al., 2022), thereby affecting the environment. The World Health Organization (WHO) reported that the air quality of almost 97% of cities in low- and middle-income countries failed to meet the WHO standard (World Health Organization, 2018). Air pollution caused by particulate matter (PM), nitrogen dioxide (NO2), ozone (O3) carbon monoxide (CO), and sulfur dioxide (SO2) is a serious environmental issue that threatens human health and hinders the realization of the SDGs in the urbanized areas (Tomson et al., 2021; Miao et al., 2022).
Urban forest has been highlighted to offer a mitigation potential to improve air quality (Pataki et al., 2021; Ren et al., 2021) and is the focus of current attention with regard to scaling down pollution. It regulates air pollutant concentrations through various processes such as dispersion, absorption, and deposition (Chen et al., 2019; Santiago and Rivas, 2021). It also removes air pollutants from the atmosphere through stomatal absorption, and the interception at tree canopies and surfaces (Abhijith et al., 2017). Deposition and absorption effects on air quality are always positive, whereas aerodynamic effects can be positive or negative (Jennings et al., 2021; Santiago and Rivas, 2021). For example, some studies have reported that the presence of trees reduced ventilation but increased air pollutant concentrations in the built environments (Vranckx et al., 2015; Buccolieri et al., 2018).
The net effect of an urban forest on air quality is balanced with deposition, absorption and dispersion processes, and its scale depends on the background air pollution, microclimatic factors, and forest structures such as leaf area index, height, barrier thickness, stand density and canopy area (Abhijith and Kumar, 2020; Jennings et al., 2021; Li et al., 2021). Diameter at breast height and the distance from the forest to pollution sources showed a more significant influence on the reduction in PM concentrations than the leaf area index, canopy area, or distance to forest edge (Zhu et al., 2019). The removal rate of air pollutants was defined as the relative concentration difference in air pollutants both inside and outside the forest (Hofman et al., 2016; Miao et al., 2021). The comparison of the PM removal rate of different forest types reported a higher value by coniferous forests than by evergreen forests, and a higher value by coniferous forests than by deciduous forests (Han et al., 2020). Sparse planting of trees could reduce PM concentrations, while high-density planting increased PM concentration (Wang et al., 2020).
The vertical pattern of air pollutants was mainly attributable to the combined effect of the diurnal variations of traffic emissions, meteorological conditions, photochemical reactions, and the dynamics of the low atmospheric boundary layer (ABL; Li et al., 2017; Lu et al., 2020). Given that the dispersion of air pollutants varies with height, research on the vertical distribution of air pollutants by the urban forest needs to be carried out to investigate the dispersion of air pollutants (Cavanagh et al., 2009; Wu et al., 2020). Although numerous studies have been conducted to investigate the net benefit of urban forest on air quality, these researches mainly assessed the deposition effect of the urban forest on air pollutants or compared the air pollutant reduction capacities of different plant species near the ground (Han et al., 2020; Viippola et al., 2020; Bonilla-Bedoya et al., 2021). A few works were even carried out to estimate the vertical airflow and air pollutants in the presence of trees in urban street canyon based on the numerical simulation (Ng and Chau, 2012; Buccolieri et al., 2018). They reported an 18% decrease of air pollutant concentration in the presence of trees paralleled with wind. Albeit with larger path areas than street trees, it remains unknown as to what extent an urban forest could affect the vertical profile of air pollutants, particularly from the field observation perspective. This knowledge gap limits the applicability of urban forest planning and management regarding air quality and public health improvement.
Unmanned aerial vehicles (UAVs) equipped with backpack monitoring equipment provide a feasible way to observe the vertical concentrations of air pollutants in urban environments. They ensure the acquisition of air pollutant concentrations with a high temporal and spatial resolution (Peng et al., 2015; Liu et al., 2020, 2021; Wu et al., 2021). Several previous studies based on UAVs' observations were conducted to characterize the horizontal and vertical distribution of air pollutants in rural and urban areas (Li et al., 2017, 2018, 2019; Zheng et al., 2021). However, previous studies were mainly focused on the spatial or temporal distribution of air pollutants, whereas the response of vertical air pollutant distributions to urban structures such as buildings, and green infrastructure was rarely considered.
Overall, it is necessary to estimate the vertical impact of urban forest on air pollutant concentrations to understand better the air purification ability of an urban forest. In this study, a four-rotor UAV equipped with a portable instrument was used to observe PM2.5 (particulate matter with diameter less than 2.5 μm), PM10 (particulate matter with diameter less than 10 μm), SO2, CO, NO2, O3 concentrations and air temperature, relative humidity vertically in an urban forest, a street, and a community area. The pollutant concentrations and their correlation with air temperature and relative humidity were compared among the three areas. The vertical purification effect of an urban forest was also presented and discussed. The results offer a new understanding of air pollutant behavior in relation to the urban forest and provide proper guidelines for forest management to improve the quality of outdoor air.
Methodology
UAV platform and Sniffer4D V2
A four-vector UAV (Dajiang M100) was used to carry portable instruments such as Sniffer4D V2 to observe the PM2.5, PM10, SO2, CO, NO2, and O3 concentrations, air temperature, relative humidity, and atmospheric pressure per second. The UAV weighs 2.355 kg and has a maximum carrying weight of 3.6 kg. The maximum climate and descent rates of the UAV are 5 m/s and 4 m/s, respectively. The vertical hovering accuracy is 0.5 m, and the horizontal accuracy is 2.5 m. Moreover, the size of Sniffer4D V2 is 158 × 103 × 87.5 mm. It is a portable mobile monitoring device with a weight of less than 500 g. It can be installed on the top of UAVs or cars traveling at a speed of less than 80 km/h to record air pollutant concentrations. The PM sensor in the Sniffer4D V2 is a miniaturized laser photometer, which estimates the PM concentrations based on the light scattering principle with a resolution of 1 μg/m3. The gaseous pollutant sensors for SO2, CO, NO2, and O3 are electrochemical sensors, which calculate the concentrations by reacting with the measured gas to generate an electrical signal proportional with a resolution of < 1 ppb (parts per billion; Li et al., 2020).
Field campaigns
The field campaigns were conducted in Shenyang (41°48′11.75″N, 123°25′31.18″E), the capital of Liaoning Province, China. This province has a temperate continental monsoon climate with four distinct seasons. It covers an area of 12,860 km2 and has a permanent resident population, which had reached 9 million by December 2020. The annual air temperature is 6.2–9.7°C, and the annual precipitation stands at 600–800 mm. In this study, the vertical concentrations of PM2.5, PM10, SO2, CO, NO2, O3, air temperature, relative humidity, and atmospheric pressure were collected by UAV equipped with Sniffer4D V2 at three sites including urban forest, street and community areas to estimate the air purification of the forest (Figure 1). The three areas were located in and beside the Shenyang Arboretum, the Institute of Applied Ecology. The Arboretum is located in the central area of Shenyang and covers an area of 5 hectares. Wanliutang street is oriented North–South (N–S) and consists of five traffic lanes in each direction. The community area is composed of six-floor buildings.
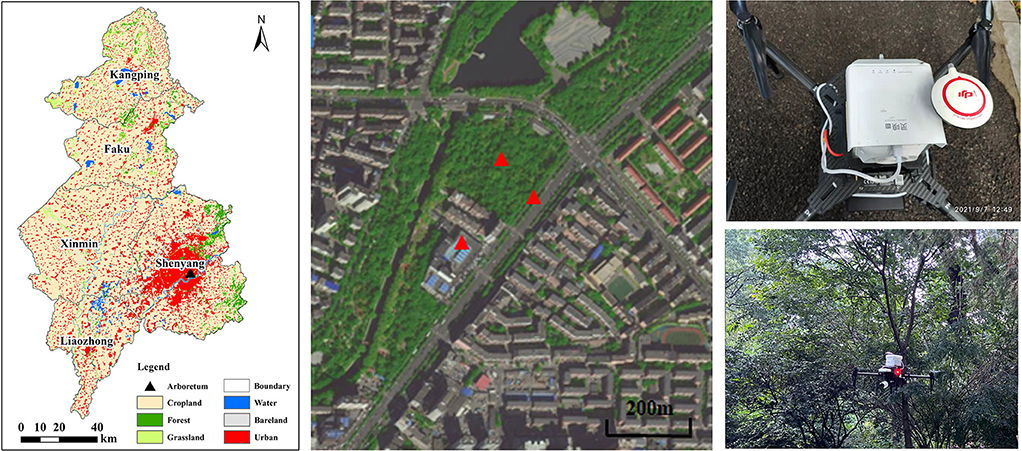
Figure 1. Location of the Arboretum in Shenyang and unmanned aerial vehicles' (UAVs') observation sites in the street canyon, forest, and community areas.
Different dispersion capacities of air pollutants under different weather conditions form different vertical distributions of air pollutants within the low troposphere (Li et al., 2018). In this study, UAV measurements were taken on overcast and sunny weekdays, with a similar traffic volume. The UAV flight was operated at 0–100 m to estimate the vertical influence of the urban forest on air quality in the urban surface. In total, 11 monitoring heights were selected: 0, 2.5, 5, 10, 15, 20, 30, 40, 60, 80, and 100. The UAV hovered at different monitoring heights for 50 s, because the air pollutant monitors need some buffer time to obtain reliable measurements (Zheng et al., 2021). The first 20 s at each height was considered as the buffer time and the data collected during this period were removed to ensure the accuracy of the data. The measurements were taken at 10:00, 14:00, and 18:00 local time on the overcast (3 September 2021) and sunny (17 September 2021) days, respectively. Sniffer 4D V2 observed air pollutant concentrations in the air pumped into the instrument, while the accuracy of the observation can be affected by the airflow around. To eliminate the effect of airflow generated by the UAV during the flight, Sniffer 4D V2 was placed on top of the UAV (Li et al., 2022).
Data analysis
Vertical line charts were plotted to compare the distribution of air pollutants in street canyons, forests, and community areas on overcast and sunny days. Then, pair plots were used to display a matrix of plots for viewing distributions of air pollutants and their correlation relationship with air temperature and relative humidity. The vertical line charts and pair plots were plotted via Hiplot at https://hiplot-academic.com/.
Results
Figure 2 shows the hourly vertical distribution of PM2.5 and PM10 concentrations on overcast and sunny days, respectively. Similar concentration trends were found between PM2.5 and PM10 at the three sites on overcast and sunny days. Both PM2.5 and PM10 concentrations increased with height below 20 m and then maintained a similar value or slightly decreased with height on overcast days, whereas no obvious changes in PM concentrations with height were observed on sunny days. The PM concentrations at 10:00 were significantly higher than those at 18:00 and higher than those at 14:00 on overcast and sunny days. The PM concentrations in the forest were significantly higher than those on the street at 10:00, whereas the situation was reversed at 14:00 and 18:00 on overcast days. The PM concentrations in the forest were significantly lower than those on the street, while no significant difference was found at 14:00 and 18:00 on sunny days. The PM concentrations in the community at 18:00 were significantly higher than those in the forest on overcast and sunny days.
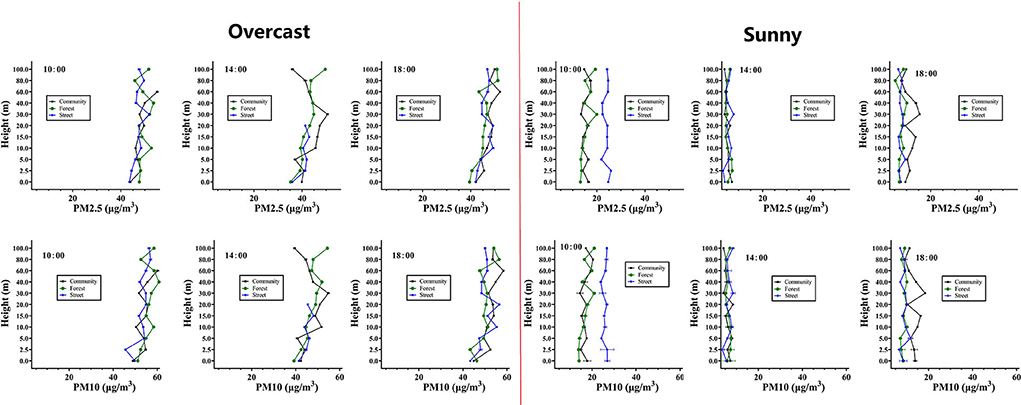
Figure 2. Hourly vertical distributions of PM2.5 (particulate matter with diameter less than 2.5 μm) and PM10 (particulate matter with diameter less than 10 μm) concentrations (mean ± SE) in the overcast and sunny days, respectively.
The CO concentrations at 10:00 were significantly higher than those at 18:00 and higher than those at 14:00 on overcast and sunny days (Figure 3). They increased with height below 15 m and then decreased with the increase of height at the street on overcast days. The CO concentrations first decreased, then increased, and then decreased with the increase of height in the forest on overcast days. The CO concentrations on the street were significantly higher than those in the forest below 20 m, whereas no significant difference in CO concentrations was found above 20 m at 14:00 and 18:00 on the overcast days. They were significantly higher on the street than those in the forest within 100 m at 10:00 on overcast and sunny days. No significant difference was found between CO concentrations on the street and in the forest at 14:00 and 18:00 on sunny days. The CO concentrations in the community were significantly higher than those in the forest and on the street at 18:00 on sunny days.
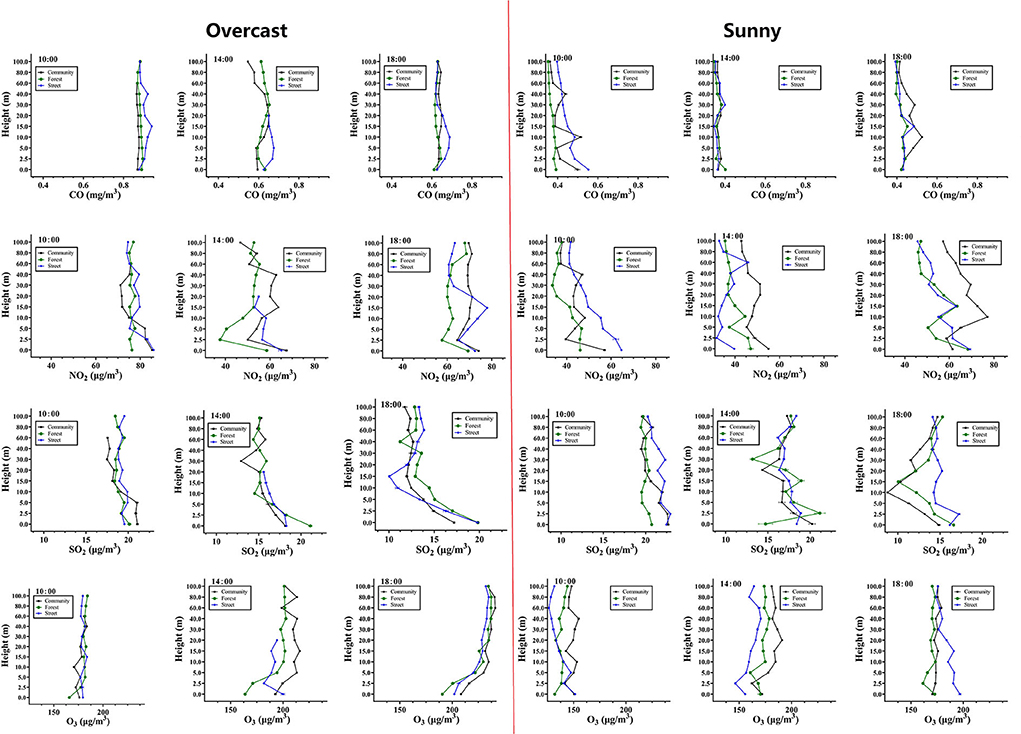
Figure 3. Hourly vertical distributions of carbon monoxide (CO), sulfur oxide (SO2), nitrogen dioxide (NO2), and ozone (O3) concentrations (mean ± SE) on overcast and sunny days, respectively.
The SO2 concentrations decreased with the increase of height within 20 m, whereas no significant difference in SO2 concentrations was found when the height increased from 20 m to 100 m on overcast and sunny days (Figure 3). The SO2 concentrations in the forest were lower than those at the street at 10:00 and 14:00, while the situation was reversed at 18:00 on overcast days. They were significantly lower in the forest than those on the street at 10:00 and 18:00 on sunny days. The SO2 concentrations in the forest decreased slower than those at the street when the concentration decreased.
The NO2 concentrations near the ground were higher than those at 2.5 m at 10:00, 14:00, and 18:00 on overcast and sunny days (Figure 3). They increased with the increase of height to 20 m from 2.5 m and then decreased with the height on the overcast day and sunny days. The NO2 concentrations were significantly lower in the forest than those on the street at 10:00, 14:00, and 18:00 on overcast days. Similar results were found at 10:00 and 18:00 on sunny days, whereas the situation was reversed at 14:00 on sunny days. The NO2 concentrations at 14:00 were significantly lower than those at 10:00 and 18:00 on sunny days. The O3 concentrations increased with the height increasing within 20 m at 10:00, 14:00, and 18:00 on overcast days, and at 14:00 on sunny days. The differences among O3 concentrations at the three sites on sunny days were larger on overcast days. The O3 concentrations in the forest were higher than those on the street at 14:00, while they were lower than those on the street at 18:00 on sunny days. The O3 concentrations in the community were significantly higher than those in the forest than those on the street at 14:00 on overcast and sunny days.
Easy pair plots were drawn to view the distribution of air pollutants, air temperature, relative humidity, and the correlation between the two of them (Figure 4). Double peaks were found in the distribution of PM2.5 and PM10 concentrations, whereas one peak was found in the distribution of chemical pollutant concentrations such as CO, SO2, NO2, and O3. For PM concentrations, a significantly positive correlation was found with relative humidity at the three sites, whereas only a significantly negative correlation with air temperature was found in the forest. The correlation coefficient between PM2.5 concentration and relative humidity (r = 0.86) in the forest was higher than that on the street (r = 0.85), than that in the community (r = 0.82). For CO concentrations, a significantly positive correlation (r = 0.82) was found with relative humidity, whereas no significant correlation was found with air temperature at the three sites. For SO2 concentrations, a significantly positive correlation (r = 0.29) was found with relative humidity at the three sites, whereas a significantly negative correlation was found with air temperature in the forest (r = −0.35) and at the street (r = −0.42). For NO2 concentrations, a significantly negative correlation was found with air temperature (r = −0.34), whereas a significantly positive correlation was found with relative humidity (r = 0.76) at the three sites. The correlations between NO2 concentration with air temperature and relative humidity in the forest were stronger than those in the street. For O3 concentrations, a significantly positive correlation was found with air temperature (r = 0.35) at the three sites, and a significantly positive correlation was found with relative humidity (r = 0.21) in the forest and the community.
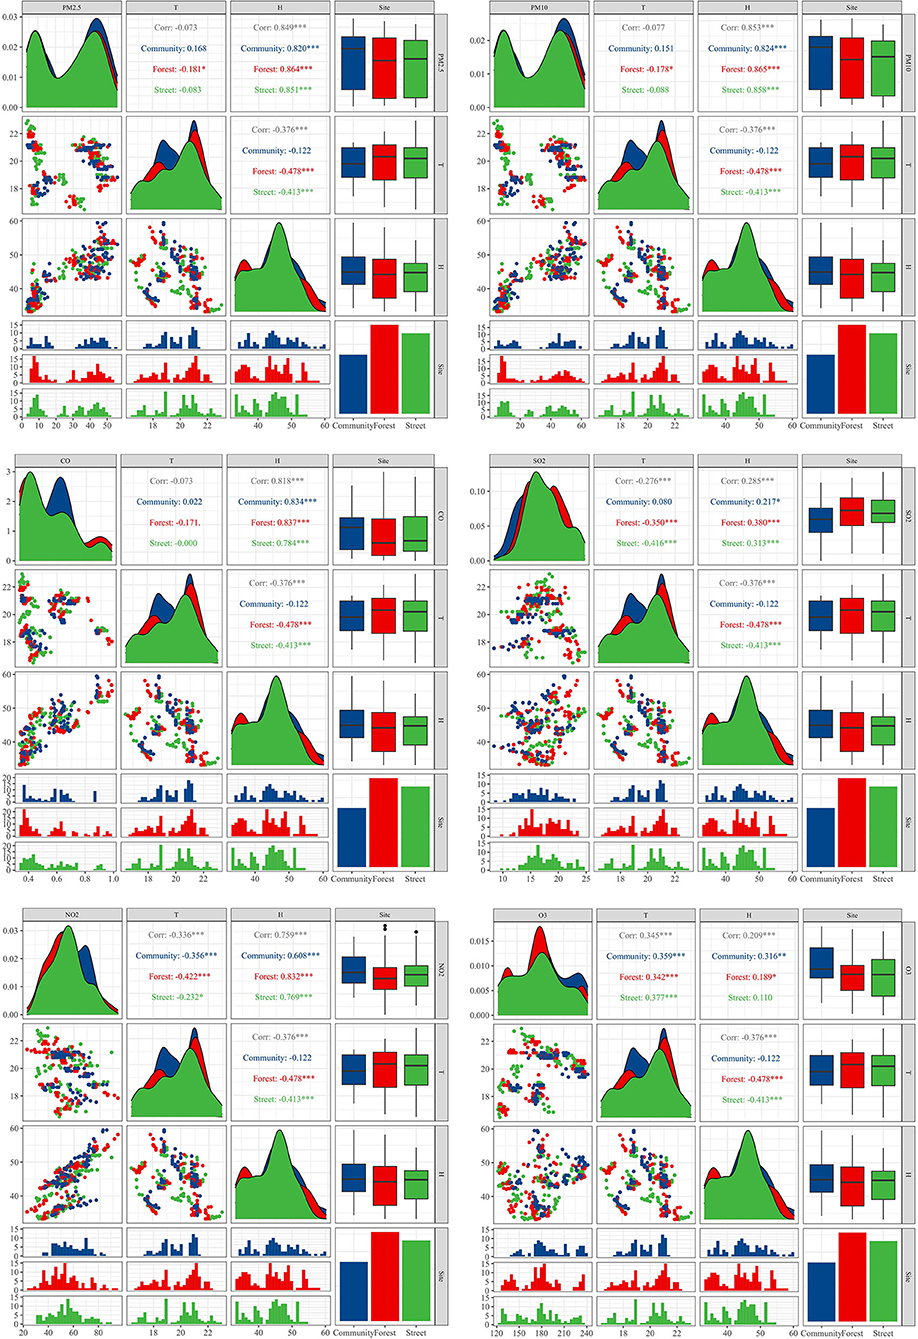
Figure 4. Pair plots for viewing correlation and distributions of air pollutant concentrations, air temperature, and relative humidity. The numbers in the figure show Pearson's correlation coefficient between air pollutants and relative humidity and air temperature totally in the community, forest, and street, respectively.
Discussion
The vertical pattern of air pollutants
In this study, PM concentrations increased with height below 20 m and then slightly decreased with height on overcast days, whereas no obvious changes in PM concentrations with height were observed on sunny days (Figure 2). The different trends between overcast days and on sunny days are probably due to the different background concentrations and meteorological conditions. Two peaks appeared in the distribution maps of PM concentrations, and the vertical distribution of PM concentrations was different on the overcast and sunny days (Figure 4). The higher PM background concentrations and relative humidity, and weaker solar radiations on overcast days were probably the main reasons for the different vertical distributions of PM on sunny days (Li et al., 2017).
The concentrations of gaseous air pollutants, such as CO, NO2, and O3, increased with height within 20 m and then decreased with height on overcast days. Miao et al. (2023) also found a similar trend in NO2 and O3 concentrations in an urban street canyon. However, the SO2 concentrations decreased with the increase of height within 20 m, whereas no significant difference in SO2 concentrations was found when the height increased from 20 m to 100 m on overcast and sunny days (Figure 3). The different vertical trends of SO2 from the other gaseous air pollutants were observed probably due to the lower SO2 background concentration, which made it more sensitive to the impact of traffic emissions and human activities (Lu et al., 2020). The vehicle emissions led to a high SO2 concentration near the ground.
During the day, the PM, CO, and NO2 concentrations decreased from 10:00 to 14:00, and then increased to 18:00, whereas the O3 concentrations increased from 10:00 to 14:00. The increase of O3 is probably due to the high intensity of photochemical reactions that are enhanced by solar radiation during the day (Li et al., 2017; Liu et al., 2020). The higher concentration at 10:00 than at 14:00 was possibly associated with higher traffic emissions hour and lower vertical convection of air masses that hinder the air pollutant dispersion at 10:00 (Li et al., 2017; Lu et al., 2020; Zheng et al., 2021). The increased solar radiation led to rising turbulent effects and a deeper ABL from 10:00 to 14:00 within a day, which improved the vertical diffusion of traffic-emitted pollutants (Lu et al., 2020). The increase from 14:00 to 18:00 took place probably due to the deposition of air pollutants, cooking and traffic emissions, and a rapid shrinkage of ABL (Li et al., 2018). At 18:00, along with sunset, the land cooled rapidly and the thermal-inversion layer was gradually formed. This could trap traffic-emitted particles in the shallow ABL, leading to a rapid increase in PM concentrations (Lu et al., 2020).
On overcast days, PM2.5, PM10, CO, and NO2 concentrations in the community were lower than those on the street at 10:00. The difference between them decreased at 14:00, and the concentrations at the community became higher than at the street at 18:00. The decrease in PM2.5, PM10, CO, and NO2 concentrations from 10:00 to 14:00 was found probably due to the vertical and horizontal transport of air pollutants and decreased traffic volume (Lu et al., 2020). High PM2.5, PM10, CO, and NO2 concentrations in the community at 18:00 were attributable to human activities such as cooking and parking (Ezhilkumar and Karthikeyan, 2020). Whereas O3 concentrations in the community were higher than those on the street and in the forest at both 10:00 and 14:00. The heat stored in the building surface materials increased the ambient temperature, promoted photochemical reactions, and thus increased ozone concentrations (Wang et al., 2021).
Vertical air purification capacity of urban forest
According to the concentration differences between the forest and the street, the forest increased PM concentrations in the morning of the overcast day, whereas decreased PM concentrations were detected in the afternoon on the overcast day. The forest obstructed the horizontal and upward transport of PM when the PM concentrations grew lower in the morning of the overcast day, but it can intercept air pollutants and prevent them from entering the canopy when the PM concentrations grew higher in the afternoon. This is consistent with what Gromke and Ruck (2009) reported that urban forest beside the street hinders the transmission of air pollutants and increases pollutant concentrations. Therefore, the reduced wind velocity and ventilation performance in the urban forest slow down the reduction rate of pollutant concentration when the background concentration decreases (Ng and Chau, 2012). On the other hand, the urban forest can act as a sink for turbulence and provide surfaces for PM deposition (Lin et al., 2020). The forest intercepts air pollutants and prevents them from depositing into the canopy when the background concentration increased. Moreover, the forest decreased PM concentrations on the morning of the sunny day. The purification capacity of the forest on PM was significant when the background concentration was low.
Generally, the forest decreased CO concentrations within 100 m at 10:00 on overcast days. It decreased CO concentrations below 20 m, whereas no significant difference was found above 20 m at 14:00 and 18:00 on the overcast days. That means, the forest hindered the horizontal transport of CO within its canopy height. Moreover, the forest was characterized by low solar heating, which greatly restricted the upward transport of ground-level air pollutants (Lu et al., 2020). Low air temperature in the forest reduced the mixing height of air masses and then formed stable atmospheric conditions that hinder air pollutant dispersion (Ganguly et al., 2019; Miao et al., 2023).
The forest decreased SO2 concentrations at 10:00 and 14:00, while the situation was reversed at 18:00 on overcast days. It decreased SO2 concentrations at 10:00 and 18:00 on sunny days. The SO2 concentrations in the forest decreased slower than those in the street when the concentration decreased. The forest decreased NO2 concentrations at 10:00, 14:00, and 18:00 on overcast days. It decreased NO2 concentrations at 10:00 and 18:00 on sunny days, whereas the situation was reversed at 14:00 on sunny days. The forest increased O3 concentrations at 14:00, while it decreased O3 concentrations at 18:00 on sunny days. The probabilities in the formation of secondary aerosols were high under low solar heating in the forest (Lu et al., 2020). The vertical convection was more important in shaping the ozone vertical distribution than horizontal transport processes (Li et al., 2017).
All the PM, CO, SO2, and NO2 concentrations were significantly positively correlated with relative humidity. The overcast days were always characterized by higher relative humidity and severe air pollution compared with clean days (Miao et al., 2023). Photochemical pollutants such as NO2 and O3 showed a significant correlation with air temperature. The NO2 concentrations were significantly negatively correlated with air temperature, whereas O3 concentrations were significantly positively correlated with air temperature. High air temperature can promote photochemical reactions and ozone formation (Li et al., 2017; Wang et al., 2021). Wang et al. (2021) reported a negative correction between O3 and NO2 concentrations in residential streets. Low NO2 concentrations could reduce the titration of O3 and thus increase O3. The correlations between NO2 concentration with air temperature, and relative humidity in the forest were stronger than those in the street. Moreover, a positive correlation was found between PM concentrations and air temperature in the community areas, rather than in the forest or on the street, probably due to the kitchen exhaust of residential buildings (Ezhilkumar and Karthikeyan, 2020).
Strengths and limitations
Urban forest has attracted worldwide attention for their potential to mitigate local air pollution (Jia et al., 2021). The impact of urban forests on the vertical pattern of air pollutants is conducive to the understanding of pollutant dispersion and net purification of the urban forest. This study obtained PM2.5, PM10, CO, SO2, NO2, and O3 concentrations at 0, 2.5, 5, 10, 15, 20, 30, 40, 60, 80, and 100 m in the urban forest and at a street by UAVs equipped with Sniffer4D. The results indicate that the purification of an urban forest depends on the change in background concentrations. The forest filtered PM significantly when the background concentration was low. The forest might obstruct the dispersion of air pollutants when the background concentrations decreased, but it hinders the PM deposition into the forest when the background concentrations increased.
This study estimates the vertical purification of urban forests on overcast and sunny days in autumn, and the results provide some implies on air pollutant dispersion in urban forests. Although the overcast and sunny days with different background concentrations were involved in estimating the vertical purification, the sampling days and seasons were limited. The air purification of a forest in different seasons remains unknown. Additionally, wind velocity is likely to provide sophisticated means for a thorough understanding of the dispersion of air pollutants and transport over the urban surface (Zheng et al., 2021). In case the wind speed and direction cannot be quantified during the rotation of the UAV wing, the analysis of pollutant dispersion could be deeper if the local wind information was considered.
Conclusion
In this study, a residential area in Shenyang was taken up as a case study to explore the vertical purification of urban forests on overcast and sunny days. The study indicates that UAVs platform can provide a high-quality vertical profile of an air pollutant that can be used to understand better the transport and distribution of air pollutants. Results showed that air purification by the urban forest varied during the day. The PM and SO2 concentrations in the forest decreased slower than those in the street when the PM concentrations rose lower in the morning of the overcast day. While the PM concentrations in the forest increased slower than those in the street when the PM concentrations grew higher in the afternoon. The forest could not only obstruct the horizontal and upward transport of PM, but it can also intercept air pollutants and prevent them from getting deposited into the canopy. The purification capacity of the forest on PM was significant when the background concentration was low.
Data availability statement
The data supporting the conclusions of this article will be made available by the authors, without undue reservation, upon request.
Author contributions
CM conceived the article and wrote the first draft. CM, AC, YH, and ZX conducted the field investigation. WC and XH edited subsequent drafts. All authors contributed to the article and approved the submitted version.
Funding
The authors acknowledge the financial support from the National Natural Science Foundation of China (41730647, 32271661, and 41801187).
Conflict of interest
The authors declare that the research was conducted in the absence of any commercial or financial relationships that could be construed as a potential conflict of interest.
Publisher's note
All claims expressed in this article are solely those of the authors and do not necessarily represent those of their affiliated organizations, or those of the publisher, the editors and the reviewers. Any product that may be evaluated in this article, or claim that may be made by its manufacturer, is not guaranteed or endorsed by the publisher.
References
Abhijith, K. V., and Kumar, P. (2020). Quantifying particulate matter reduction and their deposition on the leaves of green infrastructure. Environ. Pollut. 265, 114884. doi: 10.1016/j.envpol.2020.114884
Abhijith, K. V., Kumar, P., Gallagher, J., McNabola, A., Baldauf, R., Pilla, F., et al. (2017). Air pollution abatement performances of green infrastructure in open road and built-up street canyon environments - A review. Atmos. Environ. 162, 71–86. doi: 10.1016/j.atmosenv.2017.05.014
Bonilla-Bedoya, S., Zalakeviciute, R., Coronel, D. M., Durango-Cordero, J., Molina, J. R., Macedo-Pezzopane, J. E., et al. (2021). Spatiotemporal variation of forest cover and its relation to air quality in urban Andean socio-ecological systems. Urban For. Urban Gree. 59, 127008. doi: 10.1016/j.ufug.2021.127008
Buccolieri, R., Santiago, J. L., Rivas, E., and Sanchez, B. (2018). Review on urban tree modelling in CFD simulations: Aerodynamic, deposition and thermal effects. Urban For. Urban Gree. 31, 212–220. doi: 10.1016/j.ufug.2018.03.003
Cavanagh, J. A. E., Zawar-Reza, P., and Wilson, J. G. (2009). Spatial attenuation of ambient particulate matter air pollution within an urbanised native forest patch. Urban For. Urban Gree. 8, 21–30. doi: 10.1016/j.ufug.2008.10.002
Chen, H., Wang, B., Xia, D. S., Fan, Y. J., Liu, H., Tang, Z. R., et al. (2019). The influence of roadside trees on the diffusion of road traffic pollutants and their magnetic characteristics in a typical semi-arid urban area of Northwest China. Environ. Pollut. 252, 1170–1179. doi: 10.1016/j.envpol.2019.06.023
Diao, Y. Y., Hu, W., and He, B. J. (2021). Analysis of the impact of park scale on urban Ppark equity based on 21 incremental scenarios in the urban core area of Chongqing, China. Adv. Sustain. Syst. 5, 2100171. doi: 10.1002/adsu.202100171
Ezhilkumar, M. R., and Karthikeyan, S. (2020). Vertical measurement of PM2.5 and PM10 in street canyons and cohort health risk estimation at Chennai, South India. Environ. Eng. Sci. 37, 535–547. doi: 10.1089/ees.2019.0494
Ganguly, R., Sharma, D., and Kumar, P. (2019). Trend analysis of observational PM10 concentrations in Shimla city. India. Sustain. Cities Soc. 51, 101719. doi: 10.1016/j.scs.2019.101719
Gromke, C., and Ruck, B. (2009). On the impact of trees on dispersion processes of traffic emissions in street canyons. BoLMe. 131, 19–34. doi: 10.1007/s10546-008-9301-2
Han, D. H., Shen, H. L., Duan, W. B., and Chen, L. X. (2020). A review on particulate matter removal capacity by urban forests at different scales. Urban For. Urban Gree. 48, 126565. doi: 10.1016/j.ufug.2019.126565
Hofman, J., Bartholomeus, H., Janssen, S., Calders, K., Wuyts, K., Van Wittenberghe, S., et al. (2016). Influence of tree crown characteristics on the local PM10 distribution inside an urban street canyon in Antwerp (Belgium): a model and experimental approach. Urban For. Urban Gree. 20, 265–276. doi: 10.1016/j.ufug.2016.09.013
Jennings, V., Reid, C. E., and Fuller, C. H. (2021). Green infrastructure can limit but not solve air pollution injustice. Nat. Commun. 12, 4681. doi: 10.1038/s41467-021-24892-1
Jia, Y. P., Lu, K. F., Zheng, T., Li, X. B., Liu, X., Peng, Z. R., et al. (2021). Effects of roadside green infrastructure on particle exposure: a focus on cyclists and pedestrians on pathways between urban roads and vegetative barriers. Atmos. Pollut. Res. 12, 1–12. doi: 10.1016/j.apr.2021.01.017
Li, B., Cao, R., Wang, Z. Y., Song, R. F., Peng, Z. R., Xiu, G. L., et al. (2019). Use of multi-rotor unmanned aerial vehicles for fine-grained roadside air pollution monitoring. Transport Res. Rec. 2673, 169–180. doi: 10.1177/0361198119847991
Li, C., He, H. D., and Peng, Z. R. (2022). Spatial distributions of particulate matter in neighborhoods along the highway using unmanned aerial vehicle in Shanghai. Build. Environ. 211, 108754. doi: 10.1016/j.buildenv.2022.108754
Li, C. L., Liu, M., Hu, Y. M., Zhou, R., Huang, N., Wu, W., et al. (2020). Spatial distribution characteristics of gaseous pollutants and particulate matter inside a city in the heating season of Northeast China. Sustain Cities Soc. 61, 102302. doi: 10.1016/j.scs.2020.102302
Li, K. M., Li, C. L., Liu, M., Hu, Y. M., Wang, H., and Wu, W. (2021). Multiscale analysis of the effects of urban green infrastructure landscape patterns on PM2.5 concentrations in an area of rapid urbanization. J. Clean. Prod. 325, 129324. doi: 10.1016/j.jclepro.2021.129324
Li, X. B., Wang, D. S., Lu, Q. C., Peng, Z. R., Lu, S. J., Li, B., et al. (2017). Three-dimensional investigation of ozone pollution in the lower troposphere using an unmanned aerial vehicle platform. Environ. Pollut. 224, 107–116. doi: 10.1016/j.envpol.2017.01.064
Li, X. B., Wang, D. S., Lu, Q. C., Peng, Z. R., and Wang, Z. Y. (2018). Investigating vertical distribution patterns of lower tropospheric PM2.5 using unmanned aerial vehicle measurements. Atmos. Environ. 173, 62–71. doi: 10.1016/j.atmosenv.2017.11.009
Lin, X. L., Chamecki, M., and Yu, X. P. (2020). Aerodynamic and deposition effects of street trees on PM2.5 concentration: from street to neighborhood scale. Build Environ. 185, 107291. doi: 10.1016/j.buildenv.2020.107291
Liu, C., Huang, J. P., Wang, Y. W., Tao, X. Y., Hu, C., Deng, L. C., et al. (2020). Vertical distribution of PM2.5 and interactions with the atmospheric boundary layer during the development stage of a heavy haze pollution event. Sci. Total Environ. 704, 135329. doi: 10.1016/j.scitotenv.2019.135329
Liu, X., Shi, X. Q., He, H. D., Li, X. B., and Peng, Z. R. (2021). Vertical distribution characteristics of particulate matter beside an elevated expressway by unmanned aerial vehicle measurements. Build Environ. 206, 108330. doi: 10.1016/j.buildenv.2021.108330
Llaguno-Munitxa, M., Bou-Zeid, E., and Hultmark, M. (2017). The influence of building geometry on street canyon air flow: validation of large eddy simulations against wind tunnel experiments. J. Wind Eng. Ind. Aerod. 165, 115–130. doi: 10.1016/j.jweia.2017.03.007
Lu, K. F., He, H. D., Wang, H. W., Li, X. B., and Peng, Z. R. (2020). Characterizing temporal and vertical distribution patterns of traffic-emitted pollutants near an elevated expressway in urban residential areas. Build Environ. 172, 106678. doi: 10.1016/j.buildenv.2020.106678
Miao, C., Yu, S., Zhang, Y., Hu, Y., He, X., and Chen, W. (2023). Assessing outdoor air quality vertically in an urban street canyon and its response to microclimatic factors. J. Environ. Sci. 124, 923–932. doi: 10.1016/j.jes.2022.02.021
Miao, C. P., Chen, W., and Yu, S. (2022). Assessing ozone distribution vertically and horizontally in urban street canyons based on field investigation and ENVI-met modelling. Buildings 12, 262. doi: 10.3390/buildings12030262
Miao, C. P., Yu, S., Hu, Y. M., Liu, M., Yao, J., Zhang, Y., et al. (2021). Seasonal effects of street trees on particulate matter concentration in an urban street canyon. Sustain. Cities Soc. 73, 103095. doi: 10.1016/j.scs.2021.103095
Ng, W. Y., and Chau, C. K. (2012). Evaluating the role of vegetation on the ventilation performance in isolated deep street canyons. Int. J. Environ. Pollut. 50, 98–110. doi: 10.1504/IJEP.2012.051184
Pataki, D. E., Alberti, M., Cadenasso, M. L., Felson, A. J., McDonnell, M. J., Pincetl, S., et al. (2021). The Benefits and limits of urban tree planting for environmental and human health. Front. Ecol. Evol. 9, 603757. doi: 10.3389/fevo.2021.603757
Peng, Z. R., Wang, D. S., Wang, Z. Y., Gao, Y., and Lu, S. J. (2015). A study of vertical distribution patterns of PM2.5 concentrations based on ambient monitoring with unmanned aerial vehicles: a case in Hangzhou, China. Atmos. Environ. 123, 357–369. doi: 10.1016/j.atmosenv.2015.10.074
Ren, Z. B., Fu, Y., Dong, Y. L., Zhang, P., and He, X. Y. (2022). Rapid urbanization and climate change significantly contribute to worsening urban human thermal comfort: a national 183-city, 26-year study in China. Urban Clim. 43, 101154. doi: 10.1016/j.uclim.2022.101154
Ren, Z. B., Zhao, H. B., Fu, Y., Xiao, L., and Dong, Y. L. (2021). Effects of urban street trees on human thermal comfort and physiological indices: a case study in Changchun city, China. J. Forestry Res. 10.1007/s11676-021-01361-5. doi: 10.1007/s11676-021-01361-5
Santiago, J. L., and Rivas, E. (2021). Advances on the influence of vegetation and forest on urban air quality and thermal comfort. Forests 12, 1133. doi: 10.3390/f12081133
Tomson, M., Kumar, P., Barwise, Y., Perez, P., Forehead, H., French, K., et al. (2021). Green infrastructure for air quality improvement in street canyons. Environ. Int. 146, 106288. doi: 10.1016/j.envint.2020.106288
United Nations. The UN Sustainable Development Goals. United Nations New York, (2015) Available online at: http://www.un.org/sustainabledevelopment/summit/ (accessed 16 January 2018).
Viippola, V., Yli-Pelkonen, V., Jarvi, L., Kulmala, M., and Setala, H. (2020). Effects of forests on particle number concentrations in near-road environments across three geographic regions. Environ. Pollut. 266, 115294. doi: 10.1016/j.envpol.2020.115294
Vranckx, S., Vos, P., Maiheu, B., and Janssen, S. (2015). Impact of trees on pollutant dispersion in street canyons: a numerical study of the annual average effects in Antwerp, Belgium. Sci. Total Environ. 532, 474–483. doi: 10.1016/j.scitotenv.2015.06.032
Wang, S., Ma, Y., Wang, Z., Wang, L., Chi, X., Ging, A., et al. (2021). Mobile monitoring of urban air quality at high spatial resolution by low-cost sensors: impacts of COVID-19 pandemic lockdown. Atmos. Chem. Phys. 21, 7199–7215 doi: 10.5194/acp-21-7199-2021
Wang, X. S., Teng, M. J., Huang, C. B., Zhou, Z. X., Chen, X. P., and Xiang, Y. (2020). Canopy density effects on particulate matter attenuation coefficients in street canyons during summer in the Wuhan metropolitan area. Atmos. Environ. 240, 117739. doi: 10.1016/j.atmosenv.2020.117739
World Health Organization (2018). Available online at: https://www.who.int/teams/control-of-neglected-tropical-diseases/lymphatic-filariasis/morbidity-management-and-disability-prevention/air-quality-and-health (accessed November 01, 2022).
Wu, C., Liu, B., Wu, D., Yang, H., Mao, X., Tan, J., et al. (2021). Vertical profiling of black carbon and ozone using a multicopter unmanned aerial vehicle (UAV) in urban Shenzhen of South China. Sci. Total Environ. 801, 149689. doi: 10.1016/j.scitotenv.2021.149689
Wu, D., Gong, J. H., Liang, J. M., Sun, J., and Zhang, G. Y. (2020). Analyzing the influence of urban street greening and street buildings on summertime air pollution based on street view image data. ISPRS Int. J. Geo-Inf. 9, 500. doi: 10.3390/ijgi9090500
Xiong, K., Yang, Z. J., and He, B. J. (2022). Spatiotemporal heterogeneity of street thermal environments and development of an optimised method to improve field measurement accuracy. Urban Clim. 42, 101121. doi: 10.1016/j.uclim.2022.101121
Zheng, T., Li, B., Li, X. B., Wang, Z. Y., Li, S. Y., and Peng, Z. R. (2021). Vertical and horizontal distributions of traffic-related pollutants beside an urban arterial road based on unmanned aerial vehicle observations. Build Environ. 187, 107401. doi: 10.1016/j.buildenv.2020.107401
Keywords: air pollutants, urban forest, vertical dispersion, UAVs platform, PM
Citation: Miao C, Cui A, Xiong Z, Hu Y, Chen W and He X (2022) Vertical evaluation of air quality improvement by urban forest using unmanned aerial vehicles. Front. Ecol. Evol. 10:1045937. doi: 10.3389/fevo.2022.1045937
Received: 16 September 2022; Accepted: 17 October 2022;
Published: 14 November 2022.
Edited by:
Bao-Jie He, Chongqing University, ChinaReviewed by:
Jinlei Zhu, University of Hohenheim, GermanyHongyan Zhao, Beijing Normal University, China
Copyright © 2022 Miao, Cui, Xiong, Hu, Chen and He. This is an open-access article distributed under the terms of the Creative Commons Attribution License (CC BY). The use, distribution or reproduction in other forums is permitted, provided the original author(s) and the copyright owner(s) are credited and that the original publication in this journal is cited, in accordance with accepted academic practice. No use, distribution or reproduction is permitted which does not comply with these terms.
*Correspondence: Wei Chen, Y2hlbndlaUBpYWUuYWMuY24=; Xingyuan He, aGV4eUBpYWUuYWMuY24=