- 1Hubei Institute of Geosciences (Hubei Selenium-rich Industry Research Institute), Wuhan, China
- 2Hubei Center of Selenium Ecological Environment Effect Detection, Wuhan, China
- 3Huazhong Agricultural University, Wuhan, China
Machine learning is of great value for the situation analysis and scientific prevention and control of soil heavy metal pollution risk. In this paper, taking the selenium rich area as the research object, the improved Genetic Algorithm (GA)–Back Propagation (BP) algorithm was used to construct the risk assessment model of Cd pollution in this area. Firstly, the content of Cd and Se in the soil of the study area was statistically analyzed based on descriptive statistics and correlation analysis. Then, a three-layer BP neural network structure was designed and optimized by GA algorithm. The individual coding length was calculated by connecting weights and thresholds of Cd and Se elements. Based on 97 groups of field data in this area, the experimental results show that the BP model optimized by GA has faster convergence speed, maintains good generalization ability on the test sample points. Compared with multiple linear regression model (MLRM), GA-BP reduces RMSE by 64.84, 52.12, 49.53, and 63.18% compared with M5. The accuracy of estimating Cd pollution status in different areas by GA-BP neural network model is higher than the other three regression models on the whole. In the whole research region, the samples in the safe interval, relatively safe interval, light pollution interval, moderate pollution interval and severe pollution interval accounted for 4.12, 8.24, 42.26, 17.52 and 27.86%, respectively, and the prediction results of soil Cd pollution level showed that only 12.36% of the samples were in a safe state without the risk of Cd pollution, while most of the samples were in a mild state. Because of the huge potential of carbon sequestration and emission reduction in agriculture, planting se-rich and Cd-low crops in these areas can not only promote the development of local Se-rich industries but also achieve carbon sequestration and emission reduction.
Introduction
Soil is an important part of the earth’s ecosystem. The physical and chemical properties of soil affect the growth of plants, especially the heavy metal pollution in soil affects the growth of plants. Heavy metals in soil will enter plants or animals through the food chain, and then enter the human body for enrichment, affecting human life and health. According to the experimental results of the national survey of soil heavy metal pollution, the total over standard rate of soil heavy metal content in our country has increased to 16.1%, which damages the ecological environment, endangers human health and affects human life (Shi Jiangdan and Yangyang, 2022).
In some areas of China is rich in selenium rich soil resources. It is of great practical significance to develop selenium rich agricultural products based on selenium rich soil resources and increase selenium intake by daily diet for selenium deficient people. However, studies have shown that selenium rich soils are often associated with heavy metals such as cadmium and chromium, and the heavy metals in soil have the characteristics of small mobility, concealment, easy accumulation and high toxicity, which not only directly affect the quality of soil environment, but also affect the water source, animals and plants and human health (Hu Qing and Ying, 2022). And lead to selenium-rich areas of agricultural economic development in the face of resource shortages, environmental pollution and other related environmental problems, for high-selenium and high-cadmium areas can grow selenium and cadmium reduction crops, reduce the use of fertilizers, pesticides and so on, agricultural means of production also emit greenhouse gases in their production process, and using soil rich in selenium and cadmium to grow crops rich in selenium and low in cadmium can achieve a win–win situation of carbon sequestration and people’s livelihood.
Therefore, how to obtain the pollution information of heavy metals in soil efficiently and quickly and provide basic support for soil treatment is an important research content in the field of Environmental Earth. At present, the soil heavy metal pollution investigation usually uses the ground object spectrometer (Qiuxia et al., 2017) or induced LIBS analysis technology (Ren et al., 2022) to study, and combined with the field measured a large number of soil heavy metal samples of laboratory physical and chemical data to estimate the soil heavy metal. Although the traditional geochemical methods have high detection accuracy, for large-scale pollution investigation, the field sample collection cost is high and time-consuming, and the comprehensive analysis ability of ecological environment information is weak, which makes it difficult for the traditional chemical method to become our high efficiency and has strong timeliness advantages to monitor environmental problems such as soil heavy metal pollution (Chen et al., 2018). Compared with the traditional assessment methods of regional soil heavy metal pollution, the artificial intelligence machine learning algorithm can accurately and quickly predict the regional soil heavy metal pollution status, which can play an auxiliary role in the prevention and control of soil heavy metal pollution. By analyzing the contribution of each heavy metal element to the soil pollution, the pollution source can be traced, so as to reduce the emission of source pollution and the cost of repairing the polluted land (Lijie et al., 2018; Yantao et al., 2022). For example, Dinpankar used Health hazard risk mapping (HHRM) to detect 14 different Health hazard factors from the Priuria area, which was mainly composed of hardy rocks (Ruidas et al., 2022). In another study, Ruidas used ANN and RF to quantify toxic substances in the Ramsar area of Lake Chilka with the help of 17 water chemistry properties of the lake water. Compared with the traditional assessment methods of regional soil heavy metal pollution, the artificial intelligence machine learning algorithm can accurately and quickly predict the regional soil heavy metal pollution status, which can play an auxiliary role in the prevention and control of soil heavy metal pollution (Pal et al., 2022).
In recent years, the methods of soil pollution risk assessment using artificial intelligence and machine learning methods have also begun to receive attention and research. The main research work focuses on the evaluation of soil environmental quality, prediction of soil characteristics, prediction of soil heavy metal content and so on. In the aspect of soil environmental quality assessment, Jiang et al. used the support vector machine method of statistical learning to evaluate the soil environmental quality, and had certain learning ability of small samples (Jiang Xue et al., 2014). In the aspect of soil properties prediction, Ma et al. (2016a) used machine learning method to predict soil total nitrogen, organic carbon and moisture values, and the data were obtained from spectral measurement instruments. In the aspect of soil heavy metal content prediction, Ma et al. (2016b) used the random forest model of machine learning to predict the heavy metal content of soil. Zhou et al. (2015) studied the hyperspectral inversion method of heavy metals in mining area soil based on transfinite learning machine, predicted the content of heavy metals in mining area soil using visible near infrared spectroscopy data, and analyzed and compared with support vector machine and other methods.
Therefore, this paper uses the improved GA-BP algorithm to build the cadmium pollution risk assessment model in the selenium rich area of the study area. Firstly, the correlation between soil samples is analyzed, and the missing or bad values of soil samples are interpolated to make the sample data more complete and accurate; After that, the Cd pollution under different pollution conditions was calculated, and the heavy metal pollution index of soil was quantitatively predicted, which is of great value for the spatial situation analysis and scientific prevention and control of soil heavy metal pollution.
Research status of soil pollution prediction based on machine learning
Dumedah et al. (2014) and Aydilek and Arslan (2012) used neural network algorithm to interpolate and predict the missing values of heavy metal elements in soil. They set the elements with missing values as category attributes, and other complete elements in the samples as description attributes. After that, they put the samples into the neural network for training, so as to predict the missing heavy metal values in the samples, and the prediction effect is good. Antonio (Sun and Sheng, 2016) took the information of relevant geographical environment elements as the input parameters of neural network, analyzes the correlation between various elements, so as to predict the regional soil heavy metal pollution index, and analyze the causes of soil heavy metal pollution. Gong et al. (2017) used the relevant data of heavy metals in soil as the input data of neural network, so as to predict the contents of heavy metals Cr, Cu, and Ni in soil, and the prediction effect was better. At the same time, the author compared the prediction results of BP neural network model with the prediction results of multiple linear regression and partial least squares regression, and the results showed that BP neural network was better. However, when traditional BP is used to solve the problem, its weight is usually changed due to local changes, which makes the derivation fall into local extremum easily, which makes the training fail. Meanwhile, due to the existence of flat area when the output of neurons is close to 0 and 1, the data deviation is smaller and the convergence process is slower.
Different from the traditional gradient derivation method, genetic algorithm (GA) is a more efficient method for global searching and solving problems (Deng et al., 2021). It can be realized not only by individual learning, but also by individual learning, which emphasis on the population and the strategy of searching among populations can overcome the nonlinear difficulties that other algorithms are difficult to solve. Considering that BP algorithm is easy to fall into local optimum and over rely on initial value, encoding BP parameters and Optimizing BP original data with genetic algorithm can improve BP learning quality and reduce the possibility of falling into local minimum data. In order to solve the problem of large data analysis error caused by background interference and signal interference of adjacent elements in XRF quantitative analysis and prediction of heavy metal elements in soil. Cheng et al. (2020) used GA algorithm to optimize the weights and thresholds of BP neural network, and quantitatively analyzed the spatial distribution and internal relationship of Pb, Mn, Cr, and Cu. Liu et al. (2021) analyzed the relationship between nine meteorological factors and soil moisture data measured by monitoring instruments. Considering the lag of meteorological factors, BP-GA model was used to predict soil moisture of eight meteorological data. The soil moisture of ecological slope can be well predicted, and the results have high prediction accuracy, which has a good application prospect in other fields.
To sum up, the artificial neural network has the ability to approximate any nonlinear mapping by learning, and its application in soil environment prediction is not limited by the nonlinear model, and has obvious advantages compared with the traditional nonlinear system prediction. At the same time, the topography of some research areas is complex and the sampling is difficult. The artificial neural network model can be used to reduce the sampling cost and analysis cost, and reduce the chemical pollution caused by the analysis samples. However, many studies are only limited to the prediction of different metal elements in the soil, and the research on the internal coupling relationship between different elements is relatively insufficient. This paper focuses on the area, where the soil Se content is relatively high, how to use unsupervised learning method to improve the adaptability and flexibility of spatial distribution modeling and explore the mechanism of Cd pollution in high Se content areas is an important research to be further studied.
Statistics of Cd and Se contents in soil of the study area
Some studies have shown that there are symbiotic and antagonistic relationships between selenium and cadmium in some areas. While some selenium rich agricultural products in some areas exceeds the standard of cadmium, which is mainly due to the symbiosis of selenium and cadmium in soil. Mingyi and Jing (2012) studied the characteristics and ecological effects of selenium and heavy metals represented by cadmium in the soil, which found that the reason for the simultaneous existence of selenium and cadmium was that the content of selenium and cadmium in the soil parent material was high, but there was no collective disease in the local population. The hair selenium content was high, and the hair cadmium content was low, suggesting that there might be some antagonistic relationship between selenium and cadmium. Therefore, due to the particularity of the study area, in order to quantitatively predict the Cd pollution index, it is necessary to carry out statistical and correlation analysis on Cd and Se contents.
Stratigraphic unit selection
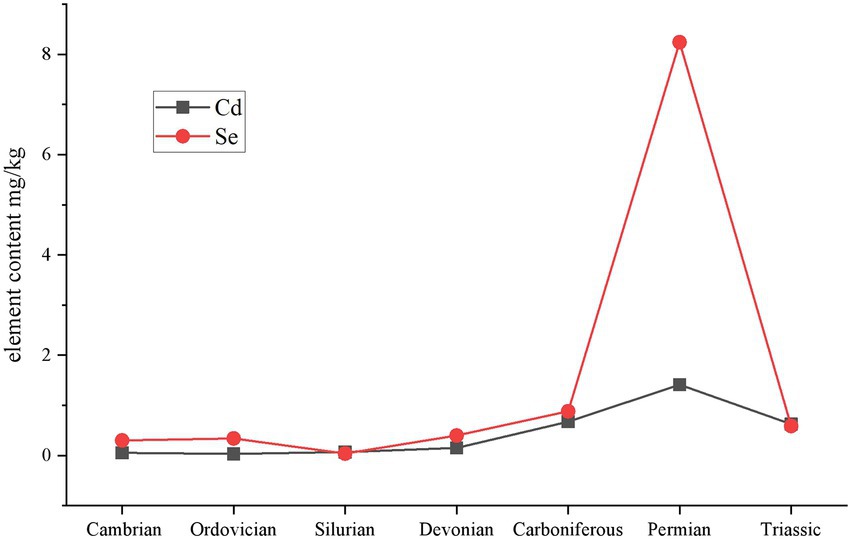
There are differences in the distribution of elements in rocks of different strata. Therefore, the selenium and cadmium contents of seven rock samples in the study area were selected for statistical comparison, as shown in Figure 1.
The average content of Cd in rock samples is shown that Permian > Carboniferous > Triassic > Devonian > Cambrian > Ordovician > Silurian, which is consistent with the average selenium content of rocks in the main Se-rich strata in the study area. This area is a region with high Cd geochemical background under natural conditions. In different parent material units, the distribution of soil Cd is closely related to the geological attributes of the parent material, and the content of soil Cd is higher in the Permian parent material area, which is significantly higher than that in other strata. Therefore, this paper selected the soil data under the Permian system for training.
Descriptive statistics
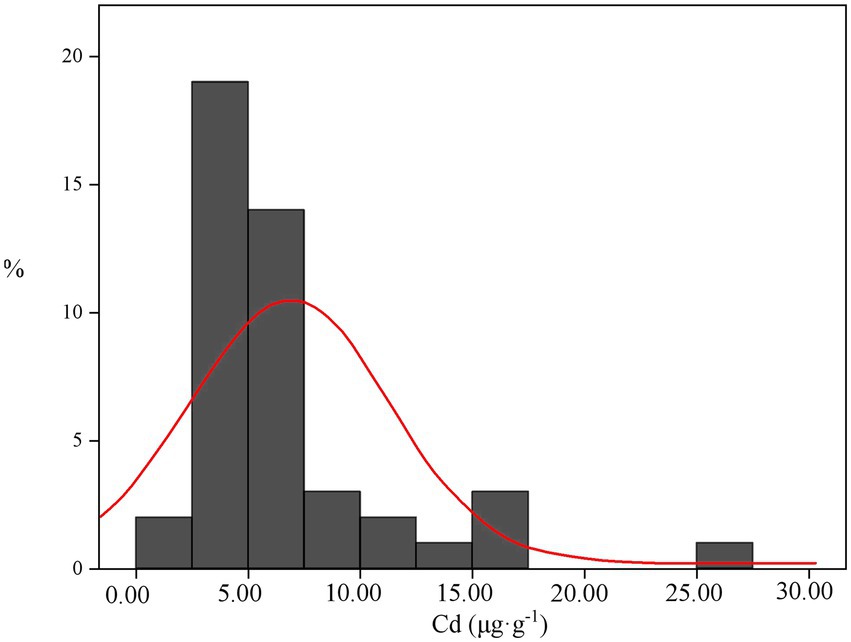
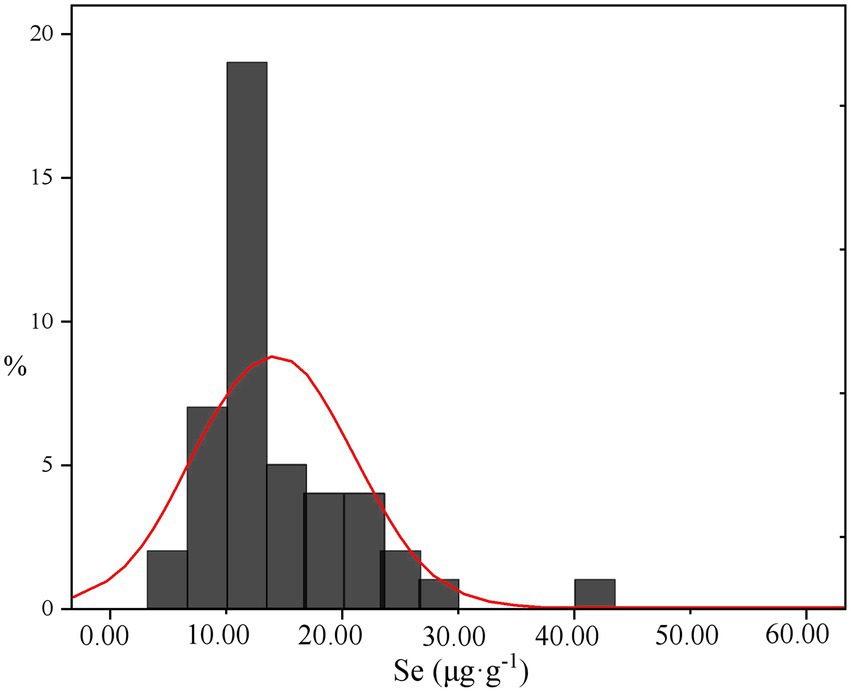
Descriptive statistical analysis refers to the analysis of all aspects of the characteristic values of a group of data in the experiment. The purpose of this analysis is to more clearly describe and count the characteristics of the experimental samples and the overall characteristics that can be reflected. The 97 Cd and Se content sample values obtained in the study area are used for histogram statistics, as shown in Figures 2, 3.
It can be seen from the figure that there are some abnormal values of Cd and Se contents in soil. The existence of outliers has an impact on the accuracy of the estimation model of soil heavy metals, so the outliers of the two are eliminated. The content of Cd ranged from 0.44 to 29.6 μg/g, and that of Se ranged from 0.84 to 54.1 μg/g. We conducted histogram statistics on the sample data and eliminated the outliers. After elimination, the sample numbers of Cd and Se elements were 94 and 93, respectively.
Element correlation analysis
Correlation analysis is a statistical method that can measure whether there is a dependent relationship between two or more variables, and explore the degree of dependence between two variables. Pearson correlation coefficient method was used for correlation analysis in this study. Correlation coefficient is a non-deterministic relationship, which can measure the degree of correlation between two variables. If the absolute value of Pearson coefficient R is closer to 1, it means that the correlation between the two variables is greater. The calculation formula is shown in Formula (1).
Where, is the covariance of X and Y, is the variance of X, and is the variance of Y.
In order to facilitate the spatial prediction of soil metals, the correlation among the three target elements was analyzed based on the least square regression analysis method. The correlation analysis was carried out in SPSS software, and the results are shown in Table 1.
Although the correlation between the two elements showed significant correlation, but the correlation coefficient was not more than 0.7. In the construction of pollution estimation model, the two elements need to be analyzed and space estimated separately.
Risk assessment model of Cd pollution based on GA-BP
Back propagation topology
The core of BP neural network algorithm is to search for a group of weight vectors which can make the output error function of the network reach the minimum through the alternate iteration of the two propagation processes (Wang and Bi, 2021).
Forward propagation of data stream
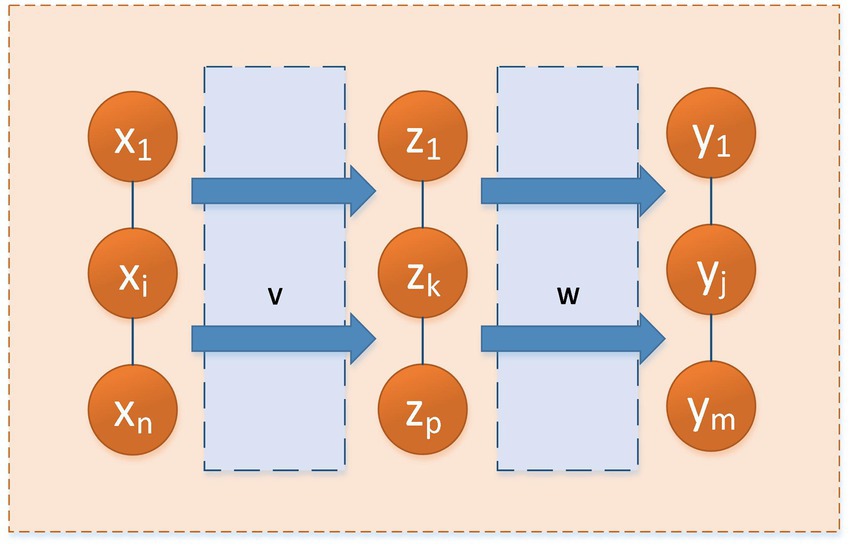
As shown in Figure 4, the number of nodes in input layer, hidden layer and output layer of a certain network is n, q and m respectively, the weight matrix between input layer and hidden layer is V, the weight matrix between hidden layer and output layer is W, and the excitation functions of hidden layer and output layer are and respectively. The results of hidden layer and output layer of neuron model are as follows:
Thus, the network completes the overall mapping from n dimensional input data to m dimensional output data.
Backward propagation of error function
Set the number of training samples as p, and define the output error function for the i-th training sample:
In Formula (3), indicates the desired output.
According to the definition of error function, the global error of all training samples can be obtained as follows (Liang et al., 2019):
The main purpose of this paper is to reduce the error of different levels by adjusting the weights of the different levels.
This paper constructs a three-layer neural network including input layer Xi, hidden layer and output layer Yk. The number of input layer refers to the dimension of input vector, i.e., the dimension of optimal influence factor set of heavy metal elements input from outside. Among them, the number of neurons in input layer of Se element participating in modeling is 6, and that of Cd element is 9;
Neuron Yk in the output layer refers to the dimension of the output vector of the experiment, that is, the dimension of soil heavy metal training samples participating in the modeling. The selection of the number of hidden layer neurons has a great influence on the model accuracy of BP neural network. In this paper, the number of hidden layer neurons is determined to be 4 through trial and error method, the activation function of hidden layer is Sigmoid function, and the activation function of output layer is purelin function.
Genetic algorithm–back propagation model
BP neural network optimized by genetic algorithm mainly includes population initialization, fitness function and determination of genetic operation.
Population initialization
In this study, the coding method of individuals is real number method. The length of the encoding string is usually composed of four parts: the connection weight and threshold value between the input layer and the hidden layer, and the connection weight and threshold value from the hidden layer to the output layer. Assuming that the number of nodes in the input layer of BP neural network is m, the number of nodes in the hidden layer is p, and the number of nodes in the output layer is n, then the calculation formula of the coding length S is shown in Formula (5):
Where, m × p is the encoding length of the connection weight between the input layer and the hidden layer, p × n is the encoding length of the connection weight between the hidden layer and the output layer, p is the encoding length of the threshold of the hidden layer, and n is the encoding length of the threshold of the output layer. According to the connection weights and thresholds of Cd and Se elements, it can be calculated that their individual coding lengths are 45 and 33 respectively, and the calculation formula is shown in Formula (6):
Calculation of fitness value
The BP neural network is trained with training samples, and the error between the output obtained after training and the expected output is summed and calculated with the absolute value. The calculated F is the individual fitness value, and the calculation of F is shown in Formula (7):
Where, is the number of output nodes of neural network; is the actual output of the neural network output layer; is the expected output; If the individual fitness value of the calculated population is smaller, it means that the individual is optimal.
Crossover operator and mutation operation
In this paper, roulette method is used to select genetic operators. In this study, the real number method is used to initialize the population, so the operation of crossover operator is carried out by real number crossing method. When the crossover probability is set as 0.3, the real crossover operation is performed, and the mutation operation is performed when the mutation probability is 0.1.
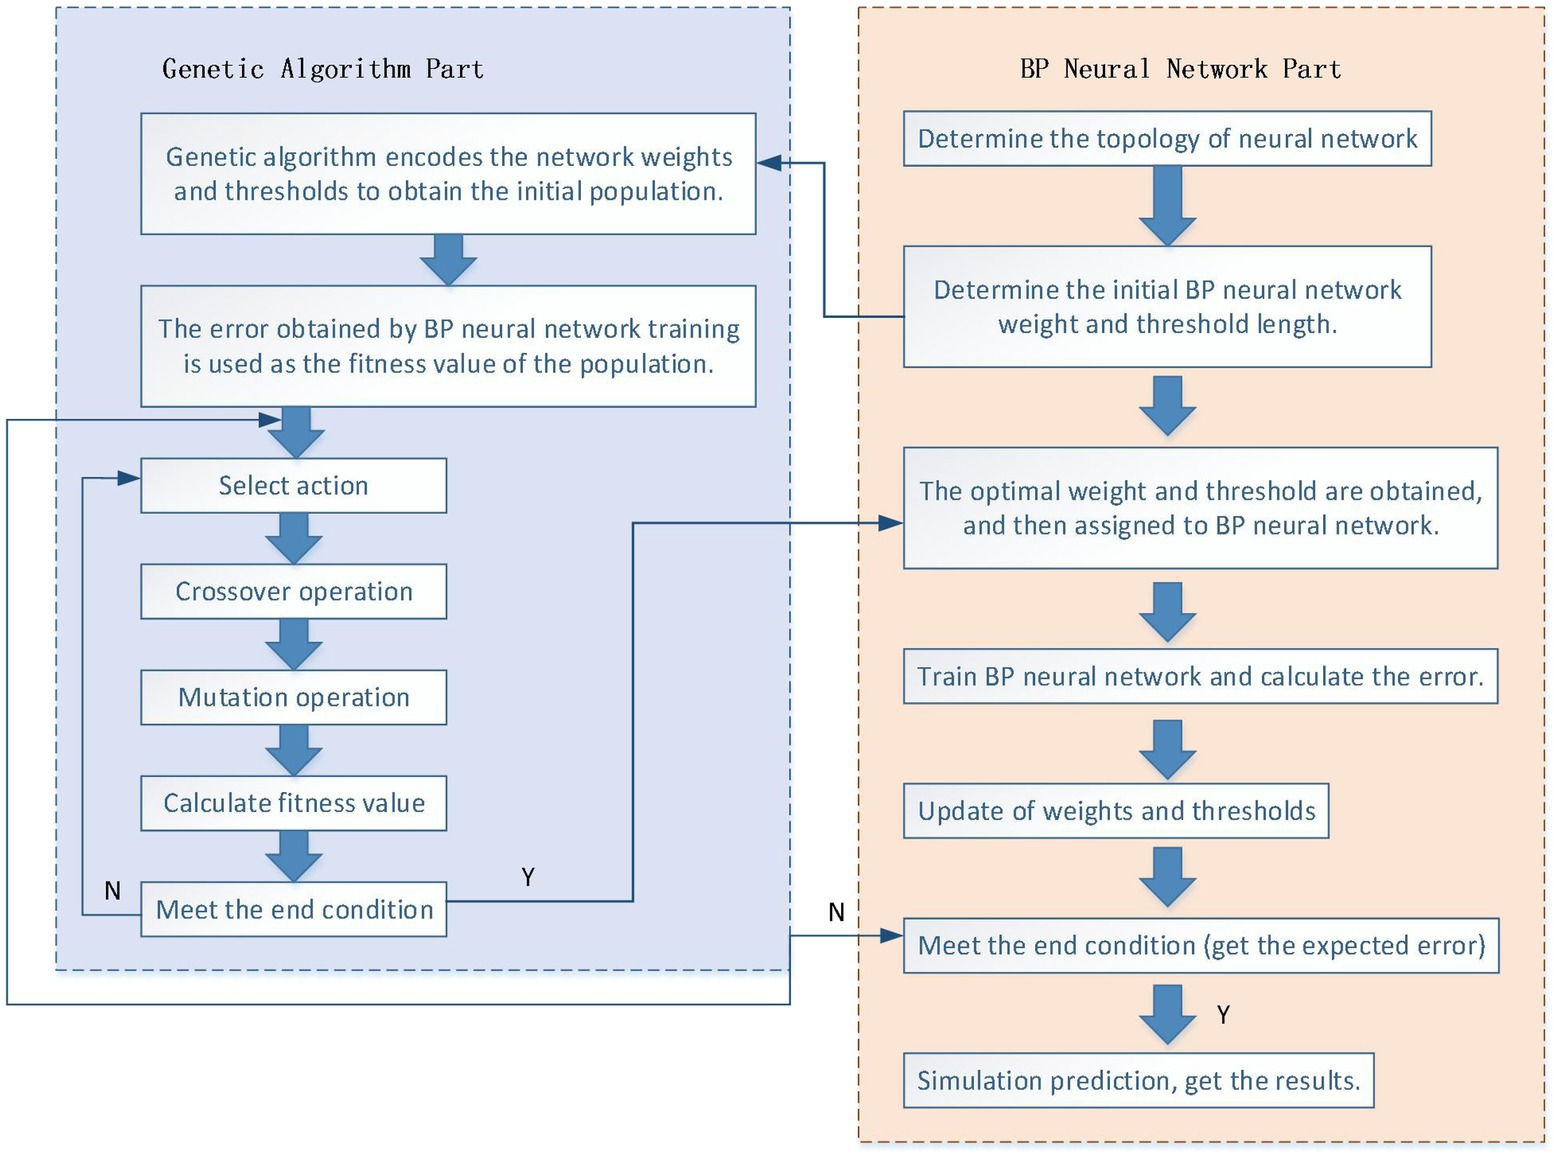
After the parameters of genetic algorithm are determined, it is judged according to the optimization steps of genetic algorithm to see whether it can meet the accuracy of genetic algorithm or whether it can meet the maximum evolution algebra. If it is satisfied, the individual is decoded to obtain the optimal initial weights and thresholds, and then the initial weights and thresholds are assigned to the BP neural network, and the neural network is trained according to the flow shown in Figure 5.
Finally, the trained neural network is used to estimate the content of Se and Cd in the study area.
Risk assessment status
The single factor index method and Nemero comprehensive pollution index method are often used to evaluate the heavy metal pollution degree of a piece of land. The expression of single factor exponential method is shown in Formula (8).
where represents the content of heavy metal i in soil, and represents the standard content data of heavy metal in soil.
In the screening of soil pollution risk in agricultural land, available cadmium in soil is closely related to pH value. The low availability of cadmium in acidic soil is not conducive to the absorption of selenium, while the high availability of cadmium in alkaline soil is more conducive to the absorption of cadmium. Therefore, the influence factor α is introduced into the above model to consider the influence of pH on the division of pollution degree, and the division basis is shown in Table 2. With the enrichment of cadmium, the effect of soil pollution is not linear, so the influencing factors are different at different pH. Meanwhile, the cadmium content in the model is the effective cadmium content.
Then, Formula (8) is optimized as
The pollution index was calculated according to Formula (10)
Where represents the single pollution index of heavy metal in soil, is the nemerow comprehensive pollution index of heavy metal in soil.
To obtain soil Cd content data in different pollution states, the content parameter of soil Cd in area A is defined as Z. Formula (9) is used to calculate the soil heavy Cd pollution state G (Safe state g1, relative safe state g2, mild Cd pollution state g3, moderate Cd pollution state g4, and severe Cd pollution state g5).
Experiment and analysis
Parameter settings
The transfer function of hidden layer is sigmoid function, and the learning rate is generally set between 0.01 and 0.8. If the learning rate is too large or too small, the network performance will be affected and the accuracy will decrease. The selection of training times and target errors determines the generalization ability of the model. Too little training times may lead to insufficient learning, and too much training times may lead to overfitting. The network learning rate set in this paper is 0.01, the maximum training times is 1,000, and the target error is 0.0001. The evolutionary algebra determines the change of individual fitness in the population. The appropriate evolutionary algebra can be determined according to the stability of the fitness function value. The maximum number of iterations selected in this paper is 100. After model debugging and comparison, the crossover probability value selected in this paper is 0.3, and the mutation probability value is 0.1.
Sample collection
Previous studies on the geochemistry of selenium and cultivation of selenium rich crops in the study area have found that the Cd content in the se rich soil in some area has reached a serious level, and the Cd content of rocks or soil in a large area of the Permian se rich strata in the study area exceeds the standard. Therefore, based on the collected data, 1,000 groups of data were randomly generated, and the data generated after annotation was used for algorithm training. Finally, 97 groups of data were used for algorithm verification.
Evaluation index
Pollution degree
Nemerow comprehensive pollution index P directly reflects the multiple of heavy metals exceeding standard and pollution degree in soil. According to the evaluation standard of Nemerow pollution index, when P is less than or equal to 0.7, the soil condition is safe (Level 1); when P range is (0.7,1.0), the soil condition is fair and safe (Level 2); when P range is (1.0,2.0), the soil condition is mildly polluted (Level 3). When P is in the range of (2.0,3.0), the soil is moderately polluted (Level 4); when P is greater than 3.0, the soil is severely polluted (Level 5) (Ying et al., 2019).
Model evaluation
In this paper, we use the experimental group samples to establish an estimation model to explore the changes of soil heavy metal content in the study area, and use the measured values of the remaining soil samples of the control group to evaluate the accuracy. This study mainly uses root mean square error (RMSE) and mean relative estimation error (MRE) to evaluate the accuracy of the study area, as shown in Formulas (11) and (12).
Where, represents the measured value of the i-th soil heavy metal sample, represents the estimated value of the i-th soil heavy metal sample; represents the total number of soil samples. RMSE can measure the accuracy of the estimation model results. While MRE is the average value of relative errors of all test samples, which can measure the average reliability of model estimation results.
Results and analysis
Model convergence
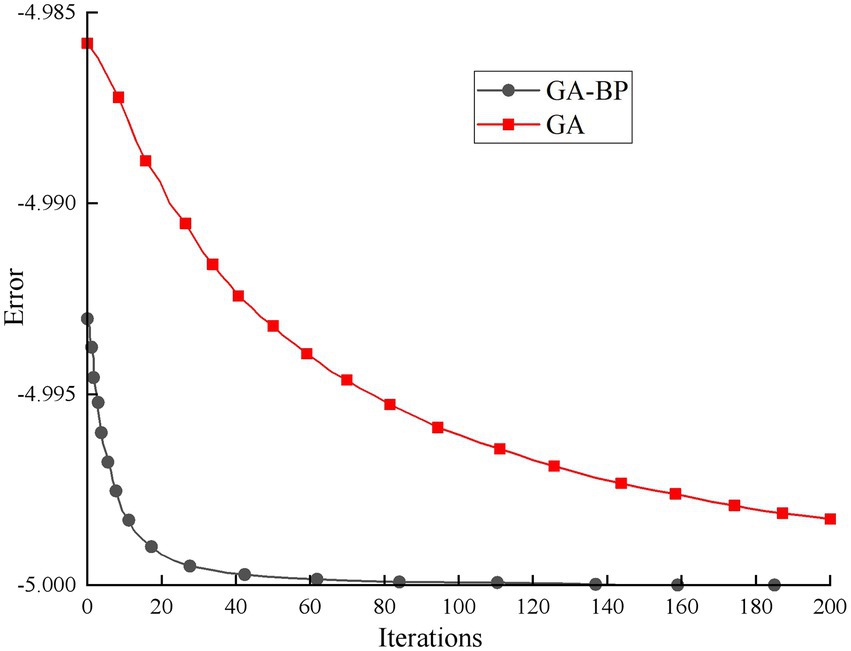
In order to verify the effectiveness of GA-BP algorithm, the iterative process is tested, and the results are shown in Figure 6.
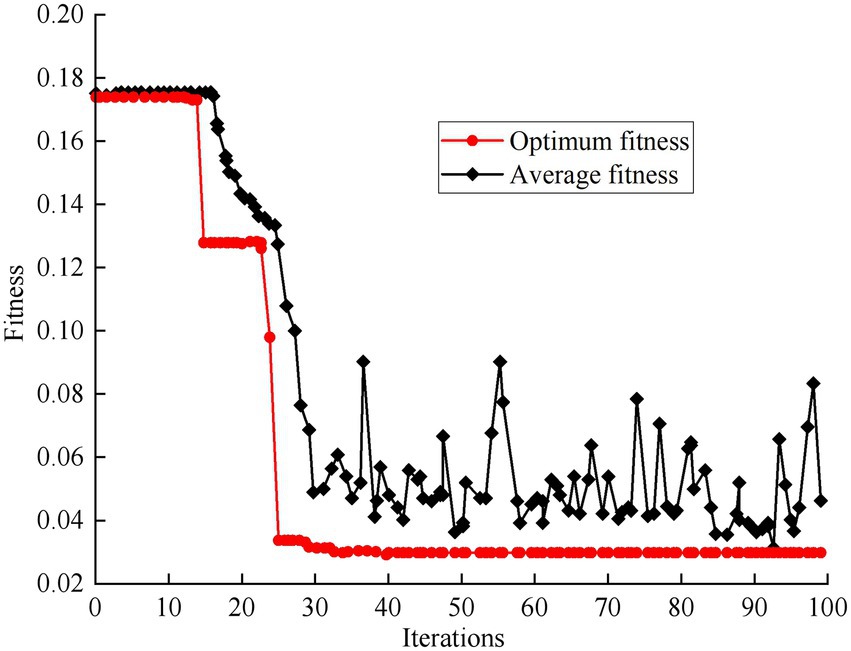
It can be seen from Figure 5 that after 200 iterations, the calculated value of GA-BP algorithm has been equal to −5. However, under the same calculation iteration times, the convergence speed of traditional BP algorithm is not as fast as that of GA-BP algorithm, which shows that compared with BP algorithm, GA-BP algorithm has better optimization effect in dealing with general function problems. The change trend of the model fitness curve after optimization is shown in Figure 7. After repeated genetic optimization of the model, the fitness index decreased and the adaptability increased. When the evolution reached about 24 generations, the fitness index gradually became stable.
Comparison of predicted values of Cd and Se
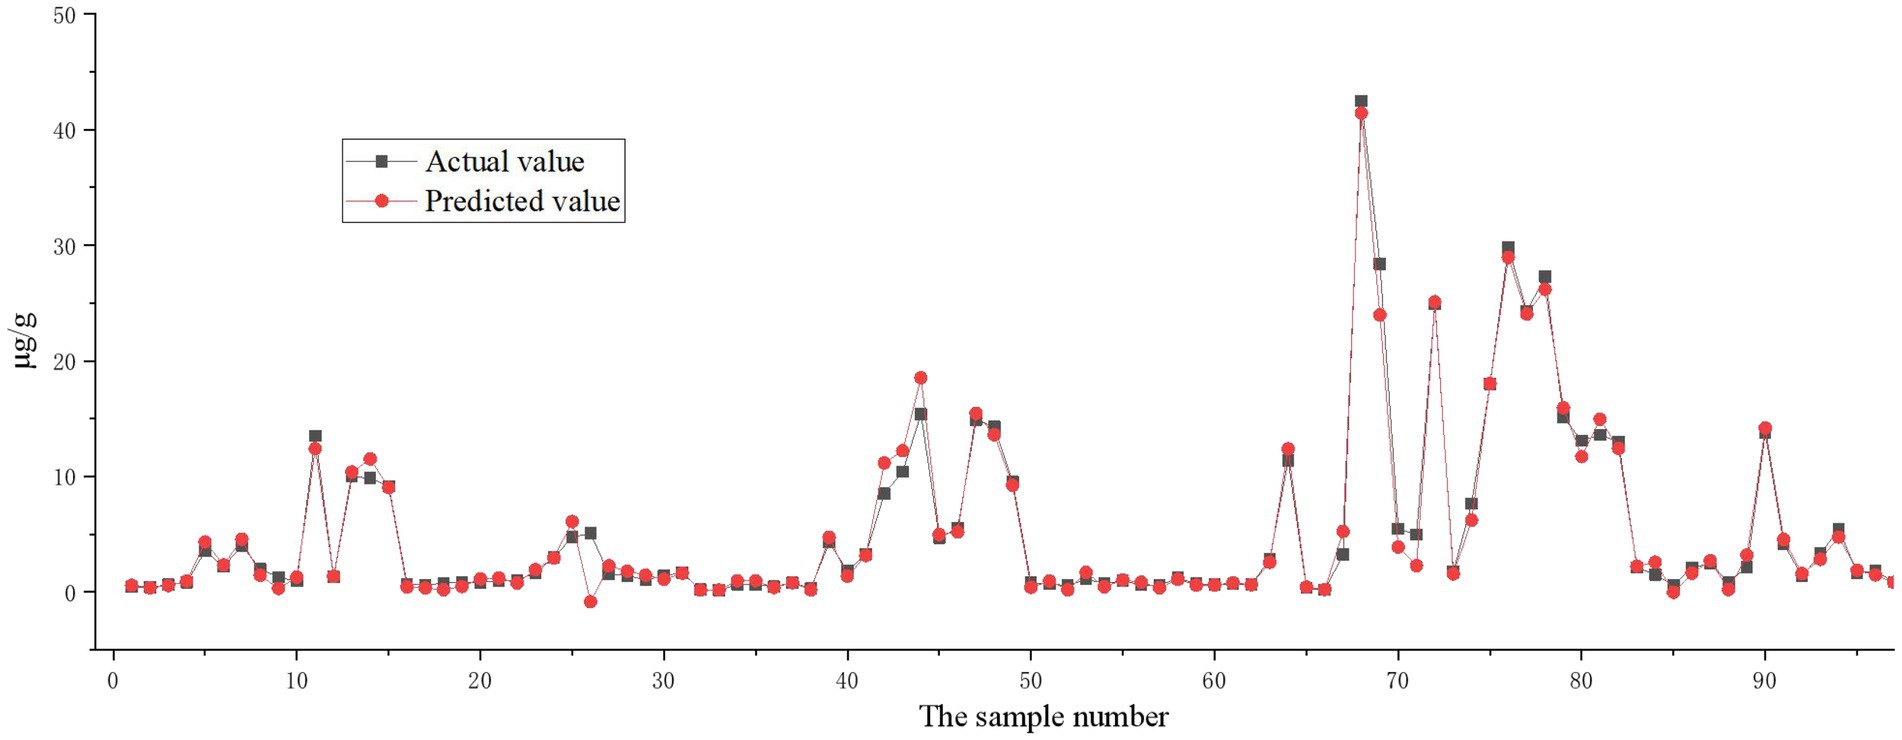
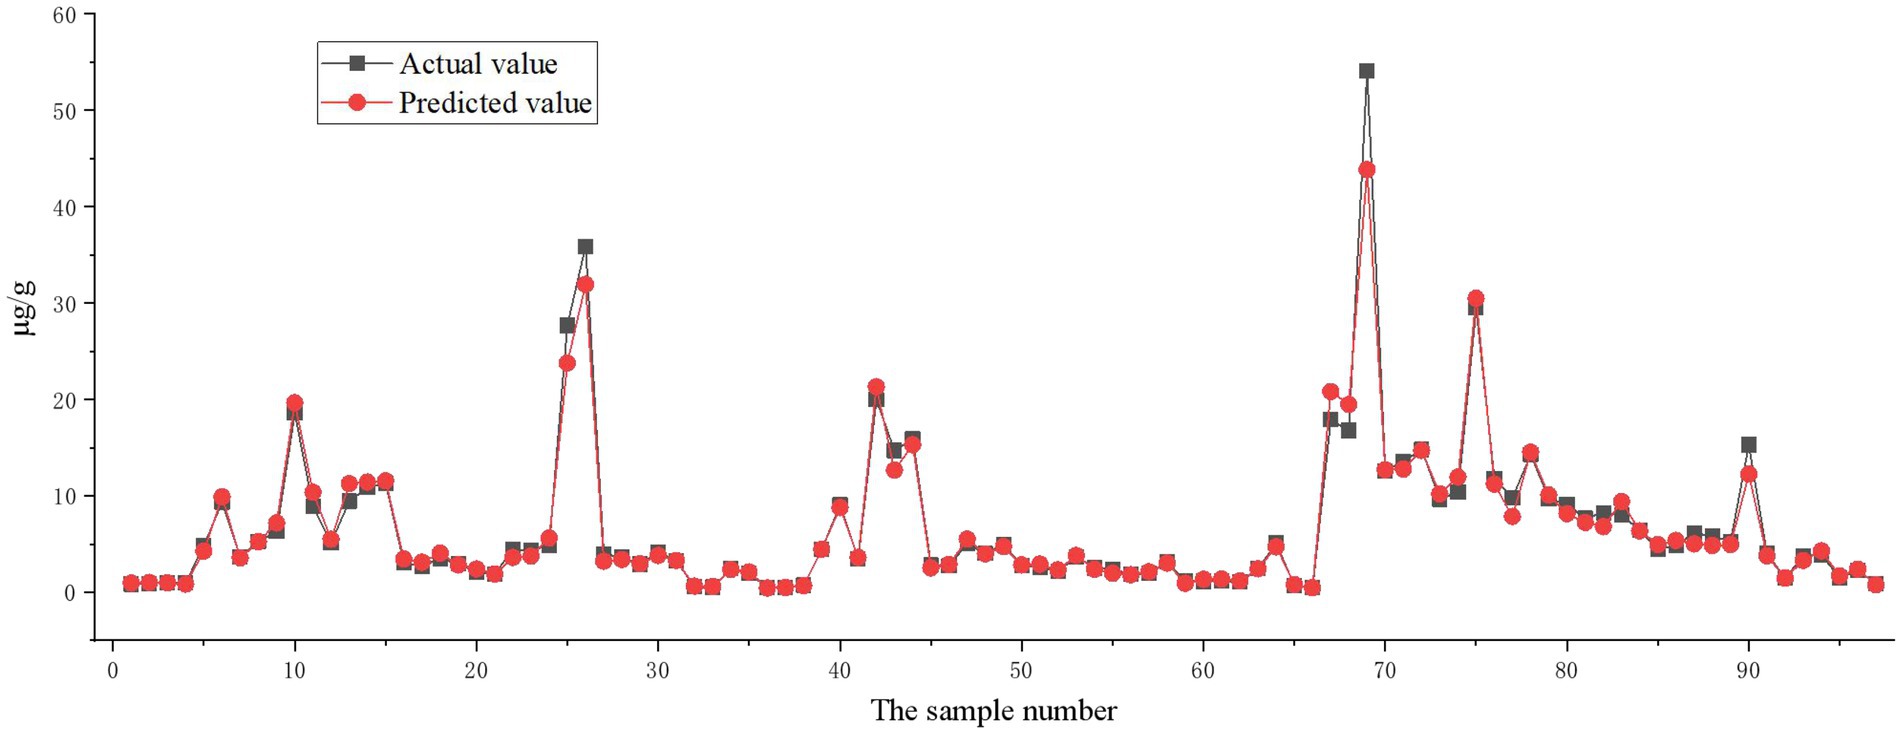
In order to directly reflect the overall trend of estimation error, the actual and predicted values of Cd and Se in the study area soil by GA-BP model were compared. The results are shown in Figures 8, 9.
It can be seen that GA-BP model has good training approximation accuracy, and the prediction of Cd and Se content is very accurate. Only a few sample points have relatively large error, but the overall prediction performance is good.
Prediction of pollution state
In order to verify the superiority of GA-BP neural network model, it was compared with multiple linear regression model (MLRM), BP network model and M5 decision tree model in different levels of Cd pollution samples. The results are shown in Table 3.
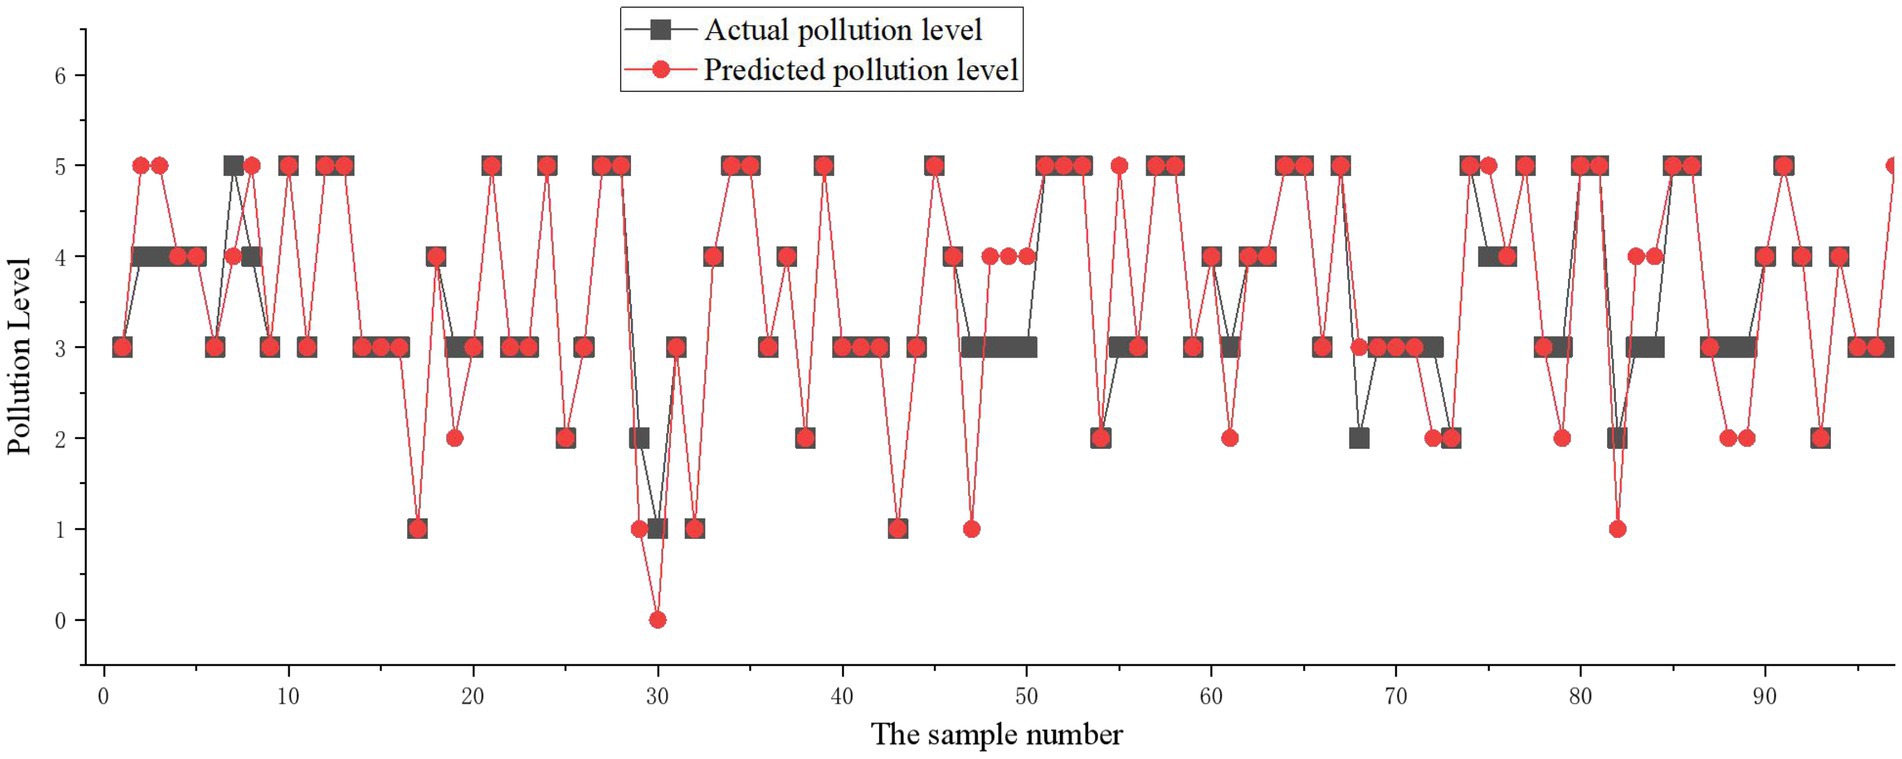
Compared with mlrm, GA-BP reduced the RMSE by 64.84, 52.12, and 49.53% respectively, and the estimation error of 63.18% was also significantly lower than that of M5. The distribution of soil Cd pollution level in the study area is statistically analyzed, and the results are shown in Figure 10.
Among the samples in the study area, 4.12, 8.24, 42.26, 17.52, and 27.86% were in the safe, relatively safe, slightly polluted, moderately polluted and heavily polluted areas, respectively.
Discussion
To sum up, GA-BP model maintains the good generalization ability in the new test sample points, and because of the fuzzy rule model expression, it has the interpretability and comprehensibility that the neural network model does not have. It has a significant application value for the ecological risk analysis and assessment of soil heavy metal pollution. In addition, the accuracy of GA-BP neural network model in estimating Cd pollution status in different regions was higher than that of the other three regression models. At the same time, the prediction effect of this model for mild Cd pollution is better than other grades. Moreover, the Nemero pollution level predicted by GA-BP neural network model is close to the measured Nemero pollution level. In addition, it can be seen that soil Cd pollution in the study area is a serious problem. Only 12.36% of the samples are safe and have no risk of Cd pollution, while most of them are mildly polluted. Therefore, it is necessary to carry out risk control of Cd pollution in the study area. Because of the huge potential of carbon sequestration and emission reduction in agriculture, planting Se-rich and Cd-low crops in these areas can not only promote the development of local se-rich industries but also achieve carbon sequestration and emission reduction. Heavy metals in soil will enter plants or animals through the food chain and then enter human body for enrichment, affecting human life and health. This study has important value for the situation analysis and scientific prevention and control of soil heavy metal pollution risk.
Conclusion
In this paper, the improved GA-BP algorithm is used to build the cadmium pollution risk assessment model in the selenium rich are. The content of Cd in different pollution states was calculated and the soil Cd pollution index was used for quantitative prediction, which is of great value for the spatial situation analysis and scientific prevention and control of soil heavy metal pollution. The experimental results show that, compared with BP neural network, GA-BP has a significant optimization effect on the model, and its fitness index is gradually stable at lower iteration times. The accuracy of GA-BP neural network model to estimate Cd pollution status in different areas is higher than other models. In addition, this study has important value for the situation analysis and scientific prevention and control of soil heavy metal pollution. From the pollution level index, soil Cd pollution of the Permian in the study area is relatively serious, only 12.36% of the samples are in a safe state. In the global scale, soil Cd pollution or potential pollution in many areas is still very much studied. Heavy metals in soil will enter plants or animals through the food chain and then enter human body for enrichment, affecting human life and health. This study has important value for the situation analysis and scientific prevention and control of soil heavy metal pollution risk.
Data availability statement
The original contributions presented in the study are included in the article/supplementary material, further inquiries can be directed to the corresponding author.
Ethics statement
This study were reviewed and approved by Hubei Institute of Earth Sciences, Hubei Selenium Eco-Environmental Effect Testing Center and Huazhong Agricultural University. The participants provided their written informed consent to participate in the study.
Author contributions
WZ and JY were responsible for the conception of research ideas and the writing of the first draft. DW was responsible for data collection. YZ and CJ were responsible for the methodology design. LY was responsible for the analysis of the data. HC was responsible for the article chart. All authors contributed to the article and approved the submitted version.
Funding
This work was supported by 2020 Science and Technology Support Project of Hubei Geological Bureau (KJ2020-13); Study on The Coupling Effect and Ecological Risk of Typical Metal Elements and Selenium in Selenium Rich Areas (KJ2018-17).
Acknowledgments
The authors would like to show sincere thanks to those techniques who have contributed to this research.
Conflict of interest
The authors declare that the research was conducted in the absence of any commercial or financial relationships that could be construed as a potential conflict of interest.
Publisher’s note
All claims expressed in this article are solely those of the authors and do not necessarily represent those of their affiliated organizations, or those of the publisher, the editors and the reviewers. Any product that may be evaluated in this article, or claim that may be made by its manufacturer, is not guaranteed or endorsed by the publisher.
References
Aydilek, I. B., and Arslan, A. (2012). A novel hybrid approach to estimating missing values in databases using k-nearest neighbors and neural networks. Int. J. Innov. Comput. Inf. Control 7, 4705–4717.
Chen, Y., Jiang, X., Wang, Y., and Zhuang, D. (2018). Spatial characteristics of heavy metal pollution and the potential ecological risk of a typical mining area: a case study in China. Process Saf. Environ. Prot. 113, 204–219. doi: 10.1016/j.psep.2017.10.008
Cheng, H., Zhao, Y., and Li, F. (2020). Genetic algorithm-optimized BP neural network model for prediction of soil heavy metal content in XRF[C]//2020 international conference on intelligent computing, automation and systems (ICICAS). IEEE, 41, 327–331. doi: 10.1109/ICICAS51530.2020.00074
Deng, W., Shang, S., Cai, X., Zhao, H., Song, Y., and Xu, J. (2021). An improved differential evolution algorithm and its application in optimization problem. Soft. Comput. 25, 5277–5298. doi: 10.1007/s00500-020-05527-x
Dumedah, G., Walker, J. P., and Chik, L. (2014). Assessing artificial neural networks and statistical methods for infilling missing soil moisture records. J. Hydrol. 515, 330–344. doi: 10.1016/j.jhydrol.2014.04.068
Gong, C., Jiaxuan, L., and Zhixiu, D. (2017). Application of BP neural network in soil heavy metal pollution analysis (in Chinese). J. Geol. 41, 394–400. doi: 10.3969/issn.1674-3636.2017.03.005
Hu Qing, W., and Ying, Z. Y. (2022). Application and thinking of selenium rich soil remediation and improvement technology: a case study of Enshi prefecture, Hubei Province (in Chinese). Land China 41, 47–48. doi: 10.13816/j.cnki.ISSN1002-9729.2022.01.17
Jiang Xue, L., Wen, Y. Q., and Haiqing, Z. (2014). Using support vector machine to evaluate soil environmental quality China environmental (in Chinese). Science 34, 1229–1235.
Liang, Y., Ren, C., Wang, H., Huang, Y. B., and Zheng, Z. T. (2019). Research on soil moisture inversion method based on GA-BP neural network model. Int. J. Remote Sens. 40, 2087–2103. doi: 10.1080/01431161.2018.1484961
Lijie, S., Yi, Z., Miao, A., Shijin, D., Youcai, Z., and Shucan, L. (2018). Review on remediation technology of soil heavy metal pollution (in Chinese). Shandong Chem. Industry 47, 203–207. doi: 10.3969/j.issn.1008-021X.2018.10.084
Liu, D., Liu, C., and Tang, Y. (2021). GA-BP neural network regression model for predicting the soil moisture of ecological slope protection. 08 July 2021, PREPRINT (Version 1) available at Research Square [https://doi.org/10.21203/rs.3.rs-681849/v1]
Ma, W., Tan, K., and Du, P. (2016a). Predicting soil heavy metal based on random Forest model. IEEE Int. Geosci. Remote Sens. Symp. (IGARSS) 2016, 4331–4381. doi: 10.1109/IGARSS.2016.7730129
Ma, W., Tan, K., and Li, H. (2016b). Hyperspectral inversion of heavy metals in soil of a mining area using extreme learning machine. Journal of Ecology and Rural Environment 32, 213–218. doi: 10.11934/j.issn.1673-4831.2016.02.007
Mingyi, S., and Jing, c. (2012). Characteristics and ecological effects of selenium rich soil in high cadmium geological environment (in Chinese). Earth Environ. 40, 354–360.
Pal, S. C., Ruidas, D., Saha, A., Islam, A. R. M. T., and Chowdhuri, I. (2022). Application of novel data-mining technique-based nitrate concentration susceptibility prediction approach for coastal aquifers in India. J. Clean. Prod. 346:131205. doi: 10.1016/j.jclepro.2022.131205
Qiuxia, Z., Hebing, Z., and Wenkai, L. (2017). Hyperspectral inversion of soil heavy metal content in high-standard prime farmland construction area (in Chinese). Trans. Chin. Soc. Agric. Eng. 33, 230–239. doi: 10.11975/j.issn.1002-6819.2017.12.030
Ren, J., Zhao, Y., and Yu, K. (2022). LIBS in agriculture: a review focusing on revealing nutritional and toxic elements in soil, water, and crops. Comput. Electron. Agric. 197:106986. doi: 10.1016/j.compag.2022.106986
Ruidas, D., Pal, S. C., Saha, A., Chowdhuri, I., and Shit, M. (2022). Hydrogeochemical characterization based water resources vulnerability assessment in India's first Ramsar site of Chilka lake. Mar. Pollut. Bull. 184:114107. doi: 10.1016/j.marpolbul.2022.114107
Shi Jiangdan, W., and Yangyang, H. L. (2022). Spatial and temporal distribution characteristics and influencing factors of heavy metals in topsoil of China: based on bibliometric analysis (in Chinese). Environ. Ecol. 4, 1–7.
Sun, W. W., and Sheng, X. P. (2016). Soil heavy metal pollution research based on statistical analysis and BP network. FSDM, 274–281.
Wang, L., and Bi, X. (2021). Risk assessment of knowledge fusion in an innovation ecosystem based on a GA-BP neural network. Cogn. Syst. Res. 66, 201–210. doi: 10.1016/j.cogsys.2020.12.006
Yantao, J., Shaoqian, Q., Xiaorui, J., and Zijun, D. (2022). Research progress on remediation technology of heavy metal contaminated soil in China (in Chinese). China Metal. Bull., 176–178. doi: 10.3969/j.issn.1672-1667.2022.05.058
Ying, C., Yanrong, L., and Zhiguo, S. (2019). Assessment of heavy metal pollution in farmland topsoil based on Nemerow comprehensive pollution index (in Chinese). Anhui Agric. Sci. 47, 63–67. doi: 10.3969/j.issn.0517-6611.2019.19.020
Keywords: Se, GA-BP, pollution risk assessment, Cd, carbon emission reduction
Citation: Zhou W, Wang D, Yan J, Zhang Y, Yang L, Jiang C and Cheng H (2022) Risk assessment of cadmium pollution in selenium rich areas based on machine learning in the context of carbon emission reduction. Front. Ecol. Evol. 10:1031050. doi: 10.3389/fevo.2022.1031050
Edited by:
Rita Yi Man Li, Hong Kong Shue Yan University, Hong Kong SAR, ChinaReviewed by:
Subodh Chandra Pal, University of Burdwan, IndiaXiang Hao, Nanjing University of Aeronautics and Astronautics, China
Copyright © 2022 Zhou, Wang, Yan, Zhang, Yang, Jiang and Cheng. This is an open-access article distributed under the terms of the Creative Commons Attribution License (CC BY). The use, distribution or reproduction in other forums is permitted, provided the original author(s) and the copyright owner(s) are credited and that the original publication in this journal is cited, in accordance with accepted academic practice. No use, distribution or reproduction is permitted which does not comply with these terms.
*Correspondence: Liangzhe Yang, eWFuZ2xpYW5nemhlQDEyNi5jb20=
 Wei Zhou1,2
 Liangzhe Yang