 Ziqi Chen
 Zhaoli Liu2
 Guanglei Hou
95% of researchers rate our articles as excellent or good
Learn more about the work of our research integrity team to safeguard the quality of each article we publish.
Find out more
ORIGINAL RESEARCH article
Front. Ecol. Evol. , 07 November 2022
Sec. Environmental Informatics and Remote Sensing
Volume 10 - 2022 | https://doi.org/10.3389/fevo.2022.1031008
This article is part of the Research Topic Meta-Scenario Computation for Social-Geographical Sustainability View all 60 articles
The period-oriented comparative evaluation of biodiversity conservation effectiveness is the main basis for implementing the transfer payment policy of ecological compensation. In response to the lack of such a spatial comparative assessment system, the paper proposes a method to construct the period conservation effectiveness index (PCEI) and applies it to the spatial comparative assessment of Chinese biodiversity conservation effectiveness in three periods from 1990 to 2015, while validating the rationality of the reference. The results show that (1) spatially, the biodiversity conservation effectiveness of key ecological function areas (KEFAs) in Central China and South China is better, while Southwest and Northwest are in the middle, and East China and Northeast are worse; (2) temporally, the biodiversity conservation effectiveness of KEFAs as a whole is worse from 1990 to 2000, best from 2000 to 2010, and middle from 2010 to 2015; (3) The existing reference establishment methods can reflect the spatial differences of natural environment background, which effectively support the spatial comparison assessment of biodiversity conservation effectiveness. This study constructs a spatial comparison assessment system of biodiversity conservation effectiveness within periods, which can provide a scientific basis for national and even global large-scale ecological compensation and other fund allocation methods.
In the past decades, the establishment of various protected areas has played an important role in improving the ecological environment (Gaston and Cruz-Piñón, 2008; Brooks et al., 2009; Hou et al., 2017; Xu et al., 2017). To promote and encourage ecological protection, the state invests a lot of money in the construction and restoration of protected areas (Gantioler et al., 2014). As an important basis for fund allocation, a set of time-oriented, reasonable, and spatially comparable methods for assessing biodiversity conservation effectiveness is particularly important.
Currently, Zheng et al. (2012) carried out the conservation effectiveness assessment of national wetland nature reserves, but the essence is to assess the biodiversity conservation function rather than the biodiversity conservation effectiveness. Conservation effectiveness focuses on the changes in biodiversity conservation function under human influence, and the comparison of biodiversity conservation function inside and outside protected areas is commonly used to measure conservation effectiveness, thus realizing the spatial comparison of conservation effectiveness at a large scale (Ren et al., 2015; Gray et al., 2016; Feng et al., 2021). The above methods cannot achieve effective spatial comparative assessment of conservation effectiveness, because they do not take into account the differences in the natural environment background conditions of each region. In response to the above problems, Xu et al. (2018) used the construction of reference to exclude the influence of differences in natural environmental backgrounds, and initially developed a set of spatial comparative assessment methods for biodiversity conservation effectiveness. However, the above studies only addressed spatial differences in the biodiversity conservation effectiveness in wetland ecosystem types, and Dong et al. (2018) extended them to the assessment of different ecosystem types such as wetlands and forests. Although the above methods can achieve spatial comparison of biodiversity conservation effectiveness, they are limited to the examination of assessment methods. Chen et al. (2022) then applied the methods to the whole Chinese region and comparatively assessed the spatial differences of biodiversity conservation effectiveness among several KEFAs. Nevertheless, the allocation of transfer funds is based on the temporal changes of conservation effectiveness (He et al., 2014), while the above method reflects the biodiversity conservation effectiveness from the original state to the assessment moment, and cannot provide the comparative results of conservation effectiveness at a certain time, so the above method still has some limitations. In addition, the reference is the basis of the spatial comparative assessment method, and there is still a lack of effective scientific tests on whether the existing reference can reflect the differences in natural environment background between different assessment areas.
Against this background, on the one hand, we aim to develop a set of spatial comparison assessment methods that can reflect the biodiversity conservation effectiveness at a certain period, and on the other hand, to analyze whether the reference obtained can effectively reflect the spatial differences in ecological background, and thus provide a scientific basis for the allocation of transfer payments.
The revised version of the National Ecological Function Zoning released by the Ministry of Environmental Protection in 2015 delineates 63 KEFAs on a national scale from the types of biodiversity protection, water conservation, soil and water conservation, wind and sand control, and flood storage. Among them, there are 24 KEFAs mainly for biodiversity protection, with a total area of 2.208 million km2, which cover 23.1% of the land area, and their codes and locations are shown in Figure 1. China contains seven geographic regions, except for North China, biodiversity KEFAs are distributed in other six administrative regions, and the proportion of KEFAs in each administrative geographic division are Southwest (57.25%), East China (7.45%), South China (3.02%), Northwest (15.12%), Northeast (7.31%), and Central China (9.85%).
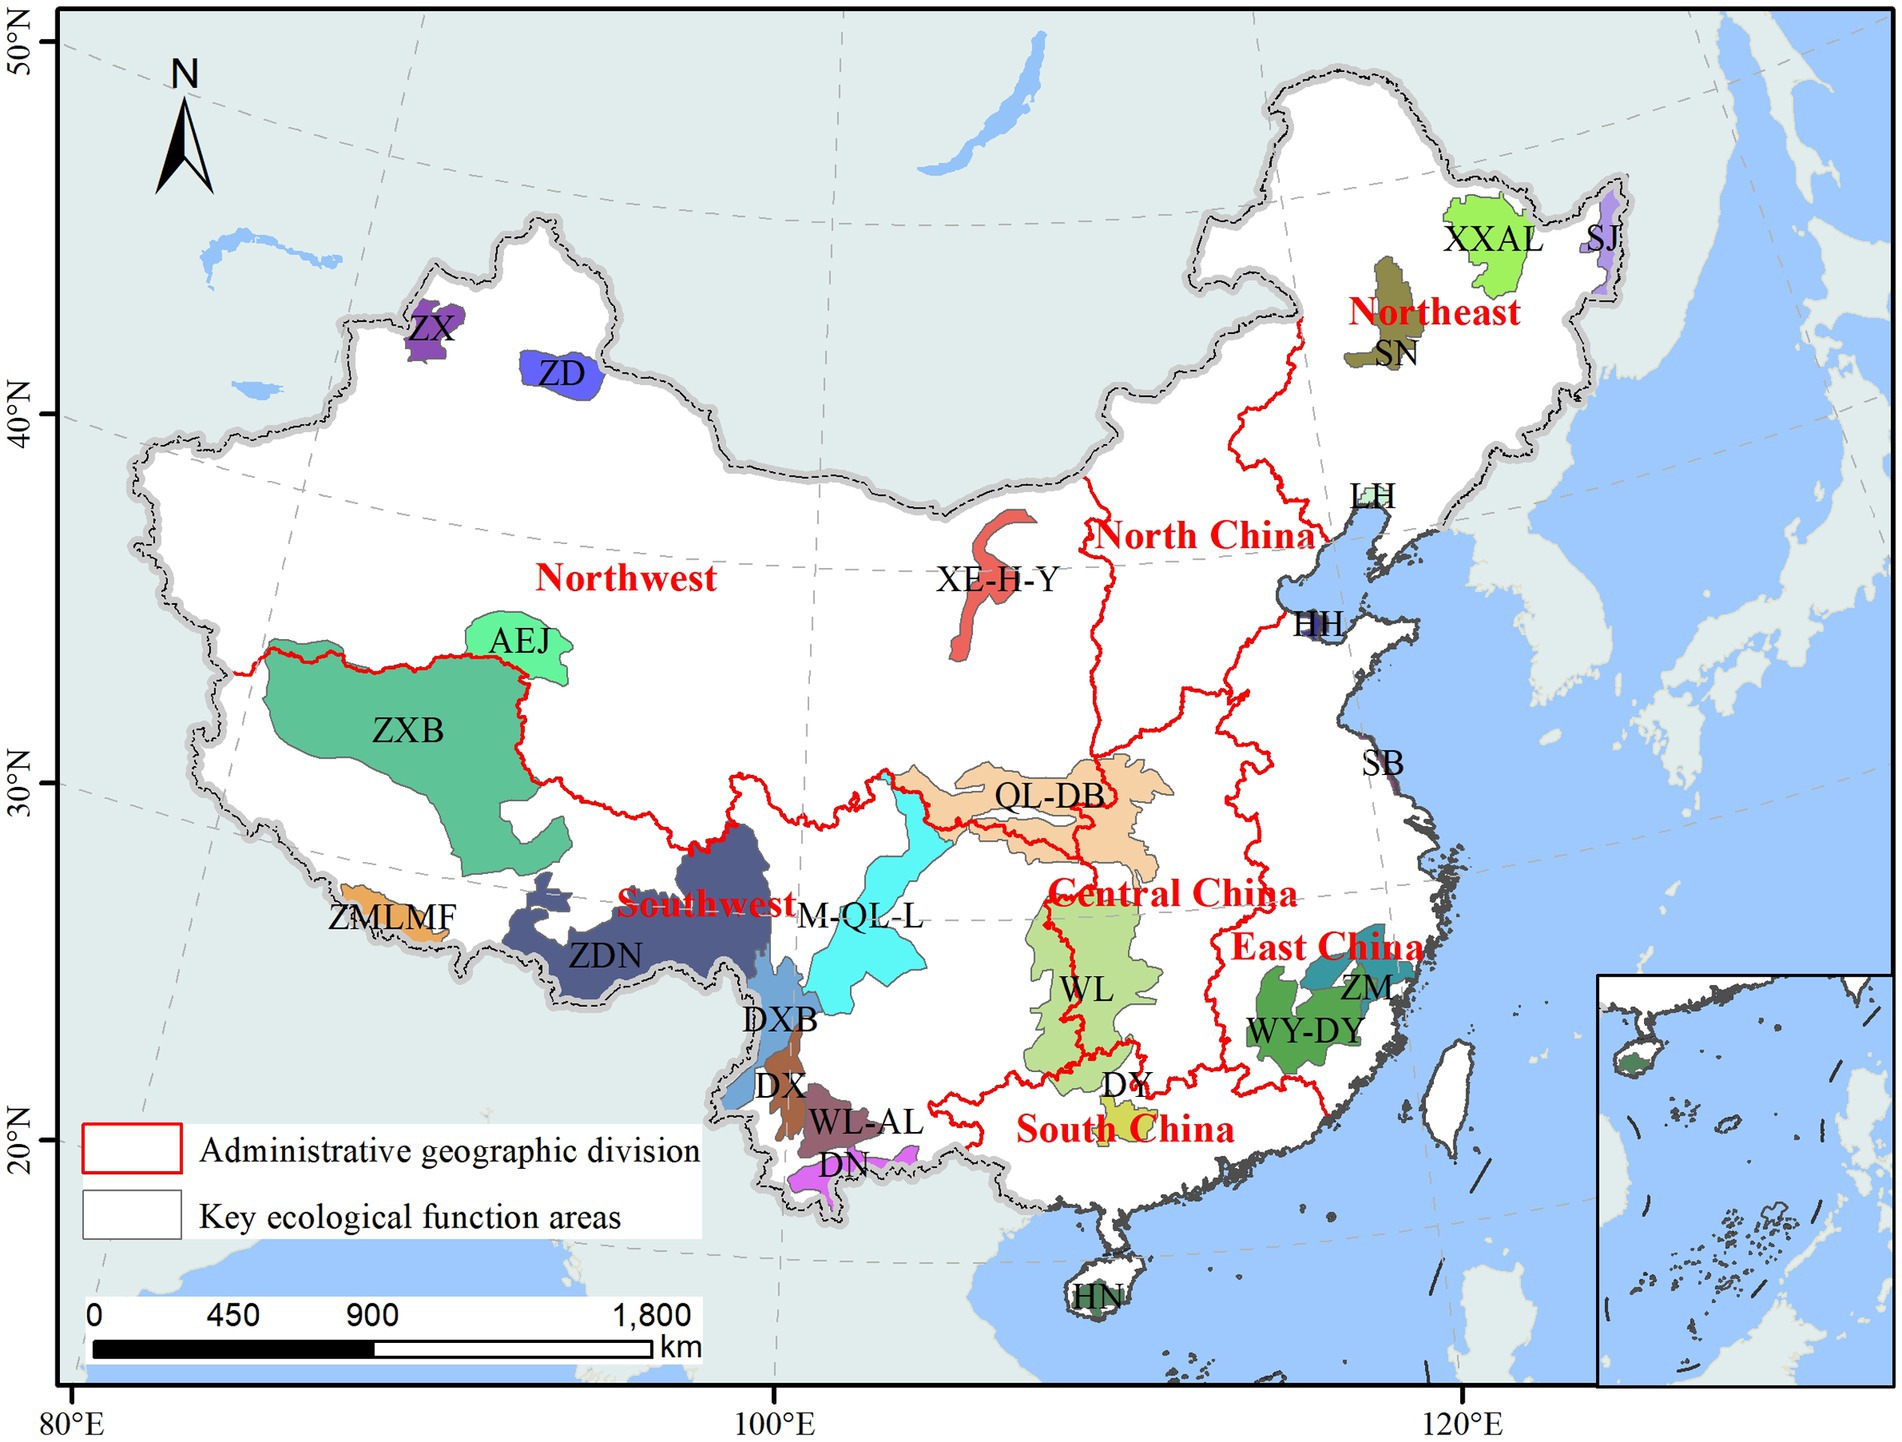
Figure 1. Distribution of KEFAs for biodiversity conservation in China.
SN, LH, and SJ in the Northeast are mainly for wetland biodiversity conservation, and the objects of conservation are mainly rare waterfowl such as the Red crown crane; XXAL is mainly for forest biodiversity conservation, and the objects of conservation are mainly endangered forest vegetation such as broad-leaved red pine forests and large rare animals such as the Siberian tiger. HH and SB in East China also focus on wetland biodiversity conservation, which are the wintering grounds of the Red crown crane and other rare waterfowl; Ginkgo, Tsuga Chinensis, and other rare relict plants are distributed in WY-DY in East China; QL-DB at the junction of Northwest and Central China is the main habitat of national protected animals such as Panda, Golden Monkey, and Takin; WL in Central China protects rare and endangered plants such as dove trees and leopards. In South China, DY protects precious animals such as crocodilians, while HN protects plant species such as Cycas taiwaniana and animal species such as Varanus salvator in tropical rainforest ecosystems. In the eastern part of Southwest, M-QL-L borders QL-DB and protects rare animal species similar to QL-DB; in the southern part of the region, DXB, DX, DN, and WL-AL are distributed with endangered animals such as Yunnan snub-nosed monkeys, Stump-tailed macaques, and black Concolor gibbons, and rare plants such as different types of Taxus Chinensis; in the central part of the region, ZDN is distributed with all plant species from tropical to boreal zones and rare animal species such as Entellus. The highest terrain in the world, the ZMLMF is located in the southwest and has unique and rare wildlife such as Assamese macaque, while the ZXB in the northwest is a unique distribution area for large ungulates such as the Tibetan antelope in the alpine ecosystem. The AEJ in the southwestern part of the Northwest shares similar biodiversity with ZXB in the Southwest; ZD and ZX in the northwestern part are located in the arid desert zone in the interior of Asia and Europe, and their unique climatic environment has nurtured endemic animals with significant desert characteristics, such as Equus Przewalskii, Aspiorhynchus laticeps, Ranodon sibiricus, Testudo horsfieldii and other precious animal species; XE-H-Y in the eastern part has national protected plants such as Ammopiptanthus mongolicus and rare animal species such as red deer and Musk deer.
The land cover dataset is provided by Project 1 of the National Key R&D Program “Ecosystem assessment technology based on multi-source data fusion and its application research,” which uses the domestic environmental disaster satellite (HJ-1A/B) and the Landsat data as information sources. The land cover dataset for 1990, 2000, 2010, and 2015 with a spatial resolution of 1 km, was obtained using a 40-class classification system and an object-oriented multi-scale segmentation and change detection classification method.
China administrative region boundary data is obtained by combining the administrative division scheme and the regional merging operation of China provincial boundary vector data. The vector boundary data of KEFAs were obtained from the revised version of the National Ecological Function Zoning in 2015 by scanning and digitizing and extracting by manual visual tracking. The national-level nature reserve boundary vector data were obtained from the Resource and Environment Science Data Center of the Chinese Academy of Sciences.1
The DEM data were downloaded from USGS GMTED2010 with a resolution of 30 arc seconds, and the Chinese digital elevation model was obtained by overlaying with the national provincial boundary vector data. The climate zones are derived from the important geographic boundaries of China, which are obtained by scanning digitization and manual visual tracking extraction.
The existing Conservation Effectiveness Comparison Index (CECI) is setting the maximum value of the Habitat Quality Index (HQI) of the nature reserve in previous years as the Habitat Quality Reference (HQR) of the assessment area, then constructed by comparing the habitat quality of the assessment area at the time of assessment with the reference (Xu et al., 2018), with the following formula:
where, CECI is the conservation effectiveness comparison index, HQI is the habitat quality index of KEFAs, and HQR is the habitat quality reference of KEFAs.
In fact, the above index expresses the original state of habitat quality in the assessment area assuming the maximum habitat quality of nature reserves, and the distance of habitat quality in the assessment area from the reference at the time of assessment reflects the temporal change of habitat quality under human influence, i.e., the conservation effectiveness of biodiversity maintenance function. However, the spatial comparison assessment of biodiversity conservation effectiveness for transfer payment is for a certain assessment period, while the existing CECI reflects the effectiveness of biodiversity conservation from the original state to the assessment time, therefore, it is difficult to apply this method system to the reasonable allocation of ecological compensation funds.
The assessment period is the time interval between two different assessment moments before and after, and the corresponding CECI exist before and after the assessment moments, respectively. Accordingly, the quantitative difference between the CECI of the two assessment moments is used to reflect the biodiversity conservation effectiveness in the assessment area during the assessment period, and the specific formula is as follows:
where, CECIi and CECIj are the conservation effectiveness comparison index in the year i and year j, respectively. If PCEIi-j is positive, it indicates that the biodiversity conservation effect is good from i to j, and the habitat quality of KEFAs is approaching the reference; if PCEIi-j is negative, it indicates that the biodiversity conservation effect of KEFAs is deteriorating from i to j, and the habitat quality of KEFAs is moving away from the reference.
1. Habitat quality index calculation for the assessment area.
Based on previous habitat quality assessment studies (Shui et al., 2018; Gong et al., 2019; Sun et al., 2019; Liu and Xu, 2020; Tang et al., 2020; Wang et al., 2020; Zhu et al., 2020), the habitat suitability of the ecological land types in the assessment area was taken into account, and a parameter weighting table was established (Chen et al., 2022). Secondly, 1990, 2000, 2010, and 2015 land use data and the parameter weight tables were input into the InVEST model to generate habitat quality raster data; finally, based on the vector boundaries of KEFAs, the habitat quality raster data were regionally averaged to obtain the HQI of the four-year assessment area.
2. Assessment area reference construction.
Based on the vector range of the KEFAs and nature reserves, the nature reserves within or near the KEFAs are extracted as the reference areas; based on the vector boundary of the nature reserves, the habitat quality raster data of each of the above years are averaged to obtain the HQI of the four-year reference areas; the maximum value is selected as the reference of the assessment areas.
3. Conservation Effectiveness Comparison Index acquisition.
Based on the HQI of the assessment areas in 1990, 2000, 2010, and 2015 calculated above and the constructed HQR, the CECI at the four assessment moments were obtained by subtracting the HQI of the assessment areas in each period from the reference, respectively.
4. Period Conservation Effectiveness Index generation.
The biodiversity conservation effectiveness in a certain period is mainly reflected in the change of the CECI of KEFAs in a fixed time interval. By subtracting the CECI in the later period of the assessment period from the earlier period, a PCEI is generated, which illustrates the biodiversity conservation effectiveness in KEFAs between 2 years, the index was magnified 100 times in this study.
5. Period-oriented spatial comparative evaluation of biodiversity conservation effectiveness.
Based on the PCEI of KEFAs in China from 1990 to 2000, 2000 to 2010, 2010 to 2015, and the whole assessment period of 1990–2015, spatial comparative assessment of biodiversity conservation effectiveness in KEFAs can be realized. Further, the spatial differences in the biodiversity conservation effectiveness in China can be analyzed by counting the PCEI of the geo-administrative divisions in which the KEFAs are located, based on the weighting of the area of the KEFAs into the seven geo-administrative divisions in China.
The PCEI of KEFAs during 1990–2015 are shown in Figure 2. As you can see from the space the Northeast and East China KEFAs fall into the negative area of PCEI, which indicates that the HQI is generally deteriorating in each period and the biodiversity conservation effectiveness is relatively poor; the Central China and South China KEFAs fall into the small positive type of PCEI, which indicates that the HQI is developing in the good direction in each period and the biodiversity conservation effectiveness is good; the PCEI of KEFAs in the Southwest and Northwest fluctuate up and down around the value of 0, indicating the HQI of KEFAs is unchanged and the biodiversity conservation effectiveness is in the middle. Among them, the PCEI of SJ, which is located within the Northeast, has a large negative value (−20.2), and has the worst biodiversity conservation effectiveness; the PCEI of XXAL belongs to the upper level of the region, and the conservation effectiveness is relatively good (−1.48). The PCEI of ZM and WY-DY, which are mainly forest ecosystems in East China, showed positive values, while SB and HH, which are mainly wetland ecosystems, had negative values. Only the HQI of DY in Central China and South China showed a decreasing trend and a small magnitude (PCEI 1990-2015 = −0.38), while the PCEI of the rest of the KEFAs showed positive values, reflecting the good effect of biodiversity conservation. The KEFAs in the Northwest showed a small decrease in general, and the Southwest showed a small increase.
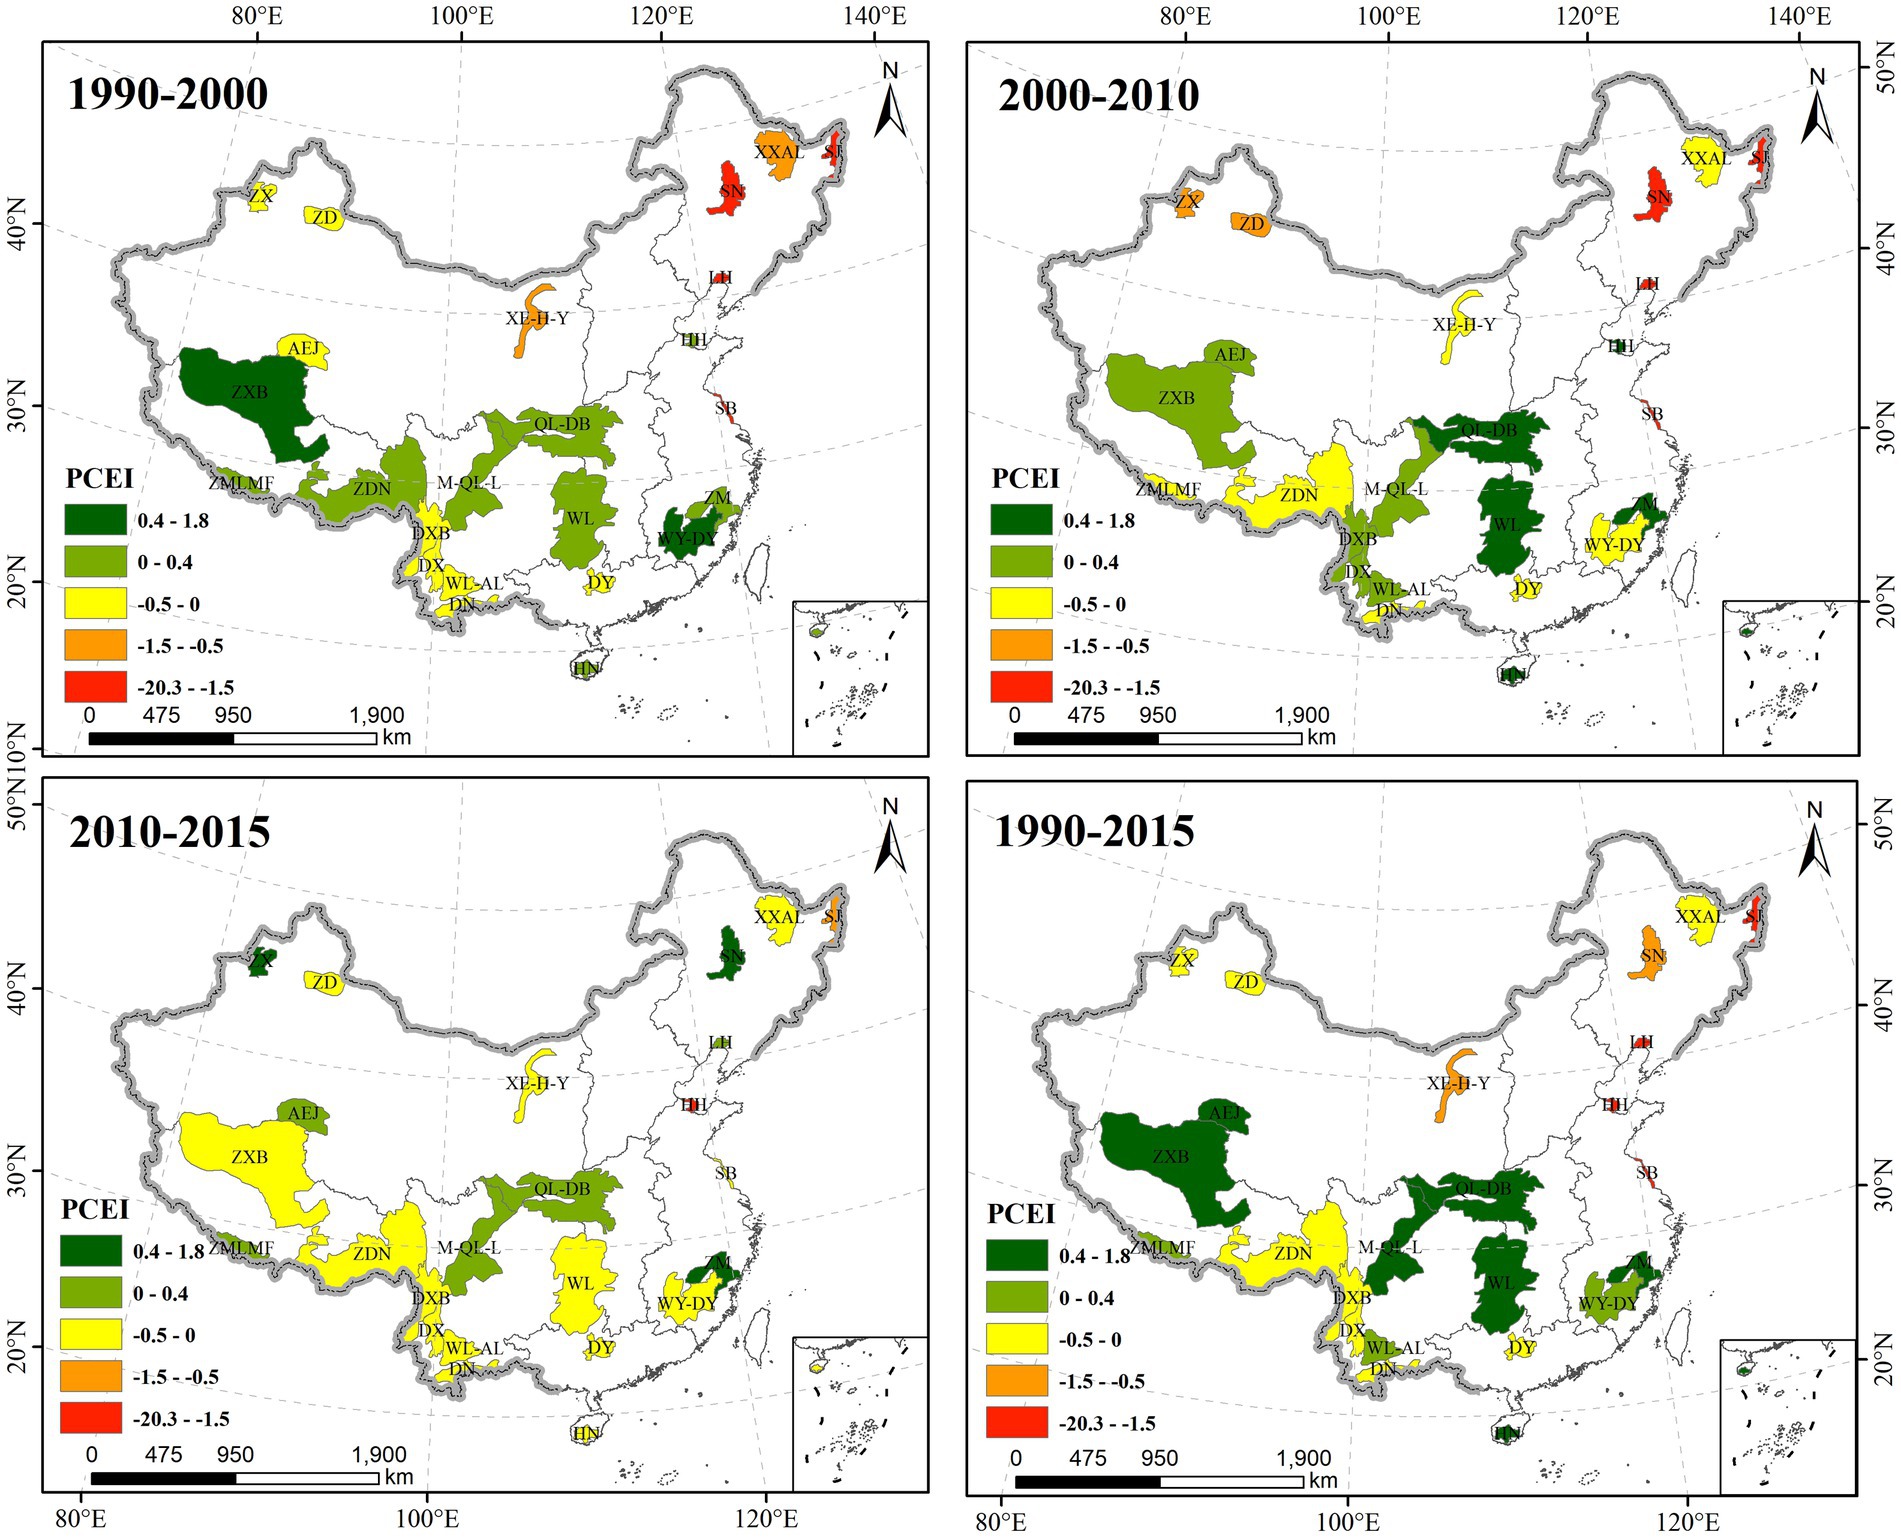
Figure 2. The PCEI of KEFAs during 1990–2015.
In terms of time, the results of the biodiversity conservation effectiveness assessment include three time periods: 1990–2000, 2000–2010, and 2010–2015. The differences in the direction and magnitude of changes in HQI reflect the differences in the biodiversity conservation effectiveness among the KEFAs and show a certain spatial divergence pattern in general. The HQI of KEFAs showed a significant decrease during 1990–2000, and the biodiversity conservation effectiveness was poor. The biodiversity conservation effectiveness was in the upper reaches from 2000 to 2010, and the period of 2010–2015 was in the middle of the whole assessment period. Among them, the HQI of the KEFAs in the Northeast declined significantly from 1990 to 2000, with the PCEI reaching −3.5. In addition, the biodiversity conservation effectiveness of the KEFAs in South China was poor. During 2000–2010, only the HQI of KEFAs in the Northeast continued to decline, but improved compared with the previous period. From 2010 to 2015, the HQI of KEFAs in the Northwest increased, and the biodiversity conservation effectiveness was better, while the biodiversity conservation function in the rest of the regions decreased.
The HQR is a prerequisite and basis for the implementation of the spatial comparative assessment of biodiversity conservation effectiveness, whether it can effectively reflect the spatial variation of China’s natural geography will determine the quality of regional comparative assessment at the national scale. Therefore, the validation and analysis of the HQR are essential.
The pattern of spatial differentiation of climatic and topographic conditions in China necessarily constrains the spatial distribution of plant and animal species and determines the spatial differences in the natural geographic environmental context. The climatic zoning is shown in Figure 3A, the eastern part of China is divided into monsoon climate of medium latitudes, subtropical and tropical monsoon climate zones from north to south, while the northwestern part is the temperate continental climate zone and the southwestern part is the plateau climate zone. They are based on latitudinal and longitudinal zonation patterns, and the combination of Chinese terrain (Figure 3B) leads to vertical zonation. In comparison with Figure 3C, East China and South China are close to the coast, with sufficient moisture and high temperatures throughout the year, and have the best ecological environment in the country; Northeast and Central China are flat, inland, and have obvious seasonal alternation, and their natural environment background is in the middle of the country; The ecological conditions in the Northwest and Southwest are slightly inferior. The deep interior of the Northwest and the natural conditions of aridity and low rainfall results in poor biodiversity levels, while the temperature conditions in the Southwest are slightly better than those in the Northwest, but its unique vertical geographical differentiation is obvious, resulting in large differences in ecological environments within the same region. In addition, Chinese geographer Hu Huanyong discovered in 1935 that a straight line from Heihe in the Northeast to Tengchong in the Southwest could effectively distinguish the spatial distribution of population density in China, the so-called Hu Huanyong line, which is densely populated in the southeast and sparsely populated in the northwest. In essence, it also reflects the spatial differentiation of China’s physical geography. There is a significant difference between the HQR of KEFAs on both sides of the Hu Huanyong line, and the HQR on the southeast side of the line (0.92) is significantly better than that on the northwest side (0.74). Therefore, the HQR can initially reflect the spatial differences in the natural environmental background of China.
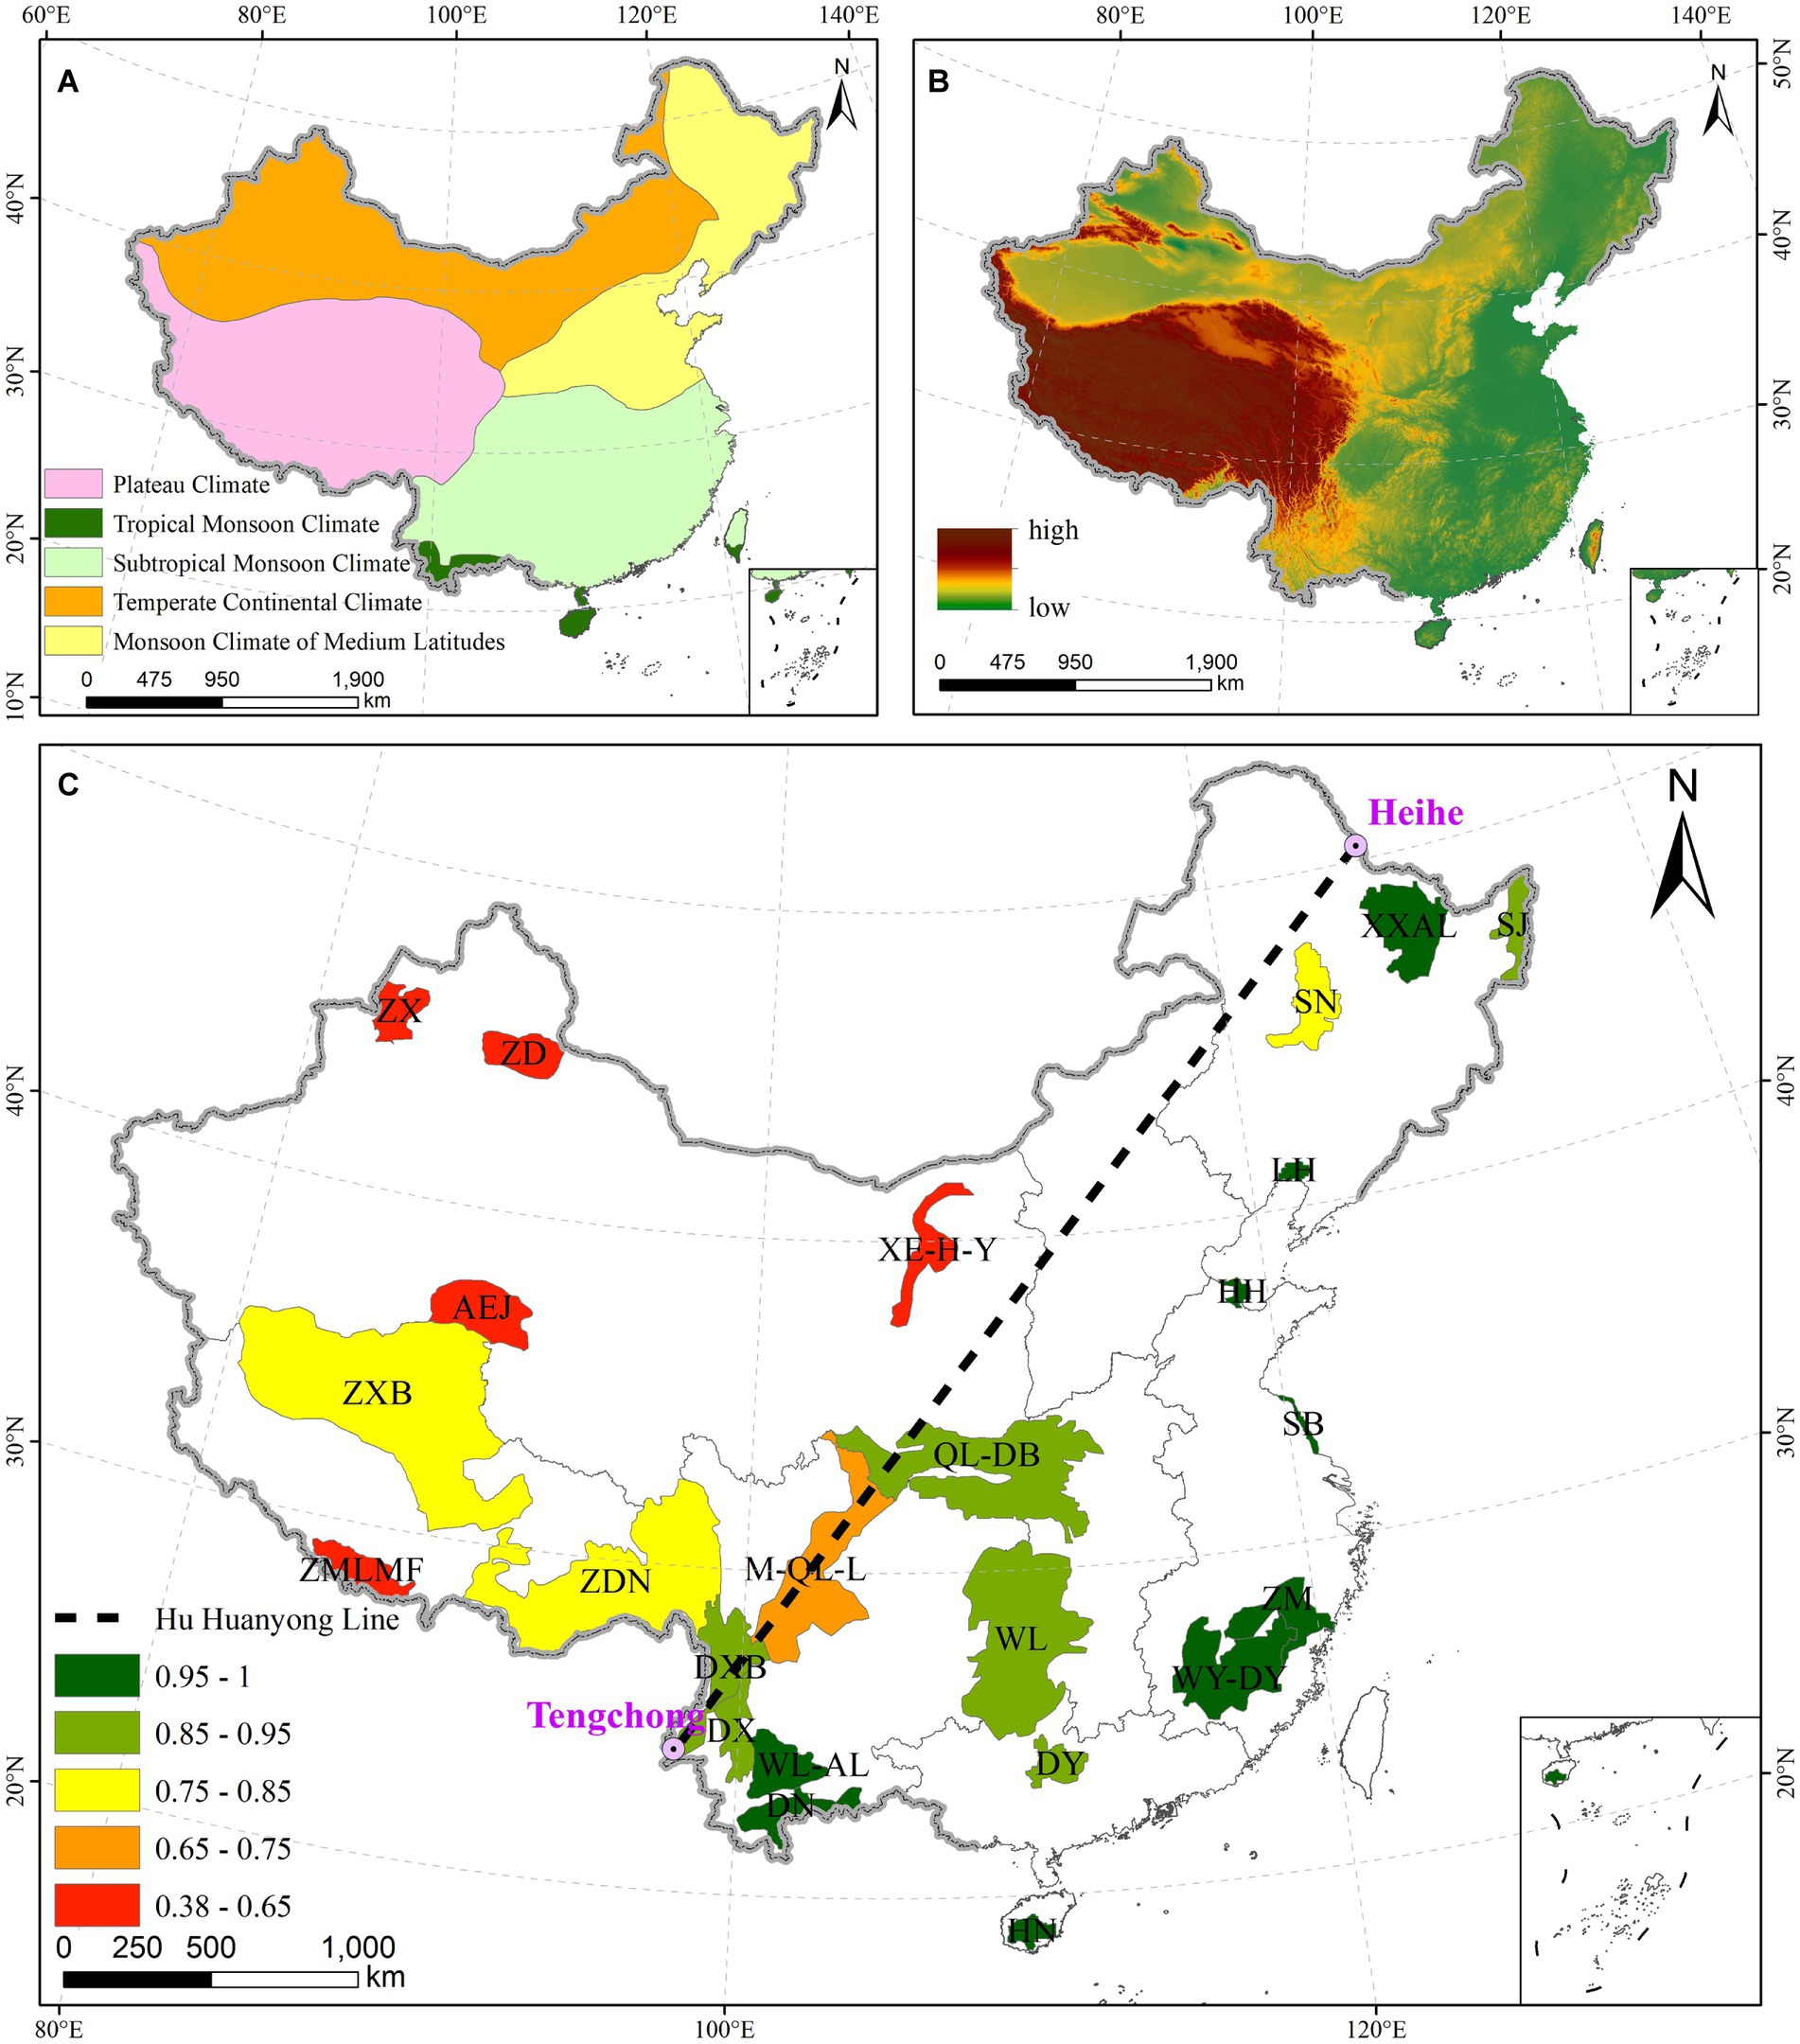
Figure 3. (A) China climate zone map. (B) China terrain map. (C) The HQR.
The spatial variation of temperature and precipitation due to different climatic zones, the regional statistics of annual mean temperature and annual precipitation raster data using the vector boundary of the reference area, respectively, and the scatter plot are generated to quantitatively verify the rationality of the reference. As can be seen from Figure 4 and Table 1, the Northwest is in the middle to lower level, but it is the driest region in China, and under such drought conditions, its HQR presents a correspondingly low value (0.68); the HQR of the Southwest shows a positive correlation with climate elements, and the core areas of the nature reserves are distributed in both warm and humid climate zones and alpine and arid climate zones, reflecting the extreme diversity of the ecological environment due to the vertical; Although the annual mean temperature and the annual precipitation of the Northeast are low, the precipitation was higher than evaporation, this causes the HQR of the region to be at the middle to the upper level (0.93); the HQR of South China and East China is the highest because of the high annual mean temperature and high precipitation climatic conditions due to their latitude and proximity to the coast; the latitude of Central China is similar to that of East China, the average annual temperature is above the middle level, however, due to its inland location, the average annual precipitation is slightly lower than that of South China, and under these climatic conditions, the HQR of this region is in the middle to upper state (0.94). Thus, the HQR of KEFAs shows good consistency with the corresponding climatic environment elements, i.e., the better the matching of water and heat conditions, the higher their HQR.
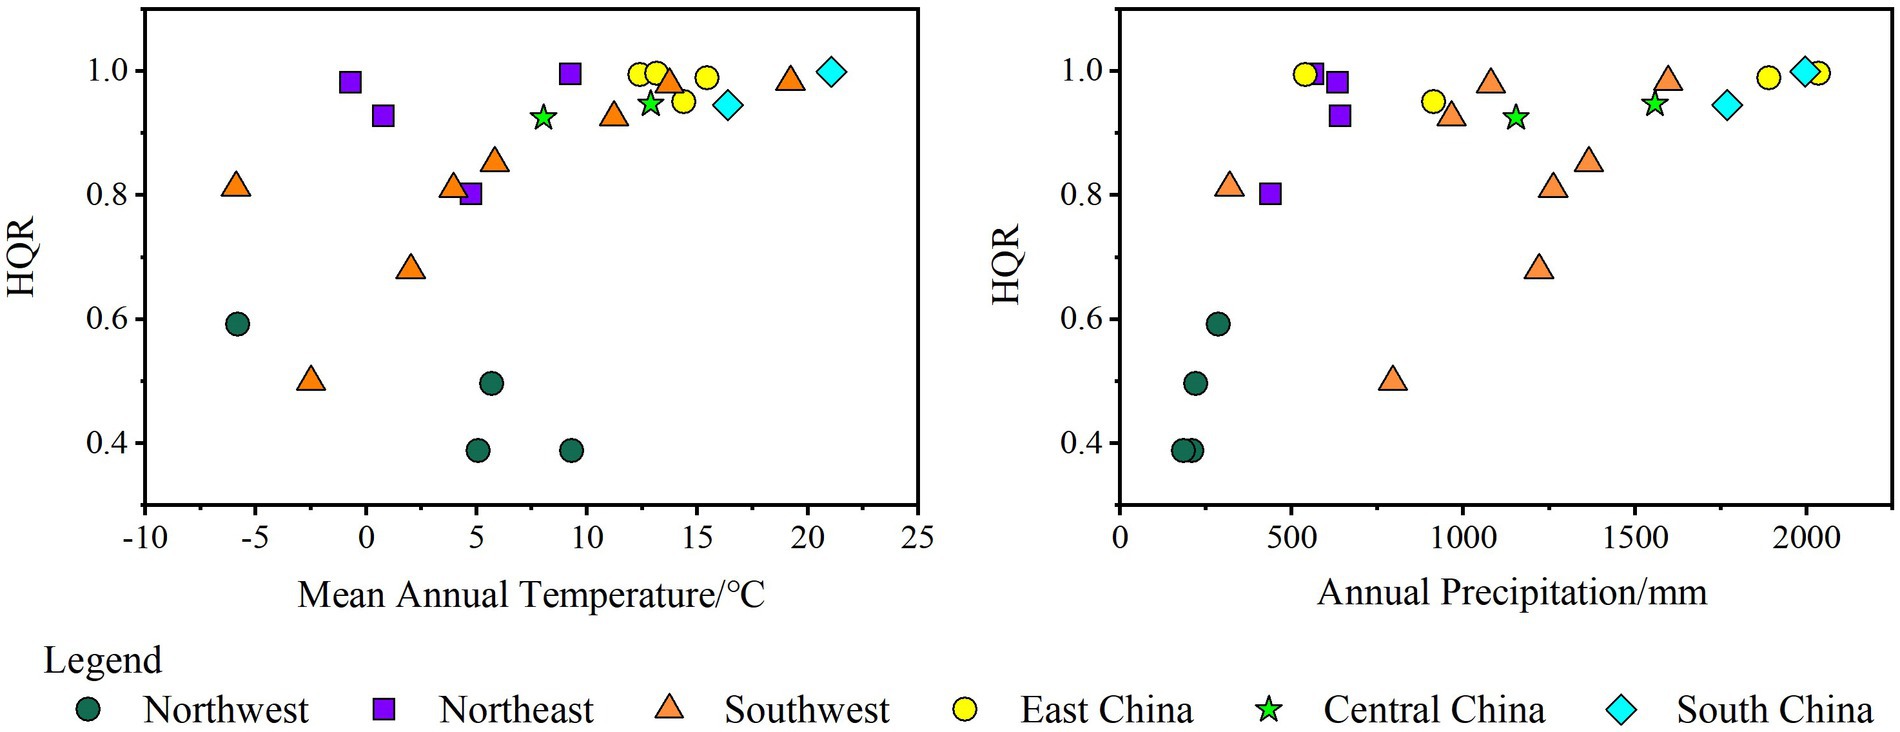
Figure 4. The HQR and mean annual temperature – annual precipitation scattered map.
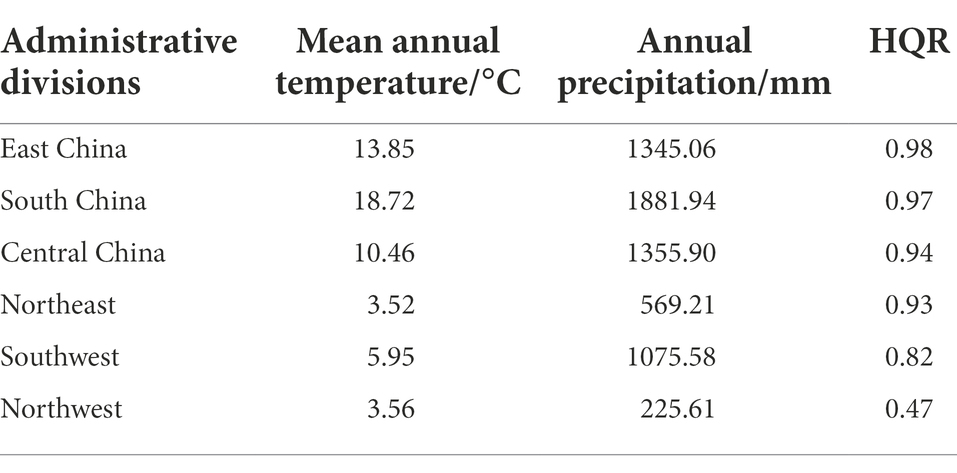
Table 1. The HQR and mean annual temperature – annual precipitation.
The above analysis indicates that the HQR can better reflect the spatial differences in the ecological background of China, thus laying a good foundation for the implementation of the regional comparative assessment of biodiversity conservation effectiveness in KEFAs.
The spatial variation of the HQR is reflected in the area share of ecological land in nature reserves in pristine condition, and the higher the share of ecological land, the greater the HQI. The nature reserves in South China and East China have the best climatic conditions, are close to the coast, have sufficient moisture, and have the best temperature conditions due to their lower latitude. With these two main factors, the soil is fertile and vegetation grows luxuriantly, resulting in the highest percentage of ecological land area in nature reserves. The nature reserves in Northeast and Central China have superior ecological conditions and larger ecological land areas, but the hydrothermal conditions in these regions are slightly worse than those in East China and South China, so the HQR is in the middle. The Northwest is far from the coast and has a dry climate with little rainfall, resulting in a lower percentage of ecological land area in nature reserves. Although the vegetation growth conditions in the Southwest are better than those in the Northwest, the ecological land area is still at the downstream level because of its significant vertical divergence and lower temperatures in areas located at higher elevations.
Spatially, the biodiversity conservation effectiveness is poor in the KEFAs of Northeast and East China, intermediate in Northwest and Southwest, and best in Central China and South China. Northeast has the largest plain area, which is easy for agricultural development, resulting in an increased demand for land due to rapid economic development and population growth, which substantially occupies ecological land. East China has more mountains and hills, and the land area available for development is limited, so the biodiversity conservation effectiveness is better than that of the Northeast. Northwest is arid and has little rainfall, and its unique climatic conditions lead to poor soil quality and less ecological land area, and at the same time, considering the poor economic benefits of the developed land, human interference is less intense; The Southwest is rich in terrain, its biodiversity has been gradually paid attention to, and the effect of carrying out conservation work has shown positive feedback, so the biodiversity conservation effectiveness in the above two regions is at the middle level of the country. Central China and South China are located in the high-quality economic development areas of China, and the ecological environment is at the forefront. Therefore, the biodiversity conservation effectiveness is at the upper level.
Temporally, the biodiversity conservation effectiveness is poor during 1990–2000, and from 2010 to 2015 is in the middle, 2000–2010 has the best conservation effectiveness. The total area of cultivated land in China is increasing from 1990 to 2000, mainly due to the reclamation of grassland and forest land in the north (Liu et al., 2003). Subsequently, biodiversity conservation functions in the Northeast and Northwest continue to decline, especially in the Northeast where intense cultivation of arable land, increased population and regional economic development, and accelerated urbanization are important driving factors (Li et al., 2010). Among them, the reclamation of arable land in the Sanjiang Plain is extremely serious, mainly from wetlands (Li et al., 2018). Compared with 1990–2000, the biodiversity conservation function in the Northeast improved slightly between 2000 and 2010 but still showed a decreasing trend, while other KEFAs increased. After 2000, the degree of human disturbance in East China showed a decreasing trend due to the implementation of the project of returning farmland to forests and grasses (Zhao et al., 2014). As a result, the biodiversity conservation function has been moderated. During 2000–2010, East China, Central China, South China, and Southwest presented better biodiversity conservation work in the project of returning farmland to forest, grass, wetland, and natural forest protection projects, respectively. Only the biodiversity conservation function of KEFAs in the Northwest increased slightly after 2010. Especially, the vegetation cover in the Northeast has improved (Shao et al., 2022), and the biodiversity conservation function has rebounded, but the ecological land was consumed too much in the early stage, and the effectiveness of biodiversity conservation is still at a low level in the national scale.
The Period-oriented spatial comparison assessment of biodiversity conservation effectiveness can effectively realize the reasonable allocation of ecological environment subsidy funds. Based on the results of this study, the number of subsidy funds can be increased for areas with better biodiversity conservation effectiveness and reduced for areas with poorer conservation effectiveness based on the PCEI. The weight of fund distribution is obtained by extracting the minimum value of PCEI of all assessment areas, taking the value downward as x, calculating the absolute value after subtracting x from the PCEI of assessment areas, and then calculating the absolute value of each area as the weight of all assessment areas, which is the fund distribution ratio (FDR), and the formula is as follows:
where, x is a set fixed value, PCEI is the period conservation effectiveness index.
In this study, a PCEI was established and used to achieve a spatially comparative assessment of the biodiversity conservation effectiveness in China’s KEFAs in different ecosystem types under different ecological backgrounds in three periods from 1990 to 2015, and at the same time, the scientific validity of the reference to reflect the differences in the natural environmental background was further verified.
The main conclusions are as follows:
1. Spatially, the KEFAs in Central China and South China have reached saturation level of development and have begun to focus on rational land use, with better biodiversity conservation effectiveness. Southwest and Northwest have less development potential and less intensive human interference, so the biodiversity conservation effectiveness is medium. East China and the Northeast have fertile soil and are conducive to reclamation, so the biodiversity conservation effectiveness is poor.
2. In terms of time, the biodiversity conservation effectiveness was poor from 1990 to 2000, and the intensity of land development was the highest in this period, which turned better from 2000 to 2010 and the biodiversity conservation effectiveness was the best in this period, during 2010–2015 was in the middle.
3. The reference can better reflect the differences in the natural environment background of China, and can effectively support the spatial comparison assessment of the biodiversity conservation effectiveness. Based on the results of this study, can provide a scientific basis for the transfer payment policy in China and the implementation of ecological compensation in other countries.
The original contributions presented in the study are included in the article/supplementary material, further inquiries can be directed to the corresponding author.
ZC designed and completed the manuscript. ZL and YZ reviewed and revised the manuscript. GH, KD and CY contributed to data collection. All authors have read and agreed to the published version of the manuscript.
This research was funded by the National Key Research and Development Program of China (Project Nos. 2021YFD1500104-3 and 2016YFC0500204).
The authors declare that the research was conducted in the absence of any commercial or financial relationships that could be construed as a potential conflict of interest.
The handling editor HZ declared a shared affiliation with the authors ZL and GH at the time of review.
All claims expressed in this article are solely those of the authors and do not necessarily represent those of their affiliated organizations, or those of the publisher, the editors and the reviewers. Any product that may be evaluated in this article, or claim that may be made by its manufacturer, is not guaranteed or endorsed by the publisher.
Brooks, T. M., Wright, S. J., and Sheil, D. (2009). Evaluating the success of conservation actions in safeguarding tropical forest biodiversity. Conserv. Biol. 23, 1448–1457. doi: 10.1111/j.1523-1739.2009.01334.x
Chen, Z. Q., Dong, K. K., Zhang, Y. H., Hou, G. L., and Liu, Z. L. (2022). Regional comparative assessment of biodiversity conservation effectiveness in national important ecological function areas. J. Ecol. 42, 5264–5274. doi: 10.5846/stxb202105081205
Dong, K. K., Hou, G. L., Xu, D. D., He, H. L., and Liu, Z. L. (2018). A method to compare the biodiversity conservation effectiveness between regions based on a reference condition. Sustainability 10:3694. doi: 10.3390/su10103694
Feng, C., Cao, M., Wang, W., Wang, H., Liu, F., Zhang, L., et al. (2021). Which management measures lead to better performance of China's protected areas in reducing forest loss? Sci. Total Environ. 764:142895. doi: 10.1016/j.scitotenv.2020.142895
Gantioler, S., Rayment, M., ten Brink, P., McConville, A., Kettunen, M., and Bassi, S. (2014). The costs and socio-economic benefits associated with the Natura 2000 network. Int. J. Sustain. Soc. 6:135. doi: 10.1504/IJSSOC.2014.057894
Gaston, K. J., and Cruz-Piñón, G. (2008). The ecological performance of protected areas. Annu. Rev. Ecol. Evol. Syst. 39, 93–113. doi: 10.1146/annurev.ecolsys.39.110707.173529
Gong, J., Xie, Y., Cao, E., Huang, Q., and Li, H. (2019). Integration of InVEST-habitat quality model with landscape pattern indexes to assess mountain plant biodiversity change: a case study of Bailongjiang watershed in Gansu Province. J. Geogr. Sci. 29, 1193–1210. doi: 10.1007/s11442-019-1653-7
Gray, C. L., Hill, S. L., Newbold, T., Hudson, L. N., Börger, L., Contu, S., et al. (2016). Local biodiversity is higher inside than outside terrestrial protected areas worldwide. Nat. Commun. 7, 1–7. doi: 10.1038/ncomms12306
He, L. H., Liu, H. J., Li, B. L., and Wang, Y. Y. (2014). Design and application practice of ecological environment quality assessment index system for counties in national key ecological function areas. Environ. Prot. 42, 42–45. doi: 10.14026/j.cnki.0253-9705.2014.12.011
Hou, P., Yang, M., Zhai, J., Liu, X., Wan, H., Li, J., et al. (2017). On nature reserves and the construction of national ecological security pattern. Geogr. Res. 36, 420–428. doi: 10.11821/dlyj201703002
Li, Y. Y., Tan, M. H., and Zhang, H. Q. (2018). The impact of changing spatial patterns of cropland on grain production in China. China Eng. Sci. 20, 90–95. doi: 10.15302/J-SSCAE-2018.05.014
Li, X. Y., Zhao, G. M., and Li, B. Y. (2010). Analysis of land resource change trends in Northeast China. Soil Water Conserv. Res. 17, 68–74.
Liu, F. T., and Xu, E. Q. (2020). Comparison of spatial and temporal evolution of habitat quality between Xinjiang corps and non-corps based on land use. J. Appl. Ecol. 31, 2341–2351. doi: 10.13287/j.1001-9332.202007.014
Liu, J. Y., Zhang, Z. X., Zhuang, D. F., Wang, Y. M., Zhou, W. C., Zhang, S. W., et al. (2003). Spatial and temporal characteristics of land use change in China in the 1990s and its causes. Geogr. Res. 01, 1–12. doi: 10.11821/yj2003010001
Ren, G., Young, S. S., Wang, L., Wang, W., Long, Y., Wu, R., et al. (2015). Effectiveness of China's national forest protection program and nature reserves. Conserv. Biol. 29, 1368–1377. doi: 10.1111/cobi.12561
Shao, Q. Q., Liu, S. C., Ning, J., Liu, G. B., Yang, F., Zhang, X. Y., et al. (2022). Remote sensing assessment of ecological benefits of major ecological projects in China from 2000 to 2019. J. Geogr. 77, 2133–2153. doi: 10.11821/dlxb202209001
Shui, Y. P., Lu, H. T., Wang, H. F., Yan, Y., and Wu, G. (2018). Habitat quality assessment of the Lhasa River basin based on land cover and NDVI changes. J. Ecol. 38, 8946–8954.
Sun, X., Jiang, Z., Liu, F., and Zhang, D. (2019). Monitoring spatio-temporal dynamics of habitat quality in Nansihu Lake basin, eastern China, from 1980 to 2015. Ecol. Indic. 102, 716–723. doi: 10.1016/j.ecolind.2019.03.041
Tang, F., Fu, M., Wang, L., and Zhang, P. (2020). Land-use change in Changli County, China: predicting its spatio-temporal evolution in habitat quality. Ecol. Indic. 117:106719. doi: 10.1016/j.ecolind.2020.106719
Wang, H., Tang, L., Qiu, Q., and Chen, H. (2020). Assessing the impacts of urban expansion on habitat quality by combining the concepts of land use, landscape, and habitat in two urban agglomerations in China. Sustainability 12:4346. doi: 10.3390/su12114346
Xu, D. D., Hou, G. L., Dong, K. K., He, H. L., and Liu, Z. L. (2018). Regional comparative assessment of the effectiveness of wetland biodiversity conservation based on reference. Wetland Sci. 16, 120–129.
Xu, W. H., Xiao, Y., Zhang, J. J., Yang, W., Zhang, L., Hull, V., et al. (2017). Strengthening protected areas for biodiversity and ecosystem services in China. PNAS 114, 1601–1606. doi: 10.1073/pnas.1620503114
Zhao, G. S., Liu, J. Y., Kuang, W. H., and Ouyang, Z. Y. (2014). Land use change perturbation in priority areas for biodiversity conservation in China from 1990 to 2010. J. Geogr. 69, 1640–1650. doi: 10.11821/dlxb201411005
Zheng, Y. M., Zhang, H. Y., Niu, Z. G., and Gong, P. (2012). Preliminary assessment of the conservation effectiveness of national wetland nature reserves in China. Sci. Bull. 57, 207–230. doi: 10.1007/s11434-011-4942-9
Zhu, C., Zhang, X., Zhou, M., He, S., Gan, M., Yang, L., et al. (2020). Impacts of urbanization and landscape pattern on habitat quality using OLS and GWR models in Hangzhou, China. Ecol. Indic. 117:106654. doi: 10.1016/j.ecolind.2020.106654
The following abbreviations are used in this manuscript:
XXAL - Xiaoxing’an Ling ecological function area
SJ - Sanjiang Plain Wetland ecological function area
SN - The Songnen Plain ecological function area
LH - Liaohe Delta Wetland ecological function area
HH - Yellow River Delta Wetland ecological function area
SB - Coastal SuBei Delta Wetland ecological function area
ZM - ZheMin mountains ecological function area
WY-DY - WuYI-DaiYun mountains ecological function area
QL-DB - QinLing-DaBa mountains ecological function area
WL - WuLing mountains ecological function area
DY - DaYao mountains ecological function area
HN - Central HaiNan ecological function area
DN - Southern Yunnan ecological function area
WL-AL - WuLiang-AiLao mountains ecological function area
DX - West YunNan mountains ecological function area
DXB - Northwest YunNan Plateau ecological function area
M-QL-L - Min -Qionglai-Liang mountains ecological function area
ZDN - Southeast Tibet ecological function area
ZMLMF - Mount Everest ecological function area
ZXB - Qiangtang Plateau, Northwest Tibet ecological function area
AEJ - Southern foothills of altun mountain ecological function area
XE-H-Y - West Ordos-Helan-Yin Mountains ecological function area
ZD - Eastern Junggar Basin ecological function area
ZX - Western Junggar Basin ecological function area
Keywords: biodiversity, conservation effectiveness, spatial comparison, reference, transfer payment
Citation: Chen Z, Liu Z, Hou G, Dong K, Zhang Y and Yang C (2022) Period-oriented spatial comparative evaluation of biodiversity conservation effectiveness in China. Front. Ecol. Evol. 10:1031008. doi: 10.3389/fevo.2022.1031008
Edited by:
Jun Yang, Northeastern University, ChinaReviewed by:
Hao Zhang, Institute of Mountain Hazards and Environment (CAS), ChinaCopyright © 2022 Chen, Liu, Hou, Dong, Zhang and Yang. This is an open-access article distributed under the terms of the Creative Commons Attribution License (CC BY). The use, distribution or reproduction in other forums is permitted, provided the original author(s) and the copyright owner(s) are credited and that the original publication in this journal is cited, in accordance with accepted academic practice. No use, distribution or reproduction is permitted which does not comply with these terms.
*Correspondence: Yanhong Zhang, Z2lzd29ya0AxNjMuY29t
Disclaimer: All claims expressed in this article are solely those of the authors and do not necessarily represent those of their affiliated organizations, or those of the publisher, the editors and the reviewers. Any product that may be evaluated in this article or claim that may be made by its manufacturer is not guaranteed or endorsed by the publisher.
Research integrity at Frontiers
Learn more about the work of our research integrity team to safeguard the quality of each article we publish.