 Zhiyu Shi
 Yating Wang
 Qing Zhao
 Changming Zhu
- School of Geography, Geomatics, and Planning, Jiangsu Normal University, Xuzhou, Jiangsu, China
The Ecological Environment Quality (EEQ) is an important foundation for the sustainable development of society and economy. To assess the spatiotemporal changes of the EEQ in the Yangtze River Delta Urban Agglomeration (YRDUA), we selected MODIS images of 2001, 2006, 2011, 2016 and 2021 to construct the Modified Remote Sensing Ecological Index (MRSEI) based on Google Earth Engine (GEE) platform and Principal Component Analysis (PCA). Then, we evaluated the spatiotemporal changes and spatial autocorrelation of the EEQ in the YRDUA. The results showed that: the EEQ of the YRDUA was improved from 2001 to 2011, deteriorated from 2011 to 2016, and improved from 2016 to 2021. The overall EEQ of the YRDUA was at moderate or excellent level, and the EEQ in the south was better than that in the north. The EEQ of the southern cities in the study area was better and more stable, while that of the northern cities was relatively poor and changes relatively drastic. The EEQ of the YRDUA was mainly unchanged and improved from 2001 to 2021. The regions with improved EEQ were mainly distributed in the north and west, while those with deteriorated EEQ were mainly distributed in the east and south. The EEQ of the YRDUA was improved gradually from 2001 to 2006, and relatively stable from 2006 to 2011. From 2011 to 2016, the changes were drastic and the EEQ deteriorated greatly; while from 2016 to 2021, the EEQ of the YRDUA was improved, and the area of ecological deterioration was significantly reduced. From 2001 to 2021, the Globalmoran’s I value ranged from 0.838 ~ 0.918. In the past 20 years, NS area in the YRDUA accounted for the highest proportion, while the HH aggregation was mainly distributed in the southern part of the YRDUA, while LL aggregation was mainly distributed in the northern part, indicated that the EEQ in the southern part was better than that in the northern part. This study provides a promising approach to assess the spatiotemporal changes of EEQ in urban areas, which is crucial to formulate the ecosystem protection policies and sustainable development strategies of YRDUA.
Introduction
Ecological Environment Quality (EEQ) is the evaluation of comprehensive characteristics of ecosystem elements, structure and function, it can reflect the strengths and weaknesses of regional ecological environment. At present, urban agglomerations have become the core engine of rapid social and economic development in China. In the process of urbanization, how to coordinate urban expansion with environmental protection has become an important strategic issue (Yao et al., 2019). On the one hand, high-intensity urbanization will inevitably interfere with or even destroy the regional ecological environment; on the other hand, ecological degradation can in turn constrain urbanization and sustainable development (Wang et al., 2014). The Yangtze River Delta Urban Agglomeration (YRDUA) has been the most active and open region in China. Under the background of the integrated development of the YRDUA, the regional ecological environment is facing more and more severe pressure. Therefore, in order to improve the EEQ of the YRDUA and realize the coordinated development of economy and environment, it is increasingly important to evaluate and analyze the EEQ of the YRDUA.
With the development of remote sensing technology, regional scale comprehensive eco-environmental assessment of multiple environmental factors based on multi-source remote sensing image data provides efficient monitoring and analysis means for EEQ research (Xu et al., 2019; Wu et al., 2022). Xu (2013) proposed to acquire four evaluation indexes, NDVI, WET, LST and NDBSI, based on remote sensing images, and combined with Principal Component Analysis (PCA) to construct Remote Sensing Ecological Index (RSEI) to quantitatively evaluate the regional ecological environment status. RSEI can not only realize the objective quantitative evaluation of the regional ecological environment, but also carry out the spatiotemporal analysis and visual display of the evolution of the ecological environment. It has been widely used in the regional EEQ evaluation (Shan et al., 2019; Hang et al., 2020; Liao and Jiang, 2020). The RSEI-based EEQ assessment method mainly focuses on near-surface factors such as vegetation, humidity, heat and dryness. However, the environmental conditions in different regions are different, so the applicability and accuracy of RSEI have certain defects (Xu et al., 2021; Geng et al., 2022). Ecosystem is a complex and diverse system, especially in large urban agglomerations with high level of industrialization and urbanization, there are many factors influencing the internal EEQ, among which air quality has a significant impact on the EEQ of urban agglomerations. Liu et al. (2022) constructed the Modified Remote Sensing Ecological Index (MRSEI) based on greenness, humidity, dryness, heat, and air quality indicators combined with PCA to evaluate the EEQ of Beijing. The results showed that MRSEI was more suitable for the evaluation of urban ecological quality, and believed that air quality indicators were very important for the monitoring and evaluation of urban ecological environment.
In recent years, the air quality problem in China has become more and more serious, especially in the Yangtze River Delta, Pearl River Delta and Beijing-Tianjin-Hebei region with better economic development (Zhang and Gong, 2018). High concentration of PM2.5 (Particulate matter with aerodynamic diameter ≤ 2.5 μm) is the main cause of air pollution in the Yangtze River Delta region (Zhou et al., 2019; Huang et al., 2020). Aerosol Optical Depth (AOD) is an important index to evaluate the degree of air pollution, and can be used to study the spatial distribution of determine the PM2.5 concentration in different regions and around the world (Van Donkelaar et al., 2015; Peng et al., 2016; Elahi et al., 2022a). At present, AOD products based on moderate Resolution Imaging Spectroradiometer (MODIS) have been verified globally, and can well invert the spatial and temporal distribution and concentration change of PM2.5 (Emili et al., 2010; Lin et al., 2015). Google Earth Engine (GEE) is a platform which can realize online analysis and visualization of geographic information big data, its appearance greatly improves the processing efficiency of remote sensing images, and has shown obvious advantages in the application research of remote sensing in a large range of long time series (Gorelick et al., 2017; Parastatidis et al., 2017). Compared with traditional remote sensing image processing software, this platform can realize large-scale and long-term geographic data processing and analysis more quickly and effectively (Kumar and Mutanga, 2018).
Therefore, based on the GEE platform, this paper used the PCA to couple the greenness, humidity, heat, dryness and air quality, so as to construct the MRSEI to evaluate and analyze the EEQ of the YRDUA, the research process of this paper is shown in Figure 1, see Table 1 for acronyms. It aims to provide scientific decision-making basis for improving EEQ, realizing green and sustainable development, and making formulating reasonable measures of ecological environment protection and construction in Yangtze River Delta region.
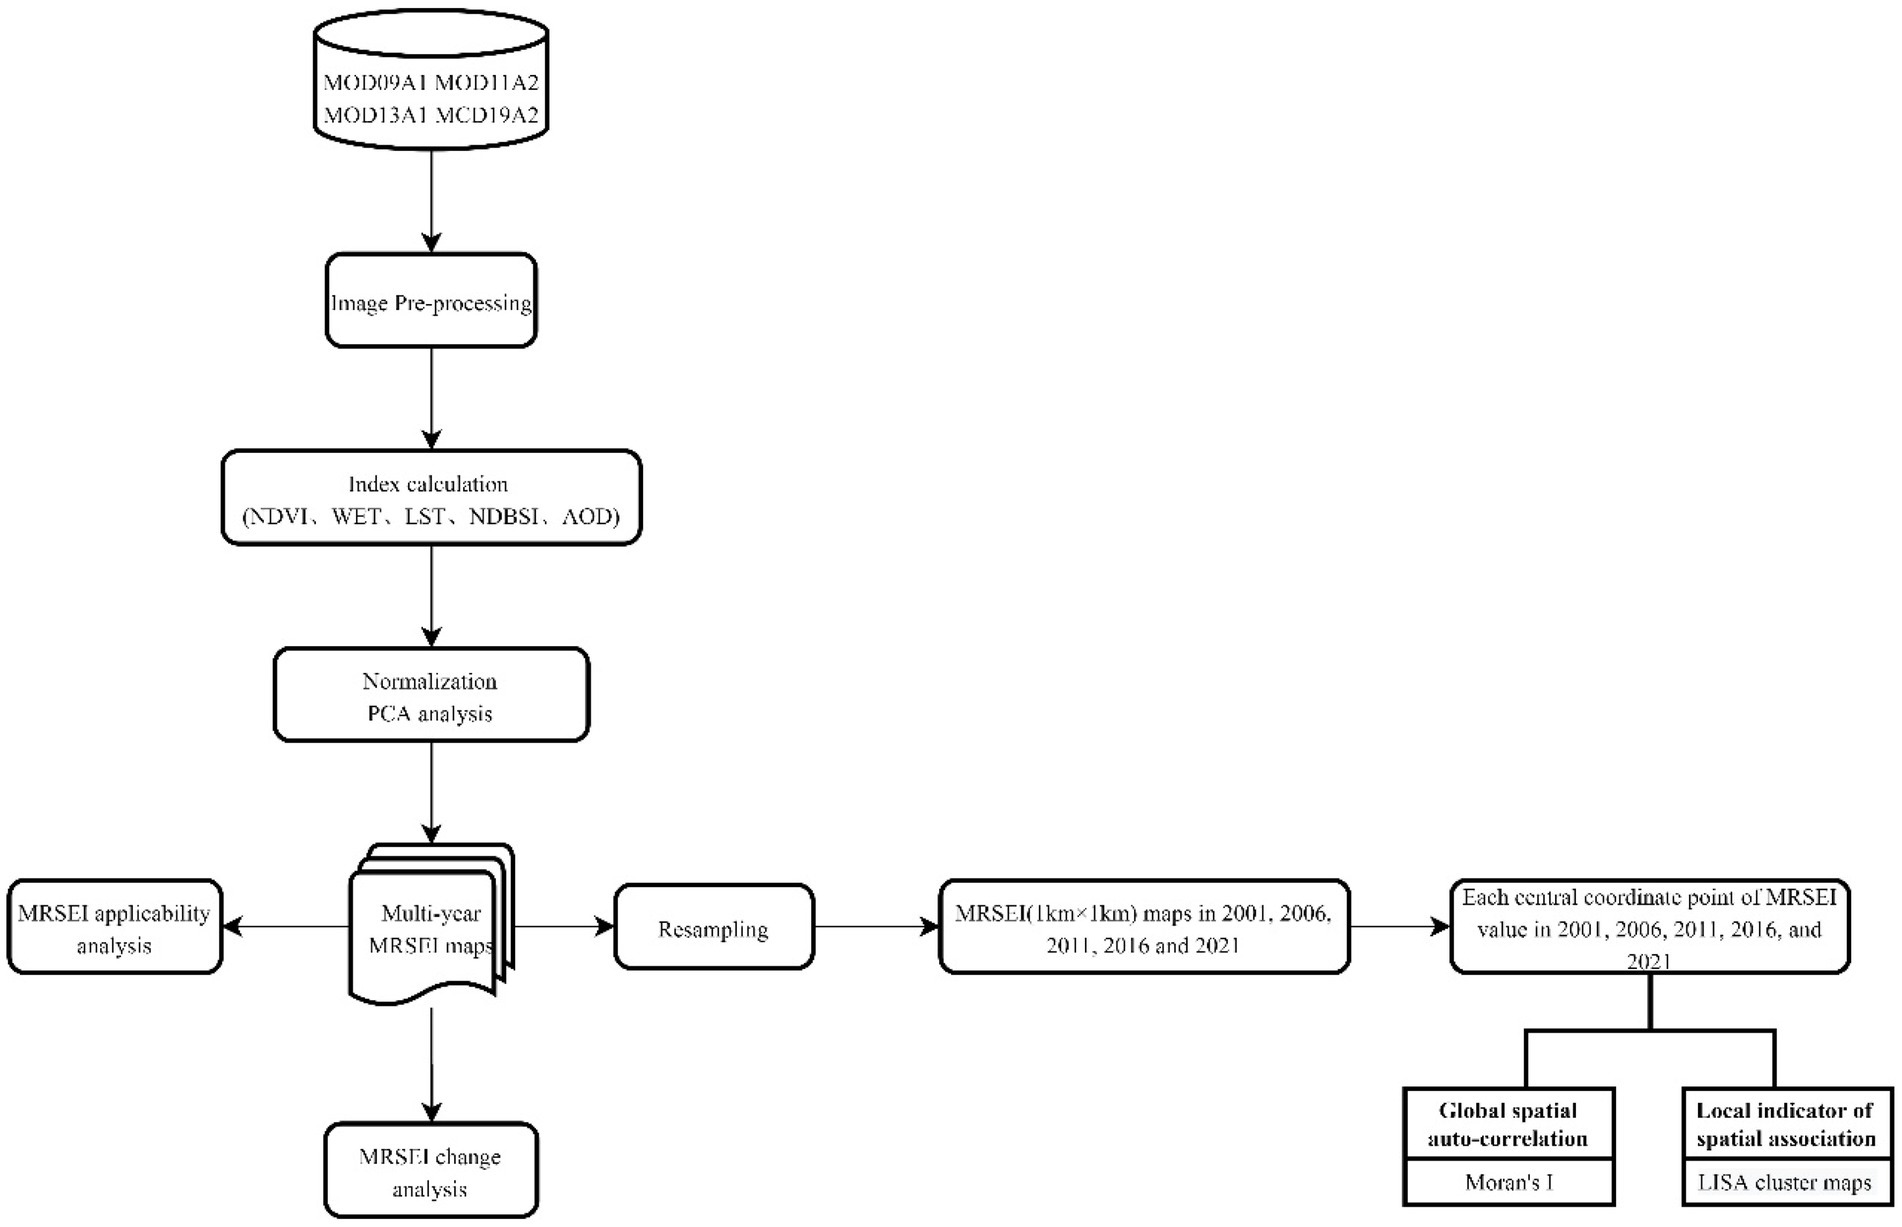
Figure 1. Workflow.
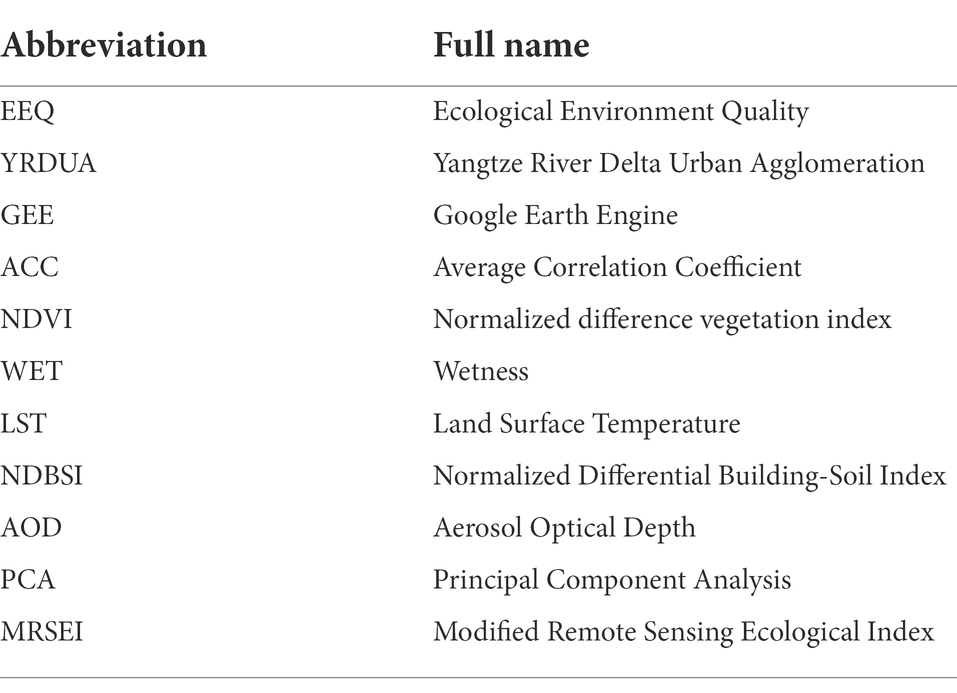
Table 1. List of acronyms.
Materials and methods
Study area
The Yangtze River Delta is located in the lower reaches of the Yangtze River, adjacent to the Yellow Sea and the East China Sea in the East. The Yangtze River Delta belongs to the subtropical monsoon climate, with an average annual precipitation of 804 ~ 2057 mm and an average annual temperature of 9.3 ~ 17.3 ° C, the terrain of this area is mainly plain, and the overall terrain is flat (Wang et al., 2021). The YRDUA is one of the six largest urban agglomerations in the world, with a huge economic aggregate and great development potential, but rapid urbanization has brought great pressure on the quality of ecological environment (Hou et al., 2021). The YRDUA spans four provinces and cities: Shanghai, Jiangsu, Zhejiang, and Anhui. Specifically, there are 26 cities (Figure 2). The total area is about 21,700 km2, accounting for about 2.3% of the national area. The YRDUA is one of the regions with the most active economic development, the highest urbanization, and the largest population absorption in China (Zhou et al., 2018; Wang et al., 2021).
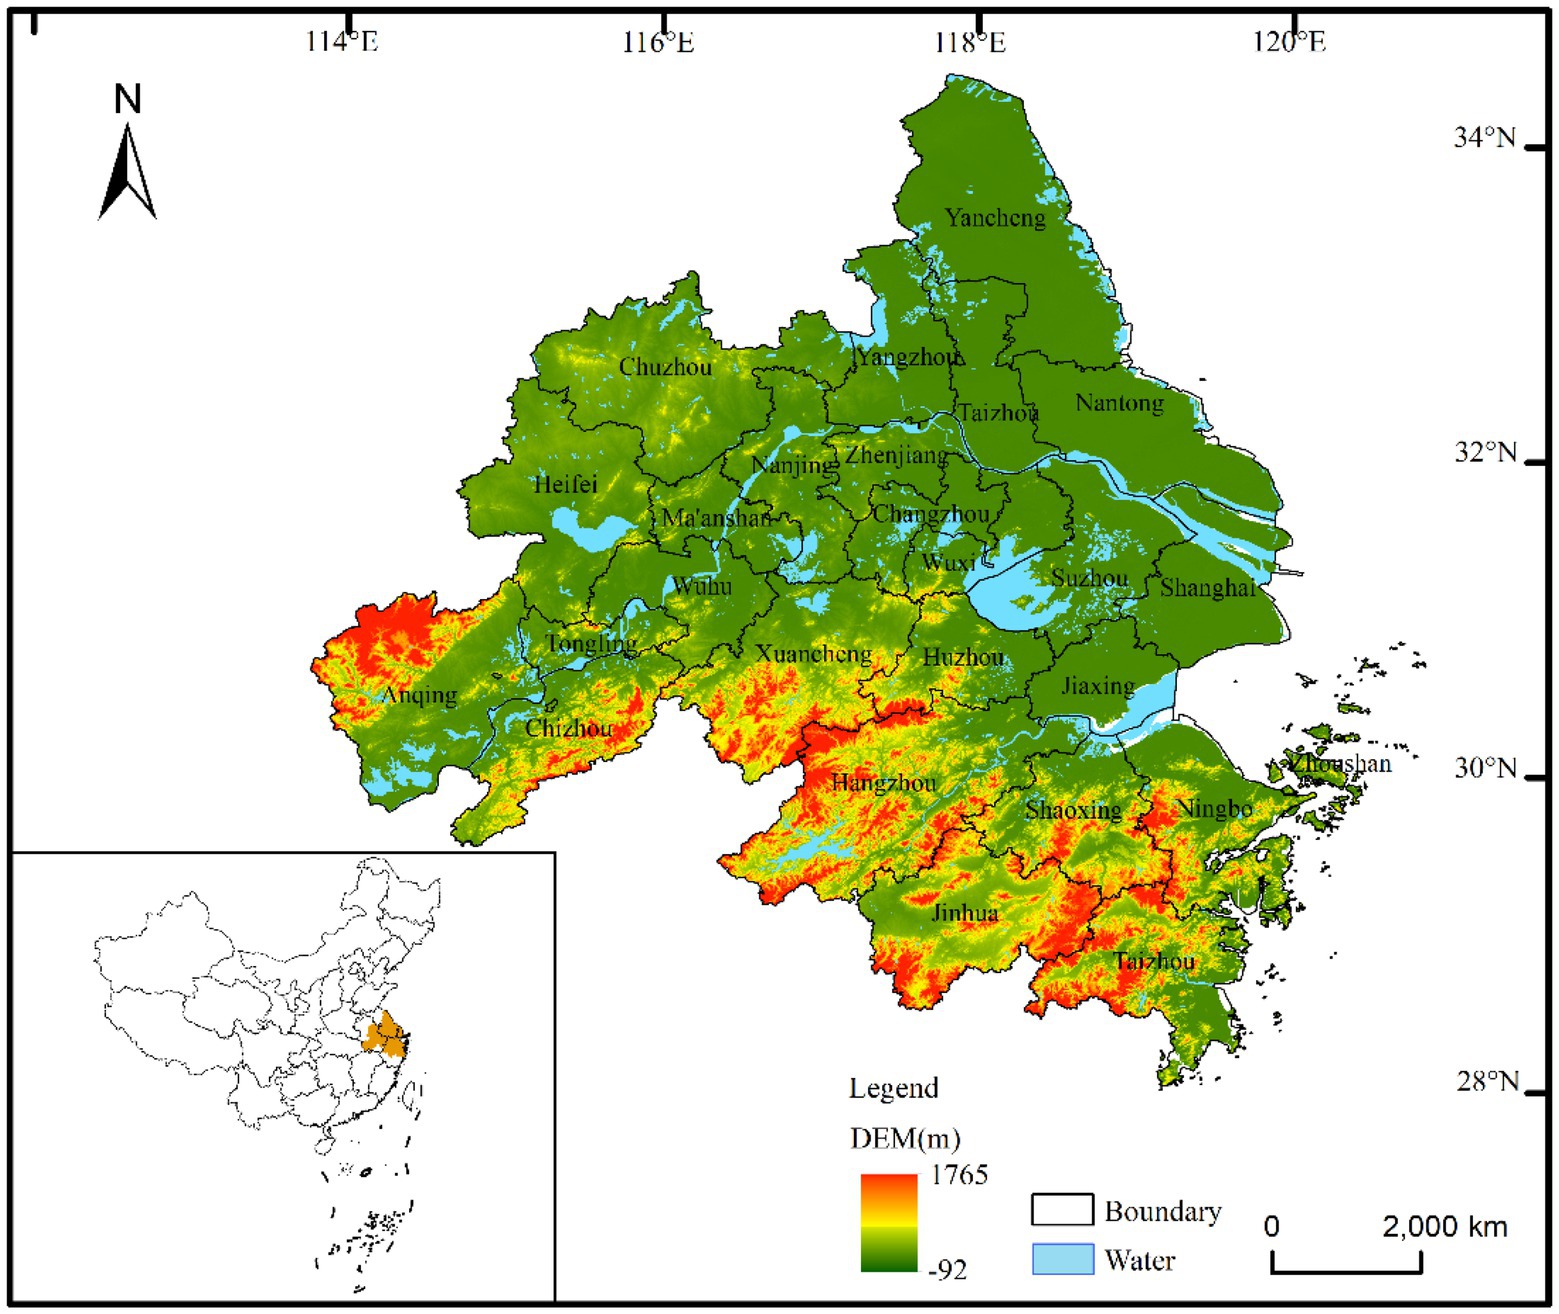
Figure 2. The location of the Yangtze River Delta Urban Agglomeration.
Data sources and processing
The MRSEI constructed in this study consists of five ecological indexes, namely greenness, wetness, heat, dryness, and air quality. MODIS data has been widely used in research on ecological environment due to moderate resolution, high image quality, and short monitoring period. Due to the large area and cloud cover of remote sensing images in the study area, MODIS data products from 2001 to 2021 were used to calculate all indicators of MRSEI. Specific data are shown in Table 2.
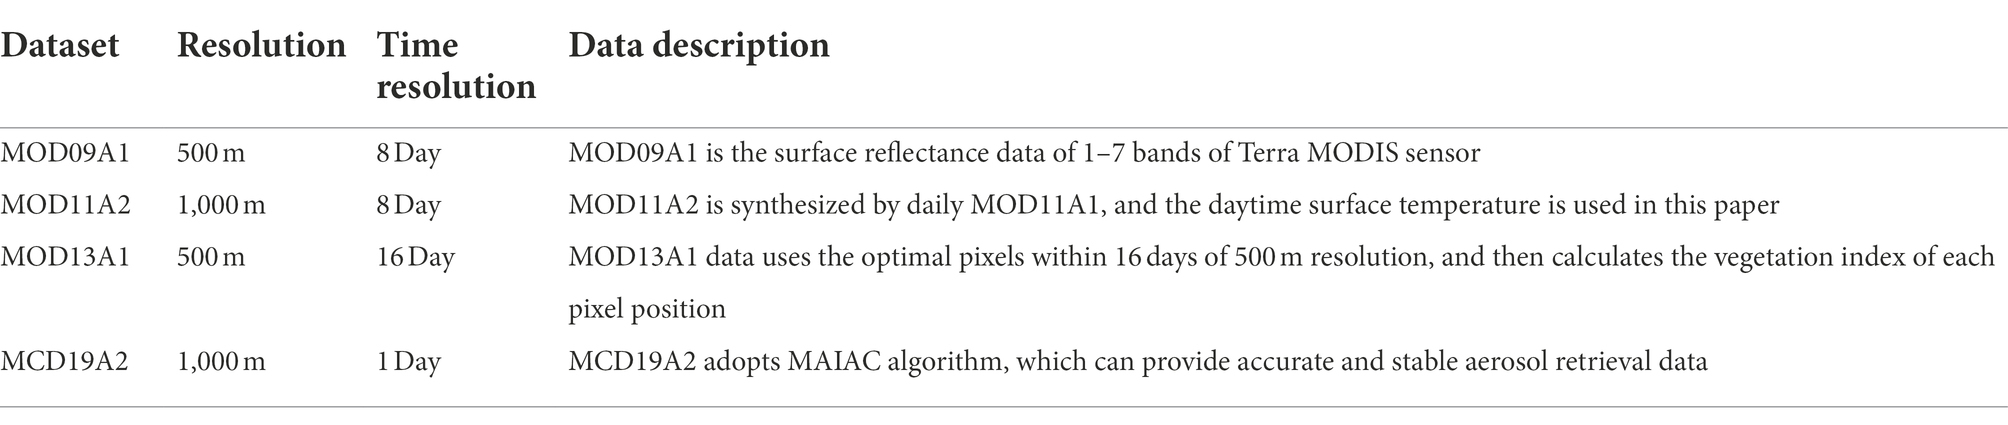
Table 2. Data source.
Based on the GEE platform, this study screened the high-quality images with few clouds from May to October on 2001–2021 online through JavaScript API. Then the remote sensing image is preprocessed, conducted cloud removal and water mask, and each type of remote sensing data was multiplied by the corresponding conversion coefficient. In addition, all types of MODIS data products were unified resampling to 500 m × 500 m.
Methods
Indicators of the MRSEI
The MRSEI combines five indicators (Greenness, Wetness, Heat, Dryness, and Air quality), and its expression is as follows:
In the above equation, NDVI, WET, LST, NDBSI, and AOD represent Greenness, Wetness, Dryness, Heat, and Air quality, respectively.
Greenness
Greenness represents the cover and growth of surface vegetation, and it is an important indicator to measure the regional EEQ. Normalized Vegetation Index (NDVI) can detect the state and coverage of surface vegetation (Goward et al., 2002). Therefore, NDVI in growing season is used to represent greenness in this work, which can be calculated with below equation:
Wetness
Ecological factors such as brightness, humidity and greenness can be acquired from tasseled cap transformation (Behling et al., 2015). Wetness (WET) is an important index to reflect the humidity status of vegetation, soil and water (An et al., 2022). In this paper, WET is acquired from tasseled cap transformation based on MOD09A1, and the calculation equation is as follows:
Heat
The Land Surface Temperature (LST) was used to represent the heat index. The LST was obtained from the daily land surface temperature (DLST) of MOD11A2 dataset, and the gray value was converted to Celsius temperature. The conversion formula is:
Dryness
In this study, the index-based built-up index (IBI; Xu, 2008) and the Soil Index (SI; Rikimaru et al., 2002) were used to represent the dryness index. The dryness index can be expressed by the average value of SI and IBI, which is called “NDBSI” (Hu and Xu, 2018). The calculation formula is:
Air quality
Air quality is an important component of ecological environment. Relevant research shows that AOD can accurately reflect the air quality in a certain area (Alfoldy et al., 2007; Paciorek et al., 2008). In this study, MCD19A2 aerosol product was used to represent the air quality. MCD19A2 is inverted by the Multi-Angle Implementation of Atmospheric Correction (MAIAC) algorithm, which significantly improves the data coverages of dense vegetation area and bright surface, and the inversion accuracy is improved by storing surface spectrum and thermal characteristics through fixed grid (Ding et al., 2020). Based on the AOD data acquired from AErosol RObotic NETwork (AERONET), it is found that MAIAC Algorithm is more accurate than the Dark Target (DT) and Deep Blue Algorithm (DB) algorithms in mainland China (Liu et al., 2019; Zhang et al., 2019).
Where, ρ1-7 represents the surface reflectivity of the 1–7 band of the Terra MODIS products, b1 indicates the LST band data in the MOD11A2 product.
Calculation of MRSEI
Since the data dimensions were not unified, the value range of the remote sensing ecological index component constructed by the above formula equation was different. Therefore, each index is normalized to transform it to 0–1. The specific equation is as follows:
Where, NI represents the normalization result of each index; I represents the value of original ecological index; Imin and Imax represent the minimum value and maximum value of the original ecological index in the calculation year, respectively.
It is necessary to assign different weights to each index to construct a single ecological environment index to analyze the EEQ. PCA is a conversion method that removes redundant information between different bands and compresses multi-band image information into several mutually independent bands. PCA can automatically and objectively determine the corresponding weight according to the contribution rates of different factors to the principal component. The formula is showed as:
Where the PCA1 is the first principal component result of five normalized indexes obtained by PCA, and its positive and negative values are transposed, and MRSEI0 is the transposed result.
The PCA1 can better reflect the regional EEQ and shows clear ecological significance, it is not need to pay special attention to the proportion of PCA1 in RSEI application if it can correctly represent the ecological information (Xu and Deng, 2022). PCA was performed on the normalized 5 indexes, and MRESI was constructed by PCA1 and normalized so that its value range is [0,1]. The higher the MRSEI value, the better the EEQ. The expression is as follows:
Where the maximum and minimum values of MRSEI0 are expressed by of RSEI0-max and RSEI0-minrespectively.
Average correlation coefficient
The ACC was employed to verify the accuracy of comprehensive expression of EEQ in the study area based on the MRSEI, so as to test the applicability of MRSEI. If the average correlation coefficient between MRSEI and each index was greater than that between each index, it indicated that MRSEI can describe the EEQ of the study area more completely and accurately than other indexes. The calculation equation of the average correlation coefficient is as follows:
In the equation, is the average correlation degree; p, q, r, and s represent the indexes for correlation analysis; n represents the number of indexes for correlation analysis; and Cp, Cq, Cr, and Cs is the correlation coefficient among each index.
Spatial autocorrelation analysis
Spatial autocorrelation analysis can reflect whether the distribution of spatial variables is related to neighboring variables, and it can be classified into the global spatial autocorrelation and the local spatial autocorrelation (Jing et al., 2020). The global spatial autocorrelation studies the spatial distribution characteristics of variables in the whole region, which is expressed by global Moran’s I index and calculated by the following equation:
In the equation, I is the Global Moran’s I index with the threshold of [−1, 1]. I < 0 means negative correlation, I = 0 means no correlation, and I > 0 means positive correlation (Wan et al., 2011); wij is the spatial weight, xi and xj represent the EEQ value of position i and j, respectively. S2 is the sum of the squares of deviations of the variable x.
The local spatial autocorrelation can reflect the spatial aggregation degree between the EEQ of each grid unit in the study area (Anselin, 1995). It is expressed by Local Moran’s I index (LISA), and the calculation formula is:
Where, Ii is the Local Moran’s I index.
Global spatial autocorrelation and local spatial autocorrelation were analyzed based on GeoDa software. To ensure the integrity of data distribution and the accuracy of quantitative evaluation, a 1 km × 1 km grid was adopted to resample the images according to the spatial pattern characteristics of the study area. Based on the resampling points obtained in each research year above, a spatial autocorrelation analysis was performed on the MRSEI of the YRDUA.
Results and analysis
Applicability of MRSEI
As shown in Table 3, the contribution rates of the characteristic values of PC1 are all over 56%, concentrating most of the information of the five indexes, indicating that MRSEI can better represent the local eco-environmental quality. In PC1, the contribution rates of NDVI and Wet are positive, the contribution rates of LST, NDBSI, and AOD are negative, which was consistent with the actual situation. To test the applicability of MRSEI, the correlation coefficients among MRSEI, NDVI, WET, LST, NDBSI and AOD in the same period were calculated (Table 4), and applicability of the model was tested through the Average correlation coefficient(ACC). In the five research years, the averaged value of correlation of MRSEI was the largest, ranged from 0.3793 to 0.6134; in addition, its average correlation was also the largest (0.4765), which was higher than that of NDVI, WET, LST, NDBSI, and AOD by 32.74, 40.50, 27.43, 14.36, and 65.44%, respectively. This indicated that MRSEI has integrated most information of all indexes and was more representative than any single index, so it can better represent the EEQ of the study area completely and comprehensively.
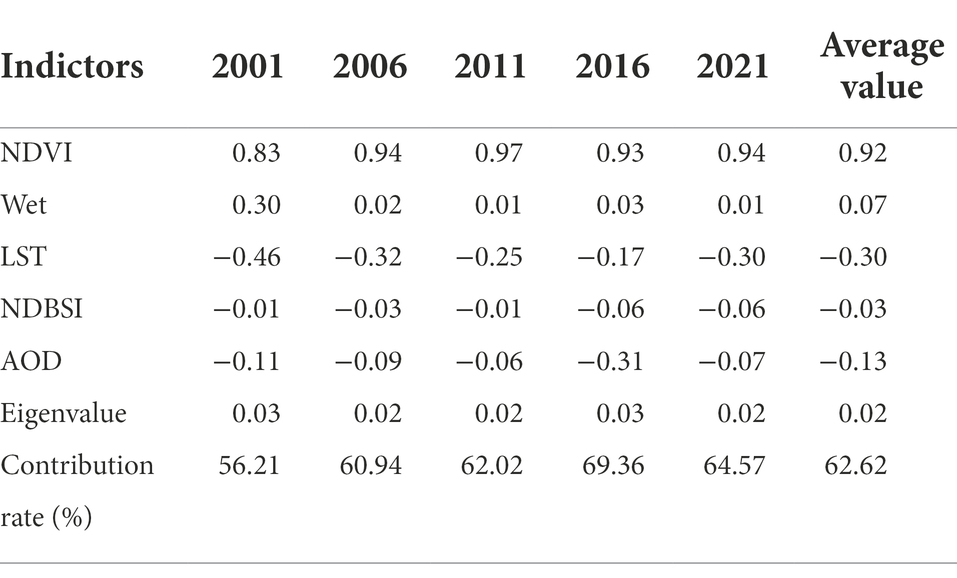
Table 3. Results of the first principal component analysis.
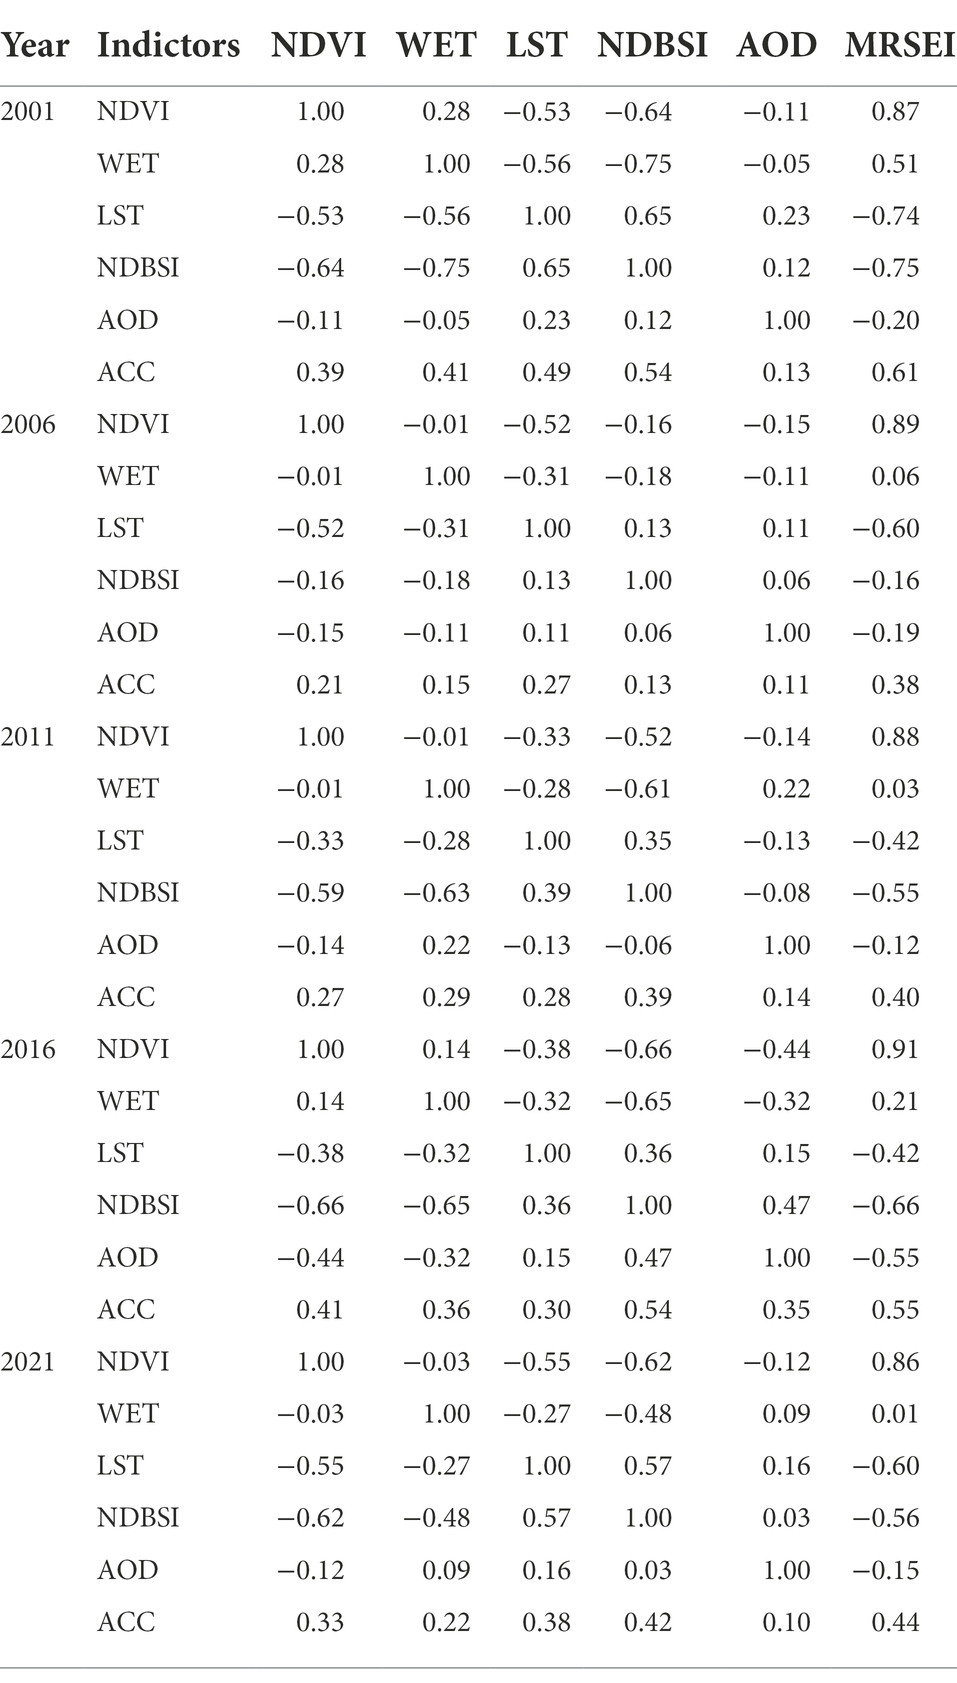
Table 4. Correlation matrix of indexes.
Assessment on EEQ in the YRDUA
The distribution of MRSEI values in the YRDUA for 5 years from 2001 to 2021 is statistically presented in Figure 3. The statistical results showed that some MRSEI values are distributed in the Excellent level (0.8–1) in the five research years. MRSEI values are all greater than 0.4 in the lower quartile, and the MRSEI values are all greater than 0.6 in the upper quartile. In addition, the changes of EEQ the YRDUA showed a fluctuating trend of “rise → decline → rise “. The average value of MRSEI in the study area increased continuously from 0.59 in 2001 to 0.62 in 2011. It then decreased to 0.60 in 2016 and increased again in 2021, with MRSEI rose to 0.67, which was the highest among the five research years. The results showed that the overall EEQ of the YRDUA maintained at the moderate and excellent level, which was improved from 2001 to 2011, decreased from 2011 to 2016, and then improved from 2016 to 2021, during which period the improvement is larger.
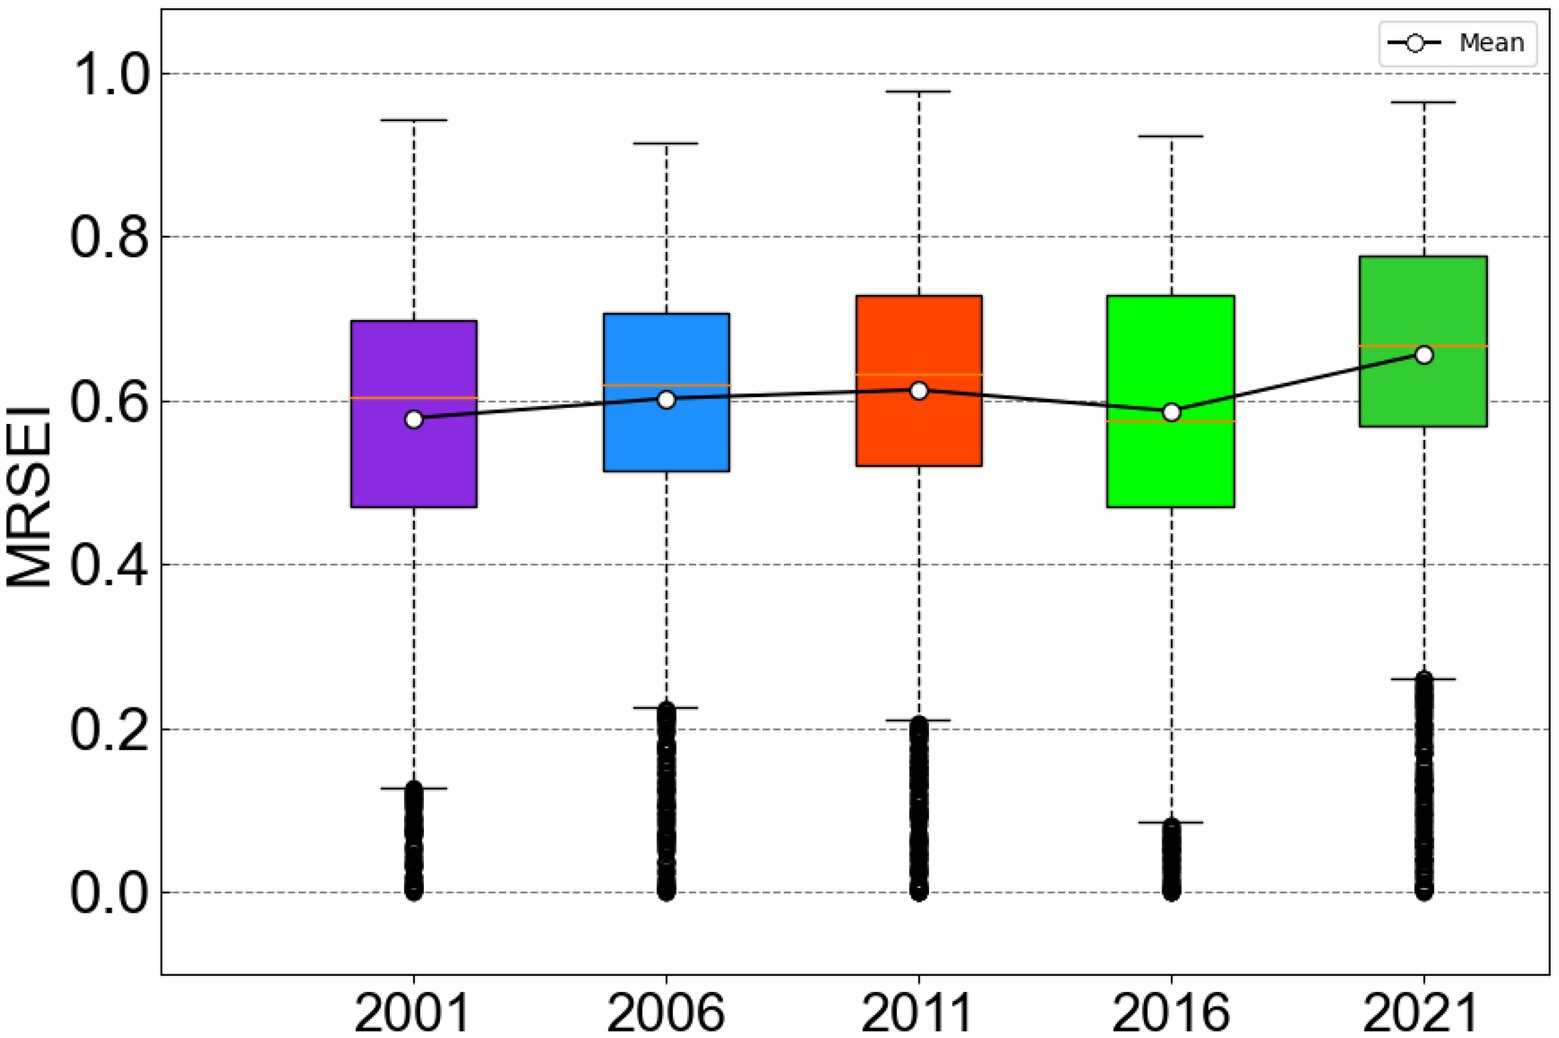
Figure 3. MRSEI Data Box diagram of study area from 2001 to 2021.
According to the distribution diagrams of MRSEI in 2001, 2006, 2011, 2016, and 2021, the area and proportion of EEQ levels (Bad, poor, moderate, good, and excellent) in each year were calculated (Figure 4). Generally, the EEQ in the YRDUA showed an improvement trend from 2001 to 2011. During this period, the proportions of areas with good level increased from 43.77 to 47.21%, while that of the areas with moderate level increased first and then decreased. The areas with excellent, poor, and bad level decreased first and then increased, and the ecological environment deteriorated from 2011 to 2016. The areas with moderate and poor level increased, while those with good level decreased significantly. The area ratio decreased from 47.21 to 32.36%, and the ecological environment improved significantly from 2016 to 2021. The areas with excellent and good level in 2021 increased significantly compared with that in 2016, and the proportions in these 2 years were the highest among the five research years, accounting for 48.37 and 21.41% of the total area, respectively. It showed that the EEQ in most areas of the YRDUA were greatly improved in 2021.
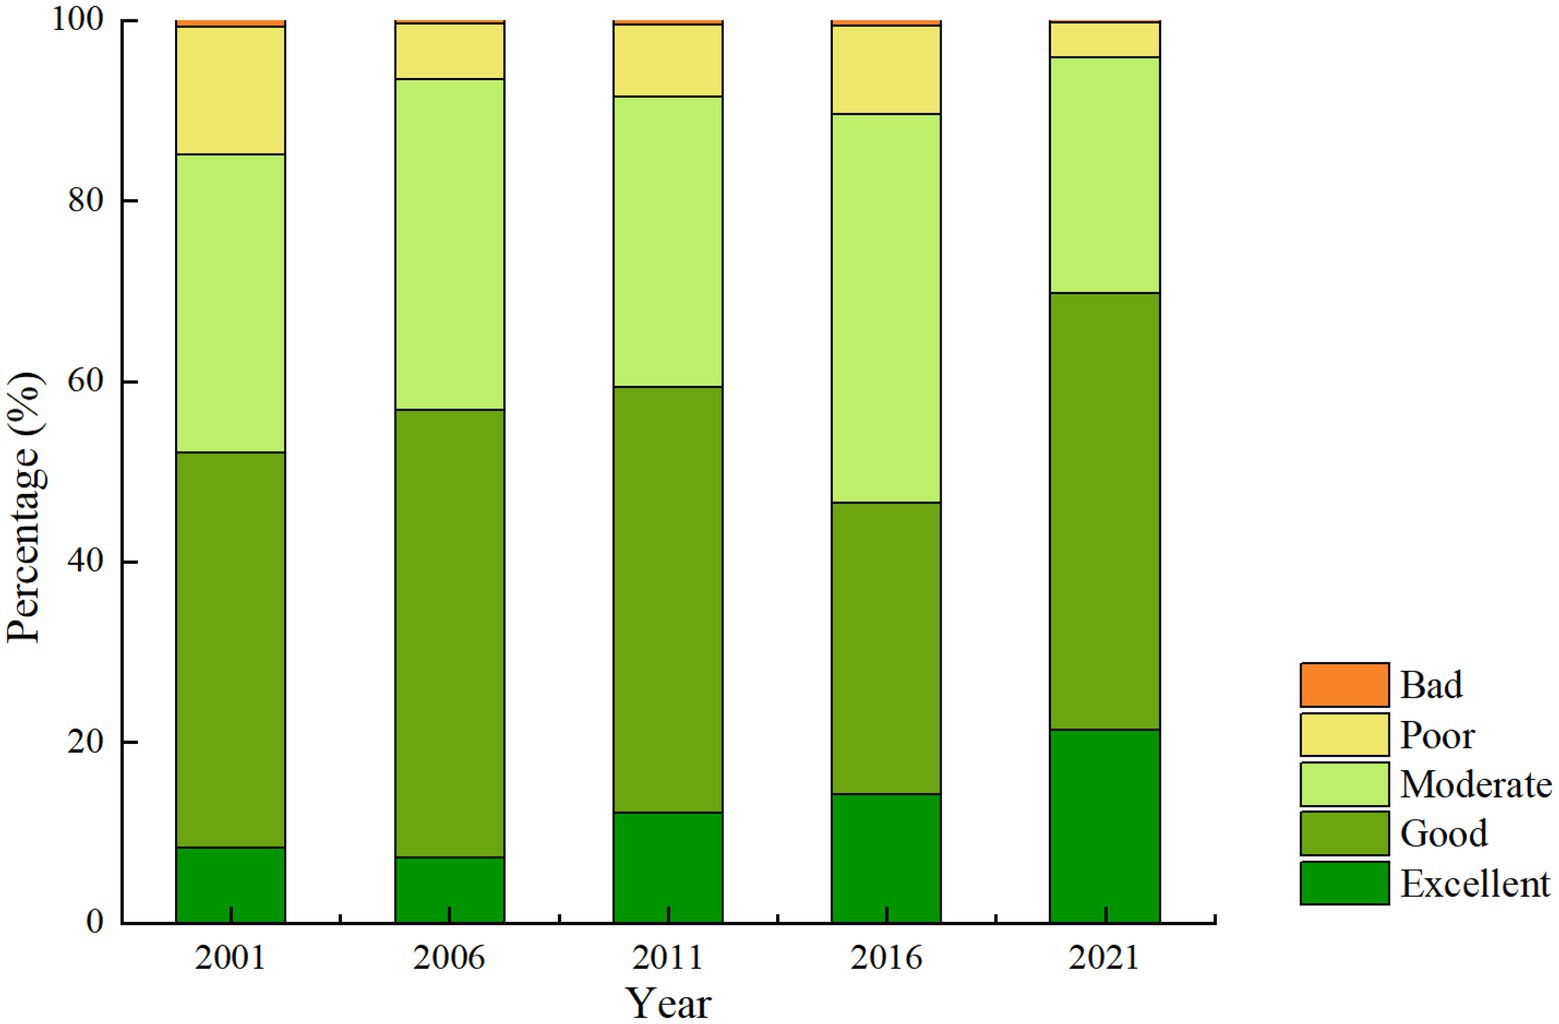
Figure 4. Area distribution of ecological environment quality levels in study area From 2001 to 2021.
The temporal and spatial distributions of MRSEI in the YRDUA in 2001, 2006, 2011, 2016, and 2021 were analyzed, and the average MRSEI was calculated (Figure 5). The MRSEI was divided into five levels: bad (0.0–0.2), poor (0.2–0.4), moderate (0.4–0.6), good (0.6–0.8), and excellent (0.8–1.0). The MRESI distribution of the YRDUA presents obvious spatial heterogeneity. Overall, the EEQ of the southern part of the YRDUA was better than that of the northern part. The regions with good and excellent EEQ were mostly distributed in the southern part with a high altitude, low human activity intensity, high forest coverage rate, and low urbanization. The regions with moderate and poor EEQ were mainly concentrated in the northern part and the two sides of the Yangtze River, mostly in urban built-up areas, especially Hefei and Shanghai, these regions were featured with high human activity intensity, high urbanization, and low forest coverage rate. In addition, the EEQ of the northern part in the YRDUA has changed dramatically in the past 20 years, and the low MRSEI area gradually moved to the downstream with time. From 2001 to 2011, there was a large area with improved EEQ, mainly in Hefei and Chuzhou in the northwest of the study area. From 2011 to 2016, the EEQ deteriorated in a large area, mainly in Yang Zhou, Taizhou, Yancheng and Nantong in the northeast of the study area. From 2016 to 2021, the EEQ of the study area improved in a large area. The low-value MRSEI area in the north decreased significantly and mainly distributed in the built-up areas of each town.
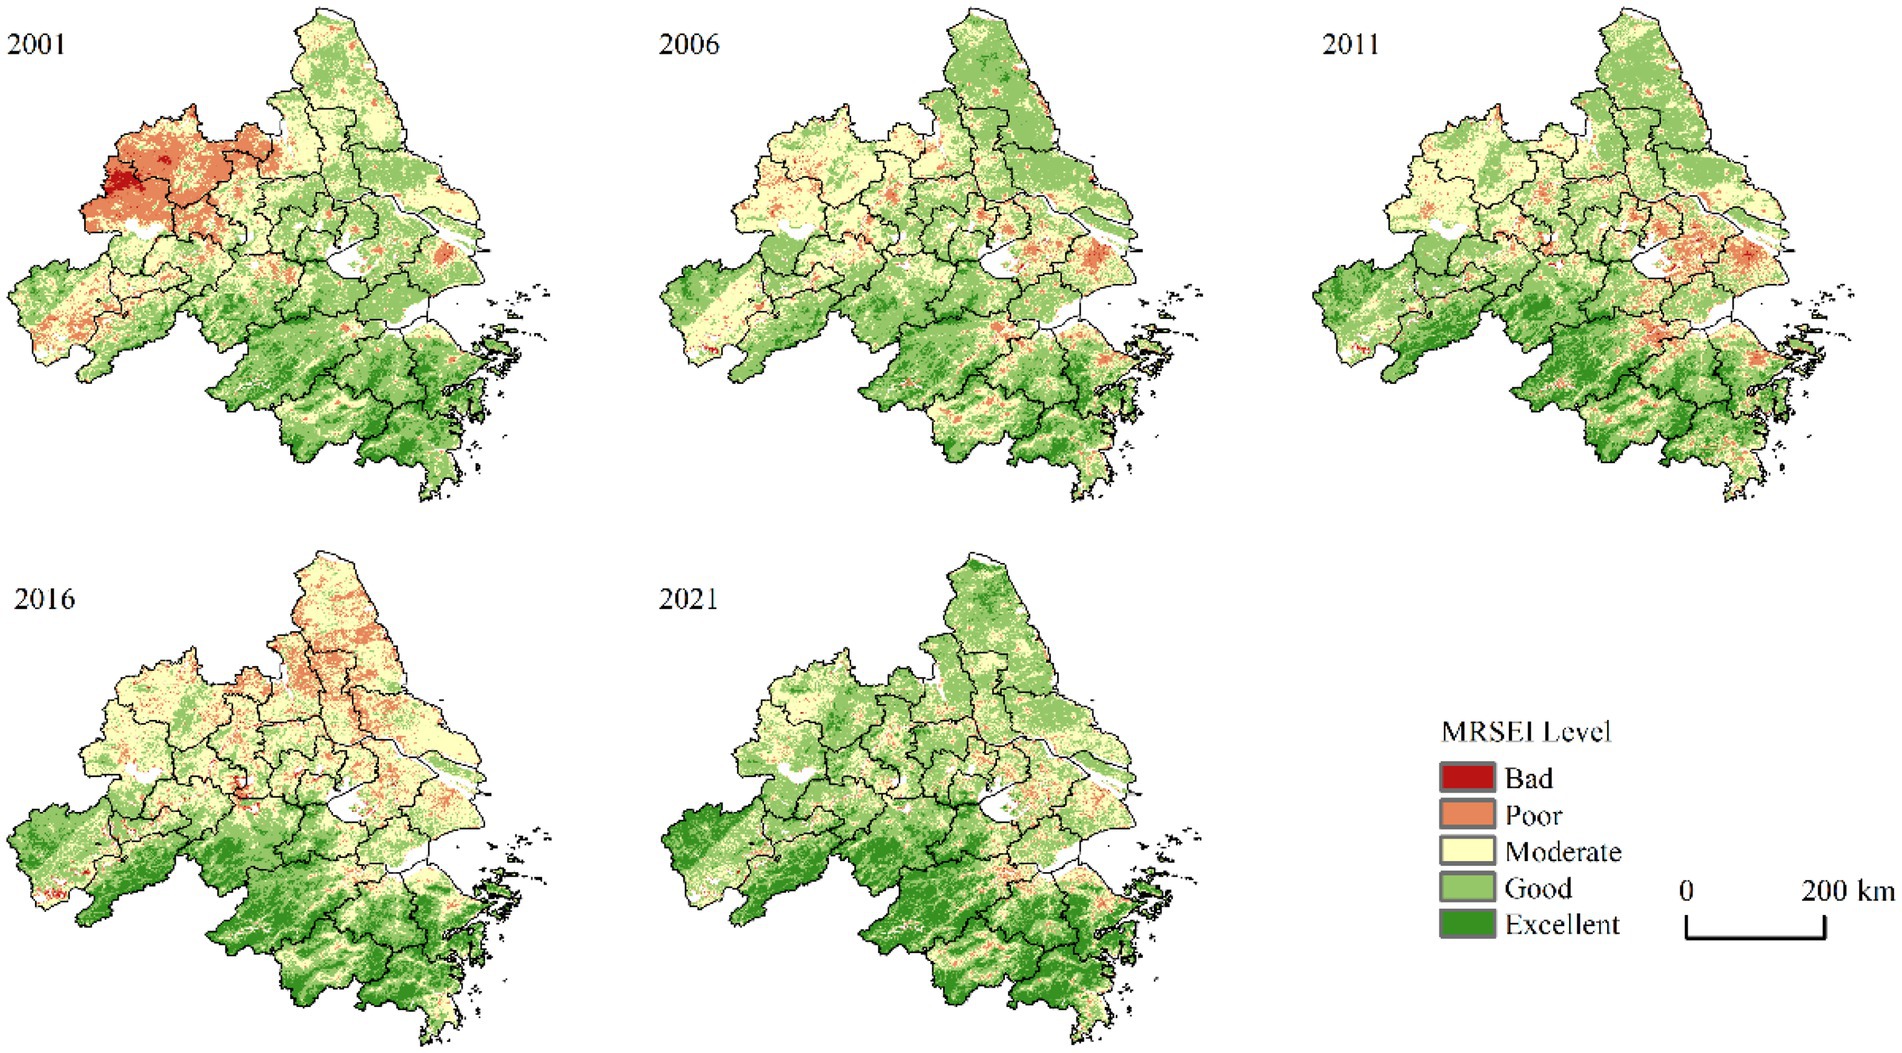
Figure 5. Spatial distribution of ecological environment quality levels in study area from 2001 to 2021.
To determine the changes of EEQ in each region of the YRDUA, MRSEI average values of 26 prefecture-level cities in the study area were calculated, as shown in Figure 6. The results showed that there was no area with bad and excellent EEQ in the YRDUA in the five research years, and the EEQ of Chizhou, Xuancheng, Huzhou, Hangzhou, Shaoxing, Jinhua, Ningbo, and Taizhou was all in good level. The cities with relatively low EEQ were mainly distributed in the northern part of the study area and the two sides of the Yangtze River. In 2001, the EEQ of Hefei and Chuzhou was poor, while that of other cities was moderate. From 2001 to 2006, the number of cities with moderate ecological environment has increased. In 2011, such distribution pattern continued, but the number of cities decreased. In 2016, the EEQ of several cities deteriorated. The EEQ of the cities in the north bank of the Yangtze River was moderate, and that in the north and south of the Yangtze River was significantly different. From 2016 to 2021, the EEQ of the YRDUA area has improved, and the number of cities with good EEQ increased significantly. Cities with moderate EEQ were mainly located in the eastern part of the study area, which were around the Yangtze River estuary, included Taizhou, Nantong, Wuxi, Suzhou, and Shanghai. In general, the EEQ of the southern cities in the study area was mainly good and relatively stable, while that of the northern cities changed relatively sharply, but the overall EEQ has been improved.
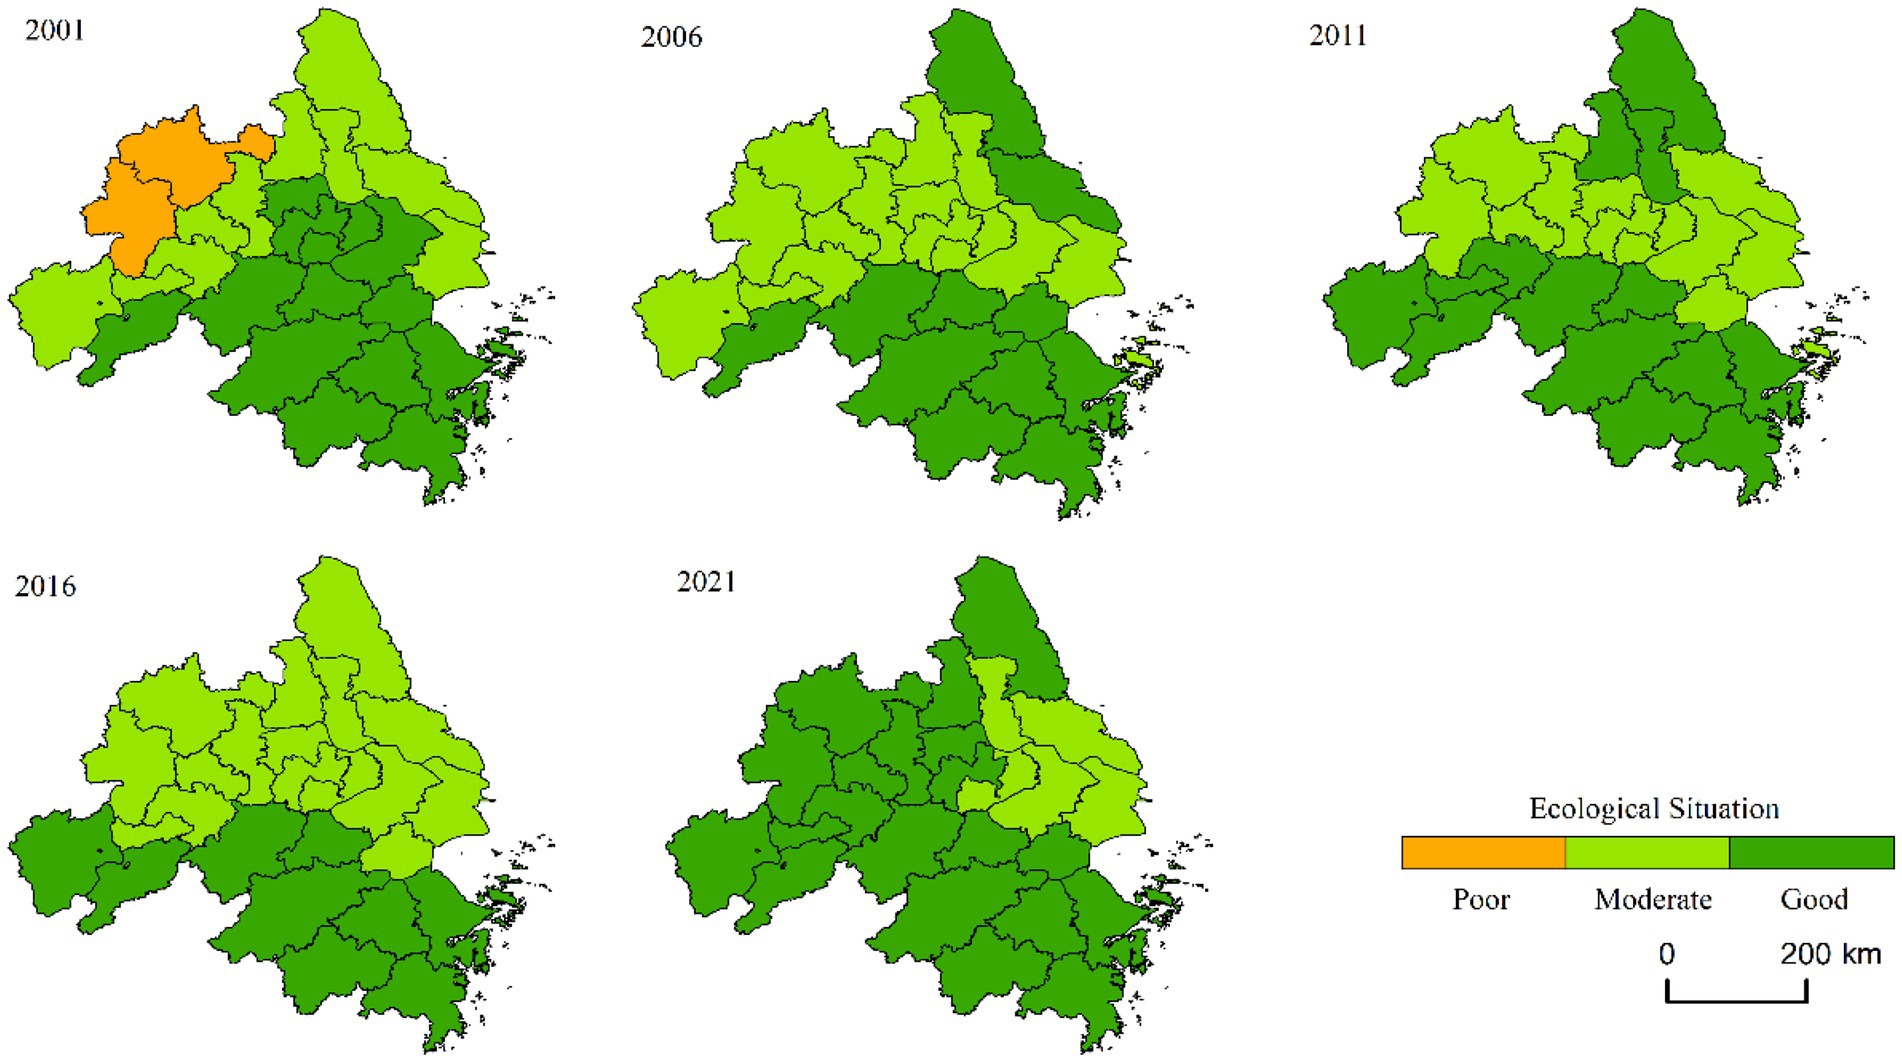
Figure 6. Changes in ecological environment quality of cities in Yangtze River Delta Urban Agglomeration.
Temporal and spatial variation characteristics of EEQ of the YRDUA
To further analyze the change of EEQ in the YRDUA from 2001 to 2021, the difference of MRSEI index in each year was analyzed based on the five-level MRSEI index. The grade difference was positive, indicated that the EEQ of the study area was improved; otherwise, the grade difference value was negative, indicated that the EEQ of the study area was deteriorated. The degree change can be graded into “Obviously Improved (OI),” “Slightly Improved (SI),” “Not Changed (NC),” Slightly Deteriorated (SD),” and “Obviously Deteriorated (OD)” (Table 5). Overall, the ecological conditions of the YRDUA from 2001 to 2021 were not changed or slightly improved, accounted for 43.21 and 45.35% of the total study area, respectively. From 2001 to 2006, the area with deteriorated EEQ in the study area was 31,684.20 km2, accounted for 15.75%, it was mainly in the SD. The area with improved EEQ was 55,773.00 km2, accounted for 27.72%, and it was mainly the SI. It indicated that the EEQ of the YRDUA has gradually improved from 2001 to 2006. From 2006 to 2011, the area with deteriorated EEQ in the study area accounted for 13.91%, mainly in the SD; the area with improved EEQ accounted for 20.23%, and it was mainly the SI. The proportions of areas with deteriorated and improved EEQ decreased, indicated that the ecological environment change in the YRDUA was relatively stable from 2006 to 2011. From 2011 to 2016, the area with deteriorated EEQ accounted for 25.82%, mainly in the SD, while the area with improved EEQ accounted for 16.05%, mainly in the SI. The proportions of areas with deteriorated and improved EEQ increased significantly, indicated that the ecological environment change in the YRDUA from 2011 to 2016 was drastic. The area of SD increased greatly, and the ecological environment deteriorates greatly. From 2016 to 2021, the area of ecological quality degradation in the study area only accounted for 6.72%, while the area of ecological improvement accounted for 38.24%. The area with deteriorated EEQ decreased significantly, indicated that the ecological environment of the YRDUA improved significantly from 2016 to 2021.
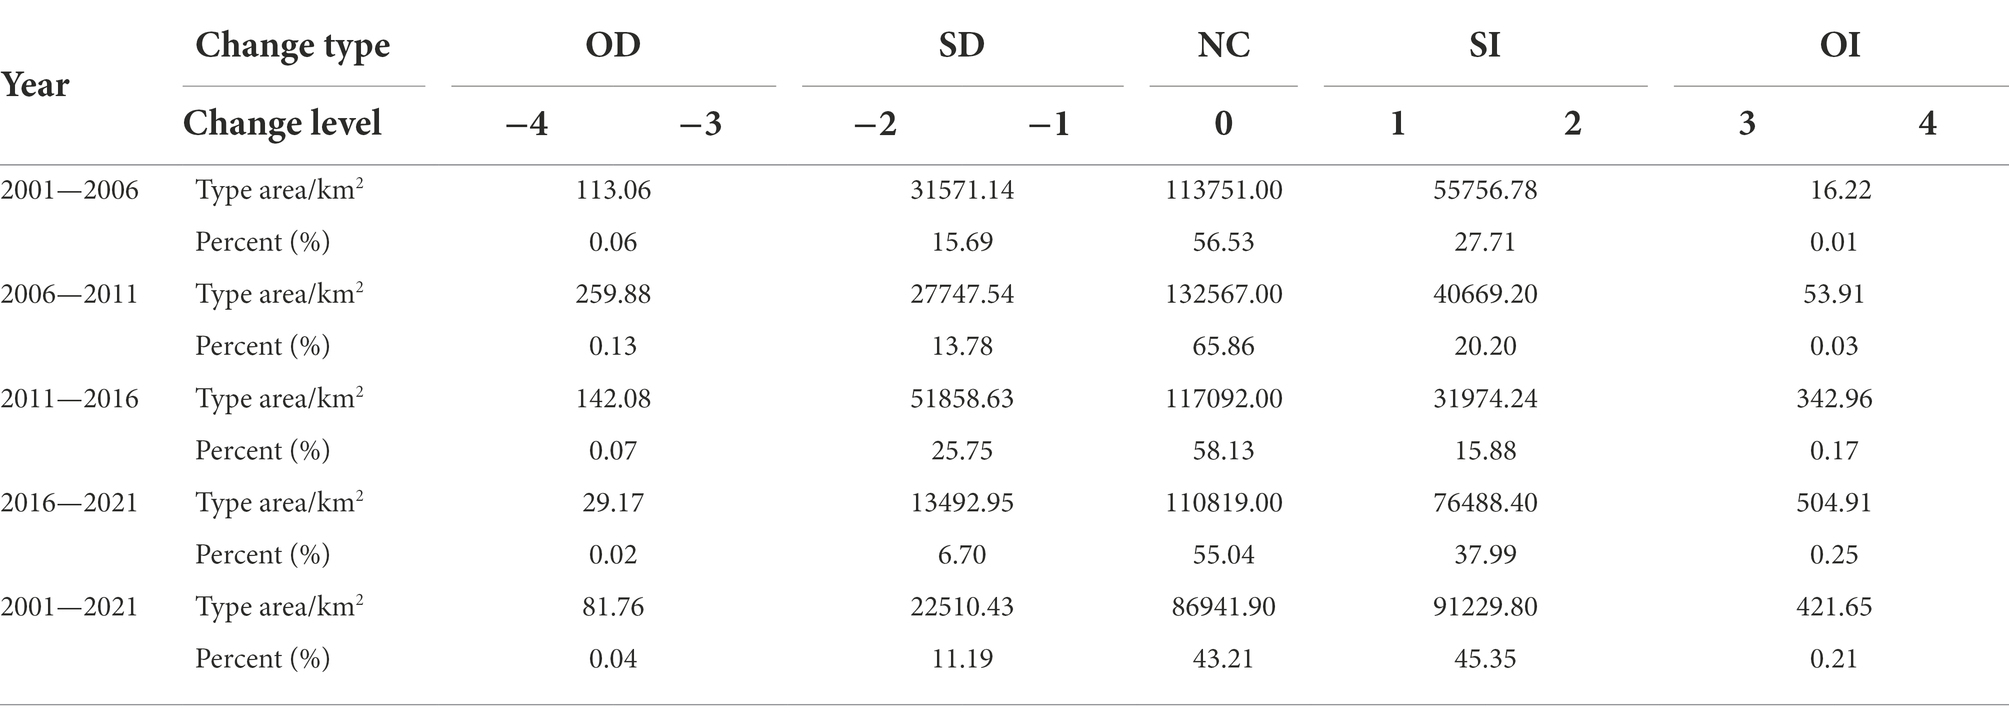
Table 5. Change detection of MRSEI level in Yangtze River Delta Urban Agglomeration from 2001 to 2021.
From the spatial perspective (Figure 7), the regions with improved EEQ from 2001 to 2021 were mainly distributed in the north and west of the study area, mainly in Hefei, Chuzhou, Anqing, Chizhou, Ma’anshan, Nanjing, Yangzhou and Yancheng. The regions with deteriorated EEQ were mainly distributed in the east and south, concentrated in the core urban areas of Suzhou, Wuxi, Changzhou, Huzhou, and Hangzhou. From 2001 to 2006, the EEQ in the northern part of the YRDUA was improved, which was embodied in Hefei, Chuzhou, Ma’anshan, and Yancheng. The regions with deteriorated EEQ were mainly distributed in the southeast of the study area, concentrated in Shanghai, Suzhou, Wuxi, Hangzhou, Shaoxing, and Ningbo. From 2006 to 2011, the EEQ of most areas in the study area remained unchanged. The regions with improved EEQ were mainly distributed in Anqing and Chizhou, while those with deteriorated EEQ were mainly distributed in Suzhou and Huzhou. From 2011 to 2016, the regions with deteriorated EEQ in the northern part of the study area expanded greatly, mainly distributed in Yangzhou, Taizhou, and Yancheng. The EEQ in the southern part of the study area remained unchanged or improved. From 2016 to 2021, the EEQ of most areas in the study area remained unchanged or improved, while only the EEQ in Anqing, Jinhua and Taizhou deteriorated.
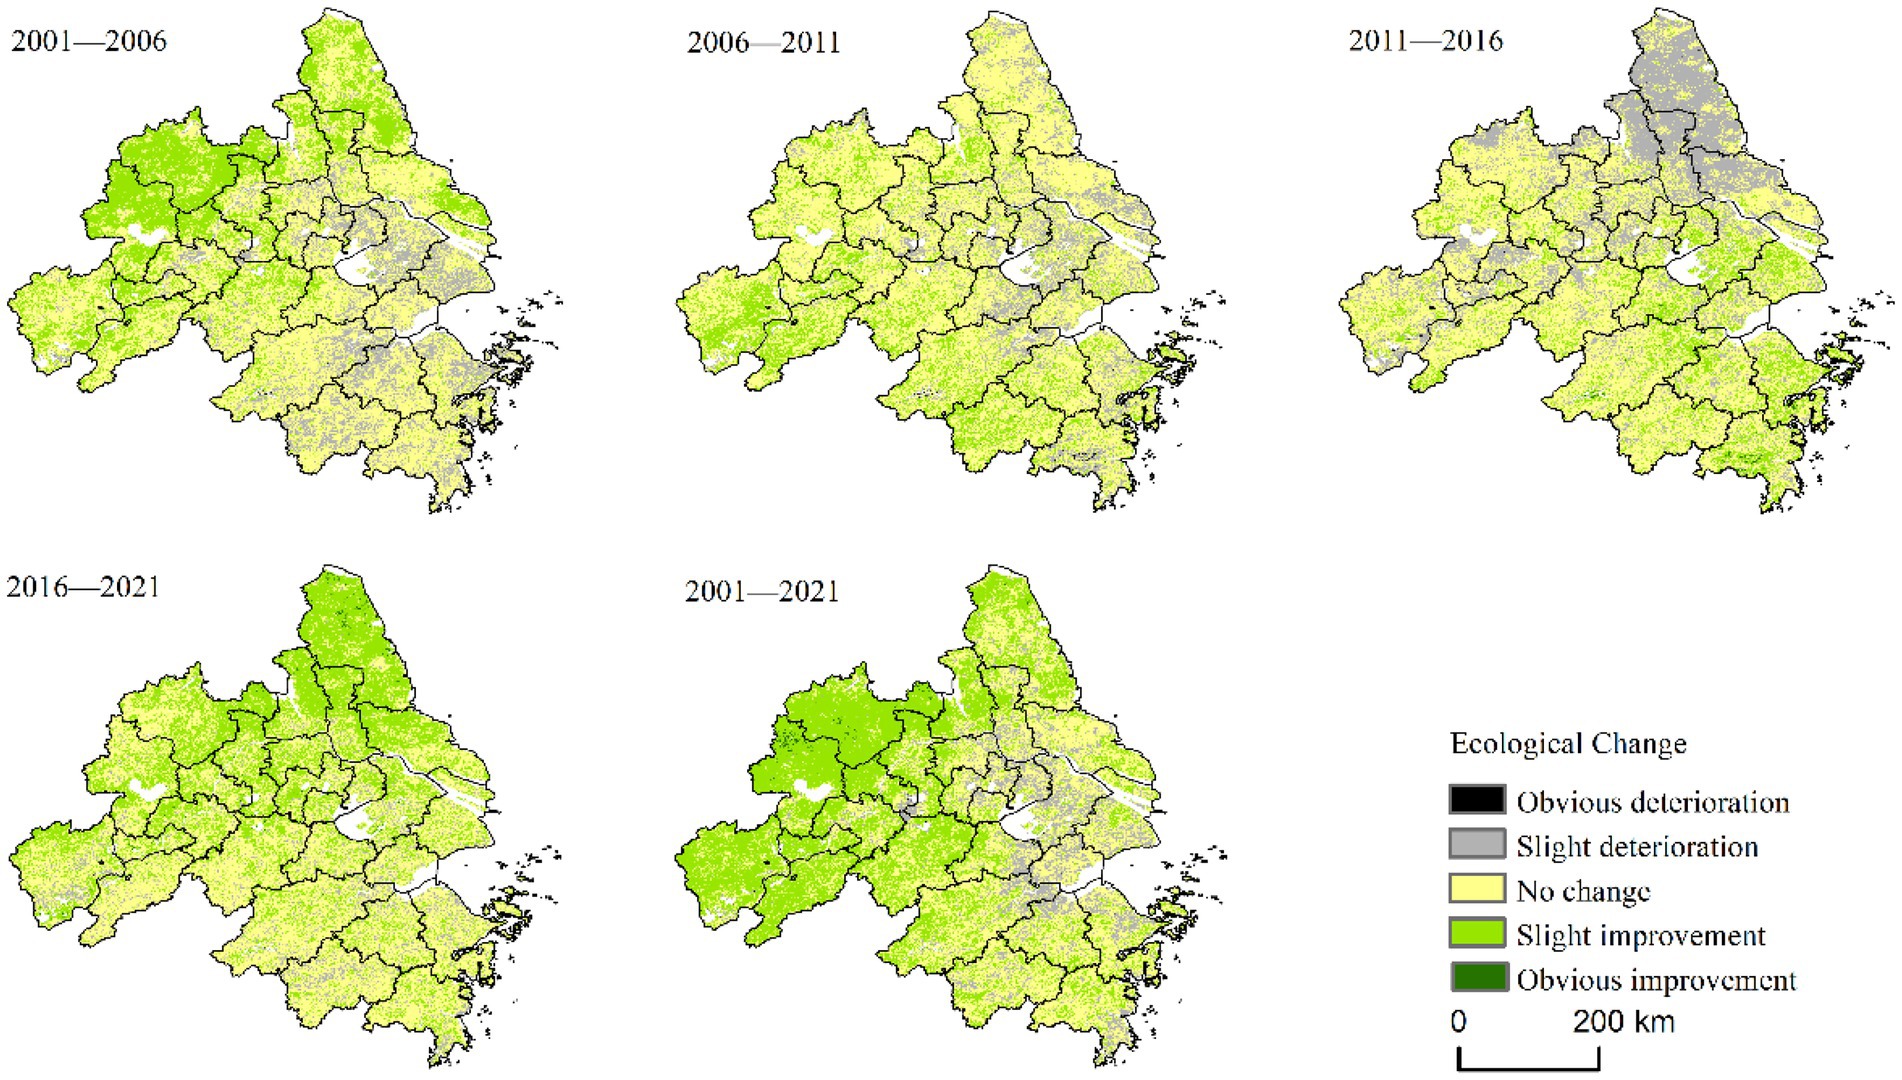
Figure 7. Changes of ecological environment level in Yangtze River Delta Urban Agglomeration from 2001 to 2021.
Spatial autocorrelation analysis of EEQ of the YRDUA
The Moran’s I and LISA map were obtained based on GeoDa software. Figure 8 shows the scatterplot of MRSEI’s Moran’s I. The values of Moran’s I in 2001, 2006, 2011, 2016, and 2021 are 0.918, 0.874, 0.864, 0.902, and 0.838, respectively, showing a significant spatial aggregation. Rather than a random distribution, scatter is mainly distributed in the first and the third quadrant of the research years. It indicates that the EEQ in the study area has a strong positive spatial correlation, which was reflected by the fact that the regions with high EEQ were adjacent to each other or the areas with low EEQ were adjacent to each other. In addition, the Moran’s I shows a downward trend from 2001 to 2011, an upward trend from 2011 to 2016, and a downward trend from 2016 to 2021, which is contrary to the change trend of EEQ in the study area.
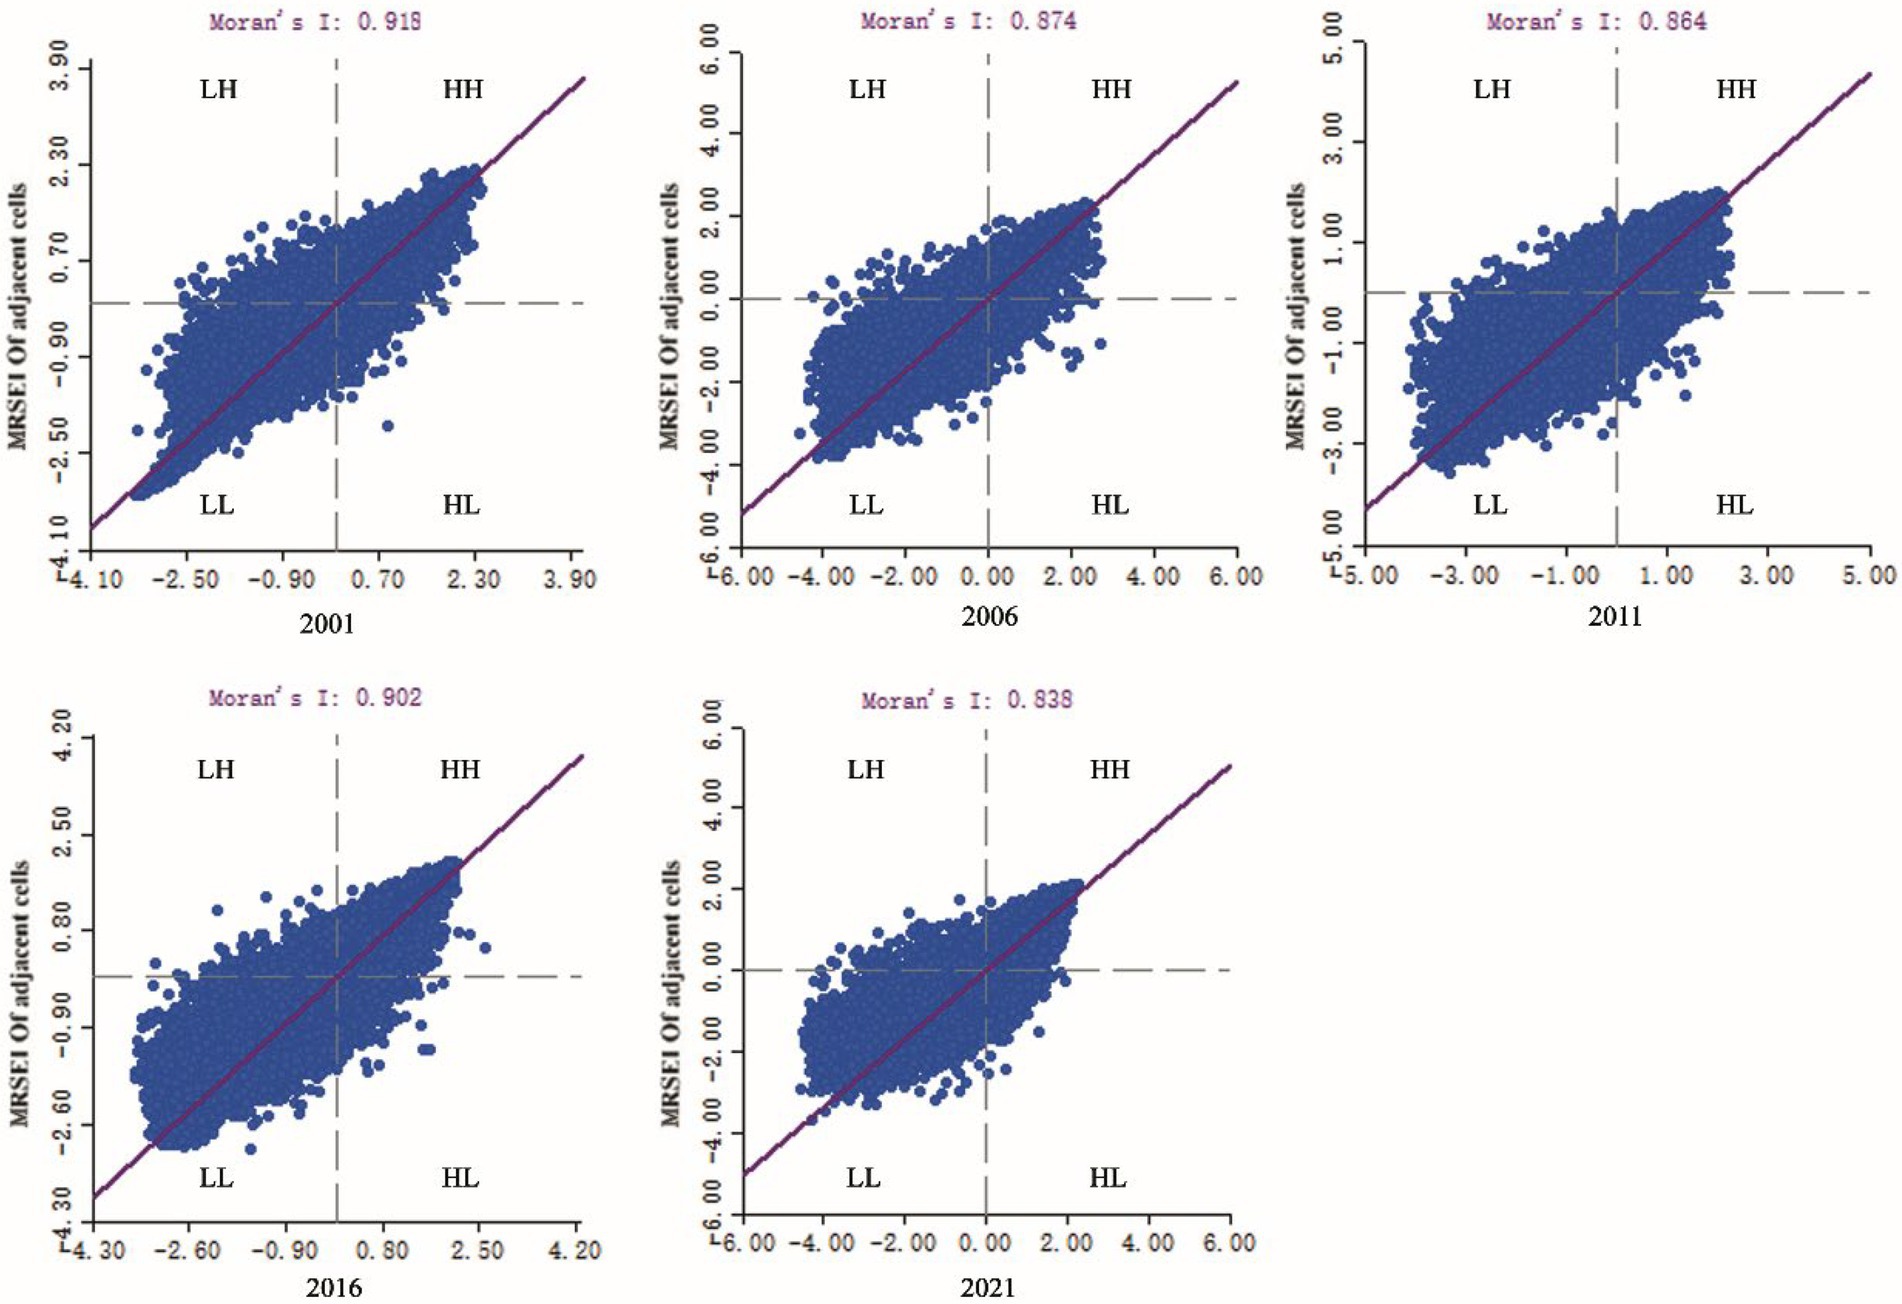
Figure 8. Moran scatter plots of the MRSEI in Yangtze River Delta Urban Agglomeration from 2001 to 2021.
Local spatial autocorrelation analysis was performed on the EEQ of the YRDUA to generate a LISA distribution diagram (Figure 9). There are five types of spatial features in the study area: High-High (HH) aggregation, High-Low (HL) aggregation, Low-Low (LL) aggregation, Low-High (LH) aggregation, and No Significant (NS) aggregation, among which NS, HH, and LL are the main ones. In the past 20 years, the HH aggregation is mainly distributed in the southern part of the study area, while the LL aggregation is mainly distributed in the northern part. It shows that the overall EEQ in the southern part of the study area is good, while that in the northern region is poor. In 2001, it was mainly distributed in Hefei and Chuzhou in the northwest of the study area. From 2006 to 2011, the distribution center of LL aggregation shifted eastward along the Yangtze River, forming two concentrated distribution regions with Hefei as the center and Shanghai as the center. In 2016, the distribution area of LL aggregation types expanded northward, with the distribution center in Yancheng City. In 2021, the area of LL aggregation types decreased significantly, mainly distributed in Hefei City, the estuary of the Yangtze River, and the Hangzhou Bay area. From the change of the area proportion of each aggregation type (Figure 10), the proportion of NS area is the highest in the five research years. From 2001 to 2011, the area changes of each aggregation type were relatively stable, the proportion of HH aggregation area was larger than that of LL cluster, and the proportion of NS aggregation area decreased significantly in 2016. The area proportions of LL and HH aggregations both increased, and the area proportion of LL aggregation exceeded that of HH aggregation. In 2021, the proportion of NS area increased significantly, but the proportion of LL and HH area decreased.
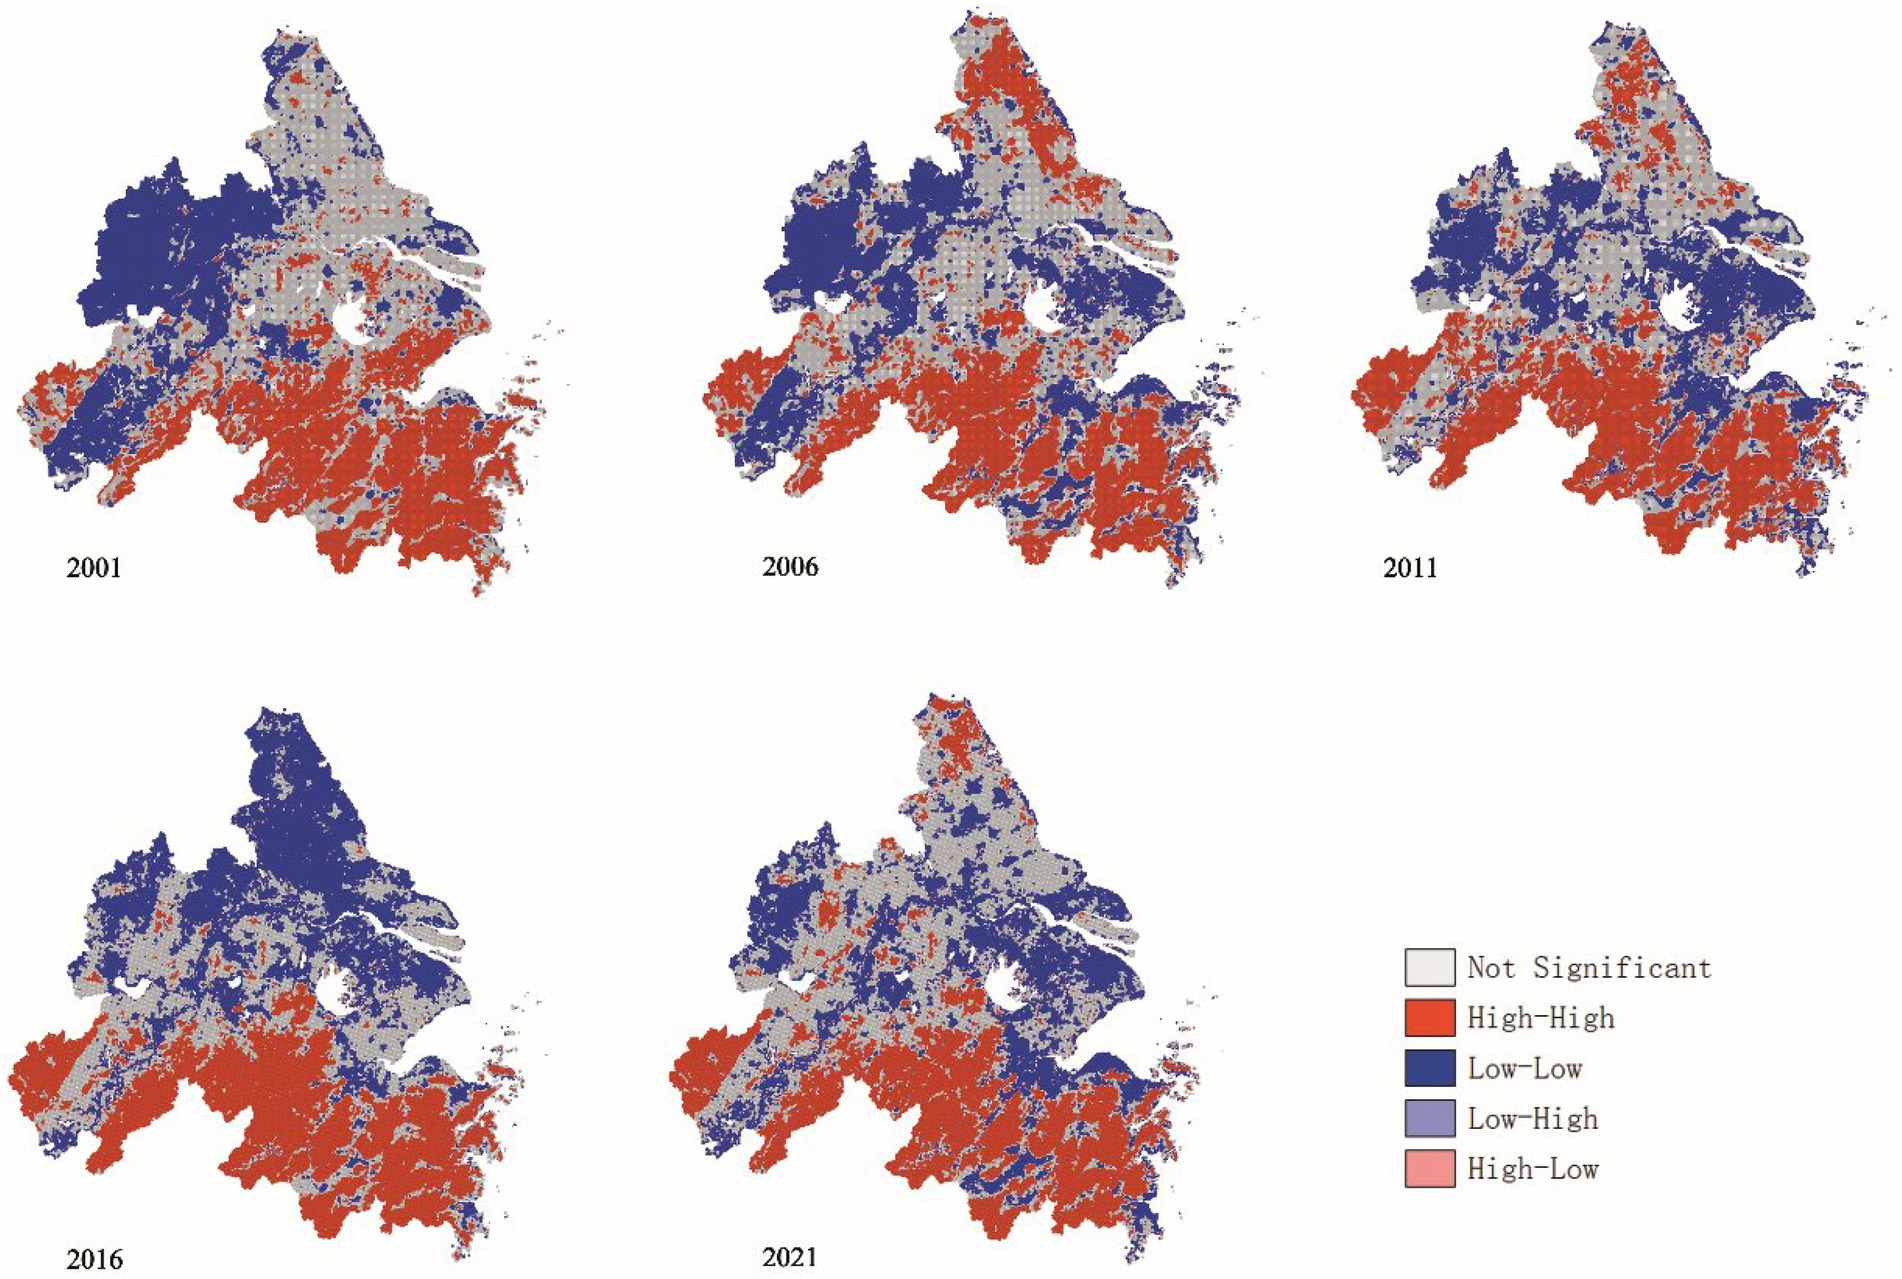
Figure 9. LISA cluster map of the MRSEI in Yangtze River Delta Urban Agglomeration from 2001 to 2021.
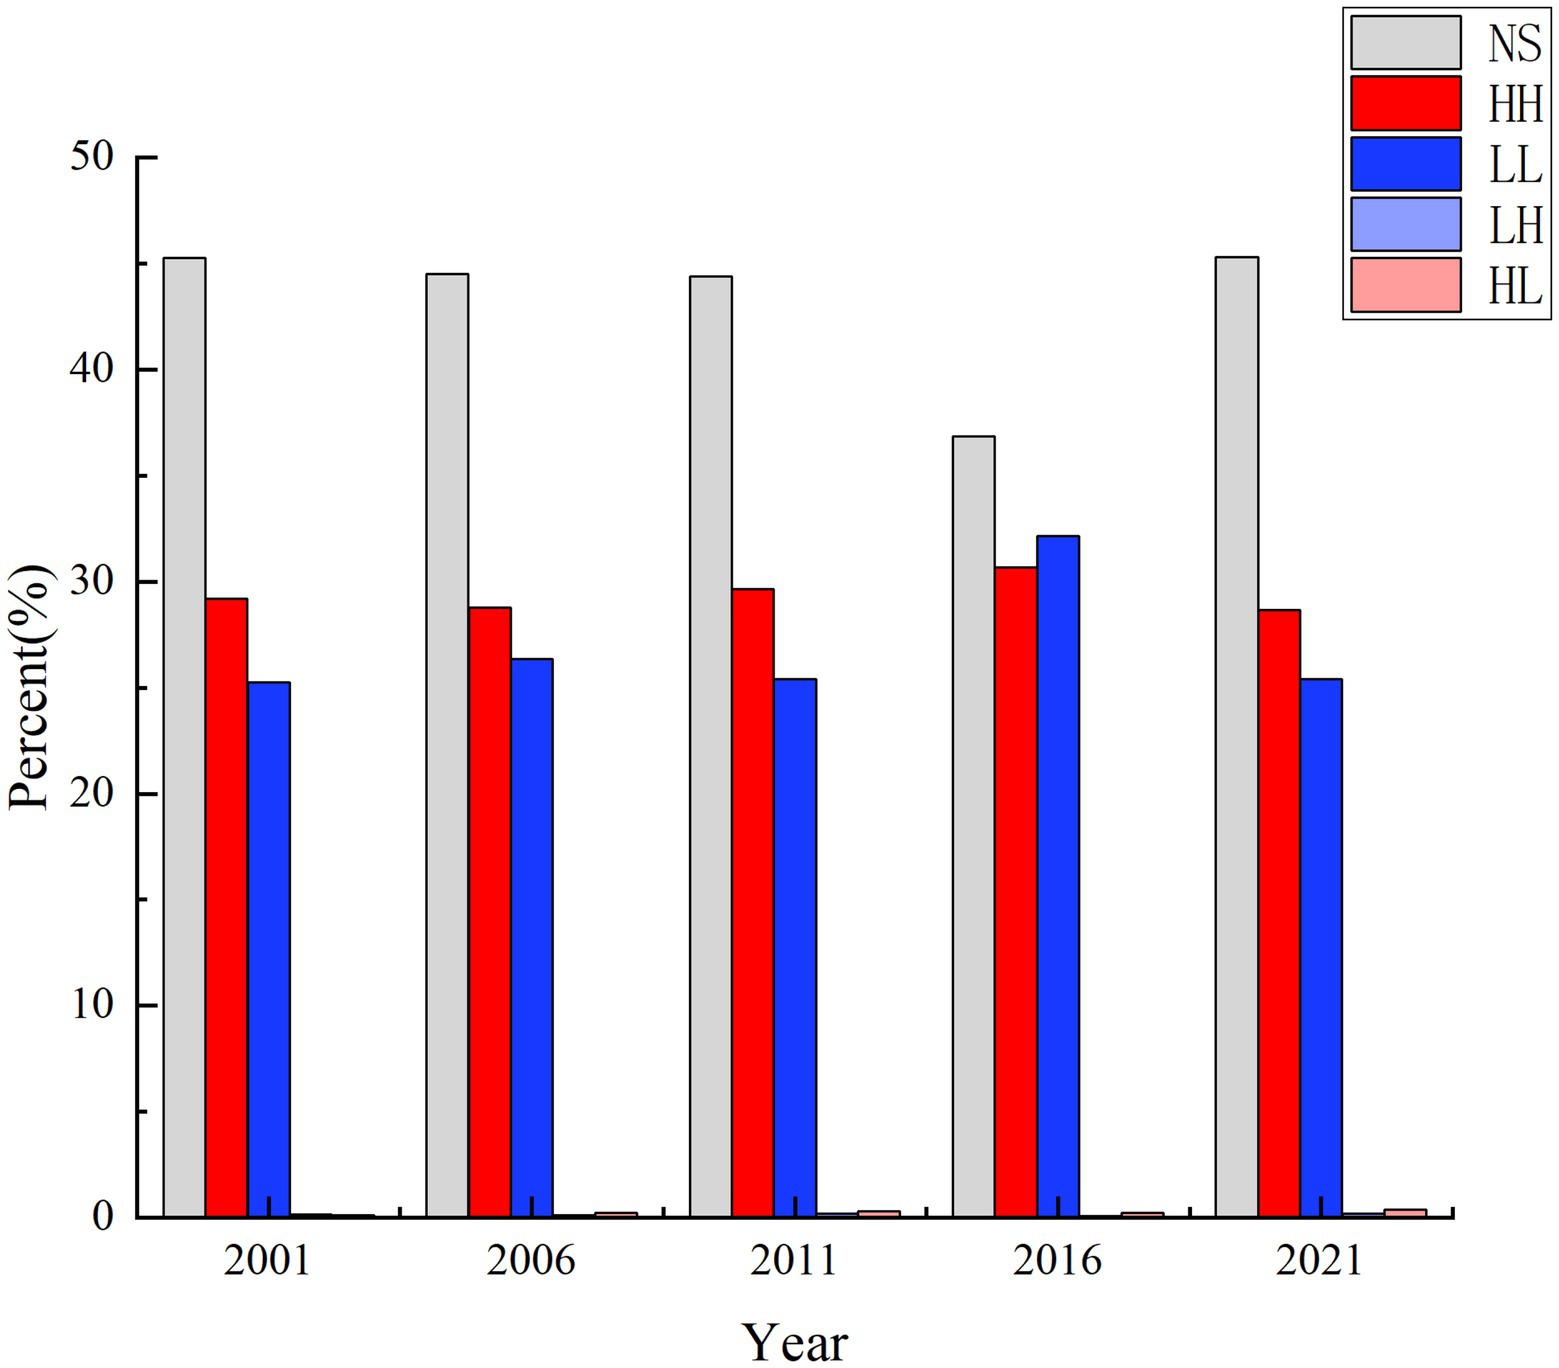
Figure 10. Area proportion of each clustering area.
Discussion
The research results are similar to those of existing study (Zheng et al., 2021), but there are certain differences in different regions, especially in the northern region, including Yancheng, Taizhou, Yangzhou and Nantong, where the EEQ changes more acutely than previous study. The main reason is that the area with serious air pollution in the north of the YRDUA expanded before 2016, and then the area gradually decreased, and the air quality in the study area has improved significantly (Yun et al., 2019; Zhang, 2022). In addition, the air quality in the south of the study area was generally better than that in the north, which was one of the reasons for the spatial differentiation of the EEQ in the YRDUA (She et al., 2017).
In this study, the MRSEI was constructed based on the GEE platform and MODIS data, which can better avoid the problems of complex data processing and low data quality in previous studies. GEE platform can quickly process lots of images to be downloaded in batches, which not only updates the images timely, but also avoids the complicated preliminary processing of remote sensing images. In addition, Google’s powerful server can be used to quickly process and analyze massive remote sensing data in large scale areas online. Therefore, it can effectively solve the problems in the application of remote sensing ecological index in a large area. MODIS data has moderate spatiotemporal resolution and high image quality, and combined with the GEE platform, it can ensure the consistency and stability of index calculation in larger-scale study areas. MODIS data has moderate spatiotemporal resolution and high image quality. Combined with the GEE platform, it can ensure the consistency and stability of index calculation in the large scale study area. Based on the ecological environment characteristics of the study area, the impacts of air quality on the EEQ cannot be ignored. MRSEI considers the impact of air quality on the ecological environment, and adds air quality indicators on the basis of the original four indicators. Compared with RSEI, MRSEI can more comprehensively and scientifically reflect the EEQ of large urban agglomerations, making the evaluation indicators more objective and reasonable. In conclusion, the results of this study are important for understanding the EEQ of the YRDUA and formulating ecosystem protection policies and sustainable development strategies in the YRDUA. The research method also provides a reference for the realization of ecological environment monitoring and governance of large urban agglomerations.
Although this study has improved RSEI, there are still some limitations in this work. Firstly, whether the five indicators can comprehensively represent the regional EEQ is questionable, the ecosystem itself is complex and diverse, and the composition and changes of EEQ involve many aspects, including natural factors and human factors. Future research can increase the number of indicators (Wei et al., 2019), such as vegetation net primary productivity (NPP), vegetation health index (VHI), meteorological drought index, and various socio-economic indexes. Secondly, the evaluation methods of the five indicators themselves can also be improved. It can be considered to establish appropriate thresholds according to the conditions of the study area before normalization (Estoque et al., 2020). Regional EEQ is usually based on the ecological base composed of natural factors such as temperature, precipitation, and solar radiation. Aggravation of climate change leads to the drastic change of natural factors, thus affecting the regional EEQ (Elahi et al., 2022b). In addition, the increase of human activity intensity and large-scale urban construction have not only changed the topography, but also greatly changed the original ecological environment and caused the urban heat island effect, exerting various effects on the surrounding ecological environment. Therefore, under the effect of climate change and human activity, the future related research should further explore the relationship of EEQ changes to climate change and human activities in Yangtze River Delta, quantitatively analyze the response of regional EEQ to the climate change and land use change of this region, especially the interaction between urban expansion and ecological environment in the process of urban development, and discuss the impacts of single factor action and multi-factor interaction on the EEQ, so as to better coordinate the relationship of climate change to economic development and environmental protection.
Conclusion
In this study, based on GEE platform and MODIS data products, PCA was employed to coupling greenness, humidity, dryness, heat, and air quality to construct MRSEI, which is to monitor and study the EEQ in the YRDUA in the past 20 years. The main results and conclusions are as follows:
1. In the five research years, the average MRSEI distribution in the YRDUA ranged from 0.59 to 0.67, the overall EEQ of the YRDUA is at a moderate or good level. The EEQ of the YRDUA showed an improvement trend from 2001 to 2011, mainly due to the increase of the area with good EEQ. From 2011 to 2016, the area with moderate and poor EEQ increased, while that with good EEQ decreased significantly. From 2016 to 2021, the EEQ was improved significantly. From the perspective of spatial pattern, the EEQ in the south of the YRDUA was better than that in the north. The regions with good and excellent EEQ were mostly distributed in the southern part of the study area. The regions with average and poor EEQ were mainly concentrated in the north and the two banks of the Yangtze River, and most of them are concentrated in the urban built-up areas. From the perspective of specific cities, the EEQ of the southern cities in the study area is better and more stable, while that of the northern cities is relatively drastic, but the overall EEQ has been improved.
2. Overall, the ecological conditions of the YRDUA from 2001 to 2021 were mainly unchanged or improved. The regions with improved EEQ were mainly distributed in the north and west, while those with deteriorated EEQ were mainly distributed in the east and south. From 2001 to 2006, the ecological environment of the YRDUA gradually improved. The area with improved EEQ accounts for 27.72% of the total area of the study area, mainly distributes in Hefei, Chuzhou, Ma’anshan, and Yancheng. From 2006 to 2011, the ecological environment change of the YRDUA was relatively stable. The regions with improved EEQ were mainly distributed in Anqing and Chizhou in the west, while those with deteriorated EEQ were mainly distributed in Suzhou and Huzhou in the east. From 2011 to 2016, the ecological environment of the YRDUA changes dramatically. The area with deteriorated EEQ accounts for 25.82% of the total area, in which the EEQ is greatly degraded, and they were mainly distributed in Yangzhou, Taizhou, and Yancheng in the north. From 2016 to 2021, the EEQ of the YRDUA was improved, and the area of ecological environment deterioration was significantly reduced.
3. The values of Moran’s I of EEQ in the study area in 2001, 2006, 2011, 2016, and 2021 are 0.918, 0.874, 0.864, 0.902, and 0.838, respectively. The spatial distribution of EEQ in the YRDUA was positively correlated, and the spatial distribution showed aggregation. In the past 20 years, NS area of spatial autocorrelation distribution of EEQ in the YRDUA accounts for the highest proportion, HH aggregation was mainly distributed in the southern part of the YRDUA, while LL aggregation was mainly distributed in the northern part of the YRDUA.
Data availability statement
The raw data supporting the conclusions of this article will be made available by the authors, without undue reservation.
Author contributions
ZS: conceptualization, methodology, data analysis, and writing - original draft. YW: software and writing - review and editing. QZ: writing - review and editing and validation. CZ: Research design and Funding acquisition. All authors contributed to the article and approved the submitted version.
Funding
This research was supported by the National Key R&D Program of China (2021YFB3901305) and A Project Funded by the Priority Academic Program Development of Jiangsu Higher Education Institutions (PAPD), to which we are very grateful.
Conflict of interest
The authors declare that the research was conducted in the absence of any commercial or financial relationships that could be construed as a potential conflict of interest.
Publisher’s note
All claims expressed in this article are solely those of the authors and do not necessarily represent those of their affiliated organizations, or those of the publisher, the editors and the reviewers. Any product that may be evaluated in this article, or claim that may be made by its manufacturer, is not guaranteed or endorsed by the publisher.
References
Alfoldy, B., Osan, J., Toth, Z., Torok, S., Harbusch, A., Jahn, C., et al. (2007). Aerosol optical depth, aerosol composition, and air pollution during summer and winter conditions in Budapest. Sci. Total Environ. 383, 141–163. doi: 10.1016/j.scitotenv.2007.04.037
An, M., Xie, P., He, W. J., Wang, B., Huang, J., and Khanal, R. (2022). Spatiotemporal change of ecologic environment quality and human interaction factors in three gorges ecologic economic corridor, based on RSEI. Ecol. Indic. 141:109090. doi: 10.1016/j.ecolind.2022.109090
Anselin, L. (1995). Local indicators of spatial association—LISA. Geogr. Anal. 27, 93–115. doi: 10.1111/j.1538-4632.1995.tb00338.x
Behling, R., Bochow, M., Foerster, S., Roessner, S., and Kaufmann, H. (2015). Automated GIS-based derivation of urban ecological indicators using hyperspectral remote sensing and height information. Ecol. Indic. 48, 218–234. doi: 10.1016/j.ecolind.2014.08.003
Ding, Y., Feng, H. H., Zou, B., Liu, N., and Ye, S. C. (2020). Spatial-temporal distribution and transport characteristic of aerosol in Changsha-Zhuzhou-Xiangtan urban agglomeration. China Environ. Sci. 40, 1906–1914. doi: 10.19674/j.cnki.issn1000-6923.2020.0214
Elahi, E., Khalid, Z., Tauni, M. Z., Zhang, H., and Lirong, X. (2022a). Extreme weather events risk to crop-production and the adaptation of innovative management strategies to mitigate the risk: a retrospective survey of rural Punjab, Pakistan. Technovation. 117:102255. doi: 10.1016/j.technovation.2021.102255
Elahi, E., Khalid, Z., and Zhang, Z. X. (2022b). Understanding farmers’ intention and willingness to install renewable energy technology: a solution to reduce the environmental emissions of agriculture. Appl. Energy 309:118459. doi: 10.1016/j.apenergy.2021.118459
Emili, E., Popp, C., Petitta, M., Riffler, M., Wunderle, S., and Zebisch, M. (2010). PM10 remote sensing from geostationary SEVIRI and polar-orbiting MODIS sensors over the complex terrain of the European alpine region. Remote Sens. Environ. 114, 2485–2499. doi: 10.1016/j.rse.2010.05.024
Estoque, R. C., Ooba, M., Seposo, X. T., Togawa, T., Hijioka, Y., Takahashi, K., et al. (2020). Heat health risk assessment in Philippine cities using remotely sensed data and social-ecological indicators. Nat. Commun. 11:1581. doi: 10.1038/s41467-020-15218-8
Geng, J., Xu, D., Wu, Y. G., Geng, J., Ren, B. N., and Yang, F. (2022). Spatio-temporal evolution of eco-environment quality and the response to climate change and human activities in Hainan Island. Acta Ecol. Sin. 42, 4795–4806. doi: 10.5846/stxb202107272035
Gorelick, N., Hancher, M., Dixon, M., Ilyushchenko, S., Thau, D., and Moore, R. (2017). Google earth engine: planetary-scale geospatial analysis for everyone. Remote Sens. Environ. 202, 18–27. doi: 10.1016/j.rse.2017.06.031
Goward, S. N., Xue, Y., and Czajkowski, K. P. (2002). Evaluating land surface moisture conditions from the remotely sensed temperature/vegetation index measurements: An exploration with the simplified simple biosphere model. Remote Sens. Environ. 79, 225–242. doi: 10.1016/S0034-4257(01)00275-9
Hang, X., Luo, X. C., Cao, Y., and Li, Y. C. (2020). Ecological quality assessment and urbanization impact based on RSEI model for Nanjing, Jiangsu Province. Chinese J. Applied Eco. 31, 219–229. doi: 10.13287/j.1001-9332.202001.030
Hou, Y. X., Zhang, K. R., Zhu, Y. C., and Liu, W. Y. (2021). Spatial and temporal differentiation and influencing factors of environmental governance performance in the Yangtze River Delta, China. Science of the Total Environment. 801:149699. doi: 10.1016/j.scitotenv.2021.149699
Hu, X. S., and Xu, H. Q. (2018). A new remote sensing index for assessing the spatial heterogeneity in urban ecological quality: a case from Fuzhou City, China. Ecol. Indic. 89, 11–21. doi: 10.1016/j.ecolind.2018.02.006
Huang, X. G., Zhao, J. B., Cao, J. J., and Xin, W. D. (2020). Evolution of the distribution of PM2.5 concentration in the Yangtze River Economic Belt and its influencing factors. Environmental. Science 41, 1013–1024. doi: 10.13227/j.hjkx.201906158
Jing, Y. Q., Zhang, F., He, Y. F., Kung, H. T., Johnson, V. C., and Arikena, M. (2020). Assessment of spatial and temporal variation of ecological environment quality in Ebinur Lake wetland National Nature Reserve, Xinjiang, China. Ecol. Indic. 110:105874. doi: 10.1016/j.ecolind.2019.105874
Kumar, L., and Mutanga, O. (2018). Google earth engine applications since inception: usage, trends, and potential. Remote Sens. 10:1509. doi: 10.3390/rs10101509
Liao, W. H., and Jiang, W. G. (2020). Evaluation of the spatiotemporal variations in the eco–environmental quality in China based on the remote sensing ecological index. Remote Sens. 12:2462. doi: 10.3390/rs12152462
Lin, C. Q., Li, Y., Yuan, Z. B., Lau, A. K., Li, C. C., and Fung, J. C. (2015). Using satellite remote sensing data to estimate the high-resolution distribution of ground-level PM2.5. Remote Sens. Environ. 156, 117–128. doi: 10.1016/j.rse.2014.09.015
Liu, Y., Dang, C. Y., Yue, H., Lyu, C. G., Qian, J. X., and Zhu, R. (2022). Comparison between modified remote sensingecological index and RSEI. National Remote Sensing Bulletin. 26, 683–697. doi: 10.11834/jrs.20229338
Liu, N., Zou, B., Feng, H. H., Wang, W., Tang, Y. Q., and Liang, Y. (2019). Evaluation and comparison of multiangle implementation of the atmospheric correction algorithm, dark target, and deep blue aerosol products over China. Atmospheric Chemistry Physics Discussion. 19, 8243–8268. doi: 10.5194/acp-19-8243-2019
Paciorek, C. J., Liu, Y., Moreno-Macias, H., and Kondragunta, S. (2008). Spatiotemporal associations between GOES aerosol optical depth retrievals and ground-level PM2.5. Environ. Sci. Technol. 42, 5800–5806. doi: 10.1021/es703181j
Parastatidis, D., Mitraka, Z., Chrysoulakis, N., and Abrams, M. (2017). Online global land surface temperature estimation from Landsat. Remote Sens. 9:208. doi: 10.3390/rs9121208
Peng, J., Chen, S., Lv, H. L., Liu, Y. X., and Wu, J. S. (2016). Spatiotemporal patterns of remotely sensed PM2.5 concentration in China from 1999 to 2011. Remote Sens. Environ. 174, 109–121. doi: 10.1016/j.rse.2015.12.008
Rikimaru, A., Roy, P. S., and Miyatake, S. (2002). Tropical forest cover density mapping. Trop. Ecol. 43, 39–47. Available at: http://refhub.elsevier.com/S1470-160X(20)30785-8/h0275
Shan, W., Jin, X. B., Ren, J., Wang, Y. C., Xu, Z. G., Fan, Y. T., et al. (2019). Ecological environment quality assessment based on remote sensing data for land consolidation. J. Clean. Prod. 239:118126. doi: 10.1016/j.jclepro.2019.118126
She, Q. N., Peng, X., Xu, Q., Long, L. B., Wei, N., Liu, M., et al. (2017). Air quality and its response to satellite-derived urban form in the Yangtze River Delta, China. Ecol. Indic. 75, 297–306. doi: 10.1016/j.ecolind.2016.12.045
Van Donkelaar, A., Martin, R. V., Brauer, M., and Boys, B. L. (2015). Use of satellite observations for long-term exposure assessment of global concentrations of fine particulate matter. Environ. Health Perspect. 123, 135–143. doi: 10.1289/ehp.1408646
Wan, L. H., Wang, S. W., and Chen, X. H. (2011). Geo DA-based spatial correlation analysis of GDP in Hadaqi industrial corridor. Geogr. Res. 30, 977–984. Available at: http://www.dlyj.ac.cn/CN/10.11821/yj2011060002
Wang, S. J., Ma, H. T., and Zhao, Y. B. (2014). Exploring the relationship between urbanization and the eco-environment—a case study of Beijing-Tianjin-Hebei region. Ecol. Indic. 45, 171–183. doi: 10.1016/j.ecolind.2014.04.006
Wang, Z., Meng, Q. Y., Allam, M., Hu, D., Zhang, L. L., and Menenti, M. (2021). Environmental and anthropogenic drivers of surface urban heat island intensity: a case-study in the Yangtze River Delta, China. Ecol. Indic. 128:107845. doi: 10.1016/j.ecolind.2021.107845
Wei, W., Guo, Z. C., Xie, B. B., Zhou, J. J., and Li, C. H. (2019). Spatiotemporal evolution of environment based on integrated remote sensing indexes in arid inland river basin in Northwest China. Environ. Sci. Pollut. Res. 26, 13062–13084. doi: 10.1007/s11356-019-04741-x
Wu, S. P., Gao, X., Lei, J. Q., Zhou, N., Guo, Z. K., and Shang, B. J. (2022). Ecological environment quality evaluation of the Sahel region in Africa based on remote sensing ecological index. J. Arid. Land 14, 14–33. doi: 10.1007/s40333-022-0057-1
Xu, H. (2008). A new index for delineating built-up land features in satellite imagery. Int. J. Remote Sens. 29, 4269–4276. doi: 10.1080/01431160802039957
Xu, H. Q. (2013). A remote sensing index for assessment of regional ecological changes. China Environ. Sci. 33, 889–897. doi: 10.3969/j.issn.1000-6923.2013.05.019
Xu, H. Q., and Deng, W. H. (2022). Rationality analysis of MRSEI and its difference with RSEI. Remote Sensing Technology and Application. 37, 1–7. doi: 10.11873/j.issn.1004-0323.2022.1.0001
Xu, H. Q., Wang, Y. F., Guan, H., Shi, T. T., and Hu, X. S. (2019). Detecting ecological changes with a remote sensing based ecological index (RSEI) produced time series and change vector analysis. Remote Sens. 11:2345. doi: 10.3390/rs11202345
Xu, D., Yang, F., Yu, L., Zhou, Y. Y., Li, H. X., Ma, J. J., et al. (2021). Quantization of the coupling mechanism between eco-environmental quality and urbanization from multisource remote sensing data. J. Clean. Prod. 321:128948. doi: 10.1016/j.jclepro.2021.128948
Yao, L., Li, X. L., Li, Q., and Wang, J. K. (2019). Temporal and spatial changes in coupling and coordinating degree of new urbanization and ecological-environmental stress in China. Sustainability. 11, 1171–1186. doi: 10.3390/su11041171
Yun, G. L., He, Y. R., Jiang, Y. T., Dou, P. F., and Dai, S. Q. (2019). PM2.5 spatiotemporal evolution and drivers in the Yangtze River Delta between 2005 and 2015. Atmos. 10:55. doi: 10.3390/atmos10020055
Zhang, Y. H. (2022). Spatial-temporal characteristics of PM2.5 regional pollution in Yangtze River Delta region. Res. Environ. Sci. 35, 1–10. doi: 10.13198/j.issn.1001-6929.2021.09.03
Zhang, X. P., and Gong, Z. Z. (2018). Spatiotemporal characteristics of urban air quality in China and geographic detection of their determinants. J. Geogr. Sci. 28, 563–578. doi: 10.1007/s11442-018-1491-z
Zhang, Z., Wu, W., Fan, M., Wei, J., Tan, Y. H., and Wang, Q. (2019). Evaluation of MAIAC aerosol retrievals over China. Atmos. Environ. 202, 8–16. doi: 10.1016/j.atmosenv.2019.01.013
Zheng, Z. H., Wu, Z. F., Chen, Y. B., Yang, Z. W., and Marinello, F. (2021). Analyzing the ecological environment and urbanization characteristics of the Yangtze River Delta urban agglomeration based on Google earth engine. Acta Ecol. Sin. 41, 717–729. doi: 10.5846/stxb202003250687
Zhou, D., Bonafoni, S., Zhang, L., and Wang, R. (2018). Remote sensing of the urban heat island effect in a highly populated urban agglomeration area in East China. Sci. Total Environ. 628-629, 415–429. doi: 10.1016/j.scitotenv.2018.02.074
Keywords: ecological environment quality, Google Earth Engine, spatiotemporal variation, spatial autocorrelation, the Yangtze River Delta urban agglomeration
Citation: Shi Z, Wang Y, Zhao Q and Zhu C (2022) Assessment of spatiotemporal changes of ecological environment quality of the Yangtze River Delta urban agglomeration in China based on MRSEI. Front. Ecol. Evol. 10:1013859. doi: 10.3389/fevo.2022.1013859
Edited by:
Xander Wang, University of Prince Edward Island, CanadaReviewed by:
Ehsan Elahi, Shandong University of Technology, ChinaSwapan Talukdar, Jamia Millia Islamia, India
Copyright © 2022 Shi, Wang, Zhao and Zhu. This is an open-access article distributed under the terms of the Creative Commons Attribution License (CC BY). The use, distribution or reproduction in other forums is permitted, provided the original author(s) and the copyright owner(s) are credited and that the original publication in this journal is cited, in accordance with accepted academic practice. No use, distribution or reproduction is permitted which does not comply with these terms.
*Correspondence: Qing Zhao, emhhb3FpbmdsYUAxNjMuY29t