
95% of researchers rate our articles as excellent or good
Learn more about the work of our research integrity team to safeguard the quality of each article we publish.
Find out more
ORIGINAL RESEARCH article
Front. Ecol. Evol. , 23 September 2022
Sec. Environmental Informatics and Remote Sensing
Volume 10 - 2022 | https://doi.org/10.3389/fevo.2022.1010400
This article is part of the Research Topic Meta-Scenario Computation for Social-Geographical Sustainability View all 60 articles
 Yifang Dai
 Tongtong Liu*
The increasingly intensifying global warming and urban heat island (UHIs) are seriously damaging the physical and mental health of urban residents. However, the spatiotemporal evolution of how high temperatures affect human health in megacities remains unclear. Therefore, in this study, with Tianjin during 2006–2020 as an example, and based on data from meteorological stations, Landsat remote sensing images, and point of interest big data, this study applied hot- and cold-spot statistics and remote sensing retrieval in numerical modeling and established an appraisal system to assess how and to what extent UHIs affect resident health. The results showed that the overall influence of UHIs on respiratory and cardiovascular diseases and mental health increased to 373 km2 in area and two levels in intensity; the influence was mainly concentrated in the downtown area, with a rising influence level. Owing to the dual-core structure of the city, the influence was distributed along the main traffic lines in Binhai New District, having a strong influence in the area mainly concentrated in the southeastern part. Many cold spots clustered in the central urban area to cool the thermal environment: the cooled area was 6.5 times larger than the area of intense cooling influence. Our study provides a method for identifying health risks in urban spaces, lays a theoretical foundation to improve the planning of urban green space systems, and offers some decision-making guidance for the planning of healthy cities.
Recent years have witnessed serious global warming, frequent extreme weather conditions, and heatwaves (Huang et al., 2022). Accelerating urbanization exacerbates the effects of urban heat islands (UHIs), causing higher summer temperatures and seriously damaging the physical and mental health of residents (Ebi et al., 2021). By 2050, 6.252 billion people will live in cities, accounting for 68% of the world population (United Nations, 2018). Against the backdrop of global climate change, the high summer temperatures in China and the health risks they pose have become increasingly serious (Wang et al., 2020; Ren et al., 2022). The temperature in cities, which are highly intensive spaces for production and living, changes faster than that in the countryside. In China, a country where urbanization is accelerating and the urban thermal environment continues to change, urban residents suffer from the combined effects of global warming and UHIs (Huanchun et al., 2020). Therefore, UHIs must be managed to address problems related to the environmental health of cities.
In recent years, heat waves have occurred in cities, mainly due to two factors: global warming and UHIs (Silva et al., 2022). Urban areas with a crowded population and a serious thermal environment also suffer from high brightness (Chen et al., 2022), and the thermal environment is related to the spatial structure and ventilation corridor of a city (Luo et al., 2021; You et al., 2021). UHIs mainly form through the following processes: underlying surfaces absorb more solar radiation in urban areas, human production and living activities release more heat, less heat evaporates from cities, and the average wind speed in cities is lower, transmitting less heat outward (Niu et al., 2021; Fu et al., 2022). The main measure implemented to alleviate the health risks in urban thermal environments is to optimize the functional spaces in a city based on land, such as by building cooling and ventilation corridors (Yang et al., 2020; Song et al., 2022). UHIs are a typical environmental result of urban microclimates, which are high spatial heterogeneity [14]. Hence, the spatial layout of the heat islands must be examined. Huang et al. (2021) identified the spatial features and patterns of UHIs and proposed planning and design strategies to reduce the health risks posed by UHIs (Wang et al., 2019). The macro exposure–response mechanism between the human body and temperature was identified, and policy suggestions were provided for public health and safeguards for different groups of people.
At high temperatures, humans struggle to adjust to their environment. Once the temperature exceeds the upper tolerance limit, heat waves may directly affect human health, leading to a higher incidence and mortality for certain diseases (Tian et al., 2021). However, as people in different cities or regions vary in adaptability and vulnerability, and they widely vary in background information (age, sex, geographical location, socioeconomic status, health condition, and medical level), different researchers have applied different methods of analyzing the effects of heat waves. In terms of deaths caused by heat waves, the elderly face the highest risk (Conti et al., 2004). Older people and patients suffer from the highest mortality during heat waves, which is usually related to cardiovascular, cerebrovascular, and respiratory diseases (Tan and Wang, 2004). In addition, during heat waves, patients with chronic diseases, such as mental disorders, diabetes, and lung, cardiovascular, and cerebrovascular diseases, are at a higher risk (Kovats and Hajat, 2008). A meta-analysis showed that patients with lung diseases or diabetes have a higher mortality risk during heatwaves (Bunker et al., 2016; Moon, 2021). In addition, on heat wave days in 2003, the mortality of patients with cardiovascular diseases in Europe rose by 30% (Kenny et al., 2010). Liu and Zhang (2010) examined daily non-accidental deaths and deaths due to respiratory diseases in Beijing and found that heat waves take 2–3 days to affect non-accidental deaths and 2–5 days to affect deaths due to respiratory diseases. In particular, with higher temperature and humidity, heat waves more strongly influence deaths due to respiratory diseases. Studies on the mortality of different diseases in 272 Chinese cities during 2013-2015 found that the attributed risks of respiratory diseases (J00-J99) and cardiovascular diseases (I00-I99) caused by temperature were 10.57% and 17.48%, respectively (Chen et al., 2018). Meanwhile, more studies are needed to analyze the spatiotemporal pattern of high-temperature health risks to reduce such risks.
High temperatures not only affect those with cardiovascular, cerebrovascular, and respiratory diseases (Linares and Díaz, 2008), but also increase the incidence and mortality of those with mental disorders. Ambient temperature is positively correlated with the admission rate of people with mental or behavioral disorders, including those with symptoms, dementia, affective disorders, neurosis, stress-related diseases, somatoform disorders, and psychological development disorders (Mullins and White, 2019). As heat waves become more frequent, patients with mental disorders will require increased care to prevent the incidence of mortality from increasing (Bando et al., 2017). To this end, epidemiologic studies focusing on the relationship between climate change and human health risk must be conducted to better understand how climate change affects our health and induces diseases, and to lay a theoretical foundation for assessing the health risk posed by high temperatures in different urban spaces.
The World Health Organization (WHO) stated that a healthy environment is part of a healthy city. Europe also treats urban planning and evaluation as an integral part of healthy cities (Barboza et al., 2021). In other words, the health risks posed by high temperatures can be mitigated through environmental engineering, urban planning, and landscape architecture (Daniel et al., 2018; Lee and Mayer, 2021). In detail, we can identify people vulnerable to heat waves, provide warnings or precautions, and prepare effective and targeted countermeasures to protect residents’ health, publicize healthcare knowledge, and reduce the medical burden due to heat waves (Kotharkar and Ghosh, 2022). In 1993, the National Health Commission of China (former Ministry of Health) attended a bidirectional meeting on urban health development convened by the WHO in Manila and initiated the planning of healthy cities. In 1995, based on the science of human settlements, Wu (1995) proposed buildings and cities that achieve environmental balance and pose zero harm to the physical and mental health of residents. Currently, researchers are focusing on improving the urban thermal environment through intelligent and data-driven analysis (Zheng et al., 2016; Shi et al., 2022).
The effect of global climate change, especially high temperatures, on human health has become an emerging research direction. However, studies are lacking on the spatiotemporal evolution of UHIs and the mechanism through which climate influences public health, hindering the development of reliable measures to improve ecological engineering. Specifically, further studies are required to explore the inner spaces in coastal cities. Therefore, in this study, we selected Tianjin, a typical city in south Asia, as an example; applied data from Landsat satellite imaging and electronic maps; and employed technologies such as ArcGIS, remote sensing, and spatial hotspots to analyze the influence of UHIs on residents’ health during 2006–2020 and the health risks they pose. The remainder of this paper is structured as follows: Section “Data and methods” describes the methods we used to assess the health risks posed by high temperatures, detect thermal fields, and identify hot and cold spots. Section “Results” describes the mechanism we used to evaluate the health risks posed by high temperatures in cities and our analyses of the driving factors and patterns of such risks. Sections “Discussion” and “Conclusion” present the discussion and conclusions, respectively.
Based on how temperature affects human physical and mental health and disease incidence and mortality, we drew upon the study of Huang et al. (2021) and chose to focus on respiratory diseases (J00–J99), cardiovascular diseases (I00–I99), and mental disorders (Huang et al., 2021). We selected emotional health, a factor relevant to the general public, as a factor influencing mental disorders. Regarding the influence of high temperatures on human health, we applied the grading standard of the Chinese Centers for Disease Control and Prevention in our data analysis to guarantee accuracy. Specifically, the weights in the assessment method were 0.5 for mental health and 0.5 for physical health (0.25 for respiratory diseases and 0.25 for cardiovascular disease; Table 1).
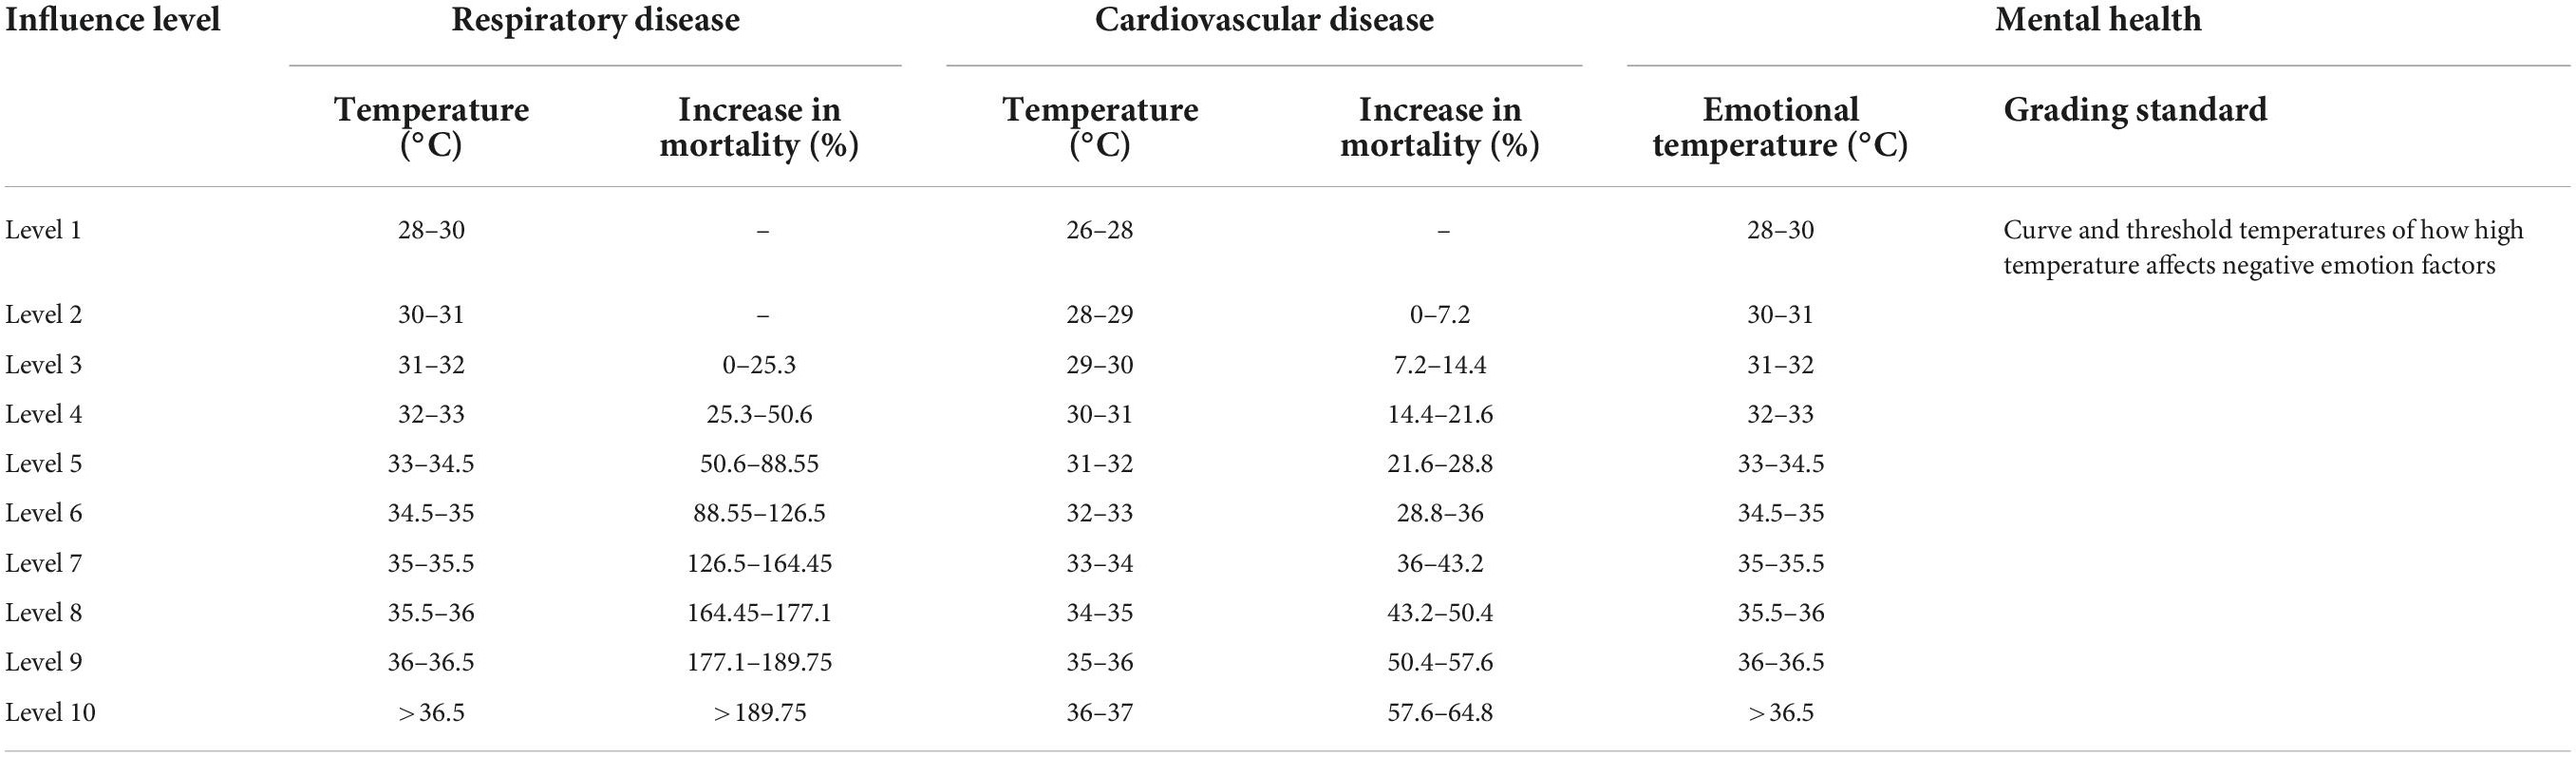
Table 1. Standards for assessing influence of high temperature on resident health.
The study area was downtown Tianjin (Figure 1), located at 117°13′45″–117°18′50″ and 39°4′25″–39°10′4″. Tianjin has an Asian monsoon climate and is located in the semihumid continental warm temperate zone. In the summer, the city experiences a subtropical high, mainly south wind, high temperatures (28°C on average in July), and heavy precipitation. In addition, Tianjin suffers from UHIs in summer, seriously affecting the comfort of residents as well as their respiratory, circulatory, and mental health.
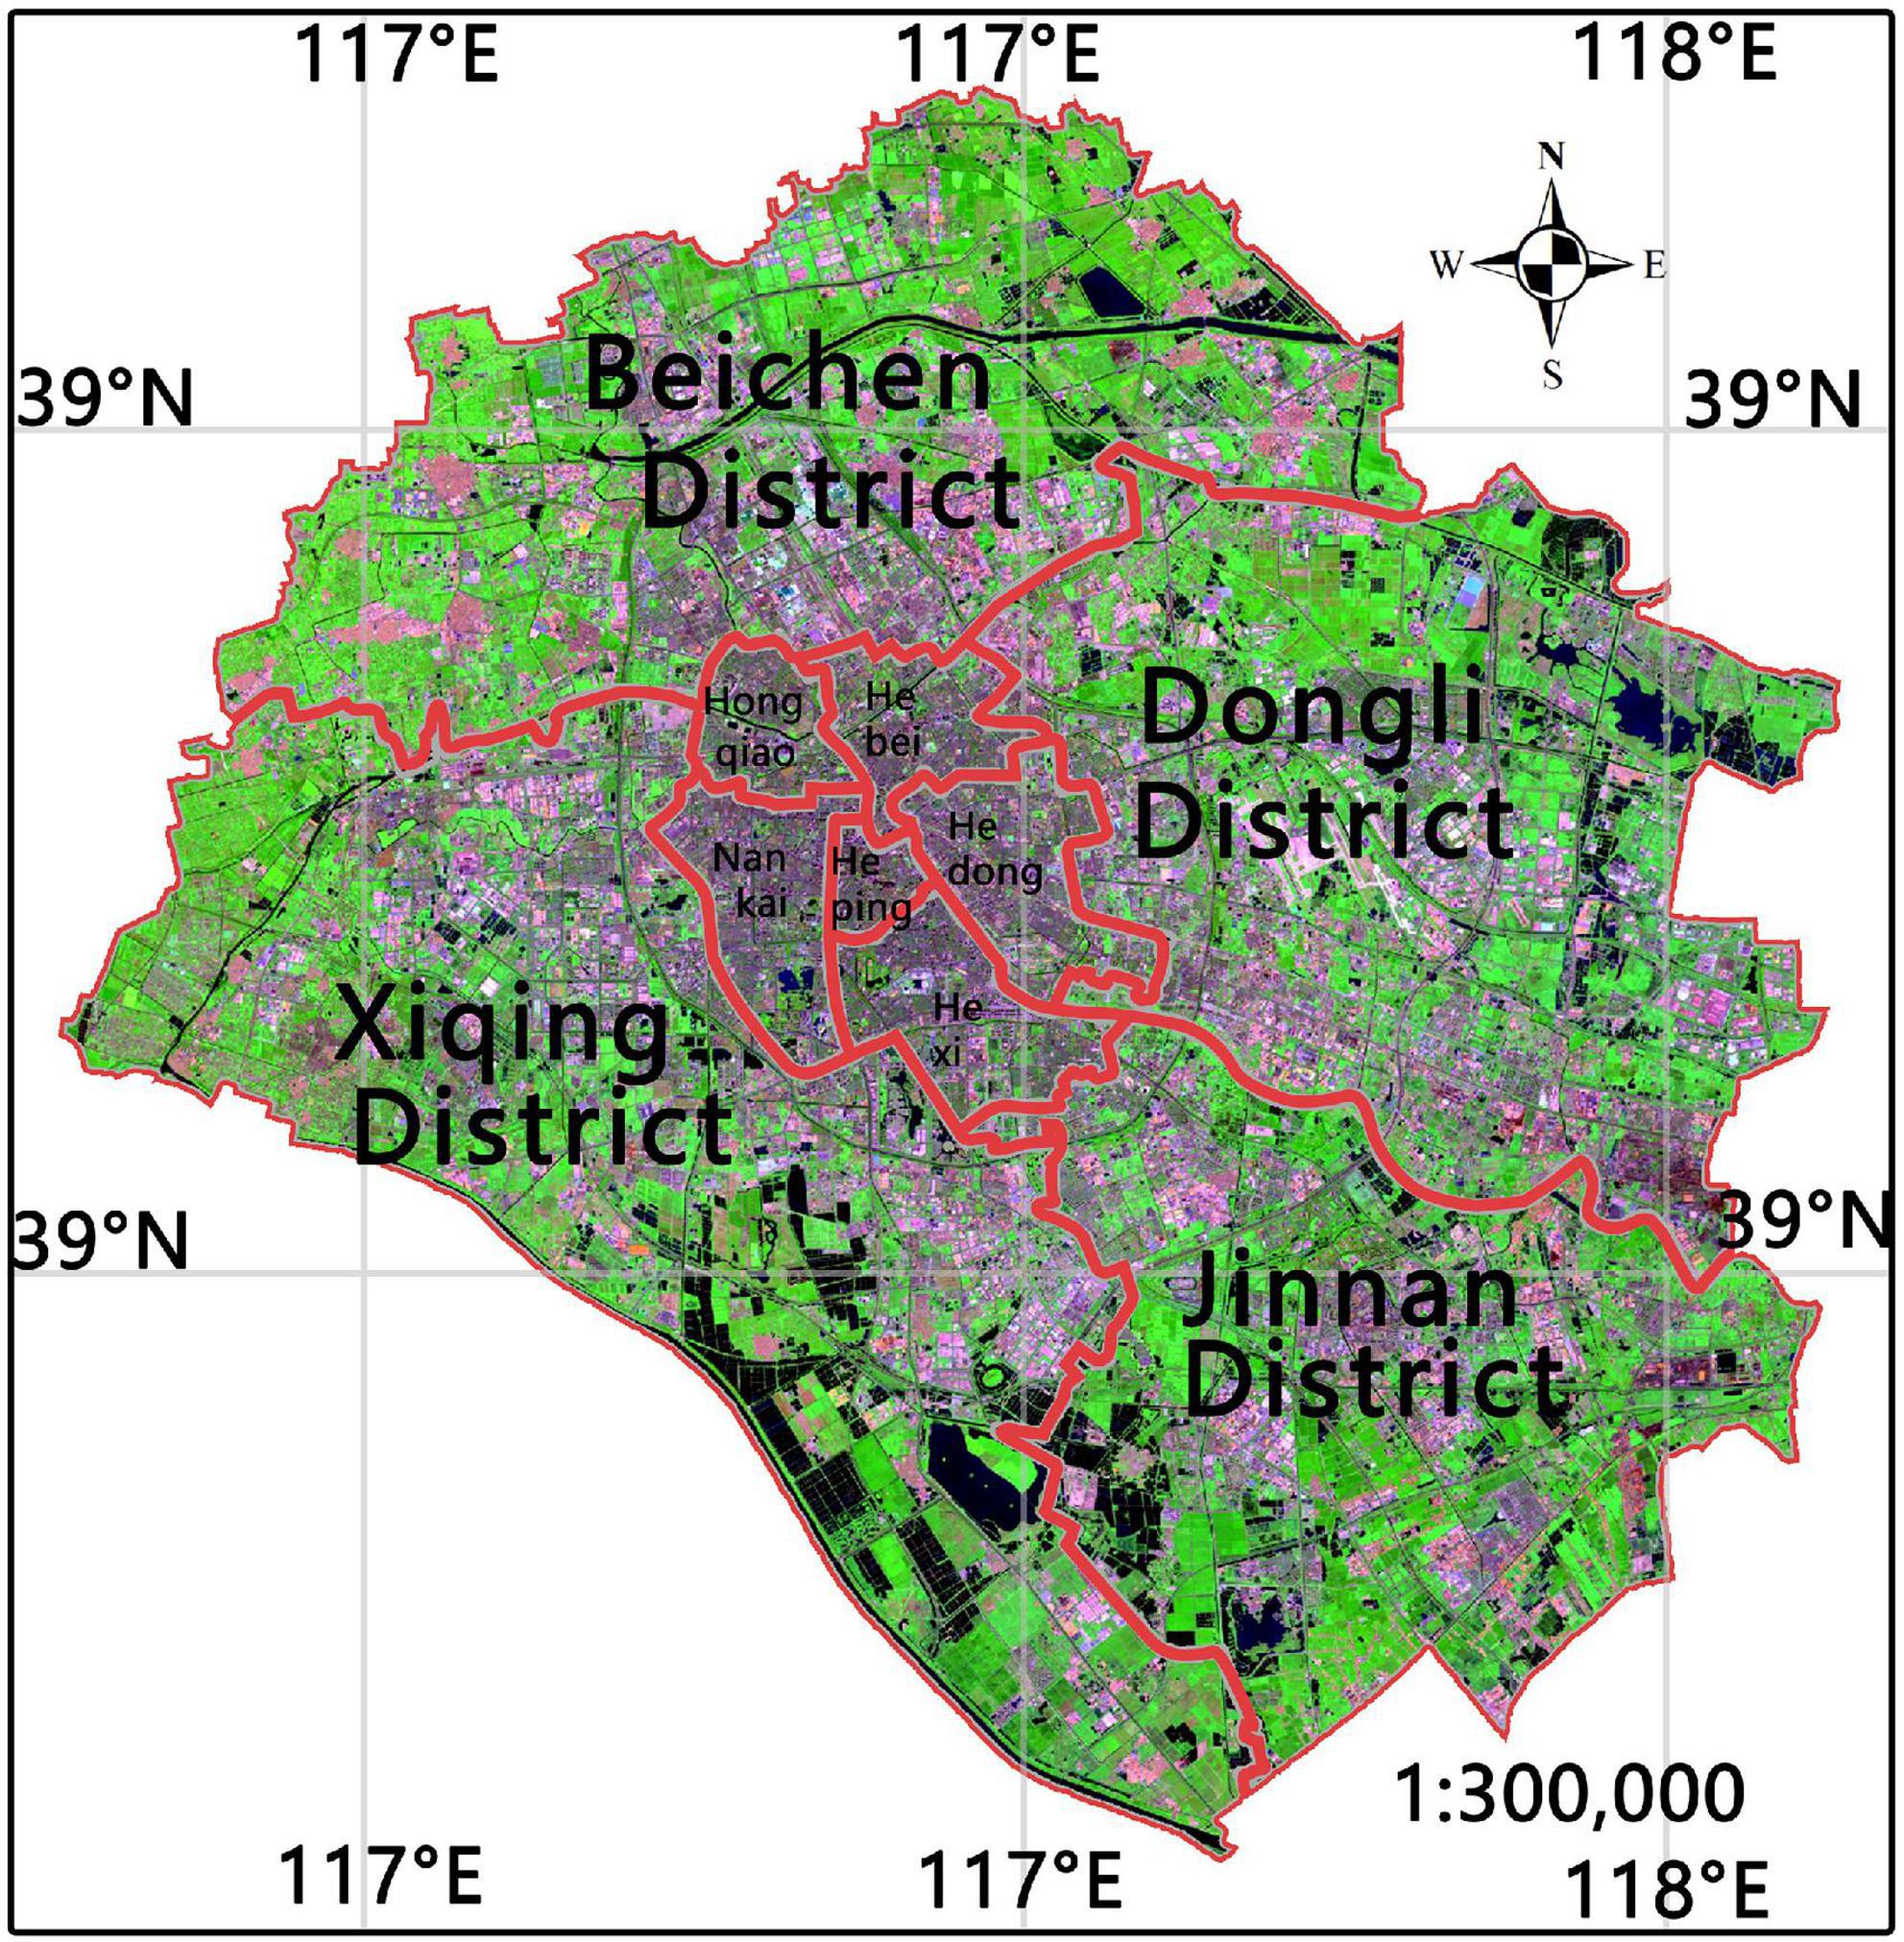
Figure 1. Overview of study area.
As a pillar metropolitan area in the center of the Asia-Pacific region, Tianjin has a population of approximately 13.73 million. Along with rapid urbanization, the urban area sprawls in a typical manner. Specifically, after the new Tianjin City Master Plan (2005–2020) was implemented in 2005, its urban area rapidly expanded, population density increased, industries clustered, and old low-rise buildings (one to two stories) were replaced by high-rise buildings, resulting in the typical UHI effects and changes in urban health space.
Spatial autocorrelation is an effective method used for probing the changes in spatial patterns. The key to the method lies in analyzing the correlation among spatial data, finding observed singular values, and revealing the spatial correlation and changes in spatial heterogeneity. Driving factors can be identified and extracted by examining the spatial patterns and time variation. Therefore, we employed the Getis-Ord to identify the spatial hot spots where UHIs affect human health during urbanization and to understand the spatial evolution of such effects (Formula 1).
where xj is the attribute value of factor j, wij is the spatial weight between factors i and j, and n is the sum of the factors. We calculated the spatial correlation of the Getis-Ord with |z| > 1.96, a significance level of p < 0.05, and a confidence level of 95% to identify whether spatial agglomeration existed and the spatial structure, and to determine if certain basic spatial processes exerted an influence.
We retrieved the urban temperature field to effectively assess the health risks posed by high temperatures, so we considered the baseline temperature, land surface temperature (LST), air temperature, and UHI intensity. The LST changes with the air temperature above the surface. Therefore, we selected 20 typical villages in the suburbs and recorded their average temperatures.
First, we used ENVI for LST then near-surface air temperature (NSAT) retrieval. Finally, we measured the UHI intensity based on the baseline temperature. Then, in accordance with the data from the meteorological stations and satellite images, we established a linear relationship between LST and daily average temperature using MATLAB.
Second, during LST retrieval, we obtained the 10th thermal waveband of the Landsat 8 satellite, along with ENVI and atmospheric correction. We performed radiometric calibration according to the NASA manual.1 We then calculated the normalized difference vegetation index (NDVI), vegetation coverage, and land surface emissivity (based on the formula proposed by Qin). Third, we calculated the LST. Finally, we used the linear relationship between LST and daily average temperature to obtain Equation (2):
where TA is the temperature of the UHI (°C), T is the temperature (°C), λ is the central wavelength of the TM6 band (11.5 μm), (where the Stefan-Boltzmann constant σ is 1.38 × 10⁻²³ J/K), Planck’s constant h is 6.626 × 10⁻³⁴ Js, the speed of light c is 2.998 × 10⁻⁸ m/s, and ε is the land surface emissivity.
In addition, we combined baseline temperature and UHI warming to comprehensively assess different factors influencing high urban temperatures. Specifically, we set the baseline temperature as 28.6°C, which is the average minimum temperature between 10:00 and18:00 in Tianjin from July 7 to August 7 (summer) in multiple years. After that, the heat island warming in different locations was added, to eliminate the influence of occasional rainy days, and to effectively assess the minimum influence of UHI on residents’ health, as well as the overall influence of temperature on human health.
We used Landsat 5 and 8 satellite images for UHI temperature retrieval and combined the baseline temperature between 10:00 and18:00 in the summer to identify the spatiotemporal patterns and layout of the urban thermal field during 2006–2020 in Tianjin (Figure 2). We divided the temperature field into five levels: low-temperature (<30°C), low–medium-temperature (30–31°C), medium-temperature (31–32°C), high-temperature (32–33°C), and extremely high-temperature (>33°C) zones.
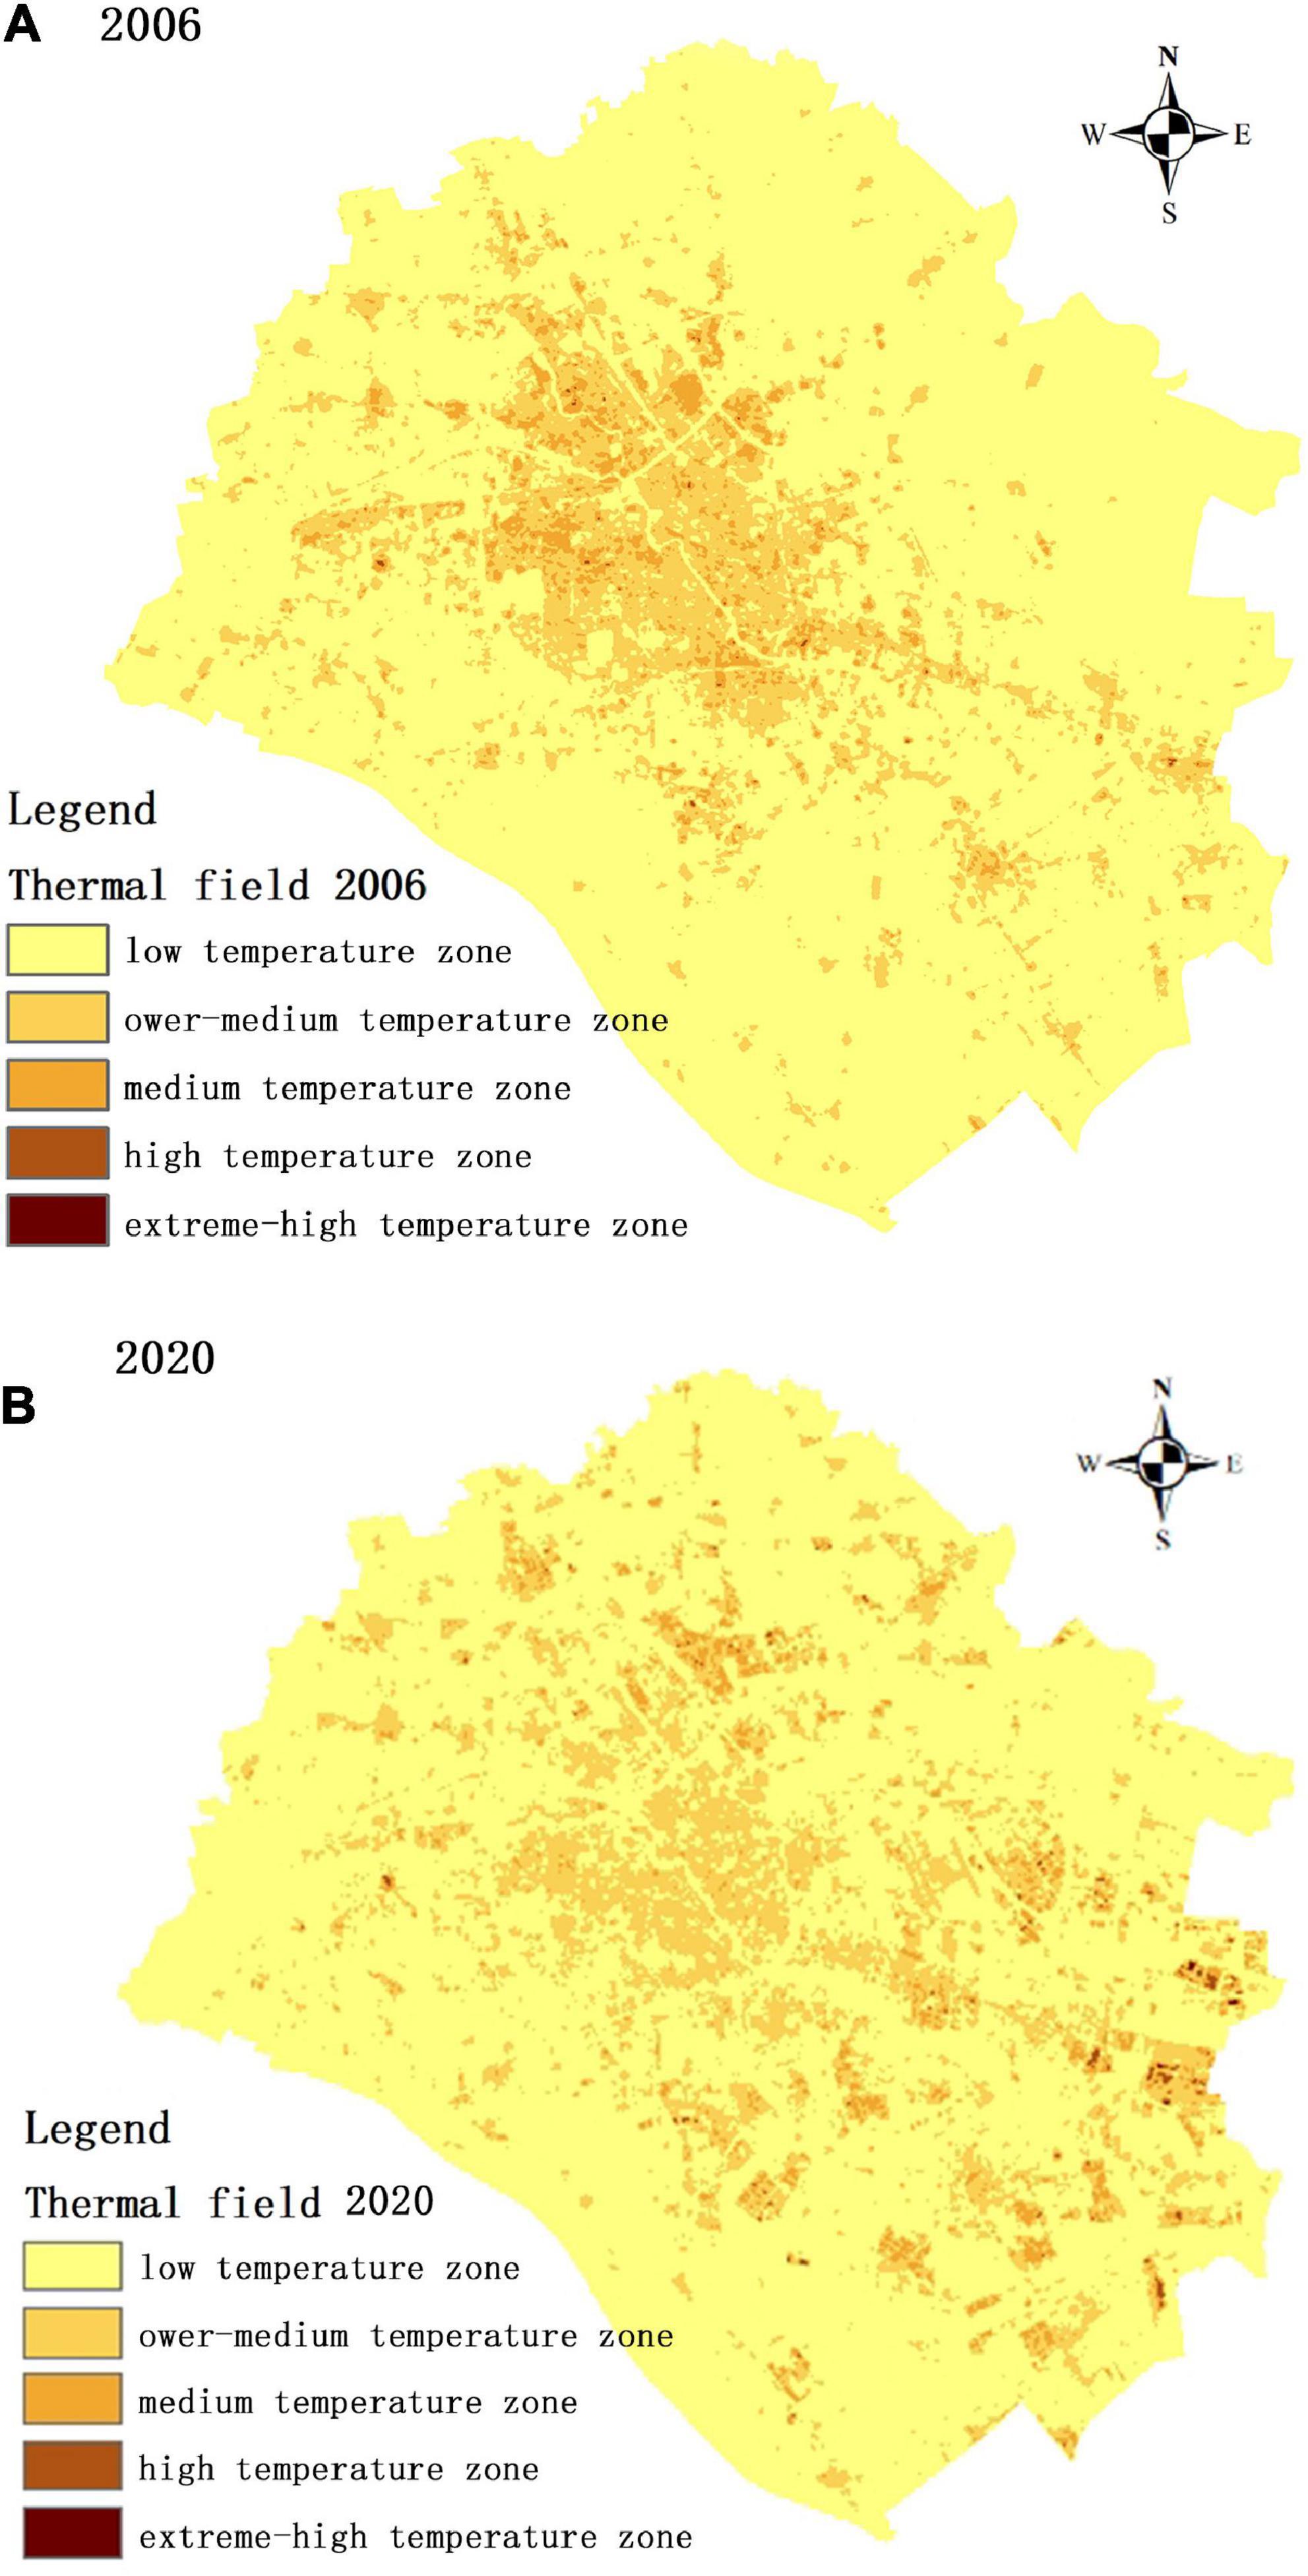
Figure 2. Changes in thermal field distribution from (A) 2006 to (B) 2020.
The results showed that in 2006, the low-temperature zone accounted for the largest proportion of the temperature zones, and the high-temperature zone was mainly concentrated in the six districts in central Tianjin: Heping, Hongqiao, Hebei, Nankai, Hexi, and Hedong Districts. Additionally, many urban heating elements weaken the cooling capacity of the city. In 2020, the medium- and high-temperature zones expanded from the downtown areas to the surroundings, with high-temperature zones scattered as small, yet high-density, patches. Tianjin has been rapidly urbanizing, and urban construction has expanded outward, breaking the original single-center pattern. Simultaneously, the green spaces were evenly distributed in the downtown area, mitigating the heating of the environment to some extent. In addition, the increases in high-temperature patches and artificial landscapes, and the lack of blue and green infrastructure have weakened the ability of the city to mitigate the effects of UHI, posing a threat to the emotional health of residents.
In this study, we combined the incidence and mortality of three typical diseases caused by high temperatures into a map of the UHIs to identify their influence on health during 2006–2020 (Figure 3). The results showed that the influence of UHIs on health gradually increased, with the level of influence increasing from mainly Levels 1 and 2 to Levels 2 and 3, expanding from the downtown area to the surroundings, and the areas of Level 3 and 4 zones increased 7 and 74 times, respectively. In addition, the areas with a low health influence were concentrated in the suburbs, while the medium- and high-level areas were divided into large patches by rivers, lakes, and belt-shaped green spaces and were distributed as circles around the downtown. In 2020, the downtown area changed from large single-level patches to scattered and fragmented patches. Meanwhile, in the suburbs, areas, where the influence on health was high, were clustered as groups, mainly concentrated on industrial land, large-area waterproof hardened surfaces, high-density building complexes, and business centers. The main reason is that in these areas, the hardened surface area is larger and green space is limited, so the area easily absorb heats and the temperature increases. Industrial heat sources release heat and raise the temperature in summer, and the lack of green space cannot mitigate the effects on UHIs.
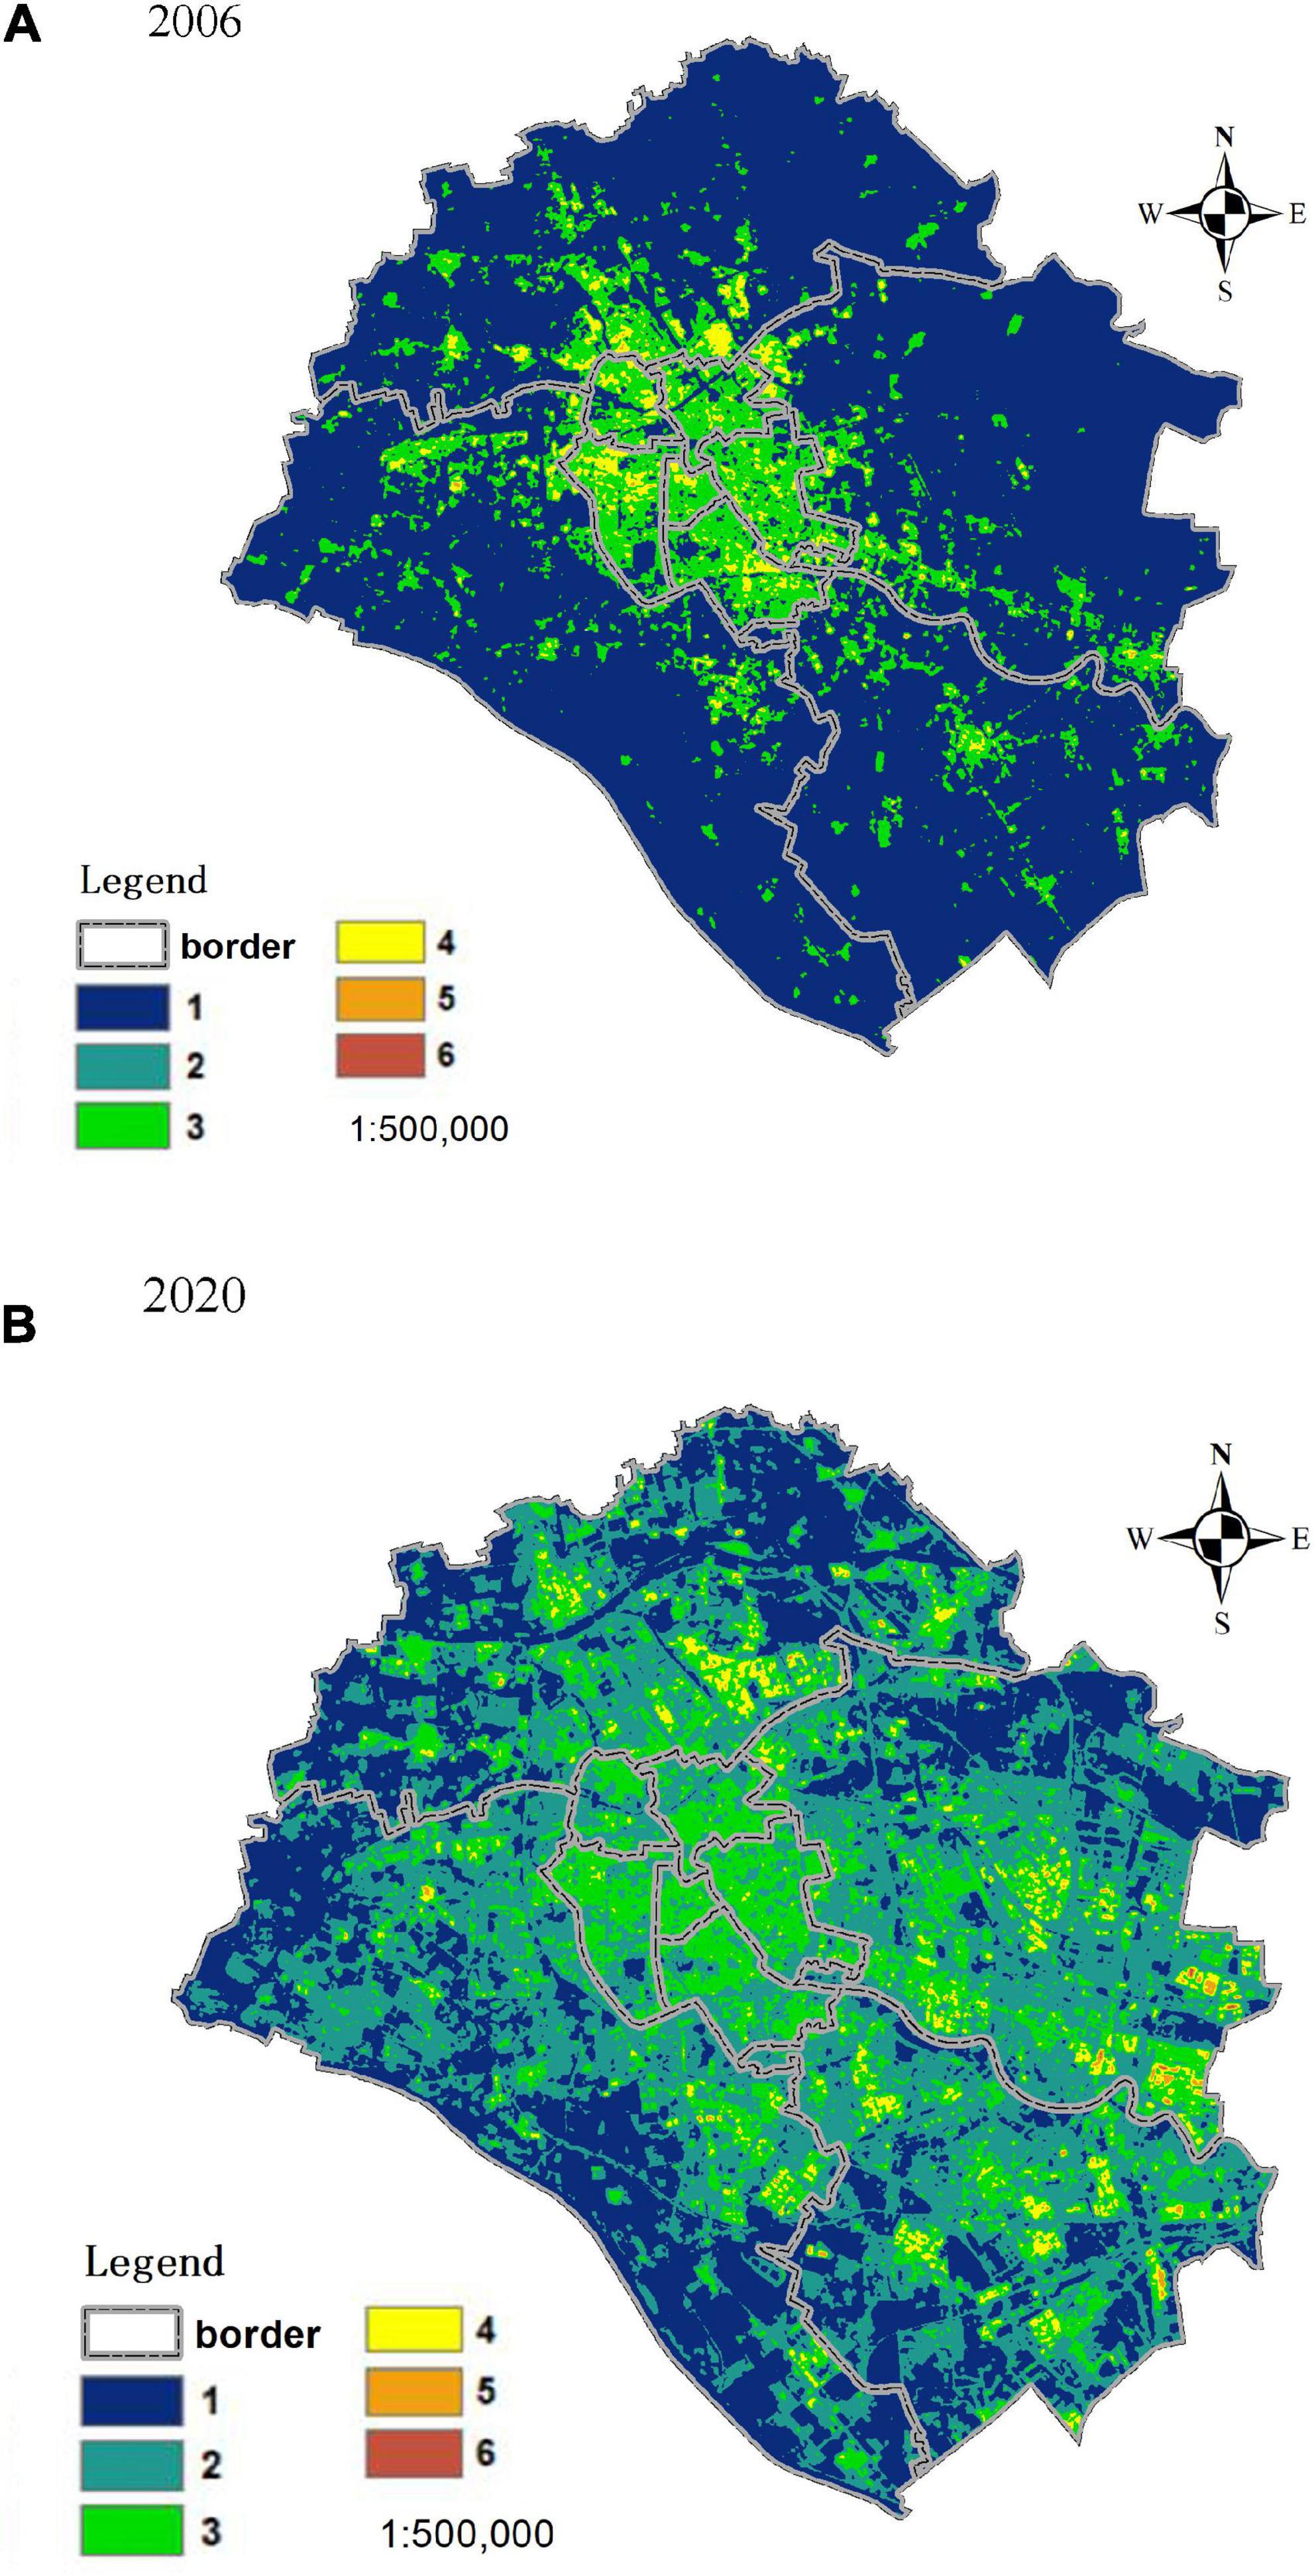
Figure 3. Spatial distribution of the influence of urban heat islands (UHIs) on health in (A) 2006 and (B) 2020.
Using ArcGIS, we explored and analyzed the cold and hot spots of the influence of UHIs on resident health during 2006–2020. Figure 4 shows that areas of severe health risk due to high temperatures mainly concentrated in the southeastern part of Binhai New District, covering the Tianjin Airport Economic Area, Dasi Industrial Park, and Tianjin Haihe Education Park, which the central area for the dual-core development in Tianjin. Therefore, the areas where health was seriously influenced by UHI distributed along the main traffic lines, with hot spots concentrated in the core of traffic lines. Cold spots separated the hot spots in the downtown area. This has mainly occurred owing to the progress in urban construction, urban planning, and development strategies and policies on urban spaces. After the Tianjin City Master Plan (2005–2020) was implemented, human health in developed areas was highly influenced, especially in areas where industries were clustered.
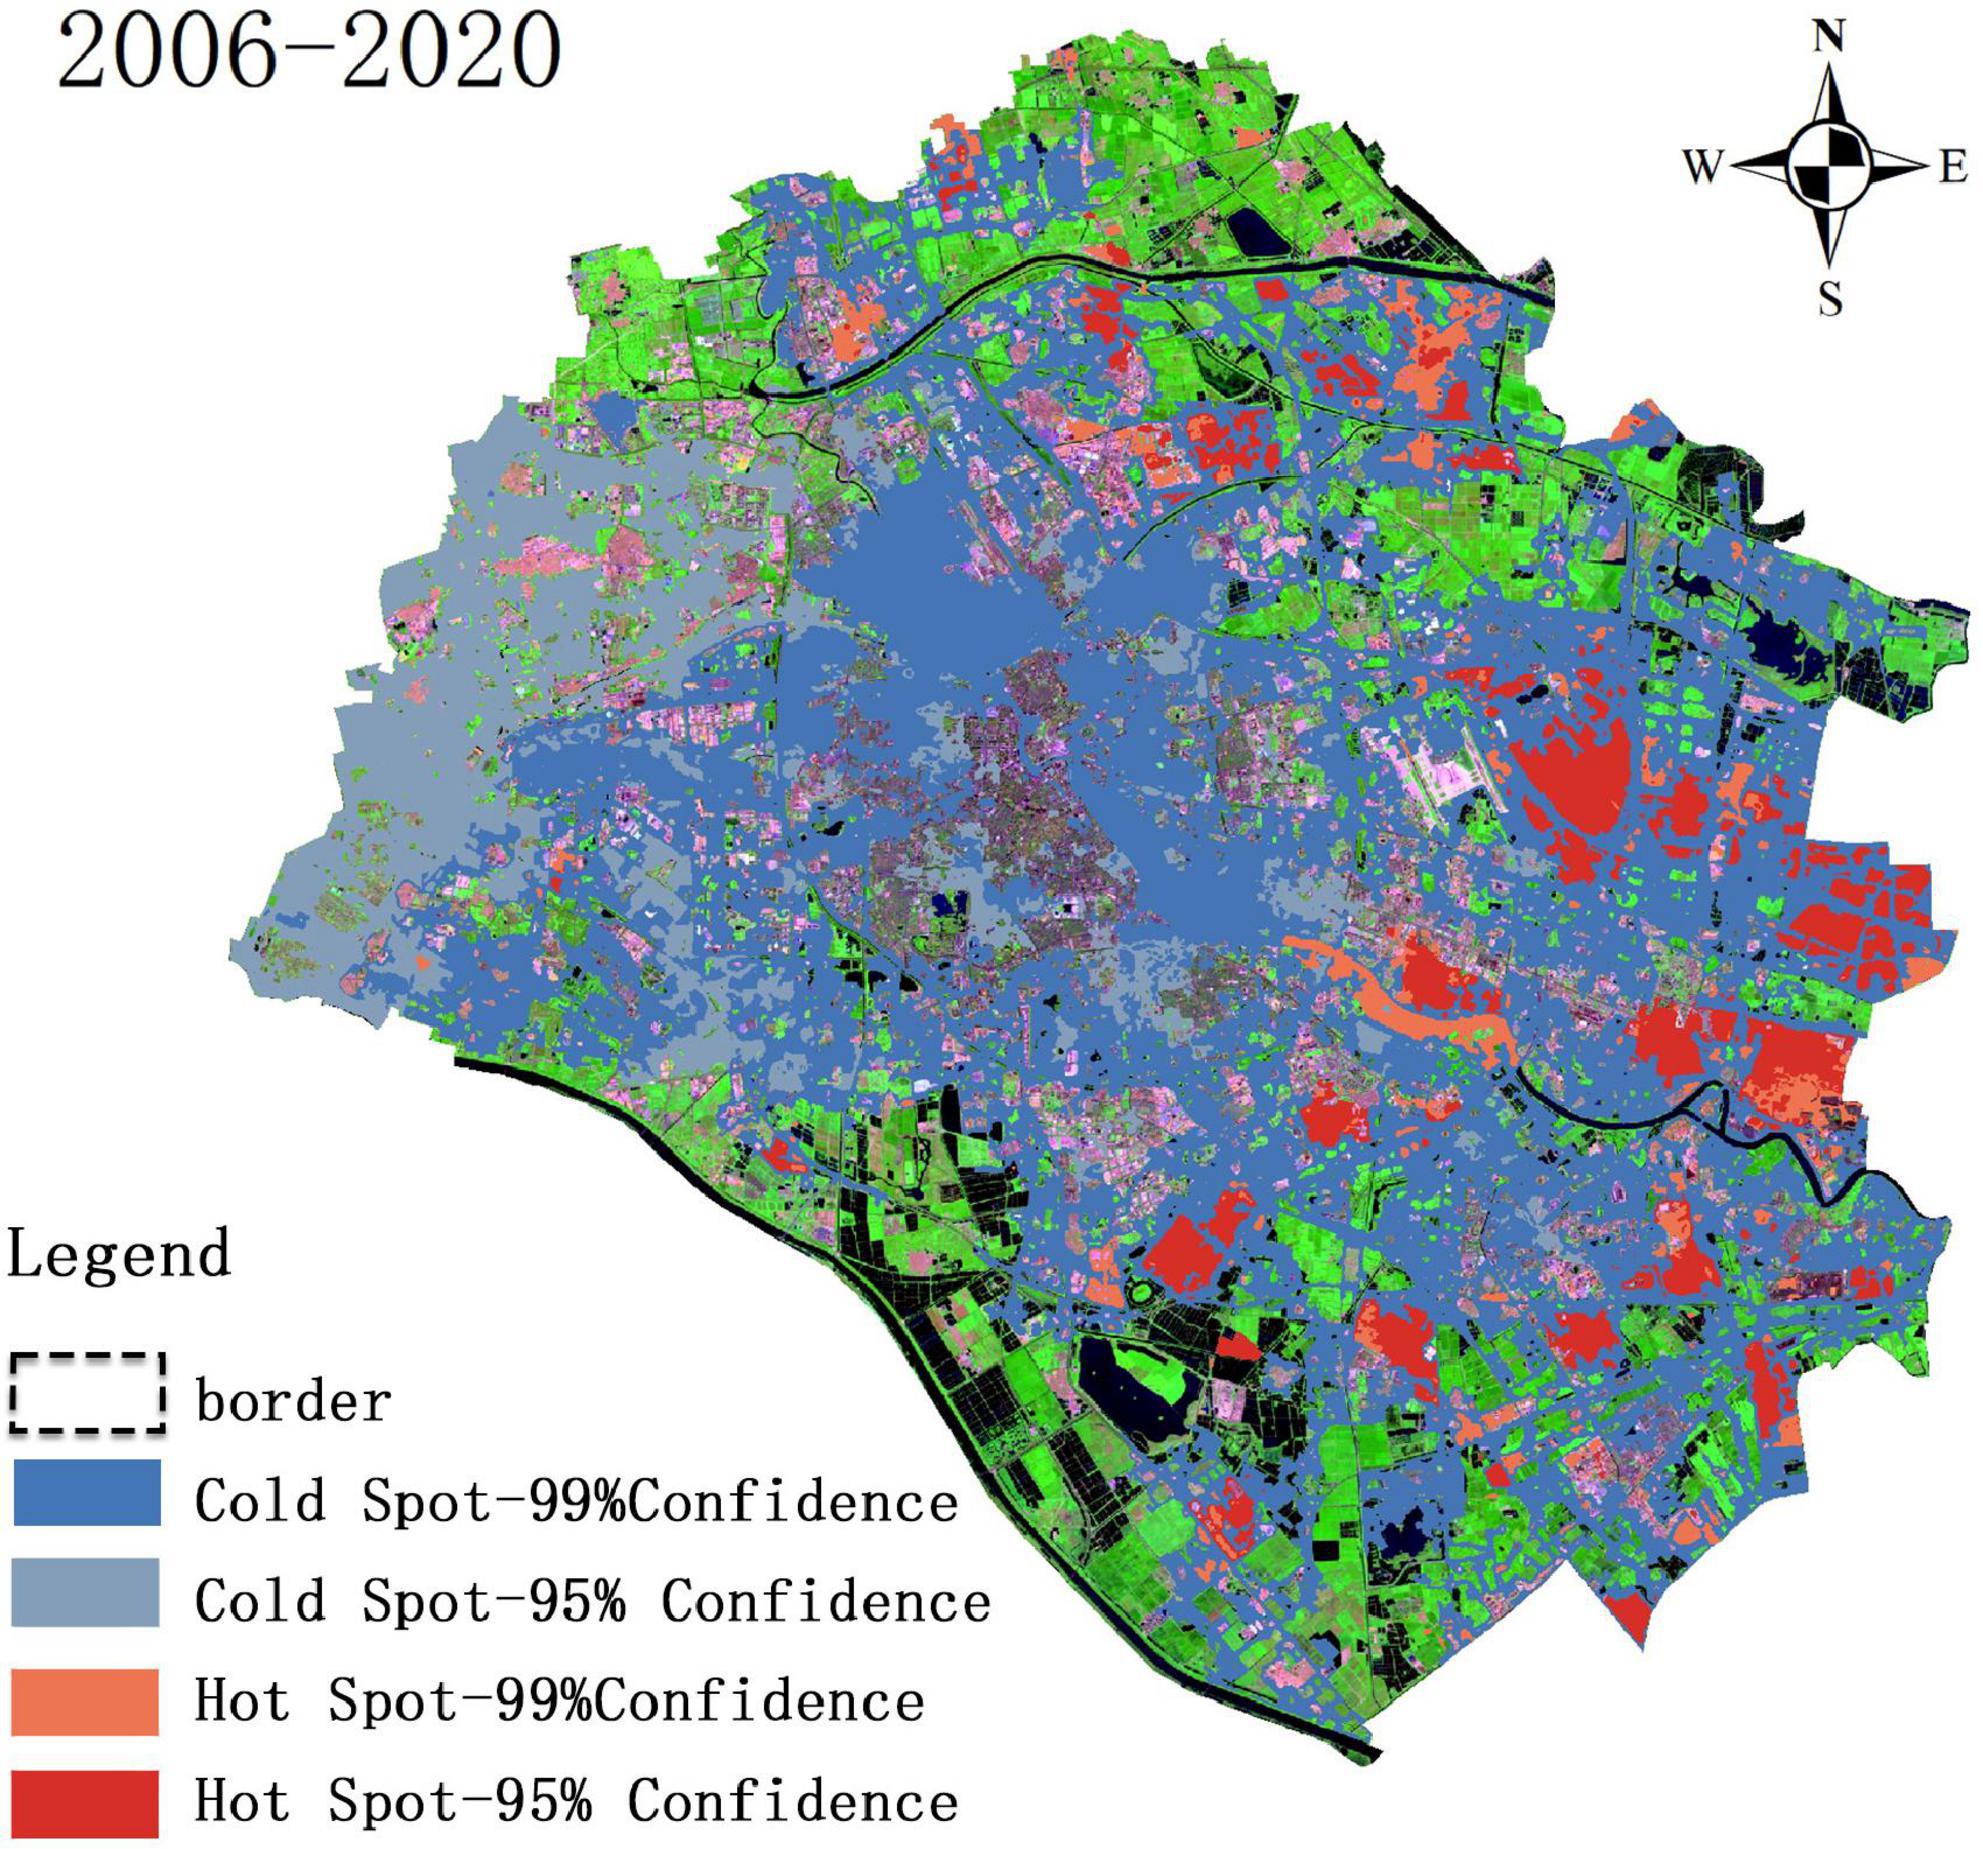
Figure 4. Distribution of cold and hot spots of health risk posed by high temperatures during 2006–2020.
The zones where health was less influenced were concentrated on the outskirts of downtown Tianjin, covering a relatively large area. The main reason for this finding that as the city services and the economic center have been improved and perfected, Tianjin has become less involved in production, and large enterprises and industries gradually moved away, thus reducing the effects of local UHIs; however, the influence of temperature on health has been exacerbated in the margins of the downtown areas. The land use in these areas is mostly low-rise buildings, composed of metals and stones, and the vegetation coverage is low. In addition, such areas discharge artificial heat, posing serious health risks.
The large areas of cold spots in downtown Tianjin helped to mitigate the influence of the high-temperature environment on the health of residents for the following main reasons: high-rise buildings protect the surface from solar radiation; local climate zones with high-rise buildings provide more open, ventilated green spaces; high-density low-rise buildings in the downtown area were upgraded and refurbished. Green space structures along the seashores and river banks separated the different levels of thermal environmental influence on health.
The influence of summer UHIs on the health of residents is mainly reflected in respiratory and cardiovascular diseases, and mental health issues, and this influence spatially varies (Huang et al., 2020). In Beijing, areas of higher health risk caused by UHIs were concentrated within the Third Ring Road; due to insufficient cooling facilities and green spaces, residents in the suburbs were also exposed to increased health risks (Huang et al., 2021). These results are in line with ours: hotspots of urban health risk were distributed in concentrated industrial districts and areas of high-intensity urban construction in the suburbs.
In this study, we obtained temperature data from remote sensing images and meteorological stations to assess the health risk posed by high temperatures to residents. This method produced more accurate results than LST retrieval using only remote sensing images. Currently, researchers have mostly retrieved LST from Landsat and MODIS data. Landsat data have a resolution of 100 m, so are suitable for analyzing mixed pixels in microurban studies. MODIS data have a resolution of 1 km, so are more suitable for regional-scale studies.
Researchers have mostly analyzed the relationship between temperature and mental health in the form of summaries (Arbuthnott and Hajat, 2017) or statistics; we instead focused on the spatial distribution of mental health risks in cities. Due to the complex evolution of and forces driving urban form (Ren et al., 2022), assessing the health influence of UHIs requires the combination of various theories with many practical cases. The findings of our study on Tianjin city revealed the features of spatial transfer in the influence of UHIs on urban resident health, from clusters to scattered groups. Therefore, we propose adding more green spaces and water areas in high-risk areas and taking full advantage of the cooling benefits provided by large wetlands and water bodies around Tianjin to improve urban ventilation.
With Tianjin as the case study, we explored the characteristics of the spatial evolution of the health risks posed by high temperature to residents during urbanization. However, further temporal analysis of these changes is required. We study selected Landsat remote sensing images covering nearly 15 years to analyze the changes in how summer UHIs influence the health of residents, without comparing how different seasons or temperatures at different times affect such influences. Moreover, limited by the scale of the data, we could not further refine the time scale to further analyze the changes in how the thermal environment affects the health of residents, so our results cannot serve as a reference for implementing management policies in real time.
We analyzed the differences in the spatial distribution of the influence of UHIs on resident health in a city. However, our spatial scale was not sufficiently refined. In the future, we will conduct refined empirical studies on the differences in the emotional health of residents in different inner-urban landscapes such as parks and squares. In addition, we will optimize the landscape index by including indicators applicable to the planning of healthy cities to offer references for urban planning and construction. Additionally, because of the lack of meteorological data for the years of the corresponding remote sensing images, we only employed remote sensing images to analyze changes in the UHIs, without performing a verification analysis using high-resolution spatiotemporal data.
Based on data from multiple sources, such as meteorological stations, satellite images, and points of interest, in this study, we analyzed the spatial patterns and processes of the influence of UHIs on health, and the spatial changes in hot spots of climate-related health impacts in Tianjin during 2006–2020. Our conclusions were as follows:
(1) With increasing UHI area in summer, both the high- and extreme-high-temperature areas expanded. The influence of UHIs on resident health increased by two levels in intensity and 373 km2 in area, with areas of high-level influence moving from the downtown area to the suburbs.
(2) The locations where the thermal environment influenced health notably shifted toward the eastern part of Tianjin, along the major traffic lines in the dual-core structure in Tianjin; the concentrated high-level influence area transformed into scattered and fragmented patches, and the properties and landscapes of the transferred spaces also contributed to this influence.
(3) The distribution of cold and hot spots of health risk due to high temperature showed that, affected by the changes in the layout of the urban function of Tianjin and with a confidence coefficient surpassing 95%, the zones where the influence was lessened (963 km2) were located within the outer ring road, around the downtown area. The hot spots (135 km2) were expanding in areas concentrated in the key development areas of Tianjin.
The original contributions presented in this study are included in the article/supplementary material, further inquiries can be directed to the corresponding author.
YD: conceptualization, methodology, data curation, formal analysis, writing—original draft preparation, review and editing, investigation, and visualization. TL: methodology, data curation, formal analysis, writing—original draft preparation, review and editing, investigation, and visualization. Both authors contributed to the article and approved the submitted version.
The authors declare that the research was conducted in the absence of any commercial or financial relationships that could be construed as a potential conflict of interest.
All claims expressed in this article are solely those of the authors and do not necessarily represent those of their affiliated organizations, or those of the publisher, the editors and the reviewers. Any product that may be evaluated in this article, or claim that may be made by its manufacturer, is not guaranteed or endorsed by the publisher.
Arbuthnott, K. G., and Hajat, S. (2017). The health effects of hotter summers and heat waves in the population of the United Kingdom: a review of the evidence. Environ. Health 16:119. doi: 10.1186/s12940-017-0322-5
Bando, D. H., Teng, C. T., Volpe, F. M., de Masi, E., Pereira, L. A., and Braga, A. L. (2017). Suicide and meteorological factors in São Paulo, Brazil, 1996–2011: a time-series analysis. Braz. J. Psychiatry 39, 220–227. doi: 10.1590/1516-4446-2016-2057
Barboza, E. P., Cirach, M., Khomenko, S., Iungman, T., Mueller, N., Barrera-Gómez, J., et al. (2021). Green space and mortality in European cities: a health impact assessment study. Lancet Planet. Health 5, e718–e730. doi: 10.1016/S2542-5196(21)00229-1
Bunker, A., Wildenhain, J., Vandenbergh, A., Henschke, N., Rocklöv, J., Hajat, S., et al. (2016). Effects of air temperature on climate-sensitive mortality and morbidity outcomes in the elderly: a systematic review and meta-analysis of epidemiological evidence. EBiomedicine 6, 258–268. doi: 10.1016/j.ebiom.2016.02.034
Chen, R. J., Yin, P., Wang, L. J., Liu, C., Niu, Y., Wang, W. D., et al. (2018). Association between ambient temperature and mortality risk and burden: a time series study in 272 main Chinese cities. BMJ 363:k4306. doi: 10.1136/bmj.k4306
Chen, Y., Yang, J., Yang, R. X., Xiao, X. M., and Xia, J. H. (2022). Contribution of urban functional zones to spatial distribution of urban thermal environments. Build. Environ. 216:109000. doi: 10.1016/j.buildenv.2022.109000
Conti, S., Meli, P., Minelli, G., Solimini, R., Toccaceli, V., Vichi, M., et al. (2004). “Epidemiological study of mortality during summer 2003 in Italian regional capitals: results of a rapid survey,” in Proceedings of the 4th Ministerial Conference on Environment and Health, Budapest, 109–120.
Daniel, M., Lemonsu, A., and Viguié, V. (2018). The role of watering practices in large-scale urban planning strategies to face heat wave risks in future climates. Urban Clim. 23, 287–308. doi: 10.1016/j.uclim.2016.11.001
Ebi, K. L., Capon, A., Berry, P., Broderick, C., de Dear, R., Havenith, G., et al. (2021). Hot weather and heat extremes: health risks. Lancet 398, 698–708. doi: 10.1016/S0140-6736(21)01208-3
Fu, X. C., Yao, L., Xu, W. T., Wang, Y. X., and Sun, S. (2022). Exploring the multitemporal surface urban heat island effect and its driving relationship in the Beijing-Tianjin-Hebei urban agglomeration. Appl. Geogr. 144:102714. doi: 10.1016/j.apgeog.2022.102714
Huanchun, H., Hailin, Y., Xin, D., Cui, H., Liu, Z., Wei, L., et al. (2020). The factors influencingfactors urban thermal field intensity were analyzed using big data-based GIS. Sustain. Cities Soc. 55:102024. doi: 10.1016/j.scs.2020.102024
Huang, H. C., Deng, X., Yang, H. L., Zhou, X. H., and Jia, Q. (2020). Spatio-temporal mechanism underlying the effect of urban heat Island on cardiovascular diseases. Iran. J. Pub. Health 49, 1455–1466. doi: 10.18502/ijph.v49i8.3889
Huang, H. C., Yang, H. L., Chen, Y. L., Chen, T. N., Bai, L., and Peng, Z. R. (2021). Urban green space optimization based on a climate health risk appraisal: a case study of Beijing City, China. Urban For. Urban Greening 62:127154. doi: 10.1016/j.ufug.2021.127154
Huang, H. C., Zhou, X. H., Qu, Y. C., and Zhang, H. (2022). Spatial effects of climate warming on health risks due to urban heat exposure: a case study of China. DYNA 97, 162–168. doi: 10.6036/10426
Kenny, G. P., Yardley, J., Brown, C., Sigal, R. J., and Jay, O. (2010). Heat stress in older individuals and patients with common chronic diseases. CMAJ 182, 1053–1060. doi: 10.1503/cmaj.081050
Kotharkar, R., and Ghosh, A. (2022). Progress in extreme heat management and warning systems: a systematic review of heat health action plans (1995–2020). Sustain. Cities Soc. 76:103487. doi: 10.1016/j.scs.2021.103487
Kovats, R. S., and Hajat, S. (2008). Heat stress and public health: a critical review. Annu. Rev. Public Health 29, 41–55. doi: 10.1146/annurev.publhealth.29.020907.090843
Lee, H., and Mayer, H. (2021). Solar elevation impacts the heat stress mitigation of pedestrians on tree-lined sidewalks of E-W street canyons under Central European heat wave conditions. Urban For. Urban Greening 58:126905. doi: 10.1016/j.ufug.2020.126905
Linares, C., and Díaz, J. (2008). Impact of high temperatures on hospital admissions: comparative analysis with previous studies on mortality (Madrid). Eur. J. Public Health. 18, 317–322. doi: 10.1093/eurpub/ckm108
Liu, L., and Zhang, J. L. (2010). Relationship between heatwaves and daily death from non-accidental death and respiratory disease: a case-crossover study. J. Environ. Health. 02, 95–99. doi: 10.16241/j.cnki.1001-5914.2010.02.010
Luo, X., Yang, J., Sun, W., and He, B. J. (2021). Suitability of human settlements in mountainous areas from the perspective of ventilation: a case study of the main urban area of Chongqing. J. Cleaner Prod. 310:127467. doi: 10.1016/j.jclepro.2021.127467
Moon, J. (2021). The effect of the heatwave on the morbidity and mortality of diabetes patients: a meta-analysis of the era of the climate crisis. Environ. Res. 195:110762. doi: 10.1016/j.envres.2021.110762
Mullins, J. T., and White, C. (2019). Temperature and mental health: evidence from the spectrum of mental health outcomes. J. Health Econ. 68:102240. doi: 10.1016/j.jhealeco.2019.102240
Niu, L., Zhang, Z. F., Peng, Z., Liang, Y. Z., Liu, M., Jiang, Y. Z., et al. (2021). Identifying surface urban heat island drivers and their spatial heterogeneity in China’s 281 cities in China: an empirical study based on multiscale geographically weighted regression. Remote Sens. 13:4428. doi: 10.3390/rs13214428
Ren, J., Yang, J., Zhang, Y., Xiao, X., Xia, J. C., Li, X., et al. (2022). Exploring the thermal comfort of urban buildings based on climate zones. J. Cleaner Prod. 340:130744. doi: 10.1016/j.jclepro.2022.130744
Shi, Z., Yang, J., Zhang, Y., Xiao, X., and Xia, J. C. (2022). Urban ventilation corridors and spatiotemporal divergence patterns of urban heat island intensity: a local climate zone perspective. Environ. Sci. Pollut. Res. Int. 1–13. doi: 10.1007/s11356-022-21037-9
Silva, R., Carvalho, A. C., Pereira, S. C., Carvalho, D., and Rocha, A. (2022). Lisbon urban heat island in future urban and climate scenarios. Urban Clim. 44:101218. doi: 10.1016/j.uclim.2022.101218
Song, J. L., Lu, Y., Zhao, Q., Zhang, Y. Q., Yang, X. C., Chen, Q., et al. (2022). Effect modifications of green space and blue space on heat-mortality association in Hong Kong, 2008–2017. Sci. Total Environ. 838:156127. doi: 10.1016/j.scitotenv.2022.156127
Tan, J. G., and Wang, J. X. (2004). The impacts of heat waves on human health and its research methods. Clim. Environ. Res. 04, 680–686.
Tian, L., Lu, J., Li, Y. C., Bu, D., Liao, Y., and Wang, J. (2021). Temporal characteristics of urban heat island and its response to heat waves and energy consumption in the mountainous Chongqing, China. Sustain. Cities Soc. 75:103260. doi: 10.1016/j.scs.2021.103260
Wang, J., Feng, J. M., Yan, Z. W., and Chen, Y. (2020). Future risks of unprecedented compound heat waves over three vast urban agglomerations in China. Earths Future 8:e2020EF001716. doi: 10.1029/2020EF001716
Wang, S. Z., Huang, H. C., Hao, C., Cao, L., and Liu, T. (2019). Sensitivity microscale of urban heat island reduction by green space. Open House Int. 44, 147–151. doi: 10.1108/OHI-03-2019-B0034
Wu, L. Y. (1995). Concluding speech at the “Human Gathering Environment and the 21st century Chinese Architecture Symposium” on the development of human settlements facing the new century. Hua Zhong Archit. 02, 1–9.
Yang, J., Wang, Y. C., Xiu, C. L., Xiao, X. M., Xia, J. H., and Jin, C. (2020). Optimizing local climate zones to mitigate urban heat island effect in human settlements. J. Cleaner Prod. 275:123767. doi: 10.1016/j.jclepro.2020.123767
You, H. L., Yang, J., Xue, B., Xiao, X. M., Xia, J., Jin, C., et al. (2021). Spatial evolution of population change in Northeast China during 1992–2018. Sci. Total Environ. 776:146023. doi: 10.1016/j.scitotenv.2021.146023
Keywords: urban heat island, health damage, mechanism features, spatiotemporal, residents health
Citation: Dai Y and Liu T (2022) Spatiotemporal mechanism of urban heat island effects on human health—Evidence from Tianjin city of China. Front. Ecol. Evol. 10:1010400. doi: 10.3389/fevo.2022.1010400
Received: 03 August 2022; Accepted: 29 August 2022;
Published: 23 September 2022.
Edited by:
Jun Yang, Northeastern University, ChinaReviewed by:
Chao Yang, Shenzhen University, ChinaCopyright © 2022 Dai and Liu. This is an open-access article distributed under the terms of the Creative Commons Attribution License (CC BY). The use, distribution or reproduction in other forums is permitted, provided the original author(s) and the copyright owner(s) are credited and that the original publication in this journal is cited, in accordance with accepted academic practice. No use, distribution or reproduction is permitted which does not comply with these terms.
*Correspondence: Tongtong Liu, Zmp5bDUwM0AxNjMuY29t
Disclaimer: All claims expressed in this article are solely those of the authors and do not necessarily represent those of their affiliated organizations, or those of the publisher, the editors and the reviewers. Any product that may be evaluated in this article or claim that may be made by its manufacturer is not guaranteed or endorsed by the publisher.
Research integrity at Frontiers
Learn more about the work of our research integrity team to safeguard the quality of each article we publish.