 Haixia Wu
 Peng Li
- Jiangsu Key Laboratory for Biodiversity and Biotechnology, College of Life Sciences, Nanjing Normal University, Nanjing, China
Body size is one of the most important traits of an organism. Among reptiles, both lizards and snakes show body size differences that span a similar six orders of magnitude variation. However, the molecular mechanisms underlying body size variation in squamates remain obscure. Here, we performed comparative genomic analyses of 101 body-size-related genes from 28 reptilian genomes. Phylogenetic analysis by maximum likelihood (PAML) revealed that snakes showed higher evolutionary rates in body-size-related genes, and had an almost two-fold increase in the number of positively selected genes (∼20.3%) compared with lizards (∼8.9%). The high similarities in dN/dS values were obtained between the branches of large-bodied lizards and large-bodied snakes by Spearman correlation analysis. Combining the results from site model, branch-site model and clade model analyses, we found some key genes regulating the evolution of body size in squamates, such as COL10A1, GHR, NPC1, GALNS, CDKN2C, FBN1, and LCORL. Phylogenetic generalized least squares (PGLS) indicated that AKT1, BMP1, IGF1, SOX5, SOX7 in lizards and BMP5, BMP7, GPC6, SH2B3, SOX17 in snakes were significantly correlated with body length and body mass. Furthermore, ecological factors had varying degrees of impact on body size and the evolutionary rate of body-size-related genes in squamates. Intriguingly, climate had little effect on body size of lizards and snakes, but the contribution of climate-related factors to the variation in evolutionary rate of body-size-related genes were relatively higher. Our study lays a foundation for a comprehensive understanding of genetic mechanisms of body size evolution in squamates during the process of adapting to terrestrial life.
Introduction
Squamate is the largest order taxon of extant reptiles, which are truly ectothermic vertebrates (Martins and Murta-Fonseca, 2022). Terrestrial environment is complex and changeable, and climate, microhabitat, range size and extinction risk all affects reptilian phenotypes (Feldman and Meiri, 2013; Slavenko et al., 2019; Li and Wiens, 2022). In order to adapt to terrestrial life, reptiles evolved many morphological and physiological adaptations, and the most obvious phenotypic adaptation is body size (e.g., body length and body mass) (Kratochvíl et al., 2018; Clifton et al., 2020; Gearty and Payne, 2020). It is easy to see the huge body size differences in lizards and snakes. For instance, body mass difference between large-bodied Python bivittatus and small-bodied Indotyphlops braminus in snakes is over four orders of magnitude, and that between large-bodied Varanus komodoensis and small-bodied Sphaerodactylus elasmorhynchus in lizards is approximately five orders of magnitude (Feldman and Meiri, 2013; Feldman et al., 2016).
So far, many studies have concentrated on the laws of body size evolution in reptiles. In the study of sexual-size dimorphism (SSD), body length is one of the most important indexes in reptiles. To improve the fecundity, the heads of males were relatively longer, whereas the abdomens of females were relatively longer; moreover, viviparous lizards and females laying large clutches also had longer abdomens (Scharf and Meiri, 2013). Contrary to Island law, small lizards on islands became smaller than their mainland counterparts, while large lizards became larger, especially in carnivorous lizards; in addition, herbivorous lizards and omnivorous lizards behaved in line with Island law (Meiri, 2008). Body size played a complicated role in the extinction of Late Quaternary reptiles: extinct lizards and turtles were relatively larger than extant ones, but extinct crocodiles were small and extinct snakes did not have common trends (Slavenko et al., 2016). Moreover, previous studies have reported that some signal pathways regulated the animal body size, such as Insulin signaling pathway, phosphoinositide 3-kinase/serine-threonine kinase (PI3K/AKT) signaling pathway, Wnt signaling pathway, mechanistic target of rapamycin (mTOR) signaling pathway, Hippo signaling pathway and bone morphogenetic protein (BMP) signaling pathway, etc. (Oldham and Hafen, 2003; Ladoux et al., 2015; Taciak et al., 2018; Hwang et al., 2020; Heng et al., 2021). Among these pathways, the inactivation of some regulatory genes inhibits the signaling pathway, resulting in the significant reduction of cells, organs and even individuals; on the contrary, the mutation of some regulators can obviously enlarge cells or organs (Richardson et al., 2004). Furthermore, in the last decades, some stature-related genes were discovered to promote cell growth or the mutation of these genes could result in gigantism or overgrowth, such as aryl hydrocarbon receptor interacting protein (AIP) gene (Outi et al., 2006), N-acetylgalactosamine-6-sulfatase (GALNS) gene (Yasuda et al., 2013), nuclear receptor binding SET domain protein 1 (NSD1) gene (Yang et al., 2021). In contrast, it was reported that some genes inhibited cell growth or their mutation might cause dwarfism, such as Aggrecan (ACAN) gene (Metzger et al., 2017; Park et al., 2021), a disintegrin and metalloproteinase with thrombospondin motifs 10 (ADAMTS10) gene (Le Goff and Cormier-Daire, 2012), obscurin like cytoskeletal adaptor 1 (OBSL1) gene (Clayton et al., 2012). Notably, some genes, e.g., fibrillin (FBN1) gene, have been related to gigantism and dwarfism, in which mutations at different sites would lead to opposite phenotypes (Le Goff et al., 2011; Sakai et al., 2016). Therefore, we define these key genes in the above signal pathways and stature-related genes as body-size-related genes in our study.
From a macro perspective, most of previous studies focused on the correlation between body size of reptiles and ecological factors, such as diversification rate, microhabitat, climate, etc. (Meiri, 2008; Feldman and Meiri, 2013; Feldman et al., 2016; Kulyomina et al., 2019; Slavenko et al., 2019). However, it is rare to explore the genetic mechanism of body size evolution of reptiles in microscopic view. Therefore, this study intended to use methods of comparative genomics, bioinformatics and ecology to perform elaborate analyses on the evolutionary rate of body-size-related genes and morphological/ecological variables, including selective pressure analyses and phylogenetically controlled regressions. First, comparing the lizard-only and snake-only datasets, we investigated the similarities and differences of evolutionary patterns and screened out key genes regulating the body size. Second, we examined the correlation between the evolutionary rate of body-size-related genes and morphological/ecological variables, and between phenotypes and ecological variables. Third, we synthesized the results above, providing a comprehensive and profound insight into the genetic basic and ecological adaptation of body size evolution in squamates.
Materials and methods
Sequences and alignment
In our study, 12 body size related gene families and 26 body-size-related genes (a total of 101 genes, Supplementary Table 1) were selected from body size regulation signaling pathways and pertinent literatures. The 28 representative species (Supplementary Table 2) includes 12 lizards: Anolis carolinensis, Eublepharis macularius, Gekko japonicus, Hemiphyllodactylus yunnanensis, Lacerta agilis, Paroedura picta, Podarcis muralis, Pogona vitticeps, Salvator merianae, Shinisaurus crocodilurus, Varanus komodoensis, Zootoca vivipara, and 16 snakes: Crotalus tigris, Hydrophis melanocephalus, Laticauda laticaudata, Naja naja, Notechis scutatus, Ophiophagus hannah, Pantherophis guttatus, Pantherophis obsoletus, Protobothrops flavoviridis, Protobothrops mucrosquamatus, Pseudonaja textilis, Ptyas mucosa, Python bivittatus, Thamnophis elegans, Thamnophis sirtalis, Thermophis baileyi. The third-generation genomes of G. japonicus and H. yunnanensis were obtained from our laboratory (data has not been published yet), and the remained genomes were downloaded from NCBI database1, Ensembl database2, and GigaDB database3. The 101 body-size-related amino acid sequences of Homo sapiens, Xenopus tropicalis, Gallus gallus, A. carolinensis and G. japonicus were acquired from NCBI and used as queries to identify the coding sequences of body-size-related genes. TBLASTN searches were conducted against the genomes of the studied species, and the E-value was set to 1e-5. For genomes without annotation files, we predicted the candidate genes by GeMoMa v1.7.1 (Keilwagen et al., 2019) using known reference genomes with annotation. Incomplete sequences and sequences containing premature stop codons were abandoned. All sequences were removed stop codons and were aligned using PRANK v170427 (Löytynoja, 2014) at the codon level. Poor aligned and highly variable regions were removed using Gblocks v0.91b (Castresana, 2000) with relatively strict parameters (“-t = c, -b5 = h”). Information about orthologous genes of each body-size-related gene and accession numbers of genomes were provided in Supplementary Tables 1, 2. The body size attributes (mean, mode, median, etc.) of squamate suborders (amphisbaenians, lizards and snakes) are totally different (Feldman et al., 2016), so we separately performed evolutionary analyses on lizard-only and snake-only datasets. High-quality multiple sequence alignment (MSA) files were from lizard-only dataset containing orthologous genes of 12 lizard-species, and snake-only dataset containing orthologous genes of 18 snake-species.
Molecular evolutionary analysis
In evolutionary biology, comparisons of non-synonymous/synonymous substitution ratios (dN/dS) are used to quantify the influence of natural selection (Kimura, 1983). Different values represent different types of selection: ω < 1, ω = 1 and ω > 1 indicate purifying selection, neutral selection and positive selection, respectively. CODEML program implemented in PAML v4.9 (Yang, 2007), was applied to detect the selective pressure by site model, branch model, branch-site model and clade model. The sequence length was an exact multiple of three, and the tree topology of lizards and snakes used as input for the CODEML were pruned from the consensus reptilian phylogenetic tree (Tonini et al., 2016; Figure 1).
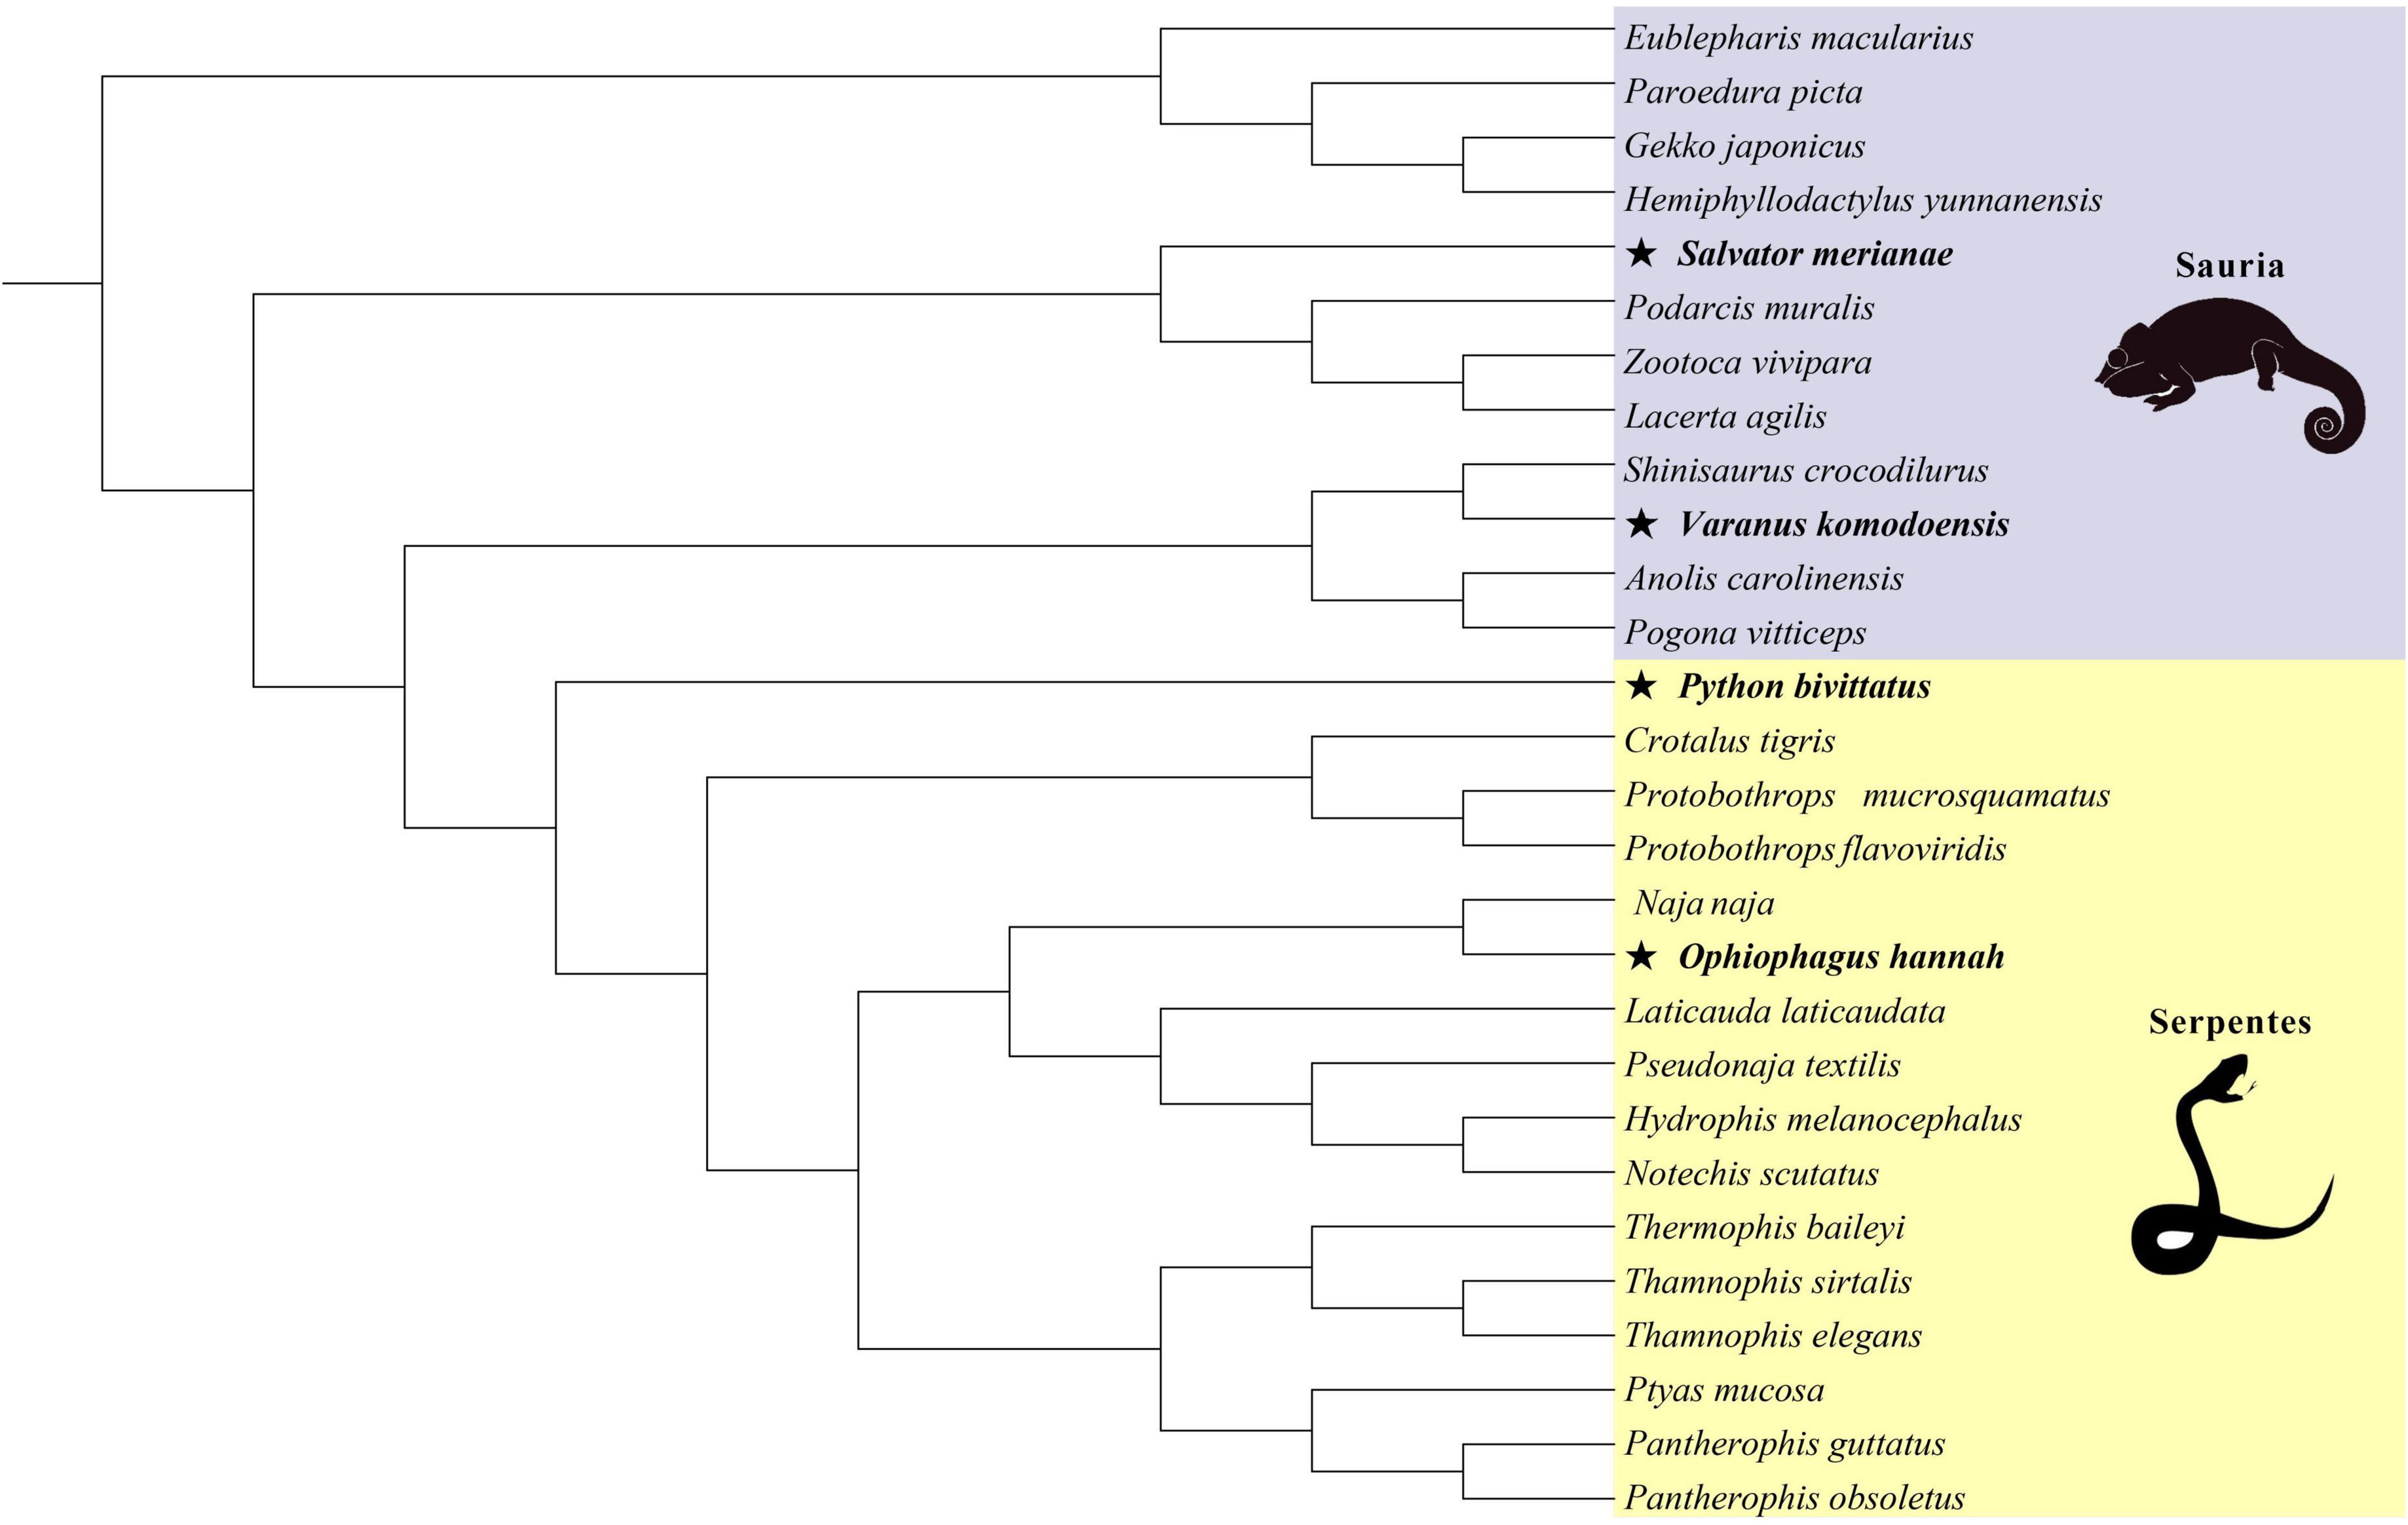
Figure 1. The phylogenetic relationship of 28 squamate reptiles based on maximum-likelihood method (asterisk represents large-bodied species in lizards and snakes).
Firstly, we used three evolutionary models (M0, M8a, M8) to estimate site-specific selection. Model 0 which assumed that one ratio occurred across the phylogeny was used to calculate the global ω values representing the average evolutionary rate of genes, and two pairs of site models (M8a vs. M8) were applied to identify the sites under positive selection in each body-size-related gene. The likelihood ratio test (LRT) which approximately follows a chi-square distribution was employed to compare hierarchically nested models (Bielawski and Yang, 2003). p < 0.05 represents that the two models are statistically significant. Positively selected sites were detected using Bayes empirical Bayes (BEB) analysis with posterior probabilities (PP) of >0.8 (Yang, 2005). Fisher’s Extract Test was used to determine whether there was a significant association between the number of selected genes in lizards and that in snakes or not.
Then, in order to test branch-specific evolutionary rates, we performed branch models with a two-ratio model which allowed ω values to vary between the foreground and background branches. The two-ratio model is compared to a one-ratio model that enforces the same ω values for all branches. According to the body size of squamates from Feldman et al. (2016) (Supplementary Table 2), we applied K-means cluster analyses to separately classify lizards and snakes into two categories (large-bodied and small-bodied). S. merianae, V. komodoensis in lizards, and P. bivittatus, O. hannah in snakes were relatively large-bodied species. In the lizard-only and snake-only datasets, the terminal branches of large-bodied species were set as the unified foreground branches, and the remaining lineages were background branches. Large-bodied species were compared against small-bodied species, providing a clear understanding of body-size-related genes subject to different selective pressure in two categories. Spearman’s correlations between the estimated ω values for branches (large lizards, small lizards, large snakes, and small snakes) were implemented in IBM SPSS Statistics for Windows, Version 25.0 (IBM Corp., Armonk, NY, United States).
To investigate whether episodic positive selection was limited to a subset of sites along particular lineages, branch-site models were conducted which allowed variation in ω values across branches and sites in the phylogeny. Besides the unified branches of large-bodied species, some particular lineages of interest were also set as the foreground branches (Supplementary Table 3). BEB analyses were also used to count the posterior probability (PP > 0.8). For each body-size-related MSA, the alternative model Ma was compared with the null model Ma0 which ω value was fixed to 1.
To further test for the selective pressure acting on large-bodied species relative to other small-bodied species, Clade model C (CmC) were utilized in the lizard-only and snake-only datasets. CmC assuming that a class of sites evolve conservatively along the phylogeny, and others evolve contrastly between foreground and background branches, was compared against the null model M2a_rel (nearly neutral).
In view of the large number of candidate genes and relatively few species, all results of branch model, branch-site model and clade model were corrected for multiple testing bias using Benjamini–Hochberg method implemented in q-value package (R v4.0.3) (R Core Team, 2020). Q-value indicates the false discovery rate (FDR) using the critical value 0.05, which is calculated on the basis of p value.
Association analyses between body size and body-size-related genes
To explore the potential association between the evolutionary rate of body-size-related genes and phenotypes (body length, body mass), phylogenetic generalized least squares (PGLS) regression were implemented in the R package ‘caper’ (Orme et al., 2018). The time-calibrated phylogenies were acquired from the consensus tree of reptile (Tonini et al., 2016). The phylogenetic signal (lambda, λ) was estimated by the maximum likelihood (ML) method, which can vary from 0 to 1. λ = 1 indicates that observed data obey Brownian motion model of evolution and have a strong phylogenetic signal; λ = 0 means that the phylogeny occurs independently.
As the method suggested by Montgomery et al. (2011), the evolutionary rate (root-to-tip ω) were calculated by free-ratio model implemented in the CODEML program of PAML v4.9. The root-to-tip ω of each species is the average of ω values from the last common ancestor (LAC) to each terminal branch, which removes temporal effects on ω values and reflects the average evolutionary rate of genes. If dN or dS is less than 0.0002 leading to ω values extremely big or small, it is labeled as an outlier ‘N/A.’ The phenotypic data of lizards and snakes studied were obtained from the publication (Zhang et al., 2005; Tonini et al., 2016; Xing et al., 2018). Moreover, in order to improve normality, all phenotypic data and root-to-tip ω values were log10-transformed for subsequent analyses.
Association analyses between ecological factors and body-size-related genes
To address the impact of ecological variables (microhabitat, climatic niche, range size, rate of range expansion) on the evolutionary rate of body-size-related genes, we first performed univariate PGLS regression analyses separately on the lizard-only and snakes-only datasets (Pagel, 1999). Then, variables significantly associated with body-size-related genes (p < 0.05) were selected to conduct a series of phylogenetic multiple regression analyses, considering all possible combinations of these variables to build candidate models. The models with lowest Akaike Information Criterion (AIC) values were considered as the best-fitting model overall (Burnham and Anderson, 2002). Finally, for the best-fitting model, we used R code from Moen and Wiens (2017) to estimate standardized partial regression coefficients (SPRC). SPRC explain the contribution of each ecological variable to the best-fitting model, and show the impact of variables on evolutionary rates of body-size-related genes when others are held constant (Sokal and Rohlf, 1995).
We obtained the microhabitat data of 28 species from the IUCN database (IUCN, 2021) and previously published literatures (Bars-Closel et al., 2017; Meiri, 2018; Supplementary Table 4). Following the classification method of Bars-Closel et al. (2017), each species was assigned to one microhabitat type where they were active, including terrestrial, arboreal, fossorial, aquatic, semi-arboreal, semi-aquatic, and semi-fossorial. Pie et al. (2017) estimated phylogenetic principal components (PCs) for 19 climatic variables for squamate species. We chose PC1, PC2, PC3, ln-transformed Bio1 (annual mean temperature) and ln-transformed Bio12 (annual precipitation) as independent variables, and then extracted climatic niche data of 17 species studied (Pie et al., 2017; Supplementary Table 5). The number of ecoregions was defined as range size in the study. As Pyron and Wiens (2013) suggested, we first retrieved the geographic range of 28 species studied from the IUCN database, and assigned each species to one or more of 12 ecoregions (Li and Wiens, 2022; Supplementary Table 6). To improve normality, we transformed range size based on the equation log10(x + 0.5), where x is the number of ecoregions and adding 0.5 avoids assigning zero to species found in only one ecoregion (Li and Wiens, 2022). As a measure of the rate of range expansion for each species, the total number of ecoregions was divided by the species’s stem age (ecoregions/age) (Li and Wiens, 2022). Thus, species that occur in many regions despite being relatively young will have a relatively rapid rate of inferred range expansion; conversely, species that occur in few regions despite being older will have a lower rate of range expansion.
Association analyses between ecological factors and body size
Finally, we tested the relationship between ecological variables (microhabitat, climatic niche, range size, rate of range expansion) and phenotypes (body length, body mass) in 28 species of lizards and snakes. The PGLS regression analyses were performed in lizard-only, snake-only and squamate datasets. Specially, in the squamate dataset, we only examined the effect of ecological variables on body mass, because the measurement methods of body length in lizards and snakes were different. The specific analytical methods were the same as above.
Results
Site models show a higher evolutionary rate in snake body-size-related genes
The model 0 showed that the ω values of these 101 body-size-related genes were 0.121 ± 0.096 (mean ± SD) in the lizard-only dataset and 0.175 ± 0.144 (mean ± SD) in the snake-only dataset (Supplementary Table 7). The global ω values of snake were higher than those of lizard, indicating that body-size-related genes in snakes evolved faster than in lizards. In addition, the global ω values of lizards and snakes were much less than 1, suggesting that these genes were under strong purifying selection constraining their critical function in the body size evolution of squamates. The global ω values distribution of lizards and snakes were different, among which, the highest and lowest ω values (0.426 and 0.00225) in lizards were observed for NSD1 and GDF11, and the highest and lowest ω values (0.759 and 0.00491) in snakes were found for NPC2 and SOX4.
In site models, of 101 body-size-related genes in lizards, 9 (∼8.9%) supported the Model 8 (positively selected) (Supplementary Table 8), whereas in snakes, 21 (∼20.8%) were under positive selection (Supplementary Table 9). Fisher’s Extract Test demonstrated that there was a significant difference in the number of genes subject to positive selection between lizards and snakes (p = 0.028, two-tailed), which indicated that these clades might have disparate evolutionary patterns of body size. Notably, COL10A, GHR and NPC1 were co-positively selected in the lizard-only and snake-only datasets.
Furthermore, it was also observed that LCORL (0.348 and 0.409) and INSL5 (0.482 and 0.491) in the lizard-only and snake-only datasets had relatively higher global ω values (Supplementary Table 7). However, considering only the number of sites with ω values greater than 1 and posterior probabilities (PP) greater than 0.8, OBSL1 (11) of lizards and NPC1 (18), NPC2 (15) of snakes had the highest number of positively selected sites.
Branch models and branch-site models examine similarities and differences in evolutionary patterns of lizards and snakes
For branch model analyses, free-ratio models fitted the data better than one-ratio models at 53 genes in lizards and at 24 genes in snakes, indicating the heterogeneous selection among the phylogeny. Then, we marked the datasets based on body size, with the large-bodied species (S. merianae and V. komodoensis in lizards, P. bivittatus and O. hannah in snakes) as united foreground branches. After FDR correction, 10 body-size-related genes in lizards and 9 genes in snakes favored two-ratio models better than one-ratio models (p < 0.05, q < 0.05). Contrasting the two datasets, GALNS was the only gene with significantly different evolutionary rates between large-bodied and small-bodied lineages in both lizard-only and snake-only datasets. The positively selected genes identified by branch model were shown in Table 1.
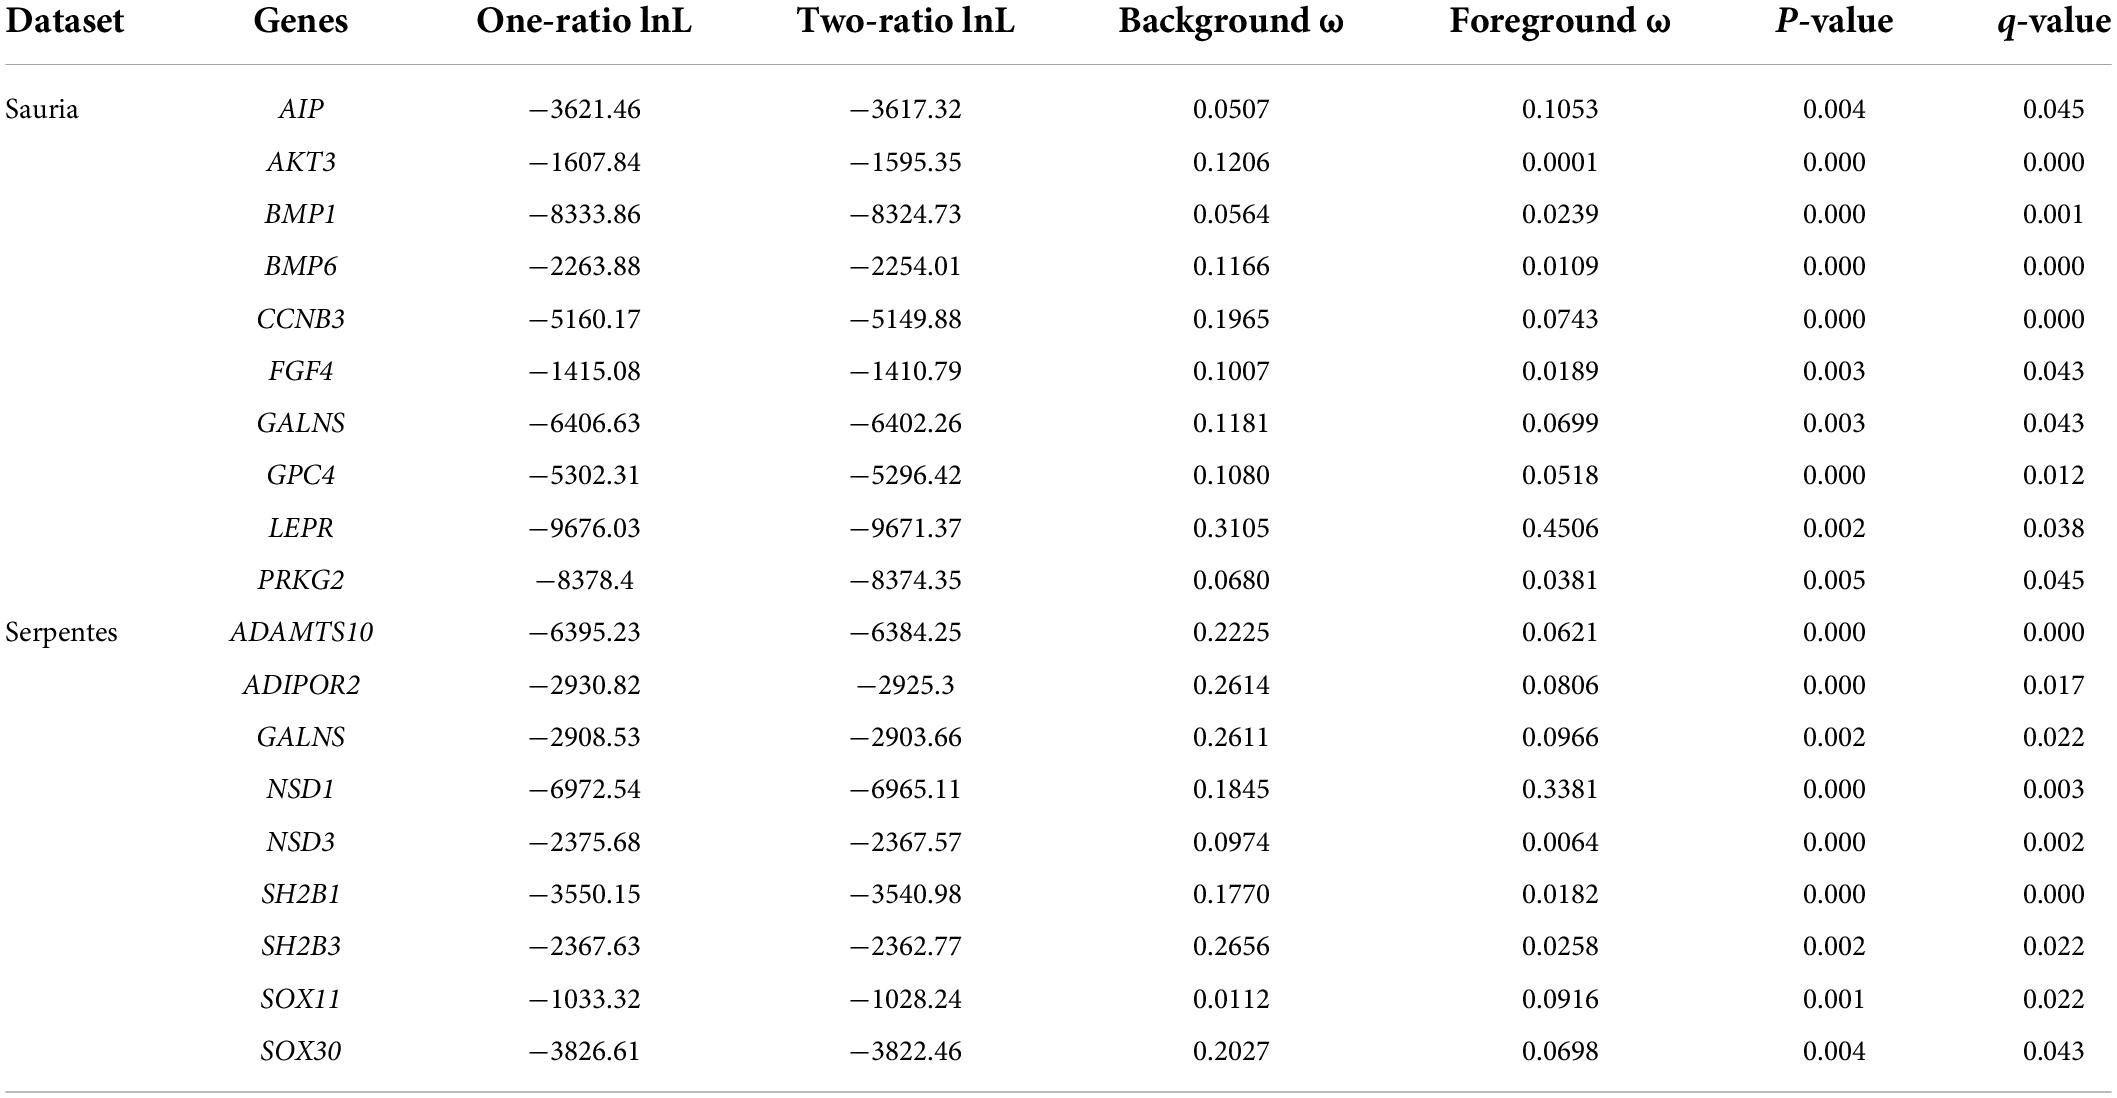
Table 1. Genes detected to be under positive selection by branch model (the terminal branches of large-bodied species as unified foreground branch).
Spearman correlation analyses showed that the correlation between lizards and snakes had the lowest rho (ρ) for large lizards and small snakes (Spearman’s ρ = 0.653; p < 0.01). The ω values were highly similar across taxonomic clades: large and small lizards (Spearman’s ρ = 0.857; p < 0.01), and large and small snakes (Spearman’s ρ = 0.700; p < 0.01) (Table 2). These results demonstrated that through relatively less sites influenced, they were sufficient to be detected under positive selection, yet were no able to cause significantly different evolutionary rates of body-size-related genes between large and small species in each clade. Specially, the correlation of ω values for large lizards and large snakes was also relatively high (Spearman’s ρ = 0.730; p < 0.01), suggesting that lizards and snakes were likely to evolve toward larger body size with similar patterns (Table 2).
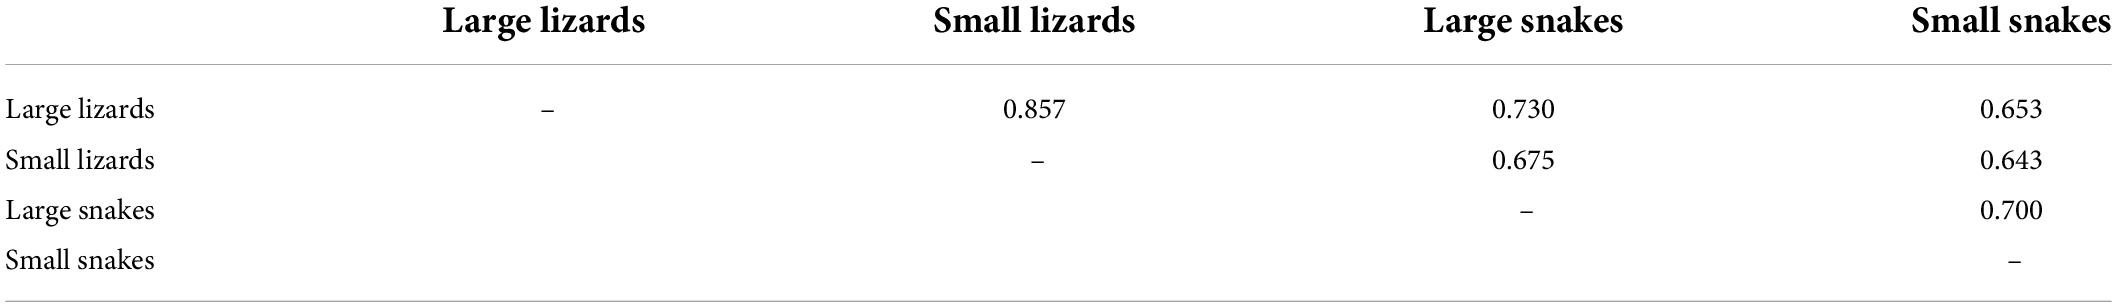
Table 2. Spearman correlation between the estimated ω for branches: large lizards vs. small lizards and large snakes vs. small snakes (all correlations are significant at the p < 0.01, two-tailed, n = 97).
In branch-site models, the terminal branches of large-bodied species were also set as united foreground branches. After FDR correction, CDKN2C, IGF1, IRS2 in lizards and FBN1, NSD1 in snakes were detected positive selection signatures in large-bodied lineages, and positively selected sites with posterior probabilities > 0.8 were shown in Table 3. It was thus clear that lizards and snakes did not have the same genes under positive selection after FDR correction. However, before correction, FBN1 was identified as a positively selected gene in both lizards and snakes, and had two identical sites under positive selection with PP > 0.8. CDKN2C in lizards and NSD1 in snakes had the highest number of positively selected sites, 24 and 56, respectively, indicating that they might be the key genes for regulating body differentiation in squamates.
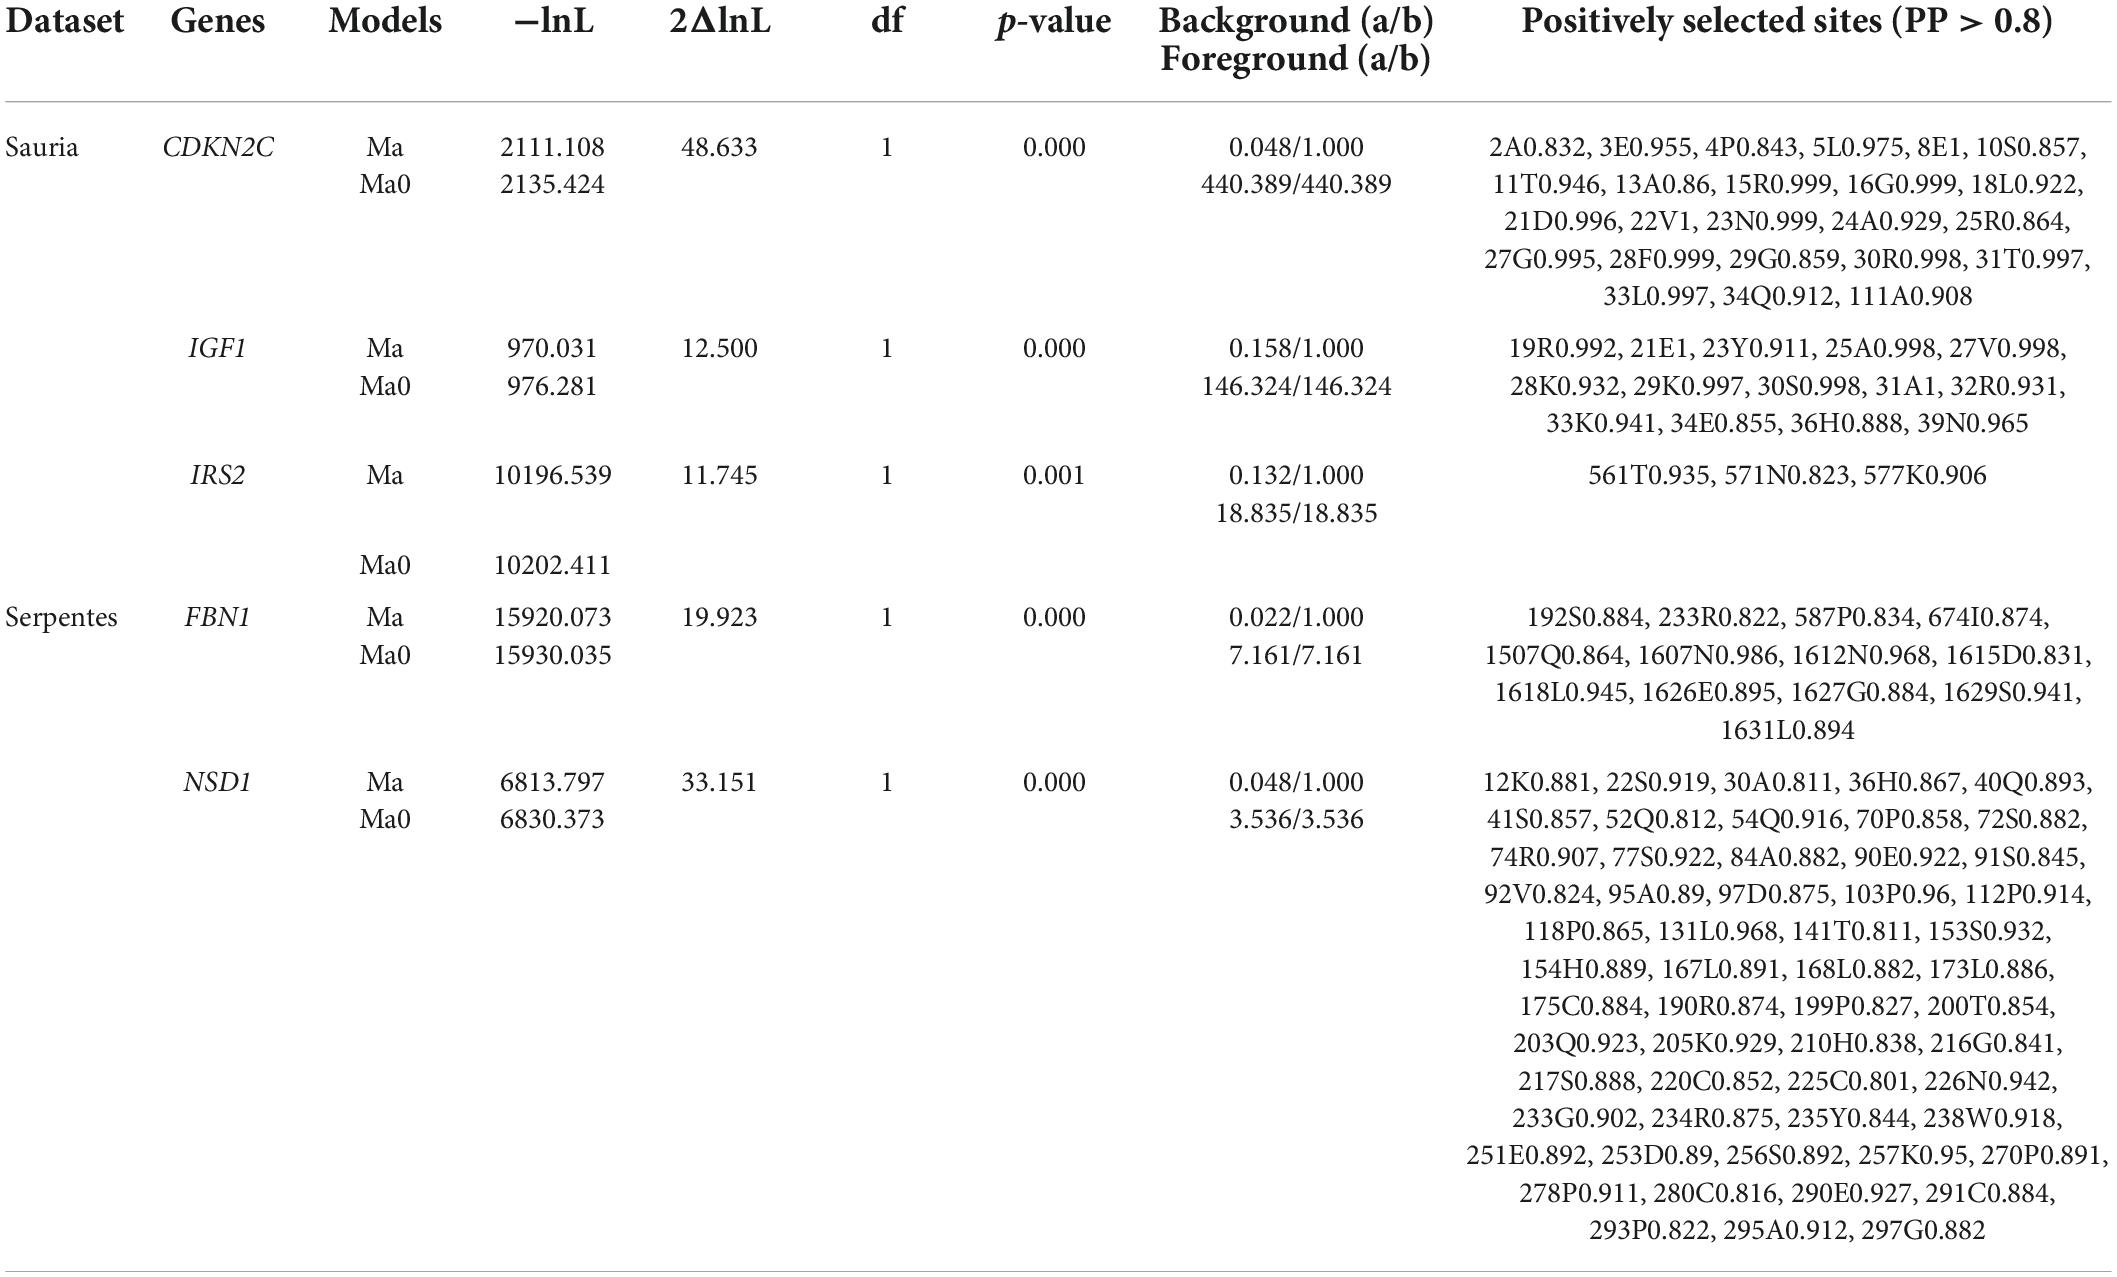
Table 3. Genes and sites detected to be under positive selection by branch-site model (the terminal branches of large-bodied species as unified foreground branch).
Clade models identify body-size-related genes under divergent selection
To further identify body-size-related genes under disruptive selection in the different body size lineages, we analyzed the lizard-only and snake-only datasets using Clade model C. We found significant evidence for shifts in selection pressure in large-bodied species relative to other small species in 62 of 101 body-size-related genes from the lizard-only dataset (p < 0.05, q < 0.05). Among them, the foreground branches of 14 genes (CCNB3, CDKN2C, COL10A1, FOXO1, GPC3, GPC4, GRB10, IGF1, INSL5, LEPR, mTOR, NSD3, OBSL1, SOX21) had ω values higher than background and greater than 1, suggesting that these genes experienced the relaxation of selective pressure and reached the level of positive selection (Supplementary Table 10). In the snake-only dataset, CmC detected that the partitions of 35 body-size-related genes (from a total of 95 genes, and 6 genes were not identified in large-bodied snakes) were significantly better suited relative to M2a_rel models, indicating divergent selection applying to different body size lineages. The ω values of the foreground branches in 8 of 35 genes were higher than those of background, which were strong evidence for relaxation of constraint. Except CDKN2C, the retained seven genes (AKT1, BMP15, CDKN2C, IGFBP6, IRS4, NSD1, SOX11, SOX5) with ω > 1 were affected by positive selection (Supplementary Table 10). Interestingly, CDKN2C was under divergent selection in both lizards and snakes, but only in lizards reached the level of positive selection.
Comparison of positively selected genes along terminal branches and ancestral branches with large or small body size
In addition to large-bodied species, there are also some small-bodied species in lizards and snakes. The terminal branches of these large-bodied and small-bodied species were also set as the foreground branches, and we used branch-site model to explore similar or different genes and sites under positive selection in lineages with different body size. Evidence of positive selection was determined along the terminal branch of H. yunnanensis, the smallest species in lizards, at seven genes (ACAN, FOXO6, GDF6, GDF7, GHR, IGFBP2, IRS2), and along the terminal branch of T. baileyi, the smallest species in snakes, at four genes (FBN1, IGF1, PRKG2, SOX21) (Supplementary Table 11). Moreover, positive selection was detected along the terminal branch of V. komodoensis (the largest species in lizards) at six genes (BMP10, FOXO4, IGF1, INS, LEPR, NSD1), as well as the lineage leading to S. merianae (another large-bodied species in lizards) at four genes (BMP15, CDKN2C, IRS2, LEPR) (Supplementary Table 11). We also found positive selection signals along the terminal branch of P. bivittatus (the largest species in snakes) at two genes (CDKN2C, FBN1) and along the terminal branch of O. hannah (another large-bodied species in snakes) at five genes (BMP15, IGFBP6, IGFBP7, NSD1, SOX11) (Supplementary Table 11). Comparing the results, we discovered some positively selected genes (e.g., FBN1, IGF1, IRS2) associated with large-bodied and small-bodied species, LEPR only relevant to large-bodied species in lizards, and some genes (e.g., BMP15, CDKN2C, NSD1) only related to large-bodied species in both lizards and snakes.
Comparing body size of 28 species studied, E. macularius is larger than the species of Gekkonidae and S. merianae is larger than the species of Lacertidae. Similarly, C. tigris is larger than P. mucrosquamatus and P. flavoviridis, and T. baileyi is smaller than T. sirtalis and T. elegans, and P. mucosa is larger than P. guttatus and P. obsoletus. Therefore, we set some ancestral branches as foreground and performed branch-site models in the lizard-only and snake-only datasets (Supplementary Table 3). Five genes (GDF6, GPC4, IGFBP2, SH2B3, SOX11) at the ancestral branch of Gekkonidae and six genes (CCNB3, CNP, IGFBP3, SOX9, IRS2, SMO) at the ancestral branch of Lacertidae displayed significant evidence of positive episodic selection (Supplementary Table 12). It is easy to see that both IGFBP2 and IGFBP3 belong to the IGFBP family, which may participate in the regulation of body size reduction. Furthermore, branch-site models showed that LCORL (296 G 0.604, 575 L 0.767, 964 V 0.595) was positively selected along the lineage to the last common ancestor (LCA) of P. mucrosquamatus and P. flavoviridis, but had no sites with PP > 0.8 (Supplementary Table 12). Positive selection was also identified along the LCA of T. sirtalis and T. elegans at three genes (NPC1, 553 Y 0.650; ACAN, 965 D 0.808; LCORL, 265 C 0.564, 1070 V 0.665) and along the LCA of P. guttatus and P. obsoletus at FBN1 (727 A 0.785) (Supplementary Table 12). Particularly, LCORL showed the evidence of episodic positive selection along two ancestral branches leading to relatively large-bodied species, suggesting its potential function to evolve larger. Nevertheless, we did not find common sites under positive selection, indicating that different sites in one gene could influence the same function.
Association between gene evolution and morphological variables
To explicitly explore the association between evolutionary rate of body-size-related genes and morphological variables (body length, body mass), PGLS regressions were conducted in the lizard-only and snake-only datasets. The results in lizards revealed the evidence of negative association between log (root-to-tip ω) and log (body length)/log (body mass) at four genes (AKT1, BMP1, IGF2, SOX7), and positive association between log (root-to-tip ω) and log (body length)/log (body mass) at the gene SOX5 (body length: R2 = 0.319, p = 0.033; body mass: R2 = 0.269, p = 0.048) (Table 4). In the snake-only dataset, we detected significant negative association between log (root-to-tip ω) and log (body length) at eight genes (BMP5, BMP7, FGF4, IGFBP5, IGFBP6, SH2B3, SOX17, SOX30) and between log (root-to-tip ω) and log (body mass) at seven genes (BMP5, BMP7, CDKN2D, GPC1, SH2B1, SH2B3, SOX17) (Table 4). In addition, positive association also were found between log (root-to-tip ω) and log (body length)/log (body mass) at the gene GPC6 (body length: R2 = 0.360, p = 0.018; body mass: R2 = 0.330, p = 0.023). Among them, the evolutionary rate of BMP5, BMP7, GPC6, SH2B3, SOX17, and GPC6 were significantly correlated with body length and body mass. In short, genes associated with phenotypic data were different in both lizards and snakes, but involved in two gene families (BMP and SOX family).
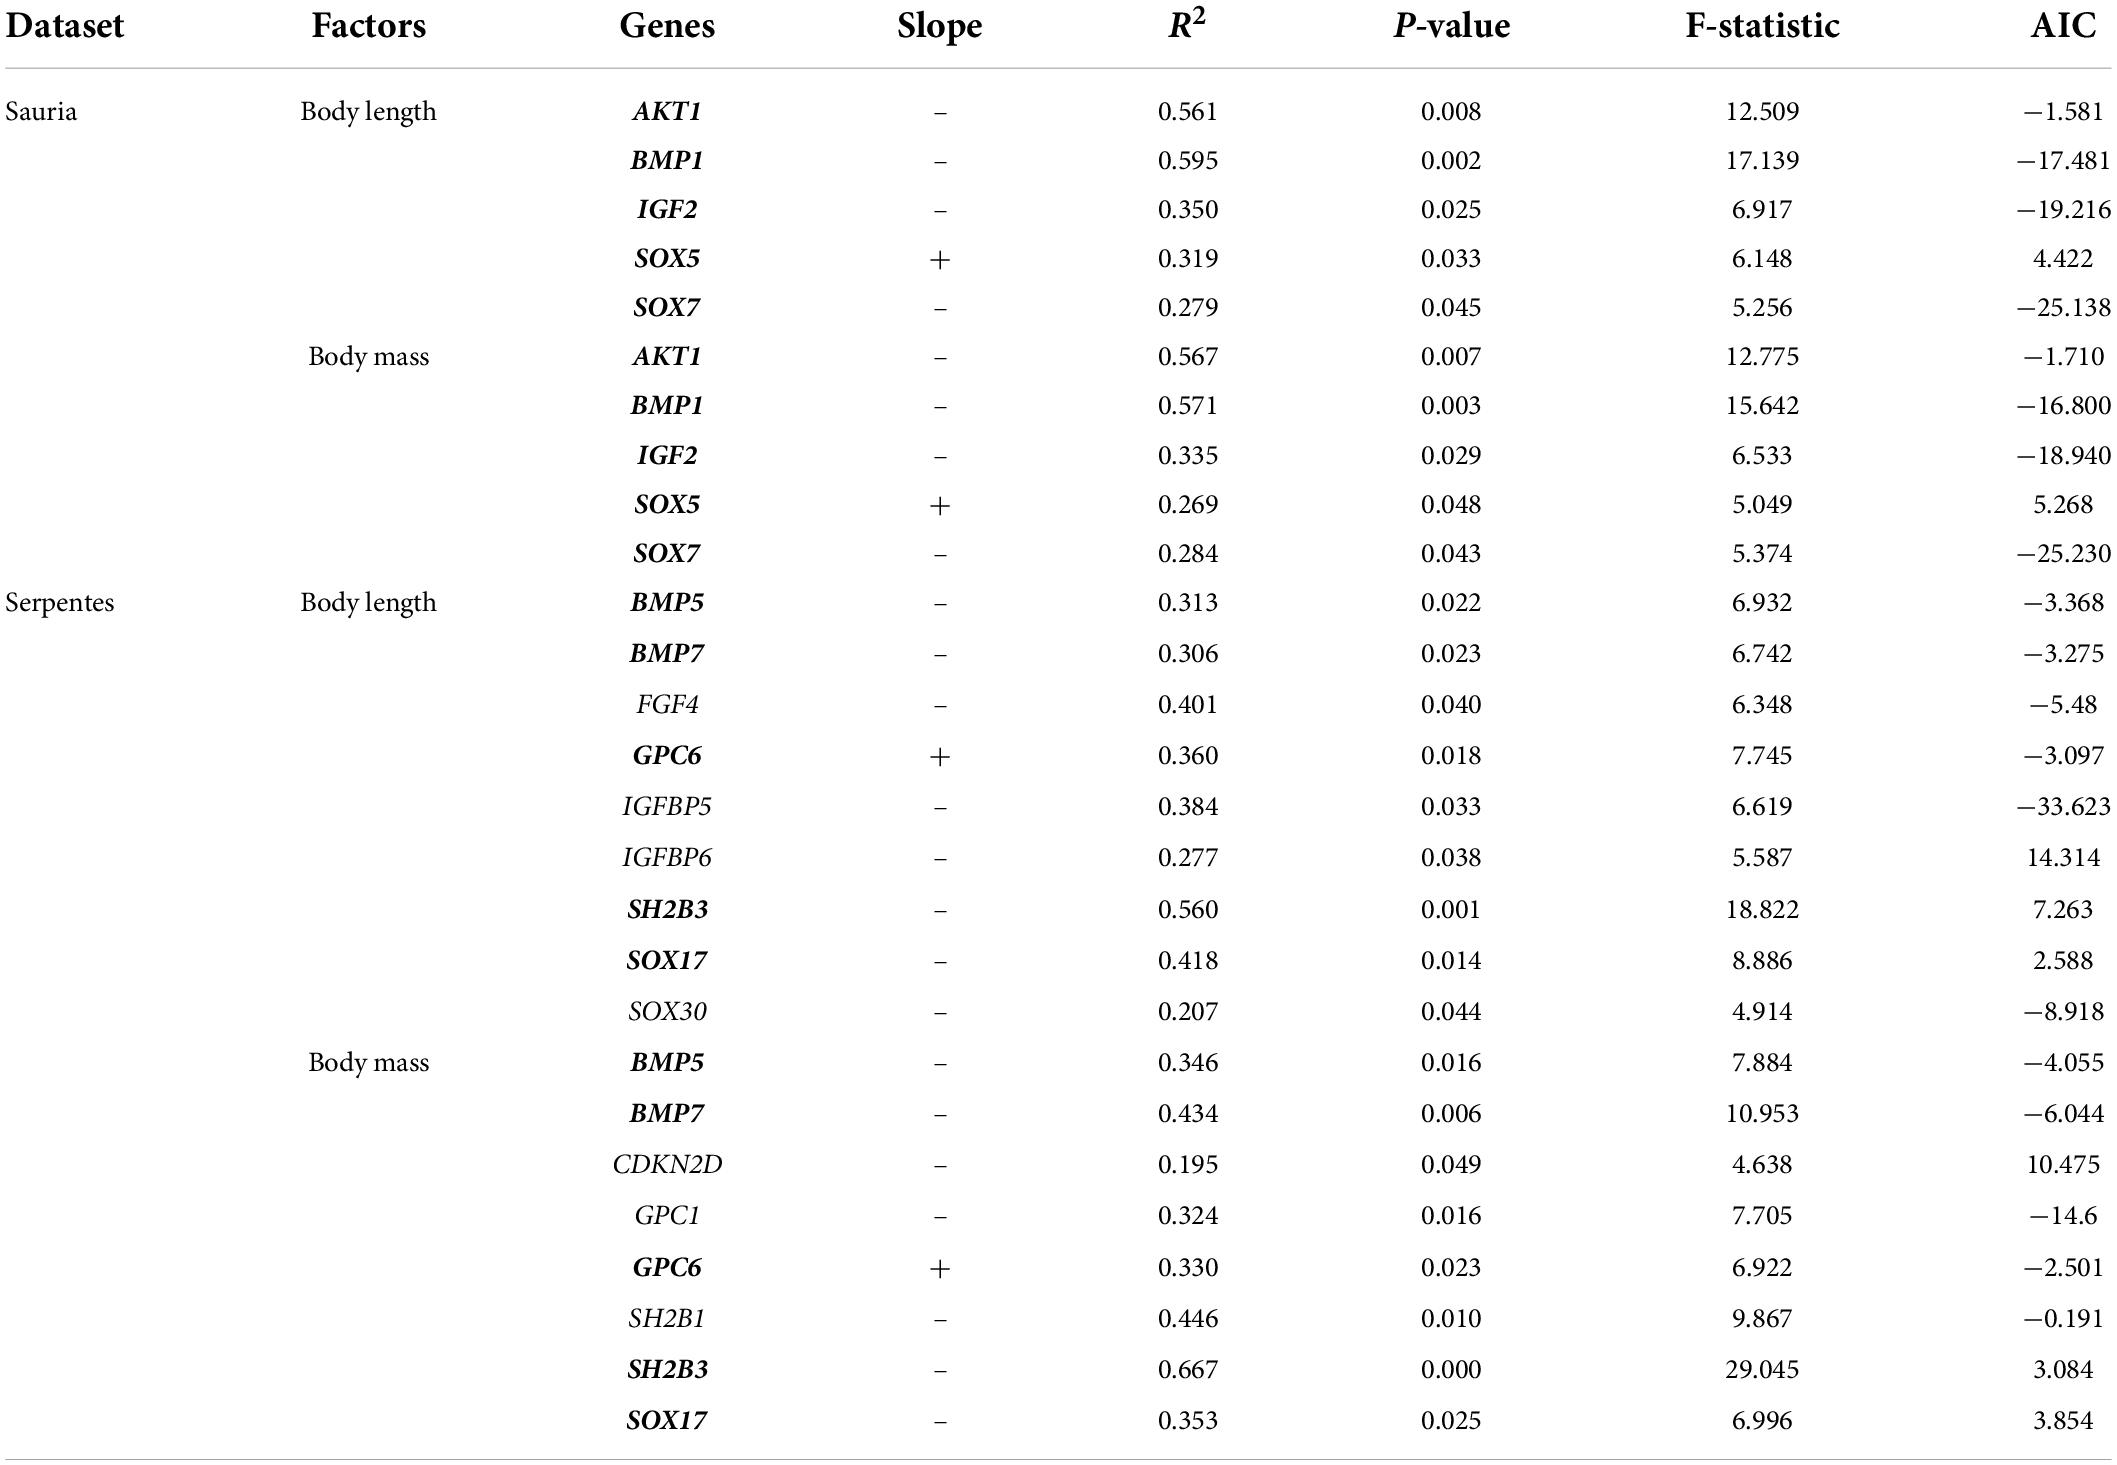
Table 4. Association analyses between gene evolution and phenotypes in lizards and snakes (genes significantly associated with body length and body mass are boldfaced).
Association between gene evolution and ecological variables
The growth and development of squamates living in different habitats are affected by many ecological factors, and genes usually control the cell proliferation, apoptosis and other processes of organisms. Hence, we performed phylogenetically controlled regressions to probe into the link between evolutionary rate of body-size-related genes and ecological variables (microhabitat, climatic niche, range size, rate of range expansion). We discovered significant correlation between log (root-to-tip ω) and logit (microhabitat) at seven genes (BMP4, BMP6, CDKN1A, GALNS, IGFBP3, IGFBP6, SOX8) in lizards, and at five genes (CCNB3, FGF4, SH2B1, SOX6, SOX7) in snakes (Supplementary Table 13). It was obvious that no common microhabitat-related genes were found.
Moreover, AKT1, BMP1, IGF2, SOX5 in lizards and ADIPOR2, FOXO1, GPC6, KCNJ2, SOX30 in snakes were strongly associated with range size (number of ecoregions) (Supplementary Table 14). We also found AKT1, BMP6, BMP7, FOXO1, GALNS, GDF9, IGFBP2, IGFBP6, IRS1, NSD2, PLAGL2 in lizards and ADIPOR2, KCNJ2, SOX30 in snakes that showed the evidence of association between log (root-to-tip ω) and rate of range expansion in species (ecoregions/age) (Supplementary Table 14). It was clearly stated that AKT1 in lizards, and ADIPOR2, KCNJ2 and SOX30 in snakes were correlated with range size and rate of range expansion (p < 0.05).
Furthermore, we detected that CDKN1B, NPC1 and SOX11 were significantly associated with climatic-niche rate for PC1; AKT1, BMP15, EIF4EBP1, GDF9, KCNJ2, SOX18, SOX5, and SOX6 were significantly correlated with climatic-niche rate for PC2; CCNB1, FOXO6, GDF7, LEPR, SOX11, SOX6, and SOX8 were significantly linked to climatic-niche rate for PC3; AIP, BMP15, CCNB1, FOXO1, NOG, and SOX14 were significantly related with annual mean temperature (Bio1); CDKN1B, NPC1, PLAGL2 and SOX11 were significantly concerned with annual precipitation (Bio12) in lizards (Supplementary Table 15). In the snake-only dataset, the evidence of significant association were discovered between log (root-to-tip ω) and PC1 at four genes (CCNB1, CDKN1A, FBN1, SOX30), and PC2 at nine genes (ADAMTS10, AKT1, FBN1, FOXO6, GPC6, IGF1, IGFBP6, KCNJ2, SOX30), and PC3 at eight genes (ADAMTS10, AIP, BMP2, CDKN1A, GPC1, LEPR, OBSL1, SOX7), and ln (Bio1) at nine genes (AKT1, FBN1, FOXO1, GPC1, IGFBP4, LEPR, SH2B1, SOX30, SOX7), and ln (Bio12) at six genes (ADIPOR2, BMP6, CCNB1, FBN1, LCORL, SOX30) (Supplementary Table 15).
Finally, combining the results of the above eight ecological variables on the evolutionary rate of body-size-related genes, it was found that AKT1, BMP15, BMP6, CCNB1, CDKN1B, FOXO1, GALNS, GDF9, IGFBP6, NPC1, PLAGL2, SOX5, SOX6, SOX8, SOX11 in lizards and ADAMTS10, ADIPOR2, AKT1, CCNB1, CDKN1A, FBN1, FOXO1, GPC1, GPC6, KCNJ2, LEPR, SH2B3, SOX30, SOX7 in snakes were significantly correlated with multiple variables (p < 0.05). Thus, based on these genes and variables, phylogenetic multiple regression analyses were performed. In the lizard-only dataset (Table 5), NPC1 and SOX11 were significantly associated with PC1 and Bio12, where PC1 explained 64–71%, whereas Bio12 accounted for 17–27% of the variation in the evolutionary rate; AKT1 and GDF9 were strongly concerned with PC2 and ecoregions/age, which separately 41–64% and 24–48% of the variation; GALNS and IGFBP6 were significantly linked to microhabitat and ecoregions/age, which respectively accounted for 23–24% and 19–30% of the variation. In subsequent analyses of snakes (Table 6), ADAMTS10 was significantly connected with PC2 and PC3, which separately explained ∼28% and ∼19% of the variation in the evolutionary rate; ADIPOR2 was strongly associated with number of ecoregions and ecoregions/age, which respectively accounted for ∼23% and ∼11% of the variation; CCNB1 was correlated with PC1 (∼18%) and Bio12 (∼28%); FBN1 was associated with PC2 (∼23%) and Bio12 (∼40%); FOXO1 was strongly linked to number of ecoregions (∼0%) and Bio1 (∼43%); KCNJ2 was correlated with PC2 (∼36%) and number of ecoregions (∼26%); SOX7 was correlated with microhabitat (∼10%) and Bio1 (∼38%); SOX30 was significantly concerned with number of ecoregions (∼48%) and Bio1 (∼28%). Notably, we discovered the evidence of strong link between the evolutionary rate of body-size-related genes and five ecological variables (PC1, PC2, PC3, Bio1, Bio12), and relatively weak correlation between the evolutionary rate and microhabitat.
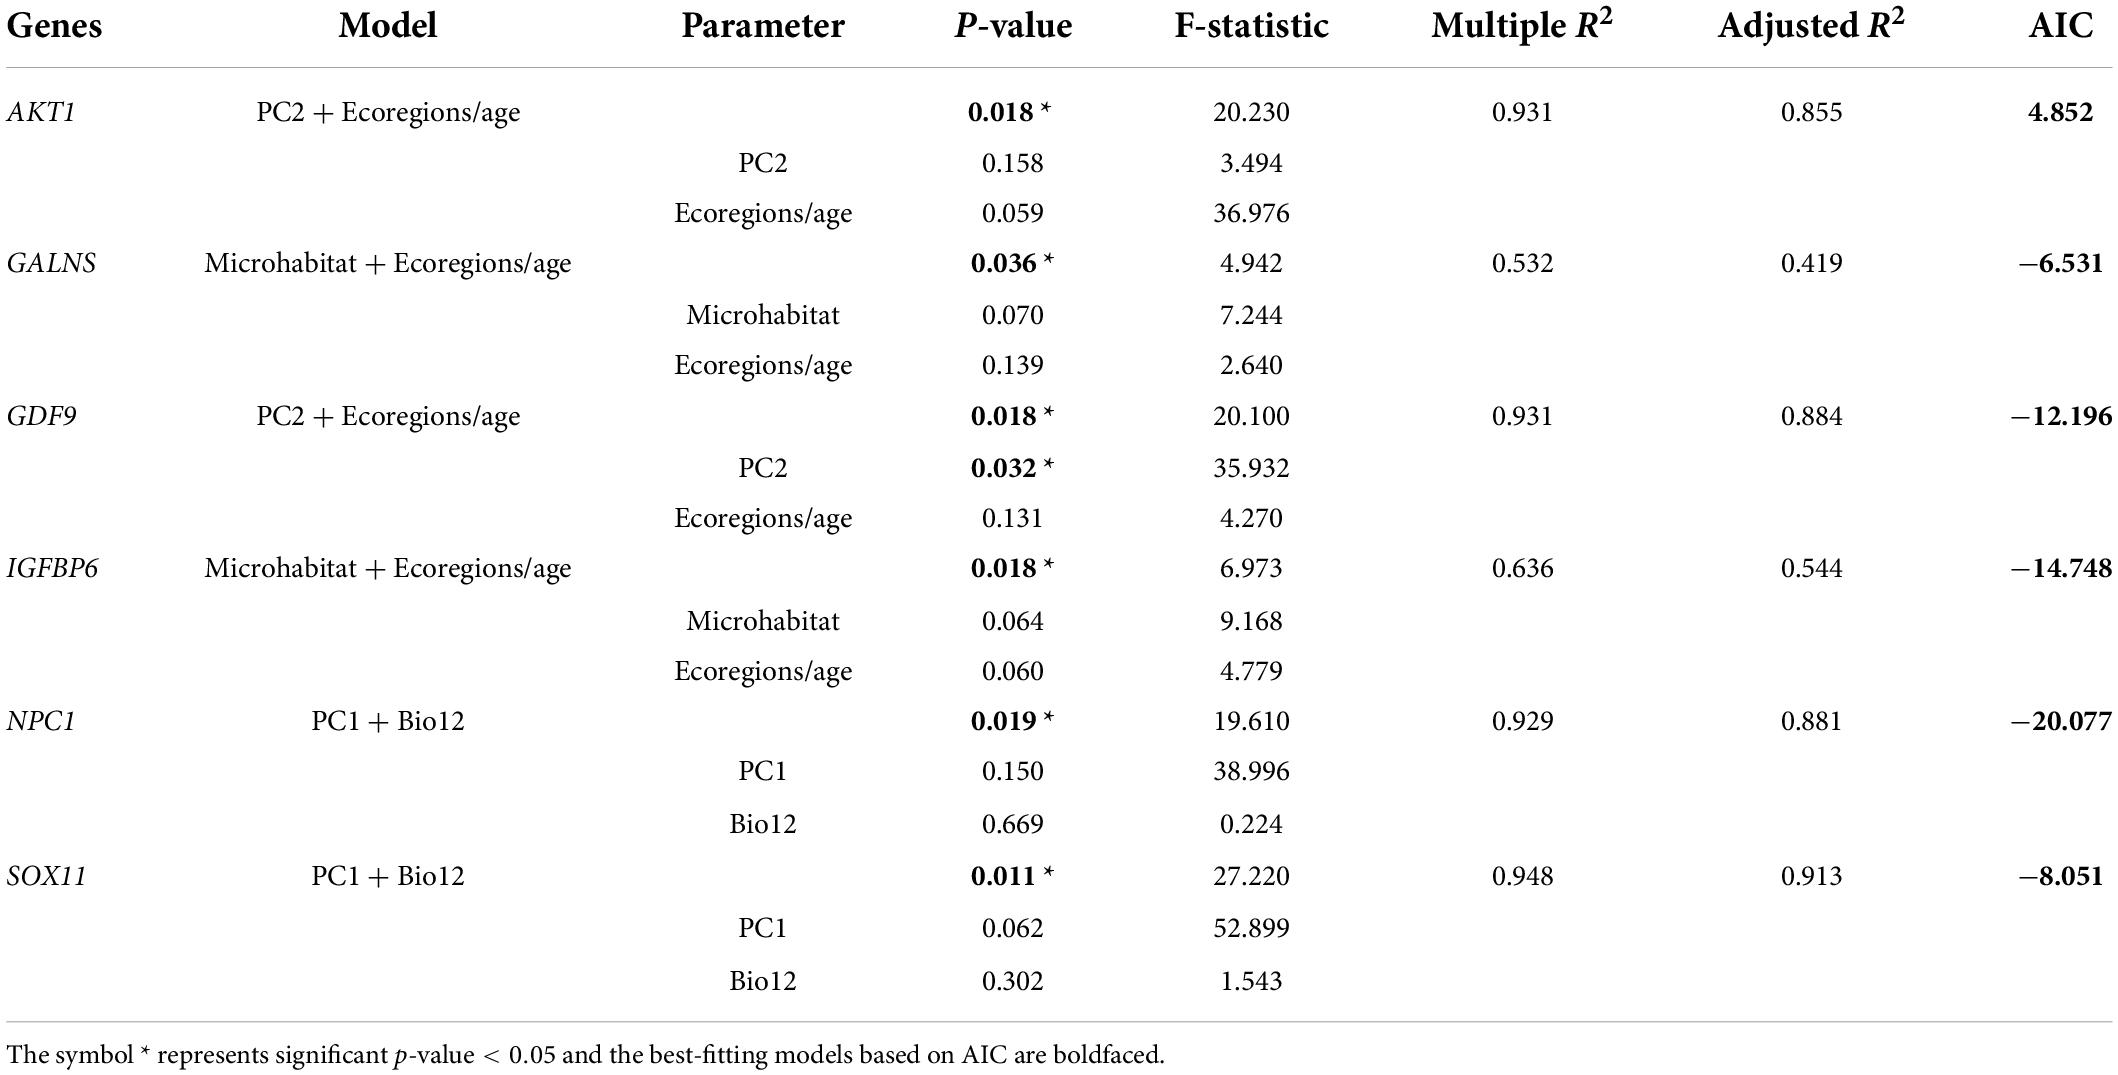
Table 5. Multiple regression analyses of the relationships between gene evolution and ecological factors in lizards.
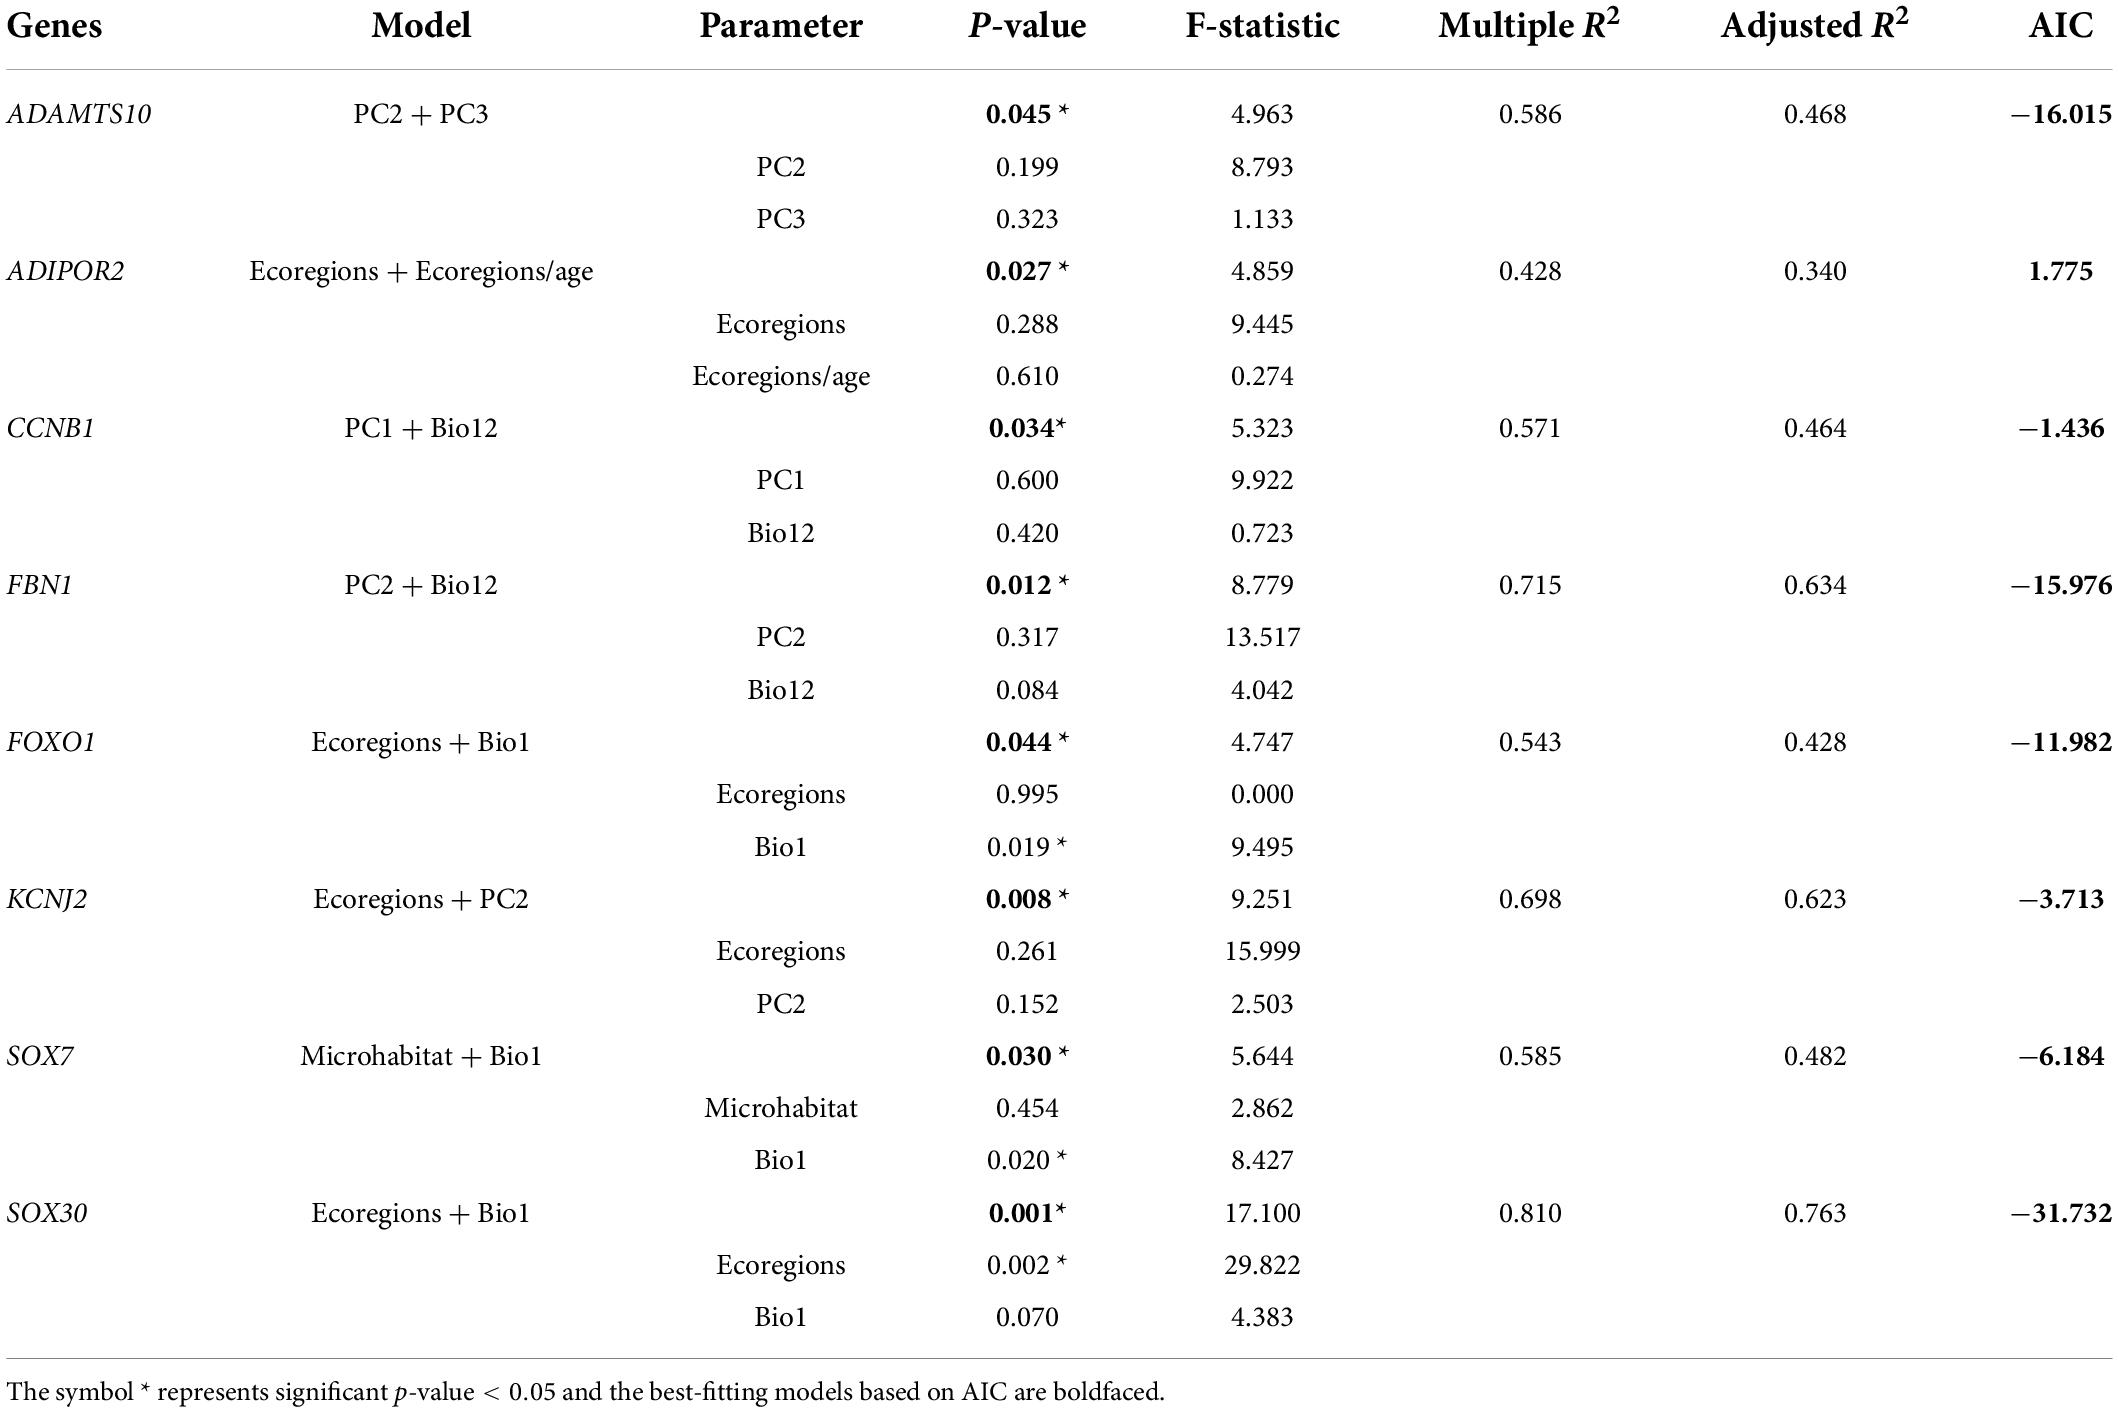
Table 6. Multiple regression analyses of the relationships between gene evolution and ecological factors in snakes.
Association between phenotypes and ecological variables
Due to natural selection, body size of squamates might be potentially related to ecological factors. Eventually, we explored the effects of ecological variables on body size. As were shown in Table 7, in the lizard-only dataset, only number of ecoregions had a significant impact on body length and body mass (p < 0.05); whereas in the snake-only dataset, no ecological factors were significantly correlated with body size. Specially, we also found that there was a weak association between microhabitat and body mass in the squamate dataset (R2 = 0.104, p = 0.056) (Table 7 and Supplementary Table 16).
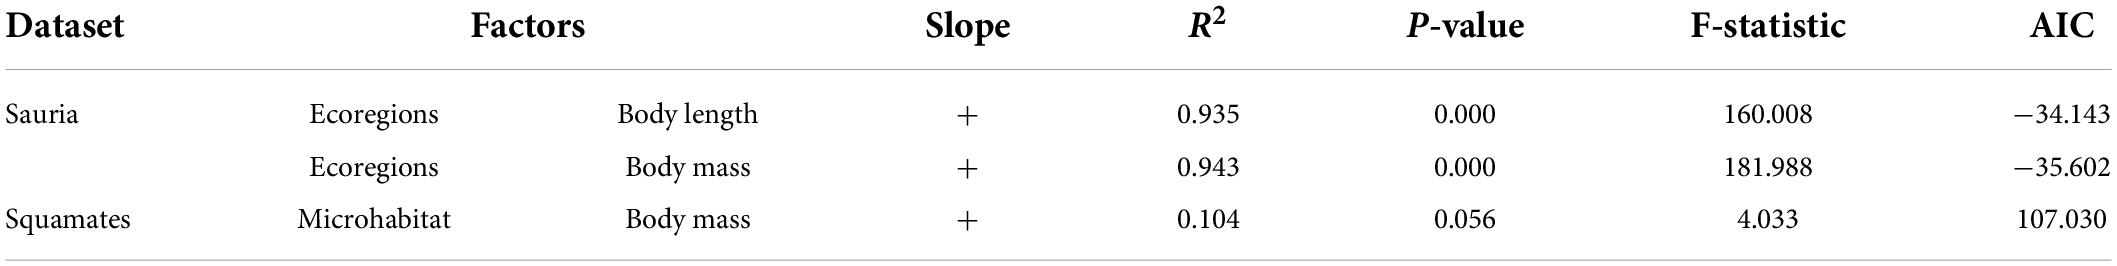
Table 7. Association analyses between phenotypes and ecological factors.
Discussion
It is well known that extant squamates span six orders of magnitude in body size. During adaptive radiation, both large body size and small body size all have adaptive advantages and disadvantages. However, little is known about the mechanism of body size evolution in squamates. In the present study, we combined the methods of comparative genomics, bioinformatics and ecology to conduct detailed analyses of body-size-related genes in lizards and snakes. We found different evolutionary patterns of body-size-related genes in different-bodied species, and explored the relationship between gene evolution and morphological/ecological variables, which preliminarily revealed the genetic basis and ecological adaptation of body size evolution in squamates.
Adaptive evolution of body-size-related genes
Site model found the number of positively selected genes in snakes was higher than that in lizards. According to data on body size for global squamates species (Feldman et al., 2016), the maximum body length and body mass of snakes have a wider ranger than that of lizards, and are obviously larger than lizards. Therefore, more genes may be required to be under positive selection to participate in the body size differentiation of snakes and regulate the process of growth and development. In addition, the global ω values of body-size-related genes in snakes was generally higher than that in lizards, which was another important evidence for the above inference.
Most notably, although body-size-related genes in snakes evolved at a faster rate overall, lizards and snakes also shared the same positively selected genes, COL10A, GHR, and NPC1. It has been reported that the increased and decreased expression of these three genes and mutations in genes all could cause the changes (overgrowth or dwarfism) in body size. Similarly, positive selection signals of COL10A, GHR, and NPC1 in our study provided the molecular evidence for their roles of regulating the adaptive evolution of body size in squamates. On the one hand, COL10A1 is overexpressed in a variety of tumors and plays a pivotal role in cell proliferation, migration, invasion, and tumor vasculature (Chapman et al., 2012; Li et al., 2018); on the other hand, the amino acid substitution G590R in the alpha1 (X) chain of type X collagen, which is encoded by COL10A1, resulted in dwarfism and growth plate abnormality in Sus scrofa (Nielsen et al., 2000). Moreover, studies in several vertebrate species have clearly demonstrated that GH/IGF-1 pathway is a major controller for growth rate and body size (Jia et al., 2018). GH binds to GHR to exert biological functions, thereby activating a series of intracellular pathways; GHR deficiency leads to growth and metabolic disturbances, whereas its increased expression is associated with various diseases, such as cancer (Dehkhoda et al., 2018). In addition, NPC1 protein plays an important role in essential metabolic activities during development, such as subcellular lipid transport, the balance of body weight, the function and formation of platelet, and its mutation is related to normal weight gain (Meyre et al., 2009), and NPC1-null mice showed delayed weight loss and decreased food intake (Xie et al., 1999).
Evolutionary patterns of body-size-related genes in lizards and snakes with contrasting body size
The body size of squamates species varies significantly. This study respectively divided the representative species of lizards and snakes into large and small bodies, and then explored the evolutionary patterns of lizards and snakes by PMAL v4.9. Branch models displayed that GALNS was subjected to significantly different selective pressure in lizards and snakes with different body size. GALNS is a lysosomal enzyme that degrades keratan sulfate (KS) and chondroitin-6-sulfate (C6S), and its deficiency leads to dwarfism with abnormal bone and connective tissue (Yasuda et al., 2013). In our study, the evolutionary rate of GALNS in small-bodied lizards (ω = 0.118) was higher than that in large-bodied lizards (ω = 0.070), and similarly, the evolutionary rate of GALNS in small-bodied snakes (ω = 0.261) was higher than that in large-bodied snakes (ω = 0.097), which indicated that the activity of GALNS enzymes in small-bodied lizards and snakes might be reduced, and the accumulation of KS and C6S provided the possibility for the body size reduction of squamates. This result is in contrast to what was found in cetaceans, where GALNS of large-bodied cetaceans had a higher evolutionary rate than that of small-bodied cetaceans (Sun, 2017). These means that the change of evolutionary rate in GALNS could affect the activity of enzymes, and thus regulate the evolution of body size in vertebrates.
Spearman correlation analyses showed the evidence of the high correlation of ω values for large lizards and large snakes (Spearman’s ρ = 0.730; p < 0.01), suggesting the similar evolutionary patterns in the process of evolving into larger body size. This also provided a molecular basis for the partition in further selective pressure analyses, where large-bodied species were set as the foreground branches. In the lizard-only and snake-only datasets, CDKN2C was under divergent selection between the lineages of large-bodied species and small-bodied species, and exhibited the relaxation of purifying selection (ωforeground > ωbackground) in the lineages of large-bodied species, whereas CDKN2C was only positively selected in lizards (ωforeground > 1). It has been reported that cell proliferation is tightly regulated by the dosage balance between cyclin-dependent kinases (CDK) and CDK inhibitors (CKI), which are critical cell cycle regulators) (Hubbi and Semenza, 2015). CDKN2 family specifically inhibits CDK4 and CDK6, resulting in their inability to bind and activate cyclin D, and then arresting in G1-phase (Sherr and Roberts, 1999). Expression data analyses of the pleiotropic genes obtained from genome-wide association studies (GWAS) revealed that CDKN2C was significantly correlated with body mass index (BMI) and insulin resistance (p = 1.99E-12 and p = 6.27E-11), suggesting its roles in type 2 diabetes (T2D) and obesity (Zeng et al., 2021). In addition, genomic analysis of Xenopus found that CDKN2C was differentially expressed between chromosomes L and S, and the conserved non-coding sequence (CNS) of CDKN2C genomic loci on X. laevis and X. tropicalis ChrS had enhanced activity in regulating expression levels (Tanaka et al., 2017), affecting the development and health of animals. In a word, the expression of CDKN2C was related to body mass, and the variability and fragility leading to the generation of new functions and expression patterns were discovered in the relative species of reptiles, which all improves the possibility of adjusting the body size of reptiles.
We examined the positive signal of FBN1 in the lineages of small-bodied and large-bodied snakes. FBN1 encodes fibrillin-1 with 350 kDa in length that has positive effect on the integrity and functions of all connective tissues (Sakai et al., 2016). The mutations of FBN1 are diverse, up to 2700 (Caputi et al., 2002), which could cause abnormal structure of microfibrils and even diseases, including Marfan syndrome (MFS), Weill-Marchesani syndrome (WMS) and so on. Mutations at different loci of FBN1 may lead to different phenotypes. For example, the major feature of Marfan syndrome is usually tall stature. However, some studies have found that only mutations in the TGFβ binding-protein-like domain 5 (TB5) of FBN1 triggered acromelic dysplasia with severe short stature phenotypes opposite of MFS, such as geleophysic dysplasia (GD), acromicric dysplasia (AD), WMS (Le Goff et al., 2011). In the present study, we detected a positively selected site (PP > 0.8) in the terminal branch of the small-bodied hot-spring snakes T. baileyi and thirteen positively selected sites (PP > 0.8) in the united branch of large-bodied snakes O. hannah and P. bivittatus. There were no overlapping positive selection sites between these two branches. Consistent with the descriptions in the literature, FBN1 was also found to play an important role in the increase and decrease of body size in cetaceans (Sun, 2017), and in our study this gene was positively selected in both large-bodied and small-bodied species of snakes, and sites under positive selection were completely different.
Our study also found that LCORL has higher global ω values in both lizards and snakes, and was positively selected along the lineages to the LCA of larger-bodied species (the LCA of P. mucrosquamatus and P. flavoviridis, the LCA of P. guttatus and P. obsoletus). LCORL contains a characteristic motif of transcription factors, and is considered to play a significant role during spermatogenesis in the testes (Lindholm-Perry et al., 2013); analyses of tissues from mice indicated that LCORL are capable of activating transcription (Metzger et al., 2013). In order to realize various functions with the same DNA-binding activity, LCORL may interact with other functional proteins to alter or specialize their functions or target genes (Kunieda et al., 2003). In addition, GWAS analyses showed that the polymorphisms of LCORL was significantly associated with the length of human trunk and hip axis, and the rate of height growth in children (Soranzo et al., 2009). The functions of LCORL, particularly similar to a transcription factor, explain its roles in regulating body size evolution in squamates. However, further association analyses with squamate phenotypic data are required, and we also need to explore how this gene works by a series of function experiments.
The relationship between phenotypes and body-size-related genes
Genes (AKT1, BMP1, IGF1, SOX5, SOX7) whose evolutionary rates were significantly correlated with body length and body mass were exactly same, whereas only the evolutionary rates of BMP5, BMP7, GPC6, SH2B3 and SOX17 were strongly associated with both body length and body mass in snakes. Based on the results of selection pressure analyses, it was found that BMP1 in lizards and SH2B3 in snakes were not only genes that were significantly positively selected along the branches of large-bodied species, but also genes that were significantly negatively correlated with body length and body mass. BMPs are important growth regulators of embryogenesis and tissue homeostasis in the adult organism (Correns et al., 2021). Osteogenesis imperfecta (OI) is an inherited bone disease caused by gene mutations characterized by increased bone fragility and recurrent fractures, and more than 20 causative genes including BMP1 have been identified so far (Correns et al., 2021). BMP1/Tolloid (TLD) is the prototype of the metalloproteinases family, whose functions include the proteolytic removal of the carboxy-terminal propeptide in procollagens I, II, and III and the amino-terminal propeptide in procollagens V and XI and the regulation of embryonic development in different species (Xi et al., 2021). In a study of OI patients lacking BMP1/mTLD, delayed cleavage of type I collagen C-propeptide, disassembly of type I/V collagen fibrils, and impaired processing of small leucine-rich proteoglycans (SLRP) were observed (Pollitt et al., 2016). Hence, the evolutionary rate of BMP1 in lizards was significantly negatively correlated with body length (R2 = 0.595, p = 0.002) and body mass (R2 = 0.571, p = 0.003), and this gene is subject to positive selection, inferring that lizards might strengthen the function of BMP1 protein to regulate the bone development, because bone mass is also a measure of body size.
As a member of the SH2B adaptor protein family, SH2B3 has multiple functional domains, containing the SH2 domain necessary for binding to and repressing target proteins, and the PH domain that distinguishes and translocates phosphoinositide to the cell membrane, and participates in the signal transduction of regulating various cytokine signaling cascade (Blass et al., 2016). On the one hand, SH2B3 dysregulation is linked to aging, cardiovascular disease, myeloproliferative cancers and so on; on the other hand, SH2B3 binds and regulates several key signaling pathways negatively, such as cell proliferation and differentiation (Kuo et al., 2020). In the snake-only dataset, the evolutionary rate of SH2B3 was significantly negatively associated with body length (R2 = 0.560, p = 0.001) and body mass (R2 = 0.667, p < 0.001), and was positively selected overall. The evidence of positive selection signals was examined at the united branch of large-bodied species in snakes and at the ancestral branch of Gekkonidae in lizards, suggesting that SH2B3 might guide body size to increase and decrease by activating or inhibiting growth and development related signaling pathways in squamates. Nevertheless, in terms of the genes and sites under positive selection detected in our study, functional experiments are still needed to verify their specific mechanism.
Effects of ecological variables on body size
Different ecological variables have different effects on lizards and snakes. We found that the influence of climate on body size evolution in lizards and snakes was not significant, which was consistent with previous study (Slavenko et al., 2019). Slavenko et al. (2019) found that body size evolution in global squamate reptiles was independent of multiple climatic components. In addition, no correlation between microhabitat and body length/body mass in the lizard-only and snake-only datasets was discovered (p > 0.05), but there was a weak correlation between microhabitat and body mass in the squamate dataset, which were generally different from previous studies. Aquatic lizards and snakes are usually larger than terrestrial lizards and snakes, and arboreal snakes are lighter than terrestrial snakes (Meiri, 2008; Feldman and Meiri, 2013). Actually, in squamates, diversification rate was more closely related to microhabitat than climate, which explained 37% of the variation in diversification rate between clades (Bars-Closel et al., 2017); similarly, strong effect of microhabitat on diversification rate was found in frogs (Moen and Wiens, 2017). Therefore, we think that the divergence between our results and previous studies is related to the limited sequenced squamate genomes and poor quality of genome assembly. In the future, for one thing, with the subsequent detection of reptilian genomes, we could add more species into selective analyses and association analyses, such as crocodiles, turtles and new squamates; for another thing, more ecological factors could be included in to further explore the general ecological laws.
Effects of ecological variables on body-size-related genes
In our study, the effects of ecological variables on body size of squamates were not obvious, but it was found that ecological variables had a greater impact on the evolutionary rate of body-size-related genes. In terms of the number of significantly correlated genes, the genes correlated to climatic-niche rate for PC2 were the most, followed by climatic-niche rate for PC3 and Bio1. From the best fitting models of genes significantly affected by multiple ecological variables, most of the models contained five climate-related variables, range size (number of ecoregions), and rate of range expansion in species (ecoregions/age), and the contribution of climate-related variables to the variation in evolutionary rate of body-size-related genes were relatively higher. Although studies have found that climate is not the major determinant of the body size evolution in squamates (Slavenko et al., 2019), many literatures show that body size of reptiles is closely related to climate. For instance, reptiles prefer to distribute in hot and arid regions (Roll et al., 2017); contrary to Bergman’s rule, turtles at lower latitudes generally exhibit larger body size (Angielczyk et al., 2015). Therefore, these also explain why our study discovered significant effects of climate-related variables on the evolutionary rate of body-size-related genes at the molecular level. Interestingly, SOX30 in the snake-only dataset was the gene affected by the largest number of ecological variables, and its best-fitting model contained two variables: number of ecoregions and Bio1 (annual mean temperature), which respectively explained ∼48% and ∼28% of the variation in the evolutionary rate. Furthermore, SOX30 also was detected under positive selection along the united branch of large-bodied snakes, and its evolutionary rate was significantly negatively correlated with body length in snakes, which were consistent with its important function to inhibit cell proliferation (Hao et al., 2018; Liu et al., 2020). As a master switch of desmosomal genes, SOX30 suppressed lung adenocarcinoma cell proliferation, migration and invasion by activating the transcription of desmosomal genes (Hao et al., 2018). Overexpression of SOX30 significantly reduces the expression of β-catenin, resulting in the inactivation of the Wnt/β-catenin pathway (Liu et al., 2020), which is a critical pathway for regulating the animal body size. All in all, for squamate reptiles, ecological factors affect the evolutionary rate of body-size-related genes at the molecular level and body size at the physiological level. Due to the organism’s self-regulation mechanism, small changes in ecological factors may not be reflected in phenotype, but may cause the variation in the evolutionary rate of body-size-related genes, thereby controlling the synthesis of related proteins and changing the activity of related enzymes in response to environmental changes.
Conclusion
We accessed the evolutionary patterns of 101 body-size-related genes in 12 saurian and 18 serpentine genomes, and discovered that snakes had significantly higher positive selection pressure for body-size-related genes than lizards. The same and different genes under positive selection and divergent selection were found along the united branches of large-bodied species in the lizard-only and snake-only datasets. Moreover, genes in large-bodied lizards and large-bodied snakes had similar evolutionary rate. The body length and body mass of lizards were significantly positively correlated with the number of ecoregions. The effects of climatic factors on body size of lizards and snakes were relatively small, but the contribution of these factors to the variation in evolutionary rate of body-size-related genes was higher. In brief, evolutionary rates of body-size-related genes and various ecological factors in some degree involve in driving body size evolution of squamates.
Data availability statement
The datasets presented in this study can be found in online repositories. The names of the repository/repositories and accession number(s) can be found in the article/Supplementary material.
Author contributions
PL designed and supervised the experiments. HW performed the experiments. HW, SG, and LX analyzed the data. HW and PL prepared the manuscript. All authors discussed the results and implications and commented on the manuscript.
Acknowledgments
For financial support, we thank the Natural Science Foundation of the Jiangsu Higher Education Institutions of China (19KJA330001 to PL), the Priority Academic Program Development of Jiangsu Higher Education Institutions (PAPD). We also thank the Topic Editors (Hongliang Lu, Guohua Ding, Hong Li, and Yuanting Jin) and colleagues (Yanfu Qu, Wenyi Zhang, Pengcheng Wang, Chaochao Hu, Jie Yan, and Kaiya Zhou) for helpful comments on the manuscript. No permits were needed for this research.
Conflict of interest
The authors declare that the research was conducted in the absence of any commercial or financial relationships that could be construed as a potential conflict of interest.
Publisher’s note
All claims expressed in this article are solely those of the authors and do not necessarily represent those of their affiliated organizations, or those of the publisher, the editors and the reviewers. Any product that may be evaluated in this article, or claim that may be made by its manufacturer, is not guaranteed or endorsed by the publisher.
Supplementary material
The Supplementary Material for this article can be found online at: https://www.frontiersin.org/articles/10.3389/fevo.2022.1007409/full#supplementary-material
Footnotes
References
Angielczyk, K. D., Burroughs, R. W., and Feldman, C. R. (2015). Do turtles follow the rules? Latitudinal gradients in species richness, body size, and geographic range area of the world’s turtles. J. Exp. Zool. Part B Mol. Dev. Evol. 324, 270–294. doi: 10.1002/jez.b.22602
Bars-Closel, M., Kohlsdorf, T., Moen, D. S., and Wiens, J. J. (2017). Diversification rates are more strongly related to microhabitat than climate in squamate reptiles (lizards and snakes). Evolution 71, 2243–2261. doi: 10.1111/evo.13305
Bielawski, J. P., and Yang, Z. (2003). Maximum likelihood methods for detecting adaptive evolution after gene duplication. J. Struct. Funct. Genomics 3, 201–212. doi: 10.1023/A:1022642807731
Blass, G., Mattson, D. L., and Staruschenko, A. (2016). The function of SH2B3 (LNK) in the kidney. Am. J. Physiol. Renal Physiol. 311, F682–F685. doi: 10.1152/ajprenal.00373.2016
Burnham, K. P., and Anderson, D. R. (2002). Model Selection and Multimodel Inference. New York, NY: Springer.
Caputi, M., Kendzior, R. J. Jr., and Beemon, K. L. (2002). A nonsense mutation in the fibrillin-1 gene of a Marfan syndrome patient induces NMD and disrupts an exonic splicing enhancer. Genes Dev. 16, 1754–1759. doi: 10.1101/gad.997502
Castresana, J. (2000). Selection of conserved blocks from multiple alignments for their use in phylogenetic analysis. Mol. Biol. Evol. 17, 540–552. doi: 10.1093/oxfordjournals.molbev.a026334
Chapman, K. B., Prendes, M. J., Sternberg, H., Kidd, J. L., Funk, W. D., Wagner, J., et al. (2012). COL10A1 expression is elevated in diverse solid tumor types and is associated with tumor vasculature. Futur. Oncol. 8, 1031–1040. doi: 10.2217/fon.12.79
Clayton, P. E., Hanson, D., Magee, L., Murray, P. G., Saunders, E., Abu-Amero, S. N., et al. (2012). Exploring the spectrum of 3-M syndrome, a primordial short stature disorder of disrupted ubiquitination. Clin. Endocrinol. 77, 335–342. doi: 10.1111/j.1365-2265.2012.04428.x
Clifton, I. T., Chamberlain, J. D., and Gifford, M. E. (2020). Role of phenotypic plasticity in morphological differentiation between watersnake populations. Integr. Zool. 15, 329–337. doi: 10.1111/1749-4877.12431
Correns, A., Zimmermann, L.-M. A., Baldock, C., and Sengle, G. (2021). BMP antagonists in tissue development and disease. Matrix Biol. Plus 11:100071. doi: 10.1016/j.mbplus.2021.100071
Dehkhoda, F., Lee, C. M. M., Medina, J., and Brooks, A. J. (2018). The growth hormone receptor: Mechanism of receptor activation, cell signaling, and physiological aspects. Front. Endocrinol. 9:35. doi: 10.3389/fendo.2018.00035
Feldman, A., and Meiri, S. (2013). Length-mass allometry in snakes. Biol. J. Linn. Soc. 108, 161–172. doi: 10.1371/journal.pone.0180791
Feldman, A., Sabath, N., Pyron, R. A., Mayrose, I., and Meiri, S. (2016). Body sizes and diversification rates of lizards, snakes, amphisbaenians and the tuatara. Glob. Ecol. Biogeogr. 25, 187–197. doi: 10.1111/geb.12398
Gearty, W., and Payne, J. L. (2020). Physiological constraints on body size distributions in Crocodyliformes. Evolution (N. Y.) 74, 245–255. doi: 10.1111/evo.13901
Hao, X., Han, F., Ma, B., Zhang, N., Chen, H., Jiang, X., et al. (2018). SOX30 is a key regulator of desmosomal gene suppressing tumor growth and metastasis in lung adenocarcinoma. J. Exp. Clin. Cancer Res. 37:111. doi: 10.1186/s13046-018-0778-3
Heng, B. C., Zhang, X., Aubel, D., Bai, Y., Li, X., Wei, Y., et al. (2021). An overview of signaling pathways regulating YAP/TAZ activity. Cell. Mol. Life Sci. 78, 497–512. doi: 10.1007/s00018-020-03579-8
Hubbi, M. E., and Semenza, G. L. (2015). Regulation of cell proliferation by hypoxia-inducible factors. Am. J. Physiol. Cell Physiol. 309, C775–C782. doi: 10.1152/ajpcell.00279.2015
Hwang, I. T., Mizuno, Y., Amano, N., Lee, H. J., Shim, Y. S., Nam, H.-K., et al. (2020). Role of NPR2 mutation in idiopathic short stature: Identification of two novel mutations. Mol. Genet. Genomic. Med. 8:e1146. doi: 10.1002/mgg3.1146
IUCN (2021). The IUCN Red List of Threatened Species. Available online at: https://www.iucnredlist.org (accessed on December 18, 2021)
Jia, J., Ahmed, I., Liu, L., Liu, Y., Xu, Z., Duan, X., et al. (2018). Selection for growth rate and body size have altered the expression profiles of somatotropic axis genes in chickens. PLoS One 13:e0195378. doi: 10.1371/journal.pone.0195378
Keilwagen, J., Hartung, F., and Grau, J. (2019). GeMoMa: Homology-based gene prediction utilizing intron position conservation and RNA-seq data. Methods Mol. Biol. 1962, 161–177. doi: 10.1007/978-1-4939-9173-0_9
Kimura, M. (1983). The Neutral Theory of Molecular Evolution. Cambridge: Cambridge University Press, doi: 10.1017/CBO9780511623486
Kratochvíl, L., Kubika, L., Vohralík, M., and Starostová, Z. (2018). Variability in vertebral numbers does not contribute to sexual size dimorphism, interspecific variability, or phenotypic plasticity in body size in geckos (Squamata: Gekkota: Paroedura). J. Exp. Zool. Part A Ecol. Integr. Physiol. 329, 185–190. doi: 10.1002/jez.2159
Kulyomina, Y., Moen, D. S., and Irschick, D. J. (2019). The relationship between habitat use and body shape in geckos. J. Morphol. 280, 722–730. doi: 10.1002/jmor.20979
Kunieda, T., Park, J.-M., Takeuchi, H., and Kubo, T. (2003). Identification and characterization of Mlr1,2: Two mouse homologues of Mblk-1, a transcription factor from the honeybee brain. FEBS Lett. 535, 61–65. doi: 10.1016/S0014-5793(02)03858-9
Kuo, C.-L., Joaquim, M., Kuchel, G. A., Ferrucci, L., Harries, L. W., Pilling, L. C., et al. (2020). The longevity-associated SH2B3 (LNK) genetic variant: Selected aging phenotypes in 379,758 subjects. J. Gerontol. A Biol. Sci. Med. Sci. 75, 1656–1662. doi: 10.1093/gerona/glz191
Ladoux, B., Nelson, W. J., Yan, J., and Mège, R. M. (2015). The mechanotransduction machinery at work at adherens junctions. Integr. Biol. 7, 1109–1119. doi: 10.1039/c5ib00070j
Le Goff, C., and Cormier-Daire, V. (2012). From tall to short: The role of TGFβ signaling in growth and its disorders. Am. J. Med. Genet. Part C Semin. Med. Genet. 160C, 145–153. doi: 10.1002/ajmg.c.31337
Le Goff, C., Mahaut, C., Wang, L. W., Allali, S., Abhyankar, A., Jensen, S., et al. (2011). Mutations in the TGFβ binding-protein-like domain 5 of FBN1 are responsible for acromicric and geleophysic dysplasias. Am. J. Hum. Genet. 89, 7–14. doi: 10.1016/j.ajhg.2011.05.012
Li, P., and Wiens, J. J. (2022). What drives diversification? Range expansion tops climate, life history, habitat and size in lizards and snakes. J. Biogeogr. 49, 237–247. doi: 10.1111/jbi.14304
Li, T., Huang, H., Shi, G., Zhao, L., Li, T., Zhang, Z., et al. (2018). TGF-β1-SOX9 axis-inducible COL10A1 promotes invasion and metastasis in gastric cancer via epithelial-to-mesenchymal transition. Cell Death Dis. 9:849. doi: 10.1038/s41419-018-0877-2
Lindholm-Perry, A. K., Kuehn, L. A., Oliver, W. T., Sexten, A. K., Miles, J. R., Rempel, L. A., et al. (2013). Adipose and muscle tissue gene expression of two genes (NCAPG and LCORL) located in a chromosomal region associated with cattle feed intake and gain. PLoS One 8:e80882. doi: 10.1371/journal.pone.0080882
Liu, Y., Wang, W., Li, Y., and Huang, Y. (2020). SOX30 confers a tumor suppressive effect in acute myeloid leukemia through inactivation of Wnt/β-catenin signaling. Mol. Cell. Probes 52:101578. doi: 10.1016/j.mcp.2020.101578
Löytynoja, A. (2014). Phylogeny-aware alignment with PRANK. Methods Mol. Biol. 1079, 155–170. doi: 10.1007/978-1-62703-646-7_10
Martins, A. R., and Murta-Fonseca, R. A. (2022). “Squamate morphology,” in Encyclopedia of Animal Cognition and Behavior, eds J. Vonk and T. K. Shackelford (Cham: Springer International Publishing), 6682–6694. doi: 10.1007/978-3-319-55065-7_150
Meiri, S. (2008). Evolution and ecology of lizard body sizes. Glob. Ecol. Biogeogr. 17, 724–734. doi: 10.1111/j.1466-8238.2008.00414.x
Meiri, S. (2018). Traits of lizards of the world: Variation around a successful evolutionary design. Glob. Ecol. Biogeogr. 27, 1168–1172. doi: 10.1111/geb.12773
Metzger, J., Gast, A. C., Schrimpf, R., Rau, J., Eikelberg, D., Beineke, A., et al. (2017). Whole-genome sequencing reveals a potential causal mutation for dwarfism in the Miniature Shetland pony. Mamm. Genome 28, 143–151. doi: 10.1007/s00335-016-9673-4
Metzger, J., Schrimpf, R., Philipp, U., and Distl, O. (2013). Expression levels of LCORL are associated with body size in horses. PLoS One 8:e56497. doi: 10.1371/journal.pone.0056497
Meyre, D., Delplanque, J., Chèvre, J. C., Lecoeur, C., Lobbens, S., Gallina, S., et al. (2009). Genome-wide association study for early-onset and morbid adult obesity identifies three new risk loci in European populations. Nat. Genet. 41, 157–159. doi: 10.1038/ng.301
Moen, D. S., and Wiens, J. J. (2017). Microhabitat and climatic niche change explain patterns of diversification among frog families. Am. Nat. 190, 29–44. doi: 10.1086/692065
Montgomery, S. H., Capellini, I., Venditti, C., Barton, R. A., and Mundy, N. I. (2011). Adaptive evolution of four microcephaly genes and the evolution of brain size in anthropoid primates. Mol. Biol. Evol. 28, 625–638. doi: 10.1093/molbev/msq237
Nielsen, V. H., Bendixen, C., Arnbjerg, J., Sørensen, C. M., Jensen, H. E., Shukri, N. M., et al. (2000). Abnormal growth plate function in pigs carrying a dominant mutation in type X collagen. Mamm. Genome 11, 1087–1092. doi: 10.1007/s003350010212
Oldham, S., and Hafen, E. (2003). Insulin/IGF and target of rapamycin signaling: A TOR de force in growth control. Trends Cell Biol. 13, 79–85. doi: 10.1016/S0962-8924(02)00042-9
Orme, D., Rob, F., and Gavin, T. (2018). The Caper Package: Comparative Analysis of Phylogenetics and Evolution in R. Available online at: https://cran.rproject.org/package=caper (accessed April 16, 2018).
Outi, V., Marianthi, G., Rainer, L., Pia, V., Antti, K., Anniina, R., et al. (2006). Pituitary adenoma predisposition caused by germline mutations in the AIP gene. Science 312, 1228–1230. doi: 10.1126/science.1126100
Pagel, M. (1999). Inferring the historical patterns of biological evolution. Nature 401, 877–884. doi: 10.1038/44766
Park, M., Kim, K. H., Jaiswal, V., Choi, J., Chun, J. L., Seo, K. M., et al. (2021). Effect of black ginseng and silkworm supplementation on obesity, the transcriptome, and the gut microbiome of diet-induced overweight dogs. Sci. Rep. 11:16334. doi: 10.1038/s41598-021-95789-8
Pie, M. R., Campos, L. L. F., Meyer, A. L. S., and Duran, A. (2017). The evolution of climatic niches in squamate reptiles. Proc. R. Soc. B Biol. Sci. 284:20170268. doi: 10.1098/rspb.2017.0268
Pollitt, R. C., Saraff, V., Dalton, A., Webb, E. A., Shaw, N. J., Sobey, G. J., et al. (2016). Phenotypic variability in patients with osteogenesis imperfecta caused by BMP1 mutations. Am. J. Med. Genet. Part A 170, 3150–3156. doi: 10.1002/ajmg.a.37958
Pyron, R. A., and Wiens, J. J. (2013). Large-scale phylogenetic analyses reveal the causes of high tropical amphibian diversity. Proc. Biol. Sci. 280:20131622. doi: 10.1098/rspb.2013.1622
Richardson, C. J., Schalm, S. S., and Blenis, J. (2004). PI3-kinase and TOR: PIKTORing cell growth. Semin. Cell Dev. Biol. 15, 147–159. doi: 10.1016/j.semcdb.2003.12.023
Roll, U., Feldman, A., Novosolov, M., Allison, A., Bauer, A. M., Bernard, R., et al. (2017). The global distribution of tetrapods reveals a need for targeted reptile conservation. Nat. Ecol. Evol. 1, 1677–1682. doi: 10.1038/s41559-017-0332-2
Sakai, L. Y., Keene, D. R., Renard, M., and De Backer, J. (2016). FBN1: The disease-causing gene for Marfan syndrome and other genetic disorders. Gene 591, 279–291. doi: 10.1016/j.gene.2016.07.033
Scharf, I., and Meiri, S. (2013). Sexual dimorphism of heads and abdomens: Different approaches to ‘being large’ in female and male lizards. Biol. J. Linn. Soc. 110, 665–673. doi: 10.1111/bij.12147
Sherr, C. J., and Roberts, J. M. (1999). CDK inhibitors: Positive and negative regulators of G1-phase progression. Genes Dev. 13, 1501–1512. doi: 10.1101/gad.13.12.1501
Slavenko, A., Feldman, A., Allison, A., Bauer, A. M., Böhm, M., Chirio, L., et al. (2019). Global patterns of body size evolution in squamate reptiles are not driven by climate. Glob. Ecol. Biogeogr. 28, 471–483. doi: 10.1111/geb.12868
Slavenko, A., Tallowin, O. J. S., Itescu, Y., Raia, P., and Meiri, S. (2016). Late Quaternary reptile extinctions: Size matters, insularity dominates. Glob. Ecol. Biogeogr. 25, 1308–1320. doi: 10.1111/geb.12491
Soranzo, N., Rivadeneira, F., Chinappen-Horsley, U., Malkina, I., Richards, J. B., Hammond, N., et al. (2009). Meta-analysis of genome-wide scans for human adult stature identifies novel Loci and associations with measures of skeletal frame size. PLoS Genet. 5:e1000445. doi: 10.1371/journal.pgen.1000445
Sun, Y. (2017). Adaptive evolution of body-size-related genes in cetaceans. Ph.D. thesis. Nanjing: Nanjing Normal University. doi: 10.27245/d.cnki.gnjsu.2017.000009
Taciak, B., Pruszynska, I., Kiraga, L., Bialasek, M., and Krol, M. (2018). Wnt signaling pathway in development and cancer. J. Physiol. Pharmacol. 69, 185–196. doi: 10.26402/JPP.2018.2.07
Tanaka, T., Ochi, H., Takahashi, S., Ueno, N., and Taira, M. (2017). Genes coding for cyclin-dependent kinase inhibitors are fragile in Xenopus. Dev. Biol. 426, 291–300. doi: 10.1016/j.ydbio.2016.06.019
Tonini, J. F. R., Beard, K. H., Ferreira, R. B., Jetz, W., and Pyron, R. A. (2016). Fully-sampled phylogenies of squamates reveal evolutionary patterns in threat status. Biol. Conserv. 204, 23–31. doi: 10.1016/j.biocon.2016.03.039
Xi, L., Lv, S., Zhang, H., and Zhang, Z.-L. (2021). Novel mutations in BMP1 result in a patient with autosomal recessive osteogenesis imperfecta. Mol. Genet. Genomic Med. 9:e1676. doi: 10.1002/mgg3.1676
Xie, C., Turley, S. D., Pentchev, P. G., and Dietschy, J. M. (1999). Cholesterol balance and metabolism in mice with loss of function of Niemann-Pick C protein. Am. J. Physiol. Endocrinol. Metab. 276, E336–E344. doi: 10.1152/ajpendo.1999.276.2.e336
Xing, S., Da, P., Xu, P., and Qi, H. (2018). Study on biological characteristics of Tibetan hot spring snakes. Plateau Sci. Res. 2, 1–6. doi: 10.16249/j.cnki.2096-4617.2018.04.001
Yang, C., Wang, K., Liang, Q., Tian, T.-T., and Zhong, Z. (2021). Role of NSD1 as potential therapeutic target in tumor. Pharmacol. Res. 173:105888. doi: 10.1016/j.phrs.2021.105888
Yang, Z. (2005). Bayes empirical bayes inference of amino acid sites under positive election. Mol. Biol. Evol. 22, 1107–1118. doi: 10.1093/molbev/msi097
Yang, Z. (2007). PAML 4: Phylogenetic analysis by maximum likelihood. Mol. Biol. Evol. 24, 1586–1591. doi: 10.1093/molbev/msm088
Yasuda, E., Fushimi, K., Suzuki, Y., Shimizu, K., Takami, T., Zustin, J., et al. (2013). Pathogenesis of Morquio A syndrome: An autopsied case reveals systemic storage disorder. Mol. Genet. Metab. 109, 301–311. doi: 10.1016/j.ymgme.2013.04.009
Zeng, Y., He, H., Zhang, L., Zhu, W., Shen, H., Yan, Y.-J., et al. (2021). GWA-based pleiotropic analysis identified potential SNPs and genes related to type 2 diabetes and obesity. J. Hum. Genet. 66, 297–306. doi: 10.1038/s10038-020-00843-4
Keywords: squamate, phenotypic plasticity, body-size-related genes, selective pressure, ecological adaptation
Citation: Wu H, Gao S, Xia L and Li P (2022) Evolutionary rates of body-size-related genes and ecological factors involved in driving body size evolution of squamates. Front. Ecol. Evol. 10:1007409. doi: 10.3389/fevo.2022.1007409
Received: 30 July 2022; Accepted: 19 August 2022;
Published: 02 September 2022.
Edited by:
Hong-Liang Lu, Hangzhou Normal University, ChinaReviewed by:
Zhuo Chen, Henan Normal University, ChinaChi-Xian Lin, Hainan Tropical Ocean University, China
Copyright © 2022 Wu, Gao, Xia and Li. This is an open-access article distributed under the terms of the Creative Commons Attribution License (CC BY). The use, distribution or reproduction in other forums is permitted, provided the original author(s) and the copyright owner(s) are credited and that the original publication in this journal is cited, in accordance with accepted academic practice. No use, distribution or reproduction is permitted which does not comply with these terms.
*Correspondence: Peng Li, bGlwZW5nQG5qbnUuZWR1LmNu