 Yuhang Feng
 Hongling Zhang
 Xiaoye Jin
 Huang Jiang
 Zheng Ren
- Department of Forensic Medicine, Guizhou Medical University, Guiyang, China
As a single matrilineal gene, human mitochondrial DNA plays a very important role in the study of population genetics. The whole mitogenome sequences of 287 individuals of the Tai-Kadai-speaking population in Guizhou were obtained. It was discovered that there were 82, 104, and 94 haplotypes in 83 Bouyei individuals, 107 Dong individuals, and 97 Sui individuals, respectively; and the haplotype diversity in Bouyei, Dong, and Sui groups was 1.000 ± 0.02, 0.9993 ± 0.0015, and 0.999 ± 0.002, respectively. The result of neutrality tests of the Tai-Kadai-speaking population in Guizhou showed significant negative values, and the analysis of mismatch distribution showed an obvious unimodal distribution. The results implied that Guizhou Tai-Kadai-speaking populations had high genetic diversities and may have experienced recent population expansion. In addition, the primary haplogroups of studied populations were M*, F, B, D, and R*, implying that they may origin from Southern China. The matrilineal genetic structure of the Tai-Kadai-speaking populations in Guizhou was analyzed by merging the mitogenome data of 79 worldwide populations as reference data. The results showed that there were close relationships between studied populations and other Tai-Kadai as well as some Austronesian populations in East and Southeast Asia. Overall, the mitogenome data generated in this study will provide important data for the study of genetic structure of Tai-Kadai speaking populations.
Introduction
Mitochondrial DNA (mtDNA) is the only DNA that exists outside the nucleus. The mtDNA has lower molecular weight and higher mutation rate than nuclear DNA (Chatterjee et al., 2006). Human mtDNA is widely used in medical genetics (Wallace, 2012; Murphy, 2018), demography (Rakha et al., 2017; Simão et al., 2018), forensic medicine (Zander et al., 2018; Mengge et al., 2020), anthropology (Torroni et al., 2006; Derenko et al., 2007), and molecular evolution (Galtier et al., 2009; Ho et al., 2011). It exists in hundreds to thousands of copies in each cell and is transmitted as a non-recombinant unit through matrilineal inheritance (Bandelt et al., 2012). The sequence variation of mitogenome is the result of accumulation along the mutation sequence of matrilineal inheritance. Therefore, based on the time range of these mutations, human mtDNA contains the molecular record of matrilineal family history (Derenko et al., 2007; Behar et al., 2008). In this way, the pedigree analysis of mtDNA may be valuable to reconstruct the female-specific migration trajectory and infer the geographical origin, as well as the phylogenetic relationships among different populations.
The analysis of mtDNA is traditionally carried out by Sanger-type sequencing (STS), which is costly and labor-intensive for the sequencing of the whole mitogenome (Gallimore et al., 2018; Ma et al., 2018; van Dijk et al., 2018). Although the control region (CR) sequencing of mtDNA can provide relevant information, complete mitogenome sequencing can significantly enhance the molecular resolution, detect variations among individuals or populations, and identify more detailed haplogroups (Heinz et al., 2017; Duong et al., 2018). Advances in next-generation sequencing (NGS) technology make it more feasible to sequence the whole mitogenome, which can reliably detect differences among individuals, as well as mtDNA mutations within a single individual, and reasonably infer the female-specific demographic history (Ko et al., 2014; Ma et al., 2018; Strobl et al., 2019; Wood et al., 2019). Compared with STS, the NGS substantially improves the sequence output, which is more time-saving and cost-effective (Kumar et al., 2019). The EMPOP database1 (Parson and Dür, 2007), which mainly aims to collect, quality control and present mitochondrial haplotypes (mitotype) from different populations around the world, has shared 48,572 quality-controlled mitotypes, covering 4,289 complete mitogenomes (Release 13). Above, the whole mitogenome data of the Guizhou Tai-Kadai-speaking populations could be detected by the NGS.
Northern China is considered to be the primitive center of the modern Sino-Tibetans, while Southern China is a place of origin of multi-ethnic groups, including the modern Hmong- Mien-, Tai- Kadai-, Austroasiatic-, and Austronesian-speaking populations. With a high degree of linguistic, cultural, and ethnic diversity, southern China has become an important area to study the historical evolution of these populations (Ning et al., 2020; Wang et al., 2021). Guizhou Province is located in southwest China, with the frontier character of other southwestern plateau lands: rough topography. In the past, there were many ethnic minorities in Guizhou Province, and the inconvenience of transportation has alternatively maintained the province’s ethnic diversity.2 The most important 18 permanent ethnic minorities in this province include Miao, Bouyei, Sui, Dong, and so on. Among them, the populations in our study, Bouyei, Sui, and Dong ethnic groups of the Tai-Kadai language family, all belong to the officially recognized 56 ethnic groups in China. According to historical records, the ancestors of the Tai-Kadai-speaking people are the ancient Baiyue tribes, that is, the aboriginal people residing in southern China. Compelled by war and famine during the Qin Dynasty (about the second century BC), the Chinese Han people continued to expand southward for a long-time. At the same time, a large number of Baiyue people immigrated to the southwest, forming the Tai-Kadai-speaking population. At present, genetic studies have revealed that, from the perspective of Y chromosome, the patrilineal consanguinity of the Tai-Kadai-speaking population was principally derived from the haplogroup O1a-M119 (Sun et al., 2021).
In the past, the genetic studies on the Tai-Kadai population were predominantly based on autosomal, X, Y STRs, and Indels, mainly to assess the effectiveness of forensic identification of STR and Indel markers (Yang et al., 2013; Ji et al., 2017; Chen et al., 2018; Guo et al., 2019; He et al., 2019). Up to now, the published literature has almost only carried out a small amount of analysis on the CR (Le et al., 2019; Feng et al., 2021). The inefficiency of mtDNA markers (HVR/CR) and unrepresentative sampling might hinder the analysis of the genetic structure of the Guizhou Tai-Kadai population. Accordingly, we collected 83 samples of Bouyei, 97 samples of Sui, and 107 samples of Dong in Guizhou, a total of 287 samples, and sequenced the entire mitogenome. Furthermore, the mtDNA sequence data or haplogroup information of other populations with different geographical distribution and language were incorporated into our data, to analyze the mtDNA diversity and genetic structure of the Tai-Kadai-speaking population in Guizhou from the perspective of mitochondrial matrilineal inheritance.
Materials and methods
Sample collection and DNA extraction
According to the principle of informed consent, blood samples were collected from 287 unrelated paternity test cases of the Tai-Kadai-speaking populations in Guizhou, including 83 samples of Bouyei, 97 samples of Sui, and 107 samples of Dong. These individuals were all unrelated aborigines of the Tai-Kadai language family in Guizhou within three generations. After we explained the purpose and procedure of the study, all participants gave their informed consent in writing. When collecting samples, the individual’s ethnic group is based on the “Ethnicity” on the ID card, which requires that the relatives within the third-level relationship of the person to be collected are of the same ethnicity. The geographical location of the above three population samples can be seen in Supplementary Figure 1. Ethical permission was issued by the Ethics Committee of Guizhou Medical University (2021 Ethics Approval Document No. 65), and in accordance with the recommendations of the revised World Medical Association (2013). The human genome DNA was extracted applying QIAamp DNA Mini Kit (Qiagen) and quantified using the Quantifiler Human DNA Quantification Kit (Thermo Fisher Science) on the Application Biosystem 7500 Real-time PCR system (Thermo Fisher Science) according to the manufacturer’s guidelines.
Mitochondrial DNA amplification, template preparation, and sequencing
The library was based on the MultipSeqTm AImumiCap Panel kit provided by Enlighten Biotechnology Company (Shanghai, China), the steps are as follows. First, the target DNA region were obtained by multiplex polymerase chain reaction amplification, including 5 μl RealCapChrMT Mix, 10 μl 3 × EnzymeHF, 1 μl template DNA (5 ng/μl), and 14 μl Nulease-Free H2O in a 30 μl system. The amplification was carried out under the conditions of 98°C for 3 min, 13 cycles of 98°C for 20 s, 58°C for 4 min, 7 cycles of 98°C for 20 s, 72°C for 1 min, and one full extension cycle of 72°C 2 min, holding at 10°C. The amplified products were further purified by the method of magnetic beads. Then, the indexes were appended to the purified products by re-amplification, and the target DNA region were enriched. The index-adding reaction was carried out in a 30 μl system, comprising 18 μl purified PCR products, 10 μl 3 × EnzymeHF, 1 μl I5MRBar, and 1 μl I7MRBar. The corresponding PCR procedure was 98°C 2 min, then 6 cycles with 98°C for 15 s, 58°C for 15 s, and 72°C for 15 s, lastly 72°C for 2 min, and stop reaction in 10°C. The reamplified product was purified with the magnetic beads method again. Finally, the constructed library was quantified by utilizing the Qubit 2.0 Fluorometer platform (Thermo Fisher Scientific, San Jose, CA, United States) and the Qubit dsDNA HS Assay Kit (Thermo Fisher Scientific, CA, United States). The quality of the library was detected by agarose gel electrophoresis. After quantification, the paired-end mode sequencing of the library was accomplished on the Illumina HiSeq X10 sequencing platform.
Sequencing data processing
The original image data obtained by high-throughput sequencing were automatically analyzed by base recognition, and converted into the original sequences in FASTQ format. In order to ensure the accuracy of the subsequent analysis, the Cutadapt software3 was used to remove redundant primers and indexes from the initial FASTQ files, and the Trimmonmal software4 was applied to filter low-quality reads. We mapped the final cleaned data to the revised Cambridge Reference Sequence (rCRS) (Andrews et al., 1999) using the Burrows-Wheeler Aligner to generate the binary alignment/map (BWA5) (Li and Durbin, 2010) file. To avoid false positives caused by contamination of nuclear mitochondrial DNA (NUMTs), the sequences were also compared with the human reference genome hg38. The reads successfully mapped to hg38 were extracted by the Bedtools software,6 and realigned with rCRS + 64 bp by Bowtie2 software7 to generate new BAM files. The variant sites in the BAM file were then identified by the SAMtools v1.88 and VarScan v2.4.0,9 and stored as variant call format (VCF) files. Lastly, BCFtools v1.910 was utilized to generate the consistent sequence FASTA files.
Haplogroup assignment
Through the updated query engine (SAM2) built into EMPOP v4 (Huber et al., 2018) based on PhyloTree Build 17,11 the whole mitogenomes and extracted CR information of Guizhou Tai-Kadai-speaking populations were assigned to specific sub-haplogroups. The haplogroups of all mtDNA sequences were checked again manually by Snapgene,12 and compared with the rCRS (Andrews et al., 1999). In order to more comprehensively explore the matrilineal genetic structure of the Tai-Kadai-speaking populations in Guizhou, we screened 79 reference populations worldwide, each with more than 25 individuals. Details of the populations and cited references are listed in Supplementary Table 1.
Statistical analyses
The haplogroup frequencies were calculated by the direct counting method, which was used in all data analysis in this study based on the whole mitogenomes. DnaSP 6 software (Rozas et al., 2017) was used to analyze the haplotype diversity (Hd), nucleotide diversity (pi), number of segregating sites (S), and average number of pairwise nucleotide differences (k), Tajima’s D and Fu’s Fs neutrality tests. Then, we used Arlequin v3.5.2.2 software (Excoffier and Lischer, 2010) to evaluate the mismatch distributions of model test statistics (the sum of squared deviations, SSD; Harpending’s raggedness index, HRI), and the analysis of molecular variance (AMOVA). The AMOVA was carried out according to different geographic distributions and linguistic families. According to the haplogroup frequencies, the genetic distances (F-statistics, Fst) between Guizhou Tai-Kadai-speaking populations and reference populations were calculated by Arlequin v3.5.2.2 software (Excoffier and Lischer, 2010), and the Fst matrix data was imported into the R statistical package13 to plot heatmaps. To obtain a more comprehensive understanding of population relationships among different groupsets, the principal component analyses (PCAs) based on the haplogroup frequencies was carried out by using MVSP 3.22 software (Kovach, 1999). And the “ggplot2” package in R software was used to visualize the PCA results. In order to check the clustering of mitogenomes through haplogroup, the results of haplogroup division of the whole mitogenomes were uploaded to the EMPOP in the form of “*.emp,” median-joining (MJ) networks of the most common haplogroups in Guizhou Tai-Kadai-speaking population were established and visualized via the PopART version 1.7 (Bandelt et al., 1999; Leigh and Bryant, 2015). The Neighbor-Joining (NJ) tree was constructed based on the Fst data using MEGA 7 software (Kumar et al., 2016).
Results
Quality control
In this study, 83 Bouyei individuals, 107 Dong individuals, and 97 Sui individuals were successfully sequenced, a total of 287 samples. The sequencing depth of all individuals were more than 100×, and about ranged from 100× to 21,366×. The average read depth of each individual belonging to the Bouyei was 1,819× ± 1,307× (mean ± SD), each Dong individual was 3,568× ± 3,442× (mean ± SD), and each Sui individual was 1,752× ± 1,228× (mean ± SD). To assess the sequencing performance, the read depth of a single site of each sample was normalized, and then it was drawn as a boxplot (Figure 1). The Q20 and Q30 values of 287 sequencing samples were displayed in the Supplementary Table 2. The sequencing performance of the whole mitogenomes was able to meet the requirements of our study. All mitogenomes generated in this study were confirmed by two researchers, and evaluated by EMPOP using logistic, plausibility and phylogenetic checks (Huber et al., 2018). When the read depth was ≥30×, the quality score was ≥20, and the heteroplasmy detection threshold was set to 10% (Just et al., 2015), all variants are directly identified, as recommended by the updated guidelines for mtDNA. Subsequently, variants with read depth between 30× and 10×, or those designated as “Heterozygous” were validated using the Integrative Genomics Viewer (IGV) to exclude strand bias and/or low coverage (Just et al., 2015). The variants and haplogroup information of 287 Guizhou Tai-Kadai-speaking population individuals after EMPcheck14 re-check were presented in Supplementary Tables 3a–c.
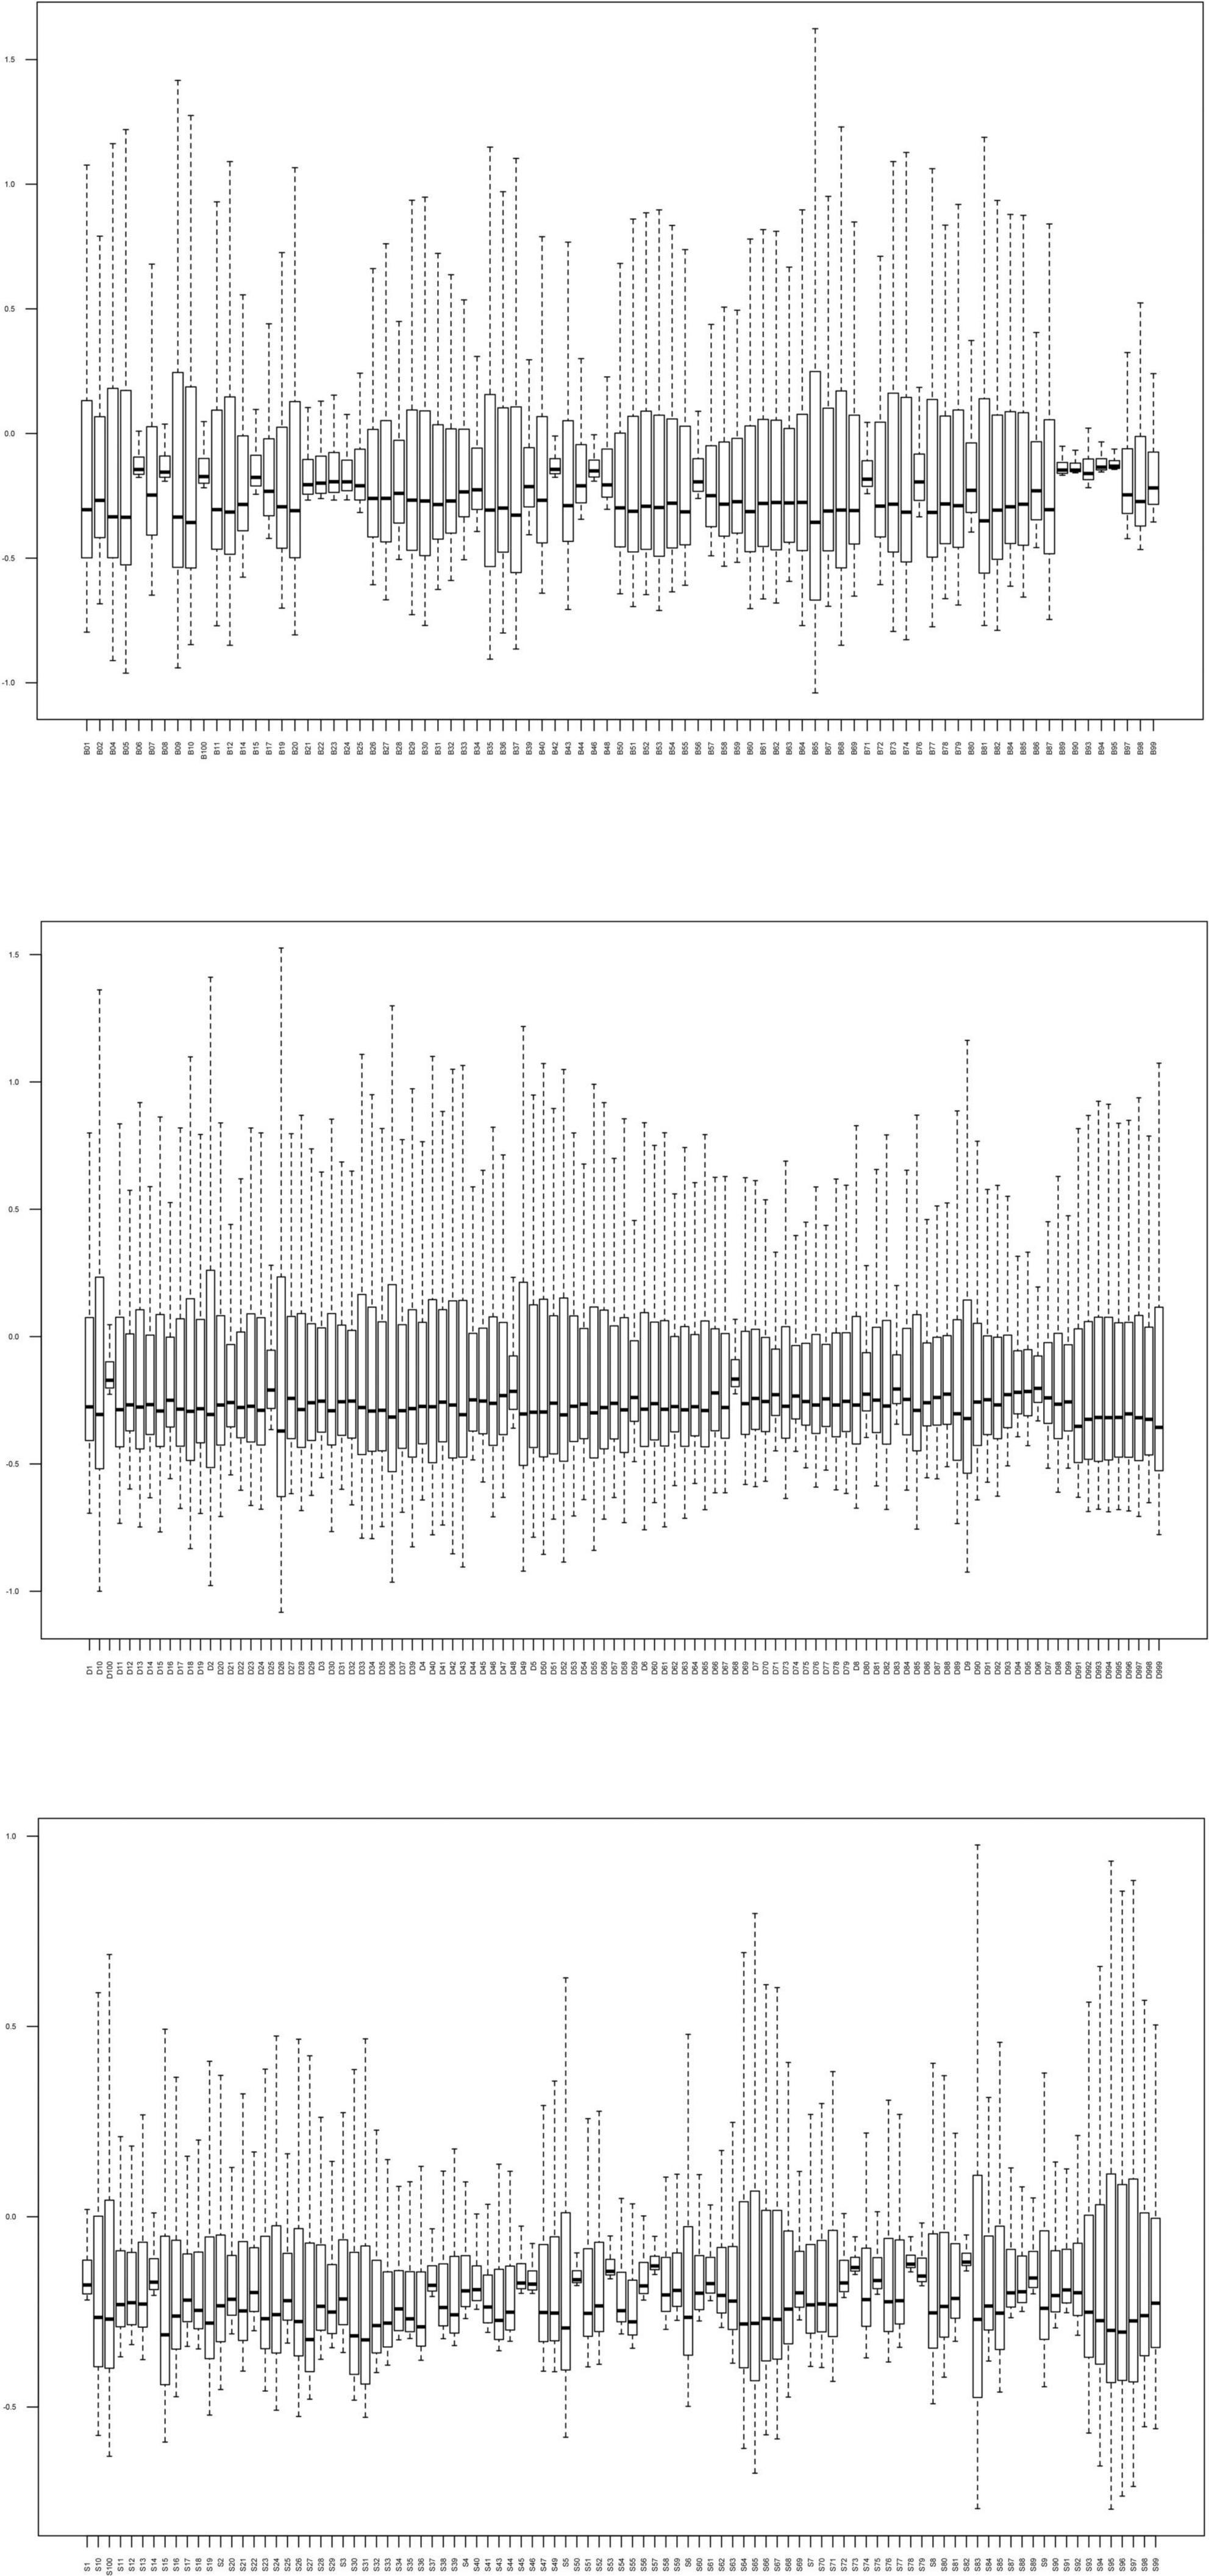
Figure 1. Read depth for the complete mitogenome of 287 Tai-Kadai individuals in Guizhou. The horizontal axis is different individuals, and the vertical axis represents the reading depth was normalized.
Mitochondrial DNA genetic diversity
In order to research the characteristics of genetic and variation of Tai-Kadai-speaking populations in Guizhou, the related genetic diversity indexes were calculated (Table 1). Among the three populations of the Guizhou Tai-Kadai language family in our study, 82 different haplotypes were identified in Bouyei, of which 81 were unique; 104 haplotypes were identified in Dong, of which 102 were unique; 94 haplotypes were identified in Sui, of which 92 were unique. In addition, one haplotype was shared among three individuals, and four haplotypes were shared between two individuals. As shown in Table 1, in terms of genetic indexes, the haplotype diversity of Bouyei was 1.000 ± 0.002, the number of segregating sites (S) and the total number of mutations (eta) were 517 and 521, respectively, the average number of pairwise nucleotide differences (k) was 36, and the nucleotide diversity (Pi) was 0.00217 ± 0.00005. The haplotype diversity, the number of segregating sites, the total number of mutations, the average number of pairwise nucleotide differences and the nucleotide diversity of Dong were 0.9993 ± 0.0015, 620, 626, 35.68, and 0.00216 ± 0.00005, respectively. In addition, the haplotype diversity, the number of segregating sites, the total number of mutations, the average number of pairwise nucleotide differences and the nucleotide diversity of Sui were 0.999 ± 0.002, 440, 445, 32.87, and 0.00199 ± 0.00006, respectively. To some extent, these genetic indexes could provide a wealth of information.
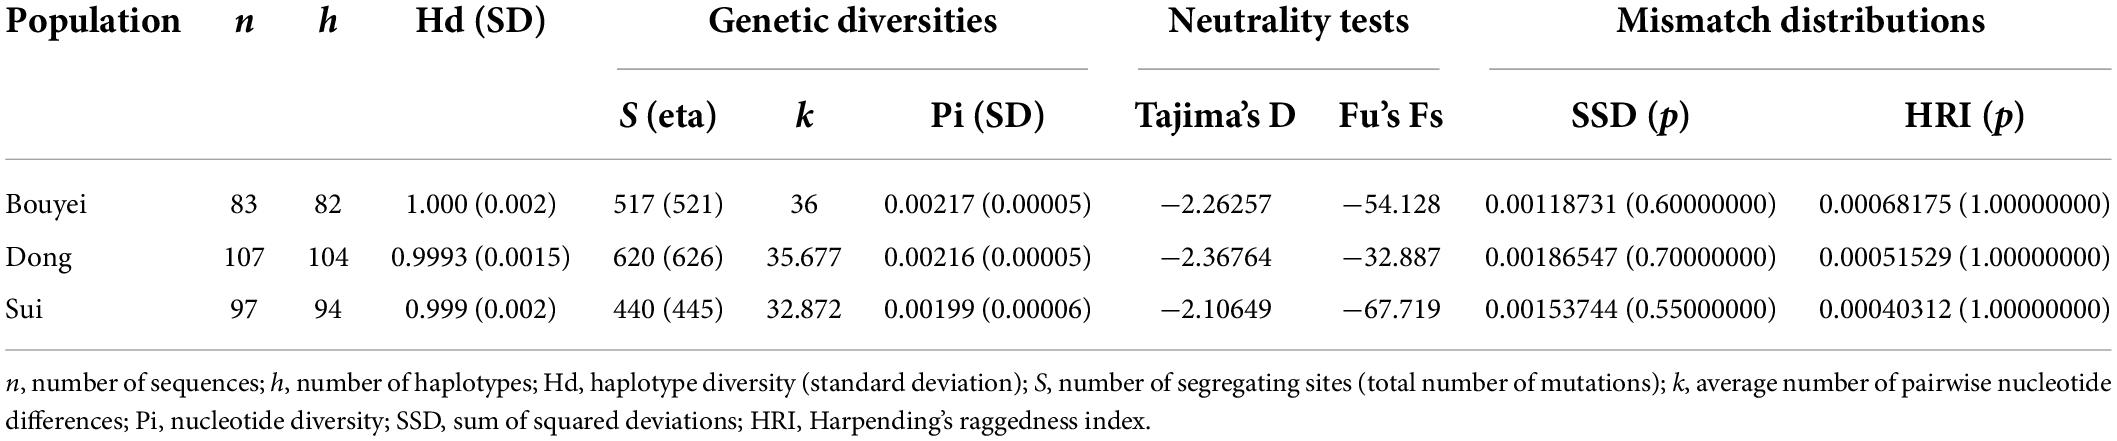
Table 1. Diversity indexes and neutrality tests for the studied Tai-Kadai-speaking populations based on the whole mitogenomes.
It could be seen from Table 1 that the neutrality tests of the three Tai-Kadai-speaking populations in Guizhou all presented significantly negative values, including Tajima’s D (Bouyei, −2.26257, p < 0.05; Dong, −2.36764, p < 0.05; Sui, −2.10649, p < 0.05), Fu’s Fs test (Bouyei, −54.128, p < 0.05; Dong, −32.887, p < 0.05; Sui, −67.719, p < 0.05). Moreover, the mismatch distributions were used to infer the population expansion history of three Tai-Kadai-speaking populations in Guizhou. The result of mismatch distribution (Figure 2) was a unimodal pattern. At the same time, the model test statistics, SSD and HRI, were used to evaluate whether the mismatch distribution was markedly different from the expected extended model. The results demonstrated that the SSD (Bouyei, 0.00118731, p = 0.60000000; Dong, 0.00186547, p = 0.700000000; Sui, 0.0015374, p = 0.55000000) and HRI (Bouyei, 0.00068175, p = 1.0000000; Dong, 0.00051529, p = 1.0000000; Sui, 0.00040312, p = 1.00000000) of the Guizhou Tai-Kadai-speaking populations did not significantly deviate from the expected model of population expansion.
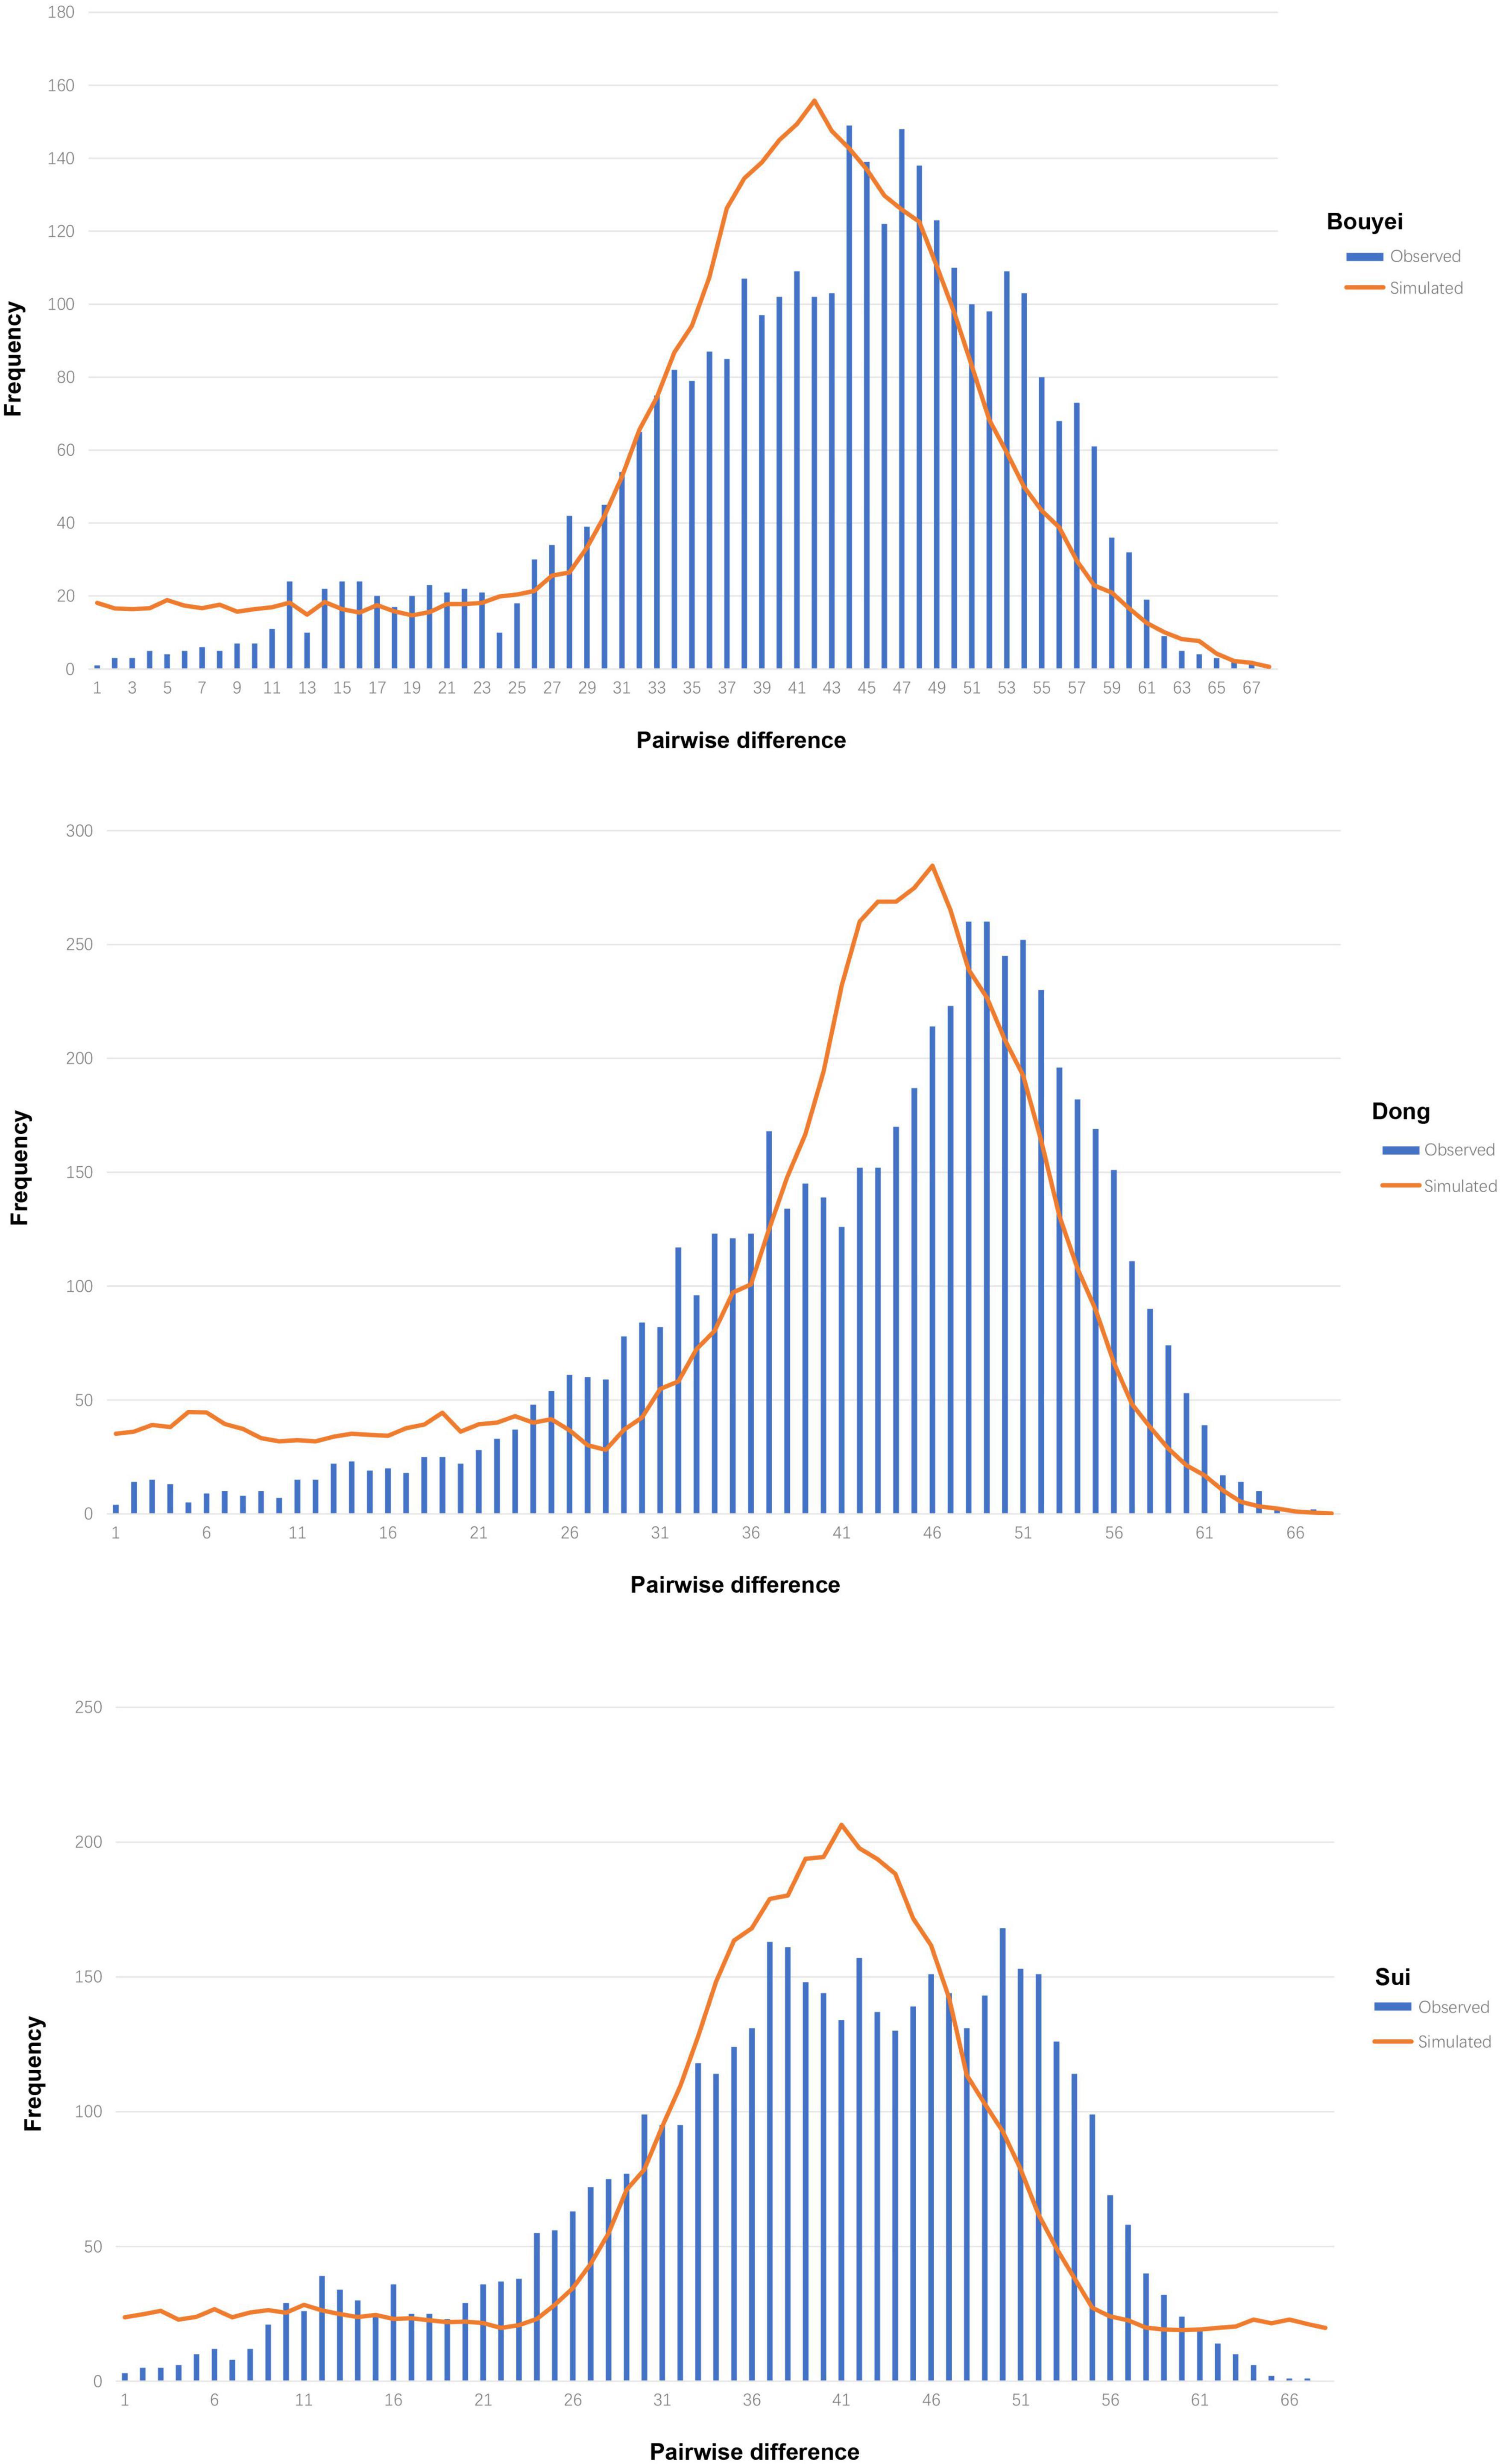
Figure 2. Mismatch distribution of three Tai-Kadai-speaking populations in Guizhou. The orange solid line represents the simulated model, and the blue bar graph represents the observed model of the Tai-Kadai-speaking populations in Guizhou.
The population expansion time of Guizhou Tai-Kadai-speaking populations
To further verify whether the population expansion occurred in the Guizhou Tai-Kadai-speaking populations, a Bayesian skyline plot (BSP) was drawn to clarify the population expansion time. Figure 3 shows the effective population size of the Guizhou Tai-Kadai-speaking populations over the preceding 90 kya. The results demonstrated that the effective population size of the Bouyei was comparatively stable between 90 and 60.5 kya, and experienced a significant population expansion between 50 and 60.5 kya, which leads to a sharp increase in population size. After this period, the effective population size remained comparatively stable, except for a small population expansion between 10.8 and 20.7 kya. Similar to the Bouyei, the effective population size of the Dong was comparatively stable between 90 and 60 kya, while it experienced significant population expansion and a dramatic increase in population size between 40.5 and 60 kya. Since then, the effective population size of the Dong has been approximately stable, with only a small population expansion occurring between 10.5 and 20.5 kya. Similarly, the BSP results showed that the effective population size of the Sui has experienced two significant population expansions, one occurring between 40.2 and 60 kya, and the other between 10 and 15 kya, both of which lead to the increase of population size. Between 90 and 60 kya and 15 and 40 kya, the number of Sui population has been in a somewhat stable state.
Figure 3. Bayesian skyline plot (BSP) of changes of effective population size through time for Guizhou Tai-Kadai-speaking populations. The dark blue line represents the median population, the blue line demarcates the boundaries of the 95% highest posterior density. (A) BSP of the Guizhou Bouyei; (B) BSP of the Guizhou Dong; and (C) BSP of the Guizhou Sui.
Observed heteroplasmies
Among the 287 samples of Guizhou Tai-Kadai language family in this study, 20 samples showed point heteroplasmy (PHP) at 21 different positions, except one was located in the CR, the rest were located in the coding region (Table 2). All PHPs appeared only once. The 16519Y distributed in the CR, the 3206Y and 15043R distributed in the coding region could be found in the EMPOP database v4/Release 13. In addition, all the other PHPs located in the coding region of our study could not be retrieved in the EMPOP database v4/Release13 (Search made June 2022).
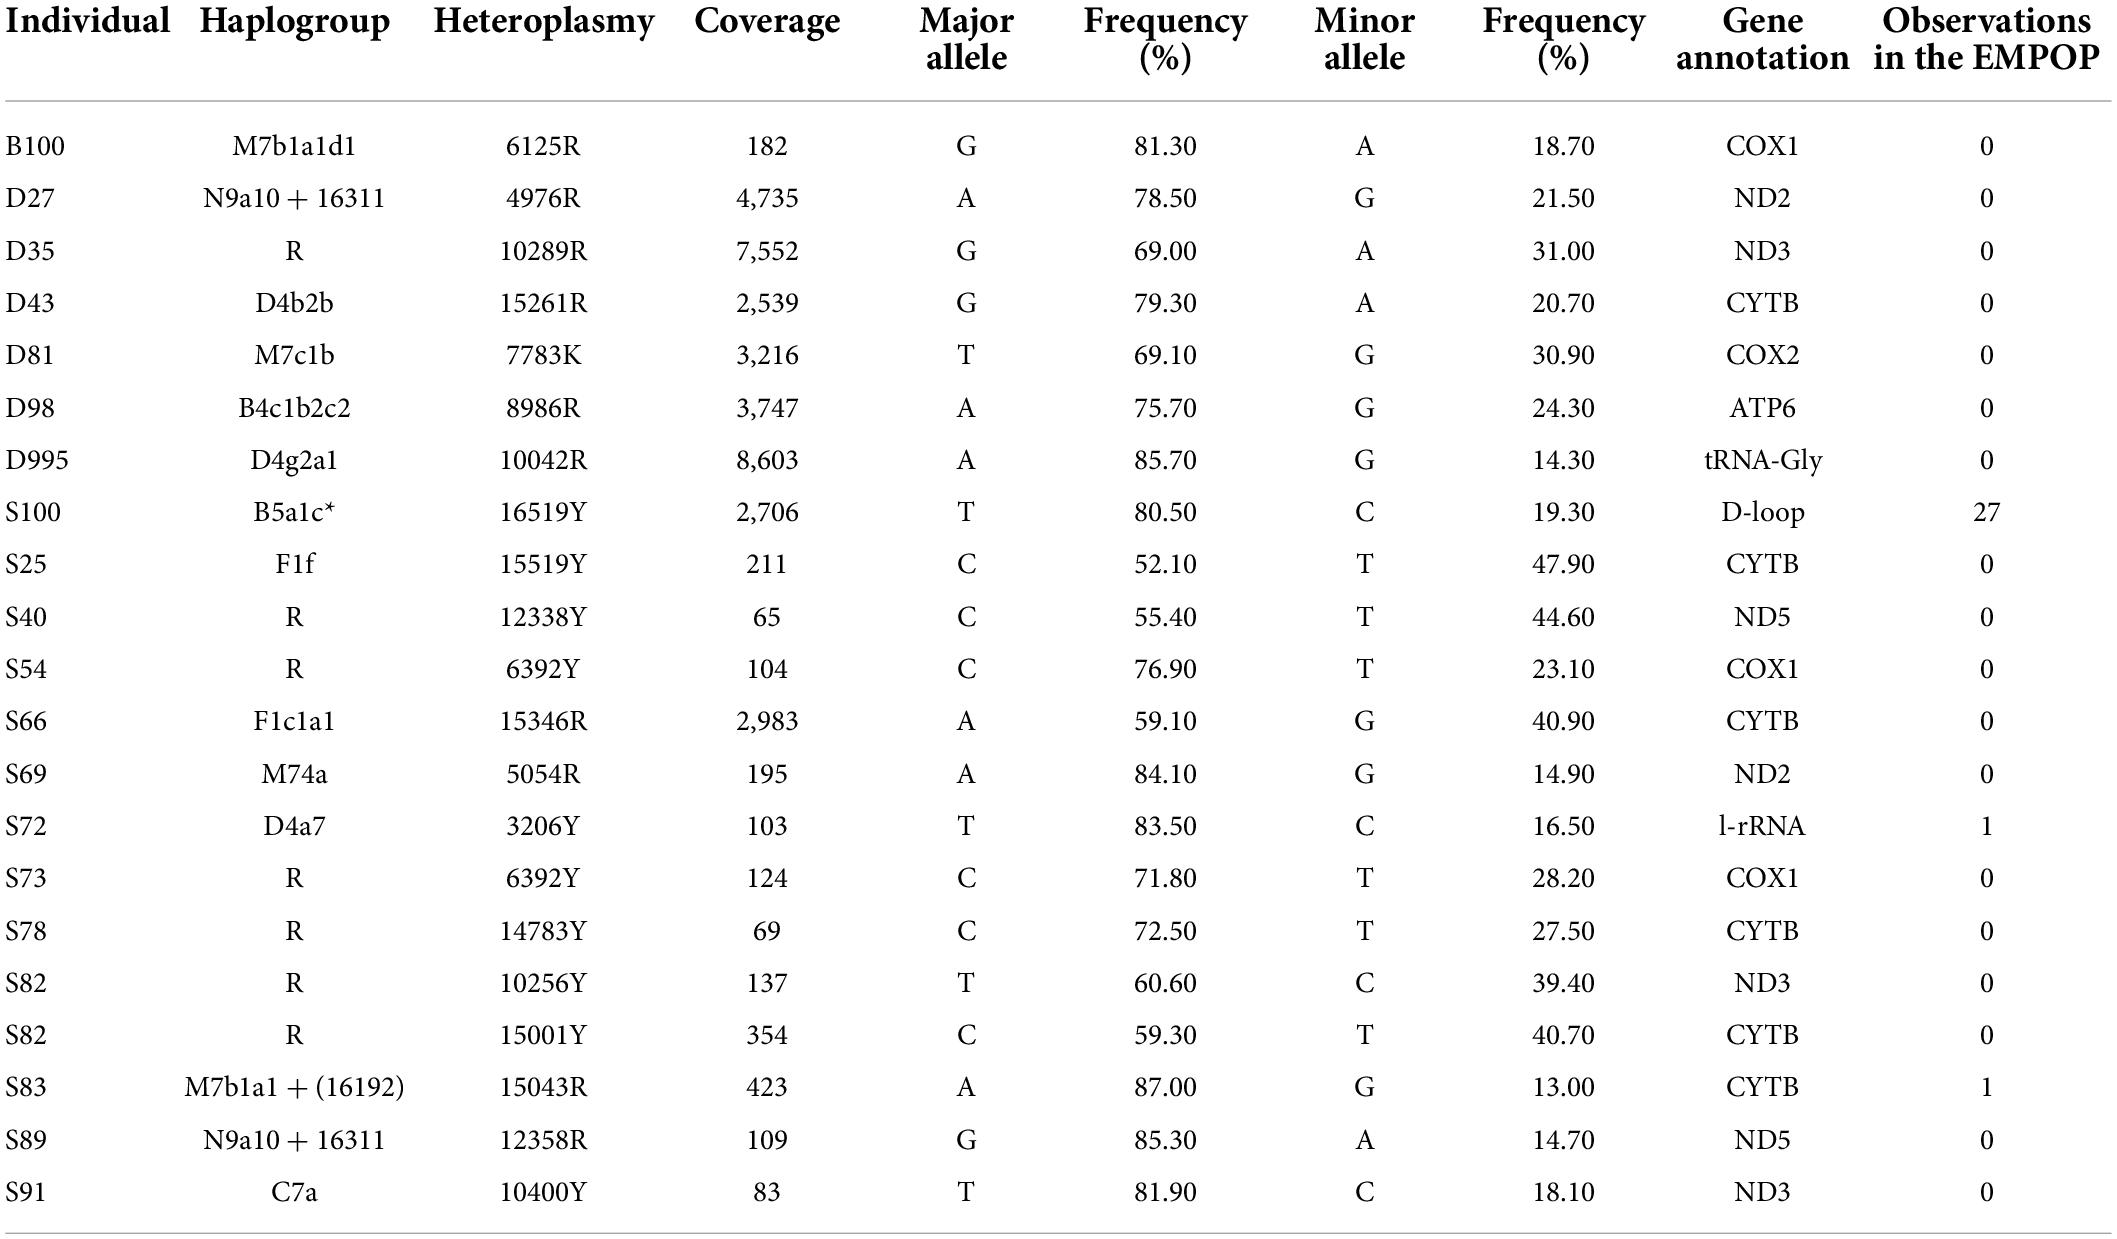
Table 2. Point heteroplasmies detected in 287 Guizhou Tai-Kadai-speaking individuals.
Haplogroup assignment through mitogenome vs. control region information
A total of 116 sub-haplogroups were classified according to the PhyloTree build 17-based15 HaploGrep 216 from the whole mitogenomes information of 287 samples of Tai-Kadai-speaking populations in Guizhou. Among them, 53 sub-haplogroups were seen in 83 Bouyei samples, 64 sub-haplogroups in 107 Dong samples, and 46 sub-haplogroups in 97 Sui samples. The detailed haplogroup classification results of each individual were shown in Supplementary Tables 3a–c.
Among the 287 individuals of Guizhou Tai-Kadai-speaking populations, the haplogroup M* (25.78%) was the most frequent haplogroup, of which M7 (16.03%) accounted for the largest proportion, followed by haplogroup F (20.91%), B (20.21%), R* (12.20%), and D (11.85%), the proportion of the above haplogroups accounted for 90.95% of our study populations. Nevertheless, haplogroups N* (4.18%), A (1.74%), C (1.74%), Z (0.70%), K (0.35%), and L (0.35%) only accounted for a minimal proportion.
The total frequency of sub-branches (F and B) of macrohaplogroup R (53.66%) was higher in the studied population (41.12%). Among the 60 samples belonging to F haplogroup, 6 samples were assigned to F1c1a1, 6 samples were assigned to F3a1*2, 5 samples were assigned to F1a1a, 5 samples were assigned to F1a1d, and 4 samples were assigned to F1a. There are no more than three samples in other sub-haplogroups. Additionally, there were eight individuals in the Guizhou Tai-Kadai speaking populations belonging to haplogroup N9a. There were 115 macrohaplogroup M mitogenomes of the Guizhou Tai-Kadai (40.07%). Notably, the sub-haplogroup M7 represented the majority of the lineage branches of the macrohaplogroup M (16.03%). Of the 57 samples belonging to haplogroup M7, 13 samples were classified as M7b1a1a3, and 12 samples were classified as M7b1a1 + (16192), and other subclades only possessed no more than 5 individuals.
As far as the three populations were concerned, among the 83 individuals in the Bouyei, the haplogroup M* and F have the same proportion, accounting for 26.5% of the population, and haplogroup B and D accounted for 16.86 and 13.25%, respectively. The haplogroup B (24.3%) and M* (21.5%) accounted for the highest proportion in 107 samples of Dong, followed by haplogroup F (16.82%) and D (13.08%). Among the 97 Sui individuals, M* (25.77%) was the haplogroup with the highest proportion, while haplogroups F (20.62%) and B (18.56%) likewise accounted for a higher proportion. According to the haplogroup division of the population of the Tai-Kadai language family in Guizhou, a sunburst plot was generated (Figure 4), in order to more intuitively exhibit the distribution of the haplogroup of these three populations. Combined with the plot, we could see that except for one Sui sample, all haplogroups belong to macrohaplogroups M, N, and R, in which macrohaplogroup R accounted for the largest proportion. On the other hand, the graphical phylogenetic tree for the Bouyei, Dong, and Sui of the Guizhou Tai-Kadai-speaking populations were reconstructed, which reflected in detail the evolution of specific branches in the process of defining sub-haplogroups (Supplementary Figures 2–4).
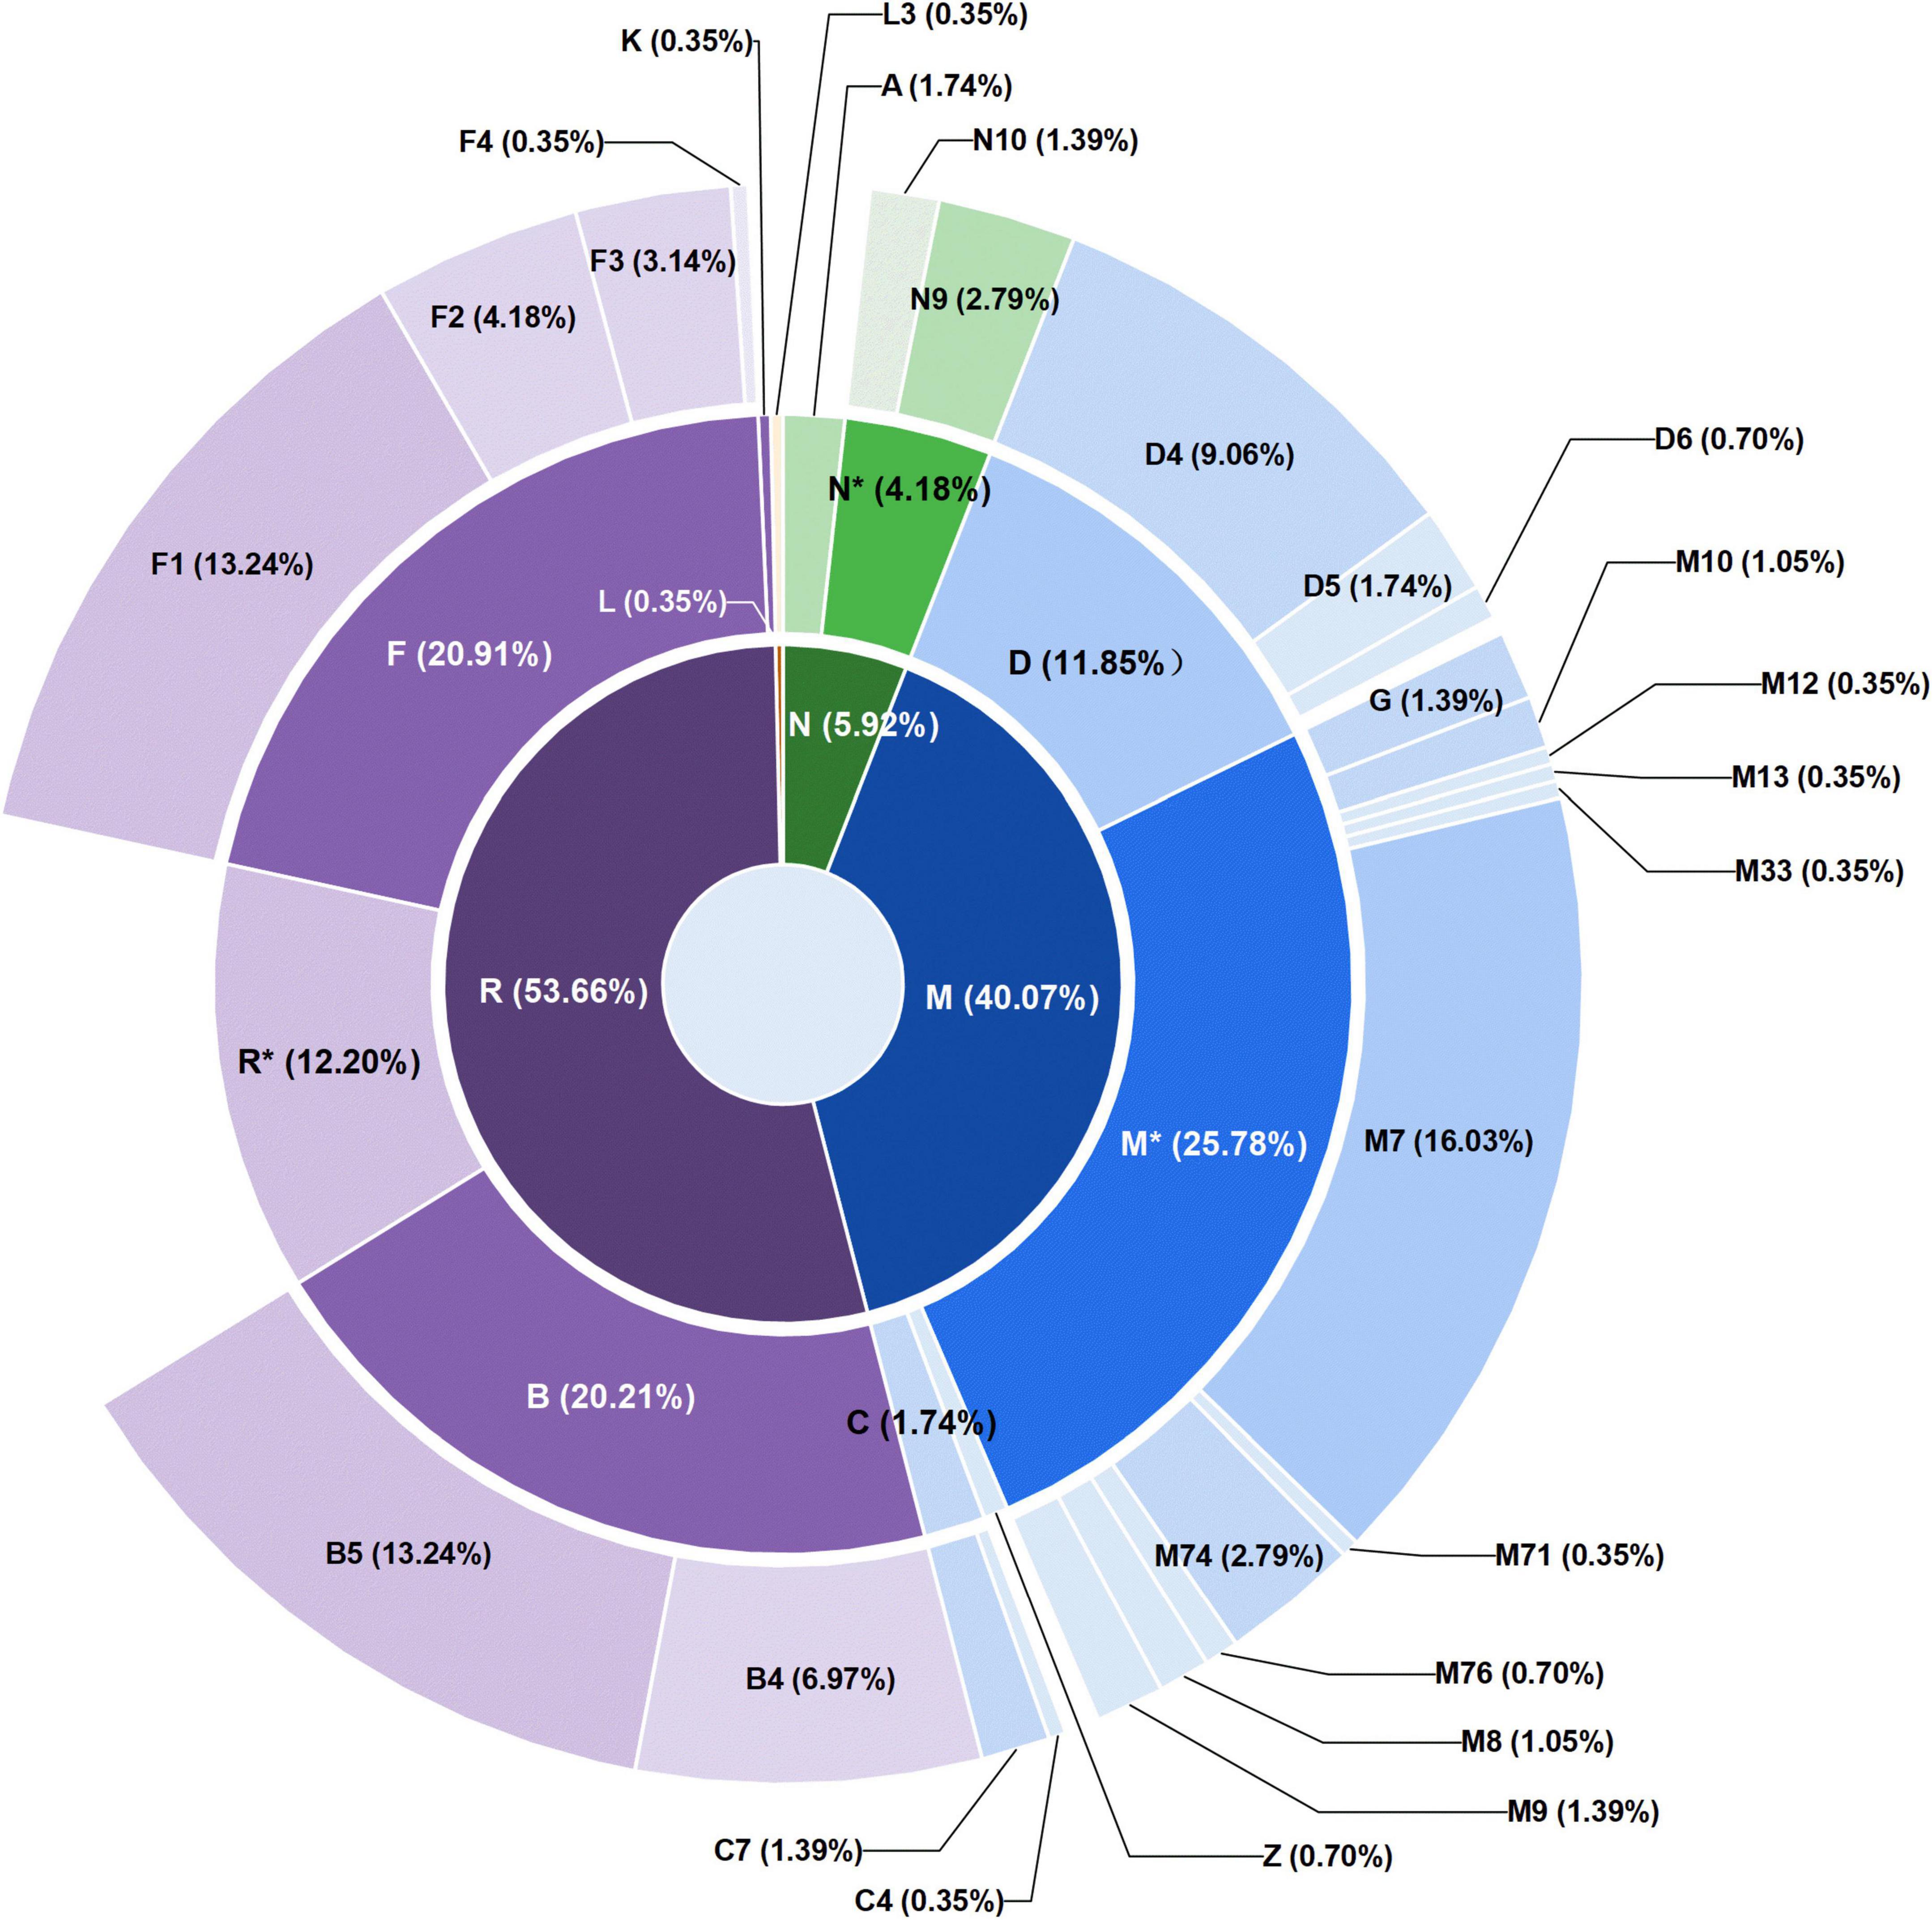
Figure 4. Distribution of mitochondrial haplogroups in 287 individuals of Tai-Kadai in Guizhou. The macrohaplogroups M, N, and R displayed in the innermost circle are represented by different colors. The circle in the middle represents the distribution and proportion of each haplogroup belonging to macrohaplogroups M, N, and R. The outermost circle shows the distribution and proportion of sub-haplogroups in more detail.
According to the HaploGrep 2 (see text footnote 16) based on PhyloTree Build 17 (see text footnote 15), we likewise divided 117 haplogroups from the CR information of 287 samples of the Tai-Kadai-speaking populations in Guizhou. Among them, 62.37% of the haplogroup results were different from the whole mitogenomes information (Bouyei, 60.24%; Dong, 60.75%; and Sui, 65.98%; Supplementary Tables 3a–c). By comparing the results of haplogroup division between the whole mitogenomes and only CR region information, it was discovered that the B35 belonging to B4b1a2g was classified into haplogroup U4a2a, the D96 belonging to B4b1a2g was classified into haplogroup U5b1d1a, and two samples belonging to B5b1c (S59 and S62) were classified into haplogroup R9. And, very consistently, S32 belonging to haplogroup F1a, B56 belonging to haplogroup F1b1 + @152, B29 belonging to haplogroup F1d1, S67 belonging to haplogroup F1g, D8 belonging to haplogroup F1g1, S79 belonging to haplogroup F2c1, D11 belonging to haplogroup F2g, and two samples (B43 and D30) belonging to haplogroup F2h were classified into haplogroup R9. Oddly, some samples were classified into the downstream sub-haplogroup according to the CR, for example, the D55 belonging to B5a1c* was reclassified into B5a1c1a1; three samples belonging to B5a1c* (B51, B55, and D89) were reclassified into B5a1c1a1*. Generally speaking, in the absence of variation site information in the coding region, most of the samples were classified as the upstream branch of the original haplogroup.
Network analysis
In the reconstructed phylogenetic tree (Supplementary Figures 2–4), haplogroups B4′5, D4, F1, and M7b made the greatest contribution to the matrilineal gene pool of the Guizhou Tai-Kadai-speaking populations, signifying that these haplogroups might be useful to trace the origin of the Tai-Kadai-speaking populations in Guizhou. Hence, the Network of B4′5, D4, F1, and M7b were analyzed. The Supplementary material Supplementary Figure 5 illustrated that almost all the Tai-Kadai-speaking populations in Guizhou have formed exclusive branches, and there was no situation of sharing mitotypes on the same node with other populations of the same language family in East Asia.
Genetic affiliation between Guizhou Tai-Kadai-speaking populations and reference populations
Analysis of molecular variance
At present, it has been shown in the literature that AMOVA can perform the hierarchical division of genetic variation by estimating the evolutionary distance between haplotypes in the study of population genetics, thus representing the correlation of haplotype diversities at different levels of subdivision. Accordingly, in order to determine the existing factors that might be significant for the formation of mtDNA diversity, the AMOVA was carried out. According to the linguistic dialect and geographical distribution area, three Guizhou Tai-Kadai speaking populations and 79 reference populations were divided into different groups for AMOVA (Table 3). The observed values of variance components in all groups were statistically significant. The results of AMOVA showed that whether grouped according to linguistic family or geographical distribution, the proportion of within populations variation is higher than that of among populations within groups variation. When grouping according to the linguistic families of worldwide populations, within populations variation accounted for 89.32%, among populations within groups variation accounted for 4.31%, and among groups variation accounted for 6.37%. In the grouping of the geographic distributions of worldwide populations, the variation within populations was 88.60%, among populations within groups was 5.61%, and among groups was 5.79%. At the same time, we have narrowed down the scope for grouping. When grouped according to the linguistic families of China, the within populations variation was 92.25%, the among populations within groups variation was 3.90%, and the among groups variation was 3.85%. In addition, when grouped according to the geographic distributions of Chinese populations, the proportion of within populations variation was 92.36%, among populations within groups variation was 4.02%, and among groups variation was 3.62%. From the results of Table 3, it could be seen that in the world, under the condition of grouping according to geographic distribution, the value of variation is lower than that of grouping according to linguistic family, while in China, the proportion of variation grouped by linguistic family is lower than that grouped by geographic distribution.
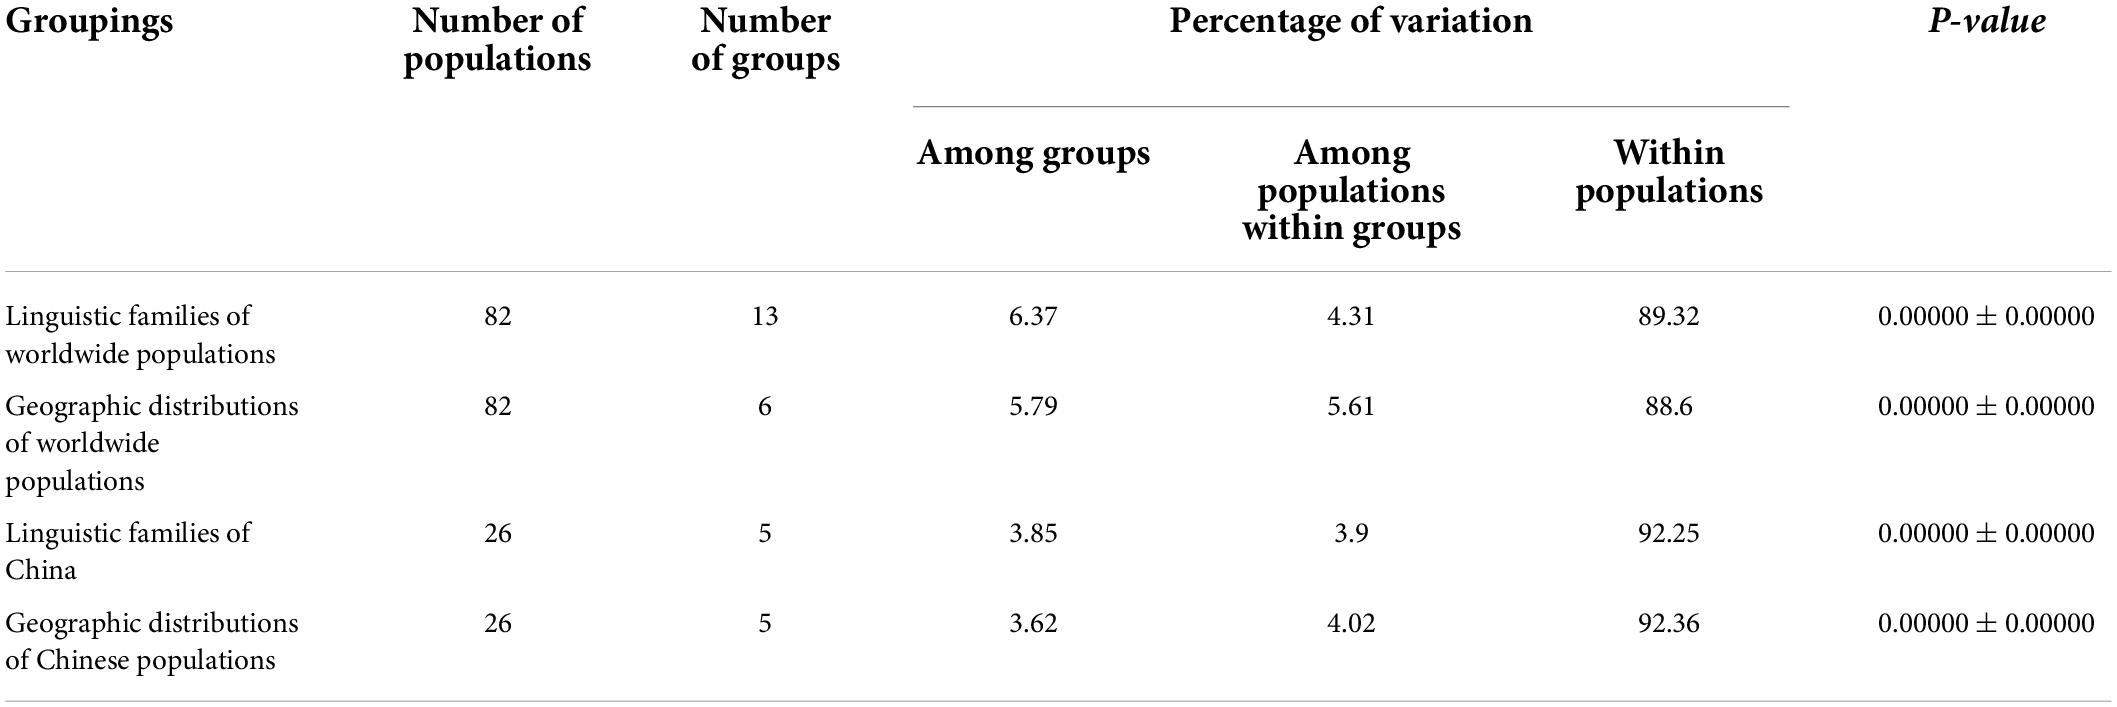
Table 3. Analysis of molecular variance (AMOVA) results based on different groups for worldwide populations.
Pairwise fixation index (Fst) values reveal population genetic distance
In order to reveal the genetic relationship patterns among the Guizhou Tai-Kadai-speaking populations and the reference worldwide populations. According to the suggestion of Biffi et al. (2010), the sub-haplogroup was compressed to the haplogroup of the upstream branch. Then, the published whole mitogenomes data were merged, and the paired Fst values of the whole mitogenomes among the Bouyei, Dong, and Sui in Guizhou and 68 reference populations were calculated (Supplementary Table 4). With the help of the “pheatmap” package of R software, the Fst values among three Tai-Kadai language family groups in Guizhou and reference populations were visualized, in order to demonstrate the paired Fst values more clearly (Figure 5).
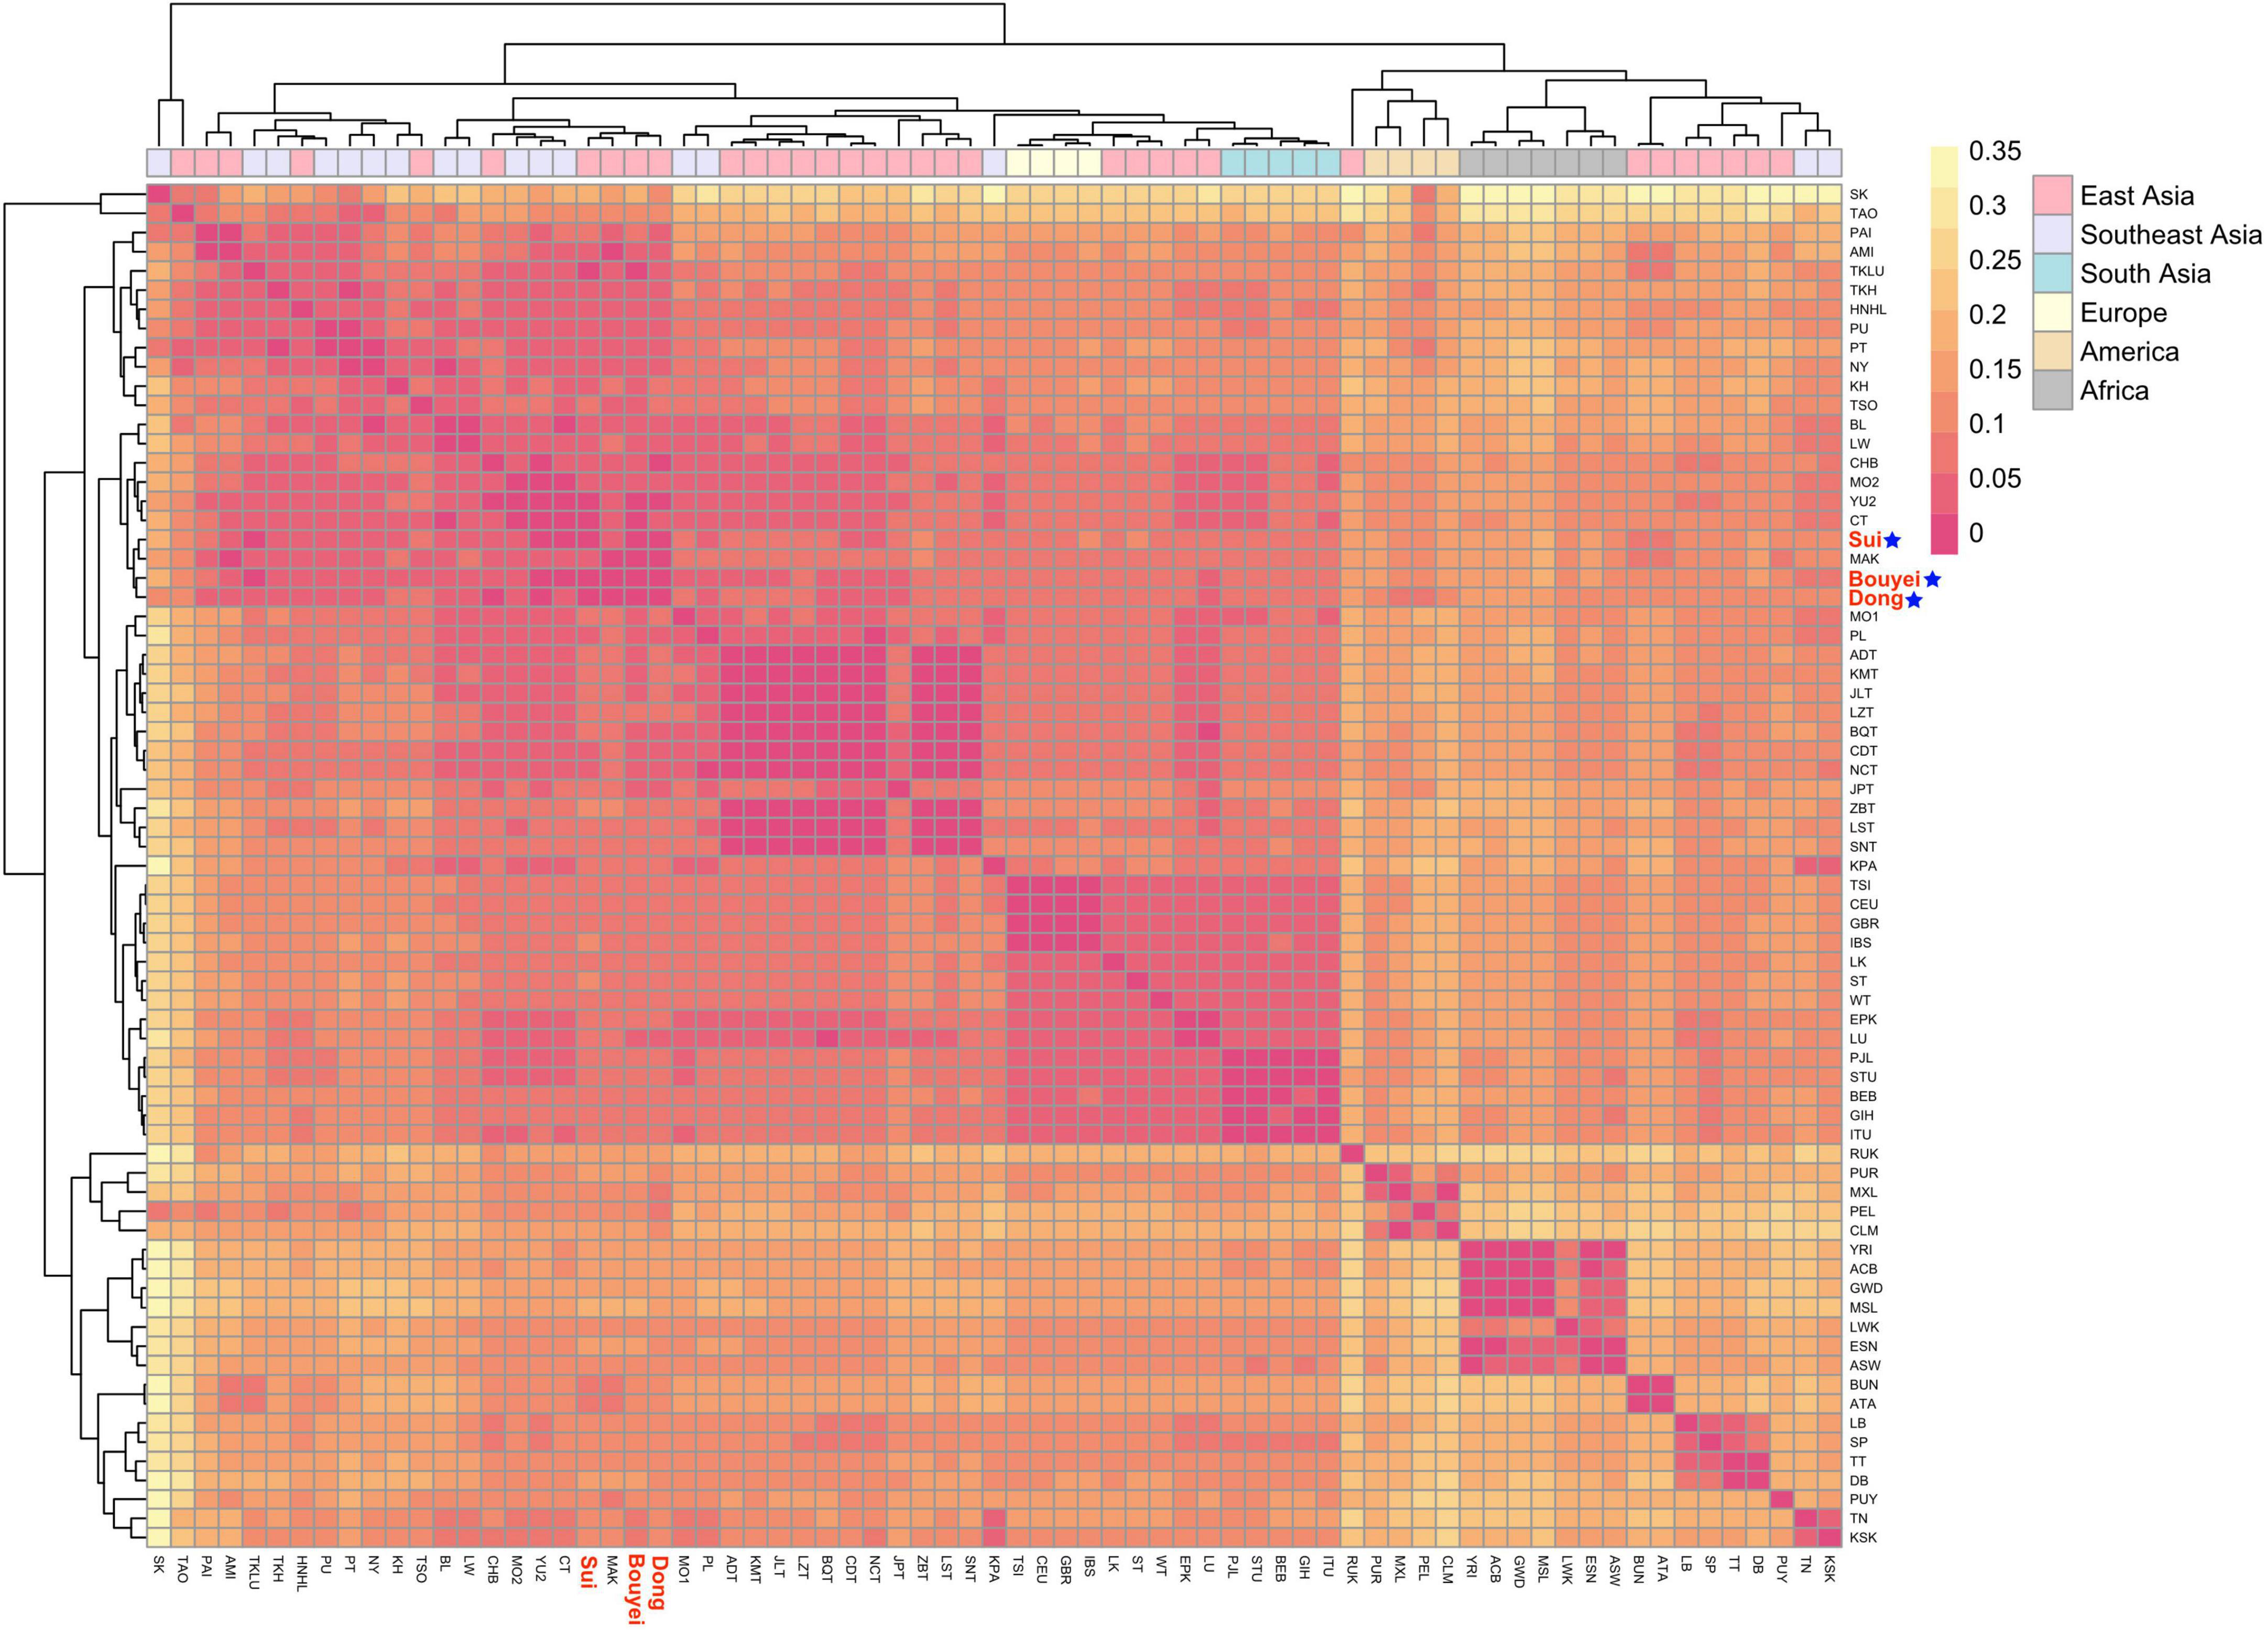
Figure 5. Heatmap for genetic distance between three Guizhou Tai-Kadai-speaking populations and worldwide 68 populations. Visualizing the FST values with different colors. Color yellow represents the high FST values, red represents the low FST values. Highlight the Sui, Bouyei, and Dong in red, followed by a blue five-pointed star.
First of all, on the whole, the populations of the Tai-Kadai language family in Guizhou in this study have close relationships with the populations in South China, and Tai-Kadai-speaking populations in East and Southeast Asia. At the same time, three studied populations also showed relatively intimate relationships with some Austronesian populations. Evidently, the genetic distance among the Bouyei, Dong, and Sui populations in Guizhou was the closest. In addition, specifically, the genetic distance between the Bouyei and the CT which is statistically significant (Tai-Kadai-speaking population from the central Thai region of Southeast Asia, Fst = 0.00627) was the smallest, followed by the YU2 (the Yuan population in Thailand, Fst = 0.01229). The genetic differences between the Bouyei and MSL (the Mende in Sierra Leone, Fst = 0.17003), GWD (the Mandinka people from the western division of the Gambia, Fst = 0.16347) were the largest. The genetic distance between the Dong and CHB (Beijing Han Chinese from the 1000 Genomes Project, Fst = 0.01139) with statistical significance was the smallest, followed by the YU2 (Fst = 0.01215). The genetic distance between the Dong population and MSL (Fst = 0.16466), GWD (Fst = 0.15839) was the largest. The genetic relationship between the Sui and TKLU (the Lue of Thailand in Southeast Asia, Fst = 0.01308) was the closest, followed by CT (Fst = 0.01663). There was also a maximal genetic distance between the Sui population and MSL (Fst = 0.17162), GWD (Fst = 0.16516). The results of merging the Bouyei, Dong and Sui indicated that the genetic relationship between the Guizhou Tai-Kadai-speaking populations and the Tai-Kadai language family of Thais in Southeast Asia was close, and the genetic difference between the Guizhou Tai-Kadai-speaking populations and the African population was very significant.
Principal component analysis based on haplogroup frequency
In order to clarify the genetic relatedness between the population of Tai-Kadai language family in Guizhou and the worldwide populations, the PCA based on haplogroup frequency was also executed.
Based on the PCA of the compressed haplogroup frequency, the first three principal components could explain 47.913% of the variation, of which PC1, PC2, and PC3 explained 22.675, 15.51, and 9.728% of the variation, respectively. The visualization results of PCA based on geographical classification indicated that there were two distinct genetic clusters, the African cluster and the American cluster (Figure 6). Although the European and South Asian populations were clustered on their own, the two clusters overlapped. People in East Asia and Southeast Asia partially overlapped. In addition, the Chinese Tibetan populations in East Asia were clustered independently. It was possible to distinguish most of the population through PC1 and PC2, but it had little effect on the European and South Asian populations. On the other hand, through PC3, although the European and South Asian populations were still in the same cluster, they could be basically separated. In addition, PC3 had little contribution to other geographical populations.
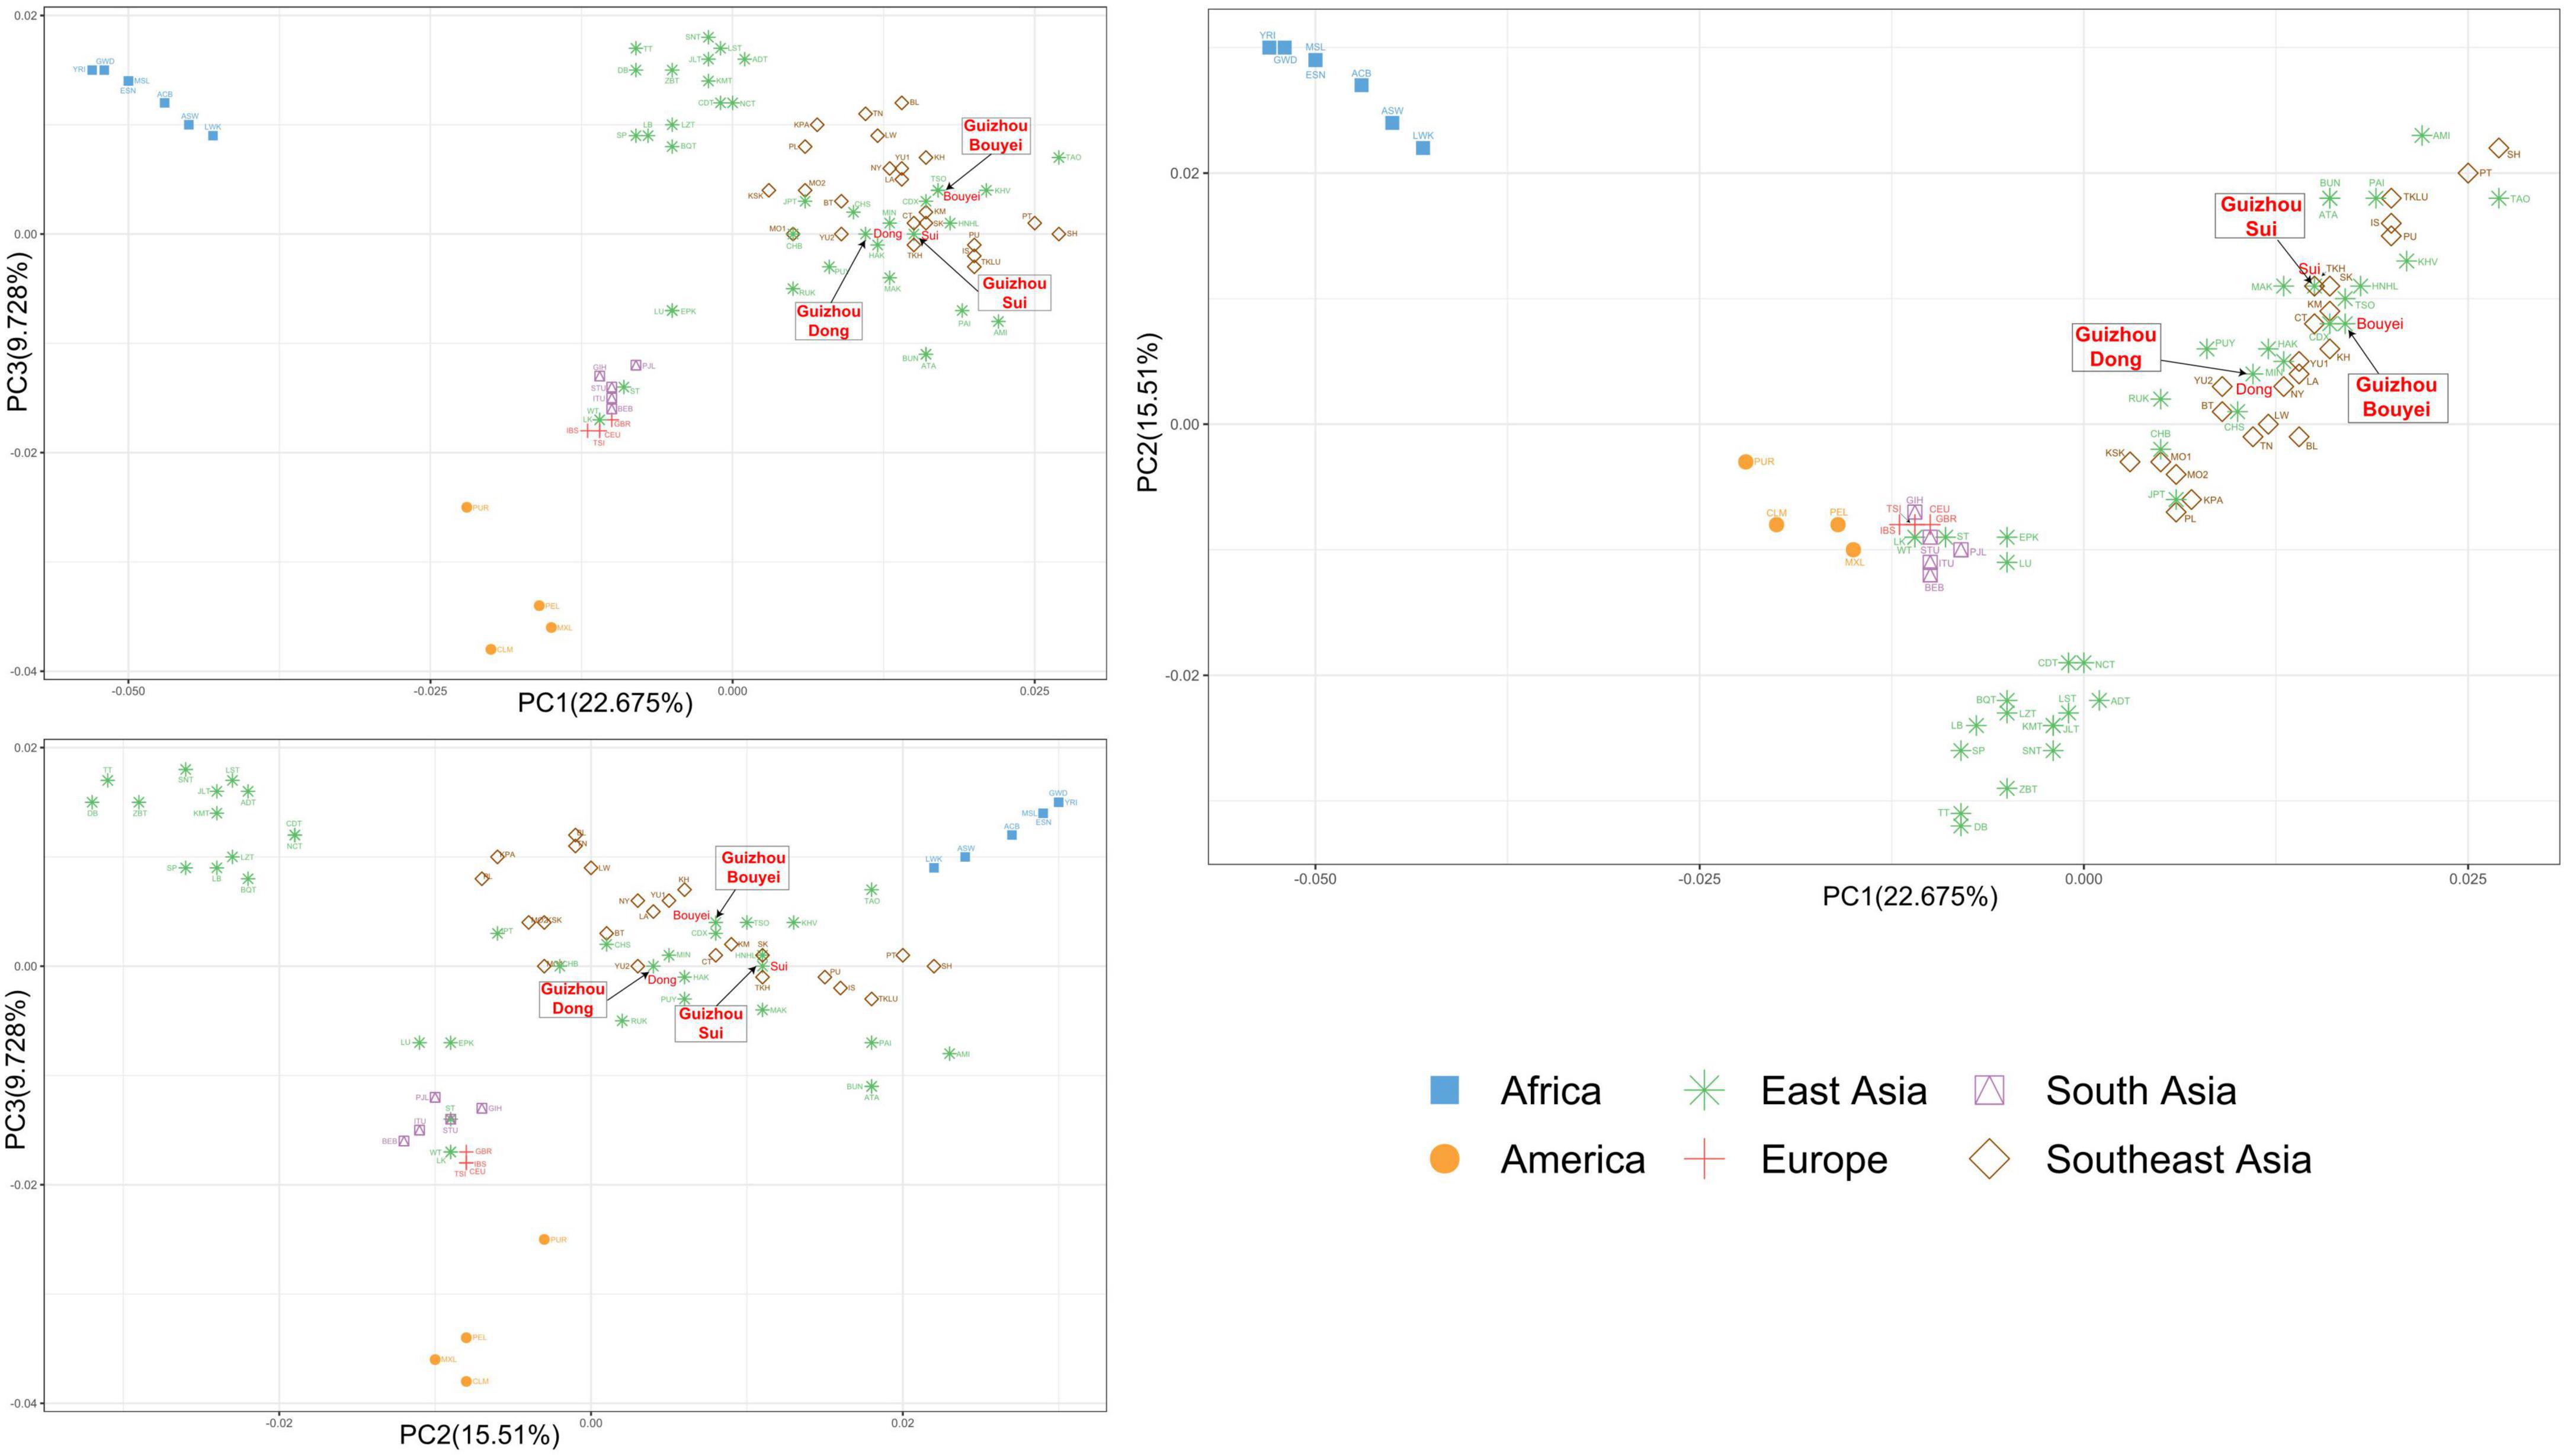
Figure 6. The principal component analysis (PCA) plot for Tai-Kadai-speaking populations in Guizhou and 79 worldwide populations according geographic distributions. These three Guizhou Tai-Kadai-speaking populations belong to East Asian cluster, indicated in green. And point out the Sui, Bouyei, and Dong with arrows.
In the PCA analysis based on the linguistic families, it is obvious that the clusters were Tibeto-Burman cluster and Indo-European cluster (Figure 7). According to the PCA plot, it could be shown that PC1 and PC2 can distinguish language families, but PC3 have little effect on the differentiation of language families.
Figure 7. The principal component analysis (PCA) plot for Tai-Kadai-speaking populations in Guizhou and 79 worldwide populations according linguistic families. These three Guizhou Tai-Kadai-speaking populations belong to Tai-Kadai cluster, which is represented by green diamond. And point out the Sui, Bouyei, and Dong with arrows.
Combined with the PCA grouped according to the geographic distributions and linguistic families, in the PC1 and PC2, the points portraying the Sui overlapped with TKH (the Khuen of Thailand in Southeast Asia), and was comparatively closer to MAK (Makatao, a population of Austronesian in Taiwan, China) and KM (the Khon Mueang of northern Thailand in Southeast Asia); the point representing the Bouyei was comparatively close to CDX (Xishuangbanna Dai Chinese from the 1000 Genomes Project) and KM; the points representing the Dong were surrounded by YU2, HAK (Hakka Han population in Taiwan, China), MIN (Minnan Han population in Taiwan, China), and NY (the Nyaw in northeastern Thailand in Southeast Asia).
Phylogenetic analysis
To clarify the phylogenetic relationship between the Tai-Kadai-speaking populations in Guizhou and other worldwide reference populations, a Fst value-based phylogenetic tree was generated (Figure 8). According to the geographical distribution, 71 populations, including three Guizhou Tai-Kadai-speaking populations, were divided into six groups: East Asia cluster, Southeast Asia cluster, African cluster, American cluster, European cluster, and South Asian cluster. Likewise, according to different linguistic families, different colors were used to mark the names of each population in the phylogenetic tree plot. Through the plot of the phylogenetic tree, it was observed that the three Tai-Kadai-speaking populations in Guizhou are gathered in the same branch with the Tai-Kadai-speaking populations and some Austronesian family populations in East and Southeast Asia. Among them, the Sui was nearer to HNHL (Hlai population in Hainan, China).
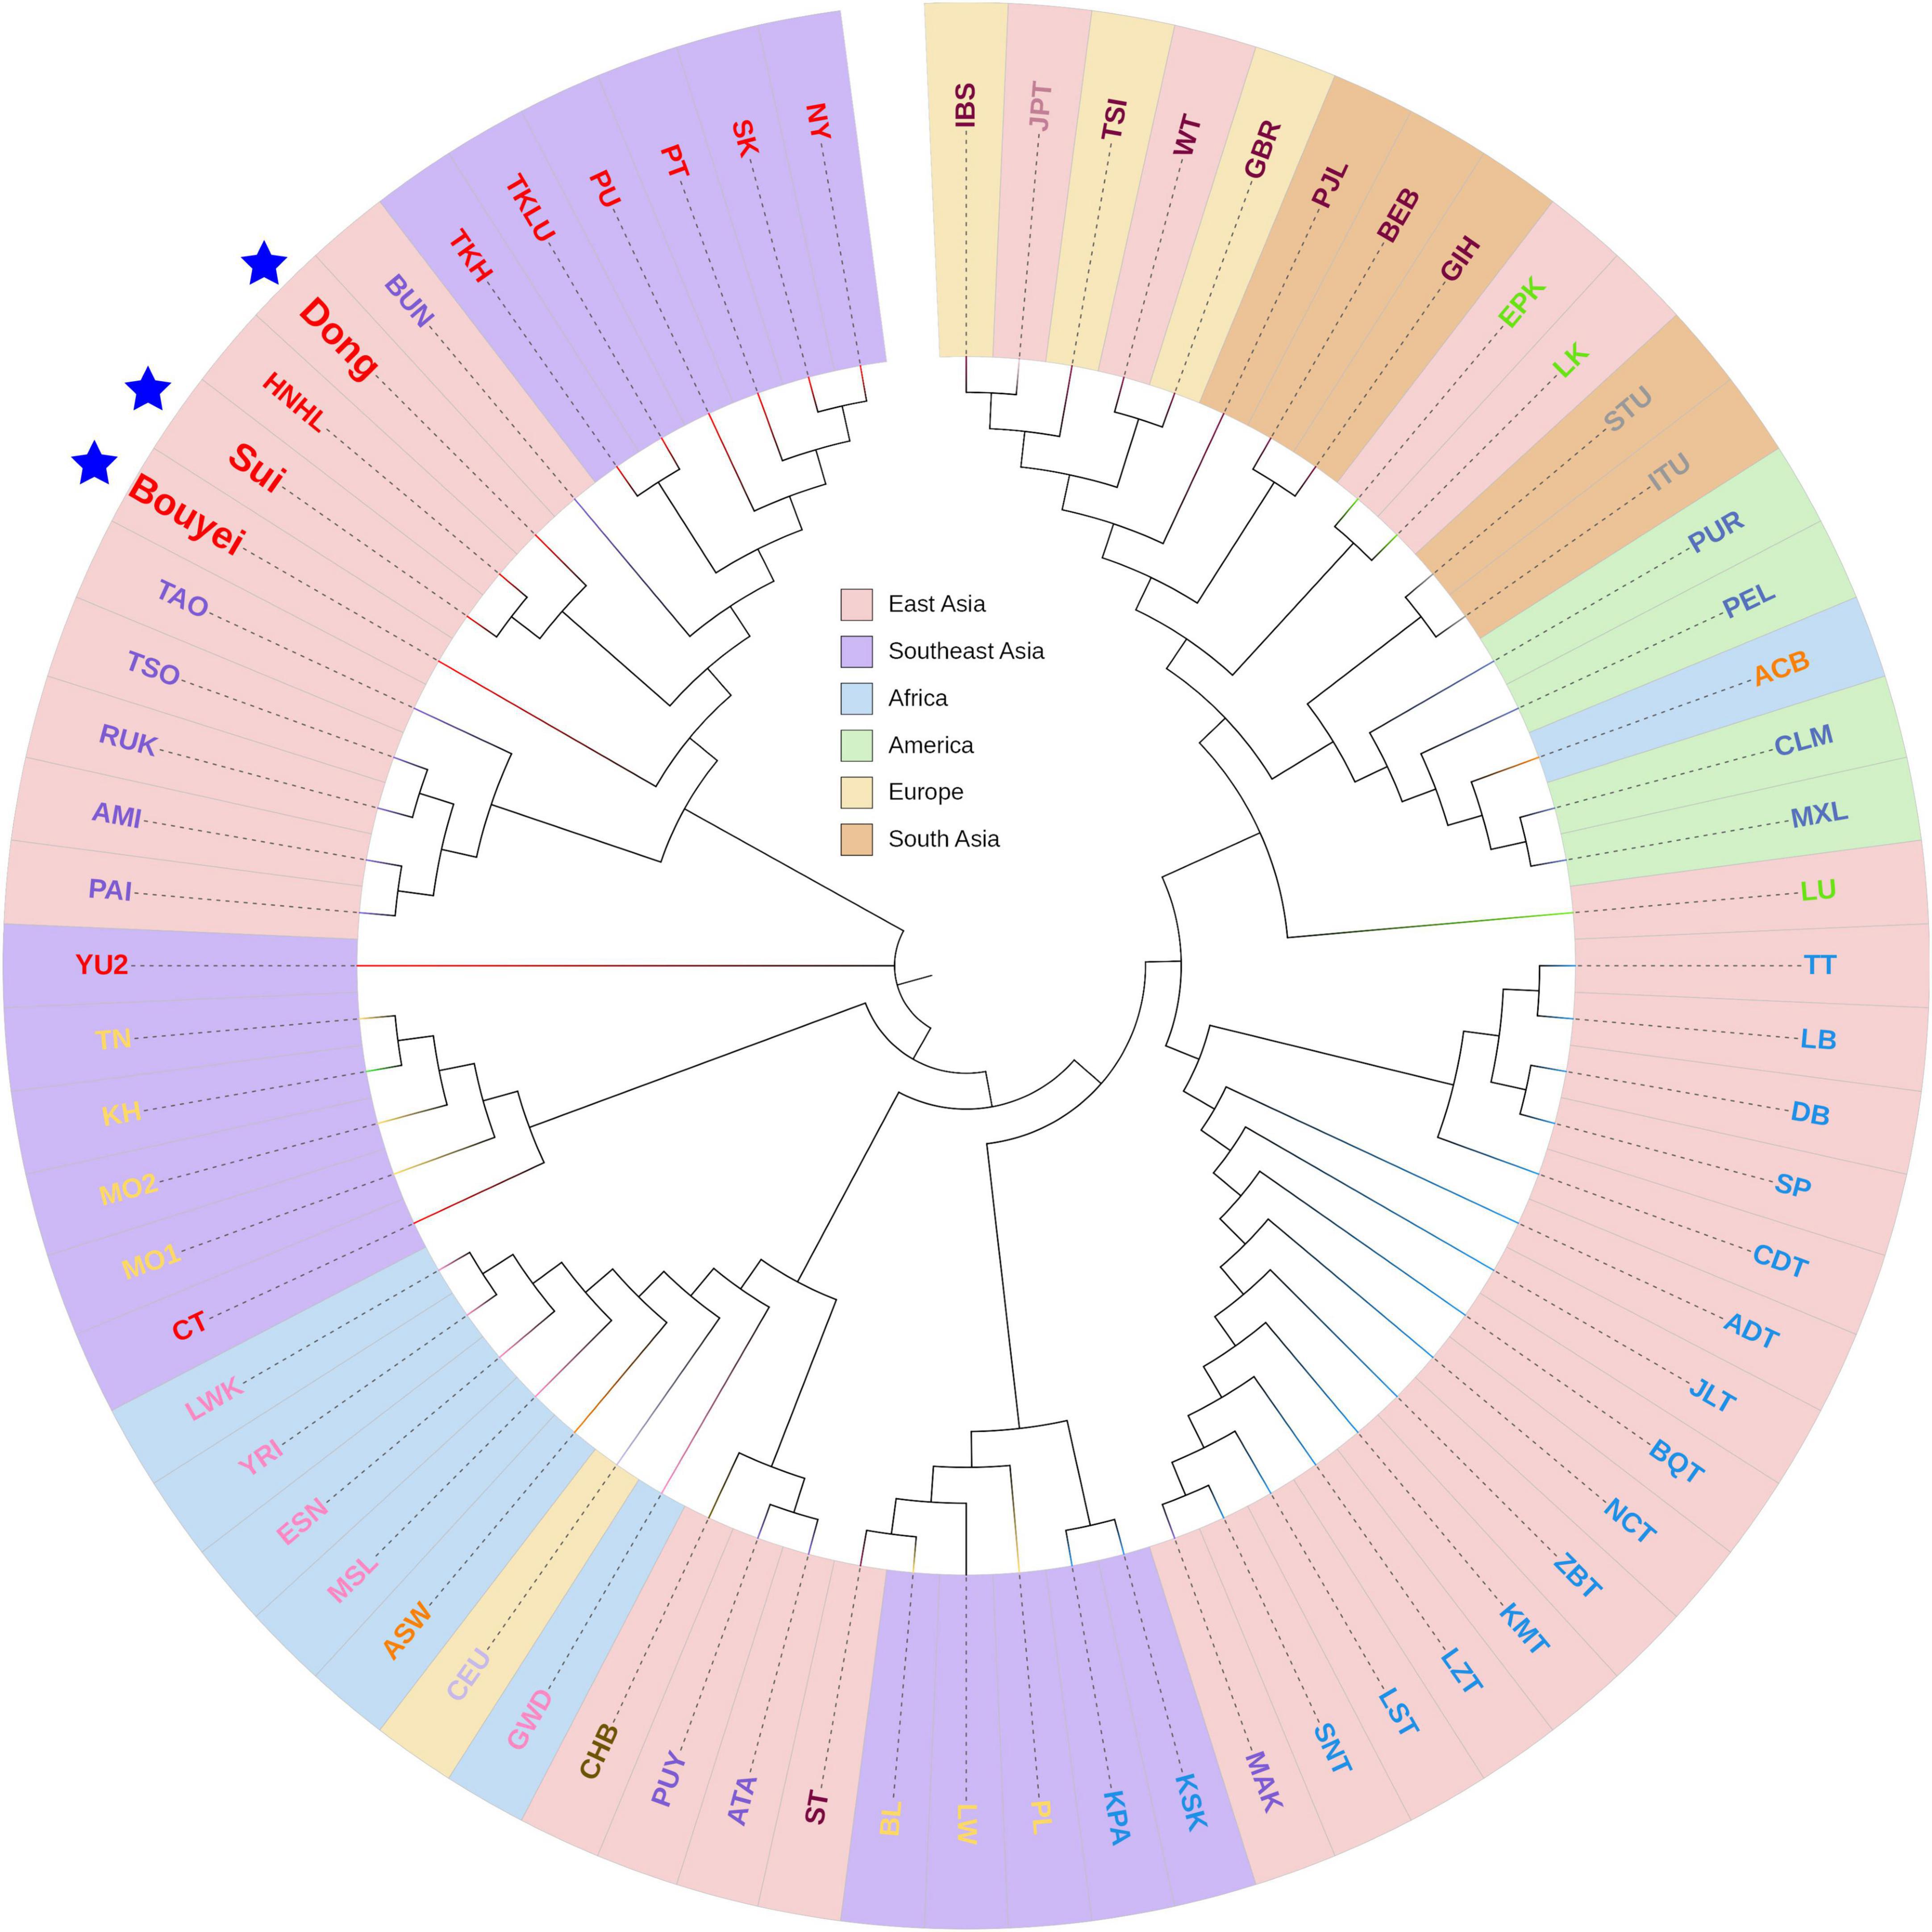
Figure 8. The phylogenetic NJ tree of three Guizhou Tai-Kadai-speaking populations and 68 reference populations. The tree colored according to its geographical origin. Highlight Bouyei, Sui, and Dong with blue pentagram.
Discussion
In the past, most of the studies on the population mitogenome were based on the mitochondrial hypervariable region, although the mutation rate of the hypervariable region in the CR was higher, but the fragment was shorter. With the continuous development of the NGS technology and the reduction of the cost of sample detection, it is viable to detect the complete mitogenome on a large scale and be widely used in population genetics, forensic medicine, anthropology and other fields. In addition, through a series of analyses, we believed that mtDNA can be used as a matrilineal genetic marker to explore population heredity and evolution. In our study, we studied the Guizhou Tai-Kadai-speaking populations from the perspective of matrilineal inheritance according to the whole mitogenomes information, in order to provide genetic information about the mitogenome for the diversity of the human genome.
According to the results of genetic diversity analysis of the Bouyei, Dong, and Sui in Guizhou, the high haplotype diversity was found in three Tai-Kadai-speaking populations. At the same time, the number of segregation sites, the total number of mutations, the average number of pairwise nucleotide differences and the nucleotide diversity based on the whole mitogenome data, all exhibited high genetic polymorphism.
The purpose of using the commonly used neutrality tests is to identify sequences that do not conform to the neutral theoretical model in the balance between the mutation and genetic drift. According to the results of neutrality tests, including Tajima’s D (Tajima, 1989) and Fu’s Fs test (Fu, 1997), a large negative value was found in the Guizhou Tai-Kadai-speaking population, showing a significant neutrality test deviation. The above results can be explained that evolutionary forces such as population expansion have led to a very high frequency of rare or private variants in the matrilineal gene pool of the Guizhou Tai-Kadai-speaking population. Mismatch distribution analysis is also a powerful tool to analyze the historical dynamics of the population. This analysis can be used to compare any two sequences of one or more populations to get the distribution of pairing differences between each sequence. It is a visualization method for the historical dynamics of the population. The distribution curve of the Bouyei, Dong, and Sui in Guizhou also supported the statistical demographic history of mutation expansion with the unimodal mismatch distribution and non-significant model fit statistics. This indicated that the hypothesis of population expansion could not be rejected and suggested that the three Tai-Kadai-speaking populations in Guizhou have experienced expansion or continued growth in the past. At the same time, the results of BSP likewise confirmed that the three Tai-Kadai-speaking populations in Guizhou had experienced significant population expansion. The results of the above analysis all come to a consistent conclusion, which further firmly supports the conjecture of population expansion.
The results of heteroplasmies indicated that the PHPs detected in the CR occurred in the main hotspots locations in the mitogenome. In addition, as reported by Just et al. (2015), most of the PHPs are rare and randomly distributed in the whole mitogenome.
The results showed that there are more abundant haplogroups in the population of the Tai-Kadai language family in Guizhou. Below, we briefly discuss the characteristics and distribution of these haplogroups. As shown in Figure 4, the M7 sub-haplogroup (16.03%) accounted for the highest proportion of the Tai-Kadai-speaking population in Guizhou. As a typical branch of haplogroup M*, M7 sub-haplogroup belonged to the distinctive haplogroup of East Asian population and had the typical characteristics of southern distribution in East Asia (Kivisild et al., 2002). It has been reported that haplogroup M7 exhibits a relatively high frequency among mainlanders in Southeast Asia (Kutanan et al., 2017, 2018; Duong et al., 2018), populations in South China (Lippold et al., 2014; Auton et al., 2015), as well as Taiwanese populations (Ko et al., 2014; Brandão et al., 2016). The haplogroup F of the Guizhou Tai-Kadai-speaking population (20.91%) was the second matrilineal lineage in this population following haplogroup M*, and it was predominantly composed of sub-haplogroup F1 (13.24%). The haplogroup F was very widely distributed geographically in Asia (Auton et al., 2015; Kutanan et al., 2018; Li et al., 2019), and their sub-haplogroups showed different patterns of distribution. F1 sub-haplogroup is widespread in Southeast Asia, as well as South and Southwest China. Furthermore, haplogroup N9a and its sub-haplogroups occurred comparatively frequently in populations of Tai-Kadai language family from Thai and Lao (Kutanan et al., 2017), whereas these sub-haplogroups were absent in Dai Chinese of Tai-Kadai (Auton et al., 2015). The haplogroup B (20.21%) was principally composed of B5 sub-haplogroup (13.24%). As described in previous studies, sub-haplogroup B5 maintains a relatively high frequency in Southeast Asia (Li et al., 2019), and is also widely distributed in mainland Southeast Asia (Duong et al., 2018). The proportion of haplogroup R* was 12.20%. B, M7, F, and R are the most typical southern haplogroups, and the frequency of these haplogroups decreases in the more northern populations (Li et al., 2007). Accordingly, these four haplogroups are essential for studying the matrilineal relationships of the Tai-Kadai-speaking populations in Guizhou. The network analysis of haplogroups M7, B4′5, D4 and F1 indicated that the genetic admixture between the Guizhou Tai-Kadai-speaking population and other populations is restricted. At the same time, a majority of closely related haplotypes come from different Tai-Kadai-speaking populations, which furthermore certified that there was a close genetic relationship between studied populations in Guizhou and the same language family populations in East Asia.
The AMOVA analysis could analyze and decompose the genetic variation level of the population, and could effectively measure the differentiation of sub-populations according to the estimation of genetic evolution distance between haplotypes or genotypes. When the population was grouped according to different influencing factors, the degree of population differentiation under different factors was measured by AMOVA, and the effects of the influencing factors on population genetic diversity could be assessed to a certain extent (Amaral et al., 2015; Li et al., 2019).
According to the results of AMOVA, after 82 worldwide populations were grouped according to linguistic families and geographic distributions, the proportion of variation within populations in geographic group was lower than that in linguistic group. To a certain extent, when groups were divided based on geographic factors, better population clustering could be gained compared with classification according to linguistic. In addition, the proportion of variation among populations within groups divided according to geographic factors was higher than that divided according to linguistic families, which also indicated that compared with grouping according to linguistic families, populations based on geographic distribution factors could get a more obvious distinction among populations within groups, while higher variation among populations within groups could better justify the substructure of the populations.
On the other hand, after grouping 26 populations in China, the proportion of within populations variation grouped according to linguistic factors was somewhat lower than that grouped according to geographic factors. This also showed that when Chinese populations were divided based on linguistic factors, better population clustering could be accomplished in each linguistic group than in the geographical group.
Generally speaking, the division of mitogenome data of different global populations according to geographic factors could provide a better perspective for the analysis of the substructure of population genetic differentiation.
The statistical parameter Fst proposed by Wright (1950) provided an important insight into the evolutionary process that affects the structure of genetic variation within and among populations. It is one of the most widely utilized descriptive statistics in population and evolutionary genetics. Fst is directly related to the allele frequency difference among populations and the degree of similarity among individuals within each population (Holsinger and Weir, 2009). A smaller Fst value means that the allele frequencies of each population are similar. If the value of Fst is higher, it means that the allele frequency is different, which signifies a larger genetic distance. The results of Fst indicated that the genetic distance among the three research populations of the Tai-Kadai-speaking population in Guizhou (Bouyei, Dong, and Sui) was the closest. Among all the reference populations, the research population exhibited close genetic relationships with the Tai-Kadai-speaking populations in Southeast Asia, such as CT, YU2, and TKLU, and there were significant genetic differences between the study population and the African populations.
Based on the Fst value, the phylogenetic tree we constructed showed the similar result. The Tai-Kadai-speaking population in Guizhou was gathered in the same branch as the Tai-Kadai and some Austronesian-speaking populations in East and Southeast Asia. Combined with the PCA plot, at the level of world population, classified according to geographic distributions and linguistic families, the Tai-Kadai-speaking population in Guizhou also showed close genetic relationships with the Tai-Kadai-speaking populations in East and Southeast Asia and the Austronesian-speaking populations in Taiwan. Due to the geographic and linguistic factors, it was possible to have close genetic relationships between the Tai-Kadai-speaking populations in Guizhou and the populations with the same linguistic families in East and Southeast Asia. On the other hand, there were close genetic relationships between the Guizhou Tai-Kadai-speaking population and the Austronesian-speaking populations in Taiwan. From a linguistic point of view, this result supported the conclusion that there was an ancestral relationship between the Tai-Kadai and the Austronesian language family (Kutanan et al., 2018). In addition, from the perspective of tracing back to the origin, the ancestors of Taiwan, that is, the people of Liangdao, belonged to the “Baiyue” tribe. The Liangdao people and the ancestors of the Tai-Kadai-speaking population in Guizhou belonged to the same giant tribe. Therefore, the existence of a close genetic relationship may be due to the above reasons.
Conclusion
In this study, we produced the latest mitogenome data of 287 individuals of the Tai-Kadai-speaking population in Guizhou from 83 Bouyei individuals, 107 Dong individuals, and 97 Sui individuals. We discovered that the population of the Tai-Kadai language family in Guizhou has a high genetic polymorphism and the possibility of recent population expansion. PCA, phylogenetic tree analysis and Fst analysis all indicated that there were close genetic relationships between the Guizhou Tai-Kadai-speaking populations and the Tai-Kadai as well as some Austronesian populations in East and Southeast Asia. AMOVA analysis revealed that geographical and linguistic factors play a key role in gene flow. All in all, the mitogenome data generated in this study will enrich the existing mtDNA database, and provide more in-depth research results for the genetic structure of Guizhou Tai-Kadai-speaking population from the perspective of matrilineal inheritance. At the same time, this study actively promotes research on the population genetic structure and population historical dynamics of the Tai-Kadai-speaking population in Guizhou in the fields of population genetics and anthropology.
Data availability statement
The datasets presented in this study can be found in online repositories. The names of the repository/repositories and accession number(s) can be found in the article.
Ethics statement
The studies involving human participants were reviewed and approved by the Ethics Committee of Guizhou Medical University. The patients/participants provided their written informed consent to participate in this study.
Author contributions
YF wrote the manuscript. ZR and YF conceived and designed the study. YF and HZ ran analyses. QW, XJ, CL, and YF conducted the experiments. HJ, XJ, ZR, and YL revised the manuscript. All authors contributed to the article and approved the submitted version.
Funding
This study was supported by the foundations as follows: National Natural Science Foundation (No. 82160324). Guizhou Scientific Support Project, Qian Science Support (2021) General 448. Shanghai Key Lab of Forensic Medicine, Key Lab of Forensic Science, Ministry of Justice, China (Academy of Forensic Science), Open Project, KF202009. Guizhou Province Education Department, Characteristic Region Project, Qian Education KY No. (2021) 065. Guizhou “Hundred” High-level Innovative Talent Project, Qian Science Platform Talents (2020)6012. Guizhou Scientific Support Project, Qian Science Support (2020) 4Y057. Guizhou Science Project, Qian Science Foundation (2020) 1Y353. Guizhou Scientific Cultivation Project, Qian Science Platform Talent (2018) 5779-X. Guizhou Engineering Technology Research Center Project, Qian High-Tech of Development and Reform Commission No. (2016)1345.
Acknowledgments
We thank all volunteers who provided blood samples for this study.
Conflict of interest
The authors declare that the research was conducted in the absence of any commercial or financial relationships that could be construed as a potential conflict of interest.
Publisher’s note
All claims expressed in this article are solely those of the authors and do not necessarily represent those of their affiliated organizations, or those of the publisher, the editors and the reviewers. Any product that may be evaluated in this article, or claim that may be made by its manufacturer, is not guaranteed or endorsed by the publisher.
Supplementary material
The Supplementary Material for this article can be found online at: https://www.frontiersin.org/articles/10.3389/fevo.2022.1000493/full#supplementary-material
Footnotes
- ^ https://empop.online
- ^ https://www.britannica.com/place/Guizhou
- ^ http://cutadapt.readthedocs.org/
- ^ http://www.usadellab.org/cms/index.php?page=trimmomatic
- ^ http://bio-bwa.sourceforge.net/
- ^ https://bedtools.readthedocs.io/en/latest/
- ^ http://bowtie-bio.sourceforge.net/bowtie2/
- ^ http://samtools.sourceforge.net/
- ^ http://varscan.sourceforge.net/
- ^ https://samtools.github.io/bcftools/
- ^ http://www.phylotree.org/
- ^ https://www.snapgene.com/
- ^ https://www.r-project.org/
- ^ https://empop.online/empcheck
- ^ http://www.phylotree.org/index.htm
- ^ https://haplogrep.i-med.ac.at
References
Amaral, M. R., Albrecht, M., McKinley, A. S., de Carvalho, A. M., de Sousa Junior, S. C., and Diniz, F. M. (2015). Mitochondrial DNA Variation Reveals a Sharp Genetic Break within the Distribution of the Blue Land Crab Cardisoma guanhumi in the Western Central Atlantic. Molecules 20, 15158–15174. doi: 10.3390/molecules200815158
Andrews, R. M., Kubacka, I., Chinnery, P. F., Lightowlers, R. N., Turnbull, D. M., and Howell, N. (1999). Reanalysis and revision of the Cambridge reference sequence for human mitochondrial DNA. Nat. Genet. 23:147. doi: 10.1038/13779
Auton, A., Brooks, L. D., Durbin, R. M., Garrison, E. P., Kang, H. M., Korbel, J. O., et al. (2015). A global reference for human genetic variation. Nature 526, 68–74. doi: 10.1038/nature15393
Bandelt, H. J., Forster, P., and Röhl, A. (1999). Median-joining networks for inferring intraspecific phylogenies. Mol. Biol. Evol. 16, 37–48. doi: 10.1093/oxfordjournals.molbev.a026036
Bandelt, H. J., van Oven, M., and Salas, A. (2012). Haplogrouping mitochondrial DNA sequences in Legal Medicine/Forensic Genetics. Int. J. Legal Med. 126, 901–916. doi: 10.1007/s00414-012-0762-y
Behar, D. M., Villems, R., Soodyall, H., Blue-Smith, J., Pereira, L., Metspalu, E., et al. (2008). The dawn of human matrilineal diversity. Am. J. Hum. Genet. 82, 1130–1140. doi: 10.1016/j.ajhg.2008.04.002
Biffi, A., Anderson, C. D., Nalls, M. A., Rahman, R., Sonni, A., Cortellini, L., et al. (2010). Principal-component analysis for assessment of population stratification in mitochondrial medical genetics. Am. J. Hum. Genet. 86, 904–917.
Brandão, A., Eng, K. K., Rito, T., Cavadas, B., Bulbeck, D., Gandini, F., et al. (2016). Quantifying the legacy of the Chinese Neolithic on the maternal genetic heritage of Taiwan and Island Southeast Asia. Hum. Genet. 135, 363–376. doi: 10.1007/s00439-016-1640-3
Chatterjee, A., Mambo, E., and Sidransky, D. (2006). Mitochondrial DNA mutations in human cancer. Oncogene 25, 4663–4674. doi: 10.1038/sj.onc.1209604
Chen, P., He, G., Zou, X., Zhang, X., Li, J., Wang, Z., et al. (2018). Genetic diversities and phylogenetic analyses of three Chinese main ethnic groups in southwest China: A Y-Chromosomal STR study. Sci. Rep. 8:15339. doi: 10.1038/s41598-018-33751-x
Derenko, M., Malyarchuk, B., Grzybowski, T., Denisova, G., Dambueva, I., Perkova, M., et al. (2007). Phylogeographic analysis of mitochondrial DNA in northern Asian populations. Am. J. Hum. Genet. 81, 1025–1041. doi: 10.1086/522933
Duong, N. T., Macholdt, E., Ton, N. D., Arias, L., Schröder, R., Van Phong, N., et al. (2018). Complete human mtDNA genome sequences from Vietnam and the phylogeography of Mainland Southeast Asia. Sci. Rep. 8:11651. doi: 10.1038/s41598-018-29989-0
Excoffier, L., and Lischer, H. E. (2010). Arlequin suite ver 3.5: A new series of programs to perform population genetics analyses under Linux and Windows. Mol. Ecol. Resour. 10, 564–567. doi: 10.1111/j.1755-0998.2010.02847.x
Feng, Y., Zhang, H., Wang, Q., Yang, M., Liu, Y., Wang, J., et al. (2021). The mitochondrial DNA control region sequences from the Chinese sui population of southwestern China. Ann. Hum. Biol. 48, 635–640. doi: 10.1080/03014460.2021.1994649
Fu, Y. X. (1997). Statistical tests of neutrality of mutations against population growth, hitchhiking and background selection. Genetics 147, 915–925. doi: 10.1093/genetics/147.2.915
Gallimore, J. M., McElhoe, J. A., and Holland, M. M. (2018). Assessing heteroplasmic variant drift in the mtDNA control region of human hairs using an MPS approach. Forensic Sci. Int. Genet. 32, 7–17. doi: 10.1016/j.fsigen.2017.09.013
Galtier, N., Nabholz, B., Glémin, S., and Hurst, G. D. (2009). Mitochondrial DNA as a marker of molecular diversity: A reappraisal. Mol. Ecol. 18, 4541–4550. doi: 10.1111/j.1365-294X.2009.04380.x
Guo, J., Ji, J., He, G., Ren, Z., Zhang, H., Wang, Q., et al. (2019). Genetic structure and forensic characterisation of 19 X-chromosomal STR loci in Guizhou Sui population. Ann. Hum. Biol. 46, 246–253. doi: 10.1080/03014460.2019.1623911
He, G., Wang, Z., Zou, X., Wang, M., Liu, J., Wang, S., et al. (2019). Tai-Kadai-speaking Gelao population: Forensic features, genetic diversity and population structure. Forensic Sci. Int. Genet. 40:e231–e239. doi: 10.1016/j.fsigen.2019.03.013
Heinz, T., Pala, M., Gómez-Carballa, A., Richards, M. B., and Salas, A. (2017). Updating the African human mitochondrial DNA tree: Relevance to forensic and population genetics. Forensic Sci. Int. Genet. 27, 156–159. doi: 10.1016/j.fsigen.2016.12.016
Ho, S. Y., Lanfear, R., Bromham, L., Phillips, M. J., Soubrier, J., Rodrigo, A. G., et al. (2011). Time-dependent rates of molecular evolution. Mol. Ecol. 20, 3087–3101. doi: 10.1111/j.1365-294X.2011.05178.x
Holsinger, K. E., and Weir, B. S. (2009). Genetics in geographically structured populations: Defining, estimating and interpreting F(ST). Nat. Rev. Genet. 10, 639–650. doi: 10.1038/nrg2611
Huber, N., Parson, W., and Dür, A. (2018). Next generation database search algorithm for forensic mitogenome analyses. Forensic Sci. Int. Genet. 37, 204–214. doi: 10.1016/j.fsigen.2018.09.001
Ji, J., Ren, Z., Zhang, H., Wang, Q., Wang, J., Kong, Z., et al. (2017). Genetic profile of 23 Y chromosomal STR loci in Guizhou Shui population, southwest China. Forensic Sci. Int. Genet. 28:e16–e17. doi: 10.1016/j.fsigen.2017.01.010
Just, R. S., Irwin, J. A., and Parson, W. (2015). Mitochondrial DNA heteroplasmy in the emerging field of massively parallel sequencing. Forensic Sci. Int. Genet. 18, 131–139. doi: 10.1016/j.fsigen.2015.05.003
Kivisild, T., Tolk, H. V., Parik, J., Wang, Y., Papiha, S. S., Bandelt, H. J., et al. (2002). The emerging limbs and twigs of the East Asian mtDNA tree. Mol. Biol. Evol. 19, 1737–1751. doi: 10.1093/oxfordjournals.molbev.a003996
Ko, A. M., Chen, C. Y., Fu, Q., Delfin, F., Li, M., Chiu, H. L., et al. (2014). Early Austronesians: Into and out of Taiwan. Am. J. Hum. Genet. 94, 426–436. doi: 10.1016/j.ajhg.2014.02.003
Kovach, W. (1999). MVSP-A multivariate Statistical Package for Windows, ver. 3.1. Pentraeth: Kovach Computing Services.
Kumar, K. R., Cowley, M. J., and Davis, R. L. (2019). Next-Generation Sequencing and Emerging Technologies. Semin. Thromb. Hemost. 45, 661–673. doi: 10.1055/s-0039-1688446
Kumar, S., Stecher, G., and Tamura, K. (2016). MEGA7: Molecular Evolutionary Genetics Analysis Version 7.0 for Bigger Datasets. Mol. Biol. Evol. 33, 1870–1874. doi: 10.1093/molbev/msw054
Kutanan, W., Kampuansai, J., Brunelli, A., Ghirotto, S., Pittayaporn, P., Ruangchai, S., et al. (2018). New insights from Thailand into the maternal genetic history of Mainland Southeast Asia. Eur. J. Hum. Genet. 26, 898–911. doi: 10.1038/s41431-018-0113-7
Kutanan, W., Kampuansai, J., Srikummool, M., Kangwanpong, D., Ghirotto, S., Brunelli, A., et al. (2017). Complete mitochondrial genomes of Thai and Lao populations indicate an ancient origin of Austroasiatic groups and demic diffusion in the spread of Tai-Kadai languages. Hum. Genet. 136, 85–98. doi: 10.1007/s00439-016-1742-y
Le, C., Ren, Z., Zhang, H., Wang, Q., Yang, M., Liu, Y., et al. (2019). The mitochondrial DNA control region sequences from the Chinese Miao population of southeastern China. Ann. Hum. Biol. 46, 606–609. doi: 10.1080/03014460.2019.1694701
Leigh, J. W., and Bryant, D. (2015). POPART: Full-feature software for haplotype network construction. Methods Ecol. Evol. 6, 1110–1116.
Li, H., Cai, X., Winograd-Cort, E. R., Wen, B., Cheng, X., Qin, Z., et al. (2007). Mitochondrial DNA diversity and population differentiation in southern East Asia. Am. J. Phys. Anthropol. 134, 481–488. doi: 10.1002/ajpa.20690
Li, H., and Durbin, R. (2010). Fast and accurate long-read alignment with Burrows-Wheeler transform. Bioinformatics 26, 589–595. doi: 10.1093/bioinformatics/btp698
Li, Y. C., Ye, W. J., Jiang, C. G., Zeng, Z., Tian, J. Y., Yang, L. Q., et al. (2019). River Valleys Shaped the Maternal Genetic Landscape of Han Chinese. Mol. Biol. Evol. 36, 1643–1652. doi: 10.1093/molbev/msz072
Lippold, S., Xu, H., Ko, A., Li, M., Renaud, G., Butthof, A., et al. (2014). Human paternal and maternal demographic histories: Insights from high-resolution Y chromosome and mtDNA sequences. Investig. Genet. 5:13. doi: 10.1186/2041-2223-5-13
Ma, K., Zhao, X., Li, H., Cao, Y., Li, W., Ouyang, J., et al. (2018). Massive parallel sequencing of mitochondrial DNA genomes from mother-child pairs using the ion torrent personal genome machine (PGM). Forensic Sci. Int. Genet. 32, 88–93. doi: 10.1016/j.fsigen.2017.11.001
Mengge, W., Guanglin, H., Yongdong, S., Shouyu, W., Xing, Z., Jing, L., et al. (2020). Massively parallel sequencing of mitogenome sequences reveals the forensic features and maternal diversity of tai-kadai-speaking hlai islanders. Forensic Sci. Int. Genet. 47:102303. doi: 10.1016/j.fsigen.2020.102303
Murphy, M. P. (2018). Newly made mitochondrial DNA drives inflammation. Nature 560, 176–177. doi: 10.1038/d41586-018-05764-z
Ning, C., Li, T., Wang, K., Zhang, F., Li, T., Wu, X., et al. (2020). Ancient genomes from northern China suggest links between subsistence changes and human migration. Nat. Commun. 11:2700. doi: 10.1038/s41467-020-16557-2
Parson, W., and Dür, A. (2007). EMPOP–a forensic mtDNA database. Forensic Sci. Int. Genet. 1, 88–92. doi: 10.1016/j.fsigen.2007.01.018
Rakha, A., Fatima, Peng, M. S., Adan, A., Bi, R., Yasmin, M., et al. (2017). mtDNA sequence diversity of Hazara ethnic group from Pakistan. Forensic Sci. Int. Genet. 30:e1–e5. doi: 10.1016/j.fsigen.2017.07.004
Rozas, J., Ferrer-Mata, A., Sánchez-DelBarrio, J. C., Guirao-Rico, S., Librado, P., Ramos-Onsins, S. E., et al. (2017). DnaSP 6: DNA Sequence Polymorphism Analysis of Large Data Sets. Mol. Biol. Evol. 34, 3299–3302. doi: 10.1093/molbev/msx248
Simão, F., Ferreira, A. P., de Carvalho, E. F., Parson, W., and Gusmão, L. (2018). Defining mtDNA origins and population stratification in Rio de Janeiro. Forensic Sci. Int. Genet. 34, 97–104. doi: 10.1016/j.fsigen.2018.02.003
Strobl, C., Churchill Cihlar, J., Lagacé, R., Wootton, S., Roth, C., Huber, N., et al. (2019). Evaluation of mitogenome sequence concordance, heteroplasmy detection, and haplogrouping in a worldwide lineage study using the Precision ID mtDNA Whole Genome Panel. Forensic Sci. Int. Genet. 42, 244–251. doi: 10.1016/j.fsigen.2019.07.013
Sun, J., Li, Y. X., Ma, P. C., Yan, S., Cheng, H. Z., Fan, Z. Q., et al. (2021). Shared paternal ancestry of Han, Tai-Kadai-speaking, and Austronesian-speaking populations as revealed by the high resolution phylogeny of O1a-M119 and distribution of its sub-lineages within China. Am. J. Phys. Anthropol. 174, 686–700. doi: 10.1002/ajpa.24240
Tajima, F. (1989). Statistical method for testing the neutral mutation hypothesis by DNA polymorphism. Genetics 123, 585–595. doi: 10.1093/genetics/123.3.585
Torroni, A., Achilli, A., Macaulay, V., Richards, M., and Bandelt, H. J. (2006). Harvesting the fruit of the human mtDNA tree. Trends Genet. 22, 339–345. doi: 10.1016/j.tig.2006.04.001
van Dijk, E. L., Jaszczyszyn, Y., Naquin, D., and Thermes, C. (2018). The Third Revolution in Sequencing Technology. Trends Genet. 34, 666–681. doi: 10.1016/j.tig.2018.05.008
Wang, C. C., Yeh, H. Y., Popov, A. N., Zhang, H. Q., Matsumura, H., Sirak, K., et al. (2021). Genomic insights into the formation of human populations in East Asia. Nature 591, 413–419. doi: 10.1038/s41586-021-03336-2
Wood, M. R., Sturk-Andreaggi, K., Ring, J. D., Huber, N., Bodner, M., Crawford, M. H., et al. (2019). Resolving mitochondrial haplogroups B2 and B4 with next-generation mitogenome sequencing to distinguish Native American from Asian haplotypes. Forensic Sci. Int. Genet. 43:102143. doi: 10.1016/j.fsigen.2019.102143
World Medical Association (2013). World Medical Association Declaration of Helsinki: Ethical principles for medical research involving human subjects. Jama 310, 2191–2194. doi: 10.1001/jama.2013.281053
Yang, L., Zhao, Y., Liu, C., Chan, D. W., Chan, M., and He, M. (2013). Allele frequencies of 15 STRs in five ethnic groups (Han, Gelao, Jing, Shui and Zhuang) in South China. Forensic Sci. Int. Genet. 7:e9–e14. doi: 10.1016/j.fsigen.2012.10.009
Keywords: mitogenome, Guizhou Tai-Kadai, genetic diversity, maternal heredity, haplogroup
Citation: Feng Y, Zhang H, Wang Q, Jin X, Le C, Liu Y, Wang X, Jiang H and Ren Z (2022) Whole mitochondrial genome analysis of Tai-Kadai-speaking populations in Southwest China. Front. Ecol. Evol. 10:1000493. doi: 10.3389/fevo.2022.1000493
Received: 22 July 2022; Accepted: 11 August 2022;
Published: 25 August 2022.
Edited by:
Chuan-Chao Wang, Xiamen University, ChinaReviewed by:
Renkuan Tang, Chongqing Medical University, ChinaQiu Pingming, Southern Medical University, China
Hong Shi, Kunming University of Science and Technology, China
Pengyu Chen, Affiliated Hospital of Zunyi Medical College, China
Copyright © 2022 Feng, Zhang, Wang, Jin, Le, Liu, Wang, Jiang and Ren. This is an open-access article distributed under the terms of the Creative Commons Attribution License (CC BY). The use, distribution or reproduction in other forums is permitted, provided the original author(s) and the copyright owner(s) are credited and that the original publication in this journal is cited, in accordance with accepted academic practice. No use, distribution or reproduction is permitted which does not comply with these terms.
*Correspondence: Huang Jiang, bW1tX2hqQDEyNi5jb20=; Zheng Ren, NTIzMDQ5NTcyQHFxLmNvbQ==