 Remedios Nava-Díaz
 Iriana Zuria2*
94% of researchers rate our articles as excellent or good
Learn more about the work of our research integrity team to safeguard the quality of each article we publish.
Find out more
ORIGINAL RESEARCH article
Front. Ecol. Evol., 20 January 2022
Sec. Urban Ecology
Volume 9 - 2021 | https://doi.org/10.3389/fevo.2021.795913
This article is part of the Research TopicEcological and Evolutionary Processes in Neotropical Urban EcosystemsView all 8 articles
Urban expansion is a pervasive driver of biodiversity loss. To understand the effects of urbanization on diversity, we investigated the response of bird taxonomic, phylogenetic, and functional diversity to urban green spaces’ characteristics in thirty-one green spaces of Mexico City. Selected sites encompassed variation of environmental factors along a transformation gradient, from natural protected areas to landscaped parks. Bird observations were conducted during winter (non-breeding season), spring (dry breeding season), and summer (wet breeding season). We used multi-model inference to assess the relationship of green space area, shape, isolation, tree richness, habitat diversity, and vegetation cover with species richness, Faith’s phylogenetic diversity, and functional richness. We calculated standardized effect sizes from null models to assess phylogenetic and functional structure. We registered 91 species belonging to 28 families across all sites and seasons. The number of detected species was largest in winter and decreased toward the dry breeding season, and then toward the wet breeding season. We found a moderate to strong positive relationship of species richness with phylogenetic diversity and functional richness. Overall, phylogenetic and functional structure of bird communities in green spaces was neither clustered nor over-dispersed. However, few cases of functional clustering, phylogenetic clustering, or both were observed, and they corresponded to natural protected areas. Results showed a predominant role of green space area in determining community diversity and phylogenetic structure while it did not influence functional structure. Contrary to our predictions, habitat diversity had a negative effect on species richness and phylogenetic diversity and this effect was detected only during the wet breeding season, whereas isolation showed a positive relationship with phylogenetic and functional structure, during the wet breeding season and winter, respectively. This study emphasizes the use of complementary measures of diversity together with the comparison between observed and expected values to get a better insight into the mechanisms by which green spaces’ characteristics affect bird diversity across the seasons.
Habitat degradation and habitat loss resulting from human activity are among the dominant drivers of the current mass extinction of fauna, the so-called Anthropocene defaunation (Dirzo et al., 2014; Young et al., 2016). Considered a pervasive and long-lasting transformation, urban growth contributes to the loss of natural habitats (Liu et al., 2016) and leads to declines in local species richness and abundance (Newbold et al., 2015). Given the global expansion of urban areas (Seto et al., 2011), we require a better understanding of those factors that support biodiversity in these areas in order to reconcile urban development and biodiversity conservation.
Green spaces are a key element for biodiversity conservation in cities since they represent available habitat for a wide range of organisms (Cornelis and Hermy, 2004; MacGregor-Fors et al., 2016) and much of the research on diversity in urban green spaces has focused on birds (Magle et al., 2012; Beninde et al., 2015). Studies have mainly reported reductions in both the number of species and diversity indices together with compositional changes (Carvajal-Castro et al., 2019; Di Pietro et al., 2020 but see Benitez et al., 2021). Although species richness has been a widely-used measure of biodiversity to assess the effect of urbanization on bird communities (Rush et al., 2014; Canedoli et al., 2017; Matthies et al., 2017) the assumption of species being equivalent may not be ecologically precise (Chave, 2004). In addition, in recent years, the multidimensional nature of biodiversity (Naeem et al., 2016) has been acknowledged in urban bird research and studies have increasingly included measures of functional, genetic, and phylogenetic diversity (Filippi-Codaccioni et al., 2009; Delaney et al., 2010; Morelli et al., 2016; Schmidt et al., 2020).
Here, we use taxonomic, phylogenetic, and functional measures of diversity to get a more complete insight into the response of bird communities to urban habitats. Functional diversity can be defined as the diversity of functional traits of those species found in an assemblage (Mason and Mouillot, 2013). A functional trait is any phenotypic characteristic that can influence ecosystem processes or the species’ response to the environmental conditions (Hooper et al., 2005). Phylogenetic diversity represents an alternative to quantify the biological attributes in an assemblage (Faith, 1992) and it differs from functional diversity in the fact that it comprises observed and unobserved characters (Faith, 2002). To do so, the diversity of features is estimated from the phylogenetic relationships among the species under the assumption that estimated amounts of divergence, measured as the branching pattern and branch lengths in a cladogram, can be used to derive feature diversity (Faith, 1994).
Besides its inherent value, functional and phylogenetic diversity hold conceptual relevance for community ecology since functional and phylogenetic clustering patterns can provide insights into community assembly mechanisms such as the environmental filtering of species from the regional species pool (Weiher, 2011). So far, there is evidence that suggests that urban areas may be acting as filters for some lineages and functional traits (Sol et al., 2017; Leveau, 2021). To test this, departure from randomness is assessed through the comparison of observed values against random expectations obtained from null models that take into account differences in species richness (Swenson, 2014; for an example see Weideman et al., 2020).
Previous works conducted in human-modified areas have shown that environmental effects on biological diversity can be dimension specific (Cisneros et al., 2015). As an example, bird species richness, functional richness and evolutionary distinctiveness responded to different attributes of Beijing’s urban parks (Morelli et al., 2017). While species richness showed a positive relationship with water cover, functional richness decreased with shrub cover, and evolutionary distinctiveness increased with deciduous tree cover. Furthermore, bird diversity dimensions can vary among seasons in urban areas (Alexander et al., 2019; Ibáñez-Álamo et al., 2020). Therefore, to achieve an effective urban bird conservation, it is necessary to employ a multidimensional approach with a temporal perspective for its diversity assessment (Devictor et al., 2010).
A wide range of factors can influence bird diversity in urban green spaces (Yang et al., 2015; Morelli et al., 2018b; Liu et al., 2019). While there is strong support for the main role of some factors such as area, habitat diversity, and plant species richness, evidence is still inconclusive about the effects of others such as shape and isolation of green spaces (Nielsen et al., 2014; La Sorte et al., 2020). In this context, we aimed to examine the taxonomic, phylogenetic, and functional bird diversity and their relationship with green spaces’ characteristics. Additionally, we explored the influence of these characteristics on phylogenetic and functional clustering.
Based on the abovementioned information and previous works (Ibáñez-Álamo et al., 2020), our first hypothesis concerning seasonal variation would be that studied bird diversity dimensions and their relationship with environmental factors would differ among seasons. We also expected to detect a departure from randomness of phylogenetic and functional diversity observed values under the assumption that urbanization acts as an ecological filter. More specifically, we hypothesized that bird assemblages in the most heavily transformed sites would show a clustered phylogenetic and functional pattern considering that some lineages and traits could be favored by urban areas (Sol et al., 2014; Evans et al., 2018). A third hypothesis was that bird diversity, measured in any of its dimensions, would increase as green space area and habitat heterogeneity increased based on existing information (Matthies et al., 2017; Yang et al., 2020; Benitez et al., 2021).
We conducted this study in Mexico City which forms part of the Metropolitan Area of the Valley of Mexico. Mexico City has an approximate area of 1,499 km2 and an estimated population of 9,209,944 inhabitants (INEGI (Instituto Nacional de Estadística y Geografía), 2021) and despite its high urbanization degree, near one third of its extent is covered by natural vegetation (471 km2) (INEGI (Instituto Nacional de Estadística y Geografía), 2016). The climate of Mexico City varies geographically, being temperate toward the northeastern part of the city and cool toward the southwestern part. Hence, mean annual temperate ranges between 8 and 10°C in the southwestern region and can be over 16°C in the northeastern part (Hernández-Cerda et al., 2016). The average annual rainfall is 1,200 mm in the wettest areas and 600 mm in the driest areas. The dry season occurs from October to May and the rainy season from June to September (INEGI (Instituto Nacional de Estadística y Geografía), 2017).
We surveyed 31 green spaces distributed from near downtown to the southwestern urban fringe (Figure 1). Site selection was intended to encompass variation of environmental factors along a transformation gradient. As a result, surveyed green spaces included recreational parks, an arboretum, a university campus, and natural protected areas. At one extreme, in heavily modified green spaces, vegetation was dominated by the broadleaf trees Fraxinus uhdei (“ash,” native species) and Jacaranda mimosifolia (“blue jacaranda,” exotic species) and the coniferous tree Cupressus lusitanica (“cypress,” native species). In these sites, artificial structures were abundant and natural ground covers were substituted by concrete to differing extents. At the other extreme, in the most natural sites, dominant plant species were conifers that belonged to the genus Pinus (“pine,” native species) and Abies (“fir,” native species) and artificial structures such as electric poles or wires were scarce or absent.

Figure 1. Left: overview of sampled green spaces and areas considered as potential species pools in Mexico City. Upper right: zoom to the shadowed area (A). Lower right: zoom to the shadowed area (B).
Birds were counted by a single observer (RND) in three different periods of 2018 which corresponded to: (1) the wintering season (from January 3rd to January 22nd), (2) the dry part of the breeding season (from May 1st to May 27th) and the rainy part of the breeding season (from August 1st to September 4th). Hereafter, we will refer to these periods as winter, dry breeding, and wet breeding seasons. The distinction between dry and wet seasons is relevant since fluctuations in food availability and temperature can affect bird distribution across the studied green spaces (Zuckerberg et al., 2011; Sainz-Borgo, 2016). Data on bird richness and abundance were collected within four hours after sunrise and by using standardized 5-min point counts with a fixed radius of 25 m. Points were separated by at least 200 m to avoid double-counting of individual birds (Bibby et al., 1993). All points were visited twice each season, on different days in a random order. Point counts were used to obtain a reliable species’ relative abundance estimate (Bibby et al., 1993) and for each point count and each species, the highest number of individuals recorded in any of the two visits was used as the abundance estimate. The number of points located in each green space ranged from one to nine based on green space size and accessibility. In total, we sampled 107 points distributed in thirty-one green spaces. We recorded all birds detected visually or acoustically, except those that were flying over.
For each green space, we used eight predictor variables (Table 1). To determine the size of green spaces we delineated their perimeters with the aid of a Geographic Information System (QGIS) and high resolution images (Google Earth). Shape index was calculated with the following formula (Corey et al., 2012):
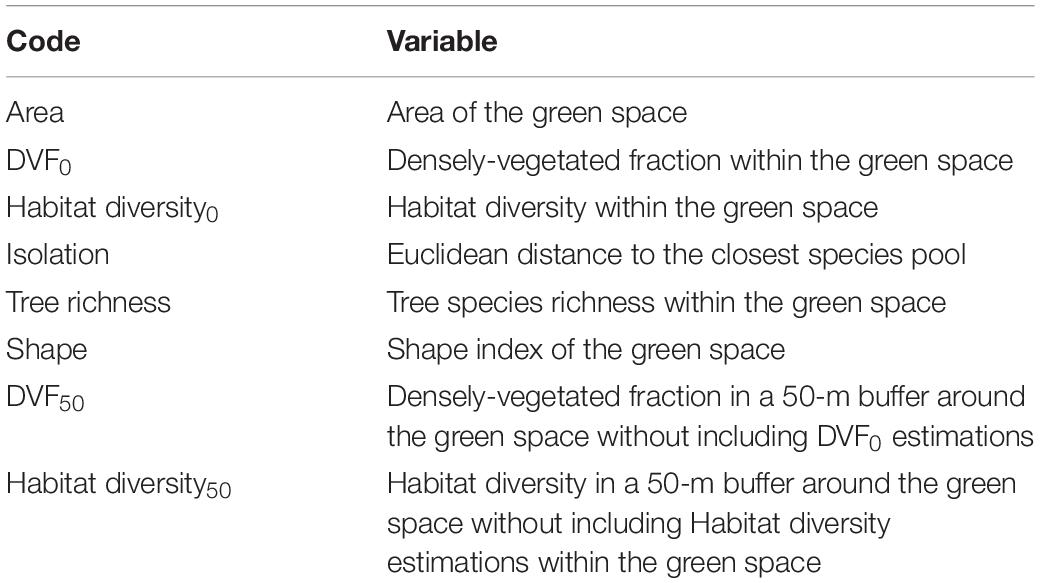
Table 1. Predictors included in analyses to describe variation in response variables.
Shape index ranges from 1 to ∞. A shape index of 1 corresponds to a circular patch, whereas an irregular patch has a shape index > 1. As the shape of the patch becomes more irregular, the shape index increases (Corey et al., 2012). To describe the distribution and amount of vegetation in each green space we used satellite imagery to derive a vegetation index. We computed the Normalized Vegetation Index (NDVI), an index that relies on the reflectance of red and near-infrared light (Huete et al., 1985). NDVI has been used for different purposes, including vegetation cover and vegetation density estimation (MacDonald et al., 2010; Odindi and Mhangara, 2012). In this work, NDVI was derived from Sentinel-2A multi-spectral images obtained from the European Space Agency. In order to reduce discrepancies, we used images whose acquisition date was as close as possible to the bird sampling seasons while maintaining a low cloud cover percentage. For winter, dry breeding, and wet breeding seasons the acquisition dates of images were January 7th, June 1st and July 26th 2018 respectively. NDVI was calculated from the Red and Near-infrared (NIR) bands which have a spatial resolution of 10 m using the following formula:
NDVI is dimensionless and ranges from −1 to +1. Negative values indicate the absence of vegetation while positive values represent vegetated areas. NDVI values can be categorized into useful classes that separate different conditions of vegetation. Values above 0.2 are associated with vegetated areas and the larger the NDVI values the denser the vegetation (Fung and Siu, 2001; Hashim et al., 2019). We followed Odindi and Mhangara (2012) to group the NDVI values into five classes that describe different vegetation conditions: unvegetated (NDVI ≤ 0), very sparse vegetation (0 > NDVI < 0.2), sparse vegetation (0.2 ≥ NDVI < 0.4), dense vegetation (0.4 ≥ NDVI < 0.6), and very dense vegetation (0.6 ≥ NDVI ≤ 1).
For every studied season, two variables were derived from the corresponding NDVI data to describe vegetation cover of each green space. The first variable was the densely-vegetated fraction (DVF), estimated as a function of the number of pixels that represent dense and very dense vegetation. NDVI values above 0.5 can be considered as fully vegetated pixels (Sobrino et al., 2004), hence, DVF is a close approximation of the proportion of fully vegetated area in green spaces. Densely-vegetated fraction was computed as follows (Wong et al., 2019):
The second variable based on NDVI was the diversity of classes describing vegetation condition and this was used as a surrogate of habitat diversity (Habitat diversity). Simpson’s diversity index was used to quantify the diversity of vegetation conditions (Nagendra, 2002). The index was calculated with the following formula:
where pi is the proportional abundance of the ith NDVI class.
Additionally, we calculated the DVF and Habitat diversity for 50-m width buffers surrounding each green space (Figure 2). These estimations (DFV50 and Habitat diversity50) did not include estimations within the green space, so the information of each buffer is spatially exclusive from that of the green space (the “doughnut” method according to Dunford and Freemark, 2005). We used 50-m width buffers because landscape variables extracted at this scale have been reported as significant drivers of bird communities (Meffert and Dziock, 2013) and because we consider that management interventions at these small scales are more likely to be accomplished in urban landscapes. We used the distance between each green space and its closest likely source of species as a proxy of isolation (Fernandez-Juricic, 2000). We assumed protected areas, environmental valuable areas, and areas designated for conservation to function as regional species pools (Figure 1). We measured the Euclidean distance from the centroid of each green space to the edge of the closest species pool as long as it was larger than 100 ha. The number of tree species was registered in each sampling point and these data were pooled for every green space.
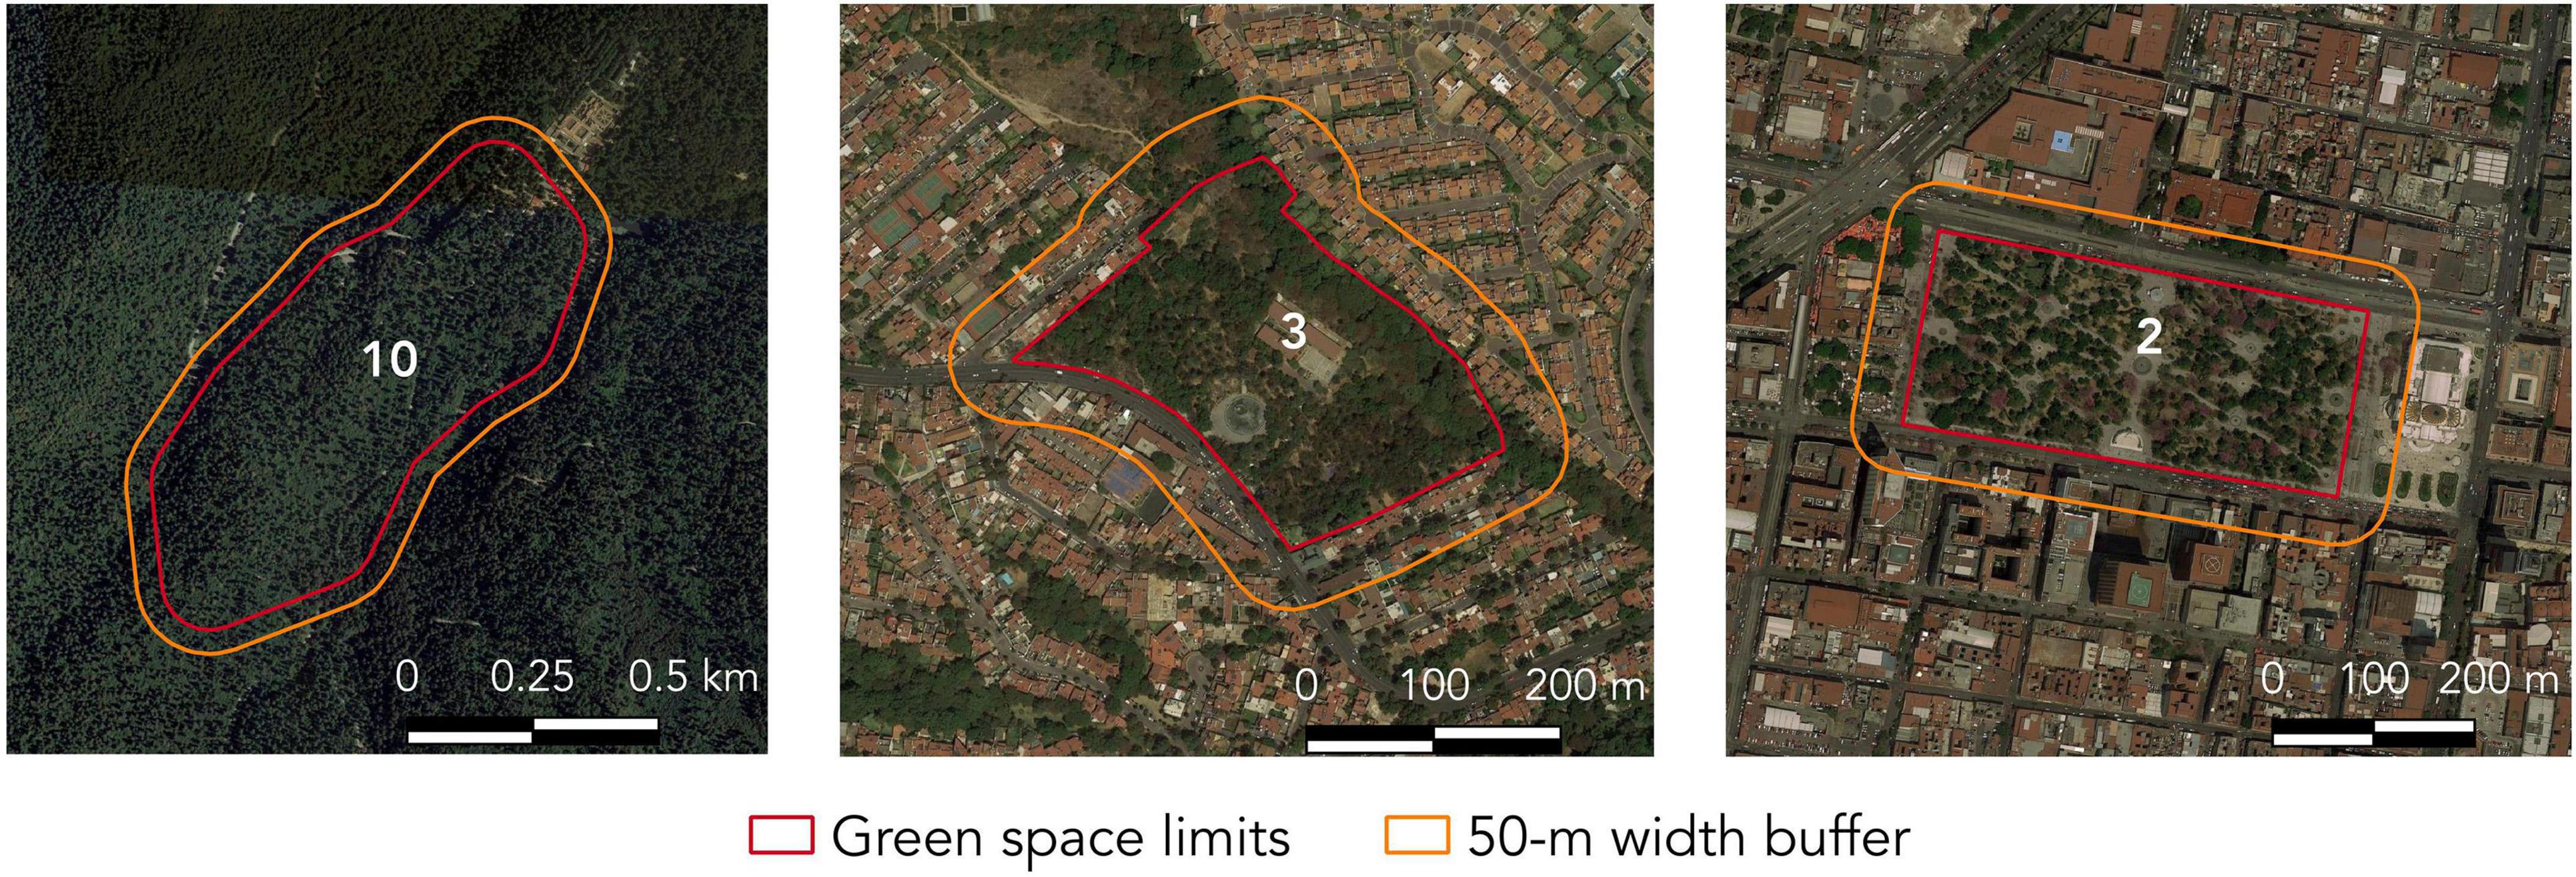
Figure 2. Satellite image (Google Earth©) showing three different green spaces and their corresponding 50-m width buffer. Green space numbers as in Figure 1.
We employed four traits to characterize all detected species: log-transformed body mass, main diet item, foraging strategy, and foraging stratum. Main diet items were the following: aquatic animals, fruit, generalist, invertebrates, nectar, seeds, and vertebrates. Foraging strategy categories were: aerial sallying, aerial screening, arboreal gleaning, bark gleaning, foraging generalist, and ground foraging. We considered the following foraging stratum categories: aerial, canopy, ground, mid height, understory, around water surface, below water surface. Foraging stratum is expressed as the estimated percentage use of each one of the all strata considered. The values of all the strata sum to 100. We selected these traits because their occurrence can be influenced by environmental conditions (Castaño-Villa et al., 2019). We built a species-trait matrix with information sourced from previous publications (Wilman et al., 2014; Tobias and Pigot, 2019).
For each season, we quantified diversity in green spaces with three different metrics. Firstly, we obtained cumulative species lists for each sampling point based on the species detected on both visits. Then, for each green space, diversity metrics were calculated after the cumulative species lists of all the corresponding sampling points were pooled. We calculated taxonomic diversity as species richness. To quantify functional diversity we used functional richness, which measures the amount of trait space occupied by the species in the community (Villéger et al., 2008). For functional richness to be computed, the number of species recorded in assemblages must be at least three. Phylogenetic diversity was quantified by means of the Faith’s phylogenetic diversity which measures the total evolutionary history of the species in a community (Frishkoff et al., 2014). Faith’s phylogenetic diversity is calculated as the sum of all branch lengths spanned by the tree connecting all the species in a community (Faith, 1992). For phylogenetic metric calculation, we used 1,000 dated phylogenies (Jetz et al., 2012): 500 phylogenies using the Hackett backbone and 500 phylogenies using the Erikson backbone following La Sorte et al. (2018). The use of sets of phylogenies can provide more robust comparative inferences than the use of a single consensus tree (Rubolini et al., 2015). Once the Faith’s phylogenetic diversity was computed for every phylogeny, we averaged the values across the 1,000 phylogenies.
Faith’s phylogenetic diversity and functional richness tend to be positively correlated with species richness (Swenson, 2014; Voskamp et al., 2017) so we checked potential correlations by means of Spearman correlation. To remove the effects of species richness on both indexes, we generated 999 null assemblages. Null assemblages were obtained through the randomization of species names on the trait data matrix and on the phylogeny maintaining constant the number of species of each focal assemblage (Swenson, 2014). For each season, we used a phylogeny and a trait matrix that included the species recorded in the specific season. To compare observed Faith’s phylogenetic diversity and functional richness values with expected values from null models we calculated standardized effect sizes (ses) and these were obtained using the following formula:
where Meanobs is the observed diversity value, Meanrand is the mean value of the randomized assemblages, and SDrand is the standard deviation of the randomized assemblages. Negative ses values indicate an observed value lower than the average value expected by chance, while positive values evidence an observed value higher than the average value expected by chance (Swenson, 2014).
In terms of community structure, negative ses values suggest phylogenetic or functional clustering, while positive ses values suggest phylogenetic or functional over-dispersion. In this way, ses values provide additional information to that obtained from non-standardized diversity measures. To test if observed values were either significantly lower or higher than the average value expected by chance, we assumed a normal distribution of observed and random values together. For a significance level = 0.05, observed values are considered not significantly different from random expectations if they range between −1.96 and 1.96 (Zar, 2014).
Previous to model fitting, we followed standard procedures in multiple regression analysis. We explored the distribution of the response variables to select the appropriate error structure. Models of species richness were fitted using a Poisson distribution, and models of functional richness, Faith’s phylogenetic diversity, ses functional richness, and ses Faith’s phylogenetic diversity employed a Gaussian distribution. Explanatory variables were standardized to mean = 0 and standard deviation = 1. We checked for potential multicollinearity between explanatory variables by means of Spearman correlation (r > 0.60) and we removed one variable of each strongly correlated pair of variables. Due to the presence of high significant correlations (|r| > 0.60, P < 0.05) of Tree richness, DVF50 and Habitat diversity50 with other variables, these three variables were not included in further analysis. Multicollinearity was also tested by calculating variance inflation factors (VIF). Once highly correlated variables were deleted, VIF values of all explanatory variables were under 2.4.
To assess the relationships between the response variables and the explanatory variables (Table 1), we fitted generalized linear models (GLM) and used multimodel inference to find the most parsimonious and likely model (Burnham and Anderson, 2002). This approach ranks and weights candidate statistical models that function as biological hypotheses (Grueber et al., 2011). For each diversity metric × season combination (for example, functional richness – wet breeding season) we fitted all possible submodels following an all-subset approach. The full set of submodels equals 2n, where n is the number of parameters.
Models were ranked based on Akaike information criterion modified for small sample size (AICc), where the model with the lowest AICc is considered the model with the best fit (Symonds and Moussalli, 2011). To quantify the relative performance of the models, we calculated the difference (Δi) between the best rated model and the rest. To quantify the relative support for each model, based on (Δi) we computed the Akaike weight (wi) which measures the weight of evidence that supports model i as being the best model, given the data and the set of candidate models (Burnham and Anderson, 2002). Akaike weight can be interpreted as the probability that model i is indeed the best model (Symonds and Moussalli, 2011).
Then, we performed model selection including those models with a (Δi) value ≤ 2. To account for model uncertainty, we implemented model averaging with the selected set, using the two existing methods to perform model averaging (Symonds and Moussalli, 2011). Natural averaging, averages the estimator βi just over the models where the predictor i appears. This method is recommended when there is strong support for a model (wi > 0.9). The other method, zero averaging, averages βi over the full set of models and is recommended when there is not strong support for any model (wi < 0.9). In those models where the predictor i is absent, a value = 0 is used in the calculation of the average. This makes βi shrink toward 0 for those predictors that appear in the less supported models (Burnham and Anderson, 2002; Grueber et al., 2011). All statistical analyses were performed in R version 3.5.2 (R Core Team, 2018). To obtain phylogenetic and functional diversity we employed functions found in the libraries “picante” (Kembel et al., 2010) and “FD” (Laliberté et al., 2014). The generation of candidate subset models, model ranking and model averaging were implemented with functions found in the library “MuMIn” (Bartón, 2020). GLM were fitted using core functions found in R.
A total of 91 species from 28 families were recorded across all sites and seasons with a mean (±standard error) of 10 (±0.6) species per site. The number of detected species decreased from winter (71 species) to the dry breeding season (63 species), and then to the wet breeding season (55 species). While thirty-seven species were recorded across seasons, some species were recorded in just one season (Supplementary Material). All the three diversity dimensions showed a similar trend across the year. On average, diversity values were higher for the winter season and decreased toward the early and the late breeding seasons (Table 2).
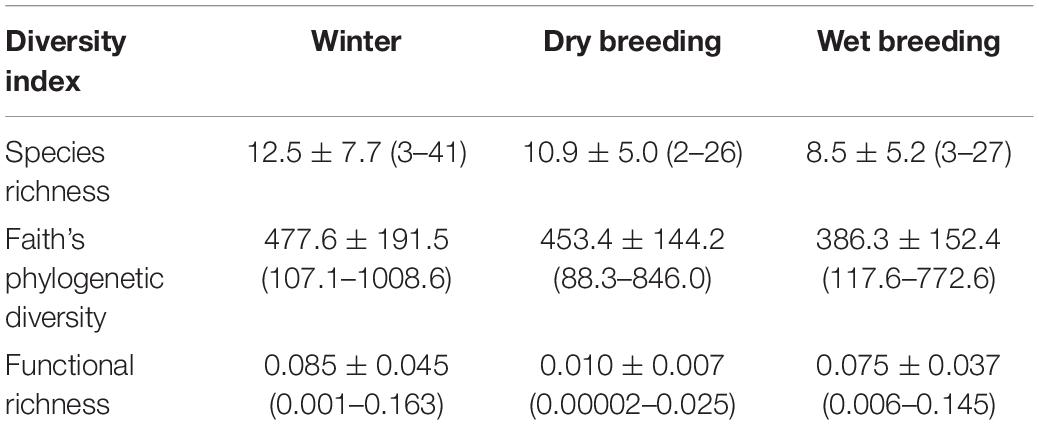
Table 2. Mean values ± standard deviation (minimum – maximum) of species richness, phylogenetic diversity, and functional richness of bird communities in green spaces in each of the studied seasons.
In general, phylogenetic and functional structure of bird communities in green spaces, assessed through standardized effect sizes, was neither clustered (ses ≤ −1.96) nor over-dispersed (ses ≥ 1.96) in any of the studied seasons (Figure 3). However, in four green spaces a non-random structure was observed. Noteworthy, functional and phylogenetic clustering were observed only in natural protected areas. In winter, a large natural protected area showed both phylogenetic and functional clustering. In the dry breeding season, phylogenetic clustering occurred in another large natural protected area while phylogenetic over-dispersion happened in a highly landscaped green space. In the wet breeding season, functional clustering was detected in a third natural protected area.
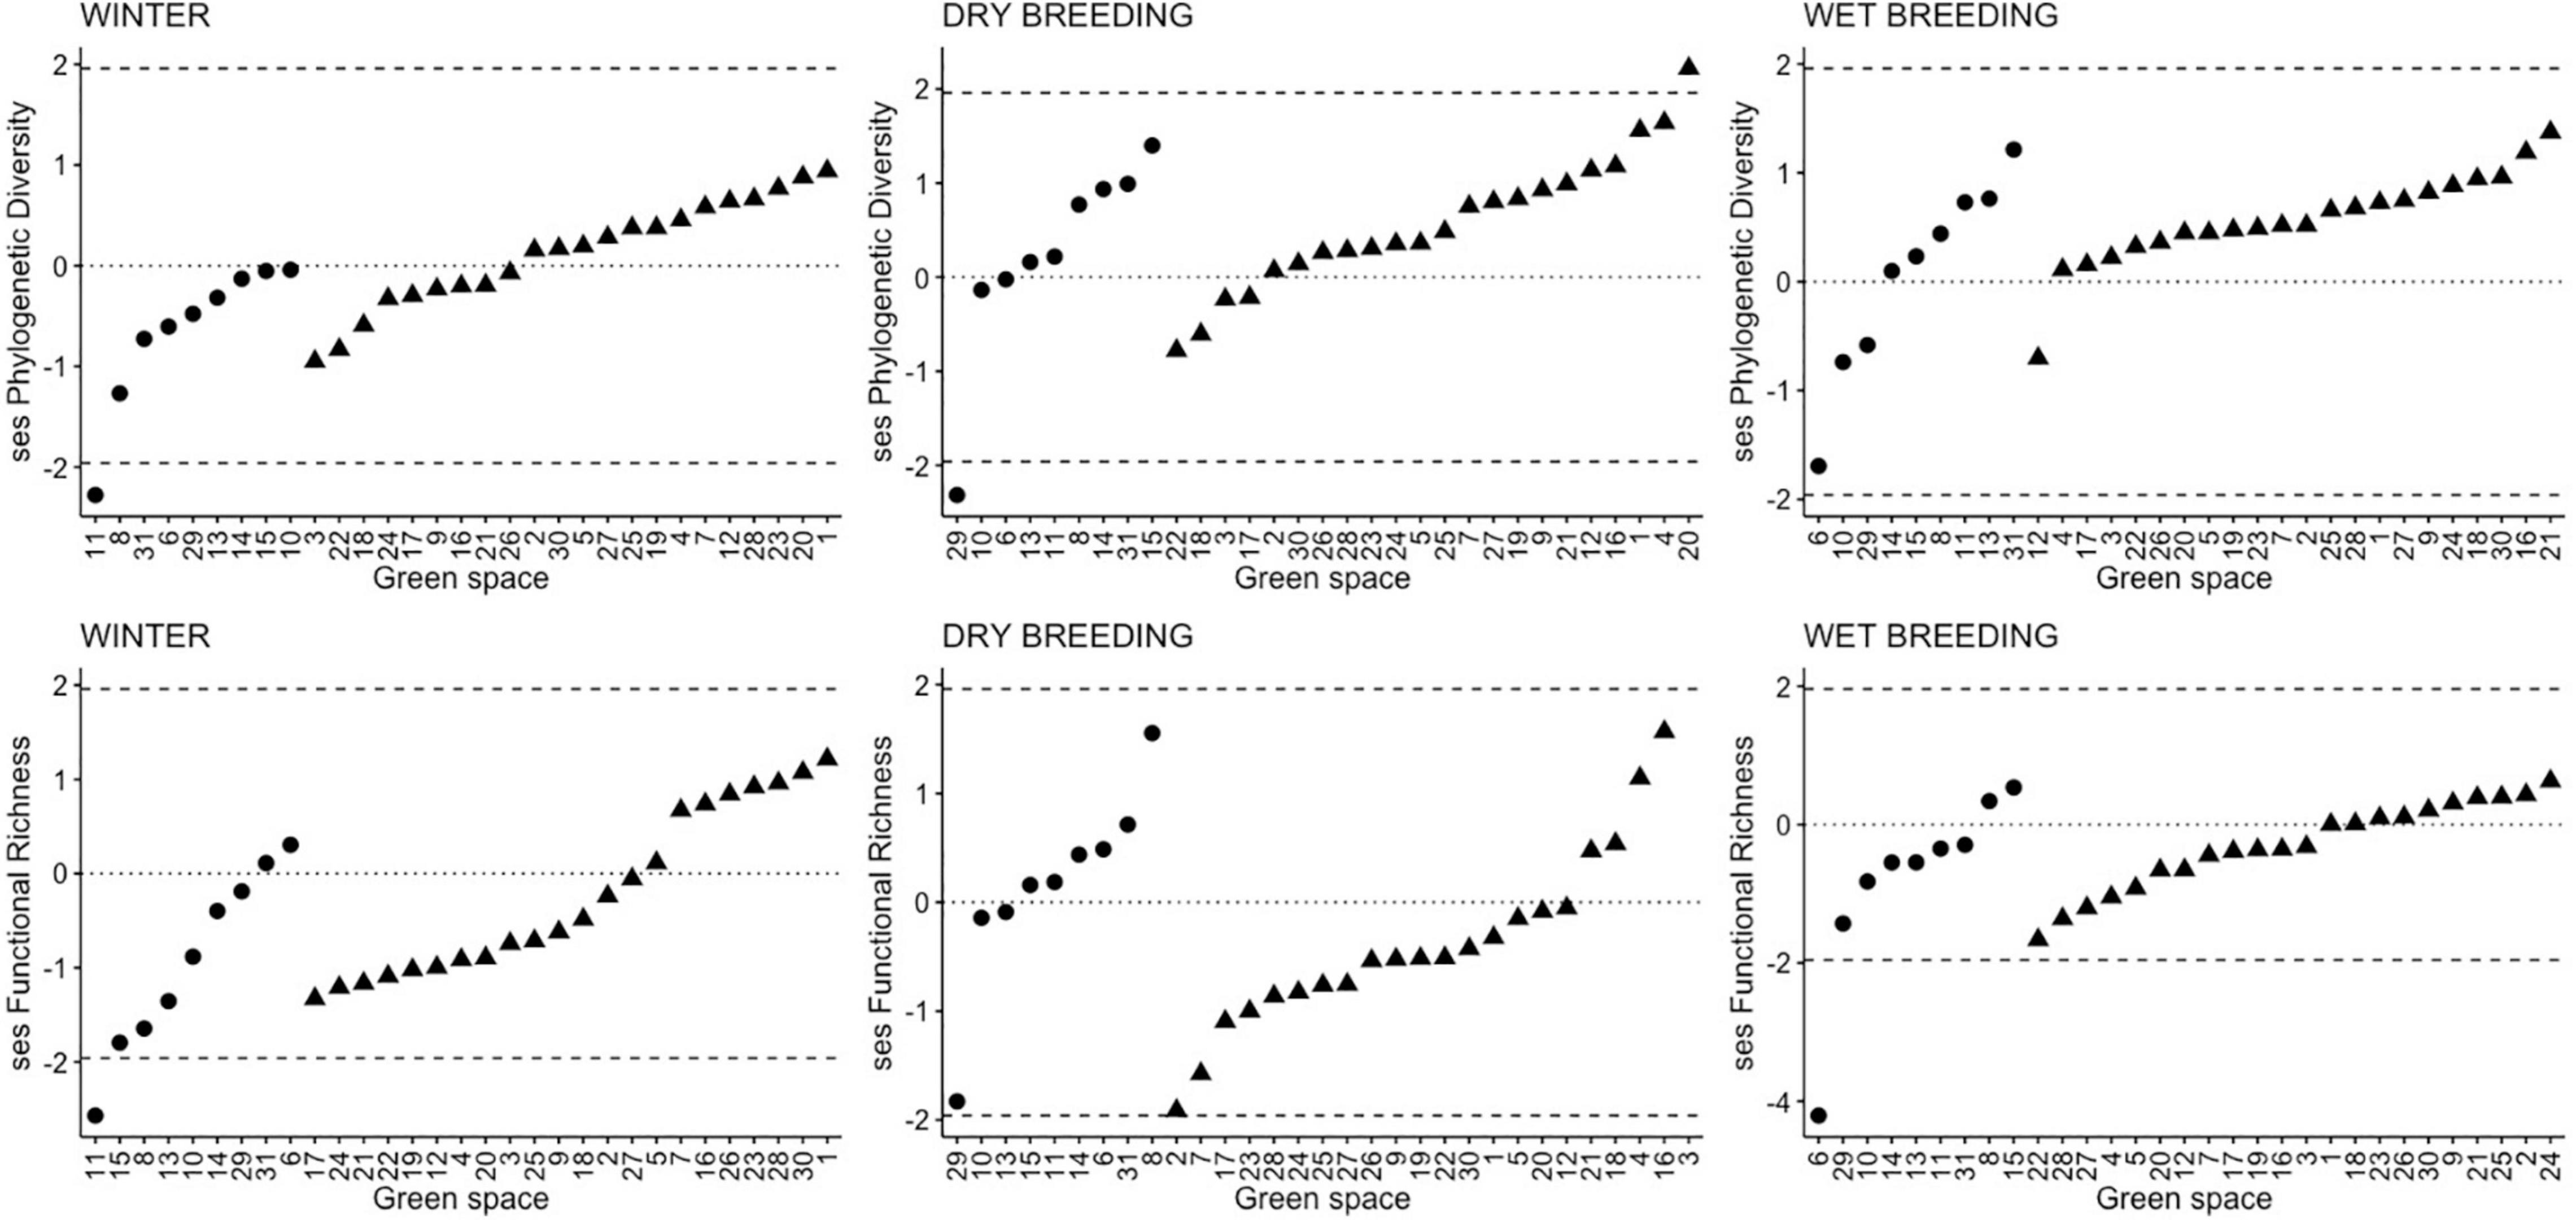
Figure 3. Standardized effect size (ses) values of phylogenetic diversity and functional richness for bird communities in green spaces during winter, dry breeding, and wet breeding seasons. Dashed lines represent the upper and lower limits for values to be considered random. Reference natural areas are represented as circles and urban green spaces as triangles. Green space numbers as in Figure 1.
Across the studied seasons, species richness was significantly correlated with both phylogenetic diversity and functional richness (Figure 4). Correlation strength of species richness with phylogenetic diversity was high while it was moderate between species richness and functional richness. In contrast, ses phylogenetic diversity and ses functional richness were not significantly correlated with species richness. In the case of the species richness-functional richness relationship, species rich communities showed a pattern of functional redundancy based on their relative low functional richness.
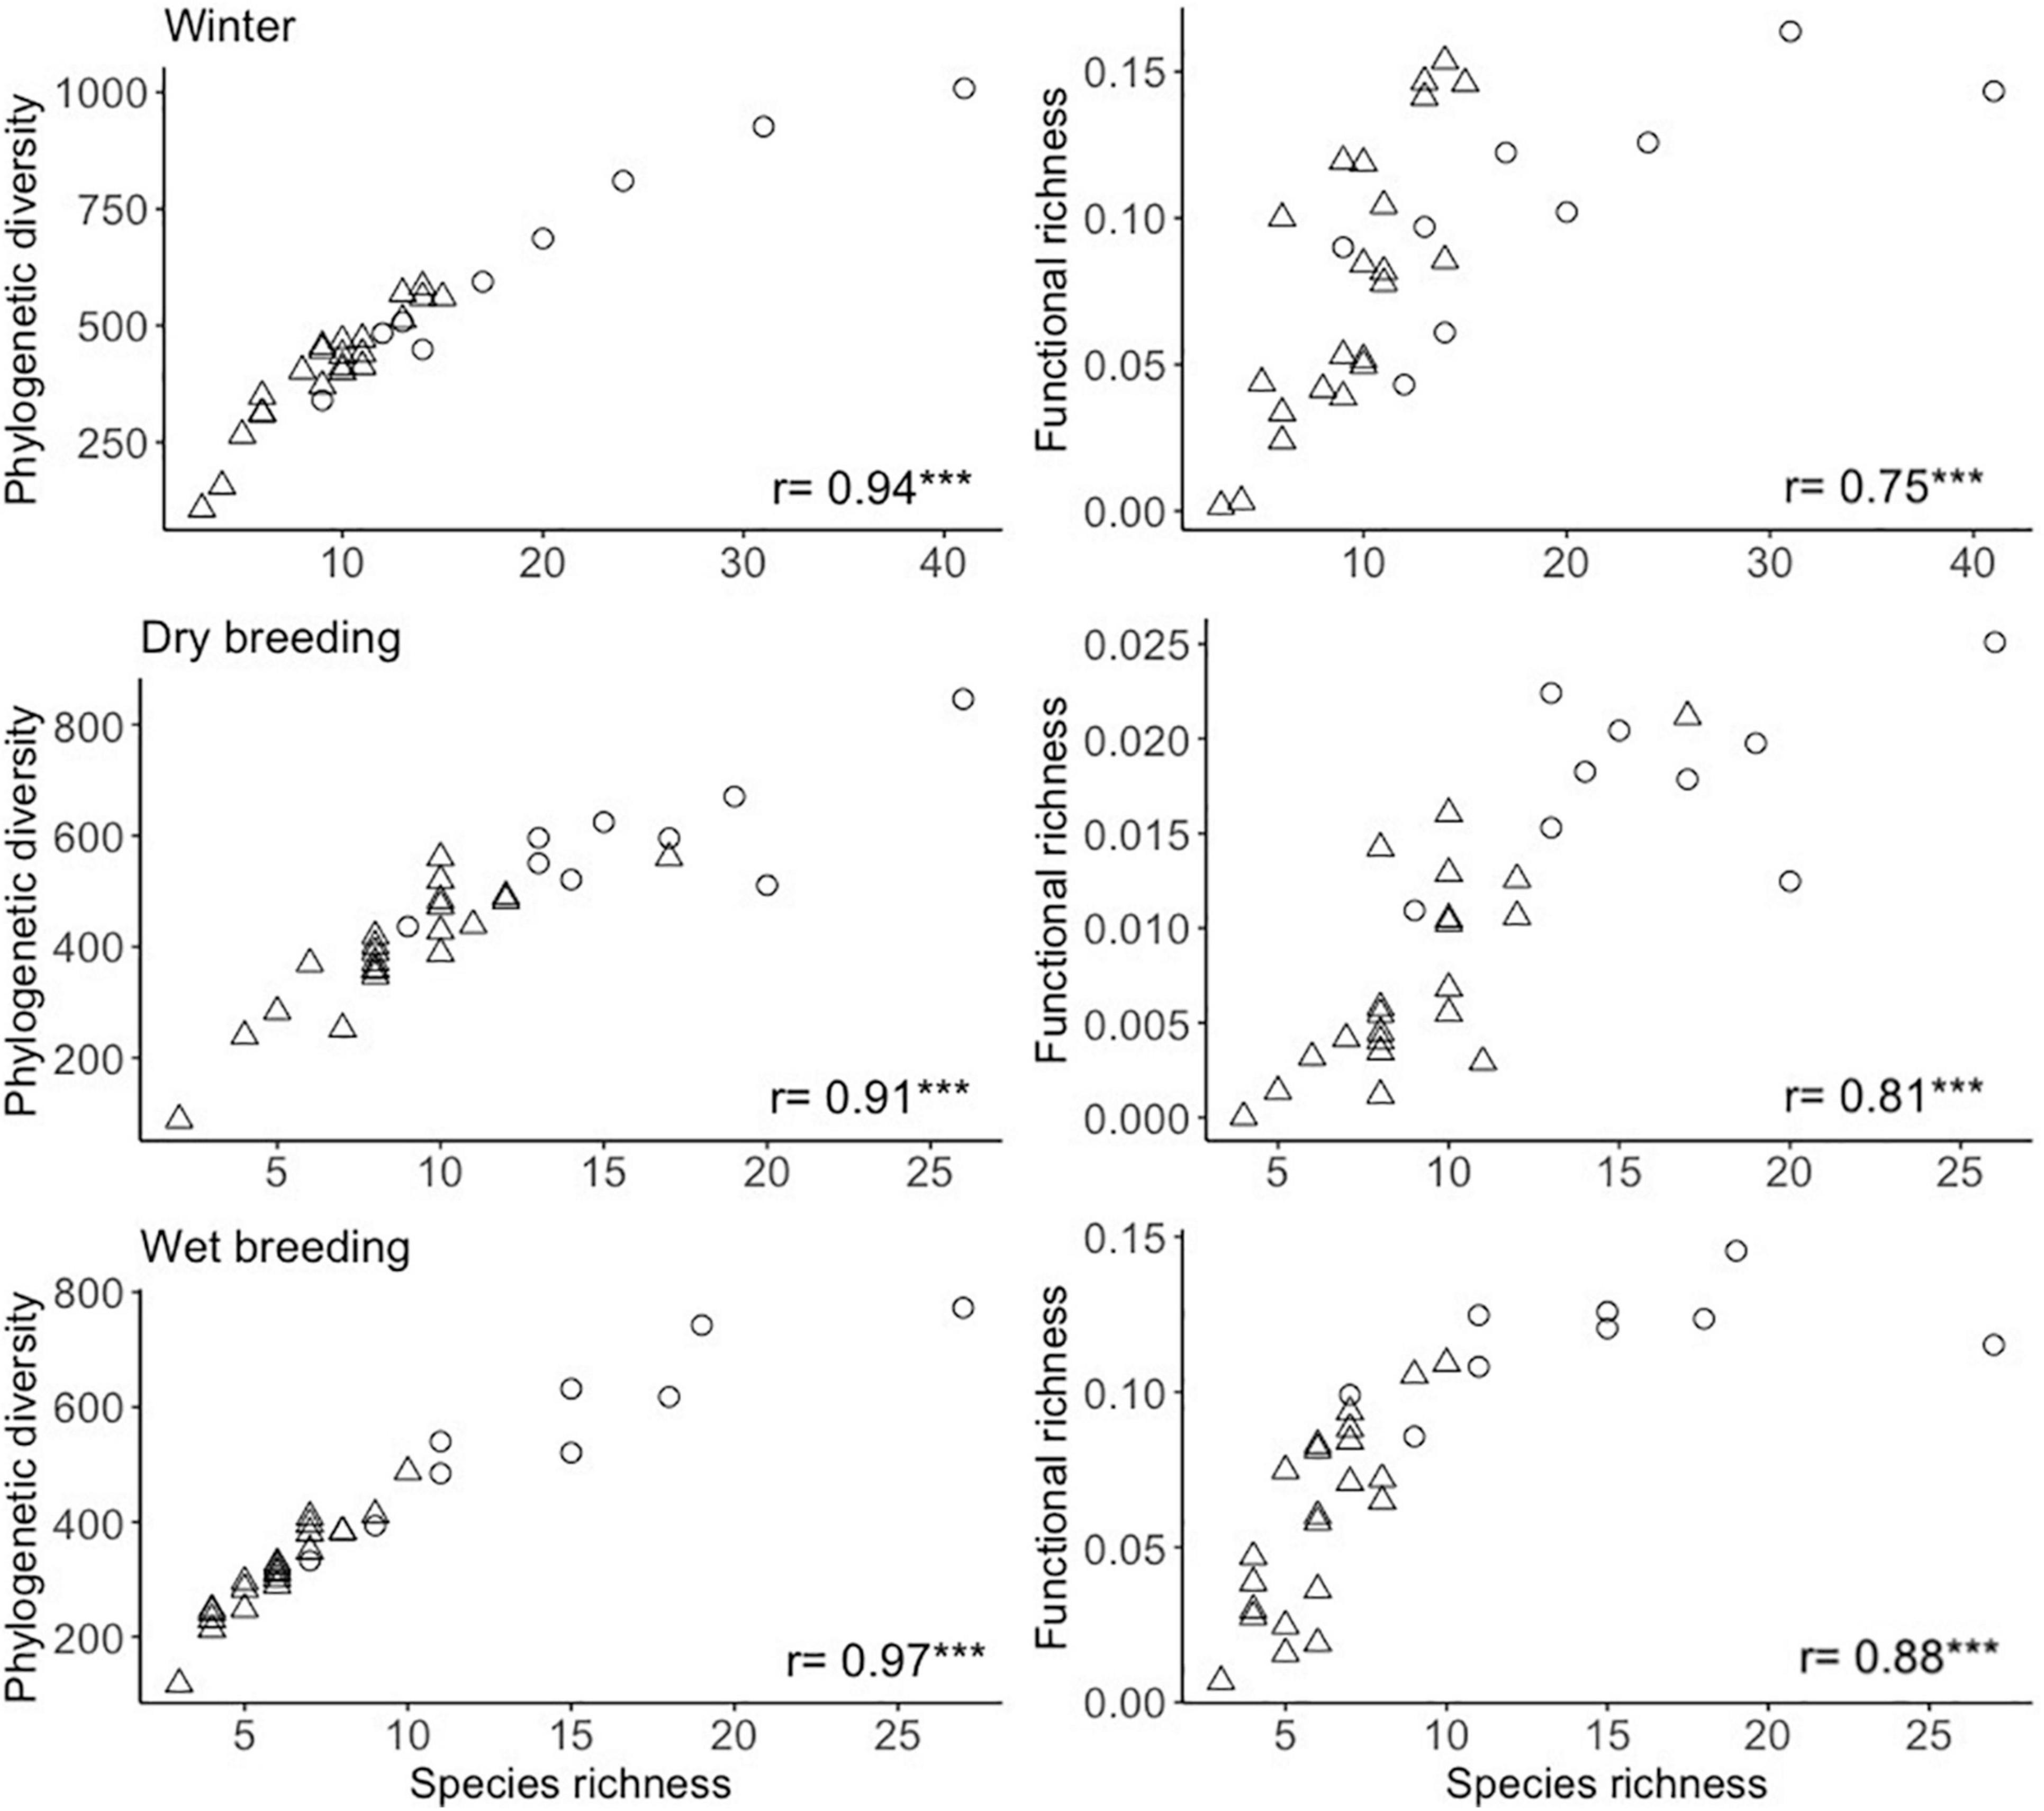
Figure 4. Relationship of species richness with phylogenetic diversity and functional richness for bird communities in green spaces during winter, dry breeding and wet breeding seasons. Strength of the relationship is expressed as Spearmans’s correlation coefficient r (***P < 0.001). Reference natural areas are represented as circles and urban green spaces as triangles.
Model ranking showed that Area was the predominant predictor to describe the relationships between green spaces’ characteristics and bird diversity, followed by Habitat diversity0 (Table 3). However, Akaike weights indicated model uncertainty to some degree, with the weight of top-ranked models ranging from 0.14 to 0.46 with a mean = 0.27. Since models did not have a strong support (wi > 0.9), zero-averaged coefficients are presented and discussed hereafter (Table 4).
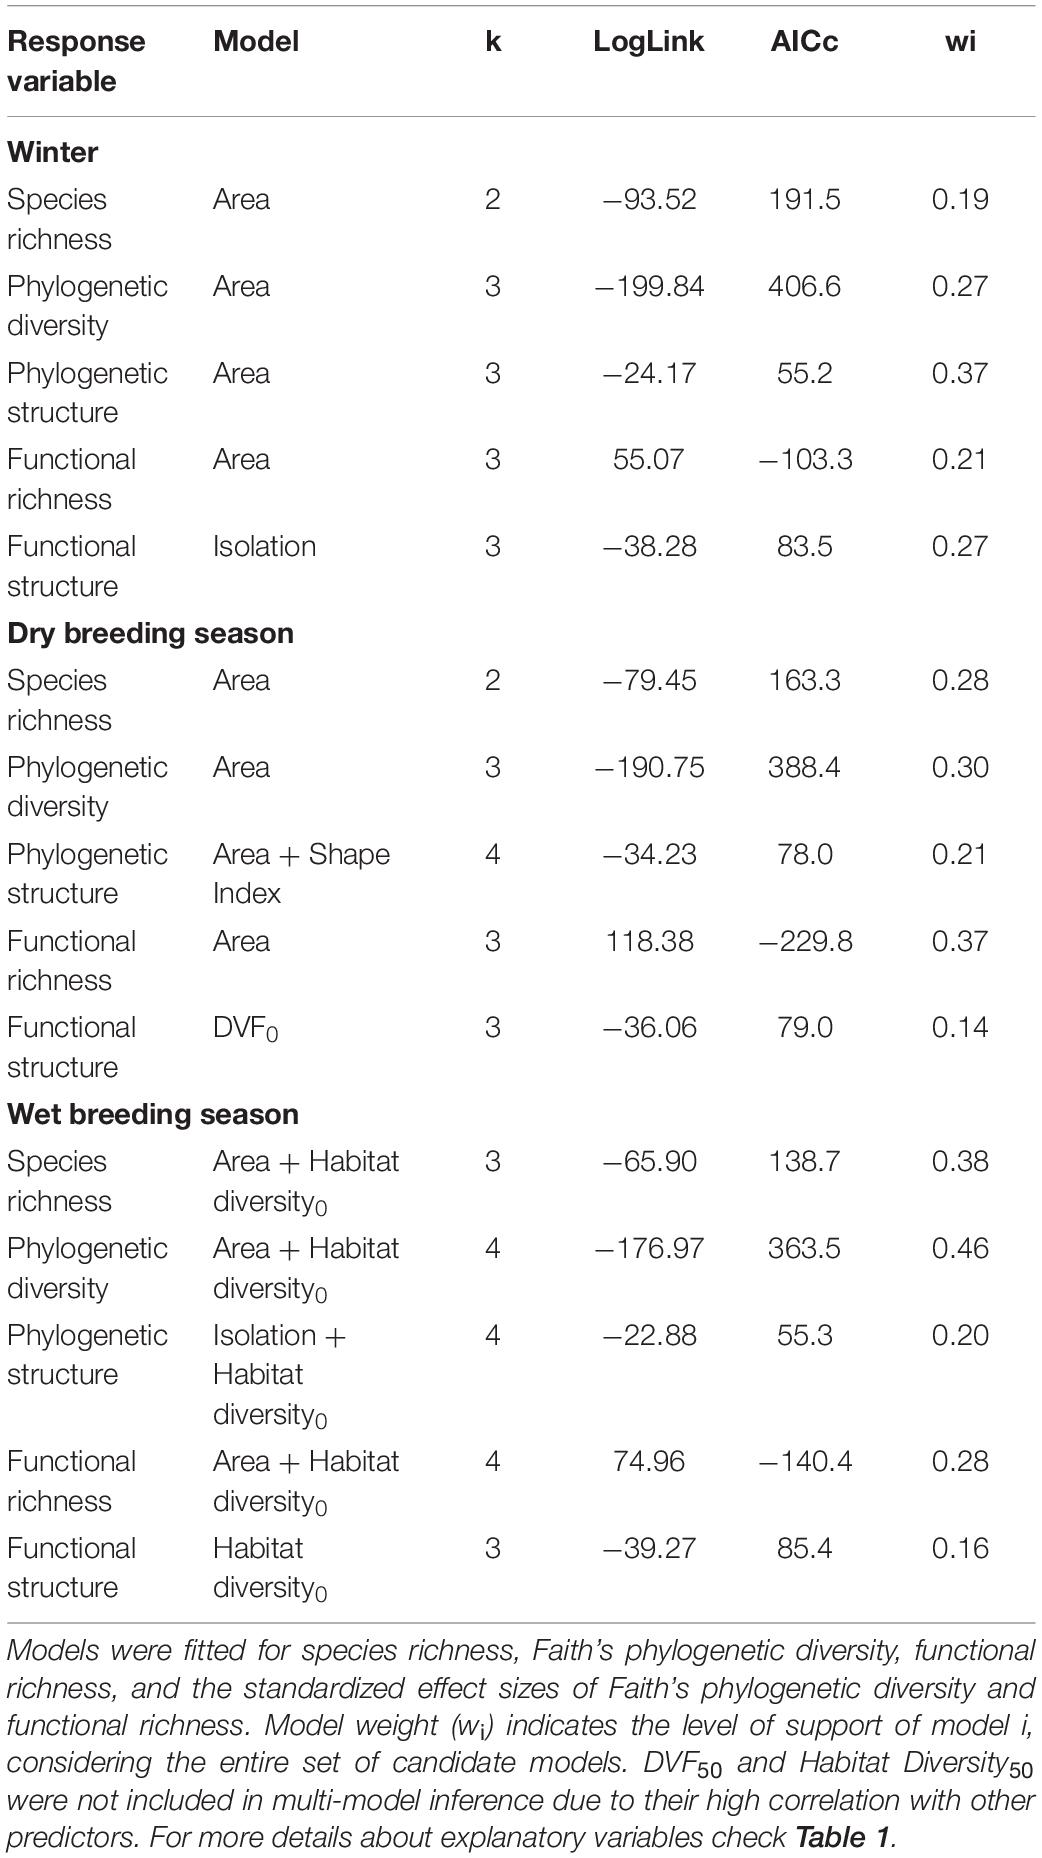
Table 3. Top-ranked models proposed to explain diversity of birds in green spaces during winter, dry breeding, and wet breeding seasons.
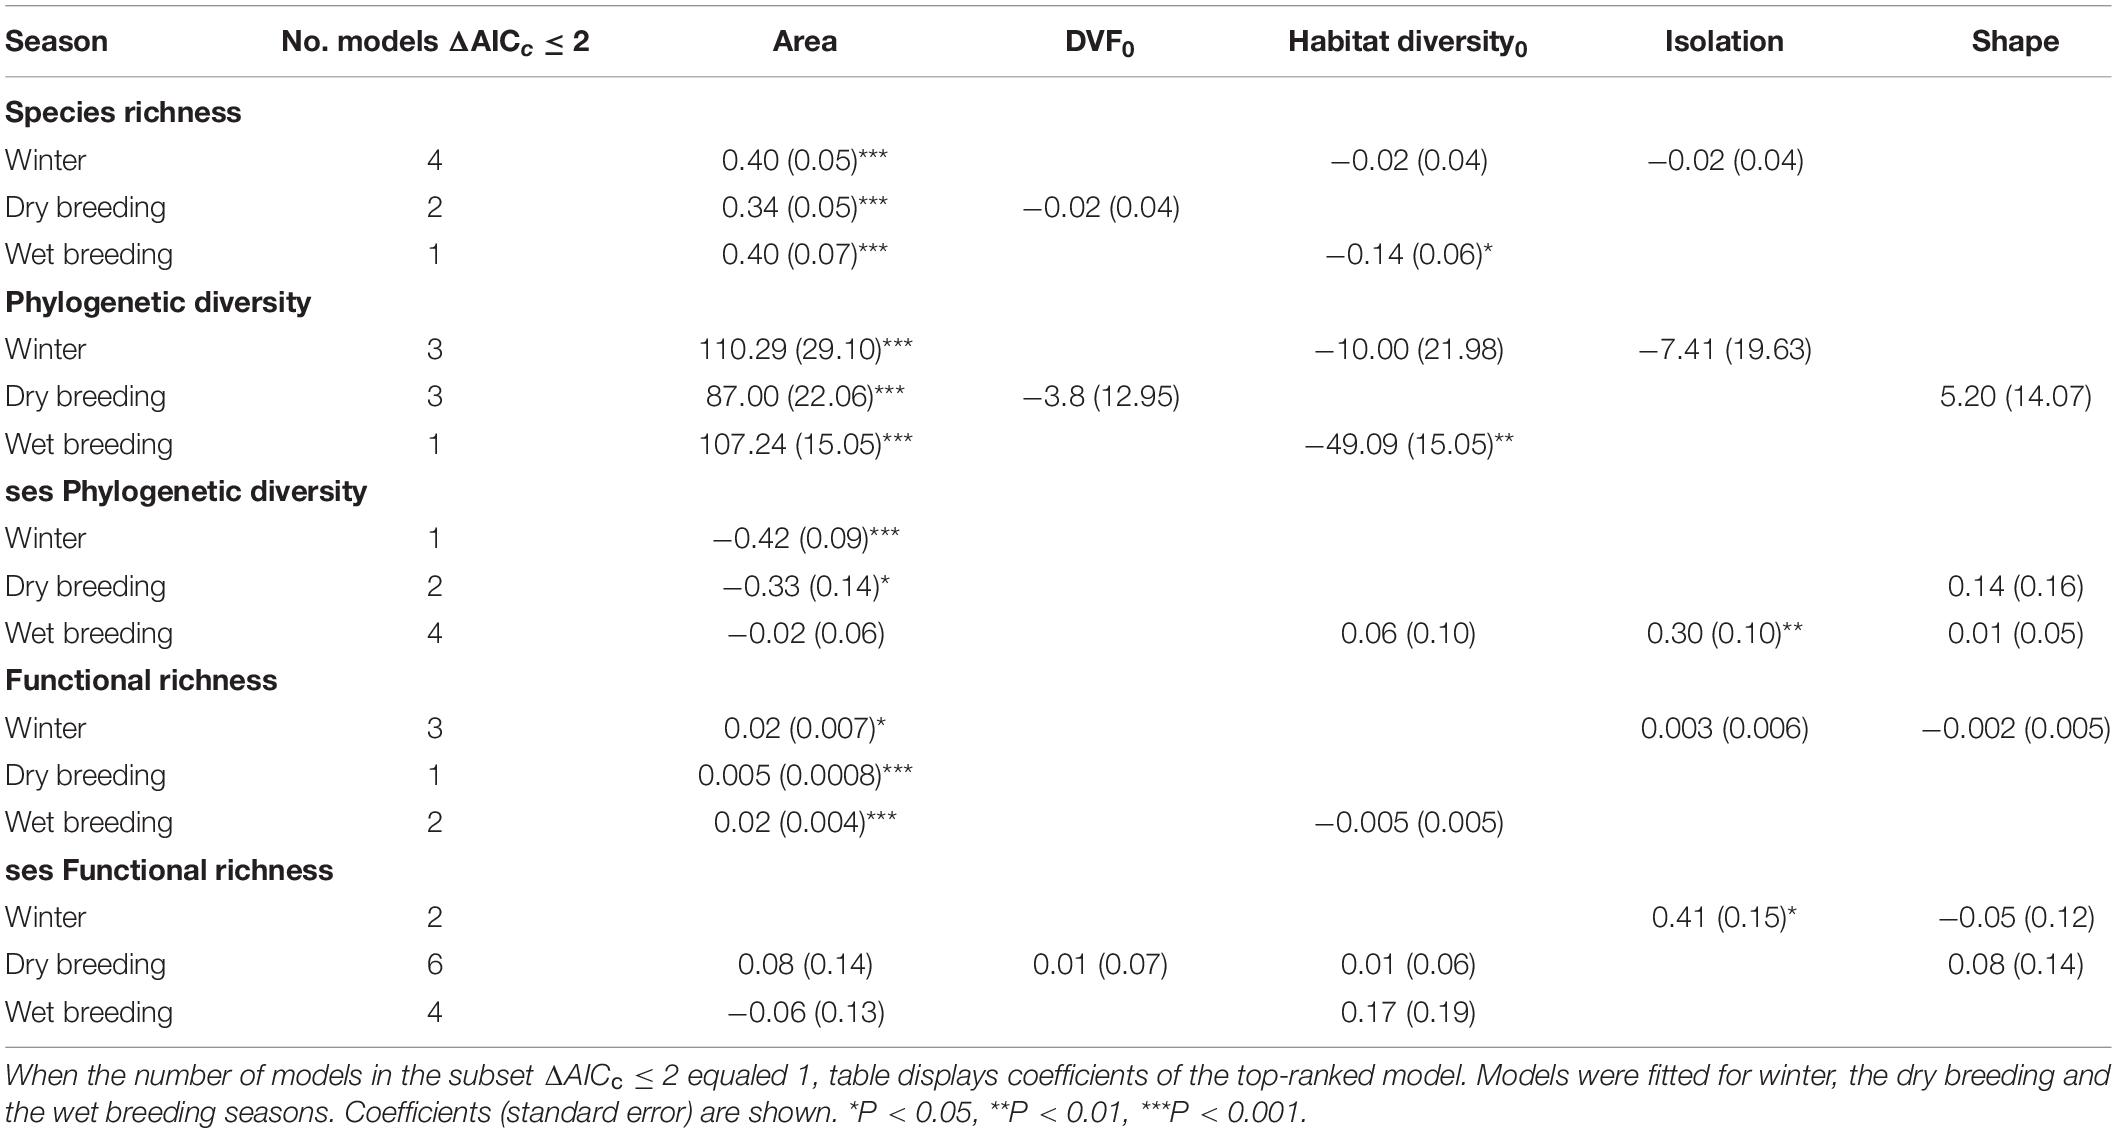
Table 4. Zero-averaged estimates for predictors of species richness, Faith’s phylogenetic diversity, functional richness, and the standardized effect sizes of Faith’s phylogenetic diversity and functional richness.
Model averaging revealed that community diversity metrics and community structure were associated with different green spaces’ characteristics. Model-averaged coefficients indicated that species richness, phylogenetic diversity, and functional richness increased with Area in all seasons, with a smaller effect in the dry breeding season (Figure 5). In contrast, Area showed a negative relationship with ses phylogenetic diversity during winter and the dry breeding season.
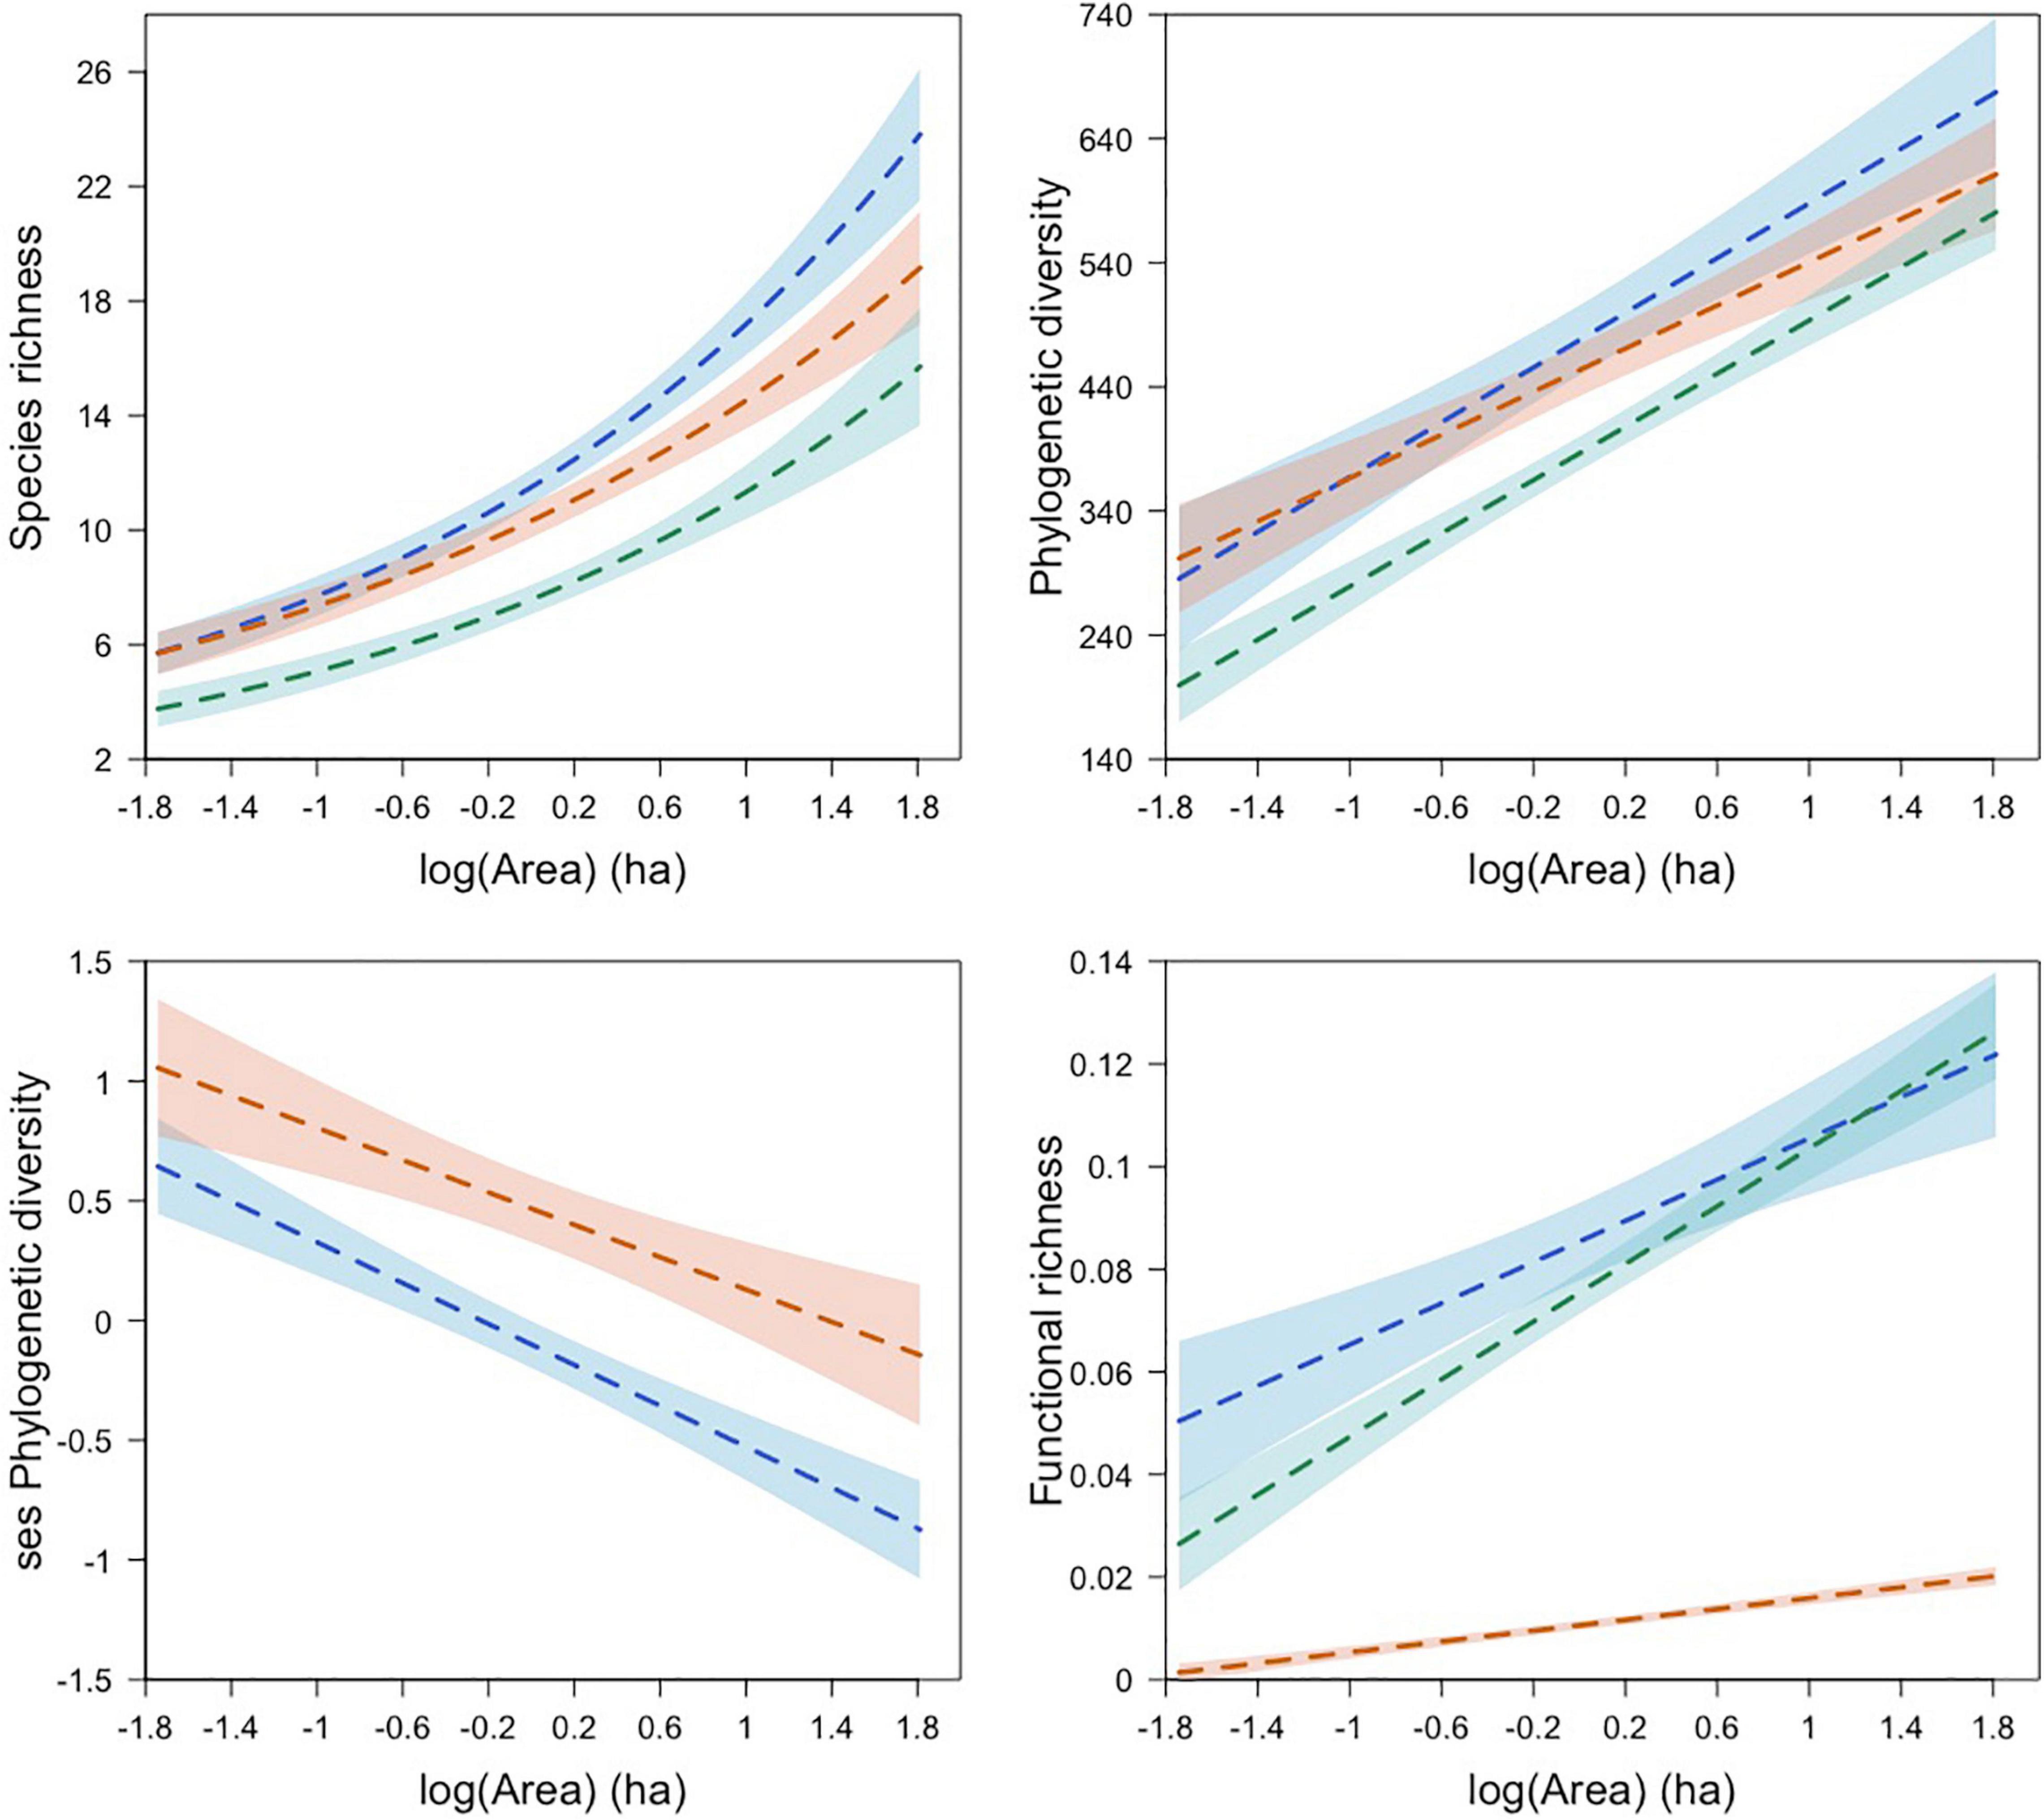
Figure 5. Relationship between green space area and bird diversity dimensions and phylogenetic structure for bird communities in green spaces during winter (blue line), dry breeding (orange line), and wet breeding (green line) seasons. Dashed lines represent predicted diversity values for each studied season based on averaged models or top-ranked models. Shaded areas represent confidence intervals. Figure prepared with script found in Graham et al. (2019).
Noteworthy, Habitat diversity0 showed a negative relationship with species richness and phylogenetic diversity, and this effect was observed only for the wet breeding season. Finally, the analyses revealed a strong positive effect of isolation on ses phylogenetic diversity and ses functional richness during the wet breeding season and winter, respectively.
Green spaces of Mexico City surveyed in this study harbored 34% of the land bird species reported in the state (Meléndez-Herrada et al., 2016) indicating that green spaces are important elements for diversity conservation in urban areas. Species richness, phylogenetic diversity, and functional richness differed among green spaces indicating that these sites possess different value for urban bird conservation. In accordance with hypothesis 1, bird diversity varied seasonally with the highest values of these indices observed during winter. Seasonal differences in urban bird assemblages can be explained by imperfect detection and seasonal use of alternative habitats (Murgui, 2010). In fact, detectability could have varied among seasons and habitats (Iknayan et al., 2014), but we used a 25-m point count to reduce detectability differences (Hutto et al., 1986). Though we assume these differences were not the main drivers of the detected seasonal variation, the results must be interpreted cautiously.
Both the presence of migratory species in urban green spaces during winter and the seasonal movements of birds are probably the main drivers of seasonal differences in bird diversity dimensions. A close inspection of species incidence across the seasons (Supplementary Material) reveals that during winter, additional species were present in surveyed green spaces and these species were functionally and phylogenetically distinctive. For example, American Krestel (Falco sparverius) and Plumbeous Vireo (Vireo plumbeus) were observed only during winter and they were, respectively, the only members belonging to order Falconiformes and family Vireonidae that were detected in this study. Hence, our study highlights the contribution of migratory species to bird diversity in urban settings and provides evidence about the importance of urban green spaces for migratory bird conservation (Dale, 2018).
Seasonal variation in diversity dimensions may also be produced by movement patterns of birds within Mexico City landscape throughout the year. These movements may arise from changes in local habitats, population parameters, or climatic conditions (Marone, 1992; Kawamura et al., 2019). In this regard, we registered variations of green spaces features related to habitat characteristics such as the densely-vegetated fraction and habitat diversity. Observed differences in these variables might relate with differences in the availability of food, cover, and nesting resources, and in this way, may affect bird distribution and diversity (Holmes et al., 1996).
Our results showed a moderate to strong relationship of species richness with phylogenetic diversity and functional richness. Overall, based on these correlations, our results indicated that increases in species richness translated into increases in phylogenetic diversity and functional richness. However, our results suggest that some of the studied communities may have been phylogenetically or functionally redundant since for a given species richness value, different phylogenetic or functional diversity values were observed and some of the species rich assemblages showed relatively low phylogenetic or functional diversity values. This finding was more apparent for functional richness. Further work should examine how phylogenetic or functional diversity respond to species losses or gains associated with habitat transformation within urban green spaces in order to get a more thorough insight of biodiversity conservation in these sites. For example, land use intensification associated with agriculture can lead to reductions of functional diversity more severe than would be expected based on species richness reductions (Flynn et al., 2009).
We highlight that the relationship of species richness with phylogenetic diversity and functional richness varied across the studied seasons and that it was stronger during the wet breeding season. We suggest that this could indicate a seasonal variation in the redundancy of species pools (sensu Aronson et al., 2016) from which communities in green spaces are assembled. In the study area, families such as Picidae (woodpeckers), Tyrannidae (flycatchers), Regulidae (kinglets), Turdidae (thrushes), Passerellidae (new world sparrows), Parulidae (new world warblers), and Cardinalidae (tanagers) are part of the resident breeding assemblages, which during winter contain additional species of these families, either wintering or transient. An alternative and complementary explanation would be that for relatively small numbers of species, the addition of “unique” clades or traits is more likely. A saturation effect has been reported for phylogenetic and functional diversity of bird assemblages in farmlands (García-Navas and Thuiller, 2020). These authors found that the standardized effect size of both phylogenetic diversity and functional richness tended to decrease when species richness reached a threshold (≈35 species). In this study, functional richness seemed to reach an asymptote above species richness ≈20. Regarding phylogenetic diversity, we did not find evidence of an asymptotic relationship with species richness.
Our results did not support our second hypothesis, which stated that studied bird assemblages would show phylogenetic or functional clustering as a result of urban environmental filtering. We found a predominantly random functional and phylogenetic structure of bird communities in green spaces of Mexico City. That is, there was no evidence to conclude that the environmental conditions of the most urbanized green spaces posed a filter to traits or clades. However, phylogenetic diversity and functional richness values lower than the expected ones were observed in three sites which resembled natural habitats and were located far from downtown and within natural forested areas of the city.
Based on this, we propose that species that prefer open habitats within cities might react to forests as local environmental filters, as has been suggested for forest-farmland and grassland-forest plantation systems (Jacoboski et al., 2019; García-Navas and Thuiller, 2020). Likewise, species that need large forest patches may be filtered out from small isolated green spaces. However, compensatory dynamics may be occurring (Supp and Ernest, 2014), by which losses of traits and lineages in small isolated green spaces are probably compensated by the introduction of exotic species, a mechanism not occurring in large and less landscaped green spaces. For example, in highly landscaped green spaces the exotic species House Sparrow (Passer domesticus) and Rock Pigeon (Columba livia), both favored by urbanization (Carbó-Ramírez and Zuria, 2011), were common and abundant. Moreover, in centrally located green spaces, species established in the city due to escapes from captivity such as Harris’s Hawk (Parabuteo unicinctus) (Ortega-Álvarez and Calderón-Parra, 2014) or Green Jay (Cyanocorax yncas) could also be detected (for previous records of Green Jay in Mexico City see Charre et al., 2013). Further research should be conducted to determine if natural forested areas in Mexico City filter birds as has been reported for forest-agriculture systems (Sreekar et al., 2021).
Area and habitat diversity within the green space were important habitat factors that influenced bird species richness, phylogenetic diversity, and functional richness of studied green spaces. Findings are consistent with previous reports about the positive effect of area on different dimensions of bird diversity (Morelli et al., 2018a) and supported partially our third hypothesis, a positive relationship of area with the three diversity dimensions measured. However, our results did not support the prediction of a positive effect of habitat diversity on any of the diversity dimensions. Moreover, our findings showed that, during the wet breeding season, species richness and phylogenetic diversity decreased as habitat diversity increased. This was an unexpected result considering that habitat heterogeneity can affect positively species richness (Loss et al., 2009). And given the positive correlation of species richness with phylogenetic and functional diversity (Mouchet et al., 2010), we expected a positive relation of phylogenetic and functional diversity with habitat diversity.
In this regard, habitat diversity could have negative effects if it develops as a consequence of habitat fragmentation (Tews et al., 2004). The absence of urban avoiders in the more heterogeneous green spaces, which in this study are also the smallest and the more landscaped ones, could explain the observed relationship between bird diversity and habitat heterogeneity. In Mexico City, small green spaces close to downtown are at the same time the more heterogeneous, and despite they attract urban exploiters such as House Sparrow and Great-tailed Grackle (Quiscalus mexicanus), this does not compensate the loss of sensitive species.
In accordance with existing evidence (La Sorte et al., 2020), green space shape did not have a significant effect on species richness, phylogenetic diversity nor functional richness. Similarly, our results did not support a significant effect of isolation on bird diversity. In this regard, additional work is needed to understand the role of isolation in determining bird diversity since existing evidence is still inconclusive (Charre et al., 2013; La Sorte et al., 2020). Of interest, was the large positive effect of isolation on ses phylogenetic diversity and ses functional richness, during the wet breeding season and winter, respectively. Two likely processes could explain this finding: more isolated green spaces were phylogenetically and functionally enriched to some degree due to the presence of exotic species while less isolated green spaces were phylogenetically and functionally impoverished due to clade and trait redundancy. This finding merits more research since isolation can influence other relevant community aspects such species composition (Peris and Montelongo, 2014; Leveau and Leveau, 2016). In addition, our study revealed a negative relationship of area with ses phylogenetic diversity during winter and the dry breeding season. This suggests that larger green spaces which have higher species richness, due to the species-area relationship, comprise phylogenetically close species and as green space area decreases, though some species are lost, the remaining species are phylogenetically distant.
Overall, our study provides little support for the hypothesis 1 with regard to the seasonal variation of the relationships between diversity and green spaces’ characteristics. Results herein reported showed that the strength of the studied relationships varied across seasons but their direction did not. This is noteworthy considering that others have found that predictors can have contrasting effects among seasons (La Sorte et al., 2020). We propose that temporal changes in the strength of the diversity-environment relationships can be the result of mechanisms simultaneously operating such as changes in anthropogenic food availability (Stofberg et al., 2019), the seasonal use of habitat (Marone et al., 1997), the species urban tolerance (Callaghan et al., 2021), and the anthropic related mortality (Bracey et al., 2016) among others.
This study provides evidence about the value of green spaces for bird conservation in cities. The use of complementary measures of diversity together with the comparison between observed and expected values allowed a better understanding of the response of bird communities to urban green spaces. Our findings show that, green space area is the main factor determining bird diversity. However, phylogenetic and functional structure did not respond to area but were affected by green space isolation. This information may be useful for future urban planning: in cases where it is not possible to enlarge green spaces, other characteristics such as their diversity of habitats or their interconnectedness to other green spaces or natural areas can be modified. Furthermore, future studies should consider both spatial and temporal variation of diversity patterns and of the influence of environmental factors.
The datasets presented in this article are not readily available because the raw data supporting the conclusions of this article will be made available by the authors under request. Requests to access the datasets should be directed to RN-D, cmVtaW5hdmFAeWFob28uY29tLm14.
RN-D: conception and design, data collection, data analysis and visualization, and manuscript writing. IZ and RP-L: supervision and writing – review and editing. All authors contributed to the article and approved the submitted version.
This work forms part of a doctoral research for which RN-D received a scholarship from Consejo Nacional de Ciencia y Tecnología (No. 421382). Fieldwork was supported by Red Temática: Biología, Manejo y Conservación de Fauna Nativa en Ambientes Antropizados.
The authors declare that the research was conducted in the absence of any commercial or financial relationships that could be construed as a potential conflict of interest.
All claims expressed in this article are solely those of the authors and do not necessarily represent those of their affiliated organizations, or those of the publisher, the editors and the reviewers. Any product that may be evaluated in this article, or claim that may be made by its manufacturer, is not guaranteed or endorsed by the publisher.
We thank Ubaldo Márquez, Manuel Palomo, and Jerónimo Ramírez for their company in remote green spaces. We are most grateful to Luis Hernández, Israel Carrillo, and Robert Jones for their comments and suggestions during the preparation of this manuscript.
The Supplementary Material for this article can be found online at: https://www.frontiersin.org/articles/10.3389/fevo.2021.795913/full#supplementary-material
Alexander, J., Smith, D. A. E., Smith, Y. C. E., and Downs, C. T. (2019). Drivers of fine-scale avian functional diversity with changing land use: an assessment of the effects of eco-estate housing development and management. Landsc. Ecol. 34, 537–549. doi: 10.1007/s10980-019-00786-y
Aronson, M. F. J., Nilon, C. H., Lepczyk, C. A., Parker, T. S., Warren, P. S., Cilliers, S. S., et al. (2016). Hierarchical filters determine community assembly of urban species pools. Ecology 97, 2952–2963. doi: 10.1002/ecy.1535
Beninde, J., Veith, M., and Hochkirch, A. (2015). Biodiversity in cities needs space: a meta-analysis of factors determining intra-urban biodiversity variation. Ecol. Lett. 18, 581–592. doi: 10.1111/ele.12427
Benitez, J., Pizarro, J. C., Blazina, A. P., and Lencinas, M. V. (2021). Response of bird communities to native forest urbanization in one of the southernmost city of the world. Urban For. Urban Green. 58:126887. doi: 10.1016/j.ufug.2020.126887
Bibby, C. J., Burgess, N. D., and Hill, D. A. (1993). Bird Census Techniques. San Diego, CA: Academic Press.
Bracey, A. M., Etterson, M. A., Niemi, G. J., and Green, R. F. (2016). Variation in bird-window colission mortality and scavenging rates within an urban landscape. Wilson J. Ornithol. 128, 355–367. doi: 10.1676/wils-128-02-355-367.1
Burnham, K., and Anderson, D. R. (2002). Model Selection and Multimodel Inference: A Practical Information-Theoretic Approach, 2nd Edn. New York, NY: Springer.
Callaghan, C. T., Cornwell, W. K., Poore, A. G. B., Benedetti, Y., and Morelli, F. (2021). Urban tolerance of birds changes throughout the full annual cycle. J. Biogeogr. 48, 1503–1517. doi: 10.1111/jbi.14093
Canedoli, C., Orioli, V., Padoa-Schioppa, E., Bani, L., and Dondina, O. (2017). Temporal variation of ecological factors affecting bird species richness in urban and peri-urban forests in a changing environment: a case study from Milan (Northern Italy). Forests 8:507. doi: 10.3390/f8120507
Carbó-Ramírez, P., and Zuria, I. (2011). The value of small urban greenspaces for birds in a Mexican city. Landsc. Urban Plann. 100, 213–222. doi: 10.1016/j.landurbplan.2010.12.008
Carvajal-Castro, J. D., Ospina-L, A. M., Toro-López, Y., Pulido-G, A., Cabrera-Casas, L. X., Guerrero-Peláez, S., et al. (2019). Birds vs bricks: patterns of species diversity in response to urbanization in a Neotropical Andean city. PLoS One 14:e0218775. doi: 10.1371/journal.pone.0218775
Castaño-Villa, G. J., Santisteban-Arenas, R., Hoyos-Jaramillo, A., Estévez-Varón, J. V., and Fontúrbel, F. E. (2019). Foraging behavioural traits of tropical insectivorous birds lead to dissimilar communities in contrasting forest habitats. Wildlife Biol. 2019:6.
Charre, G. M., Hurtado, J. A. Z., Neve, G., Ponce-Mendoza, A., and Corcuera, P. (2013). Relationship between habitat traits and bird diversity and composition in selected urban green areas of Mexico City. Ornitol. Neotropical 24, 279–297.
Chave, J. (2004). Neutral theory and community ecology. Ecol. Lett. 7, 241–253. doi: 10.1111/j.1461-0248.2003.00566.x
Cisneros, L. M., Fagan, M. E., and Willig, M. R. (2015). Effects of human-modified landscapes on taxonomic, functional and phylogenetic dimensions of bat biodiversity. Divers. Distrib. 21, 523–533. doi: 10.1111/ddi.12277
Corey, S. S., Christopher, E. M., Jason, D. R., and Burchell, M. R. (2012). Influence of patch size and shape on occupancy by shrubland birds. Condor 114, 268–278. doi: 10.1525/cond.2012.110107
Cornelis, J., and Hermy, M. (2004). Biodiversity relationships in urban and suburban parks in Flanders. Landsc. Urban Plann. 69, 385–401. doi: 10.1016/j.landurbplan.2003.10.038
Dale, S. (2018). Urban bird community composition influenced by size of urban green spaces, presence of native forest, and urbanization. Urban Ecosyst. 21, 1–14. doi: 10.1007/s11252-017-0706-x
Delaney, K. S., Riley, S. P. D., and Fisher, R. N. (2010). A rapid, strong, and convergent genetic response to urban habitat fragmentation in four divergent and widespread vertebrates. PLoS One 5:e0012767. doi: 10.1371/journal.pone.0012767
Devictor, V., Mouillot, D., Meynard, C., Jiguet, F., Thuiller, W., and Mouquet, N. (2010). Spatial mismatch and congruence between taxonomic, phylogenetic and functional diversity: the need for integrative conservation strategies in a changing world. Ecolo. Lett. 13, 1030–1040. doi: 10.1111/j.1461-0248.2010.01493.x
Di Pietro, S., Mantoni, C., and Fattorini, S. (2020). Influence of urbanization on the avian species-area relationship: insights from the breeding birds of Rome. Urban Ecosyst. 24, 779–788. doi: 10.1007/s11252-020-01081-4
Dirzo, R., Young, H. S., Galetti, M., Ceballos, G., Isaac, N. J. B., and Collen, B. (2014). Defaunation in the anthropocene. Science 345, 401–406. doi: 10.1126/science.1251817
Dunford, W., and Freemark, K. (2005). Matrix matters: effects of surrounding land uses on forest birds near Ottawa, Canada. Landsc. Ecol. 20, 497–511. doi: 10.1007/s10980-004-5650-5
Evans, B. S., Reitsma, R., Hurlbert, A. H., and Marra, P. P. (2018). Environmental filtering of avian communities along a rural-to-urban gradient in Greater Washington, DC, USA. Ecosphere 9:e02402. doi: 10.1002/ecs2.2402
Faith, D. P. (1992). Conservation evaluation and phylogenetic diversity. Biol. Conserv. 61, 1–10. doi: 10.1016/0006-3207(92)91201-3
Faith, D. P. (1994). Phylogenetic pattern and the quantification of organismal biodiversity. Philos. Trans. 345, 45–58.
Faith, D. P. (2002). Quantifying biodiversity: a phylogenetic perspective. Conserv. Biol. 16, 248–252. doi: 10.1046/j.1523-1739.2002.00503.x
Fernandez-Juricic, E. (2000). Bird community composition patterns in urban parks of Madrid: the role of age, size and isolation. Ecol. Res. 15, 373–383. doi: 10.1046/j.1440-1703.2000.00358.x
Filippi-Codaccioni, O., Clobert, J., and Julliard, R. (2009). Urbanisation effects on the functional diversity of avian agricultural communities. Acta Oecol. Int. J. Ecol. 35, 705–710. doi: 10.1016/j.actao.2009.07.003
Flynn, D. F. B., Gogol-Prokurat, M., Nogeire, T., Molinari, N., Richers, B. T., Lin, B. B., et al. (2009). Loss of functional diversity under land use intensification across multiple taxa. Ecol. Lett. 12, 22–33. doi: 10.1111/j.1461-0248.2008.01255.x
Frishkoff, L. O., Karp, D. S., M’Gonigle, L. K., Mendenhall, C. D., Zook, J., Kremen, C., et al. (2014). Loss of avian phylogenetic diversity in neotropical agricultural systems. Science 345, 1343–1346. doi: 10.1126/science.1254610
Fung, T., and Siu, W.-L. (2001). A study of green space and its changes in Hong Kong using NDVI. Geogr. Environ. Modell. 5, 111–122. doi: 10.1080/13615930120086032
García-Navas, V., and Thuiller, W. (2020). Farmland bird assemblages exhibit higher functional and phylogenetic diversity than forest assemblages in France. J. Biogeogr. 47, 2392–2404. doi: 10.1111/jbi.13950
Graham, S. I., Kinnaird, M. F., O’Brien, T. G., Vagen, T. G., Winowiecki, L. A., Young, T. P., et al. (2019). Effects of land-use change on community diversity and composition are highly variable among functional groups. Ecol. Applic. 29:e01973. doi: 10.1002/eap.1973
Grueber, C. E., Nakagawa, S., Laws, R. J., and Jamieson, I. G. (2011). Multimodel inference in ecology and evolution: challenges and solutions. J. Evol. Biol. 24, 699–711. doi: 10.1111/j.1420-9101.2010.02210.x
Hashim, H., Abd Latif, Z., and Adnan, N. A. (2019). Urban vegetation classification with NDVI threshold value method with very high resolution (VHR) Pleiades Imagery. Int. Arch. Photogramm. Remote Sens. Spatial Inf. Sci. 16, 237–240. doi: 10.5194/isprs-archives-XLII-4-W16-237-2019
Hernández-Cerda, M. E., Villicaña-Cruz, F. J., and Azpra-Romero, E. (2016). “Clima,” in La biodiversidad en la Ciudad de México, Volumen I, eds Comisión Nacional para el Conocimiento y Uso de la Biodiversidad (CONABIO) and Secretaría del Medio Ambiente (SEDEMA) (San Cristobal de las Casas: CONABIO/SEDEMA), 36–55.
Holmes, R. T., Marra, P. P., and Sherry, T. W. (1996). Habitat-specific demography of breeding Black-throated Blue Warblers (Dendroica caerulescens): implications for population dynamics. J. Anim. Ecol. 65, 183–195. doi: 10.2307/5721
Hooper, D. U., Chapin, F. S. III, Ewel, J. J., Hector, A., Inchausti, P., Lavorel, S., et al. (2005). Effects of biodiveristy on ecosystem functioning: a consensus of current knowledge. Ecol. Monogr. 75, 3–35. doi: 10.1890/04-0922
Huete, A. R., Jackson, R. D., and Post, D. F. (1985). Spectral response of a plant canopy with different soil backgrounds. Remote Sens. Environ. 17, 37–53.
Hutto, R. L., Pletschet, S. M., and Hendricks, P. (1986). A fixed-radius point count method for nonbreeding and breeding season use. Auk 103, 593–602. doi: 10.1093/auk/103.3.593
Ibáñez-Álamo, J. D., Morelli, F., Benedetti, Y., Rubio, E., Jokimäki, J., Pérez-Contreras, T., et al. (2020). Biodiversity within the city: effects of land sharing and land sparing urban development on avian diversity. Sci. Total Environ. 707:135477. doi: 10.1016/j.scitotenv.2019.135477
Iknayan, K. J., Tingley, M. W., Furnas, B. J., and Beissinger, S. R. (2014). Detecting diversity: emerging methods to estimate species diversity. Trends Ecol. Evol. 29, 97–106. doi: 10.1016/j.tree.2013.10.012
INEGI (Instituto Nacional de Estadística y Geografía) (2016). Conociendo México. Available online at: http://www.sideso.cdmx.gob.mx/documentos/2017/diagnostico/inegi/2016/Conociendo%20la%20Ciudad%20de%20Mexico%202016.pdf (accessed April 14, 2021).
INEGI (Instituto Nacional de Estadística y Geografía) (2017). Anuario Estadístico y Geográfico de la Ciudad de México 2017. Aguascalientes: INEGI.
INEGI (Instituto Nacional de Estadística y Geografía) (2021). Censo de Población y Vivienda 2020. Available online at: https://www.inegi.org.mx/programas/ccpv/2020/default.html#Resultados_generales (accessed April 14, 2021).
Jacoboski, L. I., Luza, A. L., Paulsen, R. K., Pezda, A. M., and Hartz, S. M. (2019). The effects of grassland ecosystem afforestation on avian phylogenetic diversity, taxonomic diversity and evolutionary distinctiveness. Acta Oecol. Int. J. Ecol. 99:103449. doi: 10.1016/j.actao.2019.103449
Jetz, W., Thomas, G. H., Joy, J. B., Hartmann, K., and Mooers, A. O. (2012). The global diversity of birds in space and time. Nature 491, 444–448. doi: 10.1038/nature11631
Kawamura, K., Yamaura, Y., Senzaki, M., Ueta, M., and Nakamura, F. (2019). Seasonality in spatial distribution: climate and land use have contrasting effects on the species richness of breeding and wintering birds. Ecol. Evol. 9, 7549–7561. doi: 10.1002/ece3.5286
Kembel, S. W., Cowan, P. D., Helmus, M. R., Cornwell, W. K., Morlon, H., Ackerly, D. D., et al. (2010). Picante: r tools for integrating phylogenies and ecology. Bioinformatics 26, 1463–1464.
La Sorte, F. A., Aronson, M. F. J., Lepczyk, C. A., and Horton, K. G. (2020). Area is the primary correlate of annual and seasonal patterns of avian species richness in urban green spaces. Landsc. Urban Plann. 203:103892. doi: 10.1016/j.landurbplan.2020.103892
La Sorte, F. A., Lepczyk, C. A., Aronson, M. F. J., Goddard, M. A., Hedblom, M., Katti, M., et al. (2018). The phylogenetic and functional diversity of regional breeding bird assemblages is reduced and constricted through urbanization. Divers. Distrib. 24, 928–938. doi: 10.1111/ddi.12738
Laliberté, E., Legendre, P., and Shipley, B. (2014). FD: Measuring Functional Diversity From Multiple Traits, and Other Tools for Functional Ecology. R package version 1.0-12.
Leveau, L. M. (2021). Consistency in bird community assembly over medium-term along rural-urban gradients in Argentina. Ecol. Process. 10:34. doi: 10.1186/s13717-021-00302-8
Leveau, L. M., and Leveau, C. M. (2016). Does urbanization affect the seasonal dynamics of bird communities in urban parks? Urban Ecosyst. 19, 631–647. doi: 10.1007/s11252-016-0525-5
Liu, J., Bai, H., Ma, H., and Feng, G. (2019). Bird diversity in Chinese urban parks was more associated with natural factors than anthropogenic factors. Urban For. Urban Green. 43:126358. doi: 10.1016/j.ufug.2019.06.001
Liu, Z., He, C., and Wu, J. (2016). The relationship between habitat loss and fragmentation during urbanization: an empirical evaluation from 16 world cities PLoS One. 11:e0154613. doi: 10.1371/journal.pone.0154613
Loss, S. R., Ruiz, M. O., and Brawn, J. D. (2009). Relationships between avian diversity, neighborhood age, income, and environmental characteristics of an urban landscape. Biol. Conserv. 142, 2578–2585. doi: 10.1016/j.biocon.2009.06.004
MacDonald, D. H., Crossman, N. D., Mahmoudi, P., Taylor, L. O., Summers, D. M., and Boxall, P. C. (2010). The value of public and private green spaces under water restrictions. Landsc. Urban Plann. 95, 192–200. doi: 10.1016/j.landurbplan.2010.01.003
MacGregor-Fors, I., Escobar, F., Rueda-Hernandez, R., Avendano-Reyes, S., Baena, M. L., Bandala, V. M., et al. (2016). City “green” contributions: the role of urban greenspaces as reservoirs for biodiversity. Forests 7:146. doi: 10.3390/f7070146
Magle, S. B., Hunt, V. M., Vernon, M., and Crooks, K. R. (2012). Urban wildlife research: past, present, and future. Biol. Conserv. 155, 23–32. doi: 10.1016/j.biocon.2012.06.018
Marone, L. (1992). Seasonal and year-to-year fluctuations of bird populations and guilds in the Monte Desert, Argentina. J. Field Ornithol. 63, 294–308.
Marone, L., Lopez, J., and Cueto, V. R. (1997). Patterns of habitat selection by wintering and breeding granivorous birds in the central Monte desert, Argentina. Rev. Chilena Historia Natural 70, 73–81.
Mason, N. W. H., and Mouillot, D. (2013). “Functional diversity measures,” in Encyclopedia of Biodiversity, 2nd Edn, ed. S. A. Levin (Waltham, MA: Academic Press), 597–608.
Matthies, S. A., Ruter, S., Schaarschmidt, F., and Prasse, R. (2017). Determinants of species richness within and across taxonomic groups in urban green spaces. Urban Ecosyst. 20, 897–909. doi: 10.1007/s11252-017-0642-9
Meffert, P. J., and Dziock, F. (2013). The influence of urbanisation on diversity and trait composition of birds. Landsc. Ecol. 28, 943–957. doi: 10.1007/s10980-013-9867-z
Meléndez-Herrada, A., Gómez, de Silva, H., and Ortega-Álvarez, R. (2016). “Aves,” in La biodiversidad en la Ciudad de México, Volumen II, eds Comisión Nacional para el Conocimiento y Uso de la Biodiversidad (CONABIO) and Secretaría del Medio Ambiente (SEDEMA) (San Cristobal de las Casas: CONABIO/SEDEMA), 404–413.
Morelli, F., Benedetti, Y., Ibanez-Alamo, J. D., Jokimaki, J., Mand, R., Tryjanowski, P., et al. (2016). Evidence of evolutionary homogenization of bird communities in urban environments across Europe. Glob. Ecol. Biogeogr. 25, 1284–1293. doi: 10.1111/geb.12486
Morelli, F., Benedetti, Y., Su, T., Zhou, B., Moravec, D., Šímová, P., et al. (2017). Taxonomic diversity, functional diversity and evolutionary uniqueness in bird communities of Beijing’s urban parks: effects of land use and vegetation structure. Urban For. Urban Green. 23, 84–92. doi: 10.1016/j.ufug.2017.03.009
Morelli, F., Mikula, P., Benedetti, Y., Bussiere, R., and Tryjanowski, P. (2018b). Cemeteries support avian diversity likewise urban parks in European cities: assessing taxonomic, evolutionary and functional diversity. Urban For. Urban Green. 36, 90–99. doi: 10.1016/j.ufug.2018.10.011
Morelli, F., Benedetti, Y., Perna, P., and Santolini, R. (2018a). Associations among taxonomic diversity, functional diversity and evolutionary distinctiveness vary among environments. Ecol. Indic. 88, 8–16. doi: 10.1016/j.ecolind.2018.01.022
Mouchet, M. A., Villéger, S., Mason, N. W. H., and Mouillot, D. (2010). Functional diversity measures: an overview of their redundancy and their ability to discriminate community assembly rules. Funct. Ecol. 24, 867–876. doi: 10.1111/j.1365-2435.2010.01695.x
Murgui, E. (2010). Seasonality and nestedness of bird communities in urban parks in Valencia, Spain. Ecography 33, 979–984. doi: 10.1111/j.1600-0587.2010.05816.x
Naeem, S., Prager, C., Weeks, B., Varga, A., Flynn, D. F. B., Griffin, K., et al. (2016). Biodiversity as a multidimensional construct: a review, framework and case study of herbivory’s impact on plant biodiversity. Proc. R. Soc. B Biol. Sci. 283:20153005. doi: 10.1098/rspb.2015.3005
Nagendra, H. (2002). Opposite trends in response for the Shannon and Simpson indices of landscape diversity. Appl. Geogr. 22, 175–186. doi: 10.1016/s0143-6228(02)00002-4
Newbold, T., Hudson, L. N., Hill, S. L. L., Contu, S., Lysenko, I., Senior, R. A., et al. (2015). Global effects of land use on local terrestrial biodiversity. Nature 520, 45–50. doi: 10.1038/nature14324
Nielsen, A. B., van den Bosch, M., Maruthaveeran, S., and van den Bosch, C. K. (2014). Species richness in urban parks and its drivers: a review of empirical evidence. Urban Ecosyst. 17, 305–327. doi: 10.1007/s11252-013-0316-1
Odindi, J., and Mhangara, P. (2012). Green spaces trends in the City of Port Elizabeth from 1990 to 2000 using remote sensing. Int. J. Environ. Res.s 6, 653–662.
Ortega-Álvarez, R., and Calderón-Parra, R. (2014). Hunting the unexpected: Harris’s Hawks (Parabuteo unicinctus) preying on bats in a Neotropical megacity. Rev. Brasil. Ornitol. 22, 297–299. doi: 10.1007/BF03544264
Peris, S., and Montelongo, T. (2014). Birds and small urban parks: a study in a high plateau city. Turkish J. Zool. 38, 316–325. doi: 10.3906/zoo-1305-20
R Core Team. (2018). R: A Language and Environment for Statistical Computing. Vienna: R Foundation for Statistical Computing.
Rubolini, D., Liker, A., Garamszegi, L. Z., Møller, A. P., and Saino, N. (2015). Using the BirdTree.org website to obtain robust phylogenies for avian comparative studies: a primer. Curr. Zool. 61, 959–965. doi: 10.1093/czoolo/61.6.959
Rush, S. A., Romito, T., and Robison, T. L. (2014). Avian diversity in a suburban park system: current conditions and strategies for dealing with anticipated change. Urban Ecosyst. 17, 45–60. doi: 10.1007/s11252-013-0310-7
Sainz-Borgo, C. (2016). Diet composition of birds associated to an urban forest patch in northern Venezuela. Interciencia 41, 119–126.
Schmidt, C., Domaratzki, M., Kinnunen, R. P., Bowman, J., and Garroway, C. J. (2020). Continent-wide effects of urbanization on bird and mammal genetic diversity. Proc. R. Soc. B Biol. Sci. 287:20192497. doi: 10.1098/rspb.2019.2497
Seto, K. C., Fragkias, M., Güneralp, B., and Reilly, M. K. (2011). A meta-analysis of global urban land expansion. PLoS One 6:e23777. doi: 10.1371/journal.pone.0023777
Sobrino, J. A., Jiménez-Muñoz, J. C., and Paolini, L. (2004). Land surface temperature retrieval from LANDSAT TM 5. Remote Sens. Environ. 90, 434–440. doi: 10.1016/j.rse.2004.02.003
Sol, D., Bartomeus, I., Gonzalez-Lagos, C., and Pavoine, S. (2017). Urbanisation and the loss of phylogenetic diversity in birds. Ecol. Lett. 20, 721–729. doi: 10.1111/ele.12769
Sol, D., González-Lagos, C., Moreira, D., Maspons, J., and Lapiedra, O. (2014). Urbanisation tolerance and the loss of avian diversity. Ecol. Lett. 17, 942–950. doi: 10.1111/ele.12297
Sreekar, R., Si, X., Sam, K., Liu, J., Dayananda, S., Goodale, U., et al. (2021). Land use and elevation interact to shape bird functional and phylogenetic diversity and structure: implications for designing optimal agriculture landscapes. J. Appl. Ecol. 58, 1738–1748. doi: 10.1111/1365-2664.13927
Stofberg, M., Cunningham, S. J., Sumasgutner, P., and Amar, A. (2019). Juggling a “junk-food” diet: responses of an urban bird to fluctuating anthropogenic-food availability. Urban Ecosyst. 22, 1019–1026. doi: 10.1007/s11252-019-00885-3
Supp, S. R., and Ernest, S. K. M. (2014). Species-level and community-level responses to disturbance: a cross-community analysis. Ecology 95, 1717–1723. doi: 10.1890/13-2250.1
Swenson, N. G. (2014). “Functional diversity,” in Functional and Phylogenetic Diversity in R, ed. N. G. Swenson (New York, NY: Springer), 143–186.
Symonds, M. R. E., and Moussalli, A. (2011). A brief guide to model selection, multimodel inference and model averaging in behavioural ecology using Akaike’s information criterion. Behav. Ecol. Sociobiol. 65, 13–21. doi: 10.1007/s00265-010-1037-6
Tews, J., Brose, U., Grimm, V., Tielbörger, K., Wichmann, M. C., Schwager, M., et al. (2004). Animal species diversity driven by habitat heterogeneity/diversity: the importance of keystone structures. J. Biogeogr. 31, 79–92. doi: 10.1046/j.0305-0270.2003.00994.x
Tobias, J. A., and Pigot, A. L. (2019). Integrating behaviour and ecology into global biodiversity conservation strategies. Philos. Trans. R. Soc. B Biol. Sci. 374:20190012. doi: 10.1098/rstb.2019.0012
Villéger, S., Mason, N. W. H., and Mouillot, D. (2008). New multidimensional functional diversity Indices for a multifaceted framework in functional ecology. Ecology 89, 2290–2301. doi: 10.1890/07-1206.1
Voskamp, A., Baker, D. J., Stephens, P. A., Valdes, P. J., and Willis, S. G. (2017). Global patterns in the divergence between phylogenetic diversity and species richness in terrestrial birds. J. Biogeogr. 44, 709–721. doi: 10.1111/jbi.12916
Weideman, E. A., Slingsby, J. A., Thomson, R. L., and Coetzee, B. T. W. (2020). Land cover change homogenizes functional and phylogenetic diversity within and among African savanna bird assemblages. Landsc. Ecol. 35, 145–157. doi: 10.1007/s10980-019-00939-z
Weiher, E. (2011). “A primer of trait and functional diversity,” in Biological Diversity, ed. A. E. Magurran (New York, NY: Oxford University Press), 175–193.
Wilman, H., Belmaker, J., Simpson, J., de la Rosa, C., Rivadeneira, M. M., and Jetz, W. (2014). EltonTraits 1.0: species-level foraging attributes of the world’s birds and mammals. Ecology 95:2027. doi: 10.1890/13-1917.1
Wong, M. M. F., Fung, J. C. H., and Yeung, P. P. S. (2019). High-resolution calculation of the urban vegetation fraction in the Pearl River Delta from the Sentinel-2 NDVI for urban climate model parameterization. Geosci. Lett. 6:2. doi: 10.1186/s40562-019-0132-4
Yang, G., Xu, J., Wang, Y., Wang, X. M., Pei, E. L., Yuan, X., et al. (2015). Evaluation of microhabitats for wild birds in a Shanghai urban area park. Urban For. Urban Green. 14, 246–254. doi: 10.1016/j.ufug.2015.02.005
Yang, X., Tan, X., Chen, C., and Wang, Y. (2020). The influence of urban park characteristics on bird diversity in Nanjing, China. Avian Res. 11:45. doi: 10.1186/s40657-020-00234-5
Young, H. S., McCauley, D. J., Galetti, M., and Dirzo, R. (2016). Patterns, causes, and consequences of Anthropocene defaunation. Annu. Rev. Ecol. Evol. Syst. 47, 333–358. doi: 10.1146/annurev-ecolsys-112414-054142
Keywords: urban ecology, green space, bird diversity, phylogenetic community structure, functional clustering, Mexico
Citation: Nava-Díaz R, Zuria I and Pineda-López R (2022) Taxonomic, Phylogenetic and Functional Diversity of Bird Assemblages in Urban Green Spaces: Null Model Analyses, Temporal Variation and Ecological Drivers. Front. Ecol. Evol. 9:795913. doi: 10.3389/fevo.2021.795913
Received: 15 October 2021; Accepted: 30 December 2021;
Published: 20 January 2022.
Edited by:
Álvaro Garitano-Zavala, Universidad Mayor de San Andrés, BoliviaReviewed by:
Lucas Leveau, Consejo Nacional de Investigaciones Científicas y Técnicas (CONICET), ArgentinaCopyright © 2022 Nava-Díaz, Zuria and Pineda-López. This is an open-access article distributed under the terms of the Creative Commons Attribution License (CC BY). The use, distribution or reproduction in other forums is permitted, provided the original author(s) and the copyright owner(s) are credited and that the original publication in this journal is cited, in accordance with accepted academic practice. No use, distribution or reproduction is permitted which does not comply with these terms.
*Correspondence: Remedios Nava-Díaz, cmVtaW5hdmFAeWFob28uY29tLm14; Iriana Zuria, aXp1cmlhQHVhZWguZWR1Lm14
Disclaimer: All claims expressed in this article are solely those of the authors and do not necessarily represent those of their affiliated organizations, or those of the publisher, the editors and the reviewers. Any product that may be evaluated in this article or claim that may be made by its manufacturer is not guaranteed or endorsed by the publisher.
Research integrity at Frontiers
Learn more about the work of our research integrity team to safeguard the quality of each article we publish.