- 1School of Geography, Planning and Spatial Sciences, University of Tasmania, Hobart, TAS, Australia
- 2Central Science Laboratory, University of Tasmania, Hobart, TAS, Australia
Globally, both managed and wild pollination services are unable to meet current rates of crop production and pollination demand. Wild pollination services could be improved through the reforestation of agricultural land margins, however plant–pollinator networks remain poorly understood and the collection of key floral traits a complex process. Herein, we consider the merits of pollen as a floral trait and the application of a rapid pollen comparison method in assessing whether pollen traits are conserved at a taxonomic level. Reporting the previously unstudied, pollen fingerprints of 18 Australian plant species, these are compared against the seed crop Daucus carota L. and two naturalised Brassica hybrids. Applying atmospheric solids analysis probe mass spectrometry (ASAP-MS) for rapid pollen fingerprinting, pollens are compared through non-metric multidimensional scaling (NMDS), Jaccard index correlation and hierarchical clustering. Demonstrating the merits of this analytical method for the grouping of potential revegetation flora, we identify key pollen similarities and differences that could correlate with wild pollinator preferences.
Introduction
Natural and agricultural systems share a crucial bond with insect pollination. Valued at US $170–215 billion (refer to: Kearns et al., 1998; Gallai et al., 2009; Vanbergen and the Insect Pollinators Initiative, 2013), agricultural pollination by insects accounts for 35% of global crop yield (Klein et al., 2007). Although the recent half-century has seen a global fourfold increase in biotically pollinated crops, this has come without a corresponding increase in our leading commercial pollinator Apis mellifera L. (European honeybee) (Klein et al., 2007; Aizen and Harder, 2009). Alarmingly, recent studies have reported international declines in both commercial A. mellifera populations and wild pollinators (Bailes et al., 2015; Goulson et al., 2015; Potts et al., 2016).
Recent research has considered whether revegetation and habitat linkages could halt declines in pollinators, support wild pollinator reserves, and close the gap toward agricultural pollination demands. However, the selection of revegetation species requires an understanding of complex plant–pollinator interactions and how floral traits shared between native and exotic species influence competition or deterrence. Furthermore, collecting data on floral and vegetation traits remains time and resource intensive (Bartual et al., 2019).
Floral colour, shape and scent are considered the key traits mediating insect attraction (Raguso, 2008a,b). Despite an extensive and growing global literature on floral morphology and floral scent respectively, floral reward as a pollinator selection trait remains understudied. Floral rewards can be in the form of pollen and/or nectar which provide vital nutrition to foraging insects (Jones, 2014). A recent study of pollen by Ruedenauer et al. (2019) identified that pollinators follow foraging patterns that are strongly associated with pollen quality and may therefore exert selection pressures on pollen composition. Whilst containing a wide diversity of molecules (Jones, 2014), insect-pollinated pollens have been found to contain a higher protein and carotenoid ratio than wind-pollinated pollens which contain greater carbohydrates (Ruedenauer et al., 2019; Kenđel and Zimmermann, 2020). Protein and lipid composition of pollen is also correlated with phylogeny (Ruedenauer et al., 2019), and high protein pollens may draw native pollinators to invasive plant species which provide a more nutritional reward (Russo et al., 2019).
Given that pollen composition can influence the range of visitors to floral species (Ruedenauer et al., 2019), it appears that pollen could act as a useful floral trait in the assessment of insect–pollinator networks. However, a clear understanding of phenomena associated with pollen is lacking (Jones, 2014), due in part because pollen identification and chemical composition analysis remain time-consuming and complicated (Xiao et al., 2016; Kenđel and Zimmermann, 2020). Various spectroscopy methods have been applied to pollen identification and phylogenetic investigation. Schulte et al. (2008) applied Raman spectroscopy to the in situ characterisation of 15 species and produced fingerprints demonstrating genus and family level similarities matching to known phylogeny. Conversely, Kenđel and Zimmermann (2020) applied Fourier-transform (FT) and Fourier-transform infrared spectroscopy (FTIR) to 219 species from 42 families, and observed large variability in pollen chemistry.
Presenting an alternative, rapid fingerprinting method, Xiao et al. (2016) applied atmospheric solids analysis probe mass spectrometry (ASAP-MS) to define characteristic flavonoid patterns between a set of plant and bee pollens. An advantage of ASAP-MS, in preference to vibrational methods such as infrared spectroscopy (IR) and Raman spectroscopy, is the need for minimal to no sample preparation (Xiao et al., 2016). Operating under ambient pressure conditions, the ASAP probe allows rapid, direct vaporisation and ionisation of solid and liquid samples (Waters, 2011; McEwen et al., 2005). Additionally, small sample loads can be directly placed into the ionisation chamber, high-mass molecules can be ionised, and due to the soft ionisation process, mass fingerprints can be obtained where each mass peak likely represents an individual compound (McEwen et al., 2005; Xiao et al., 2016).
Although additional analyses such as nuclear magnetic resonance (NMR) or IR are essential to fully characterise samples analysed by ASAP-MS (Waters, 2011), we consider whether total mass spectral patterns obtained for samples can be treated as fingerprints to group and contrast pollen without further interpretation of spectra. We investigate whether fast fingerprinting of pollens can be used to identify shared pollen traits between native flora and crop species that could ultimately guide agricultural revegetation by flagging potentially suitable or antagonistic plant species and pollinator overlaps. To this end, pollen spectral fingerprints are collated for 18 unstudied Australian native species and these results compared to the spectral fingerprints of three crop plants in our study region – commercial carrot Daucus carota L. and two, naturalised Brassica hybrids. We compare whether pollen fingerprints group at known phylogenetic family, genus, or species scales or exhibit unique differences. Lastly, our results are compiled in a baseline database that is available for mass spectral matching against the species we have recorded.
Materials and Methods
Study Region and Native Pollen Shortlist
In Australia, the biology and foraging habits of many native bees remains incomplete (Austin et al., 2004; Batley and Hogendoorn, 2009), and even less is known for other foraging insects. Whilst the amount of land cleared annually in Australia halved from 1990 to 2008, the ratio of native to non-native vegetation lost remains unknown (Australian Bureau of Statistics, 2010). The Tasmanian Midlands (Figure 1) is no exception, where historical land-clearing has resulted in an 83% loss of native habitat (Fensham and Kirkpatrick, 1989). Covering 7,746 km2 and accounting for 16% of Tasmania’s production, this region is a major source of carrot seed in addition to other biotically pollinated crops such as brassica and poppy seed (Department of Economic Development, Tourism and the Arts: DEDTA, 2012). Annually, 280–300 tonnes of carrot seed are harvested from 700 to 800 ha within the Midlands (DEDTA et al., 2014). Currently reliant on rental honeybee hives, this industry is unable to expand and meet pollination demands. Further compounding the issue, recent research by Gaffney et al. (2019) has demonstrated that rented bees will visit alternate sources of pollen in the Midlands in preference to carrot flowers. Synergising both the economic and ecological necessities for this region, the Midlands pollination shortage allows a unique chance to examine alternative methods of both repairing biodiversity values in tandem with meeting agricultural requirements.
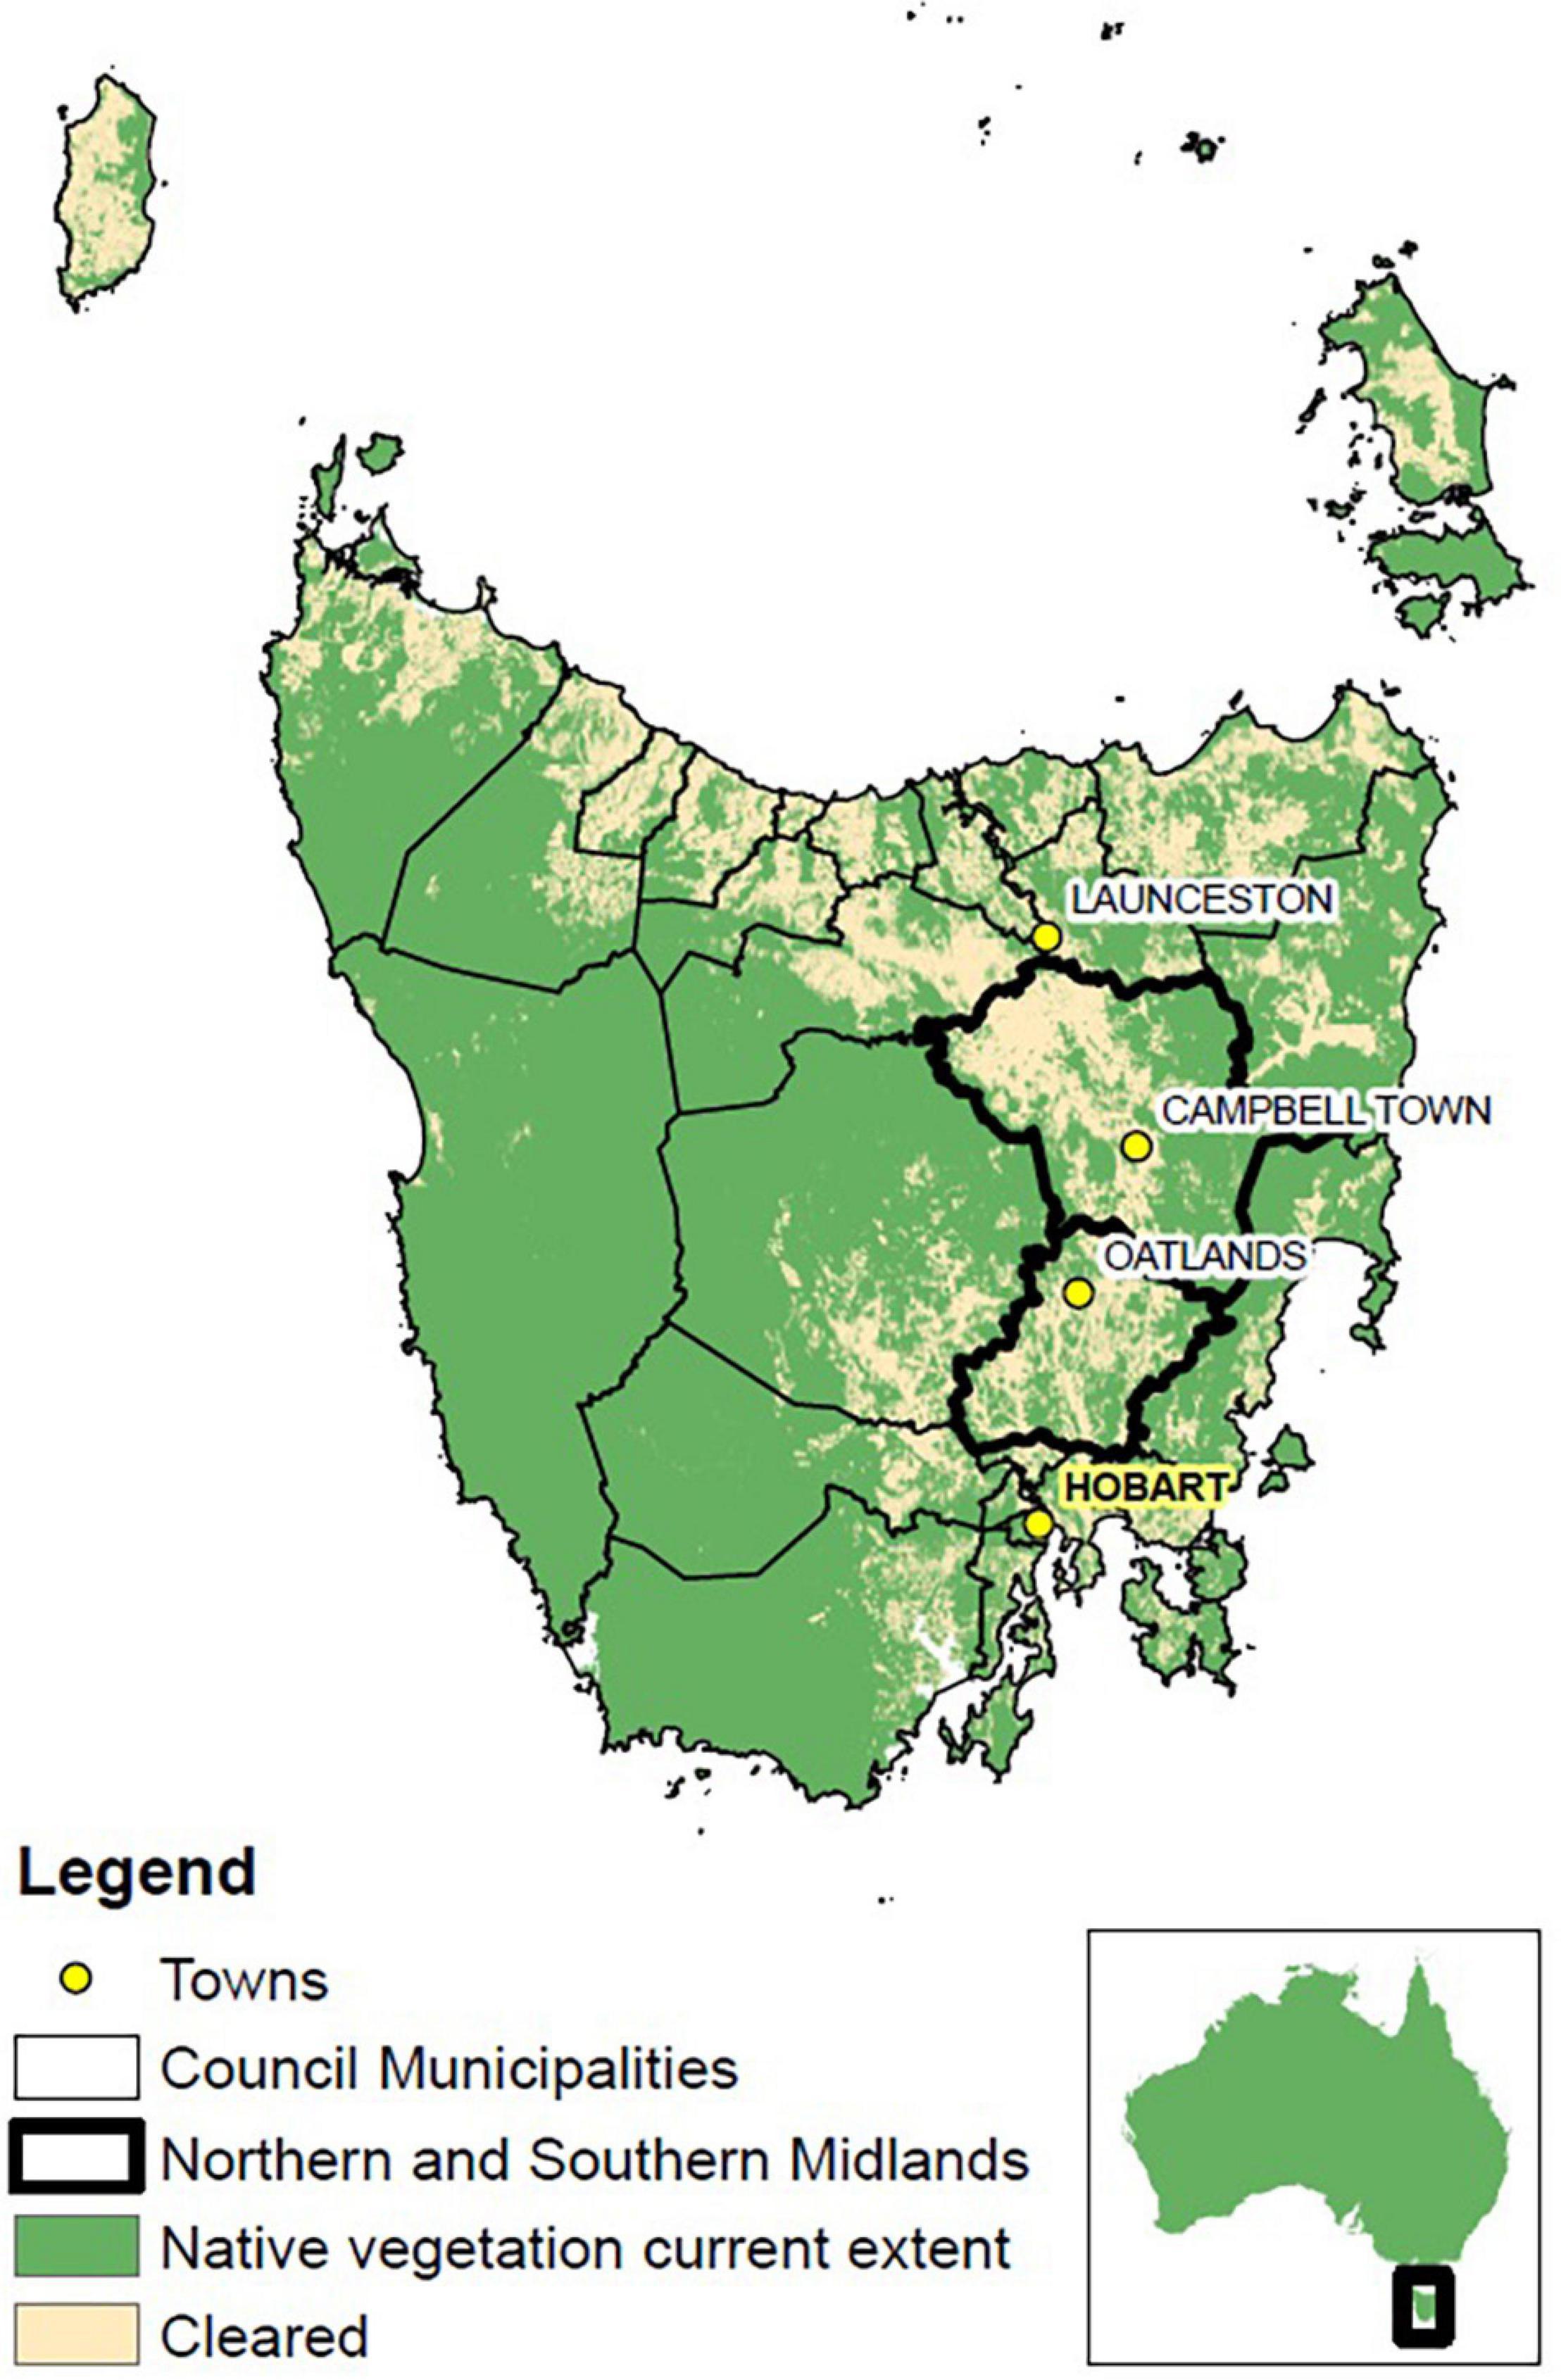
Figure 1. Map of Tasmania – state council municipality borders delimited in black, with study area highlighted in bold (Northern and Southern Midlands). Capital city of Hobart highlighted and bolded, key towns across the state provided for geographical reference. [Map data sources: National Vegetation Information System (NVIS) – Department of Agriculture and Water and the Environment, 2018; DPIPWE, 2012].
Eighteen flora species extant to the Tasmanian Midlands were shortlisted for pollen analysis. Species were chosen across four prominent plant families in the study region: Fabaceae, Myrtaceae, Pittosporaceae, and Proteaceae (Fensham and Kirkpatrick, 1989; Department of Primary Industries Parks and Water and Environment, n.d.). Selection of species was guided by “A Field Guide to Native Flora Used by Honeybees in Tasmania” (Leech and Rural Industries Research and Development Corporation, 2009). Honeybee attraction was selected as an indicator of potential native pollinator foraging preferences, in the absence of existing native pollinator data. Geographical distributions were verified through ground-truthing and the final list fine-tuned on the basis of travel time constraints. Plant family, assigned species ID and full names are presented in Table 1.
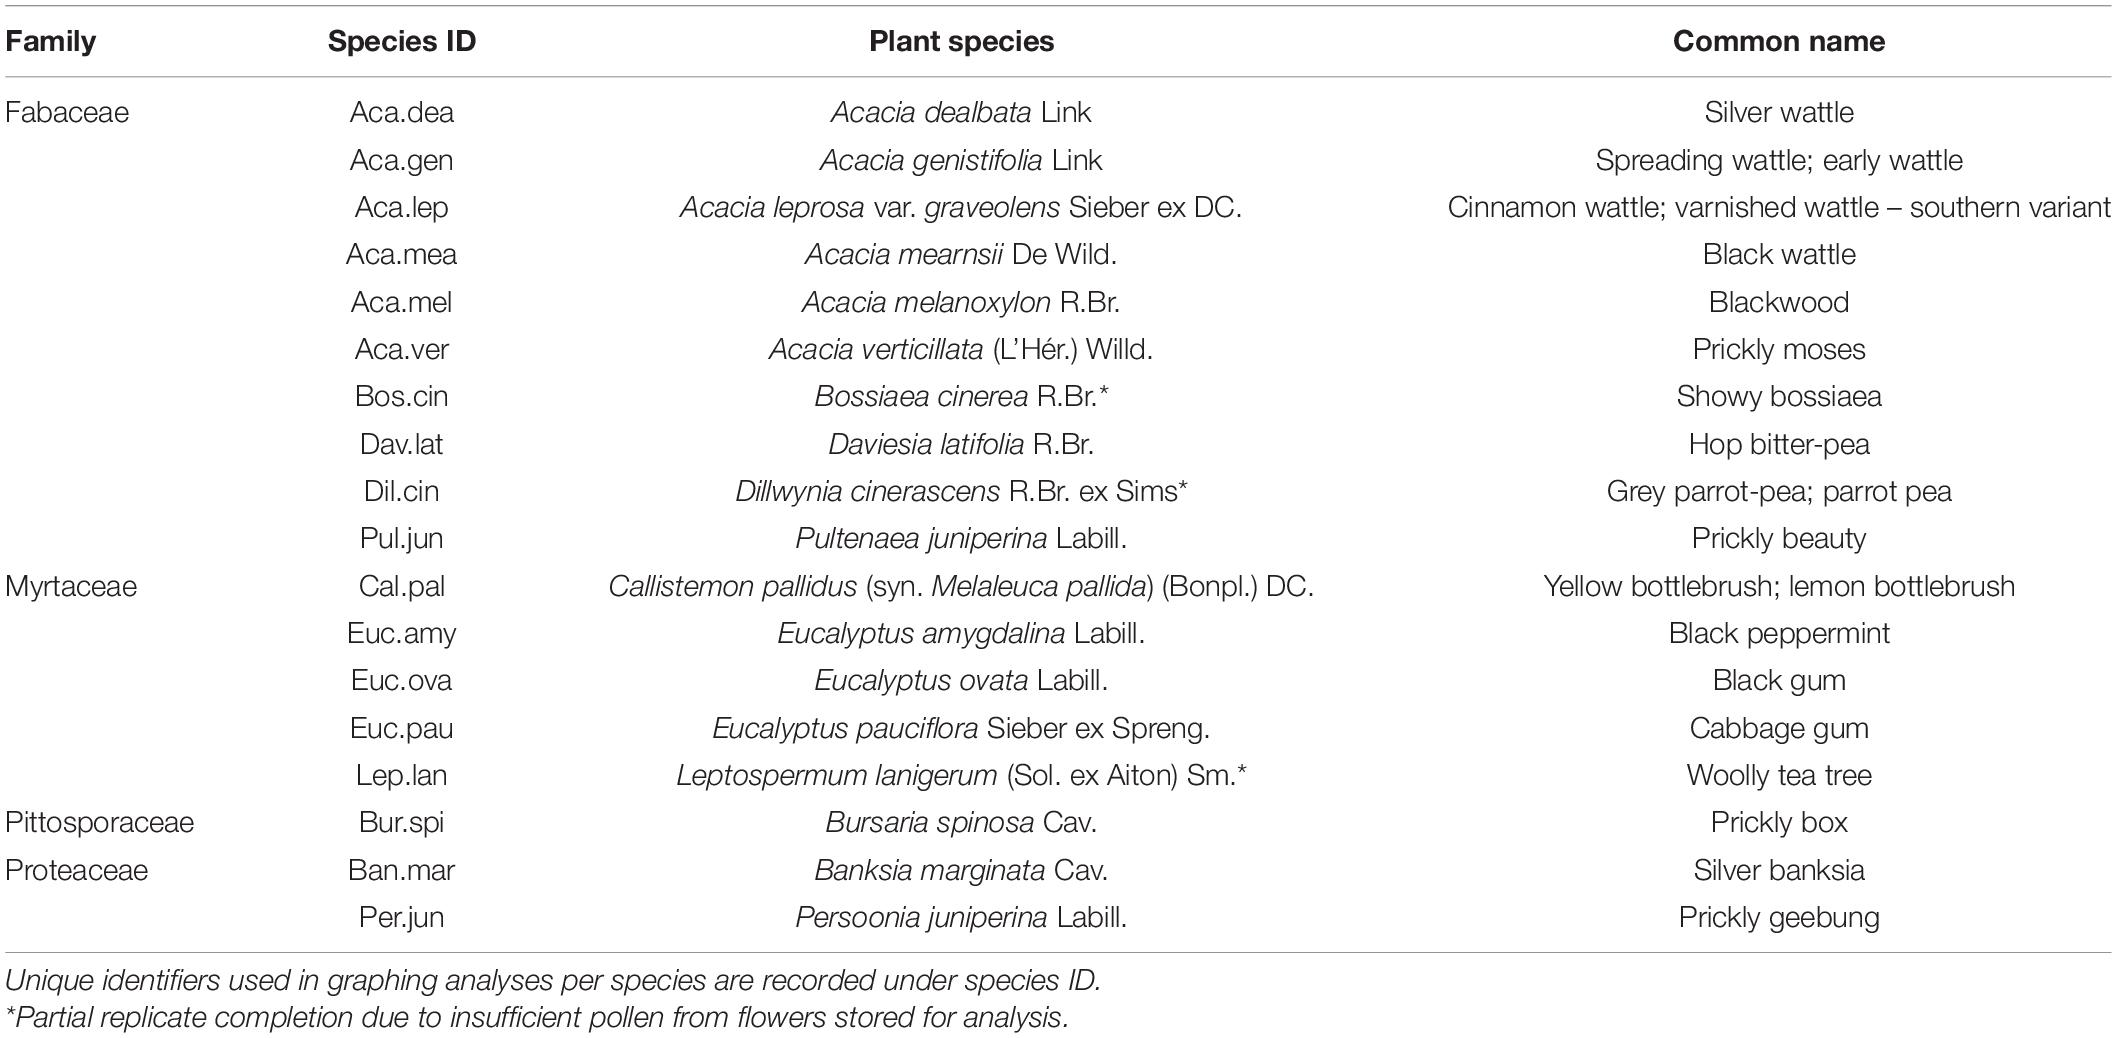
Table 1. Native floral pollen shortlist, species ordered by family, genus, and alphabetical grouping.
For cross-comparison, pollen analyses were performed for commercial carrot seed pollen (D. carota) sourced from seedPurity Pty. Ltd. (Tasmania), and two escaped Brassica spp. naturalised in the study region (Table 2). For clarity, the Brassica spp. have been assigned names based on the locality where they were collected: Campania, York Plains.
Pollen Chemical Fingerprinting – Atmospheric Solids Analysis Probe Mass Spectrometry
Three geographically randomised pollen samples were collected per plant species to incorporate geographical variation between individuals. Each sample was split into three replicates to test for analysis reproducibility and account for within-sample variation. This resulted in a total of 63 samples and 189 replicates analysed. A single sample consisted of a single inflorescence for larger flowers (1–2 cm diameter) and six individual flowers for smaller species (<1 cm). Floral samples were labelled and sealed in vials and frozen (−20°C) immediately upon return from the field.
Mass analyses were carried out in positive ionisation mode on a Waters Xevo TQ triple quadrupole mass spectrometer (MS) (Waters Corporation, Manchester, United Kingdom), equipped with a Waters Atmospheric Solids Analysis Probe. Adapted from the methods of Xiao et al. (2016), pollen was adhered by friction to a closed-end capillary tube and a small amount of deionised water was applied with a micropipette to encourage ionisation by proton transfer and the formation of a protonated molecule, [M + H]+. Initial sample spiking with a stock solution of kaempferol in methanol (100 μg/mL) (Sigma-Aldrich) was used to determine an adequate and reproducible sample size. The stock solution was also used initially to optimise source temperature, sample cone voltage and corona discharge, and prior to each round of analyses to quality test instrumentation and standardise abundance signals relative to background noise.
Xevo MS settings consisted of: a source temperature of 600°C, 3.5 kV corona discharge, sample cone voltage of 61.0 V, nitrogen desolvation gas flow of 800 L/h, acquisition mass range of (m/z) 50–600 (full scan) and scan time of 0.2 s.
Pollen Database and Matrices
Pollen ion masses and corresponding abundances were extracted and tabulated against plant species to form a mass spectral database (Supplementary Appendix 1.1). As we are applying mass spectral fingerprinting as a new method of investigating pollen as a floral trait in plant species, we wished to determine the robustness of our conclusions depending on the approach used to create species profiles and account for variability of ions across samples. We thus ran our clustering analyses based around four different approaches of compiling species profiles: (i) Complete profile – a compound must be present in any replicate of a species to qualify; or Averaged profiles in which a compound is present in a particular number of replicates of a species, in this case (ii) 20 AVG – 20% of replicates, (iii) 80 AVG – 80% of replicates, and (iv) 100 AVG – 100% of replicates. Results obtained from the Complete profile are presented in text, Averaged profile outputs are located in Supplementary Appendix 1.3.
Non-metric Multidimensional Scaling
In order to map dissimilarity, non-metric multidimensional scaling (NMDS) of the Complete profile pollen matrix was executed in R (RStudio Team, 2016). The Vegan Package “metaMDS” function was used to calculate Bray–Curtis distances for species, and repetition of outputs tested for local minima. Goodness of fit and Shepard plot stress were visualised using “goodness” and “stressplot” function in R (Supplementary Appendix 1.2).
Jaccard Index Correlation Matrix
To assess the percentage of similarity between Complete profile pollen spectra, a Jaccard index was calculated in R (“Jaccard” function from the dplyr package) and tabulated as a correlation matrix.
Hierarchical Clustering
Agglomerative clustering dendrograms (“hclust” function in R) were performed to further test species groupings from pollen matrix data and determine whether total spectral patterns are able to be compared as fingerprints. The cophenetic correlation coefficient was compared across three linkage methods (single, complete, and average), and validated the selection of the average linkage method for this data. Dendrograms were cut to form four groups and the clusters derived from different input matrices (Complete to Averaged) contrasted as a robustness test of the clustering.
Results
Predominant spectral differences were mapped via NMDS (Figure 2), and major patterns (Figure 3) grouping taxa at family, genus and species levels were assessed through Jaccard Index correlation (Figure 4), and hierarchical clustering (Table 3, Figure 5 and Supplementary Appendix 1.3).
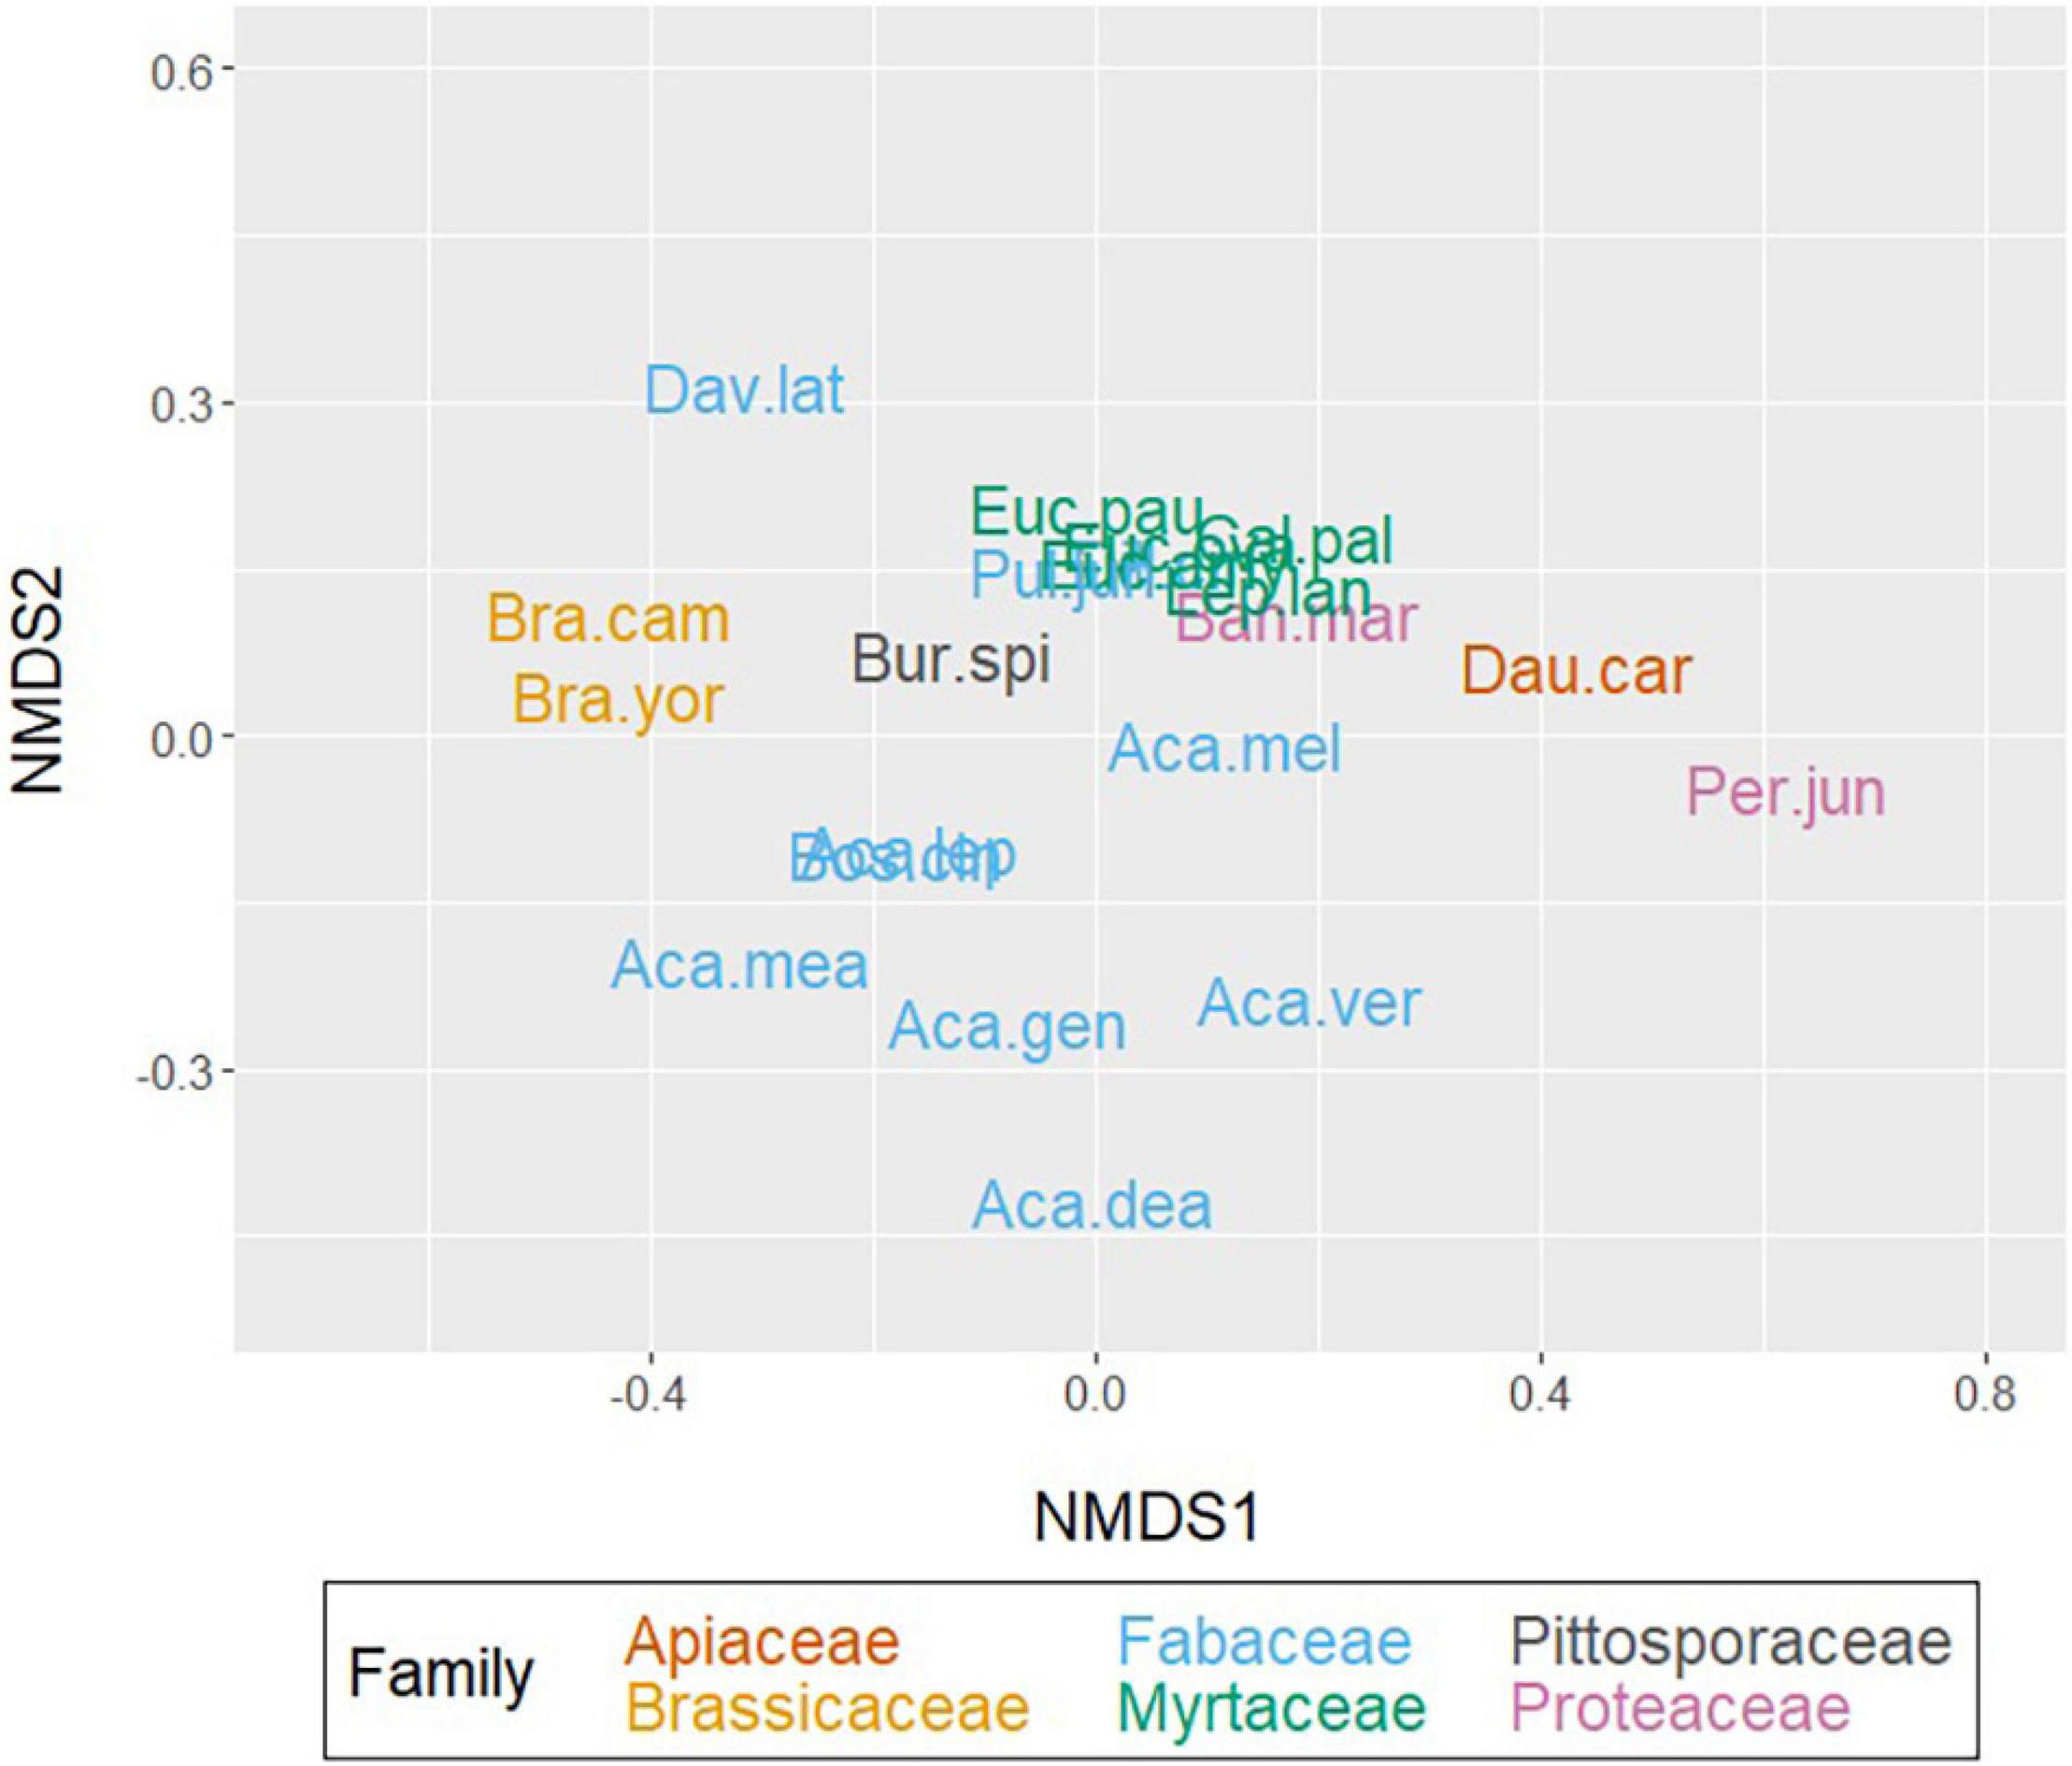
Figure 2. Three-dimensional, non-metric multidimensional scaling (NMDS) of species-level pollen mass spectral presence-absence data, applying Bray–Curtis dissimilarity matrices (stress = 0.061). Pollen spectra included: any m/z present in any sample per species. Coloured by the taxonomic rank of family. Species abbreviations are tabulated in Tables 1, 2.
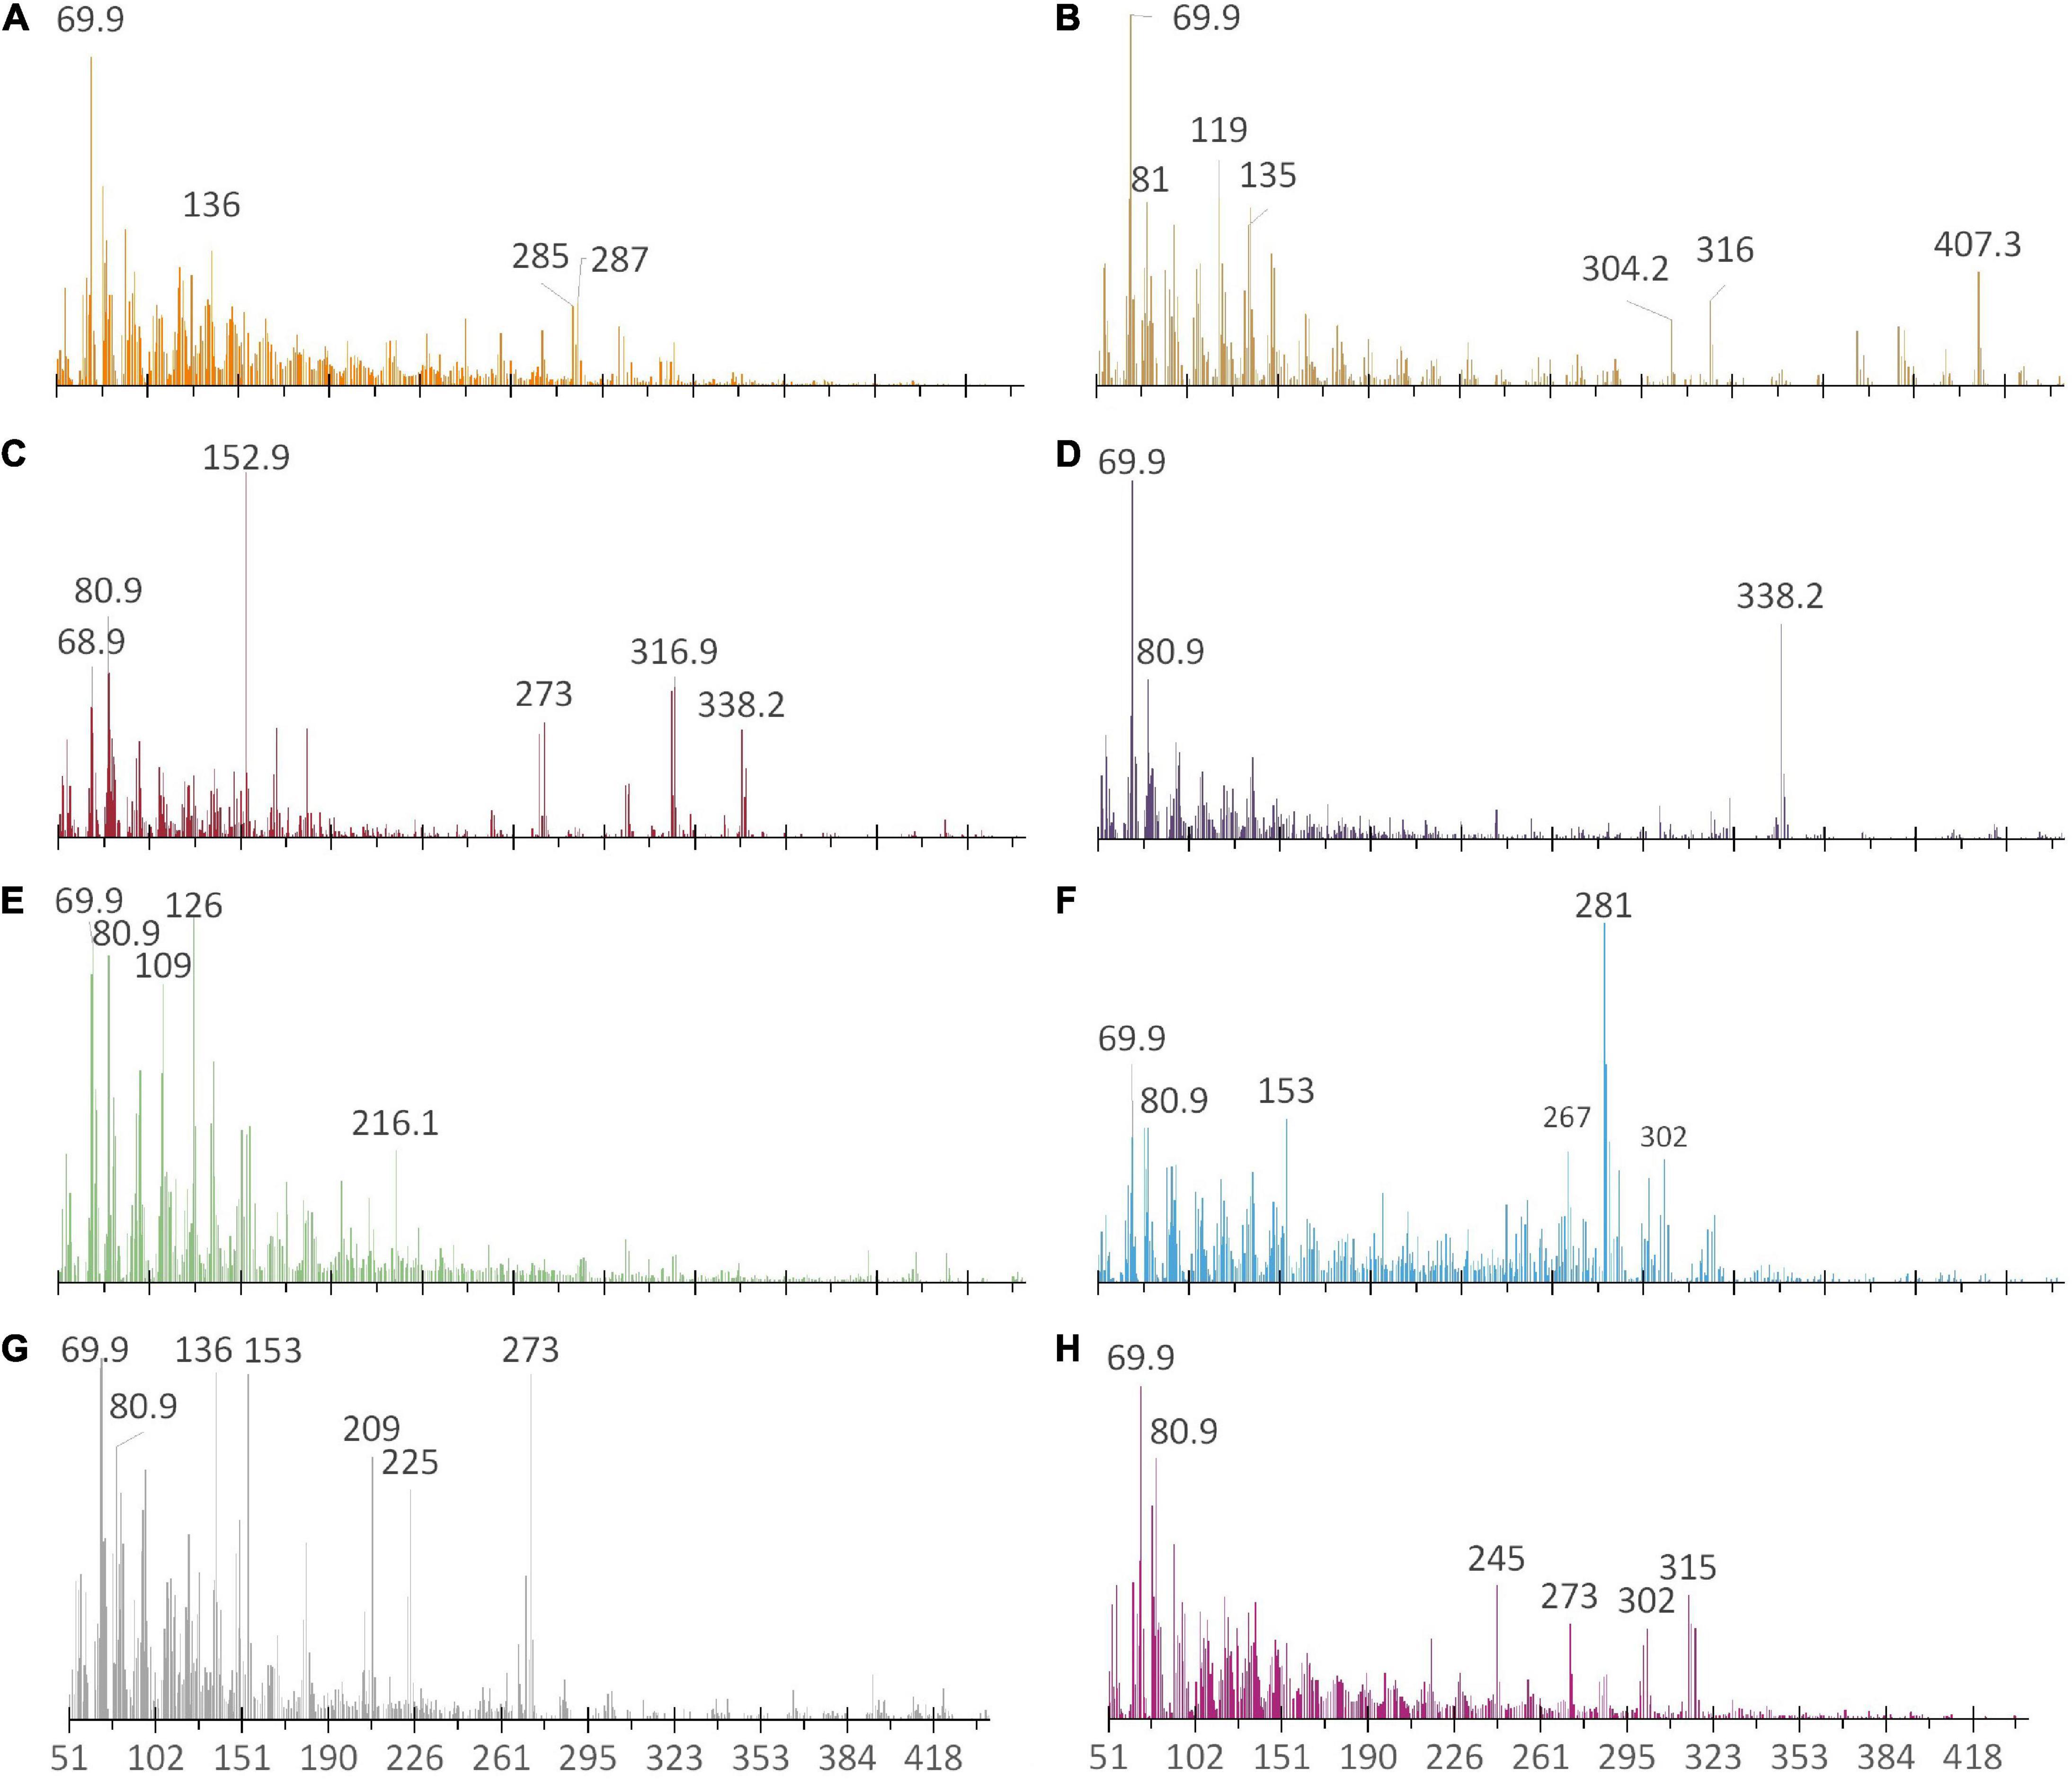
Figure 3. Representative, averaged ASAP mass spectral patterns obtained from pollen samples of (A) D. carota (Apiaceae), (B) Brassica sp. Campania (Brassicaceae), (C) A. genistifolia (Fabaceae), (D) B. cinerea (Fabaceae), (E) E. amygdalina (Myrtaceae), (F) L. lanigerum (Myrtaceae), (G) B. spinosa (Pittosporaceae), and (H) Per. juniperina (Proteaceae). Noteworthy (m/z) ratios are labelled.
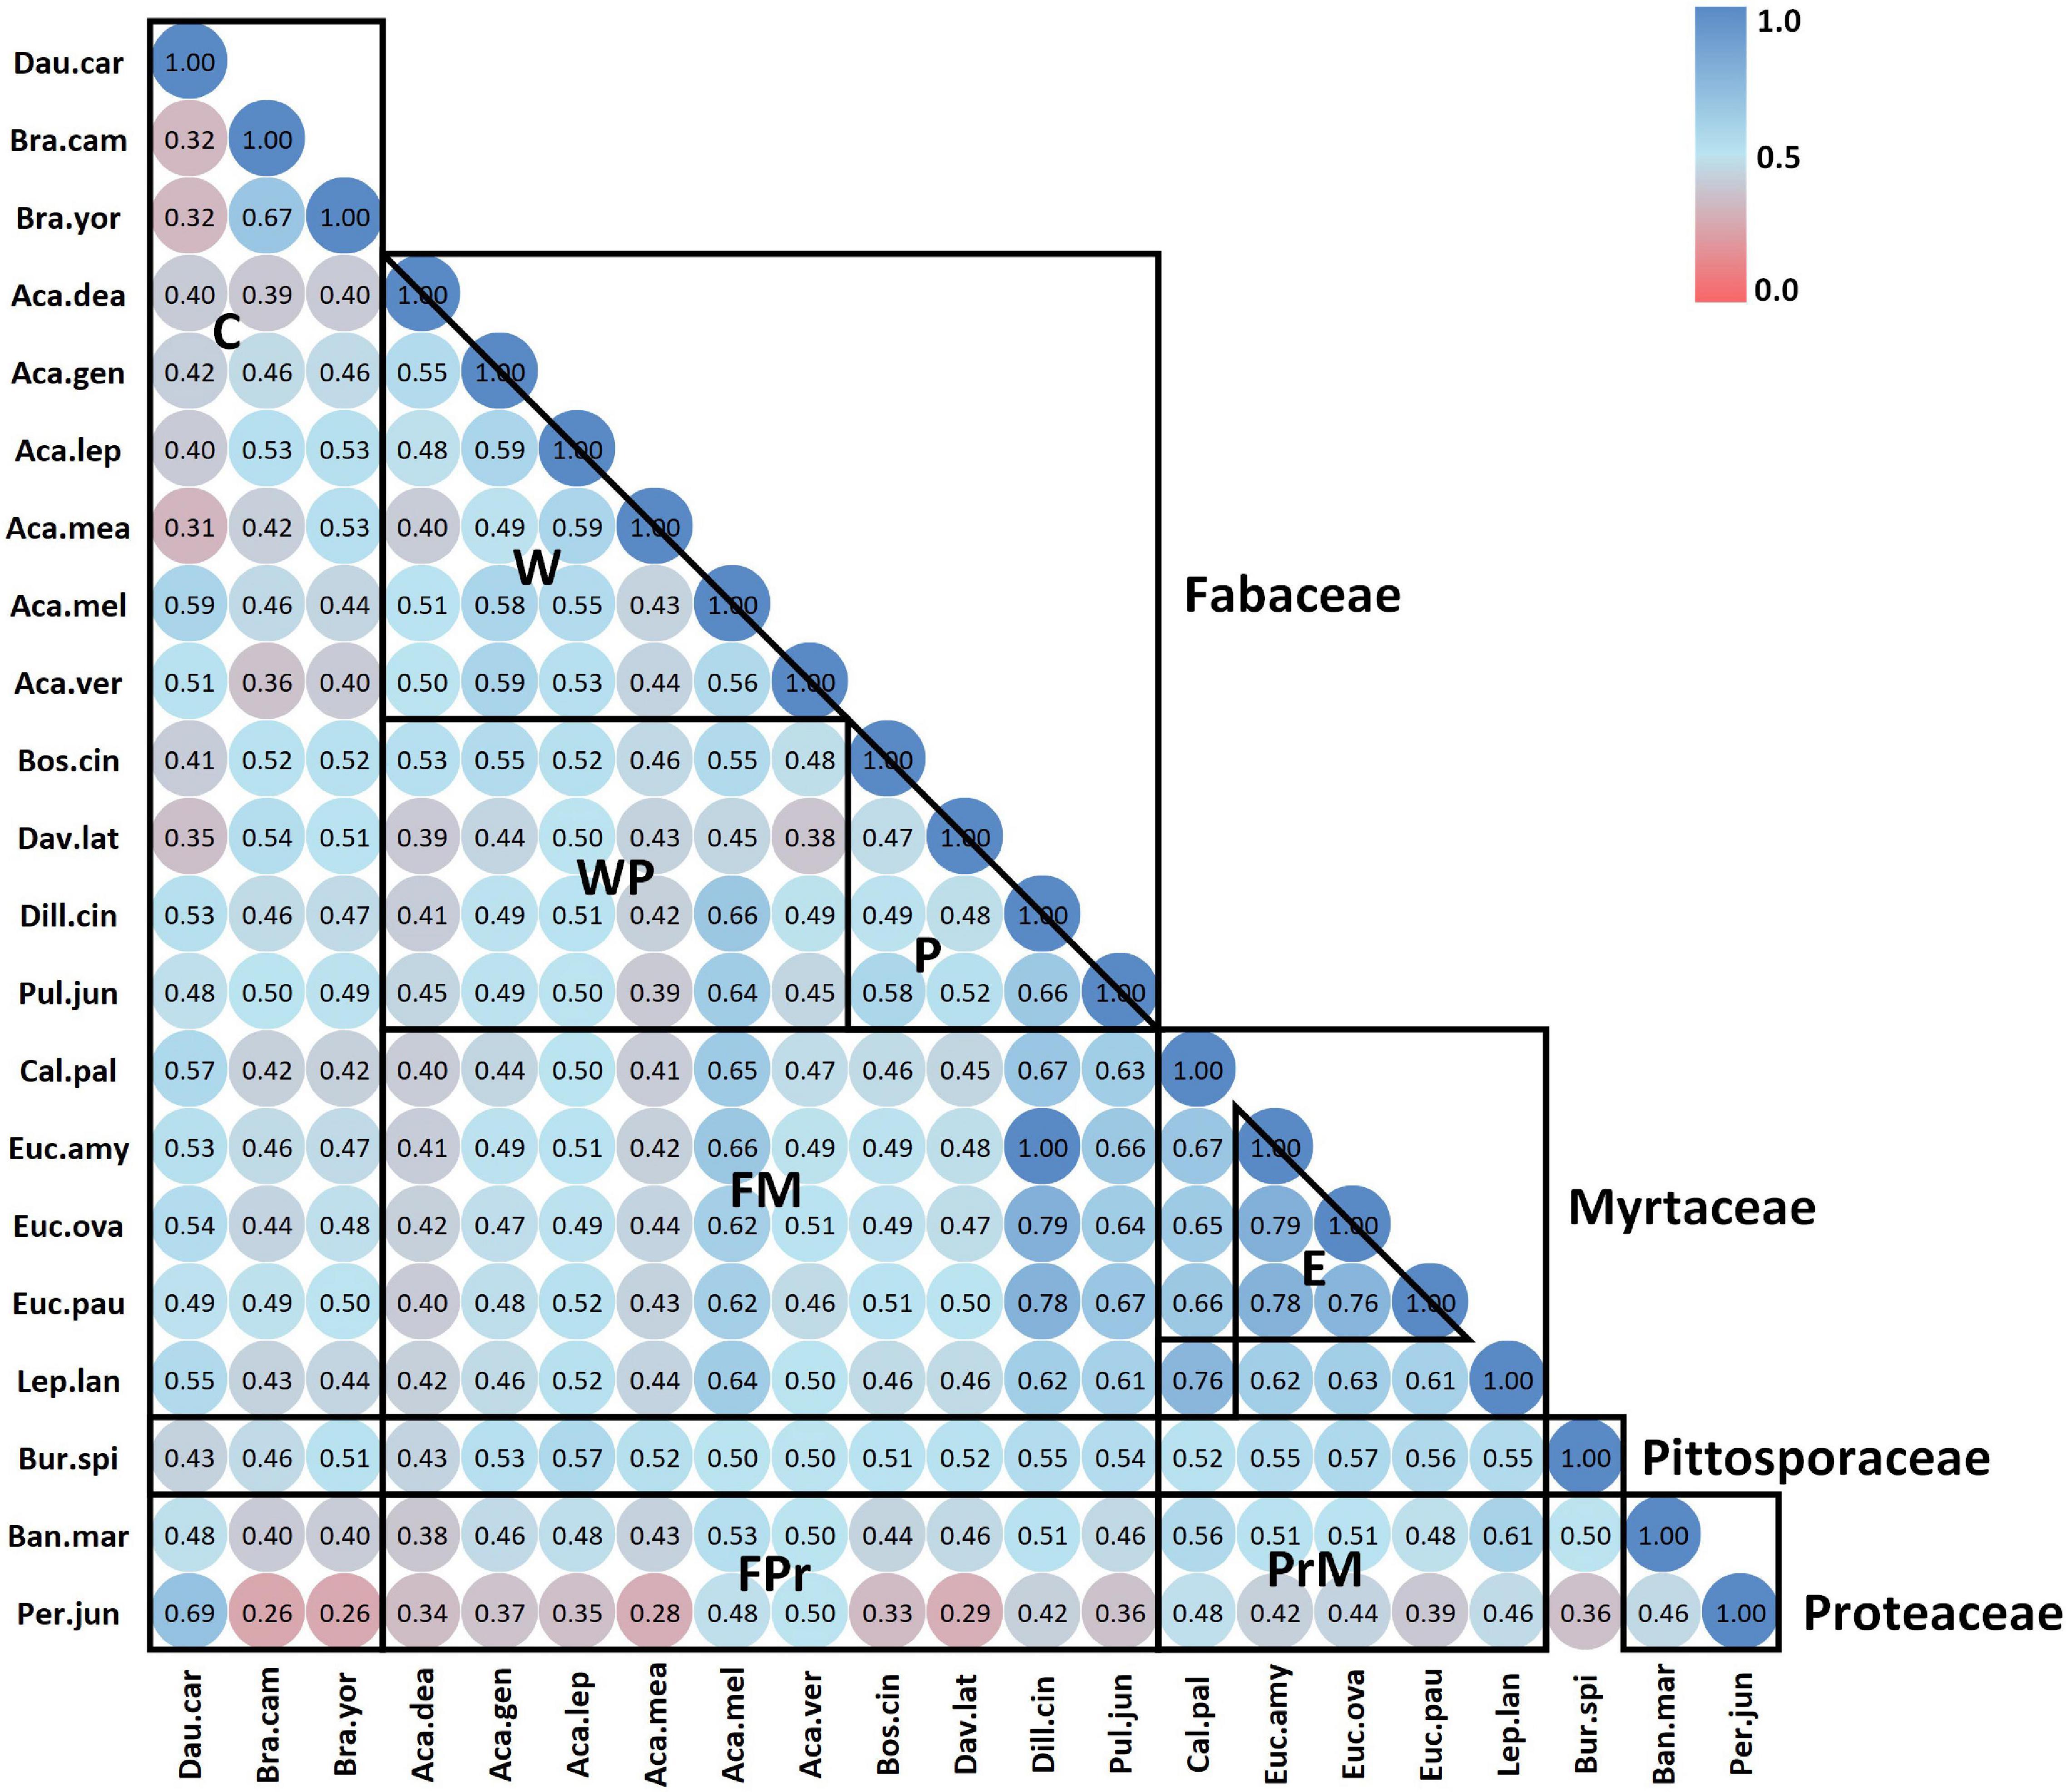
Figure 4. Jaccard index correlation matrix of crop and native flora sorted alphabetically by family – genus – species in both axes. Boxes delimit the major plant groups: crop species, Fabaceae, Myrtaceae, Pittosporaceae, and Proteaceae. Key: (C) crop hybrids, (W) wattle genera, (WP) wattle against pea genera, (P) pea genera, (FM) Fabaceae against Myrtaceae, (FPr) Fabaceae against Proteaceae, (PrM) Proteaceae against Myrtaceae.
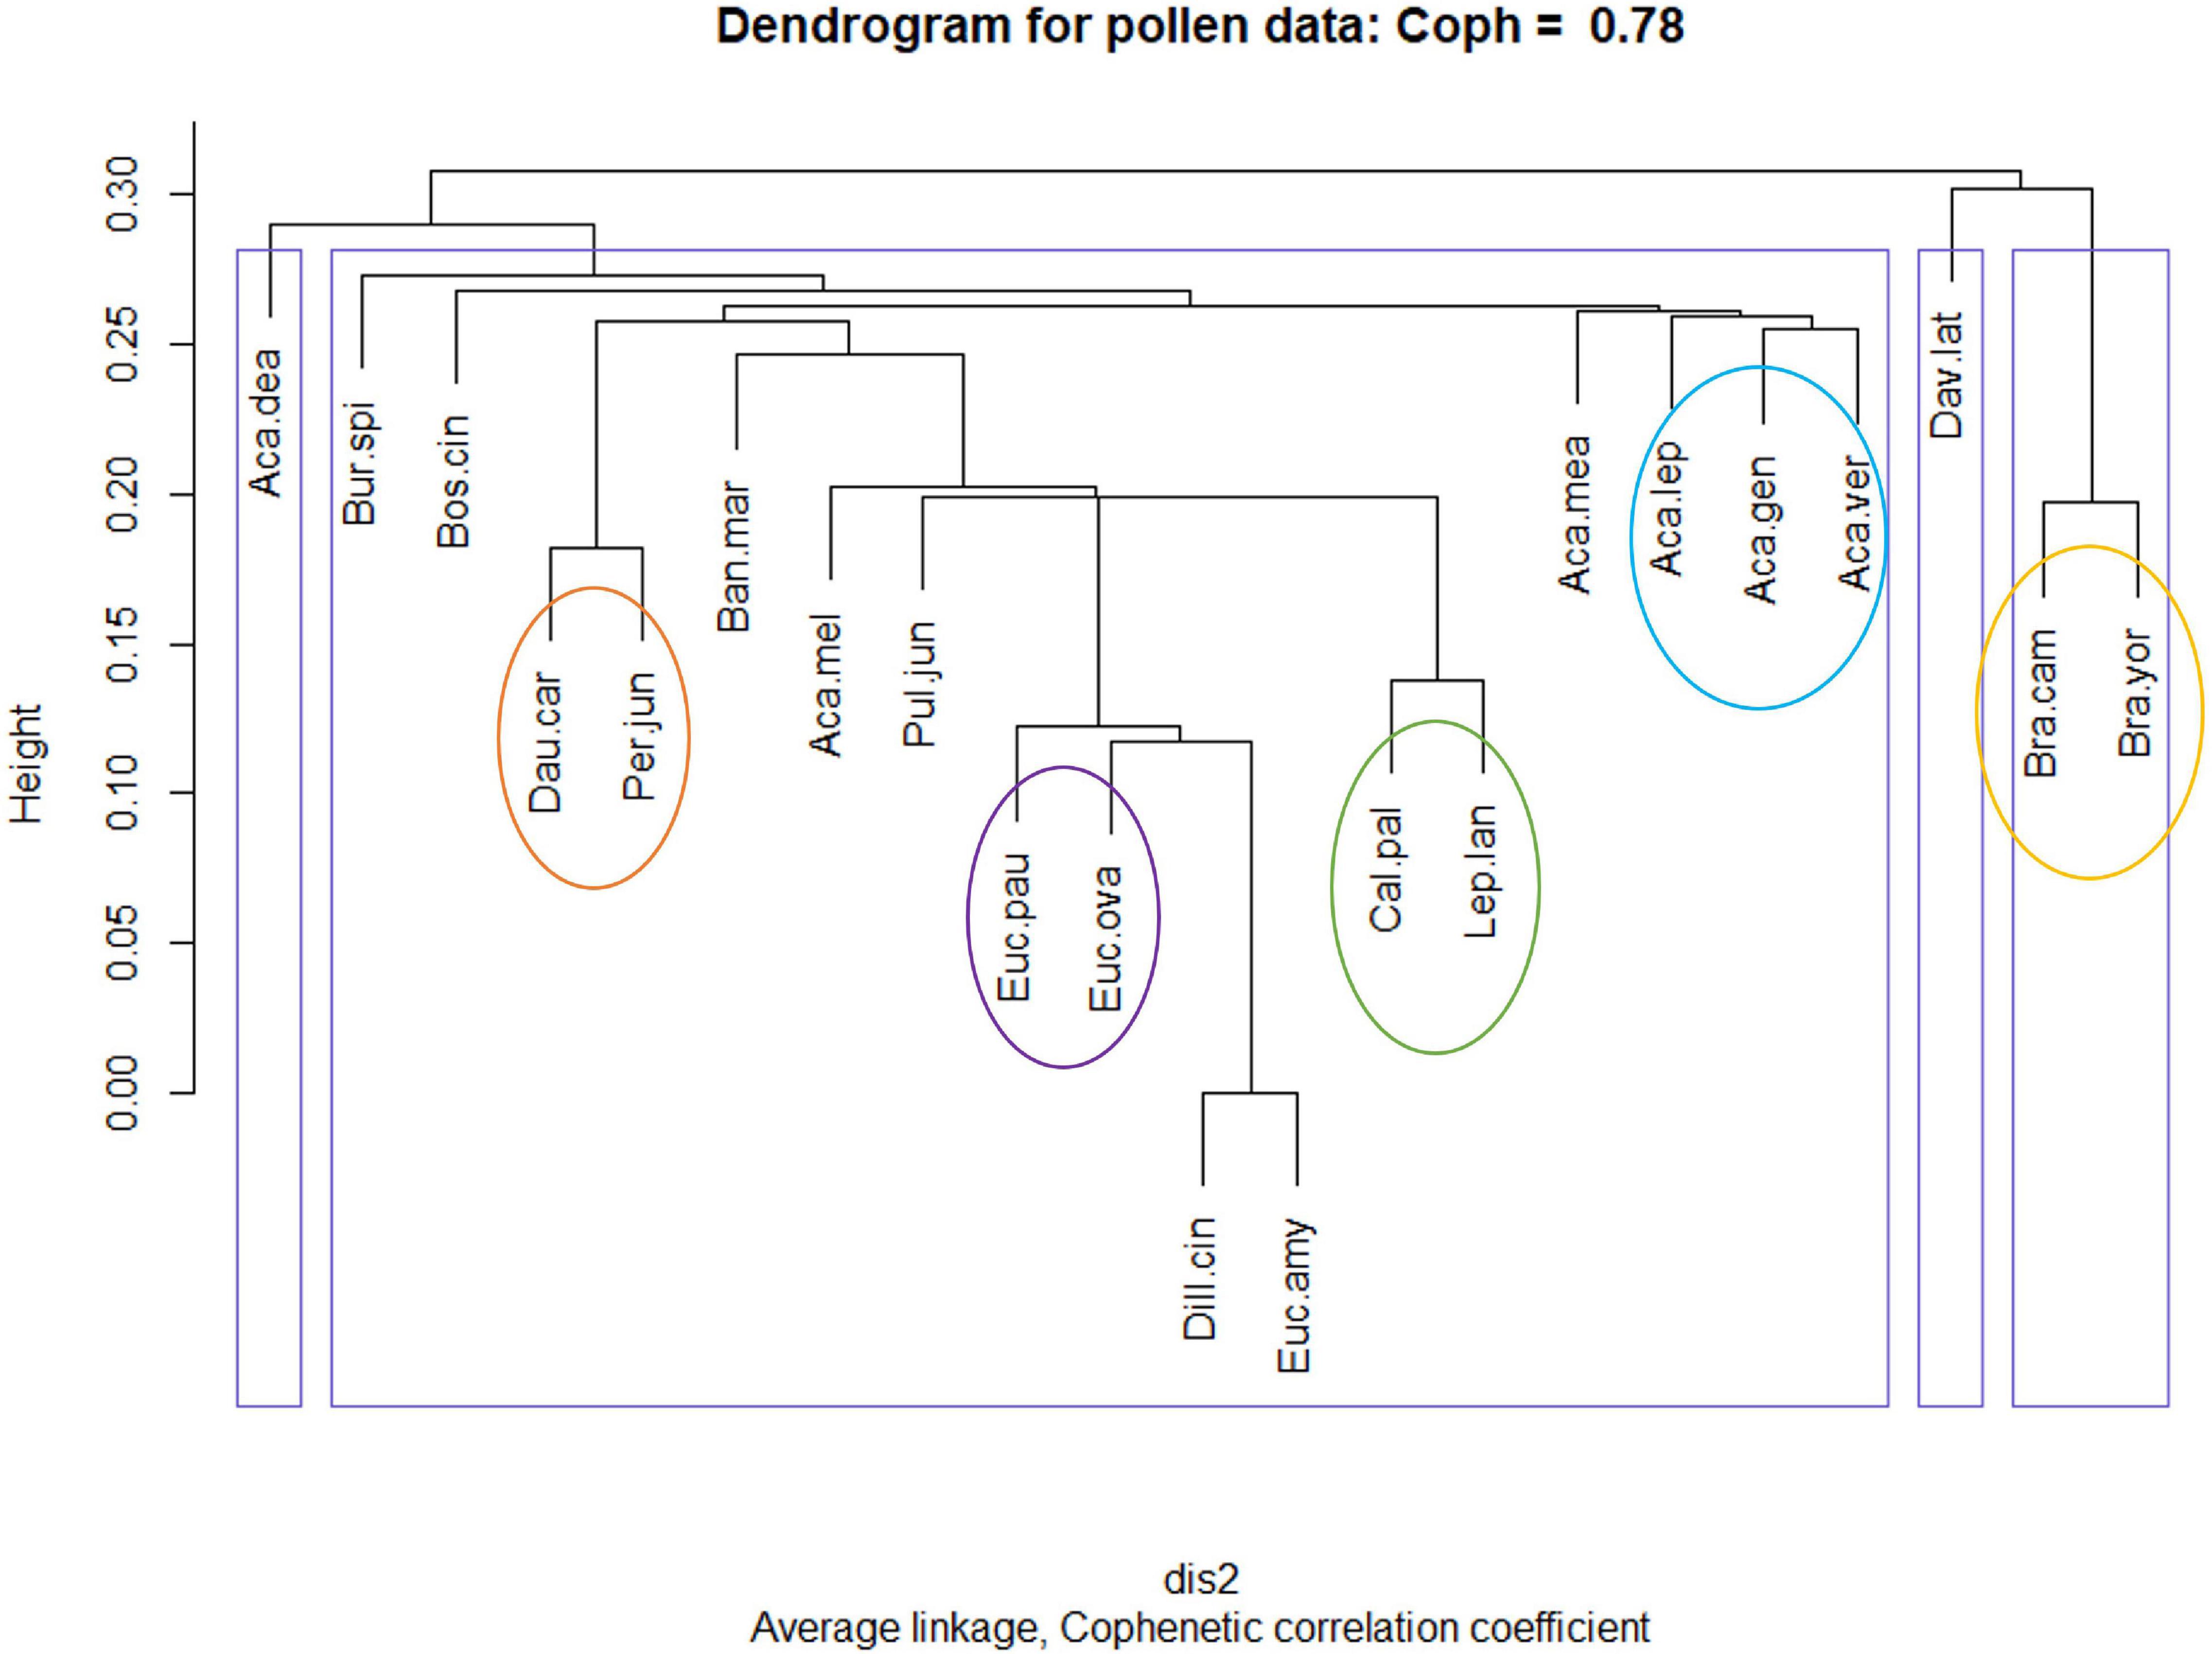
Figure 5. Complete pollen profiles derived hierarchical clustering output. Blue boxes define the four major clustering groups. Coloured circles represent stable pollen groupings which remain consistent across all four dendrogram construction methods. For Averaged profile dendrograms, refer to Supplementary Appendix 1.3.
Predominant Spectral Differences (Non-metric Multidimensional Scaling) and Jaccard Correlation
Plant species maintained taxonomic alignment in the NMDS output, grouping closely to other members within their family (Figure 2 and Supplementary Appendix 1.3). The two related Brassica crop hybrids grouped closely together and further from the majority of native flora. Carrot pollen instead aligned more closely to the Proteaceae Pultenaea juniperina and partly the Myrtaceae. Myrtaceae family members grouped tightly, suggesting higher similarity pollen composition with their family. Fabaceae were scattered more broadly, with wattle genera grouping away from pea genera. Two of the Fabaceae pea genera (Pultanaea and Dillwynia) grouped closely and overlapped with the Myrtaceae cluster. This suggests their chemical composition may be convergent to both each other and with Myrtaceae pollen. The sole Pittosporaceae Bursaria spinosa, was placed between Fabaceae and Myrtaceae groups, and closer in similarity to Brassica than carrot pollen composition. The less pollinator specific Proteaceae Banksia marginata grouped more closely with other native flora than the more specialised Persoonia juniperina.
Correlation through the Jaccard index demonstrated an average 49% pollen similarity across all study species (Figure 4). Whilst some genera were more closely correlated, therefore containing more uniform pollen composition, the results demonstrated a widespread variance of close to 50% between the majority of correlated pairs. Confirming results visualised by NMDS, the two Brassica hybrids presented 67% correlation to each other. Carrot and Pul. juniperina correlated at 69%, and the Fabaceae pea Dillwynia cinerascens exhibited 100% correlation to the Myrtaceae Eucalyptus amygdalina. For a full Jaccard percentage correlation interpretation of Figure 4, refer to Supplementary Appendix 1.4.
Comparison of the averaged, mass spectral fingerprints obtained for each species, highlighted key similarities and differences in pollen at both family and genera levels (Figure 3 and Table 4). All pollens appear to contain a presumptive protonated molecule of (m/z) 70 in relatively high abundance. Spectral signals at (m/z) 271–273 and 316–317 are also common to the Brassicaceae, Fabaceae (Acacia), Pittosporaceae, and Proteaceae (Pultenaea). By comparison, spectral patterns for particular species of the Myrtaceae shared some similarities to the Pittosporaceae and Proteaceae. The Proteaceae appear to exhibit unique spectral signals in the region (m/z) 216–330, such as (m/z) 245 for the species Pul. juniperina. Averaged mass spectral fingerprints for all study species are located in Supplementary Appendix 1.5.
Hierarchical Clustering
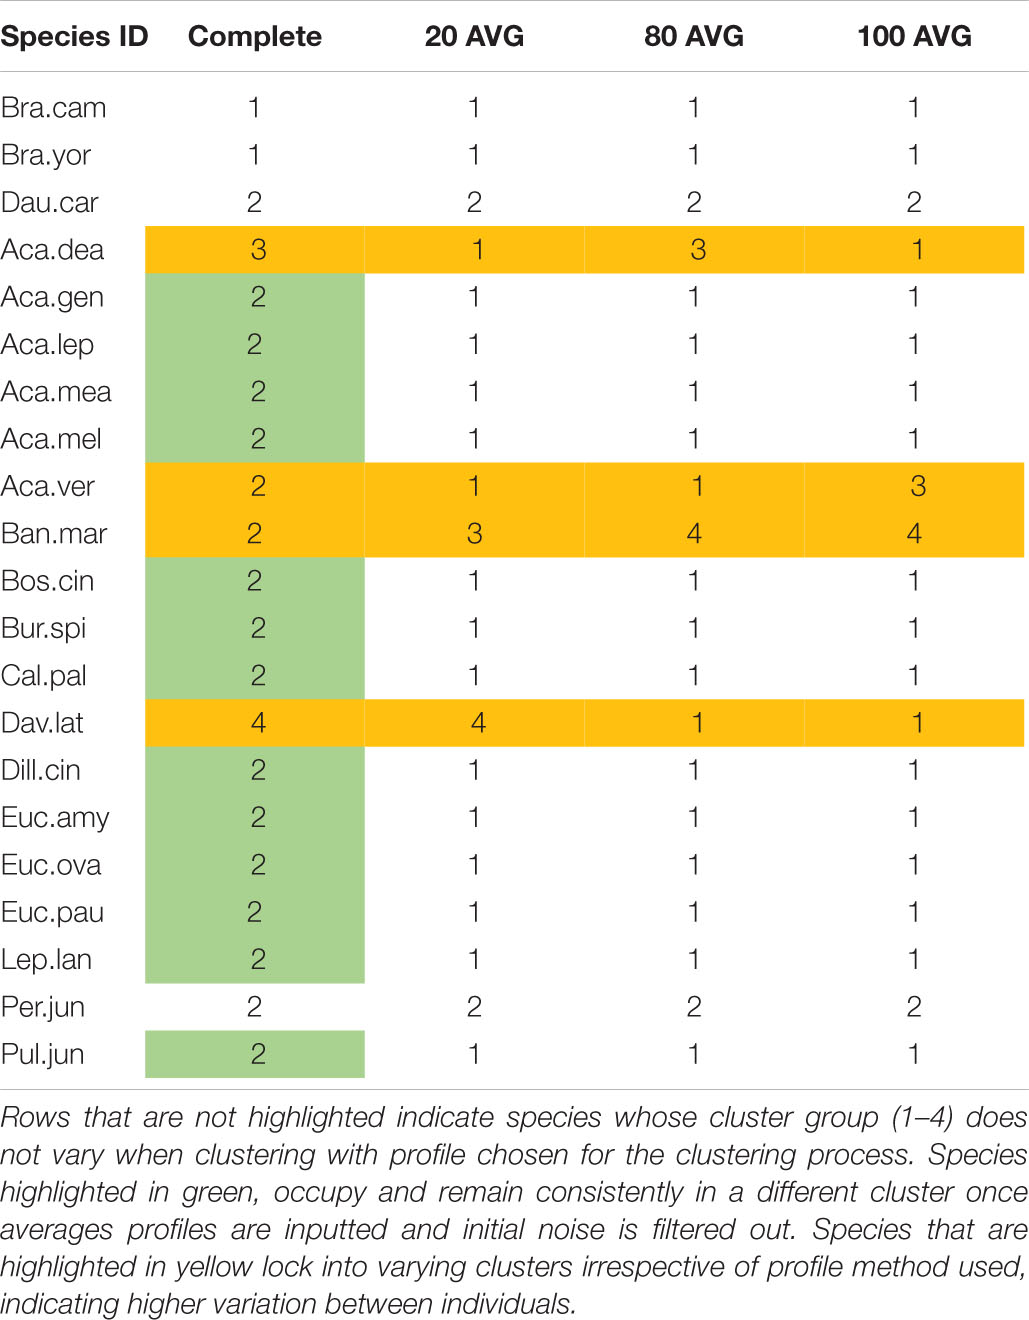
In agreement with the NMDS ordination (Figure 2), the Myrtaceae uphold their close grouping. Of these, Callistemon pallidus and Leptospermum lanigerum consistently pair together and in close hierarchical proximity to the pair of Eucalyptus ovata and Eucalyptus pauciflora (with occasional E. amygdalina). Carrot pollen is observed to always pair with Per. juniperina, within proximity of B. marginata. As suggested from their pollen fingerprints, several wattle (Acacia) species cluster within proximity of each other. Whereas four species of the Fabaceae: Acacia dealbata, Acacia verticillata, Daviesia latifolia, and Proteaceae: B. marginata, continue to shift between different clusters depending on the profile used to construct the dendrograms. This indicates the presence of variation between individuals of these species.
To test the robustness of our method to decisions of how to construct the species molecular fingerprint, we compared clustering across four possible profiles. Clustering results demonstrate that the dendrogram placement of four species remains stable regardless of whether the Complete or Averaged profiles are used to construct the dendrograms (Figure 5 and Supplementary Appendix 1.3). By comparison, 13 species lock into in a new cluster as soon as initial intra-species sample variations are averaged out and four species continue to shift in hierarchy regardless of averaging (Table 3). In general, although Brassica cluster away from native species in the Complete profile assessment, these and carrot pollen cluster within native flora for Averaged profile analyses. This supports NMDS and Jaccard findings of partial overlap between crop and native floral pollen. A large number of study species group and shift within a single cluster.
Discussion
Validity of the Fingerprinting Method
From the results, it is demonstrated that ASAP-MS provides a simple method for the collection of meaningful and reproducible pollen fingerprints. Spectroscopic methods such as FT-IR and FT-Ramen are also able to provide a powerful comparison of pollen. However, unlike ASAP-MS, these spectroscopic methods provide a chemical signature of the broader scale chemical functional groups occurring in a pollen sample. Studies such as the work of Kenđel and Zimmermann (2020) and Zimmerman et al. (2016) have demonstrated these techniques are able to provide structural information for pollen constituents, such as carbohydrate or lipid ratios. However, characterisation of these constituents involves elimination of the sample matrix from the spectra and the deflation of correlation matrices, through the use of reference compound spectra applied as eigenvectors (Zimmerman et al., 2016; Kenđel and Zimmermann, 2020). It has also been suggested that FT-IR and FT-Ramen are better used together, as FT-Ramen prioritises signals obtained from the pollen walls and FT-IR the interior of the grain (Kenđel and Zimmermann, 2020). Due to similarities in size between pollen and certain wavelengths used for FT-IR spectroscopy, Mie-type scattering also occurs and obscures the absorbance spectra from pollen (Zimmerman et al., 2016). This can be mitigated through the analysis of single pollen grains (Zimmerman et al., 2016).
By comparison, the ASAP-MS fingerprint approach allows multiple pollen grains to be adhered and analysed per sample, capturing greater pollen heterogeneity within fewer replicates. Furthermore, ASAP-MS allows individual constituent compounds for each pollen to be mapped. As such, although FT-IR and FT-Ramen techniques may be complementary to ASAP-MS, they are not exclusive. For studies such as ours, where swift identification of the similarities and differences between pollens is desired to answer phylogenetic questions, ASAP-MS mapping of individual compounds provides a greater number of datapoints for statistical comparison and can act as a standalone analysis. The mass spectral outputs may also be directly tabulated and introduced into further statistical analyses, such as correlation matrices, without additional data transformations that may introduce potential errors. Although it was not the focus of our research to undertake further ion fragmentation for compound identification, it is also feasible that the ASAP-MS approach could be extended to chemically survey total pollen composition. For example, Xiao et al. (2016) demonstrated that pollen flavonoids may be identified through ASAP-MS by comparison against reference spectra obtained from flavonol standards.
As can be seen from Figure 3 (see section “Predominant Spectral Differences (Non-metric Multidimensional Scaling) and Jaccard Correlation”), ASAP-MS allows key compounds (presumptive protonated molecule m/z values) to be isolated which are either shared between or unique to the spectral fingerprints of different species. Furthermore, these spectral fingerprints remain consistent between samples. Robustness testing (see section “Hierarchical Clustering”) identified that only 4 of 21 species tested exhibited discernible within-sample variation. It is likely that the variation observed for these species was due to either genetic or physiological differences influenced by parentage, geography, weather, local stressors, or the selection pressures of varied cohorts of floral visitors. Full mass spectral fingerprints obtained for species were also successfully averaged via four different criteria to produce consistent species profiles, which allowed straightforward comparison of these through ordination, correlation, and clustering analyses.
As a result of our analyses, floral pollens were shown to contain an average 49% similarity to each other, irrespective of whether these were exotic crop or native floral species (Figure 4). Despite this, pollens were still observed to predominantly group and cluster in accordance with currently accepted plant taxonomy (Figure 5). Furthermore, although it was not the purpose of this study to interpret individual species fingerprints in detail, shared and unique molecular ions were noted across family, genus, and species levels. It can therefore be interpreted that floral pollens contain information on both inherited traits, leading to taxonomically aligned groupings and the presence of shared compounds, as well as inter-species variation that could stem from varied pollinator selection pressures.
Pollen Correlation and Variation in Native Flora
The effects of both inherited genes and externally influenced divergence in pollen composition was evident across native flora. Native pollens arranged in distinct family groups, as could be expected from shared common ancestry (Figure 2). However, unique patterns were observed for and between different genera (Figures 2, 4). Greater inter-species and inter-generic correlation was recorded for the Myrtaceae than Fabaceae or Proteaceae, and the sole Pittosporaceae studied correlated approximately 50% correlated to the majority of other study species. These results raise a question of the importance of generalist versus specialist insect interactions in driving floral trait evolution.
Given the majority of Myrtaceae studied contain shallow (Eucalyptus and Leptospermum) or brush-shaped (Callistemon) accessible flowers providing abundant nectar and pollen, it is possible these have converged on a similar pollen resource that is beneficial to generalist pollinators. Generalist pollination is widely accepted in the Myrtaceae (Wilson et al., 2001; Zilko et al., 2017) and concurs with the only previous broadscale study of insect visitors in Tasmania by Hingston and McQuillan (2000). Although limited numbers of floral visitors were observed for many of the species studied across varied families, it was suggested that Tasmanian flowers were largely unspecialised and that diverse insect visitation recorded did not align with floral morphology and could not be predicted by pollination syndromes (Hingston and McQuillan, 2000). Since the study by Hingston and McQuillan (2000), global literature has suggested pollination syndromes are either a poor predictor of insect visitation (Ollerton et al., 2009) or require consideration of a broader selection of defining traits for improved accuracy (Dellinger, 2020).
Interestingly however, pollen of the studied pea genera (Fabaceae) exhibited unexpectedly high Jaccard correlation with Myrtaceae pollen, unlike the wattle genus Acacia (Fabaceae) (Figure 4). Of particular future research interest, the pea D. cinerascens and eucalypt E. amygdalina shared 100% pollen similarity. Some ions shared across both species included (m/z) 69.9, 80.9, 95.9, 109, 126, and 216. However, despite the high Jaccard similarity, their spectral fingerprints may be distinguished visually from the ASAP-MS output due to key differences in abundance of these ions. In particular, (m/z) 109, 126, and 216 are far higher in abundance for E. amygdalina (Supplementary Appendix 1.5). Whilst also present in E. amygdalina, D. cinerascens also exhibits a more abundant signal at (m/z) 338 (Supplementary Appendix 1.5).
This result raises a fascinating research question of whether the recorded pollen profile for these species represents an evolutionary product of similar insect selection pressures? Unlike the generalist morphology of eucalypt flowers, Tasmanian pea flowers exhibit a symmetry geared toward more specialised, pollination syndrome-like native bee attraction in preference to generalist pollination (Hingston and McQuillan, 2000). As the studied native floral pollens shared an average similarity of 51%, it appears unlikely that conserved, distant ancestral traits are a feasible explanation for the similarity between these two species of differing families. It is also unfeasible that cross-contamination of these samples occurred as testing was performed across differing days.
Similarly, supporting the importance of pollinator interactions, the most dissimilar native species was the Proteaceae Per. juniperina. To date, it has been suggested from limited studies that Per. juniperina is a specialist attracting a small subset of native Australian bees (Bernhardt and Weston, 1996). Therefore, it is possible that a set of unique selection pressures has shaped the pollen profile of this species. Another interesting incongruity uncovered through this study is the low pollen correlation of the Acacia species A. dealbata to Acacia mearnsii (40%, Figure 4). As genetically closely related species (Brown et al., 2006) flowering sequentially in the study region, it is unexpected that these do not share a more similar pollen profile. However A. dealbata, which is early flowering in the study region, correlates more highly to later flowering Acacia species. In this sense, it could be that A. mearnsii, which flowers between A. dealbata and these later co-flowering species, faces competition for floral visitors and is in a process of trait adaptation due to selection pressure.
Pollen Correlation and Variation Between Crops and Native Flora
Pollen similarity between the two, naturalised Brassica crop hybrids was 67% (Figure 4). Tentatively identified as two cultivars of oilseed rape, this result is within expectation. Both hybrids exhibited a low, 32% correlation to carrot seed D. carota pollen. This is not unexpected as the families Brassicaceae and Apiaceae are relatively distant phylogenetically (refer to Figure 1 in Ruedenauer et al., 2019). Brassica pollen exhibited an averaged 45% correlation to native flora, whereas carrot correlated 48% to native flora. Brassica pollen correlated highest with peas of the Fabaceae, whereas carrot pollen correlated highest with the Proteaceae Per. juniperina and members of the Myrtaceae and Fabaceae (Figure 2). Although both carrot (Apiaceae) and B. spinosa (Pittosporaceae) belong to the order Apiales, these were only 43% correlated (Figure 4). This result raises an interesting research question regarding how much pollens should be expected to correlate across different phylogenetic levels. As suggested by Ruedenauer et al. (2019), both phylogenetic relatedness and dependence on pollinators shape the nutritional and therefore chemical composition of pollens.
As discussed in section “Pollen Correlation and Variation Between Crops and Native Flora,” these findings support the role of external selection pressures in shaping pollen composition, in preference to conserved, inherited traits. These results are of interest as there appear to be specific pressures driving pollen composition across diverse families and ultimately correlations do not match expected phylogenetic patterns. Whether the pollen of species correlates less with related families in order to avoid competition based on other shared floral traits, or as a result of flowering time overlaps or past historical adaptations remains an exciting future research question. Lastly, the possibility of unexpected overlaps in pollinator attraction based on floral reward is a source of optimism for the tailoring of wild pollinator attraction to cropping species. It is likely that an integrated method for pairing potential revegetation species with crop hybrids could be developed, once a better understanding of pollinator foraging decisions when matched appropriately against other floral traits such as floral scent, colour and shape in addition to pollen is obtained.
Conclusion and Future Directions
In summary, our results validate ASAP-MS as an efficient and reliable method for the rapid comparison of full pollen fingerprints. Enabling comparison of pollen at all phylogenetic levels, ASAP-MS in combination with ordination (NMDS), Jaccard correlation and clustering allows direct quantification of the similarity between diverse plant families. Furthermore, composition patterns identified from pollen provide insight toward past and current evolution pressures, highlighting species of future research interest. Unlocking valuable baseline data for understudied plant–pollinator networks, mapping of the correlation between crop and target revegetation flora could expediate landscape management decision-making processes and better tailor revegetation species to agricultural crops. To conclude, pollen represents a valid and examinable floral trait and we endorse its application in plant–pollinator and revegetation studies, with the appropriate inclusion of insect visitation and other trait data.
Data Availability Statement
The original contributions presented in the study are included in the article/Supplementary Material, further inquiries can be directed to the corresponding author.
Author Contributions
AL and DN conceived and designed the experiment. AL performed the experiments, collected the field data, processed the samples, and analysed the raw data. DN contributed reagents, materials, and analysis tools. AL (80%), DN, VA, and PM wrote the manuscript. All authors contributed to the article and approved the submitted version.
Funding
Instrument time was funded internally through the School of Geography, Planning and Spatial Sciences (University of Tasmania). This study was part of a broader project funded by the Holsworth Wildlife Research Endowment – Equity Trustees Charitable Foundation & the Ecological Society of Australia.
Conflict of Interest
The authors declare that the research was conducted in the absence of any commercial or financial relationships that could be construed as a potential conflict of interest.
Publisher’s Note
All claims expressed in this article are solely those of the authors and do not necessarily represent those of their affiliated organizations, or those of the publisher, the editors and the reviewers. Any product that may be evaluated in this article, or claim that may be made by its manufacturer, is not guaranteed or endorsed by the publisher.
Acknowledgments
We extend our appreciation and acknowledgements to Ross Corkrey (Senior Research Fellow in Biometrics, Tasmanian Institute of Agriculture, Hobart) for providing valuable feedback and recommendations on the application of statistics in this study. Moreover, our sincere gratitude to seedPurity for their charitable contribution of carrot seed crop pollen samples and industry insights.
Supplementary Material
The Supplementary Material for this article can be found online at: https://www.frontiersin.org/articles/10.3389/fevo.2021.795104/full#supplementary-material
References
Aizen, M. A., and Harder, L. D. (2009). The global stock of domesticated honey bees is growing slower than agricultural demand for pollination. Curr. Biol. 19, 915–918. doi: 10.1016/j.cub.2009.03.071
Austin, A. D., Yeates, D. K., Cassis, G., Fletcher, M. J., La Salle, J., Lawrence, J. F., et al. (2004). Insects ‘down under’–diversity, endemism and evolution of the Australian insect fauna: examples from select orders. Aust. Entomol. 43, 216–234.
Australian Bureau of Statistics (2010). Measures of Australia’s Progress [WWW Document]. Available online at: http://www.abs.gov.au/ausstats/abs@.nsf/Lookup/by%20Subject/1370.0~2010~Chapter~Land%20clearing%20(6.2.2) (accessed July 28, 2017).
Bailes, E. J., Ollerton, J., Pattrick, J. G., and Glover, B. J. (2015). How can an understanding of plant–pollinator interactions contribute to global food security? Curr. Opin. Plant Biol. 26, 72–79. doi: 10.1016/j.pbi.2015.06.002
Bartual, A. M., Sutter, L., Bocci, G., Moonen, A.-C., Cresswell, J., Entling, M., et al. (2019). The potential of different semi-natural habitats to sustain pollinators and natural enemies in European agricultural landscapes. Agric. Ecosyst. Environ. 279, 43–52. doi: 10.1016/j.agee.2019.04.009
Batley, M., and Hogendoorn, K. (2009). Diversity and conservation status of native Australian bees. Apidologie 40, 347–354. doi: 10.1051/apido/2009018
Bernhardt, P., and Weston, P. (1996). The pollination ecology of Persoonia (Proteaceae) in eastern Australia. Telopea 6, 775–804. doi: 10.7751/telopea19963035
Brown, G. K., Ariati, S. R., Murphy, D. J., Miller, J. T. H., and Ladiges, P. Y. (2006). Bipinnate acacias (Acacia subg. Phyllodineae sect. Botrycephalae) of eastern Australia are polyphyletic based on DNA sequence data. Aust. Syst. Bot. 19:315. doi: 10.1071/SB05039
DEDTA, Tasmanian Institute of Agriculture, and Freshlogic (2014). Carrot Seed Market Profile, Wealth for Water. Tasmania, HBA: DEDTA.
Dellinger, A. S. (2020). Pollination syndromes in the 21 st century: where do we stand and where may we go? New Phytol. 228:16793. doi: 10.1111/nph.16793
Department of Agriculture, and Water and the Environment (2018). National Vegetation Information System (NVIS) [WWW Document]. Dep. Agric. Water Environ. Available online at: http://www.environment.gov.au/ (accessed January 8, 2020).
Department of Primary Industries Parks and Water and Environment (n.d.). Natural Values Atlas [WWW Document]. Nat. Values Atlas. Available online at: https://www.naturalvaluesatlas.tas.gov.au/#HomePage (accessed April 8, 2019).
DPIPWE (2012). LISTdata [WWW Document]. Available online at: https://www.thelist.tas.gov.au/app/content/data/index (accessed June8, 2020).
Fensham, R. J., and Kirkpatrick, J. B. (1989). “The conservation of original vegetation remnants in the midlands, Tasmania in southern Tasmania,” in Proceedings of the Royal Society of Tasmania, Tasmania, HBA, 229–246.
Gaffney, A., Bohman, B., Quarrell, S. R., Brown, P. H., and Allen, G. R. (2019). Limited cross plant movement and non-crop preferences reduce the efficiency of honey bees as pollinators of hybrid carrot seed crops. Insects 10:34. doi: 10.3390/insects10020034
Gallai, N., Salles, J.-M., Settele, J., and Vaissière, B. E. (2009). Economic valuation of the vulnerability of world agriculture confronted with pollinator decline. Ecol. Econ. 68, 810–821. doi: 10.1016/j.ecolecon.2008.06.014
Goulson, D., Nicholls, E., Botias, C., and Rotheray, E. L. (2015). Bee declines driven by combined stress from parasites, pesticides, and lack of flowers. Science 347, 1255957. doi: 10.1126/science.1255957
Hingston, A. B., and McQuillan, P. B. (2000). Are pollination syndromes useful predictors of floral visitors in Tasmania? Aust. Ecol. 25, 600–609. doi: 10.1111/j.1442-9993.2000.tb00065.x
Jones, G. D. (2014). Pollen analyses for pollination research, acetolysis. J. Pollinat. Ecol. 13, 203–217.
Kearns, C. A., Inouye, D. W., and Waser, N. M. (1998). Endangered mutualisms: the conservation of plant-pollinator interactions. Annu. Rev. Ecol. Syst. 29, 83–112.
Kenđel, A., and Zimmermann, B. (2020). Chemical analysis of pollen by FT-Raman and FTIR spectroscopies. Front. Plant Sci. 11:352. doi: 10.3389/fpls.2020.00352
Klein, A.-M., Vaissiere, B. E., Cane, J. H., Steffan-Dewenter, I., Cunningham, S. A., Kremen, C., et al. (2007). Importance of pollinators in changing landscapes for world crops. Proc. R. Soc. B Biol. Sci. 274, 303–313. doi: 10.1098/rspb.2006.3721
Leech, M. Rural Industries Research and Development Corporation (2009). A Field Guide to Native Flora used by Honeybees in Tasmania. Barton, MICH: RIRCD.
McEwen, C. N., McKay, R. G., and Larsen, B. S. (2005). Analysis of solids, liquids, and biological tissues using solids probe introduction at atmospheric pressure on commercial LC/MS instruments. Anal. Chem. 77, 7826–7831. doi: 10.1021/ac051470k
Ollerton, J., Alarcón, R., Waser, N. M., Price, M. V., Watts, S., Cranmer, L., et al. (2009). A global test of the pollination syndrome hypothesis. Ann. Bot. 103, 1471–1480. doi: 10.1093/aob/mcp031
Potts, S. G., Imperatriz-Fonseca, V., Ngo, H. T., Aizen, M. A., Biesmeijer, J. C., Breeze, T. D., et al. (2016). Safeguarding pollinators and their values to human well-being. Nature 540, 220–229. doi: 10.1038/nature20588
Raguso, R. A. (2008a). Start making scents: the challenge of integrating chemistry into pollination ecology. Entomol. Exp. Appl. 128, 196–207. doi: 10.1111/j.1570-7458.2008.00683.x
Raguso, R. A. (2008b). Wake up and smell the roses: the ecology and evolution of floral scent. Annu. Rev. Ecol. Evol. Syst. 39, 549–569. doi: 10.1146/annurev.ecolsys.38.091206.095601
Ruedenauer, F. A., Spaethe, J., van der Kooi, C. J., and Leonhardt, S. D. (2019). Pollinator or pedigree: which factors determine the evolution of pollen nutrients? Oecologia 191, 349–358. doi: 10.1007/s00442-019-04494-x
Russo, L., Vaudo, A. D., Fisher, C. J., Grozinger, C. M., and Shea, K. (2019). Bee community preference for an invasive thistle associated with higher pollen protein content. Oecologia 190, 901–912. doi: 10.1007/s00442-019-04462-5
Schulte, F., Lingott, J., Panne, U., and Kneipp, J. (2008). Chemical characterization and classification of pollen. Anal. Chem. 80, 9551–9556.
Vanbergen, A. J. the Insect Pollinators Initiative (2013). Threats to an ecosystem service: pressures on pollinators. Front. Ecol. Environ 11:251–259. doi: 10.1890/120126
Waters (2011). ASAP Application Notebook: Atmospheric Solids Analysis Probe. Milford, MA: Waters Corporation.
Wilson, P. G., O’Brien, M. M., Gadek, P. A., and Quinn, C. J. (2001). Myrtaceae revisited: a reassessment of infrafamilial groups. Am. J. Bot. 88, 2013–2025. doi: 10.2307/3558428
Xiao, X., Miller, L. L., Parchert, K. J., Hayes, D., and Hochrein, J. M. (2016). Atmospheric solids analysis probe mass spectrometry for the rapid identification of pollens and semi-quantification of flavonoid fingerprints: ASAP-MS for identification of pollen and quantification of flavonoids. Rapid Commun. Mass Spectrom. 30, 1639–1646. doi: 10.1002/rcm.7601
Zilko, J. P., Hoebee, S. E., and Edwards, T. J. (2017). Floral morphology of Eucalyptus leucoxylon (Myrtaceae) facilitates pollination by lorikeet (Aves: Psittacidae) tongues. Aust. J. Bot. 65:368. doi: 10.1071/BT16242
Keywords: pollen analysis, floral traits, wild pollinators, crop pollination, native flora, atmospheric solids analysis probe
Citation: Latinovic A, Nichols DS, Adams VM and McQuillan PB (2021) Application of Atmospheric Solids Analysis Probe Mass Spectrometry for the Taxonomic Analysis of Pollen. Front. Ecol. Evol. 9:795104. doi: 10.3389/fevo.2021.795104
Received: 14 October 2021; Accepted: 08 December 2021;
Published: 24 December 2021.
Edited by:
Panagiotis Milonas, Benaki Phytopathological Institute, GreeceReviewed by:
Konstantinos M. Kasiotis, Benaki Phytopathological Institute, GreeceAthanasios Charilaos Kimbaris, Democritus University of Thrace, Greece
Copyright © 2021 Latinovic, Nichols, Adams and McQuillan. This is an open-access article distributed under the terms of the Creative Commons Attribution License (CC BY). The use, distribution or reproduction in other forums is permitted, provided the original author(s) and the copyright owner(s) are credited and that the original publication in this journal is cited, in accordance with accepted academic practice. No use, distribution or reproduction is permitted which does not comply with these terms.
*Correspondence: Adelina Latinovic, YWRlbGluYS5sYXRpbm92aWNAdXRhcy5lZHUuYXU=
 Adelina Latinovic
 David S. Nichols2
 Peter B. McQuillan
