
94% of researchers rate our articles as excellent or good
Learn more about the work of our research integrity team to safeguard the quality of each article we publish.
Find out more
ORIGINAL RESEARCH article
Front. Ecol. Evol., 27 January 2022
Sec. Paleoecology
Volume 9 - 2021 | https://doi.org/10.3389/fevo.2021.786510
This article is part of the Research TopicEarly Human Colonization of Remote Indian Ocean Islands and its Ecological ImpactsView all 11 articles
 Vicki A. Thomson1*
 Andrew S. Wiewel1
 Russell Palmer2
 Neil Hamilton2Dave Algar2Caitlyn Pink3Harriet Mills4Ken P. Aplin5
 Geoffrey Clark6
 Atholl Anderson6
 Michael B. Herrera1,7
 Steven Myers1Terry Bertozzi1,8
 Philip J. Piper9
 Hitoshi Suzuki10
 Steve Donnellan8
Islands can be powerful demonstrations of how destructive invasive species can be on endemic faunas and insular ecologies. Oceanic islands in the eastern Indian Ocean have suffered dramatically from the impact of one of the world’s most destructive invasive species, the black rat, causing the loss of endemic terrestrial mammals and ongoing threats to ground-nesting birds. We use molecular genetic methods on both ancient and modern samples to establish the origins and minimum invasion frequencies of black rats on Christmas Island and the Cocos-Keeling Islands. We find that each island group had multiple incursions of black rats from diverse geographic and phylogenetic sources. Furthermore, contemporary black rat populations on these islands are highly admixed to the point of potentially obscuring their geographic sources. These hybridisation events between black rat taxa also pose potential dangers to human populations on the islands from novel disease risks. Threats of ongoing introductions from yet additional geographic sources is highlighted by genetic identifications of black rats found on ships, which provides insight into how recent ship-borne human smuggling activity to Christmas Island can negatively impact its endemic species.
The invasive black rat (Rattus rattus) has a well-documented history of negative impacts on indigenous island fauna at a global scale (Towns et al., 2006), e.g., Indian Ocean – (Cheke and Jones, 1987), Mediterranean – (Martin et al., 2000; Ruffino et al., 2009), Atlantic – (Angel and Cooper, 2006), Pacific – (Atkinson, 1977; Spennemann, 1997). In the Indian Ocean basin, transport of black rats has occurred over a long time frame (>4,000 years in north Africa, de Graaf and Black, 1981), in particular facilitated by a long history of human maritime movement around the western Indian Ocean and its major island groups (Tollenaere et al., 2010). Black rats have been implicated in extinction events in this region e.g., the Mascarene and Seychelles groups (Towns et al., 2006), as well as major impacts on human health through disease transmission, e.g., plague on Madagascar (Rahelinirina et al., 2018).
What makes the black rat a particularly dangerous disease threat is that it can both transmit diseases to other mammals and acquire disease it has never been exposed to previously. Together with the propensity for the black rat to both live with human populations (commensalism) and disperse through the agency of human trade and transport, the black rat represents a disease risk factor that should not be ignored. A further factor yet to be explored is the possibility that black rat populations, having expanded their ranges with the intensification of agriculture and worldwide shipping networks, now meet with the possibility for the suite of zoonotic diseases they carry to cross rat-host species boundaries and/or produce novel recombinant genotypes that neither rat-host has been exposed to. Common diseases known to infect black rats include Yersinia pestis (plague), Bartonella, Leptospirosis, Orientia tsutsugamushi (scrub typhus), Salmonella, and Hepatitis E (Kosoy et al., 2014). Novel recombinants of these or other diseases may pose risks to human populations if multiple black rat taxa come into contact outside of their native ranges (i.e., both on islands in the Indian Ocean as well as around the world).
Islands in the eastern Indian Ocean have been impacted by black rats for almost 200 years. Black rats colonized Direction Island (Pulu Tikus = Rat Island) in the Cocos-Keeling Islands (CCK) at some point between European discovery of the islands in 1643 (Gibson-Hill, 1949) and permanent human settlement in 1827 (Wood-Jones, 1909). This island group comprises 26 islands (total area ∼14 km2) in a southern (main) atoll and a single island (Pulu Keeling or North Keeling Island, 1.2 km2) situated 24 km north of the main atoll (see Supplementary Figure 1). Rats were identified as one of the major threats for the endemic CCK buff-banded rail, Gallirallus philippensis andrewsi (Stokes et al., 1984), which until recently survived only on the rat-free Pulu Keeling. In 2013, rails were successfully reintroduced to Horsburgh Island, the only rat-free island in the main atoll (Woinarski et al., 2016). Analysis of the extinction of native Rattus on Christmas Island (CXR) points to disease introduced by flea-carrying black rats as a contributing factor (Wyatt et al., 2008). These threats by black rats are also ongoing via people smuggling on small boats, with the landing of a vessel carrying asylum seekers on Pulu Keeling in 2012 sparking major concerns that rats could establish on this important seabird island.
Threats to wildlife from black rats are particularly severe on remote islands but are also a problem on offshore islands where introductions from mainland sources can occur more frequently. On the west coast of Australia, black rats have invaded at least 40 offshore islands impacting the native avian, mammalian, and reptilian fauna (Burbidge and Morris, 2002; Morris, 2002). With increased development of this coastal region by the mineral and energy sector, and an increase in ownership of private vessels for recreation, the opportunities for black rat movement are on-going (Burbidge and Morris, 2002) and present a constant threat of re-invasion at sites after successful eradication programs (Morris, 2002; Greenslade et al., 2013; Burbidge and Abbott, 2017). Thus, identification of potential re-invasion sources is an important step during the planning of eradication events (Abdelkrim et al., 2005). Or in the case of CCK, knowledge of dispersal patterns of rats between the islands in the main atoll may be critical in planning the eradication of this pest.
Earlier accounts of the identity of eastern Indian Ocean Rattus species were hamstrung by the lack of an adequate regional framework within which to assess island forms. Traditionally, differences in coloration were used to differentiate new species when this trait is now known to simply reflect natural variation within a species/subspecies (Tate, 1950; Musser and Califia, 1982; Pickering and Norris, 1996). For example, Wood-Jones (1909) suggested there were three races of rats present in the CCK. The “original” Direction Island rat from a ship in 1825, plus, a more destructive taxa, believed to be Mus decumanus (R. norvegicus) that was reportedly introduced, through shipwreck, in 1878, and the black rat (R. rattus), which was supposedly a later addition via trade or shipwrecks. The Direction Island form was subsequently described by Tate (1950) as a new subspecies, R. rattus keelingensis. Musser and Califia (1982) originally listed Rattus rattus keelingensis (found on Pulau Tikus in the Cocos-Keeling Islands) as a synonym of Rattus rattus diardii, which is included in R. tanezumi; Musser re-examined the holotype (collected in 1940) and part of the type series and now considers them introduced R. rattus (Wilson and Reeder, 2005). Recent genetic work supports Musser’s assertion, where early samples of rodents collected from CXR (in 1900 and 1903) were in fact found to belong to R. rattus (Wyatt et al., 2008). The situation is further complicated by the recent recognition that black rats comprise multiple evolutionary taxa in a putative species complex, R. rattus species complex: RrC (Pages et al., 2010; Aplin et al., 2011). Although based on mitochondrial DNA (mtDNA) only at present, the global survey of black rat diversity by Aplin et al. (2011) with more detailed regional information from Indo-China (Pages et al., 2010) and the western Indian Ocean and periphery (Pages et al., 2010; Tollenaere et al., 2010), provide a genetic framework to investigate the genetic diversity, origins of the source populations, and minimum number of dispersal or introduction events.
An assessment of black rat diversity in the eastern Indian Ocean is timely, as at least three black rat mtDNA groups (RrC I, II, IV) occur in the periphery of this region and the RrCI “ship-rat” group (sub-group within RrC I) has accessed the region from further afield via global shipping (Aplin et al., 2011). Here, we use phylogeographic analyses of mtDNA cytochrome b (cytb) nucleotide gene sequences and nuclear DNA data (Single Nucleotide Polymorphisms, SNPs) of contemporary material in a regional context to investigate the diversity and dispersal history of black rats in the eastern Indian Ocean focusing on CXR and CCK. We have enhanced the existing reference framework with additional sampling from around the world, especially from Indonesia and Australia, so that we can assess the diversity and history of black rats in this region. We also wanted to examine interactions between the mtDNA and nuclear genetic signals of these black rats to examine potential for hybridisation between RrC taxa in the novel environments of CXR and CCK. Lastly, we also attempted to date the arrival and potential population turnover of RrC on CXR by incorporating ancient DNA samples and comparing to both modern and historic samples (Wyatt et al., 2008).
We compiled a dataset of 553 modern black rats where we either generated mitochondrial DNA from tissue samples (n = 387), downloaded existing sequence from Genbank (n = 147), or requested from authors of other papers (n = 19), including from South-east Asia (n = 256), South Asia (n = 27), Africa (n = 43), the Americas (n = 31), Europe (n = 11), the Middle East (n = 20), Australia (n = 70), CCK (n = 45) and CXR (n = 50) (Tollenaere et al., 2010; Aplin et al., 2011) (see map in Figure 1). Details of all modern specimens analyzed along with GenBank accession numbers are presented in Supplementary Table 1. We also obtained mtDNA sequences from rat teeth and bones found in cave deposits on Christmas Island. Rat teeth (incisors or molars) and long bone samples (n = 48) were excavated from CXR from two caves, Sinkhole 1 (n = 15) and Runaway Cave (n = 33) – see Supplementary Figure 2. Radiocarbon dates were also generated from a range of rodent bone remains from Runaway Cave only, as no DNA could be obtained from the Sinkhole remains (see “Results” and Supplementary Table 2).
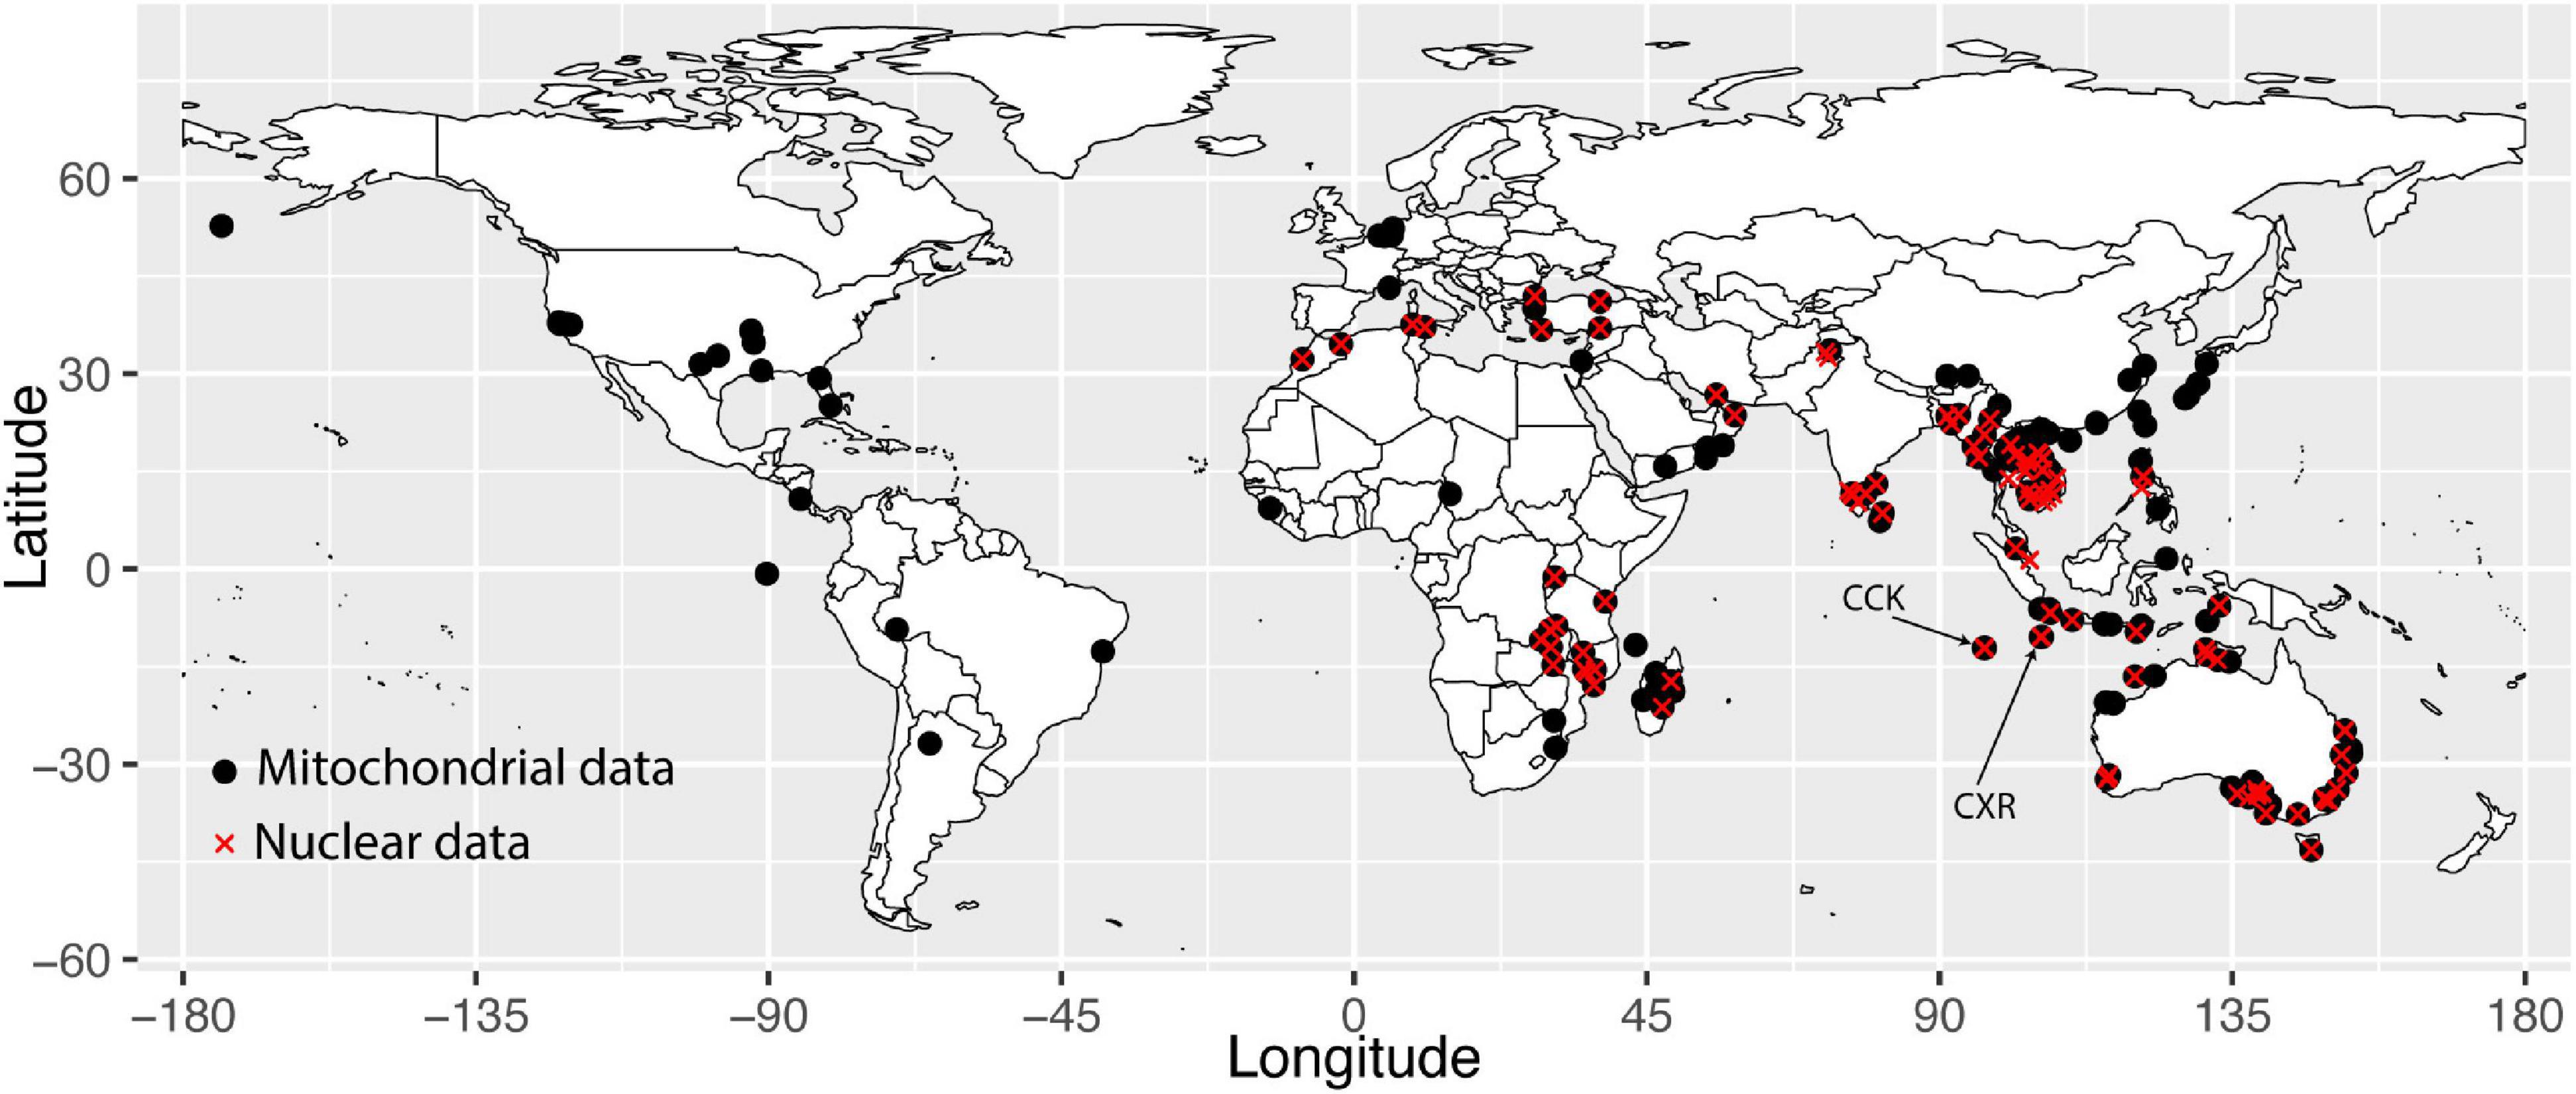
Figure 1. Map showing sample locations from this paper. Black circles represent samples sequenced for the cytb mtDNA gene, and red crosses represent samples sequenced for nuclear SNP markers.
For modern tissue samples, DNA was extracted from alcohol or RNALater® preserved liver, tail or ear with the Gentra Puregene DNA extraction protocol (QIAGEN) following the manufacturer’s instructions. Part of the mtDNA cytochrome b (cytb) gene was PCR amplified and directly sequenced from the modern samples following the methods in Aplin et al. (2011) with the primers LM1268 and HM1269 (see Supplementary Table 3). Chromatograms were edited, and sequences were aligned and trimmed to a common 945 bp in length in Geneious 7.1.21. Any samples that could be sequenced for at least 600 bp of the 945 bp were also included in the cytb network analysis where they represented a unique location. Initially, sequences were assigned to RrC groups within a framework of representative cytb sequences from Aplin et al. (2011). For each RrC mtDNA group identified from Aplin et al. (2011) as “RrC I,” “RrC II,” “RrC IV” (hereafter designated by “mtClade I,” “mtClade II,” and “mtClade IV”), we then generated median joining networks using PopART (Population Analysis with Reticulate Trees; Bandelt et al., 1999; Leigh and Bryant, 2015) to show the relationships among haplotypes (Supplementary Figures 3–5).
For ancient samples, DNA was extracted from the Christmas Island black rat dentaries/bones using the DNeasy Kit (Qiagen) with modification following procedure described in Thomson et al. (2014) in the ancient DNA lab at the Australian Centre for Ancient DNA (ACAD) at the University of Adelaide. Extraneous dirt was removed from the bones/teeth prior to entry into the ancient DNA lab but due to the small size of the bones/teeth, bleach was not used to decontaminate the samples. DNA was extracted from 48 samples and attempts were made to PCR amplify and sequence four small fragments of cytb using the primers listed in Supplementary Table 3 and PCR reaction conditions described in Louys et al. (2020). Re-amplification and re-sequencing were performed for each PCR for each specimen. PCR clean-up and Sanger sequencing were conducted at the Australian Genome Research Facility Ltd (Australia).
Nuclear SNPs were generated using a RAD-seq protocol modified from Poland et al. (2012) for a subset of the modern samples from the cytb dataset (n = 190). A two-enzyme restriction digest protocol (EcoRI and SphI) was used to generate a library consisting of DNA fragments with a forward primer and reverse primer on either end following the protocol of White et al. (2018). The raw Illumina NextSeq fastq.gz files were demultiplexed using GBSX v1.3 using the GBS option and allowing one mismatch in the barcode or enzyme cut site (Herten et al., 2015). Bbduk v36.32 and bbduk2 v36.32 were used to filter the data using the following parameters: chastity filtering, adapter trimming from the 3′ end of the reads, trimming of the restriction enzyme recognition cut site at the 5′ end of the reads, quality trimming to Q10 using the Phred algorithm, and then length filtering of all reads to 58 bp in length. The Stacks v1.40 “ustacks” program was run on each demultiplexed sample to form exactly matching stacks with a minimum depth of coverage of three required to form a stack (m = 3), a maximum of two mismatches between stacks to form homologous loci (M = 2), and a maximum of four mismatches between stacks when adding secondary reads (Catchen et al., 2013). The maximum number of stacks allowed at a single de novo locus was set at 3 (max_locus_stacks = 3) while the removal algorithm was used to drop highly repetitive stacks (and nearby errors) and the deleveraging algorithm was used to resolve over merged tags. The model type used to call homozygotes and heterozygotes was set to “bounded” with a lower bound of epsilon (error rate) of 0.0001 and an upper bound of 0.1.
A catalog (consensus set of loci) for each species was generated using the Stacks v1.40 “cstacks” program allowing five mismatches (n = 5) between different sample’s stacks when generating the catalog. The Stacks v1.40 “sstacks” program was used to map each sample’s stacks back against this catalog to assign consistent labeling on the homologous loci in all samples. The Stacks v1.40 “populations” program was then run on all samples, with only the first SNP in a marker being called, allowing a minimum minor allele frequency of 0.05, a maximum observed heterozygosity of 0.80 required to process a nucleotide site at that locus, and requiring at least 50% of samples to be called at a locus to retain a marker. The markers were output as a genepop file and the “Adegenet” package v2.1.5 in R (Jombart, 2008) was used to conduct prinicipal component analyses to examine the nuclear genetic relationships between the RrC mtDNA groups. Structure v2.3 (Pritchard et al., 2000), a model-based clustering methods, was used to investigate the species/population structure of each of the RrC mtDNA groups, using the admixture model and running for 100,000 generations with 20,000 generations removed as burnin, for k = 1–8 for five replicates each, with Clumpak used to process the file (Kopelman et al., 2015). Both the Pritchard method (likelihood of K; Pritchard et al., 2000) and Evanno method (delta K; Evanno et al., 2005) of evaluating optimal values of K were plotted in R. However, Evanno et al. (2005) finds that delta K is the better method for evaluating the most likely K when strong population structure is present and when sample and marker sizes are large; Pritchard et al. (2000) also recommend aiming for the smallest value of K that captures the major structure of the data, so we felt that the delta K method was the more appropriate post hoc method for selecting K for this dataset. The R package “PopGenome” v2.7.5 (Pfeifer et al., 2014) was used to generate diversity statistics for the modern cytb sequences.
The R package parallelnewhybrid (Wringe et al., 2016; based on the NewHybrids software of Anderson and Thompson, 2002) was used to examine the hybridisation history for the CXR and CCK Lineage IV samples (based on nuclear genetic signatures from PCA above) and infer an ancestral population from the other RrC Lineage IV samples in our dataset using 200 loci with the highest information content calculated with the R package snpReady v0.9.6 (Granato, 2021). Three replicates were run with these 200 loci for 1,000,000 sweeps and 300,000 burnin, with the posterior probabilities for each sample averaged across the replicates and the standard deviation calculated to confirm convergence of the replicate runs.
We found three of the RrC mtDNA groups defined by Aplin et al. (2011) on CXR (mtClade I, mtClade II, mtClade IV: mtDNA haplotypes are numbered from Supplementary Figures 3–5 and defined as “H, # of haplotype, -, MtClade,” e.g., “H1-I”). MtClade I (n = 2, haplotypes = 1; H41-I) was found in both a forest location and a building on CXR (but not elsewhere in our sampling locations, although it is two base pairs different to H40-I found on CCK; Supplementary Figure 3), while mtClade II (n = 2, haplotypes = 2; H48-II and H77-II; Supplementary Figure 4 and Table 1) was found in built up areas and on an asylum-seeker vessel on CXR, but also in Australia (H48-II) and Indonesia (H77-II). MtClade IV was by far the most numerous (n = 46, haplotypes = 2) and was found both in built up and forested areas (Supplementary Figure 5 and Table 1). The most common mtClade IV haplotype found on CXR (n = 43; H66-IV) is also found in Indonesia (Java and Sumba), and Vietnam, while the rarer mtDNA haplotype (n = 3; H1-IV) is also found in Indonesia, Singapore, and the Philippines (Supplementary Figure 5). Not surprisingly, the diversity of each of these mtClades on CXR were considerably lower than in our reference dataset, as well as those found on CCK (Table 1). There was also no evidence of significant demographic population expansions for either each CXR mtClade separately, nor for all the CXR samples taken together (non-significant Tajima’s D and Fu and Li’s F*, Table 1).
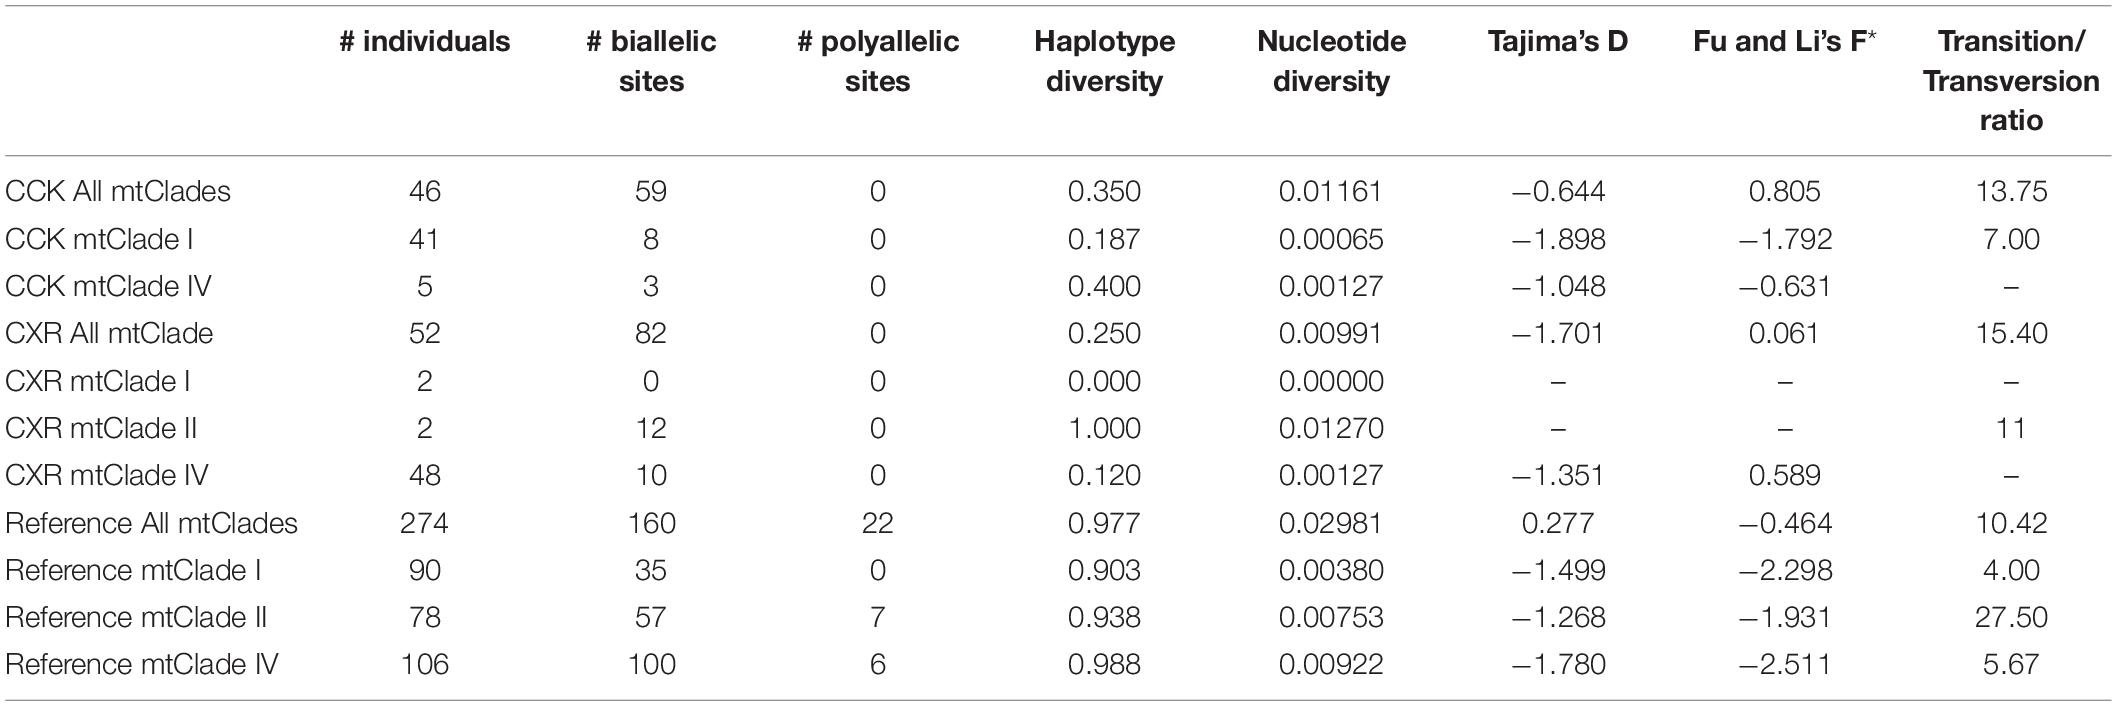
Table 1. Diversity statistics for the modern cytb dataset (945 bp).
Twenty-four of the 48 ancient teeth/bone samples yielded sequence from one or more of the cytb fragments, however, only four samples provided clean DNA sequence of the RrC without contamination (Supplementary Table 4). These four samples were only from the upper layers of Runaway Cave (TP1 20–30 cm below the surface), which dates to between 0–290 years ago and so are considered modern (Supplementary Table 2). Three of the four confirmed RrC samples were mtClade IV and the fourth sample was mtClade I (Supplementary Table 4). Additional rodent incisors were isolated from lower layers of Runaway Cave with older dates (TP1 70–80 cm deep, dated to 1564–1709 cal BP), however, no samples yielded DNA from this deep in the site. Three rodent teeth from Runaway Cave yielded R. macleari sequence (described elsewhere; from TP1 20–30 cm, TP1 40–50 cm, and TP2 20–40 cm layers). So, we cannot rule-out that the rodent incisors from the lowest layer (which did not yield DNA) were actually R. macleari.
When we compared the 30 samples from the CXR to those of mtClade I and mtClade IV groups from around the world (n = 153) using principal component analysis (PCA) and structure analysis for 32,568 loci, and hybridisation analysis using 78 samples (n = 29 from CXR; n = 47 from SE Asia) for the most informative 200 loci, we were able to identify the divergent nature of the CXR RrC samples.
In the PCA (Figure 2), the first principal component (PC1) generally separates RrC mtClade I samples from mtClade II and mtClade IV samples (Group 1 vs. Group 2), while PC2 separates CXR mtClade IV samples from mtClade II and mtClade IV samples from elsewhere. When we examine PC2 vs. PC3 (Figure 3), we see the separate ancestry of mtClade II vs. mtClade IV (native range for each mtClade is at maximum positive and maximum negative values of PC3, respectively). The major patterns (mtClade I: negative PC1; mtClade II: positive PC1 and negative PC2; mtClade IV: positive PC1 and both positive and negative PC2) appear to reflect the true nuclear backgrounds of these RrC taxa (hereafter designated by “Lineage”) previously only known from mtDNA heritage, based on knowledge of their home ranges (i.e., native range of mtClade I: India; native range of mtClade II: China/NW Laos/NW Thailand/NW Vietnam/Myanmar; native range of mtClade IV: Cambodia/SE Laos/SE Thailand/SE Vietnam; see Figure 4). All native range locations refer to those locations first established in Aplin et al. (2011) through mtDNA sequencing or by correlating these mtClades with known taxa (i.e., RrC LI = Rattus rattus = Oceanic R. rattus 2n = 38; RrC LII = Rattus tanezumi northern = Asian R. rattus 2n = 42; RrC LIV = Rattus tanezumi southern = Asian R. rattus 2n = 40) (Yosida, 1980; Aplin et al., 2003). When we compare the “mtClade” and nuclear “Lineages” of samples we observe both concordant mito-nuclear patterns, which we suggest represents traditional RrC taxa, and discordant mito-nuclear patterns, representing mtDNA capture/hybridisation.
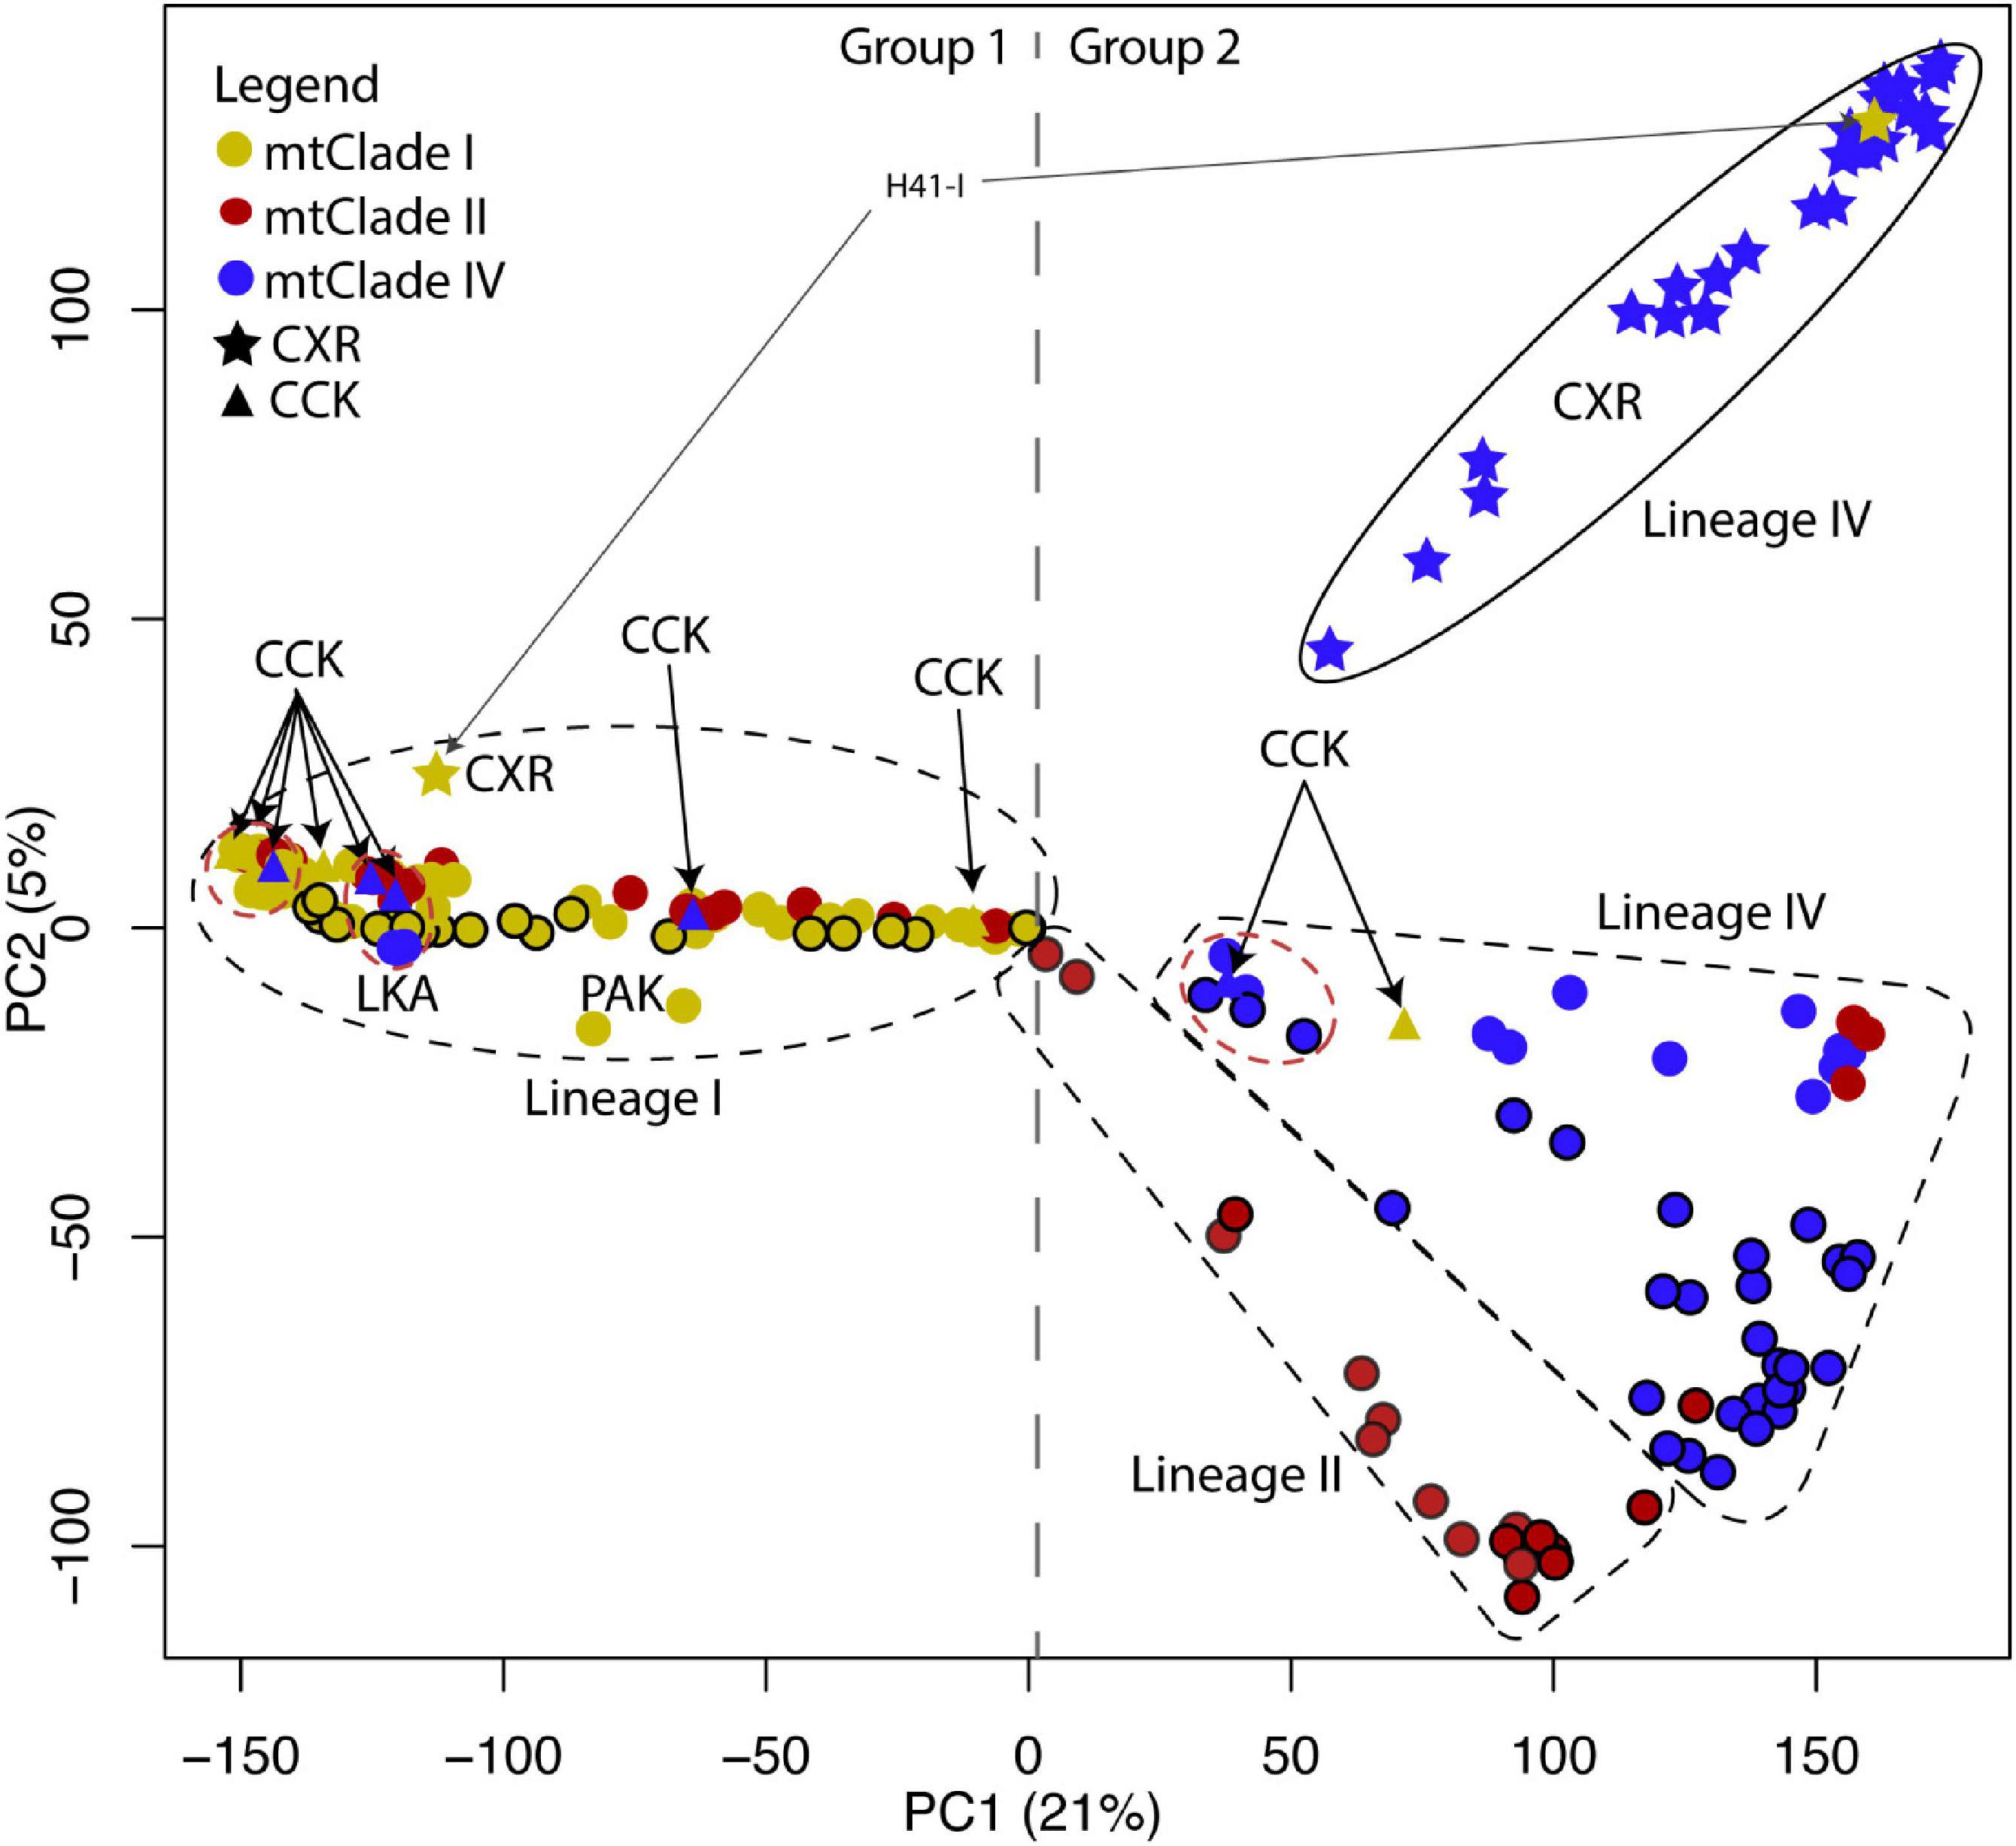
Figure 2. PCA of nuclear SNP marker dataset (showing PC1 vs. PC2). PC1 explains 21% of the variance and PC2 explains 5% of the variance. Colored circles represent the mtClades, with black outlines around circles indicating samples from the native range (i.e., has concordant mtClade/Lineage signatures). The position (and dashed shapes) in PC1 and PC2 represent the nuclear background—LIV samples from their native range are more likely to represent concordant mtClade IV/Lineage IV samples, LII samples from their native range more likely represent concordant mtClade II/Lineage II samples, LI samples from their native range are more likely to represent mtClade I/Lineage I samples. The divergent Christmas Island LIV samples are outlined in an oval in the upper right-hand side of the figure. The dashed gray vertical line shows where the divide between Group 1 and Group 2 samples identified in the Structure analysis (Figure 5). The dashed red outline represents mostly introduced range Lineage IV samples that may include the source population of at least one of the CCK Lineage IV samples.
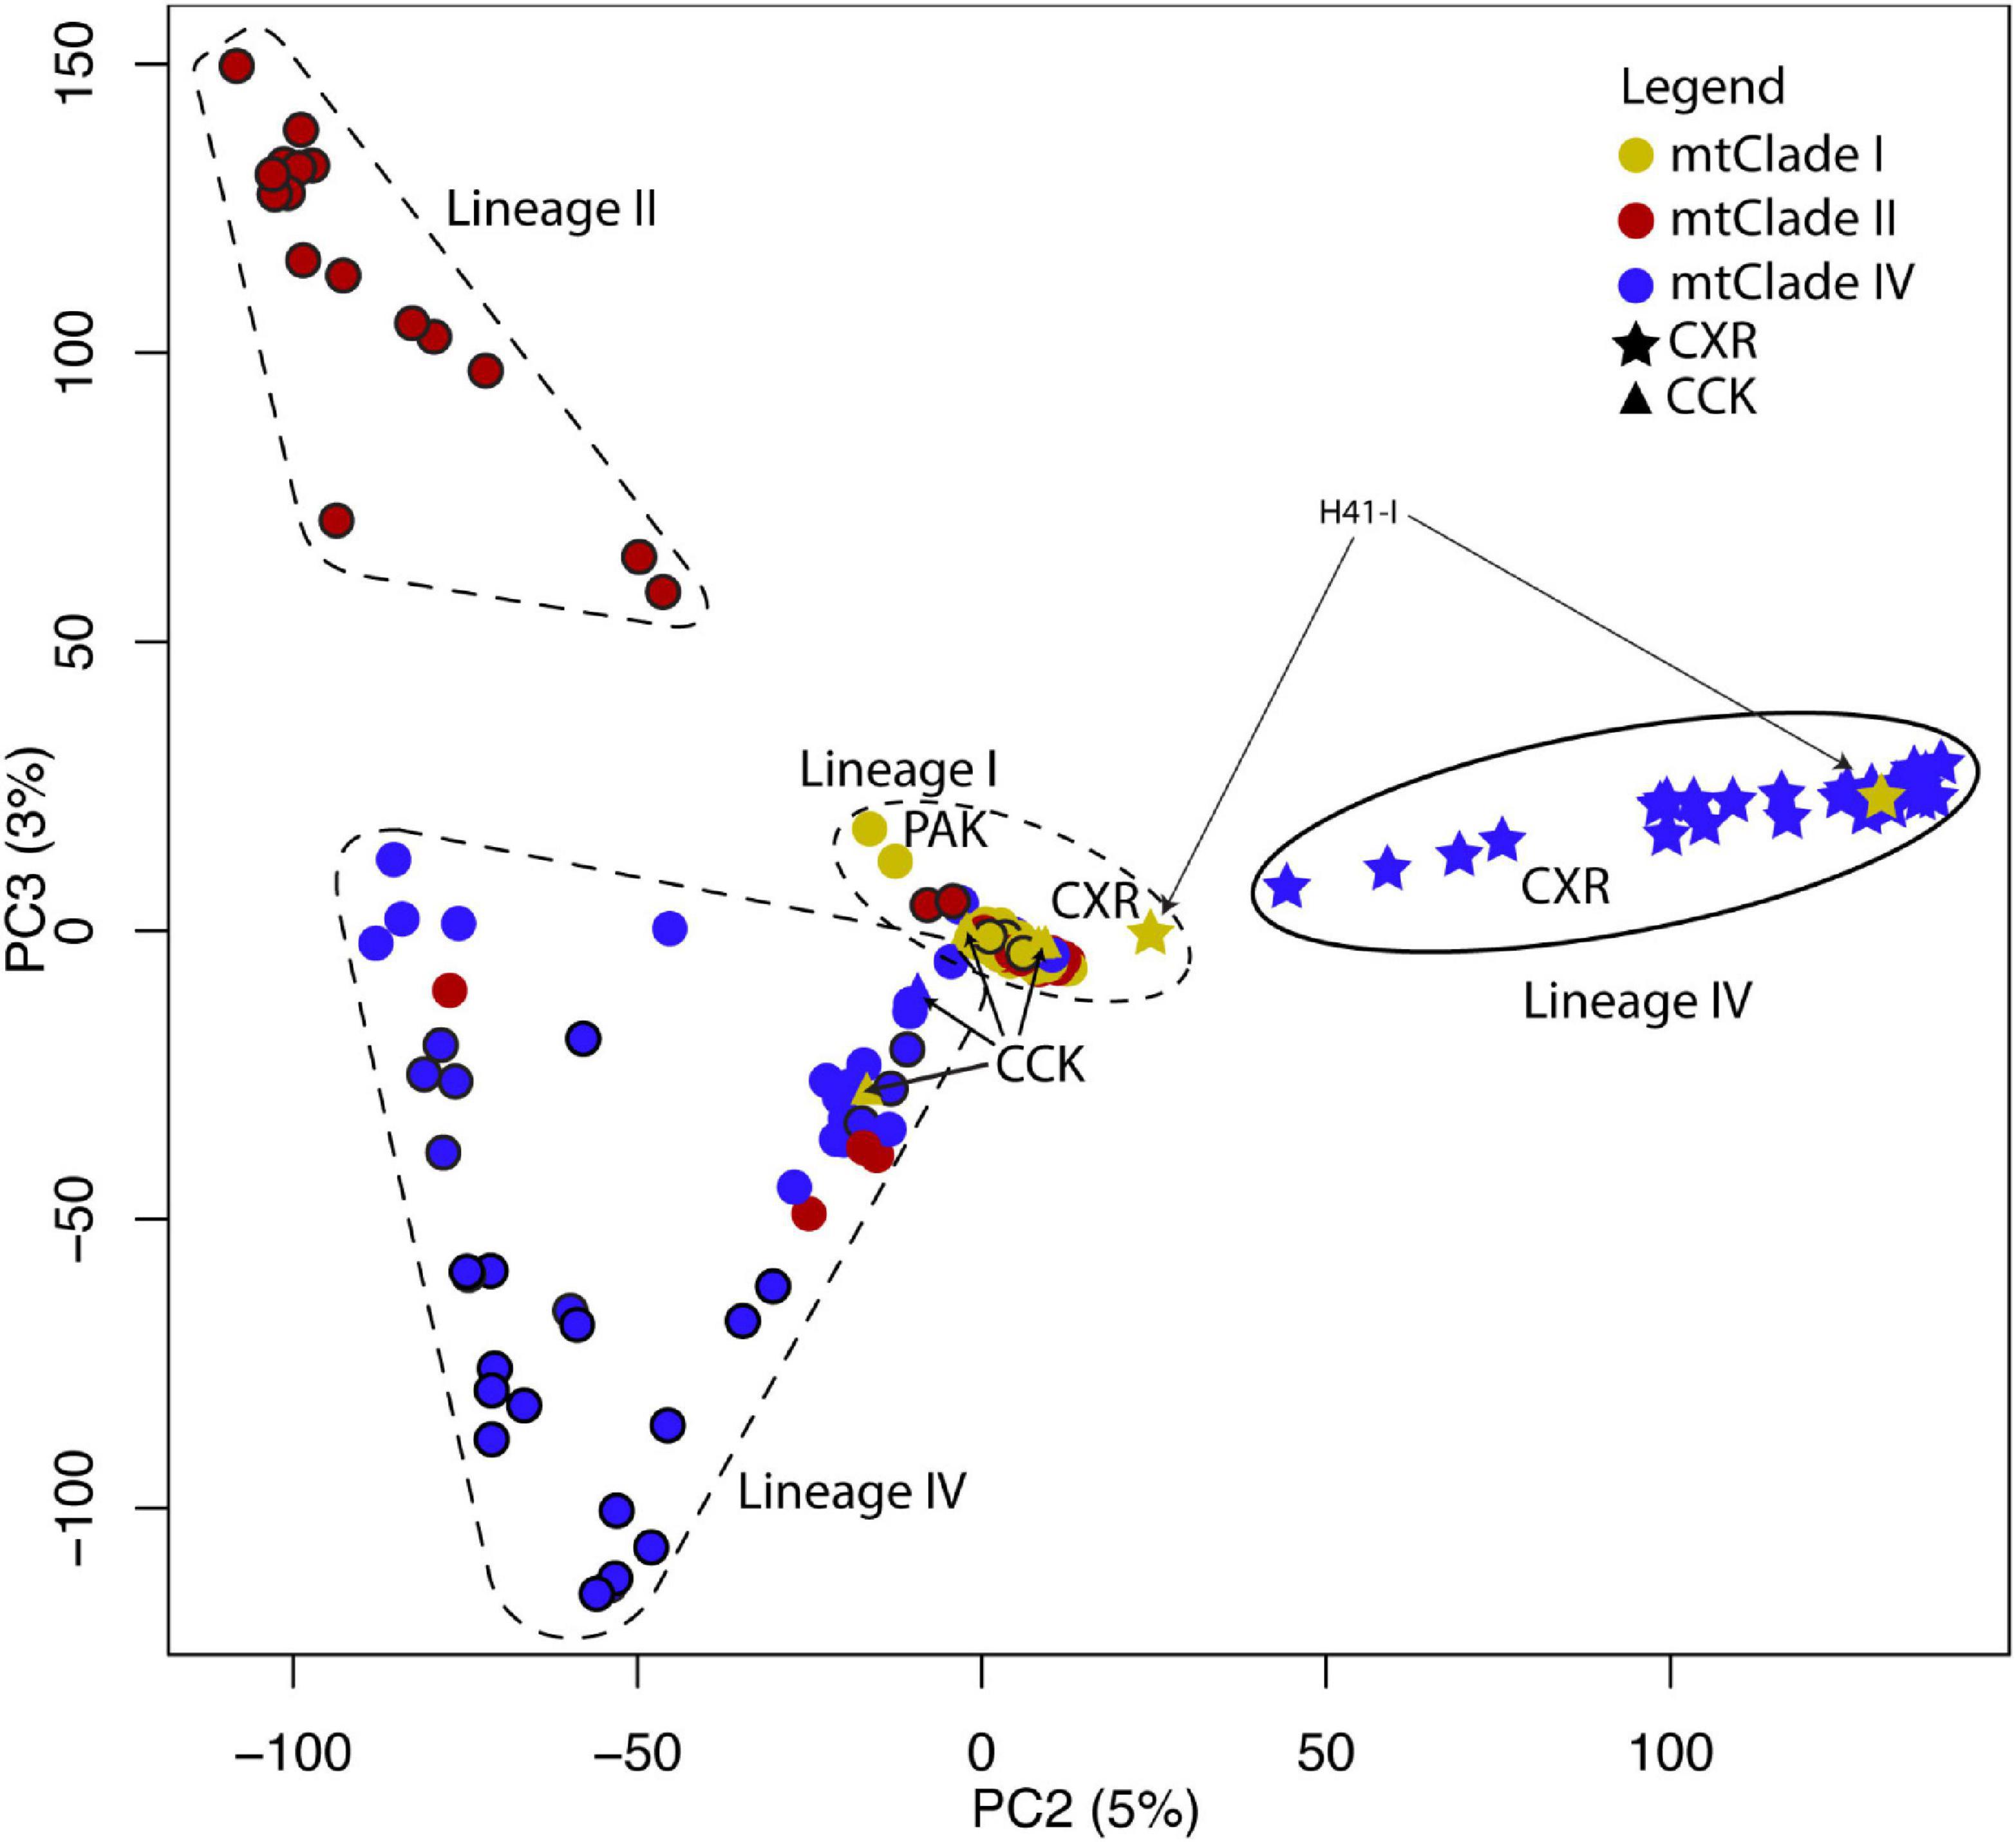
Figure 3. PCA of nuclear SNP marker dataset (showing PC2 vs. PC3). PC2 explains 5% of the variance and PC3 explains 3% of the variance. Colored circles represent the mtClades, with black outlines around circles indicating samples from the native range (i.e., has concordant mtClade/Lineage signatures). The position (and dashed shapes) in PC2 and PC3 represent the nuclear background—LIV samples from their native range are more likely to represent concordant mtClade IV/Lineage IV samples, LII samples from their native range more likely represent concordant mtClade II/Lineage II samples, LI samples from their native range are more likely to represent mtClade I/Lineage I samples. The divergent Christmas Island LIV samples are outlined in an oval in the middle right-hand side of the figure.
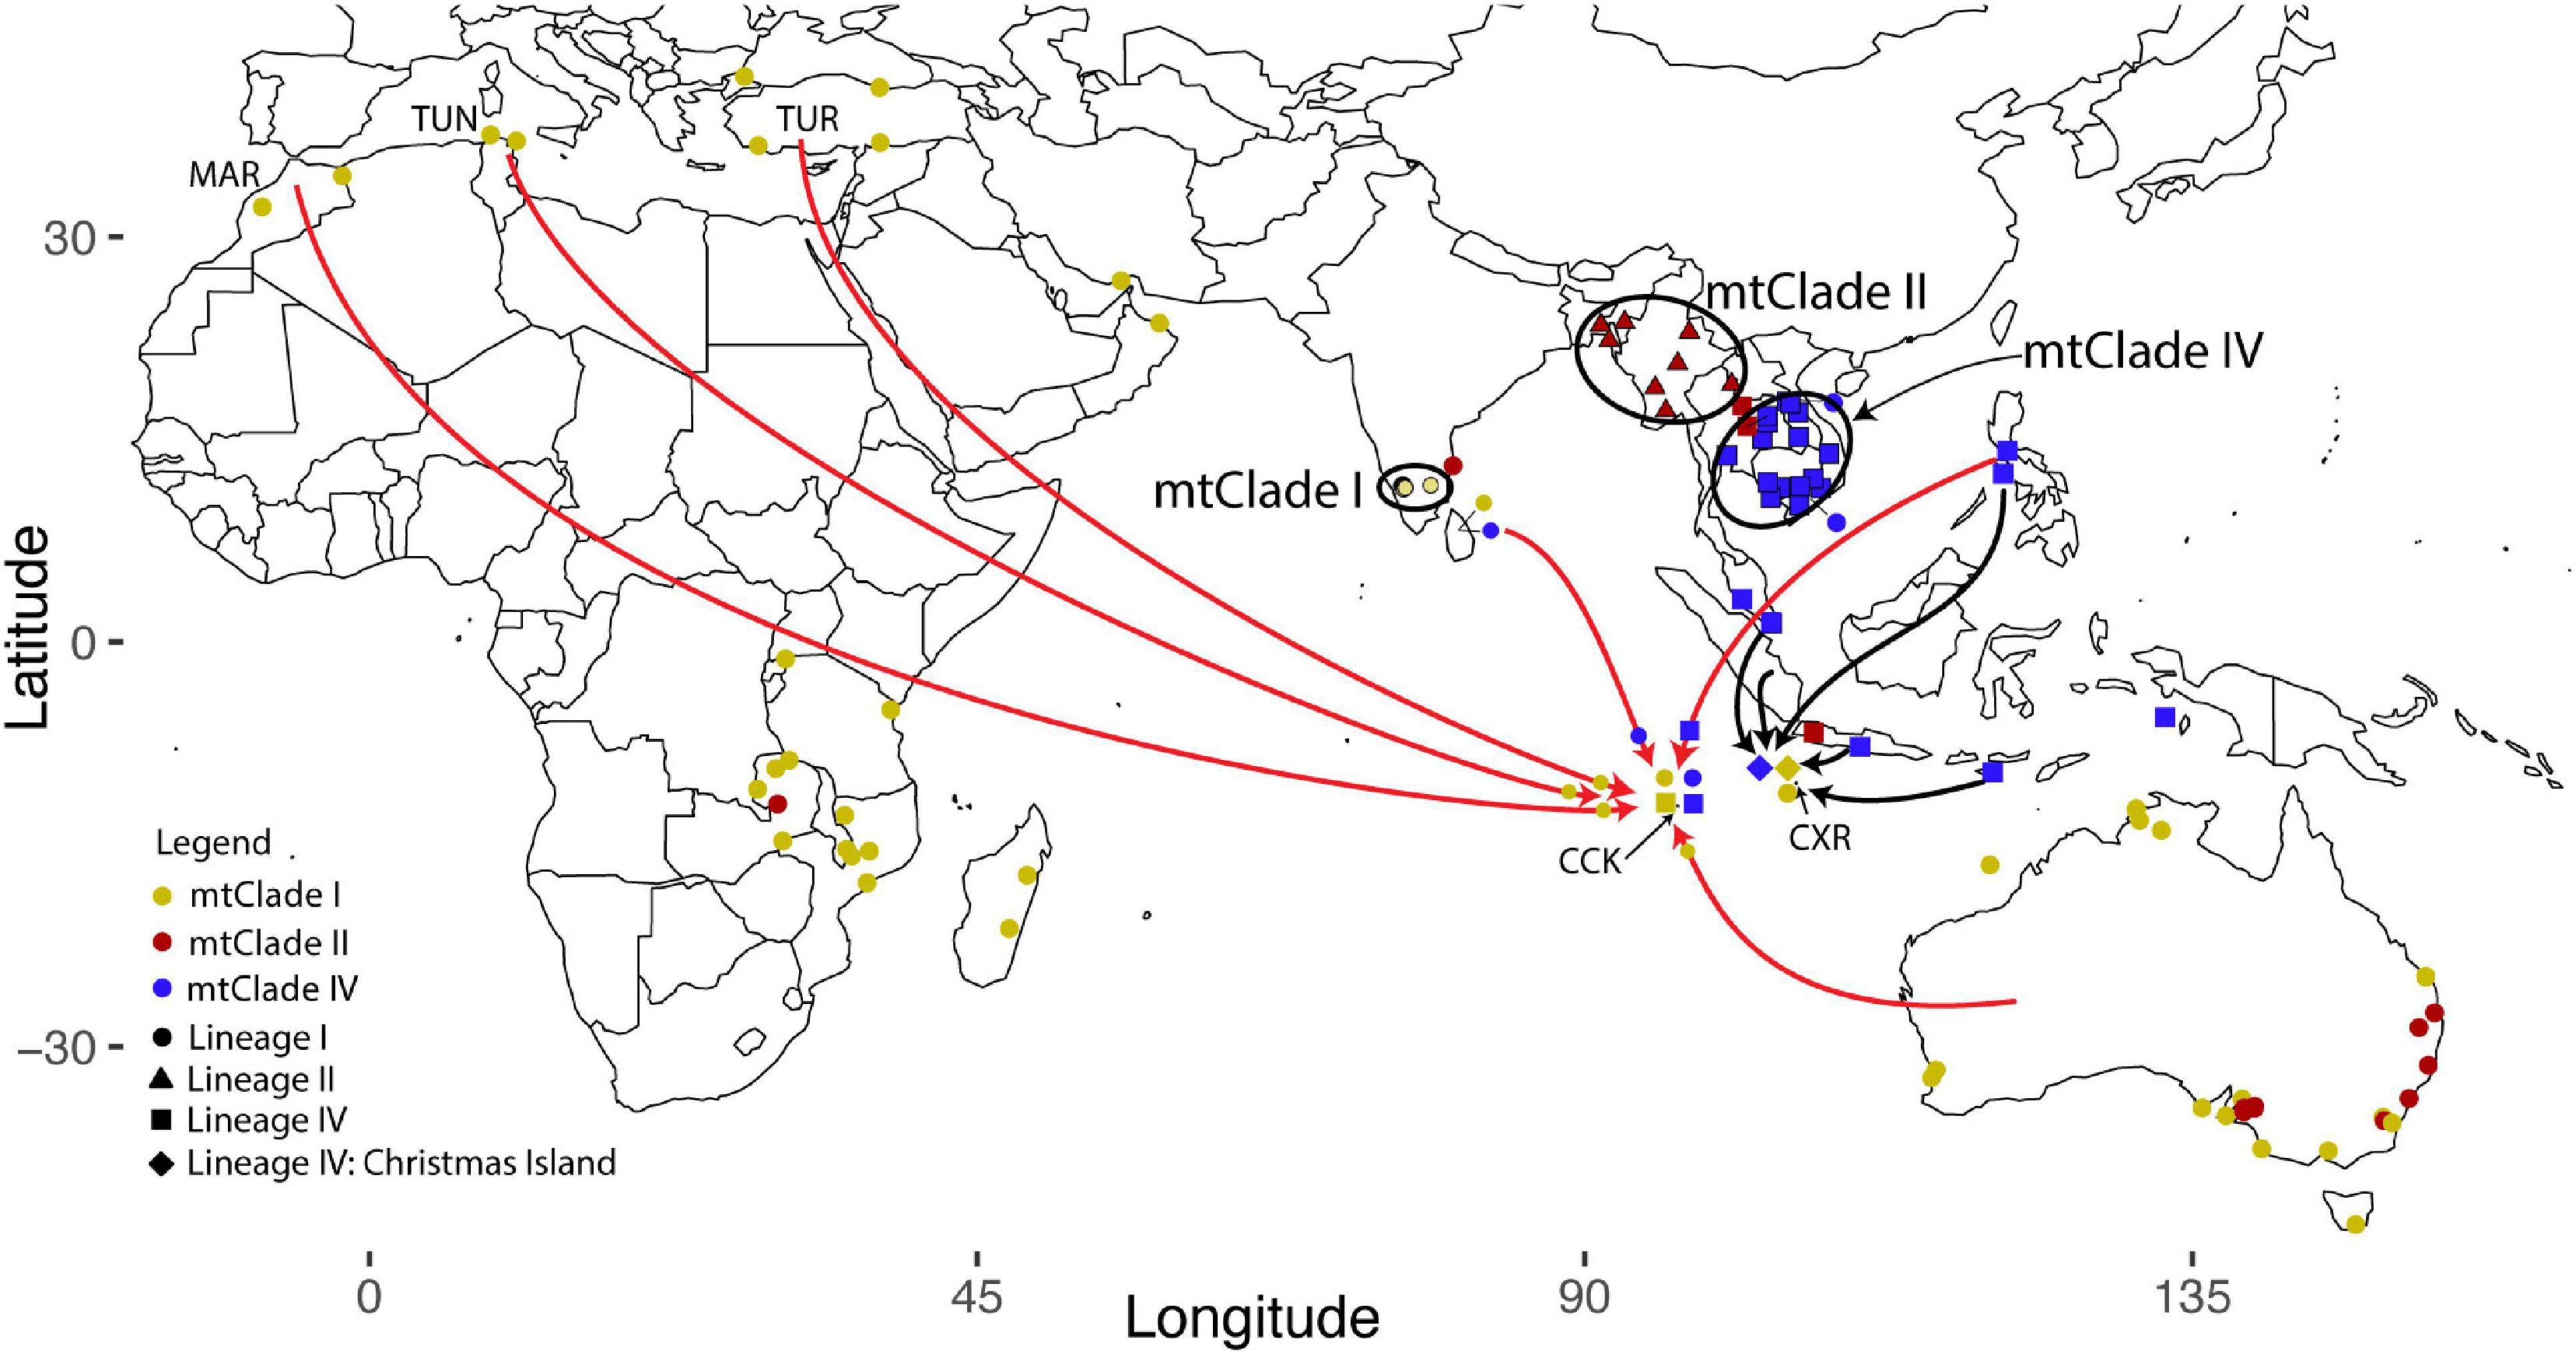
Figure 4. Map showing samples sequenced for both the cytochrome b mtDNA gene and the nuclear SNP markers. Colors represent the mtDNA signals (mtClades) and shapes represent the nuclear signals (Lineages). The black ovals outlining the shapes represent concordant mtClade/Lineage samples (and so represent the native ranges of these RrC taxa). Arrows indicate possible sources of rodents on CCK and CXR based on similarities in either mtClade haplotypes and/or nuclear Lineages (as discussed in the text). The black arrows represent evidence from purely “mtClade” information, the red arrows represent evidence from both “mtClade” and nuclear “Lineage” information. The red arrows have a symbol near their head that represents the “mtClade” (color) and “Lineage” (shape) of the link between the source and sink population.
Looking closely at the 30 CXR samples where we generated nuclear SNP data (n = 28 with mtClade IV and n = 2 with mtClade I), we see that all of the mtClade IV and one of the mtClade I samples form their own divergent sub-group (positive PC1 and positive PC2 values in PCA in Figure 2). When we removed this divergent CXR Lineage IV group and re-ran the PCA (Supplementary Figure 6), we see the same separation of mostly concordant mtClade I/Lineage I (Group 1) vs. mostly concordant mtClade II/Lineage II and mtClade IV/Lineage IV (Group 2) in PC1. In PC2 we also see a separation of mostly concordant mtClade II/Lineage II vs. mostly concordant mtClade IV/Lineage IV, suggesting that the mtClade IV/Lineage IV (non-CXR) is a real lineage and not purely an artifact of the divergent CXR mtClade IV/Lineage IV being present in the PCA analysis (Figure 2). When we examine the mtClade I samples from CXR, we see that similar to the divergent nature of the Lineage IV CXR samples, the one mtClade I/Lineage I CXR sample has a much higher PC2 value than all other Lineage I samples, suggesting that it also might have been subject to isolation and genetic drift on CXR since colonization of the island. When we examine the discordant mtClade I/Lineage IV CXR sample (ABTC136477 from Pink House that falls with the concordant mtClade IV/Lineage IV samples from CXR in the PCA in Figure 2), we note that it shares a rare mtClade haplotype (HAP 41-I) with the concordant mtClade I/Lineage I CXR sample, suggesting mtDNA capture of this rare mtClade I haplotype likely occurred on CXR.
The structure analysis of all the RAD-seq samples (Figure 5A) showed the most likely clustering as K = 2 (see Supplementary Figure 7 for delta K plot, although see Supplementary Figure 8 for the contrasting probability of K plot), which supports the main split in PC1 from the PCA, with mtClade I (Group 1) showing a separate ancestry from mtClade II/IV (Group 2). When we removed Group 1 and re-ran the structure analysis [recommended by Evanno et al. (2005) to identify lower hierarchical levels of population structure], we found the most likely clustering as K = 3 or 5 (depending on whether delta K or probability of K was used; see structure plots in Figures 5B,C; Supplementary Figure 9 for delta K plot and Supplementary Figure 10 for probability of K plot). In the K = 3 structure plot (Figure 5B), the divergent nature of the CXR Lineage IV samples is clear, as they form a separate sub-group compared to Lineage II and the rest of Lineage IV. However, we can also gain some insights as to source populations of the CXR Lineage IV samples from the K = 5 structure analysis of Group 2: the main other ancestry (green portion of the CXR samples in Figure 5C) reflected ancestry from introduced range locations of Lineage IV. This suggests that gene flow between Indonesia, Malaysia, the Philippines, or Singapore to CXR may have occurred.
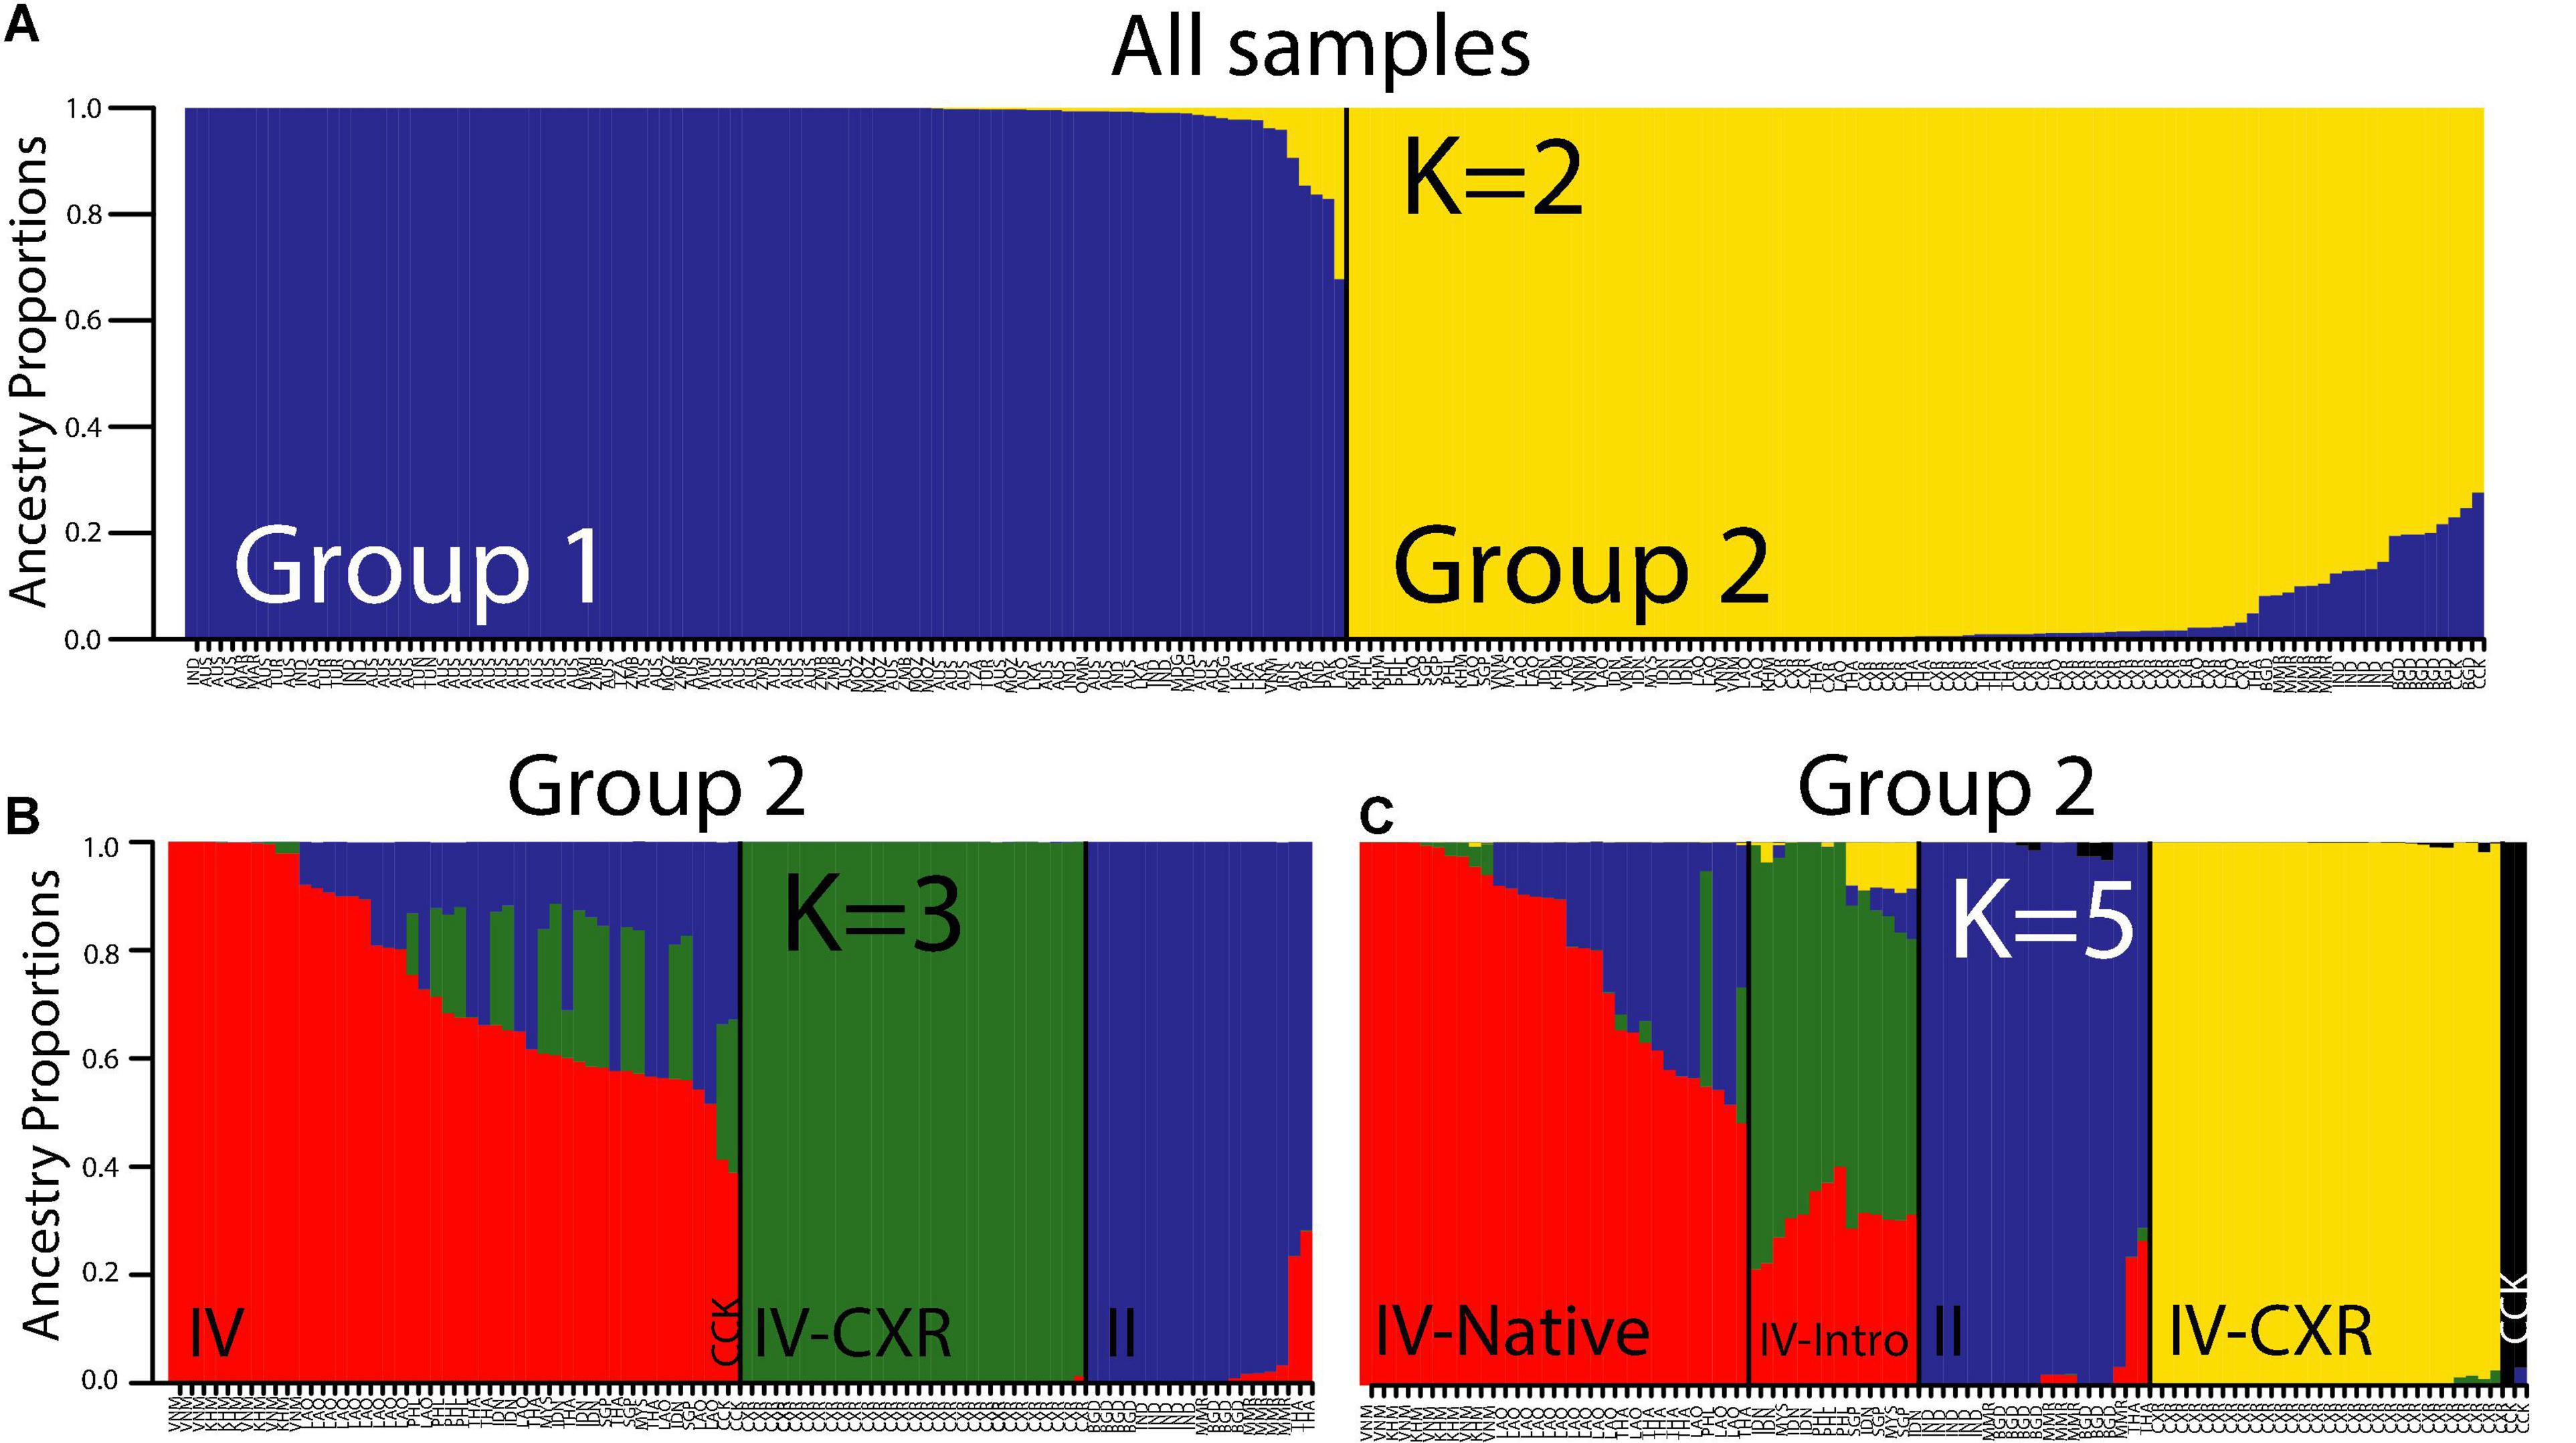
Figure 5. Structure analysis for the nuclear SNP marker (RAD-seq) dataset for (A) all samples; (B) K = 3 using the nuclear SNP marker dataset for Group 2 identified in (A); and (C) K = 5 using the nuclear SNP marker dataset for Group 2 identified in (A). Each bar represents a sample, and each color represents an ancestral group. The main split in (B) represents Lineage IV from CXR vs. Lineage II (mito-LII/nuc-LII from native ranges, i.e., Bangladesh [n = 7], India [n = 5], Myanmar [n = 5], Thailand [n = 2]) vs. Lineage IV from both native and introduced range (Lineage IV from Cambodia [n = 5], Laos [n = 14], Thailand [n = 6], Vietnam [n = 6] and the Philippines [n = 1], CCK [n = 2], Indonesia [n = 6], Malaysia [n = 2], the Philippines [n = 3], Singapore [n = 3]). The two CCK samples are labeled. The main split in (C) represents Lineage IV from Christmas Island vs. Lineage IV from CCK vs. Lineage II (mtClade II/Lineage II from native ranges, i.e., Bangladesh [n = 7], India [n = 5], Myanmar [n = 5], Thailand [n = 2]) vs. native range Lineage IV (Lineage IV from mainly native range locations, i.e., Cambodia [n = 5], Laos [n = 14], Thailand [n = 6], Vietnam [n = 6] and the Philippines [n = 1]) vs. Lineage IV from introduced range locations (i.e., Indonesia [n = 6], Malaysia [n = 2], the Philippines [n = 3], Singapore [n = 3]).
We wanted to investigate gene flow between the Lineage IV populations identified in our PCA and structure analyses, so we conducted hybridisation analyses (Figures 6A,B). Samples with pure population 1 ancestry identified in our hybridisation analysis (labeled “Pure 1” in Supplementary Table 5, Figure 6B) are from Cambodia, Laos, and Vietnam (all native range for the RrC LIV taxon). All the samples with pure population 2 ancestry were from Christmas Island, which suggests that either we have not sampled the core range of this taxa or it represents the sole remaining location of this lost taxa. No first generation “F1” hybrids were identified in our samples, nor were any backcrosses with “Pure 2” hybrids (labeled “Backcross 2” in Figure 6B).
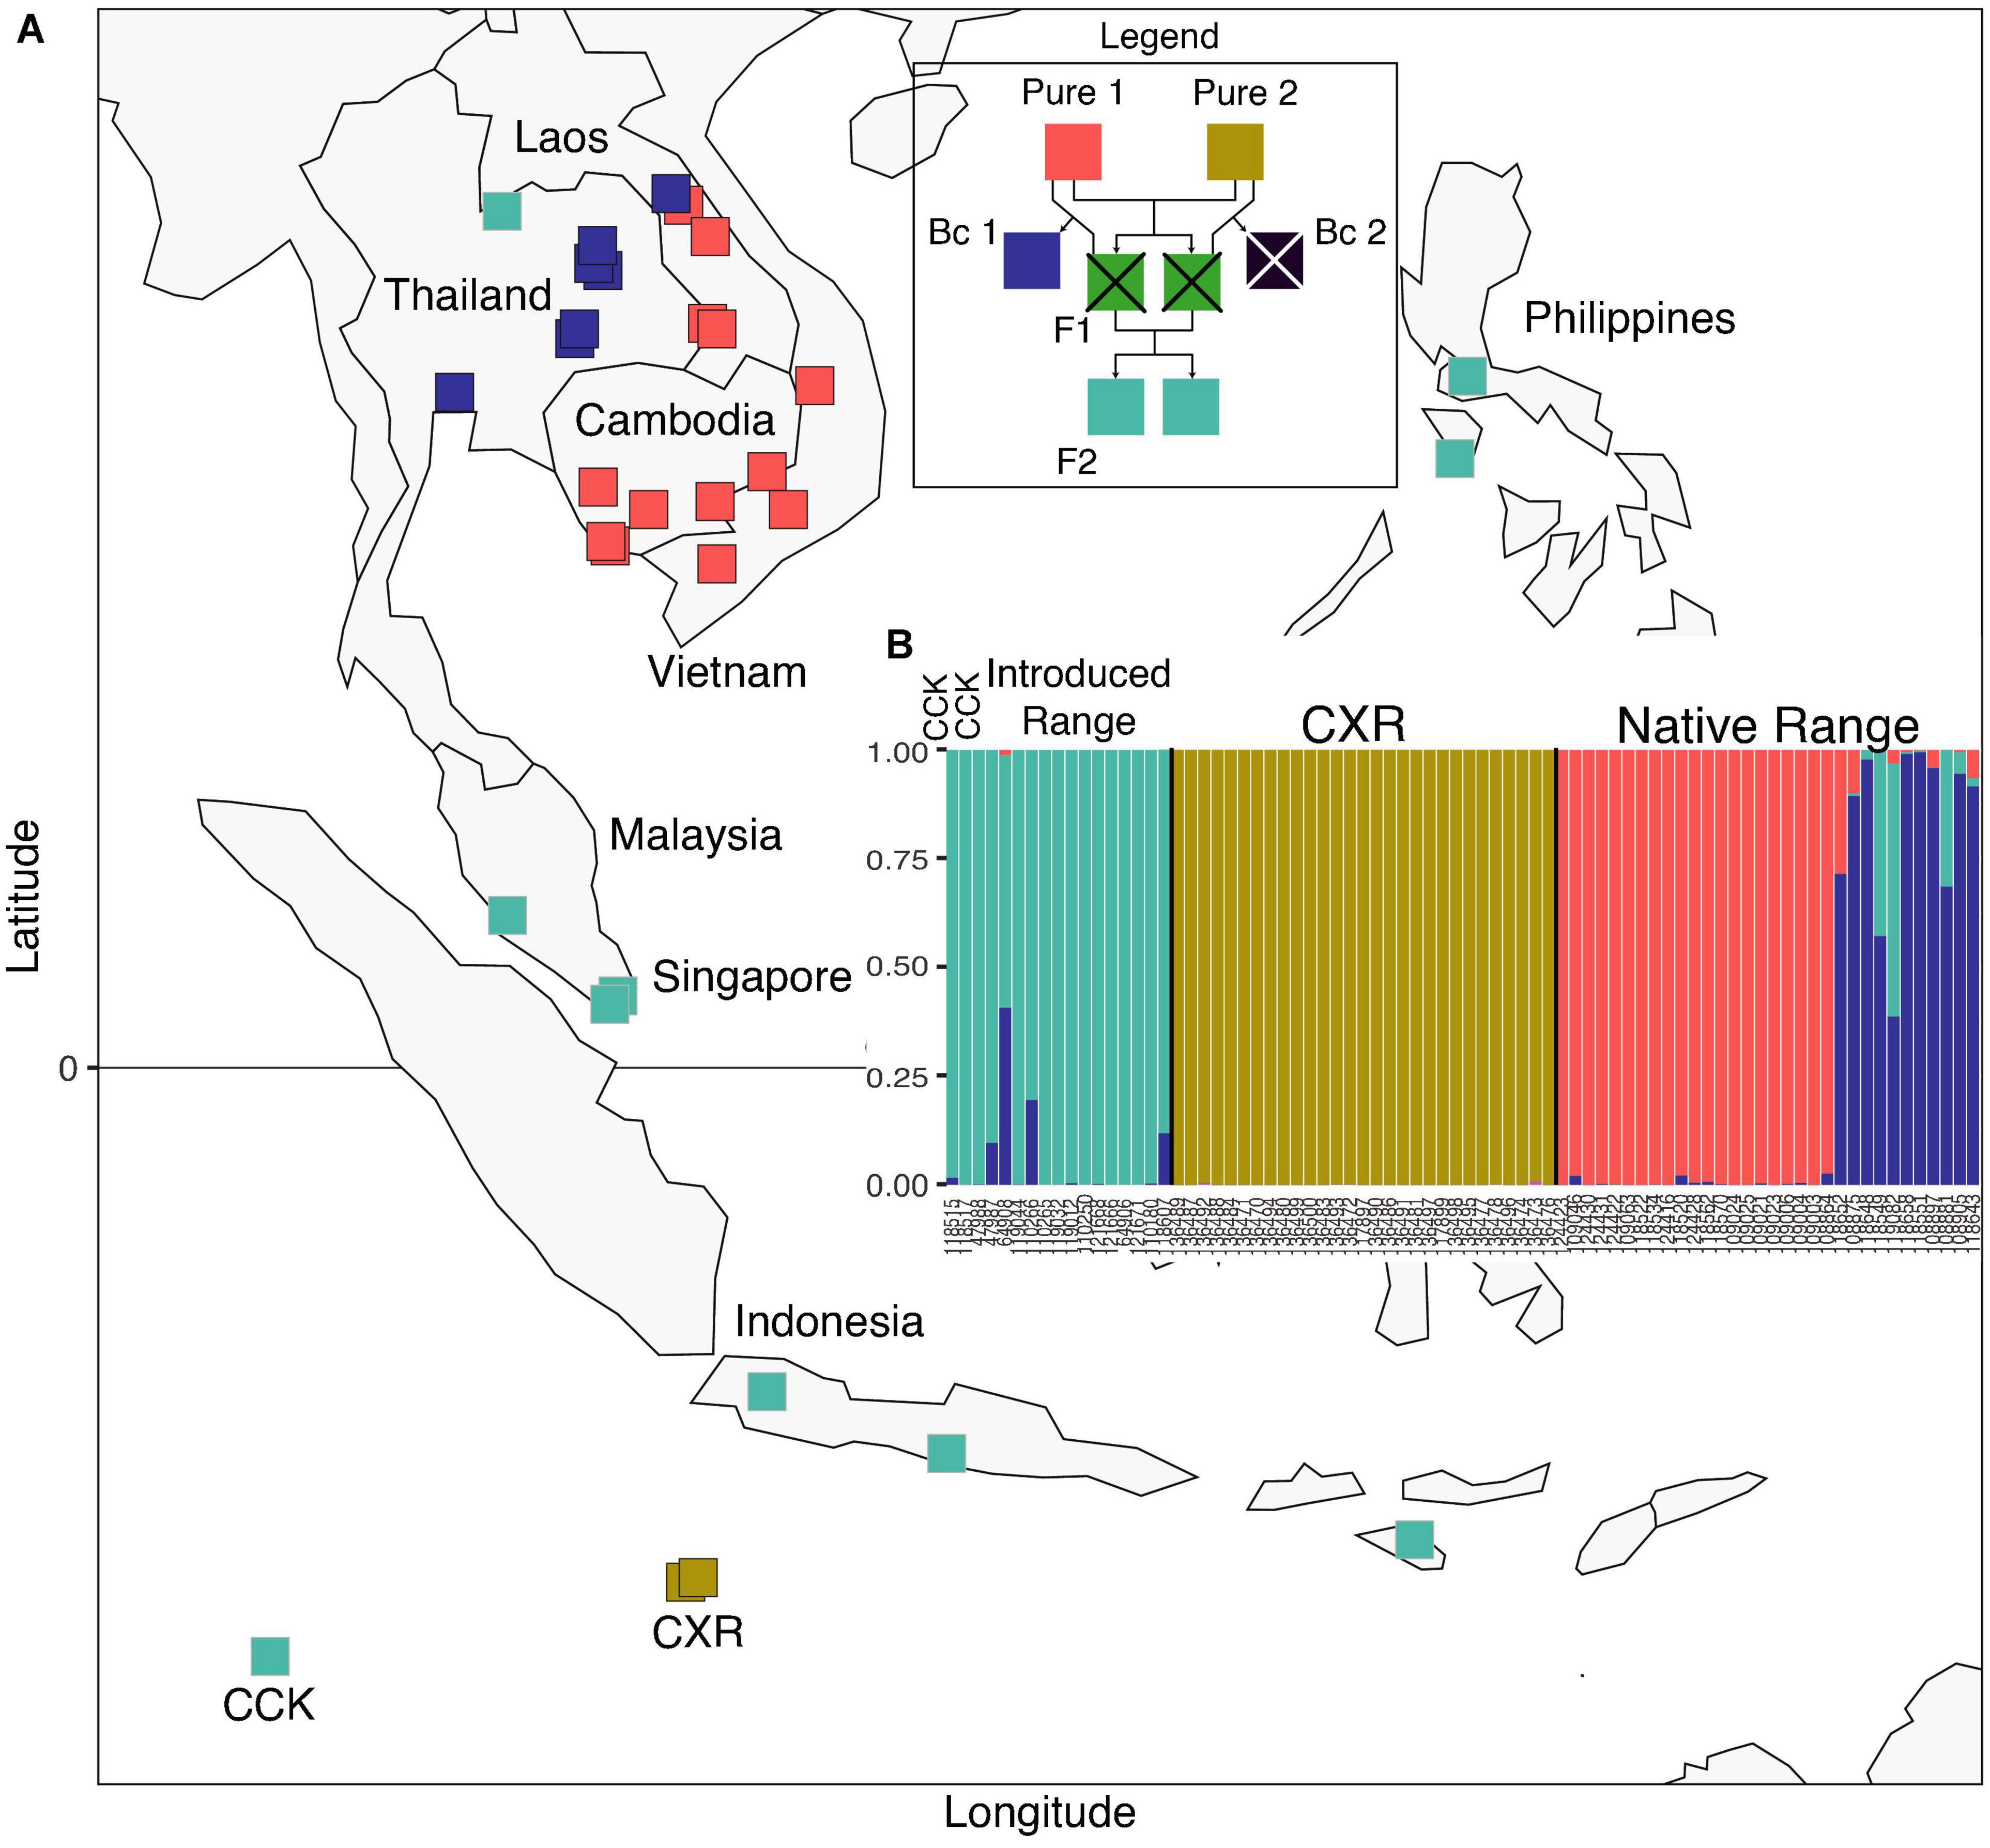
Figure 6. Hybridisation analysis with (A) map showing the sample locations with pure 1 ancestry, pure 2 ancestry, backcross 1 ancestry, and F2 ancestry (legend shows how each of these types of hybrids are related); and (B) plot showing hybridisation ancestry for nuclear SNP marker dataset for those samples with Lineage IV nuclear signatures (Group 2 identified in Figure 5 but excluding Lineage II). Each bar in (B) represents a sample, and each color represents a hybridisation type (crossed out hybridisation types in the legend represents those absent from the dataset).
We identified 40 mtClade I sequences on four islands of CCK, belonging to four haplotypes: H1-I, H15-I, H35-I, and H40-I. They were found on Direction Island (n = 1; H1-I), Home Island (n = 22; H1-I), South Island (n = 5; H1-I), and West Island (n = 12; H1-I, n = 8; H15-I, n = 1; H35-I, n = 1; H40-I, n = 2; Supplementary Figure 1). These mtClade I haplotypes were also found in Australia (H1-I, H15-I), Guinea (H1-I), Tunisia (H1-I), Morocco (H1-I), the Netherlands (H1-I, H35-I), Sri Lanka (H35-I), Turkey (H1-I), and the United States (H1-I; Supplementary Figure 3). In fact, the most common haplotype (H1-I) is the basal haplotype of the original “ship rat” sub-group, first identified in Aplin et al. (2011) as the likely RrC group brought to Europe and many European colonies along shipping routes. We expanded the geographic sampling and found this “ship rat” sub-group worldwide (in Australia, Argentina, Brazil, Costa Rica, Ecuador, France, Guinea, Iran, Israel, Morocco, Netherlands, Tunizia, Turkey, and United States; see Supplementary Figure 3). The geographic sampling that we added to the mtClade I dataset also identified a second “ship rat” sub-group that was found in a more limited set of worldwide locations (Australia, Comoros, India, Indonesia, Malawi, Mozambique, Oman, Tanzania, United States, and Yemen; see Supplementary Figure 3). Not surprisingly, the more basal and central haplotype nodes of this “ship-rat 2” sub-group were found in India (home range of mtClade I).
Five mtClade IV sequences (haplotypes = 2) were found across two islands: Direction Island (n = 1) and West Island (n = 4) (Supplementary Figure 5). The most common mtClade IV haplotype (n = 3, H6-IV) is also found in Sri Lanka, while the rarer mtDNA haplotype (n = 1; H4-IV) is not found elsewhere amongst our sampling locations (Supplementary Figure 5). Not surprisingly, the diversity of each of these mtClades were also considerably lower than in our reference dataset but higher than those found on CXR (Table 1). There was also no evidence of significant demographic population expansions for either each CCK mtClade separately, nor for all the CCK samples taken together (non-significant Tajima’s D and Fu and Li’s F*, Table 1).
When we compared the nuclear dataset for the 11 CCK samples to those of mtClade I and mtClade IV groups from around the world (n = 153) using principal component analysis (PCA) and structure analysis for 32,568 loci, we were able to see distinct patterns that help identify the likely source location from where the CCK RrC originated.
There are approximately even numbers of concordant and discordant mito-nuclear RrC samples found on CCK. From the 11 samples, five were found to be concordant mtClade I/Lineage I with one concordant mtClade IV/Lineage IV sample, and five samples had discordant mito-nuclear patterns (one mtClade I/Lineage IV and four mtClade IV/Lineage I). The only discordant mito-nuclear sample without nearby samples on the PCA (Figure 2) is the mtClade I/Lineage IV CCK sample (ABTC118517 from Direction Island), which has a PC1 value half-way in between the cluster that includes the mtClade IV/Lineage IV sample from CCK (ABTC118515 from Direction Island)/Philippines/Cambodia/Malaysia (i.e., mostly introduced range for the RrC LIV taxon) vs. the other mtClade IV/Lineage IV samples from Vietnam, Thailand, Laos, Philippines, Malaysia, and Singapore (i.e., mostly native range for the RrC LIV taxon). When we examine the other discordant mito-nuclear samples, we find the four mtClade IV samples that cluster with what is otherwise considered a Lineage I background (ABTC123583, ABTC127862, ABTC130621, and ABTC137789) are all from West Island and they fall with samples from other locations on the PCA (Australia, multiple countries in Africa, the Middle East, and South Asia; summarized in Table 2), suggesting these locations might be the source of these mismatched samples (i.e., the rats arrived with the discordant mito-nuclear genome from an introduced range location). These results highlight how mtDNA capture of both mtClade I and mtClade IV by the other nuclear background is quite common (5/11 = 46% of the CCK samples are discordant mito-nuclear RrC samples).
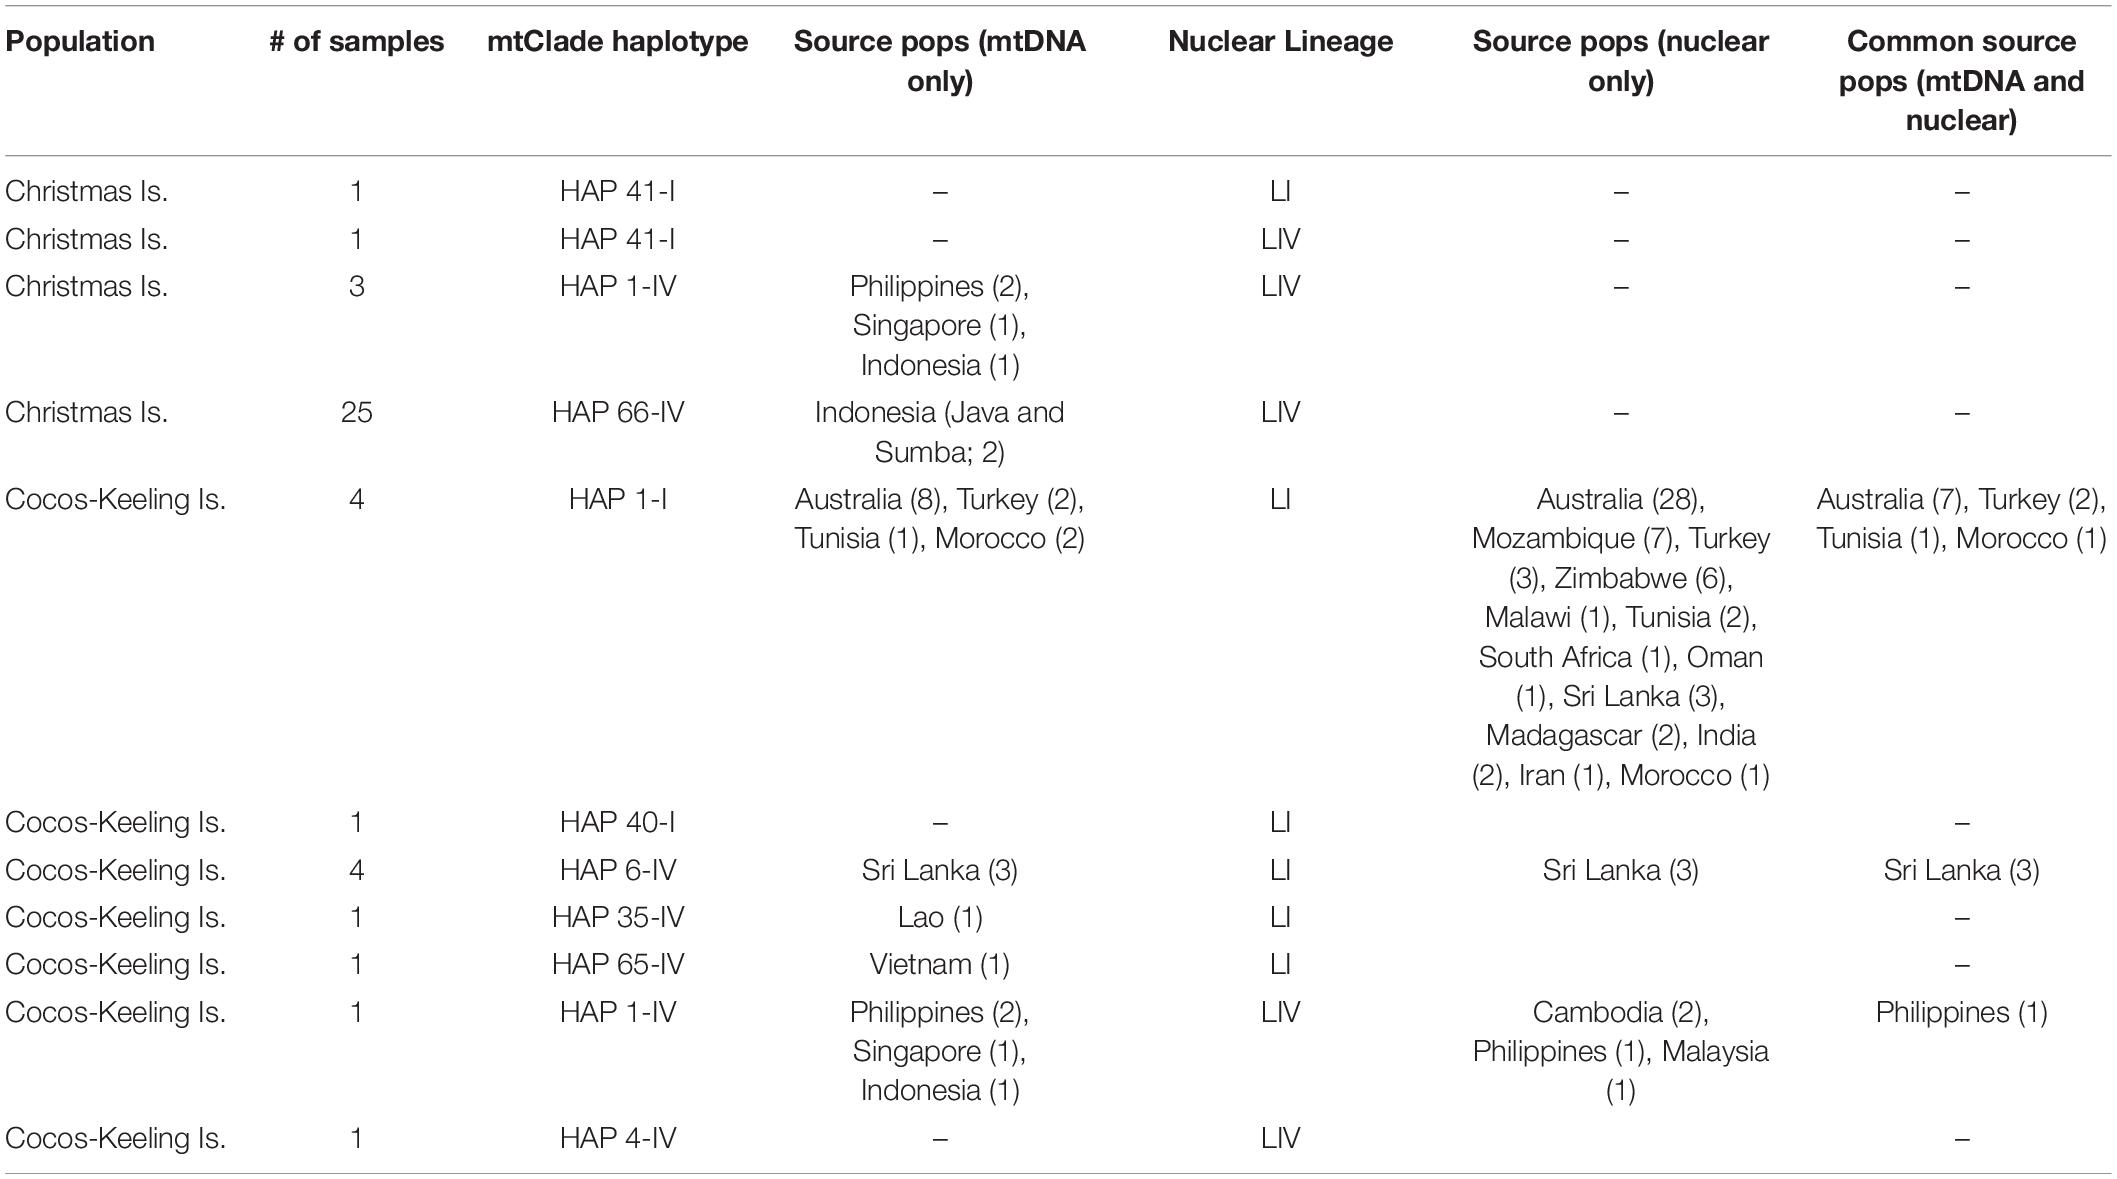
Table 2. Summary table of sample numbers for overlapping mtDNA and nuclear datasets to examine source locations for Christmas Island and Cocos-Keeling Island RrC rodents.
In the Group 2 PCA analysis (Figure 7), we see the two Lineage IV CCK samples fall in the center of the PCA close to two of the concordant mtClade II/Lineage II samples. These two mtClade II/Lineage II samples also appear in the center of the first PCA analysis (Figure 2) suggesting they might actually have Lineage I nuclear backgrounds. However, these two samples still fall within Group 2 of the main structure analysis (the other Lineage II samples are in Group 2; Figure 5A) and Lineage II of the K = 3 and K = 5 Group 2 structure analyses (Figures 5B,C).
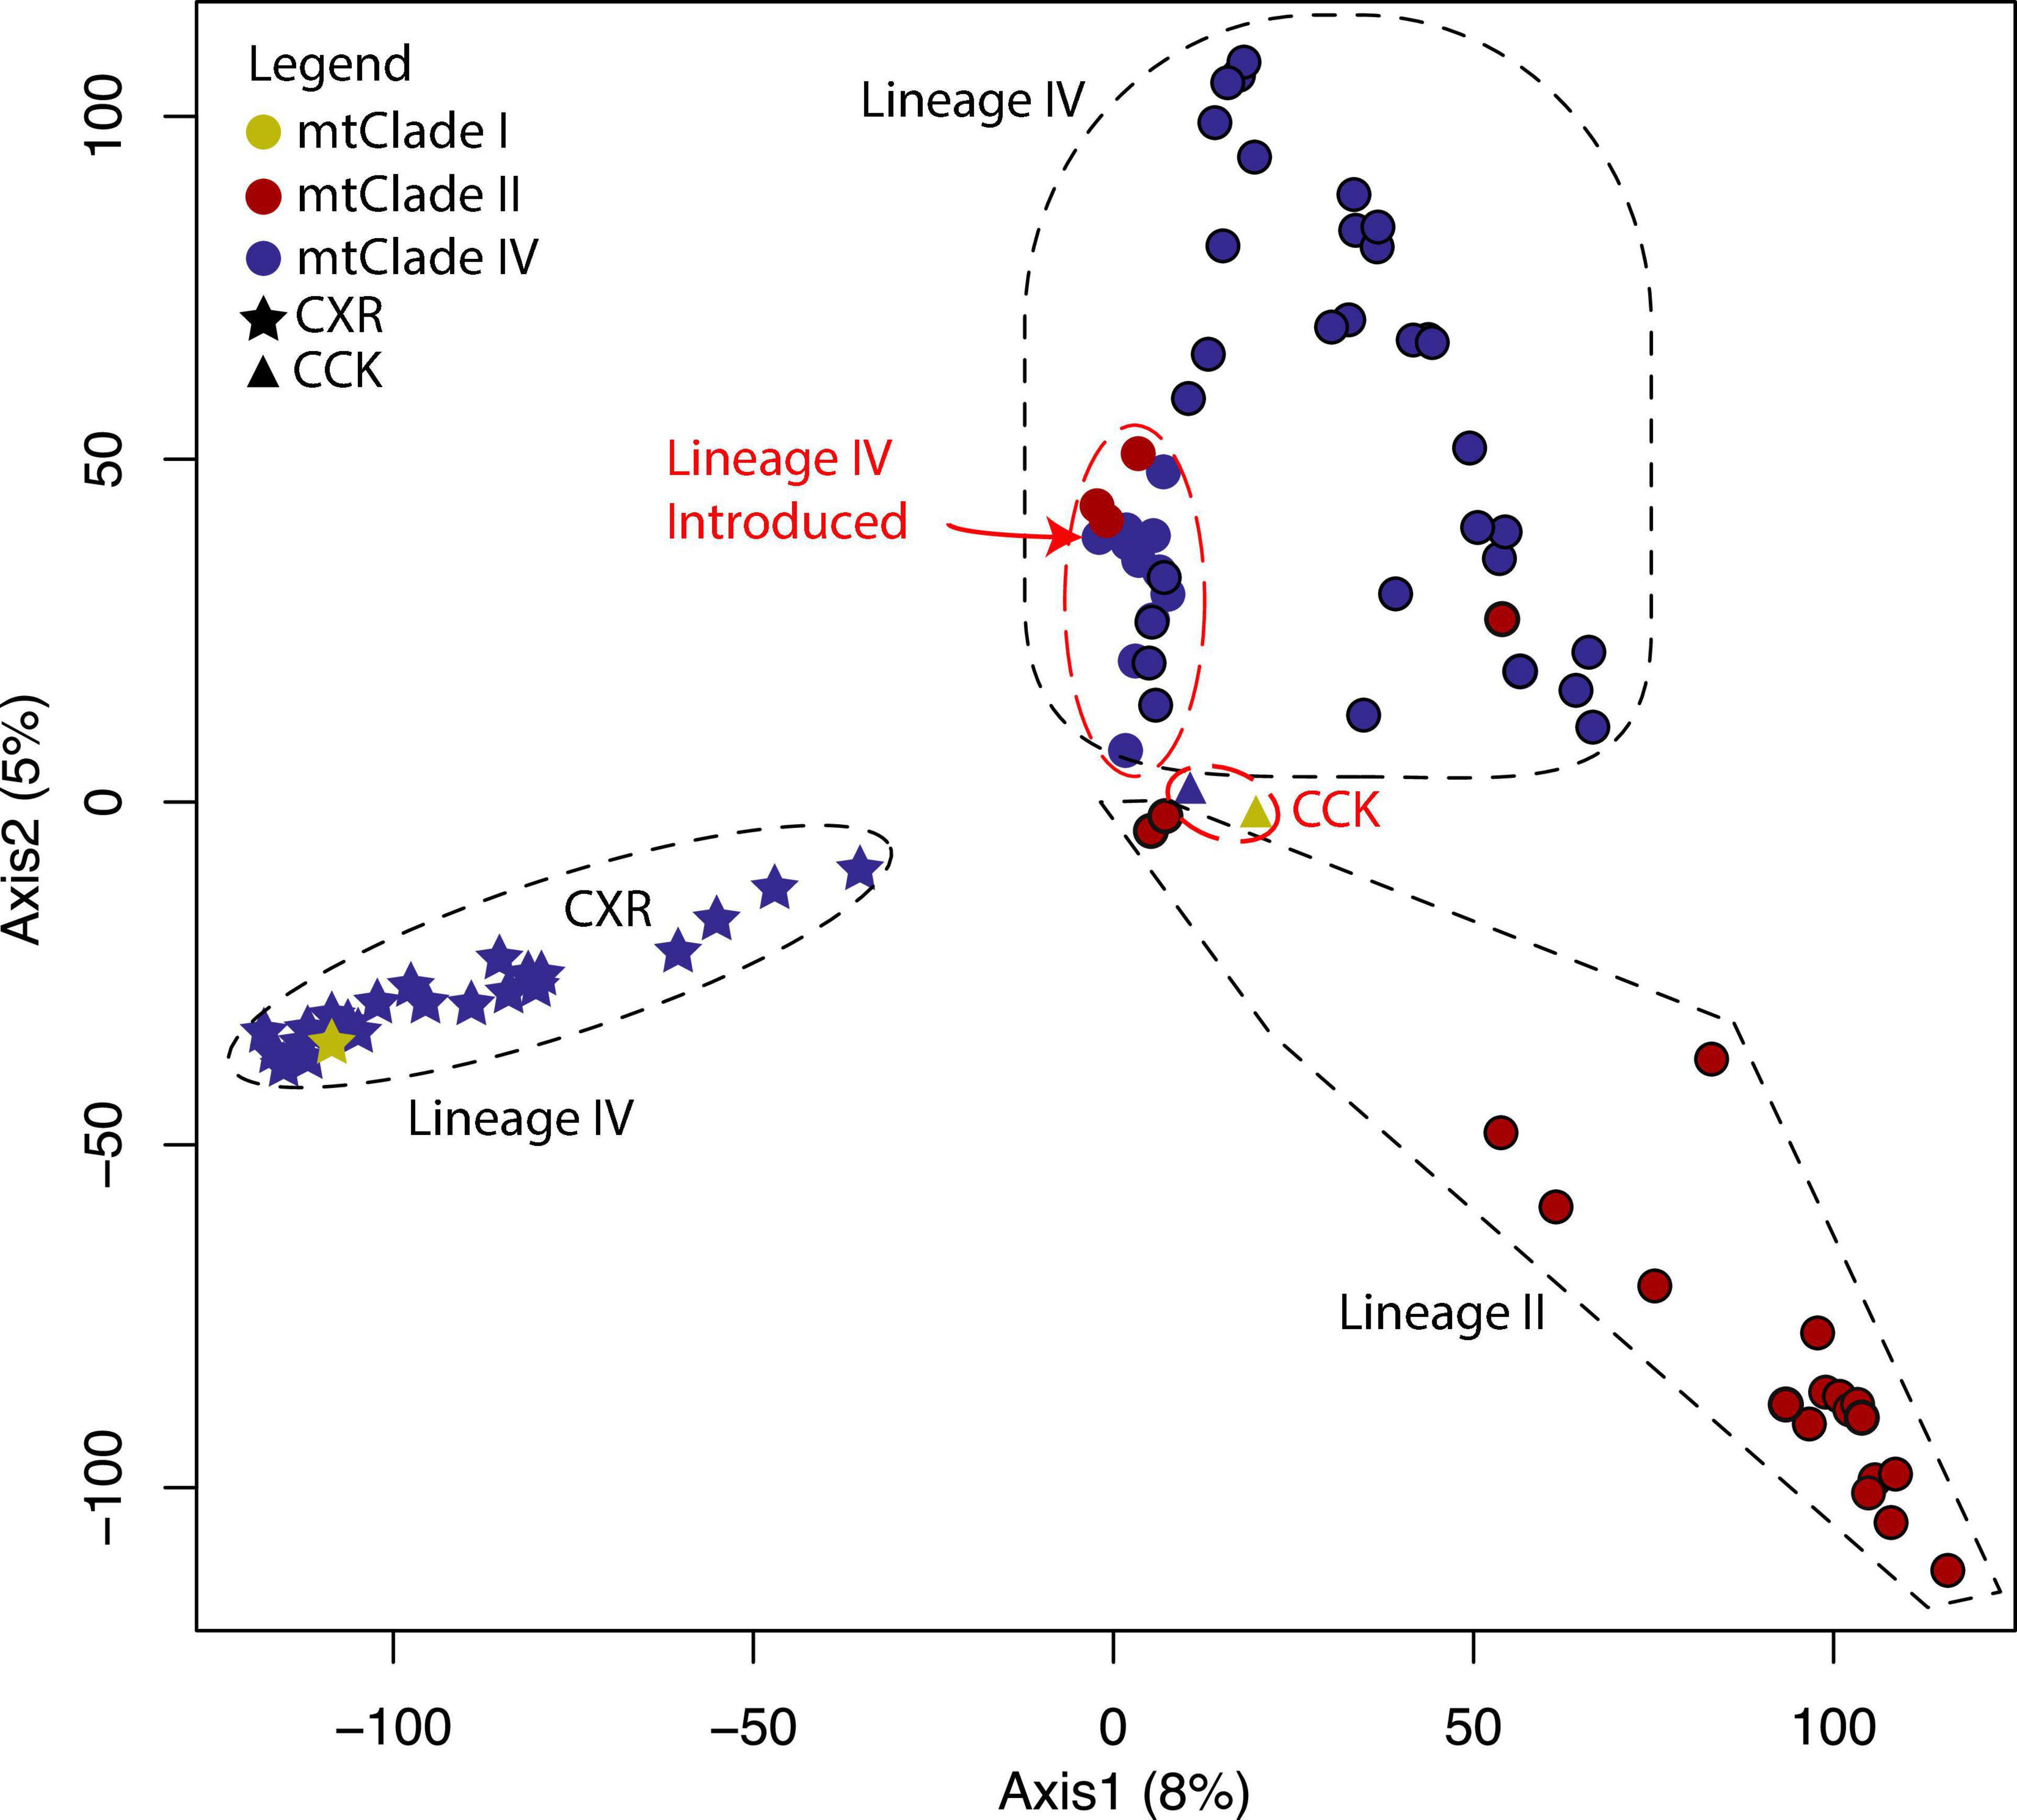
Figure 7. PCA of nuclear SNP marker dataset for Group 2 identified in Figure 5. PC1 explains 8% of the variance and PC2 explains 5% of the variance. Colored circles represent the mtClades, with black outlines around circles indicating sample was found within the native range. The dashed shapes in PC1 and PC2 represent the populations identified in the structure analysis of Group 2—K = 3 sub-groups indicated by black dashed outlines and the two extra sub-group identified in K = 5 are indicated in red dashed outlines. The native range Lineage IV samples that fall within the red dashed “Lineage IV Introduced” outline actually fall with the other Lineage IV native range samples in the K = 5 structure analysis (i.e., the ancestry patterns identified in the structure analysis do not correspond to the clustering analysis found in this principal component analysis).
In the K = 5 structure plot (Figure 5C), the only sub-group that is further split apart from the K = 3 analysis is the non-CXR Lineage IV samples, where a group of mostly native range Lineage IV samples (i.e., Cambodia [n = 5], Laos [n = 14], Thailand [n = 6], Vietnam [n = 6], and the Philippines [n = 1]) split from the rest of the introduced range Lineage IV samples (i.e., Indonesia [n = 6], Malaysia [n = 2], the Philippines [n = 3], Singapore [n = 3]), and the few CCK Lineage IV samples form a third new group.
When we search for a source population by comparing locations with similar mtDNA (same or similar mito-haplotypes) and nuclear backgrounds (within ± 10 PC1/PC2 values), we see that four concordant mtClade I/Lineage I samples have the exact same mito-haplotype (H1-I) and similar nuclear backgrounds as seven samples from mainland Australia, two from Turkey, and one each from Tunisia and Morocco. Only one of the four discordant CCK mtClade IV/Lineage I samples had PC values close to other locations, namely three mtClade IV/Lineage I samples from Sri Lanka, although all four do also share the same mito-haplotype (HAP 6-IV) as the three Sri Lankan samples. Three of these four CCK mtClade IV/Lineage I samples form a cline away from the closest Sri Lankan samples in the PCA, suggesting genetic drift away from this potential source population (although to a much weaker degree than the genetic drift occurring on CXR). However, the fourth CCK mtClade IV/Lineage I sample did not have any close mito-nuclear matches. The mtClade I/Lineage I sample (ABTC123580) closest to the middle of the main PCA plot (Figure 2) does have a similar nuclear background to a range of potential source locations (Australia, India, Madagascar, and Morocco), however, none with the same or similar mito-haplotype (4 bp different to a sample from Madagascar: HAP 40-I vs. HAP 27-I). The closest source location for the concordant mtClade IV/Lineage IV sample from CCK (ABTC118515) was a mtDNA sample from Malaysia but the mito-haplotype differed by 3 bp (HAP 4-IV vs. HAP 9-IV).
By incorporating both mtDNA and nuclear datasets, we can see how each of these Indian Ocean island groups have quite distinct colonization histories and degree of gene flow for the RrC samples (see Figure 4). Although there are no shared mitochondrial or nuclear haplotypes between CXR and CCK the fact that the sole CXR mtClade I haplotype (found in two individuals) is only two mutations different from a CCK mtClade I haplotype suggests some level of gene flow between the two island groups may have occurred. One of these CXR mtClade I haplotype samples has also had it’s mitochondrial genome captured by a RrC individual with the divergent CXR Lineage IV nuclear background, suggesting that hybridisation event occurred on CXR. We can also see suggestions of at least one source of the other mtClade groups introduced to CXR, Indonesia: HAP 1-IV (found on Flores and Kei Besar islands), HAP 66-IV (Java and Sumba islands), and HAP 77-II (Java) are all present on different Indonesian islands.
The highly divergent nature of the CXR samples also makes identifying a source population difficult in that all the CXR RrC appear to have undergone isolation and possible drift since introduction, although it is nearly impossible to predict whether the divergent Lineage IV sub-group represents huge levels of genetic drift or simply a lack of sampling of the source population. There is no evidence of a post-bottleneck population expansion from the cytb dataset which is unusual for a population colonizing an island, suggesting that either a large initial RrC population colonized the island or there was a sustained influx of subsequent gene flow. When we search for a source population for the CXR samples by comparing locations with similar mtDNA and nuclear backgrounds, we see that none of the CXR samples had any similar nuclear signal to our set of reference samples (based on the PCA in Figure 2). Hybridisation analysis suggests that the ancestral event that created the divergent CXR Lineage IV sub-group is either not recent or did not occur on Christmas Island. When we examine the hybridisation history of the Lineage IV samples from CXR compared to the rest of the Lineage IV samples, we see clear evidence of the CXR Lineage IV samples having pure ancestry from a core mainland population not present in our samples (“Pure 2” in Supplementary Table 5). In addition, the fact that the “F2” hybrids (two generations away from “Pure 2” samples) were found in Indonesia, Malaysia, Philippines, Singapore, and Thailand (RrC LIV taxon’s introduced range; Figure 6), and the “Backcross 1” (backcrosses with “Pure 1” that are also two generations away from “Pure 2” samples) were found in Laos and Thailand (RrC LIV taxon’s native range), suggests that there is some sort of continuous gene flow from the core range of the ancestral “Pure 2” population (if not from CXR, then from wherever that is located). The link between CXR and introduced range locations is further supported by the structure analysis, which shows that concordant mtClade IV/Lineage IV samples from CXR contain minor levels of ancestry from Lineage IV’s introduced range locations. Sampling more widely across the introduced range locations (especially islands of Indonesia) may identify a single source population that contains all of the currently sampled mtClade haplotypes, the third mtClade haplotype (the rare HAP 41-I currently unsampled outside of CXR), and nuclear signals that either match the CXR samples or are similar enough to have given rise to them followed by genetic drift.
By examining the ancient DNA samples from CXR we were hoping to be able to date the arrival of RrC on the island. The lack of amplifiable DNA from the lower layers of CXR deposits meant that this was not possible. In addition, the presence of other Rattus species on the island (although R. macleari and R. nativitatis are both now extinct) means that we cannot necessarily assume rodent bones/teeth from the lower layers belong to RrC. Therefore, we are still unsure of when RrC originally arrived on CXR. We do know that between 1900 and 1903 there were only mtClade I detected on CXR (7 out of 7 samples sequenced for cytb; Wyatt et al., 2008), however, this doesn’t appear to be the case any longer, both from the modern and ancient/historic sample perspective. Not only are 3 of the 4 (75%) of the ancient DNA samples mtClade IV vs. mtClade I, but the majority of modern CXR tissue samples from this study were found to be mtClade IV (92%; 46 out of 50 samples) and of the 30 samples that were sequenced for nuclear SNPs almost all (97%; 29 out of 30 samples) showed a unique and divergent nuclear Lineage IV background. This highly divergent population of Lineage IV may represent the original RrC to colonize the island, which may have been isolated from subsequent gene flow to the island since: (1) its original colonization (if we assume Lineage IV was simply missed in the early 1900’s collections, Wyatt et al., 2008); or (2) the early 1900’s (if we assume replacement of mtClade I with mtClade IV has occured in the intervening 120 years, Wyatt et al., 2008), with either the source population of this divergent Lineage IV unsampled in our study or now absent from its original location.
In addition to these signatures of isolation of the CXR nuclear gene pool, the fact that there is a “rare” mtClade haplotype shared between a mtClade I/Lineage I and a mtClade I/Lineage IV sample from CXR suggests that at least one instance of mtDNA capture of mtClade I by RrC with a nuclear Lineage IV background occurred on CXR. It appears from our reference dataset that mtDNA capture is widespread in the RrC, with almost every combination found: mtClade I/Lineage II, mtClade I/Lineage IV, mtClade II/Lineage I, mtClade II/Lineage IV, and also mtClade IV/Lineage I (Figure 2). These mitochondrial captures are obvious signs of hybridisation events between RrC taxa that may never have previously had contact in the wild.
When examining the mtDNA patterns for evidence of source populations for RrC on CCK, we see plenty of possible locations, but only a couple have multiple lines of evidence for Lineage I sources (i.e., both mtDNA and nuclear links): Australia, North Africa/Middle East, South Asia (Table 2). The link between CCK and Australia is not unexpected given that the administrative responsibility for CCK was transferred to Australia in 1955. Links to these other possible source locations are also backed up by historical records. Operation Pharos during World War II, which involved the construction of a secret airfield and base on West Island during 1944–1945 (Rosum, 2000), may explain the link between these sites in North Africa and the CCK (Figure 4). Furthermore, troops from Sri Lanka were also stationed in CCK during World War II (Crusz, 2001), potentially explaining the Sri Lankan link.
The most parsimonious explanation for the two similar CCK Lineage IV samples is that they stem from one introduction to CCK, therefore we may be looking for one source population containing both concordant mtClade IV/Lineage IV and discordant mtClade I/Lineage IV RrC. If we only consider the more nuanced nuclear data to identify this source population (given their higher information content compared to the mtDNA cytb 945 bp sequenced here) and assume that capture of the mtClade I genome actually occurred in the source population rather than on CCK then we see that there are a limited number of possible sources. Based on the shipping history of CCK we propose that Island Southeast Asia, specifically the Philippines, is the most likely source population. It is possible that both the concordant mtClade IV/Lineage IV and the discordant mtClade I/Lineage IV CCK RrC originated there, so focused sampling effort may locate the source of the CCK RrC. The high degree of mitochondrial capture that we find on CCK between the RrC taxa does not support historical claims by Wood-Jones (1909) that the “original” rat, R. rattus keelingensis (now suspected to be RrC mtClade I), on Direction Island remained separated from other races of rats found in the main CCK atoll. Rather, the speculative accounts provided in the Colonial Reports (Straits Settlement, 1897) of multiple rat introductions from various shipwrecks, trade and local transport between the islands appears to more accurately represent the complex history of RrC in the eastern Indian Ocean.
Although there are no shared mitochondrial or nuclear haplotypes between CXR and CCK the fact that the sole CXR mtClade I haplotype is only two mutations different from a CCK mtClade I haplotype suggests some level of gene flow may have occurred. The F2 hybrids detected in the CCK Lineage IV samples (i.e., two generations away from the “Pure 2” samples from CXR) might also suggest some level of gene flow between the two island groups. However, this line of evidence suggests the same level of gene flow between CXR and many Indonesian islands (via the presence of F2 hybrids), which is unlikely given there is no evidence of the CXR divergent nuclear signature present in Indonesia.
In fact, the most parsimonious explanation for the observed mitochondrial and nuclear DNA patterns is a direct link between introduced range Lineage IV locations and CCK but an indirect or older link between introduced range Lineage IV locations and CXR. The RrC gene flow to these eastern Indian Ocean islands may be historic and stem from trade in the late 1600’s between these two island groups (e.g., ships called in at CXR from CCK and Jakarta as resupply to the Clunies Ross family and workers living there, Gibson-Hill, 1949).
The mitochondrial capture documented here has implications for the zoonotic diseases that each RrC taxa may carry, with novel interactions potentially creating completely new infectious agents. As many of the modern RrC samples from CXR and CCK were found in association with built up areas (houses, offices, sheds, etc.), any novel zoonotic diseases created by these hybridisation events has the potential to cross over to the humans. Given much of the disease work done linking zoonotic diseases to their rat-hosts is likely to have been conducted prior to our understanding of the complexities of the RrC, little knowledge exists about which RrC taxa actually act as hosts for these black rat zoonotic diseases. This makes it difficult to predict how new interactions between these RrC taxa outside of their native ranges might influence any recombinant or novel zoonotic diseases capable of crossing the species barrier to humans.
We conclude that there were multiple introductions of RrC black rats to the Christmas Islands (CXR) and the Cocos-Keeling Island (CCK) groups in the eastern Indian Ocean. This is not surprising given the islands offer a land refuge between Indonesia and Australia, evidenced by the common arrival of asylum seeker vessels to the islands. While we know less about the genetic history of RrC on CCK (no previous genetic work and no ancient samples), we were able to identify that there were at least two (and possibly three) separate introductions of RrC to CCK: an introduction from Australia, Morocco, Tunisia or Turkey, an introduction from Sri Lanka, and possibly a mixed introduction from the Philippines containing both concordant mtClade IV/Lineage IV and discordant mtClade I/Lineage IV, based on common locations for the mtDNA and nuclear signatures. We find evidence from the mtDNA data that Indonesia is the most parsimonious source for the rodents on CXR although no sign of that introduction pathway is evident in our nuclear analysis. Sampling from the islands of Indonesia and the Philippines (for more recent source populations) and mainland Southeast Asia (for ancestral native range source populations of Lineage IV) may help further elucidate the colonization history of the RrC on CXR and CCK.
Genetic drift also appears to have impacted the RrC on CXR to a large degree but not as strongly on CCK, possibly due to the mixing between RrC on the different islands within the CCK group. These different genetic patterns allow us to establish that little recent gene flow has occurred between CXR and CCK. However, the evidence presented here does show how these multiple introductions of such an invasive pest species to a remote island has important implications for the biosecurity of neighboring countries, including Australia with its many unique and endemic taxa. Without more information about the timing of these introductions from the different locations (either through regular trapping and sampling of RrC and/or carbon dating of individual bones/teeth that also produce DNA) we can only speculate about how often and in what sort of numbers RrC are still making their way to CXR and CCK.
We also find extensive evidence of bi-directional mtDNA capture between RrC Lineage I/RrC Lineage IV and RrC Lineage I/RrC Lineage II, but also uni-directionally of mtClade II by Lineage IV. These mtDNA capture events appear to have occurred in both source populations and on CXR. These signals of mito-nuclear discordance represent hybridisation events that have important zoonotic disease implications, a particularly timely reminder that commensal pest species can act as both reservoirs and vectors of dangerous and potentially novel diseases.
The datasets presented in this study can be found in online repositories. The cytochrome b data presented in the study are deposited in the NCBI Genbank repository, accession numbers OL865449-OL865582. The RAD-seq raw data presented in the study are deposited in the NCBI SRA repository, under BioProject PRJNA788573 and accession numbers SAMN24011995-SAMN24012184.
Ethical review and approval was not required for the animal study because all samples were sourced from existing tissue collections associated with museum collections.
KA, AW, and SD contributed to the conceptualization, investigation and design of the study. AW, MH, SM, TB, and VT performed the statistics, analysis and were responsible for data validation. HS, RP, NH, DA, CP, HM, GC, PP, and AA provided resources to carry out the work. SD and KA were responsible for the administration and supervision of the research project. VT, KA, and AW wrote the manuscript. All authors contributed to manuscript revision, read, and approved the submitted version.
The genetic work was funded from an Australian Research Council Discovery grant (DP0988863) to SD and KA and (DP140103650) to SD, KA, and PP. AW was supported by a scholarship.
KA was employed by the company Ken Aplin Fauna Studies Pty Ltd.
The remaining authors declare that the research was conducted in the absence of any commercial or financial relationships that could be construed as a potential conflict of interest.
All claims expressed in this article are solely those of the authors and do not necessarily represent those of their affiliated organizations, or those of the publisher, the editors and the reviewers. Any product that may be evaluated in this article, or claim that may be made by its manufacturer, is not guaranteed or endorsed by the publisher.
We thank Julie Cooper, Jane Dawson, Trish Flores, S. Garretson, R. How, Liang Lu, Shahnaz Malik, T. Moore, Ali McCarthy, K. Rayner, Ky Strickland, N. Thomas, Simon Viech, Low Bing Wen, and Razali Zainiel for supplying tissue samples or sequences, as well as the South Australian Museum, the Western Australian Museum, Parks Australia, and WA Department of Biodiversity, Conservation and Attractions for tissue samples.
The Supplementary Material for this article can be found online at: https://www.frontiersin.org/articles/10.3389/fevo.2021.786510/full#supplementary-material
Abdelkrim, J., Pascal, M., Calmet, C., and Samadi, S. (2005). Importance of assessing population genetic structure before eradication of invasive species: examples from insular Norway rat populations. Conserv. Biol. 19, 1509–1518. doi: 10.1111/j.1523-1739.2005.00206.x
Anderson, E. C., and Thompson, E. A. (2002). A model-based method for identifying species hybrids using multilocus genetic data. Genetics 160, 1217–1229. doi: 10.1093/genetics/160.3.1217
Angel, A., and Cooper, J. (2006). A Review of the Impacts of Introduced Rodents on the Islands of Tristan da Cunha and Gough. RSPB Research Report No. 17. Sandy: Royal Society for the Protection of Birds.
Aplin, K., Brown, P., Jacob, J., Krebs, C., and Singleton, G. R. (2003). Field Methods for Rodent Studies in Asia and the Indo-Pacific. Canberra, ACT: Australian Centre for International Agricultural Research.
Aplin, K., Suzuki, H., Chinen, A. A., Chesser, R. T., ten Have, J., Donnellan, S. C., et al. (2011). Multiple geographic origins of commensalism and complex dispersal history of Black Rats. PLoS One 6:e26357. doi: 10.1371/journal.pone.0026357
Atkinson, I. A. E. (1977). A reassessment of factors particularly Rattus rattus that influenced the decline of endemic forest birds in the Hawaiian Islands. Pac. Sci. 31, 109–133.
Bandelt, H. J., Forster, P., and Rohl, A. (1999). Median-joining networks for inferring intraspecific phylogenies. Mol. Biol. Evol. 16, 37–48. doi: 10.1093/oxfordjournals.molbev.a026036
Burbidge, A. A., and Abbott, I. (2017). Mammals on Western Australian islands: occurrence and preliminary analysis. Aust. J. Zool. 65, 183–195. doi: 10.1071/ZO17046
Burbidge, A. A., and Morris, K. D. (2002). “Introduced mammal eradications for nature conservation on Western Australian Islands: a review,” in Turning the Tide: The Eradication of Invasive Species, eds C. Veitch and M. N. Clout (Auckland: IUCN SSC Invasive Species Specialist Group), 64–70.
Catchen, J., Hohenlohe, P. A., Bassham, S., Amores, A., and Cresko, W. A. (2013). Stacks: an analysis tool set for population genomics. Mol. Ecol. 22, 3124–3140. doi: 10.1111/mec.12354
Cheke, A., and Jones, C. (1987). “Measurements and weights of the surviving endemic birds of the Mascarenes and their eggs,” in Studies of Mascarene Island birds, ed. A. Diamond (Cambridge: Cambridge University Press), 403–422. doi: 10.1017/CBO9780511735769.011
de Graaf, G., and Black, R. A. R. (1981). Rattus rattus. In The rodents of Southern Africa: Notes on Their Identification, Distribution, Ecology, and Taxonomy. Durban: Butterworths.
Evanno, G., Regnaut, S., and Goudet, J. (2005). Detecting the number of clusters of individuals using the software STRUCTURE: a simulation study. Mol. Ecol. 14, 2611–2620. doi: 10.1111/j.1365-294X.2005.02553.x
Gibson-Hill, C. A. (1949). The early history of Christmas Island, in the Indian Ocean. J. Malay. Branch R. Asiat. Soc. 22, 67–93.
Greenslade, P., Burbidge, A. A., Jasmyn, A., and Lynch, J. (2013). Keeping Australia’s islands free of introduced rodents: the Barrow Island example. Pac. Conserv. Biol. 19, 284–294. doi: 10.1071/PC130284
Herten, K., Hestand, M. S., Vermeesch, J. R., and Van Houdt, J. K. J. (2015). GBSX: a toolkit for experimental design and demultiplexing genotyping by sequencing experiments. BMC Bioinformatics 16:73. doi: 10.1186/s12859-015-0514-3
Jombart, T. (2008). Adegenet: a R package for the multivariate analysis of genetic markers. Bioinformatics 24, 1403–1405. doi: 10.1093/bioinformatics/btn129
Kopelman, N. M., Mayzel, J., Jakobsson, M., Rosenberg, N. A., and Mayrose, I. (2015). Clumpak: a program for identifying clustering modes and packaging population structure inferences across K. Mol. Ecol. Resour. 15, 1179–1191. doi: 10.1111/1755-0998.12387
Kosoy, M. Y., Khlyap, L., Cosson, J. F., and Morand, S. (2014). Aboriginal and invasive rates of genus Rattus as hosts of infectious agents. Vector Borne Zoonotic Dis. 15, 3–12. doi: 10.1089/vbz.2014.1629
Leigh, J. W., and Bryant, D. (2015). PopArt: full-feature software for haplotype network construction. Methods Ecol. Evol. 6, 1110–1116. doi: 10.1111/2041-210X.12410
Louys, J., Herrera, M. B., Thomson, V. A., Wiewel, A. S., Donnellan, S. C., O’Connor, S., et al. (2020). Expanding population edge craniometrics and genetics provide insight into dispersal of commensal rats through Nusa Tenggara, Indonesia. Rec. Aust. Mus. 72, 287–302. doi: 10.3853/j.2201-4349.72.2020.1730
Martin, J.-L., Thibault, J.-C., and Bretagnolle, V. (2000). Black rats, island characteristics, and colonial nesting birds in the Mediterranean: consequences of an ancient introduction. Conserv. Biol. 14, 1452–1466. doi: 10.1046/j.1523-1739.2000.99190.x
Morris, K. D. (2002). “The eradication of the black rat (Rattus rattus) on Barrow and adjacent islands off the north-west coast of Western Australia,” in Turning the Tide: The Eradiction of Invasive Species, eds C. R. Veitch and M. N. Clout (Auckland: IUCN SSC Invasive Species Specialist Group), 219–225.
Musser, G. G., and Califia, D. (1982). Results of the Archbold expeditions. No. 106. Identities of rats from Pulau Maratua and other islands off East Borneo. Am. Mus. Novit. 2726, 1–30.
Pages, M., Chaval, Y., Herbreteau, V., Waengsothorn, S., Cosson, J.-F. ß, Hugot, J.-P., et al. (2010). Revisiting the taxonomy of the Rattini tribe: a phylogeny-based delimitation of species boundaries. BMC Evol. Biol. 10:184. doi: 10.1186/1471-2148-10-184
Pfeifer, B., Wittelsburger, U., Ramos-Onsins, S. E., and Lercher, M. J. (2014). PopGenome: an efficient swiss army knife for population genomic analysis in R. Mol. Biol. Evol. 31, 1929–1936. doi: 10.1093/molbev/msu136
Pickering, J., and Norris, C. A. (1996). New evidence on the extinction of the endemic murid Rattus macleari from Christmas Island, Indian Ocean. Aust. Mammal. 19, 35–41. doi: 10.1071/AM96019
Poland, J. A., Brown, P. J., Sorrells, M. E., and Jannink, J.-L. (2012). Development of high-density genetic maps for barley and wheat using a novel two-enzyme genotyping-by-sequencing approach. PLoS One 7:e32253. doi: 10.1371/journal.pone.0032253
Pritchard, J. K., Stephens, M., and Donnelly, P. (2000). Inference of population structure using multilocus genotype data. Genetics 155, 945–959. doi: 10.1093/genetics/155.2.945
Rahelinirina, S., Harimalala, M., Margueron, T., Ramihangihajason, T., Mansotte, F., Rajerison, M., et al. (2018). Risk of maritime introduction of plague from Madagascar to Mayotte. Acta Trop. 187, 140–143. doi: 10.1016/j.actatropica.2018.07.029
Rosum, K. (2000). Operation Pharos: A History of the Allied Air Base on the Cocos/Keeling Islands during World War Two. Bognor Regis: Woodfield Publishing Ltd.
Ruffino, L., Bourgeois, K., Vidal, E., Duhem, C., Paracuellos, M., Escribano, F., et al. (2009). Invasive rats and seabirds after 2,000 years of an unwanted coexistence on Mediterranean islands. Biol. Invasions 11, 1631–1651. doi: 10.1007/s10530-008-9394-z
Spennemann, D. H. R. (1997). Distribution of rat species (Rattus spp.) on the attols of the Marshall Islands: past and present dispersal. Atoll Res. Bull. 446, 1–18. doi: 10.5479/si.00775630.446.1
Stokes, A. S., Shiels, W., and Dunn, K. (1984). Birds of the Cocos (Keeling) Islands, Indian Ocean. EMU 84, 23–28. doi: 10.1071/MU9840023
Straits Settlement (1897). Papers Relating to the Cocos-Keeling and Christmas Islands. Presented to both Houses of Parliament by Command of Her Majesty. London: Eyre and Spottiswoode.
Thomson, V. A., Lebrasseur, O., Austin, J. J., Hunt, T. L., Burney, D. A., Denham, T., et al. (2014). Using ancient DNA to study the origins and dispersal of ancestral Polynesian chickens across the Pacific. Proc. Natl. Acad. Sci. U.S.A. 111, 4826–4831. doi: 10.1073/pnas.1320412111
Tollenaere, C., Brouat, C., Duplantier, J.-M., Rahalison, L., Rahelinirina, S., Pascal, M., et al. (2010). Phylogeography of the introduced species Rattus rattus in the western Indian Ocean, with special emphasis on the colonization history of Madagascar. J. Biogeogr. 37, 398–410. doi: 10.1111/j.1365-2699.2009.02228.x
Towns, D. R., Atkinson, I. A. E., and Daugherty, C. H. (2006). Have the harmful effects of introduced rats on islands been exaggerated? Biol. Invasions 8, 863–891. doi: 10.1007/s10530-005-0421-z
White, L. C., Moseby, K. E., Thomson, V. A., Donnellan, S. C., and Austin, J. J. (2018). Long-term genetic consequences of mammal reintroductions into an Australian conservation reserve. Biol. Conserv. 219, 1–11. doi: 10.1016/j.biocon.2017.12.038
Wilson, D. E., and Reeder, D. M. (2005). Mammal Species of the World. A Taxonomic and Geographic Reference. Available online at: https://www.departments.bucknell.edu/biology/resources/msw3/ (accessed July 2, 2008)
Woinarski, J. C. Z., Macrae, I., Detto, F. T., Reid, J., Pink, C., Flakus, S., et al. (2016). Conservation status and reintroduction of the Cocos Buff-banded Rail, Gallirallus philippensis andrewsi. EMU 116, 32–40. doi: 10.1071/MU15052
Wood-Jones, F. (1909). The fauna of the Cocos-Keeling Atoll, collected by F. Wood Jones. Proc. Zool. Soc. Lond. 1908, 132–160. doi: 10.1111/j.1096-3642.1909.tb01862.x
Wringe, B. F., Stanley, R. R. E., Jeffery, N. W., Anderson, E. C., and Bradbury, I. R. (2016). parallelnewhybrid: an R package for the parallelization of hybrid detection using NEWHYBRIDS. Mol. Ecol. Resour. 17, 91–95. doi: 10.1111/1755-0998.12597
Wyatt, K. B., Campos, P. F., Gilbert, M. T. P., Kolokotronis, S. O., Hynes, W. H., Desalle, R., et al. (2008). Historical mammal extinction on Christmas Island (Indian Ocean) correlates with introduced infectious disease. PLoS One 3:e3602. doi: 10.1371/journal.pone.0003602
Keywords: Rattus rattus, Christmas Island (Indian Ocean), Cocos (Keeling Islands), colonization and extinction, cytochrome b, RAD-seq, hybridisation
Citation: Thomson VA, Wiewel AS, Palmer R, Hamilton N, Algar D, Pink C, Mills H, Aplin KP, Clark G, Anderson A, Herrera MB, Myers S, Bertozzi T, Piper PJ, Suzuki H and Donnellan S (2022) Genetic Insights Into the Introduction History of Black Rats Into the Eastern Indian Ocean. Front. Ecol. Evol. 9:786510. doi: 10.3389/fevo.2021.786510
Received: 30 September 2021; Accepted: 07 December 2021;
Published: 27 January 2022.
Edited by:
Laura Parducci, Sapienza University of Rome, ItalyReviewed by:
Nicolas Dussex, Swedish Museum of Natural History, SwedenCopyright © 2022 Thomson, Wiewel, Palmer, Hamilton, Algar, Pink, Mills, Aplin, Clark, Anderson, Herrera, Myers, Bertozzi, Piper, Suzuki and Donnellan. This is an open-access article distributed under the terms of the Creative Commons Attribution License (CC BY). The use, distribution or reproduction in other forums is permitted, provided the original author(s) and the copyright owner(s) are credited and that the original publication in this journal is cited, in accordance with accepted academic practice. No use, distribution or reproduction is permitted which does not comply with these terms.
*Correspondence: Vicki A. Thomson, dmlja2kudGhvbXNvbkBhZGVsYWlkZS5lZHUuYXU=; dmlja2kudGhtc25AZ21haWwuY29t
Disclaimer: All claims expressed in this article are solely those of the authors and do not necessarily represent those of their affiliated organizations, or those of the publisher, the editors and the reviewers. Any product that may be evaluated in this article or claim that may be made by its manufacturer is not guaranteed or endorsed by the publisher.
Research integrity at Frontiers
Learn more about the work of our research integrity team to safeguard the quality of each article we publish.