 Arinder K. Arora
 Cheolho Sim
 David W. Severson3
 David S. Kang
- 1Department of Entomology, University of Florida, Gainesville, FL, United States
- 2Department of Biology, Baylor University, Waco, TX, United States
- 3Department of Biological Sciences and Eck Institute for Global Health, University of Notre Dame, Notre Dame, IN, United States
- 4USDA Agricultural Research Service, Biological Control of Insects Research Laboratory, Columbia, MO, United States
The Culex pipiens complex of mosquitoes are significant vectors of several pathogens resulting in infectious human diseases in North America, including but not limited to West Nile encephalitis, Rift Valley Fever, and Lymphatic filariasis. Among this complex are C. pipiens form pipiens and Culex quinquefasciatus. While morphologically similar, the mosquitoes exhibit unique life histories that suit them uniquely to divergent niches, wherein C. pipiens can thrive despite the cold winters of the northern United States and C. quinquefasciatus is able to survive periods of drought typical in the southern states. Here, Random Forests machine-learning algorithms were employed to model and explore which environmental parameters best explain mosquito occurrence in historical trapping data across the continental United States of America, and test correlation with abundance data. The models explained between 71 and 97% of the presence or absence of the two mosquitoes based on historical climatic data. The results of this study will improve vector management programs by explaining which environmental variables will provide the most accurate predictions of mosquito presence at a given site.
Introduction
Culex pipiens complex mosquitoes are major vectors of several pathogens that cause human diseases such as West Nile encephalitis, Rift Valley Fever, and Lymphatic filariasis (Meegan et al., 1980; Monath, 1988; Lai et al., 2000; Diamond, 2009). One of the mosquitoes belonging to this group, the southern house mosquito Culex quinquefasciatus, is found in warmer regions with its distribution limited below a latitude of 39°N in the continental United States America (Alaniz et al., 2019). Its sister species, the northern house mosquito Culex pipiens form pipiens, are found in the northern temperate regions of North America. However, the hybrid zone generally exists at latitudes between 30 and 40°N (Barr, 1957) between these two sister species although some population genetics studies showed that introgression among the C. pipiens complex species is much more widespread (Kothera et al., 2009, 2012; Huang et al., 2011). Despite these contradictory results of introgression in C. pipiens complex, each species exhibits unique life histories adapted to their specific ecological niches (Cornel et al., 2003; McAbee et al., 2008; Kothera et al., 2012; Kang et al., 2021) and purifying selection appears to maintain the unique genetic identities wherever the two biotypes are found (Fonseca et al., 2004; Arensburger et al., 2010; Amraoui et al., 2012; Hickner et al., 2013; Kang and Sim, 2013).
Environmental conditions are considered a significant effector of Culex population structure and shape differences in life history, including geographical distribution, behavior, reproduction, host preference, and diapause (overwintering) (Barr, 1957; Spielman, 1967; Harbach et al., 1984; Clements, 1992). Crucially, temperature profoundly influences the life cycle of this mosquitoes complex and is likely a major factor in its geographic distribution and consequently its ability to disseminate diseases (Chaves and Kitron, 2011; Chuang et al., 2011). A distinct temperature-related evolutionary adaptive feature of the C. pipiens complex is the presence or absence of overwintering diapause. Diapause is an anticipated, preprogrammed response of insects to the shortening of days and lower temperatures at the onset of winter and is characterized by a developmental arrest resulting in reduced metabolism, enhanced stress tolerance, and fat hypotrophy (Mori et al., 2007; Sim and Denlinger, 2013; Kang et al., 2014, 2016; Sim et al., 2015). This reallocation of resources toward survival is a critical adaptation for the northern house mosquito, C. pipiens. The absence of the diapausing phenotype would cull the southern mosquitoes from C. pipiens populations, yet fails to fully explain the low level of introgression of C. pipiens into the southern C. quinquefasciatus populations in North America.
Understanding how the changing climate influences the distribution of these mosquitoes is essential for management and control efforts. The interaction between climatic and local factors makes for complex processes. Multiple processes likely drive species distribution at different scales, and often simple models will fail to account for hidden relationships (Wagner and Fortin, 2005). This is further complicated by the nature of geospatial data, which often present complex, non-linear, high dimensional datasets (Cutler et al., 2007). This can present a problem for traditional methods such as generalized linear models (De’ath and Fabricius, 2000).
Random forests is a machine-learned method of pattern recognition that is very well suited to ecological classification and regression problems, and a chief use of the Random forests algorithm is to determine the relative importance of each feature in explaining a phenomenon (Cutler et al., 2007). Random forests is an algorithm in which multiple decision trees are combined (bagging/bootstrap aggregation) to solve classification or regression problems. This approach can compensate for errors in unbalanced datasets, which are common in ecological data (Breiman, 2001). This approach helps overcome the problem individual decision trees have with overfitting. Random forests do not need assumptions about the distribution of the data, are relatively robust when the quality of the data is inconsistent, are adept at handling outliers, and require no scaling or transformation of datasets (Ruiz et al., 2010). The algorithm reduces data into subsets and can handle high-dimensional datasets. Indeed, the potential of Random forests has already yielded promising results at a small scale in a landmark study considering the impacts of rainfall and temperature data on infection rates of C. pipiens and Culex restuans mosquitoes in the greater Chicago area by West Nile Virus (Ruiz et al., 2010). Additionally, machine learning has been gaining popularity in other entomological studies to explain the abiotic drivers of insect trap catch (Midgarden and Lira, 2006; Enkerlin et al., 2016; Bekker et al., 2019).
Here, we test whether a random forest trained on historical climatic and mosquito collection data can accurately explain future mosquito trapping occurrence within the continental United States. We examine various environmental factors, including minimum, maximum, and mean temperature, rainfall, elevation, and dew point, to determine the relative importance of each environmental factor to model accuracy. We explained above that resilience to the cold is of utmost biological relevance to these mosquitoes. Here, we investigate whether minimum temperature can explain mosquito trap events. Further, we examine whether different combinations of climatic factors can be combined to improve the accuracy of our model.
Materials and Methods
Collection of Data
Mosquito abundance data of the United States comprising all the parameters were downloaded from Vectorbase1 on Dec 28, 2019 (Supplementary Table 1). The trap data ranged from 2010 to 2019. The collection data from Vectorbase was comprised of 642,812 C. pipiens and 209,658 C. quinquefasciatus collected from various locations in the United States. Because entrees in varied from samples trapped per day and per month, the data were combined into per year counts per trap site. The data were rearranged and aggregated to obtain the sum of each mosquito species collected per year irrespective of the trap used for their collection. After curation there were 544,040 C. pipiens and 139,054 C. quinquefasciatus for the dataset leading up to 2016 and 98, 772 C. pipiens and 70, 601 C. quinquefasciatus for the post-2017 dataset. After combining the data per year in the data leading up to 2016, we had 2,336 zeroes for C. pipiens and 2,009 zeroes for C. quinquefasciatus. For the post-2017 data we have 486 zeroes for C. pipiens and 560 zeros for C. quinquefasciatus. We included all the trap available trap and scored trap sites collecting mosquitoes other than C. pipiens and C. quinquefasciatus as negative trapping events.
In addition to species abundance and year of collection, other retained parameters were the longitude and latitude of each trap. Environmental data including minimum, maximum, and mean temperature, rainfall, elevation, and dew point were retrieved from the PRISM climate group.2 The available environmental data was 30-year average for all the parameters.
Collating Mosquito Abundance Data and Environmental Data
The coordinates of environmental data were matched using QGIS33 (QGIS, 2020) to align the mosquito abundance with environmental parameters. Subsequently, the mosquito abundance was grouped into different environmental zones based on climate parameters and elevation.
Pattern Visualization and Multivariate Analysis
All the statistical analyses were performed in R software version 3.5.1 (R Core Team, 2020). A principal coordinate analysis (PCoA) was performed to visualize the pattern of C. pipiens and C. quinquefasciatus occurrence in ordination space and their relationship with environmental parameters using Euclidean distance matrix produced using vegdist function from vegan package. The matrix thus obtained was used for PCoA calculations using wcmdscale function in vegan package (Oksanen et al., 2020). The values thus generated were plotted using ggplot2 (Wickham, 2016). A PERMANOVA (Permutational Multivariate Analysis of Variance) was conducted using the “adonis” function in the vegan package of “Euclidean” distances of environmental parameters (Dixon, 2003; Oksanen et al., 2020). We conducted the PERMANOVA to determine if the presence and absence of the C. pipiens and C. quinquefasciatus groups are separated by environmental factors at multivariate level. This tested whether the presence and absence of each species in the various trap locations are influenced by environmental factors. Further, this analysis determined whether the centroid of presence and absence are different in multidimensional scaling. For reference markdown file of C. pipiens PCoA and PERMANOVA are provided in supplementary material (Supplementary File 1); and same pipeline was used to determine PCoA and PERMANOVA for C. quinquefasciatus.
Random Forest
Proposed by Leo Breiman, random forest builds multiple decision trees and merges them together to get a more accurate and stable prediction (Breiman, 2001). This model, in terms of strength of the individual predictors and their correlations, gives insight into the ability of the random forest to predict. Tree selection was made using the random Forest package in R (Liaw and Wiener, 2002). Mosquito occurrence is difficult to predict using traditional models utilizing simple formulas to examine simple relationships. Random Forests, a machine learning method does not base its predictions on any individual regression formula but is based on ensemble learning, thus increasing the accuracy compared to regression models. Random Forests were used to model the effect of climatic factors on the occurrence of C. pipiens and C. quinquefasciatus mosquitoes. Random Forests combine multiple decision trees in an iterative algorithm to predict presence or absence.
Before running random forest models, an analysis was performed using the Boruta package (Kursa and Rudnicki, 2010) to identify the relevant environmental parameters, which best explained the presence of C. pipiens and C. quinquefasciatus to avoid overfitting of data. The mosquito data was divided into three groups – mosquitoes collected before and from the beginning Jan, 2017; mosquito abundance data before Jan 2017 was bootstrapped into two sets consisting of “Mos-training” (constituting 75% of data) and “Mos-test” (constituting 25% of data) data; collectively called “Mos-data” (Supplementary Table 2). The data comprising the mosquito abundance after Jan, 2017 is called “Mos-2017” (Supplementary Table 3). Two random forest models each for C. pipiens and C. quinquefasciatus were generated using “Mos-training” data using environmental parameters as independent variables, and was used to determine decrease in mean accuracy (indicator of importance of independent factor) and partial dependence plots for each environmental variableModel thus generated was fitted to Mos-test data and Mos-2017 data. Subsequently, these models were used to determine out of bag error (OOB) and their ability to correctly predict C. pipiens and C. quinquefasciatus occurrence for the “Mos-training,” “Mos-test,” and “Mos-2017” data. Once fitted the models were used to predict presence and absence of each species and inaccurate calls were determined. We define inaccurate calls as including both when the mosquitoes were present after a prediction of absence and vice-versa. Detailed R-script and pipelines for C. pipiens Boruta analysis (Supplementary File 2), random forest for train data (Supplementary File 3), test data (Supplementary File 4), and Mos-2017 data (Supplementary File 5) are provided in Supplementary Material. Same pipeline was used for C. quinquefasciatus.
Results
Data Curation
After curation and arranging the data in accordance to climate parameters, 3,619 rows/traps containing a total of 642,812 and 209,658 C. pipiens and C. quinquefasciatus, respectively, were included for further analysis (Supplementary Table 1). The data were divided into two parts pre Jan 2017 and post Dec 2016 (Mos-2017). It was done to generate an untouched data set to determine accuracy of Random Forest. Data prior to Dec 2016 comprised of 2,882 (80% of total traps) of rows (traps) and out of which 2,336 and 2,009 rows/traps did not catch C. pipiens and C. quinquefasciatus, respectively. Mos-2017 comprised of 737 (20% of total traps) traps and out of which 486 and 560 did not trap catch C. pipiens and C. quinquefasciatus, respectively.
Influence of Various Factors on Culex pipiens and Culex quinquefasciatus
A principal coordinate analysis of C. pipiens separates its presence and absence on the first axis, although the C. pipiens indicates two populations, one is likely to be driven by all the temperature parameters and dewpoint, and other only by elevation (Figure 1A). Culex quinquefasciatus occurrence is also separated on the first axis and shows presence of two populations one of which appears to be driven by temperatures and dewpoint and second population shows an orientation opposite to the C. pipiens population that was driven by elevation (Figure 1B). All the environmental parameters contribute toward the occurrence of C. pipiens and C. quinquefasciatus (C. pipiens-PERMANOVA: environmental parameters, p = 0.001; C. quinquefasciatus-PERMANOVA: environmental parameters, p = 0.001).
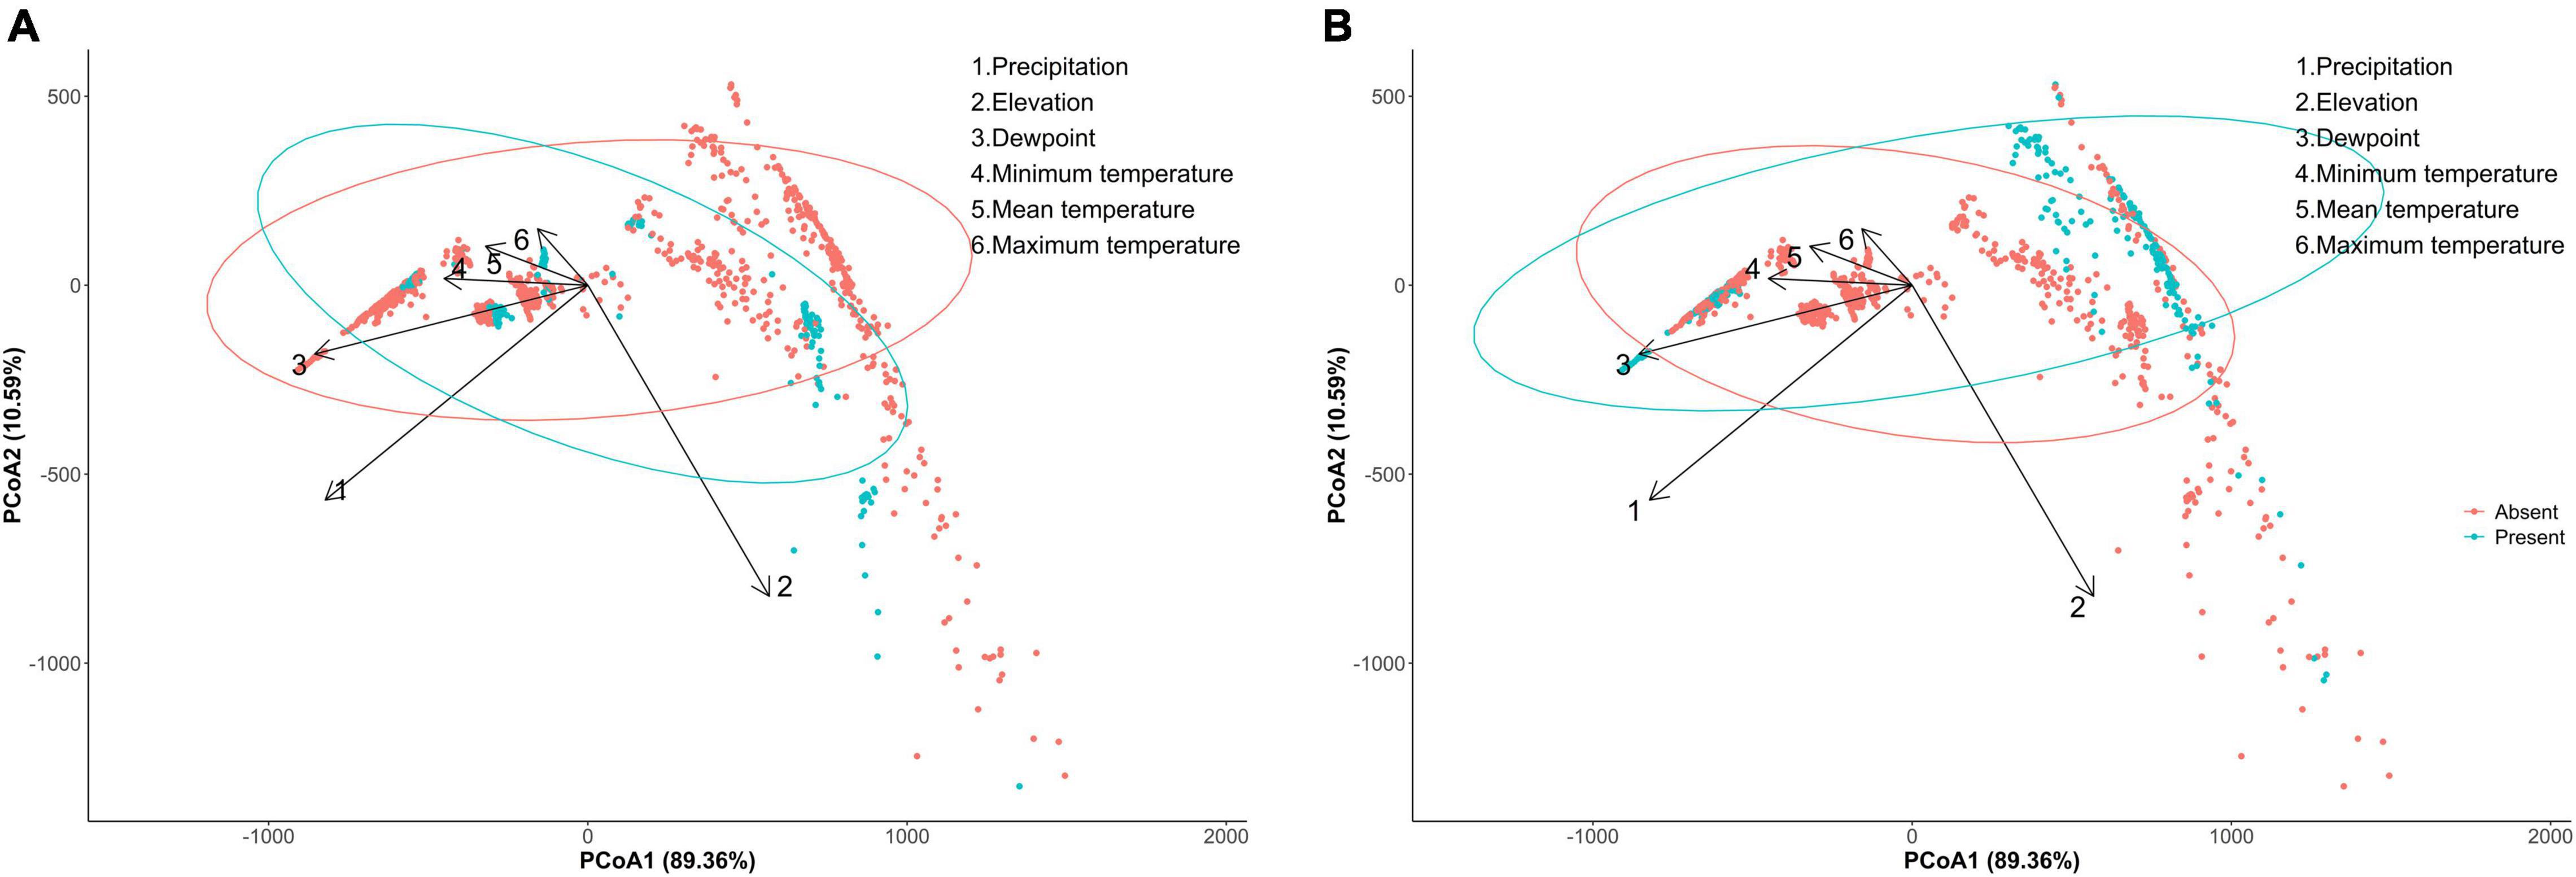
Figure 1. Principal component analysis (PCoA) between incidence of (A) Culex pipiens, (B) Culex quinquefasciatus with overlaying environmental parameters.
Variable Importance
The Boruta algorithm was first implemented to choose the influencing variables that can be used as predictors for the random forest and to avoid overfitting. The Boruta analysis determined that all the environmental parameters are important in determining the C. pipiens and C. quinquefasciatus occurrence (Supplementary Figures 1, 2). Then, using Boruta selected variables, a random forest model was executed to determine the most important variable associated with the occurrence of C. pipiens and C. quinquefasciatus. Random forest analysis shows that precipitation was the most important environmental variable affecting the occurrence of C. pipiens (Mean decrease in accuracy = 72%) and C. quinquefasciatus (Mean decrease in accuracy = 38.3%) followed by elevation (Figures 2A,B). Mean and maximum temperatures were the least importance variable affecting the occurrence of C. pipiens and C. quinquefasciatus (Figures 2A,B).
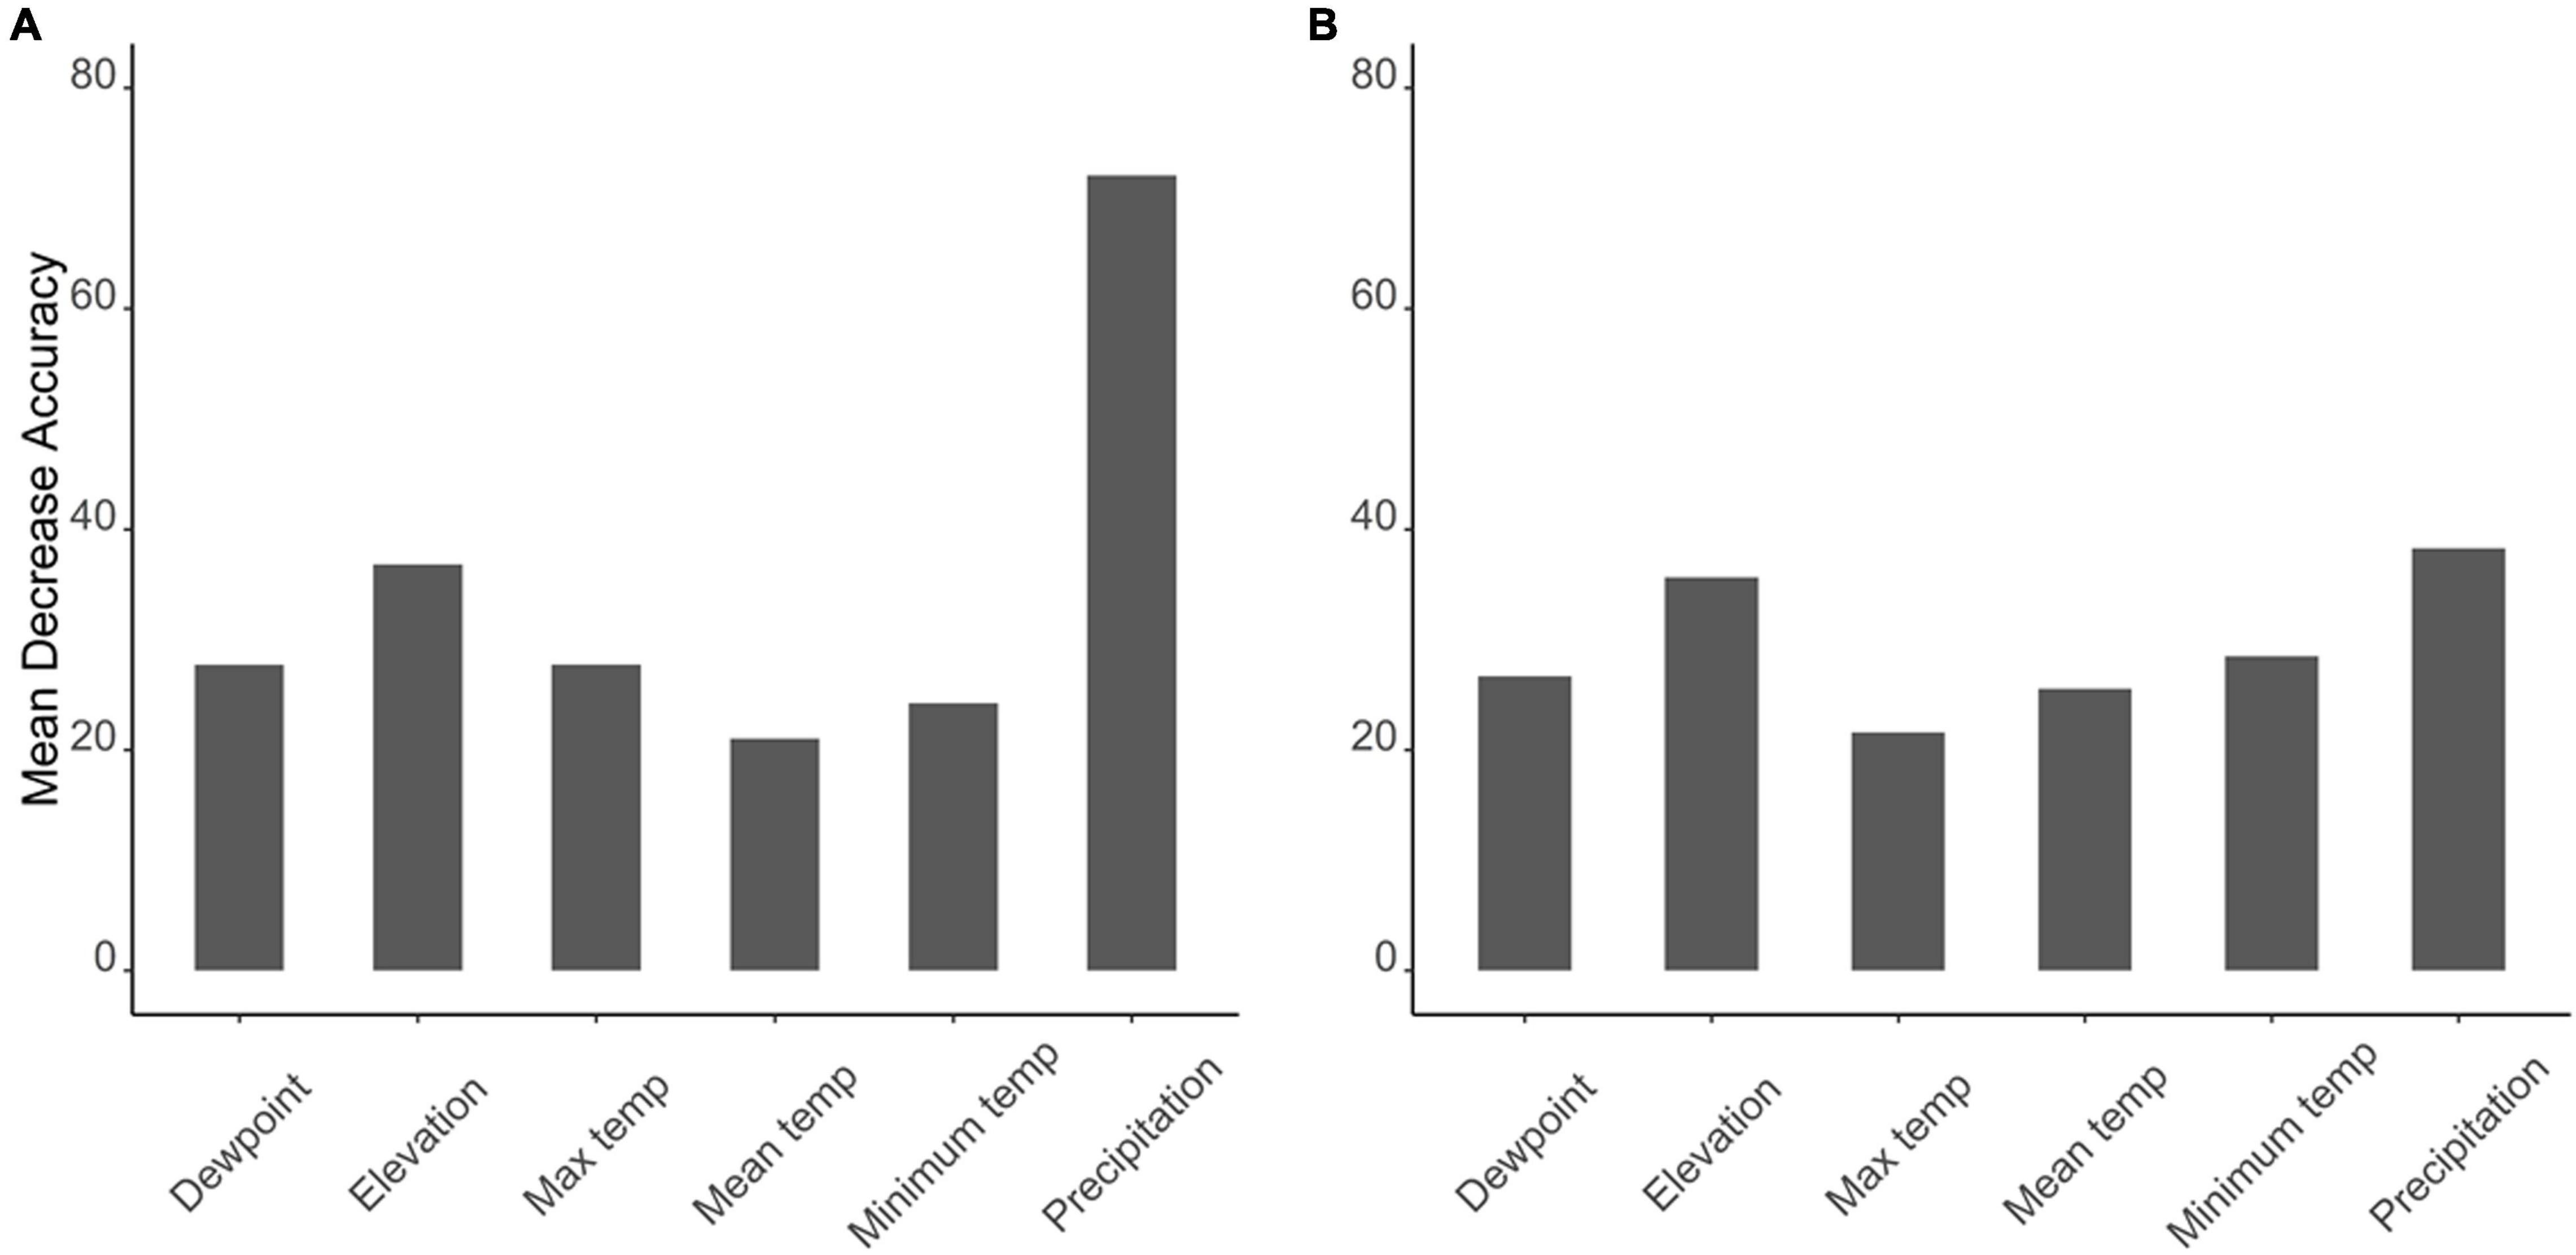
Figure 2. Graphs depicting most important environmental parameters to predict (A) C. pipiens and (B) C. quinquefasciatus.
Species Prediction
Environmental parameters demonstrated a very high accuracy (ca. 98%) in predicting the C. pipiens in “Mos-train” and “Mos-test” data. However, this decreases to 78% when the “Mos-2017” data was used (Table 1 and Figure 3A). These results indicate that random forest can utilize environmental parameters to explain C. pipiens occurrence, though absence is more accurately predicted than presence (Table 1). Accuracy of prediction of C. quinquefasciatus occurrence using environmental parameters was high with an OOB of ca. 6% (Table 1 and Figure 3B) for “Mos-train” data, and there was an increase in OOB to 10 and 8% when a random forest model was used for “Mos-test” and “Mos-2017” data. Overall, the prediction accuracy decreased when “Mos-2017” data was used (Table 1). Similarly, the accuracy in detecting the presence of C. pipiens and C. quinquefasciatus was lower than to detect their absence.
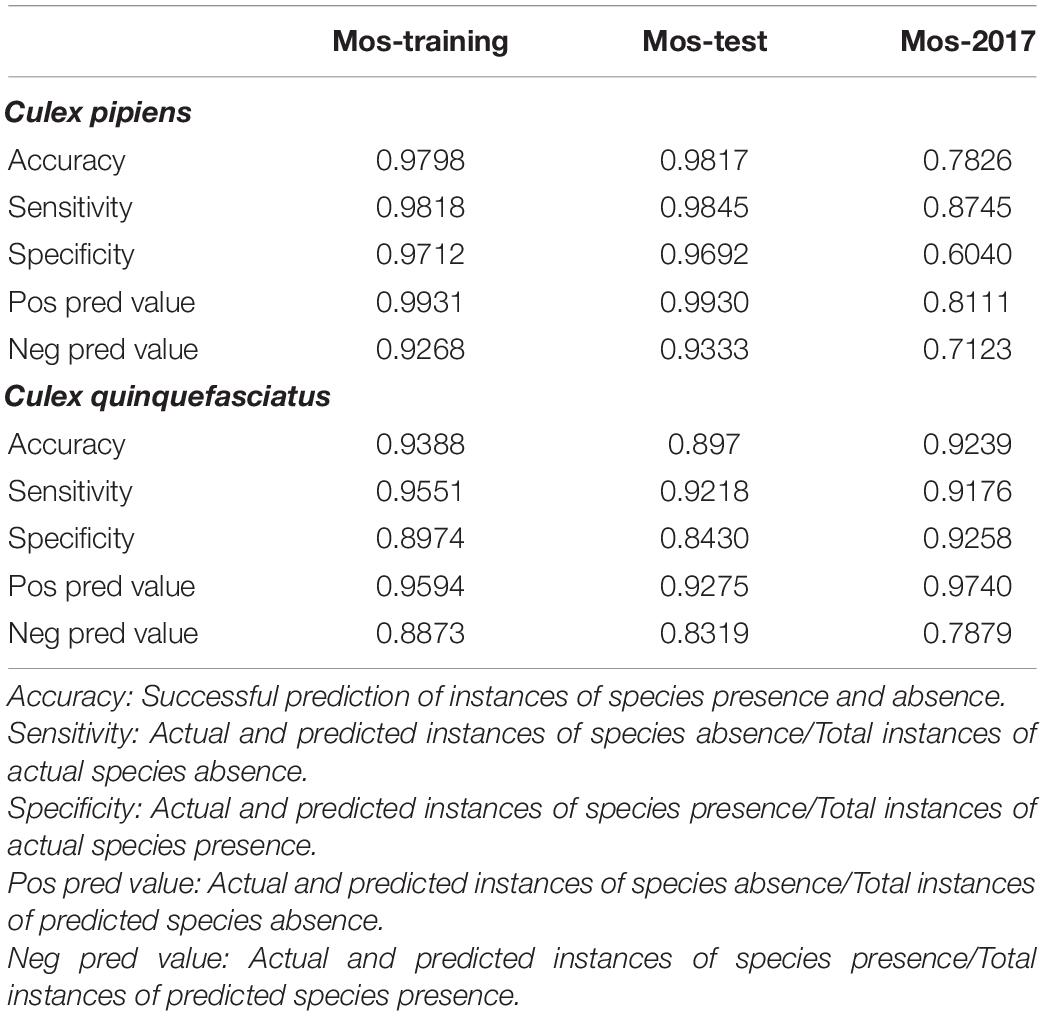
Table 1. Accuracy in predicting Culex pipiens and Culex quinquefasciatus using environmental parameters as predictors.
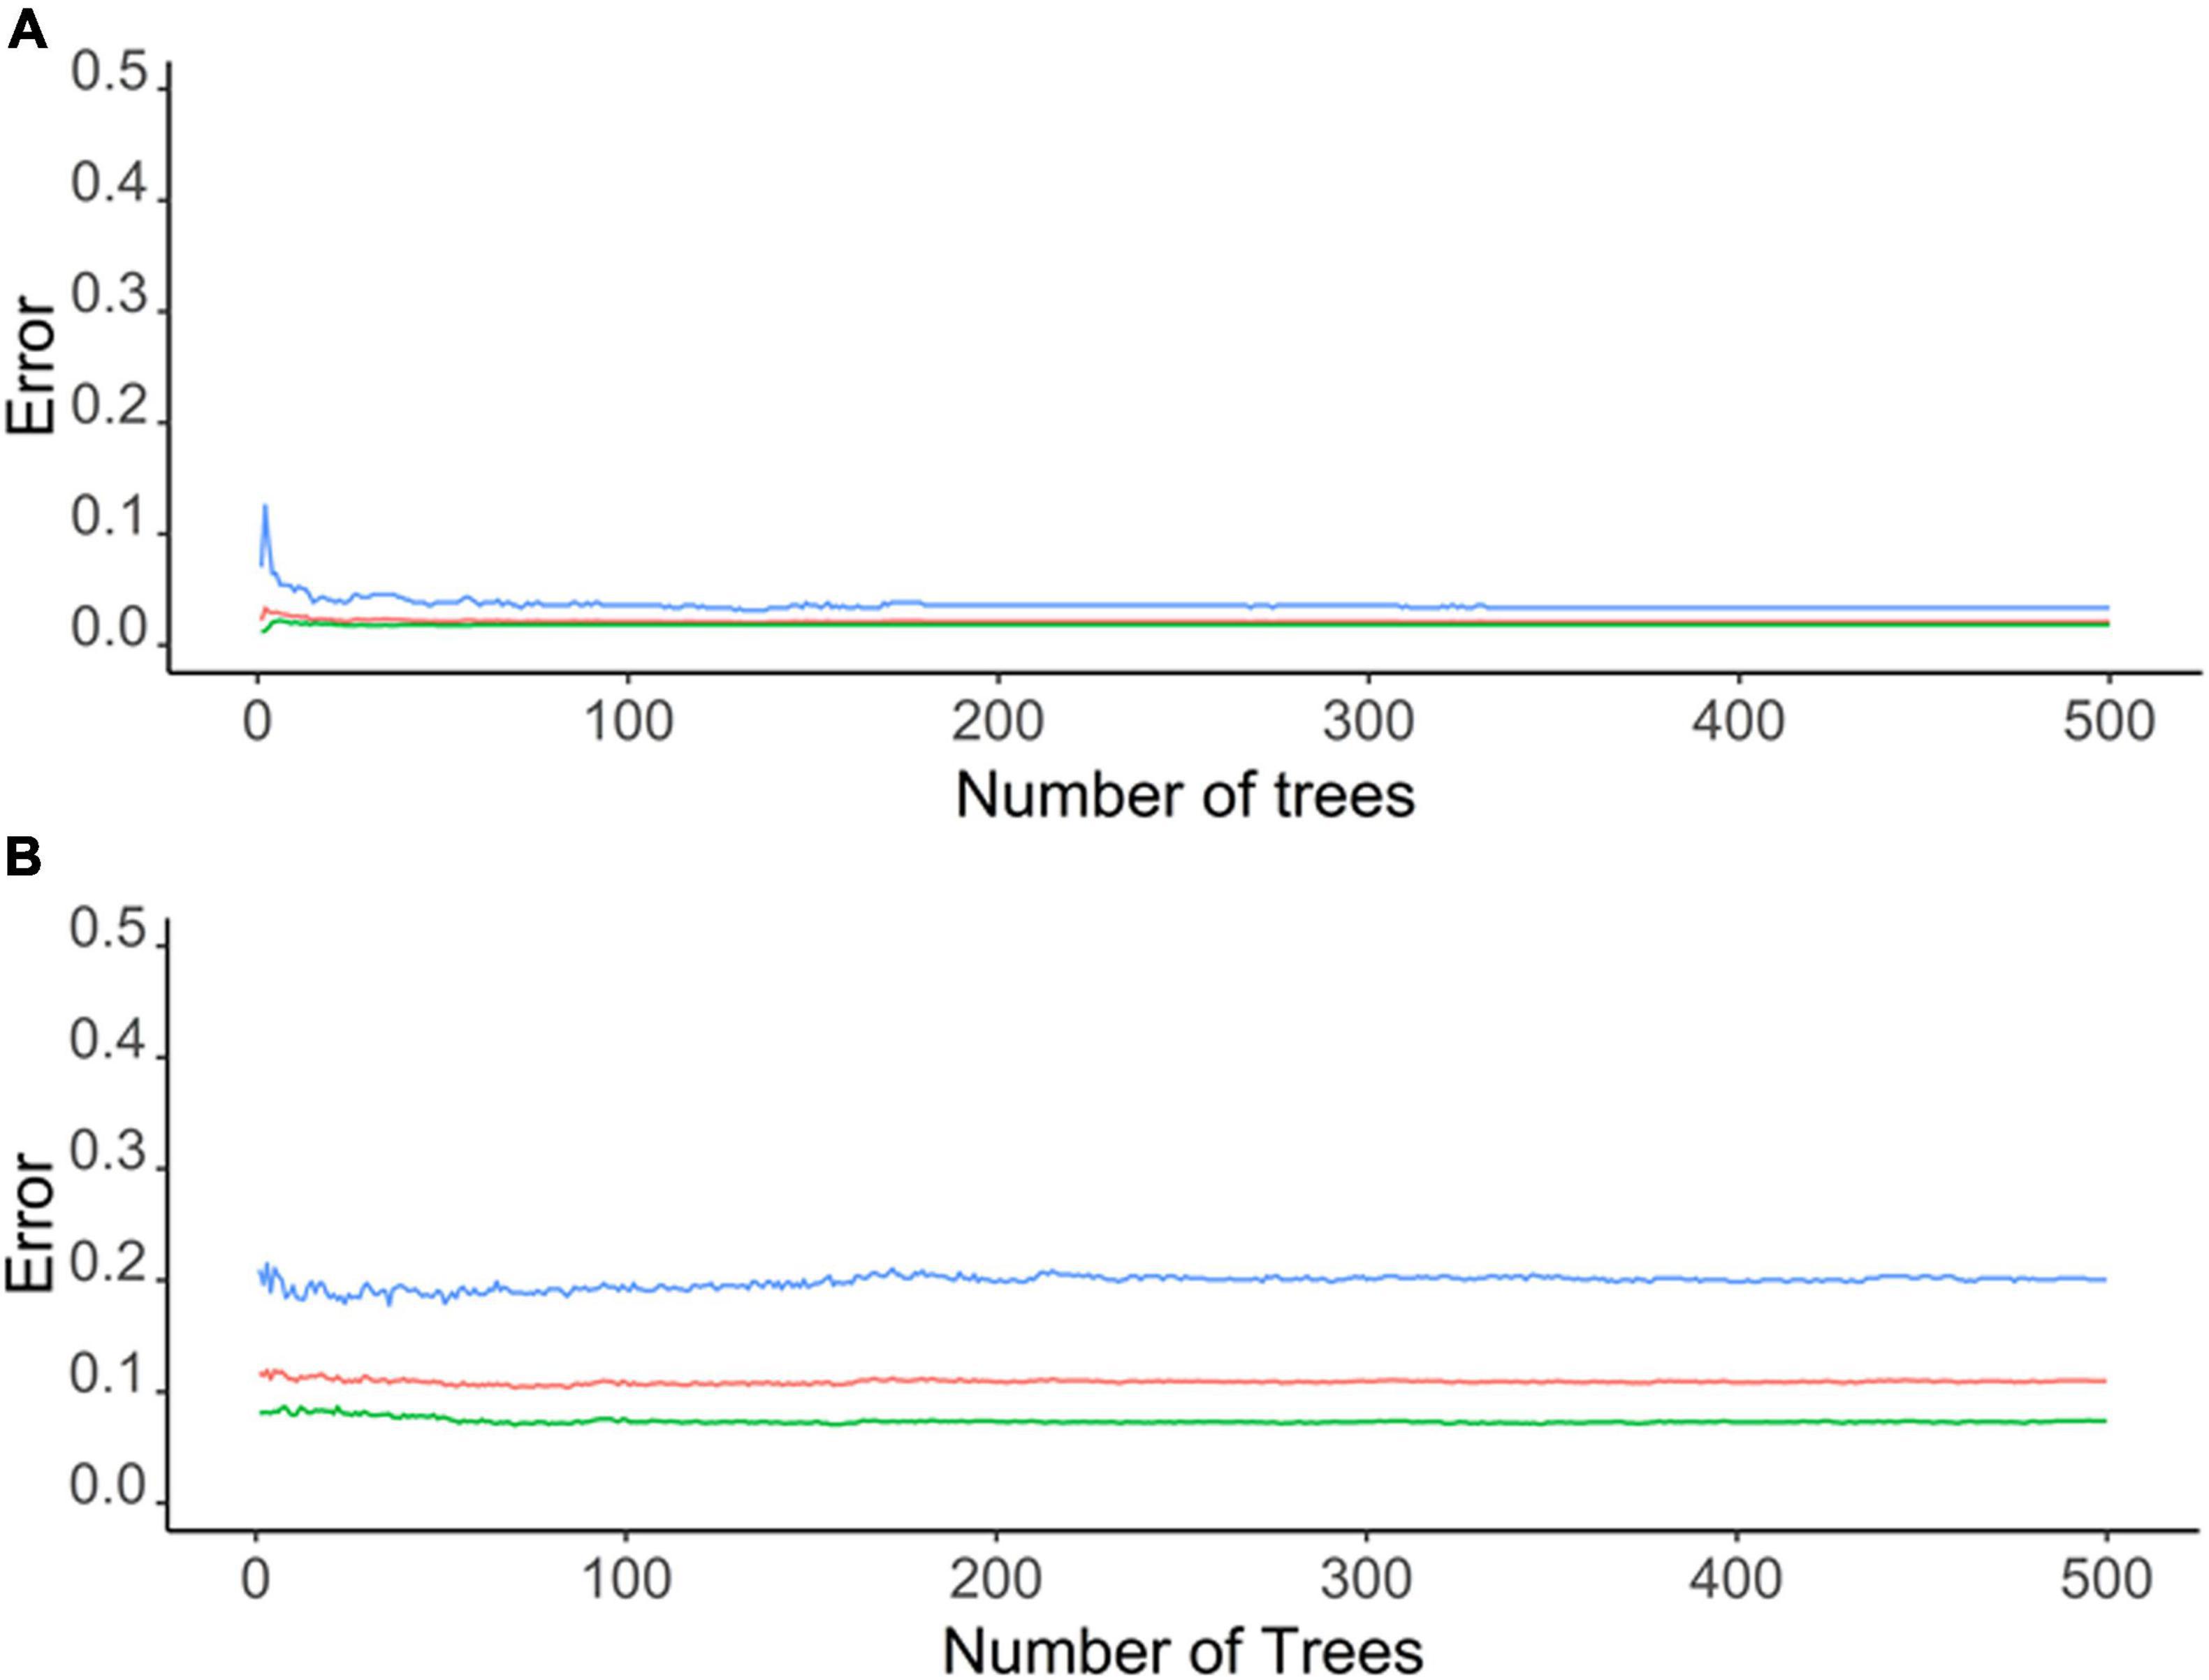
Figure 3. Graphs depicting out of bag (OOB) error of a random forest model for (A) C. pipiens and (B) C. quinquefasciatus occurrence with environmental parameters as predictor.
Partial Dependence Plots
All three temperature parameters (minimum, maximum, and average temperature) have a clear impact on C. pipiens occurrence, which is in line with the PCoA plots, indicating a minimum temperature of 11°C is required for C. pipiens presence (Figures 4, 5). Culex quinquefasciatus also shows an explicit inverse dependency on temperature, and after crossing a threshold temperature value mosquito was absent from the trap. The temperature threshold for presence of C. quinquefasciatus was 17 and 24°C, mean and maximum temperature, respectively (Figures 6, 7).
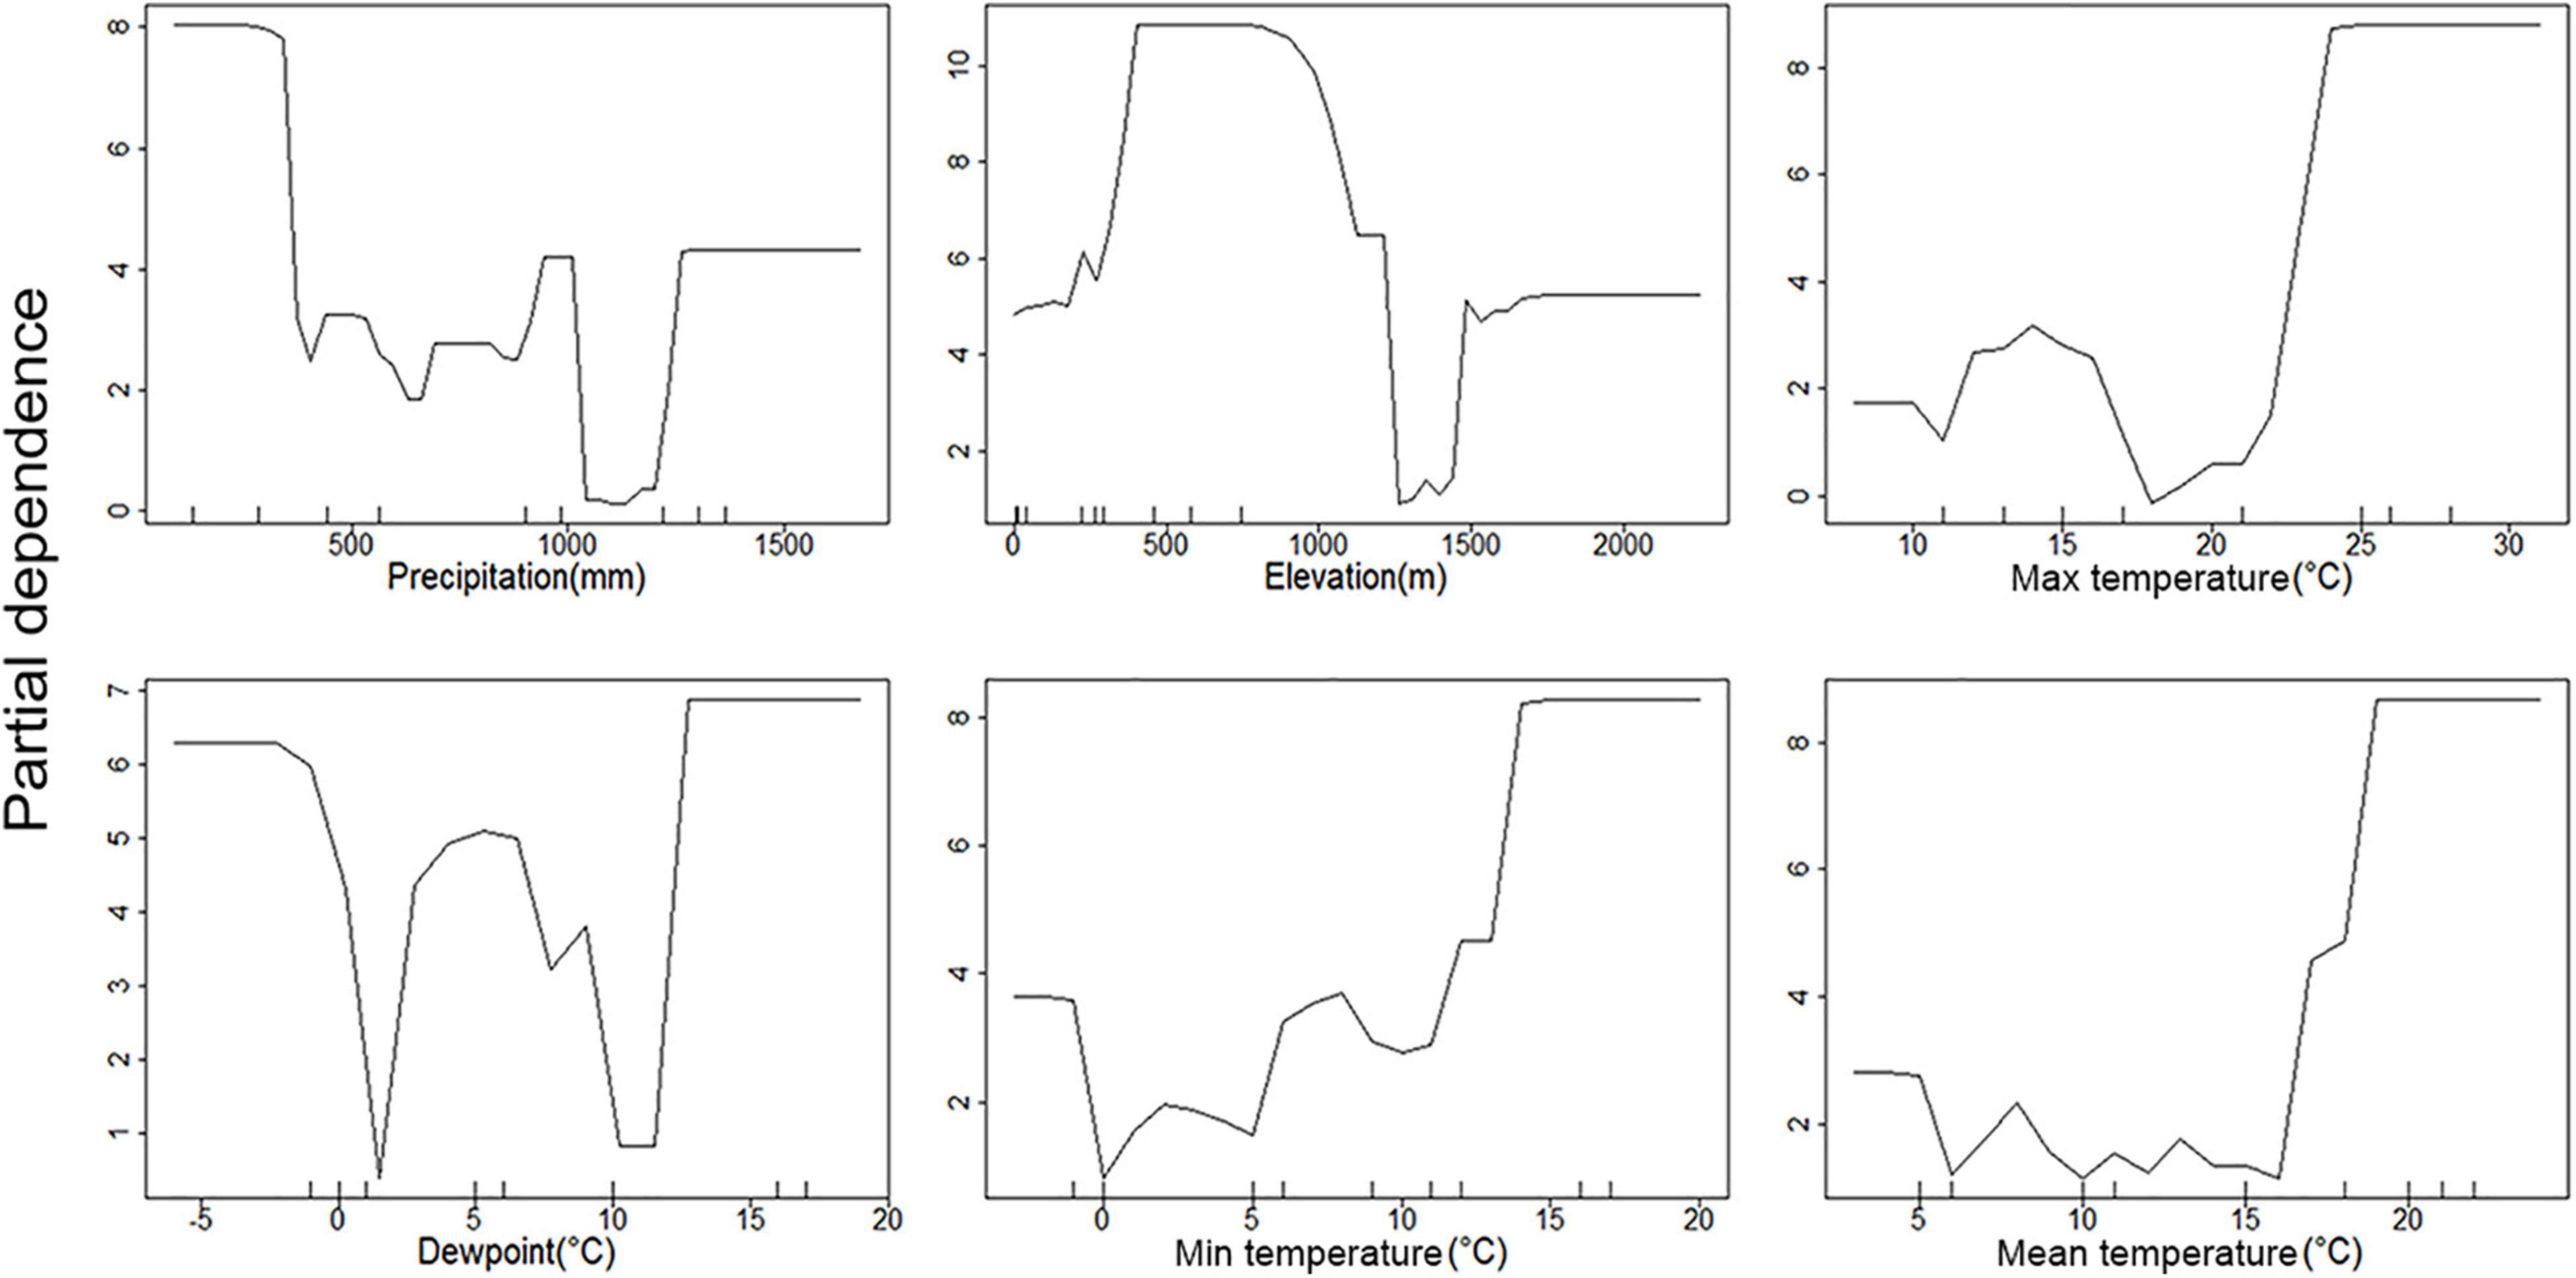
Figure 4. Partial dependence plots of environmental parameters showing their association with C. pipiens occurrence. Y-axis is partial dependence to accurately predict C. pipiens occurrence.

Figure 5. Partial dependence plots of paired environment parameters showing their association with C. pipiens occurrence. Intensity of color is proportional to partial dependence of C. pipiens occurrence on various climate factors.
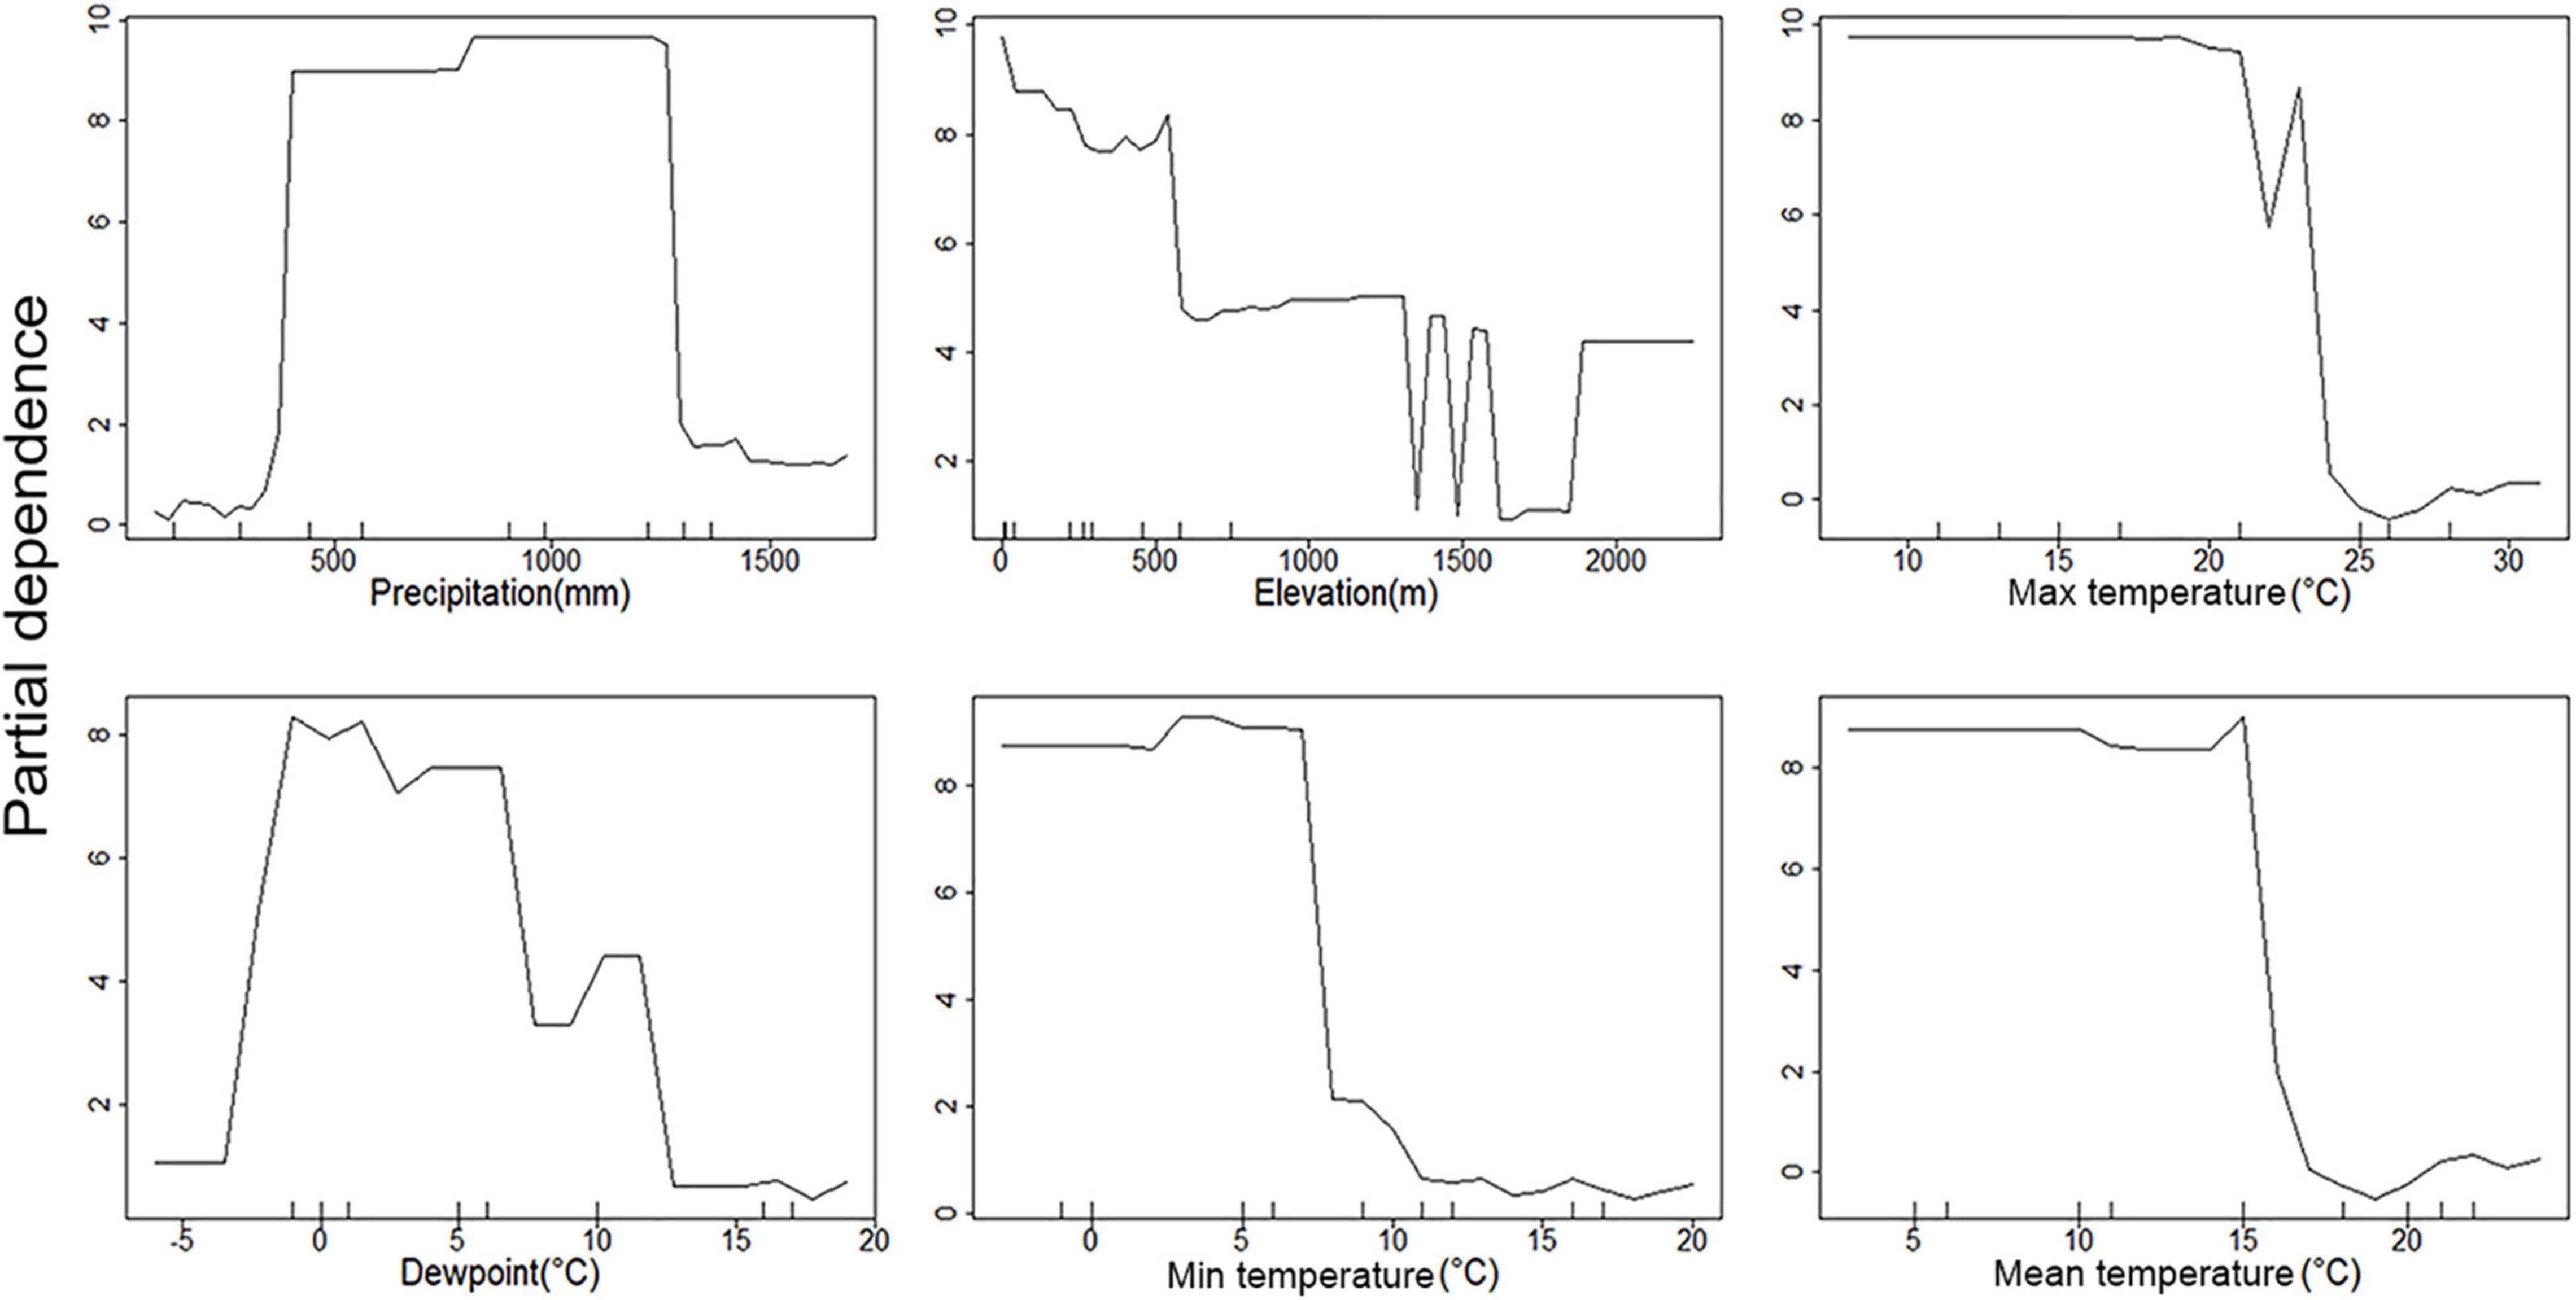
Figure 6. Partial dependence plots of environmental parameters showing their association with C. quinquefasciatus occurrence. Y-axis is partial dependence to accurately predict C. quinquefasciatus occurrence.
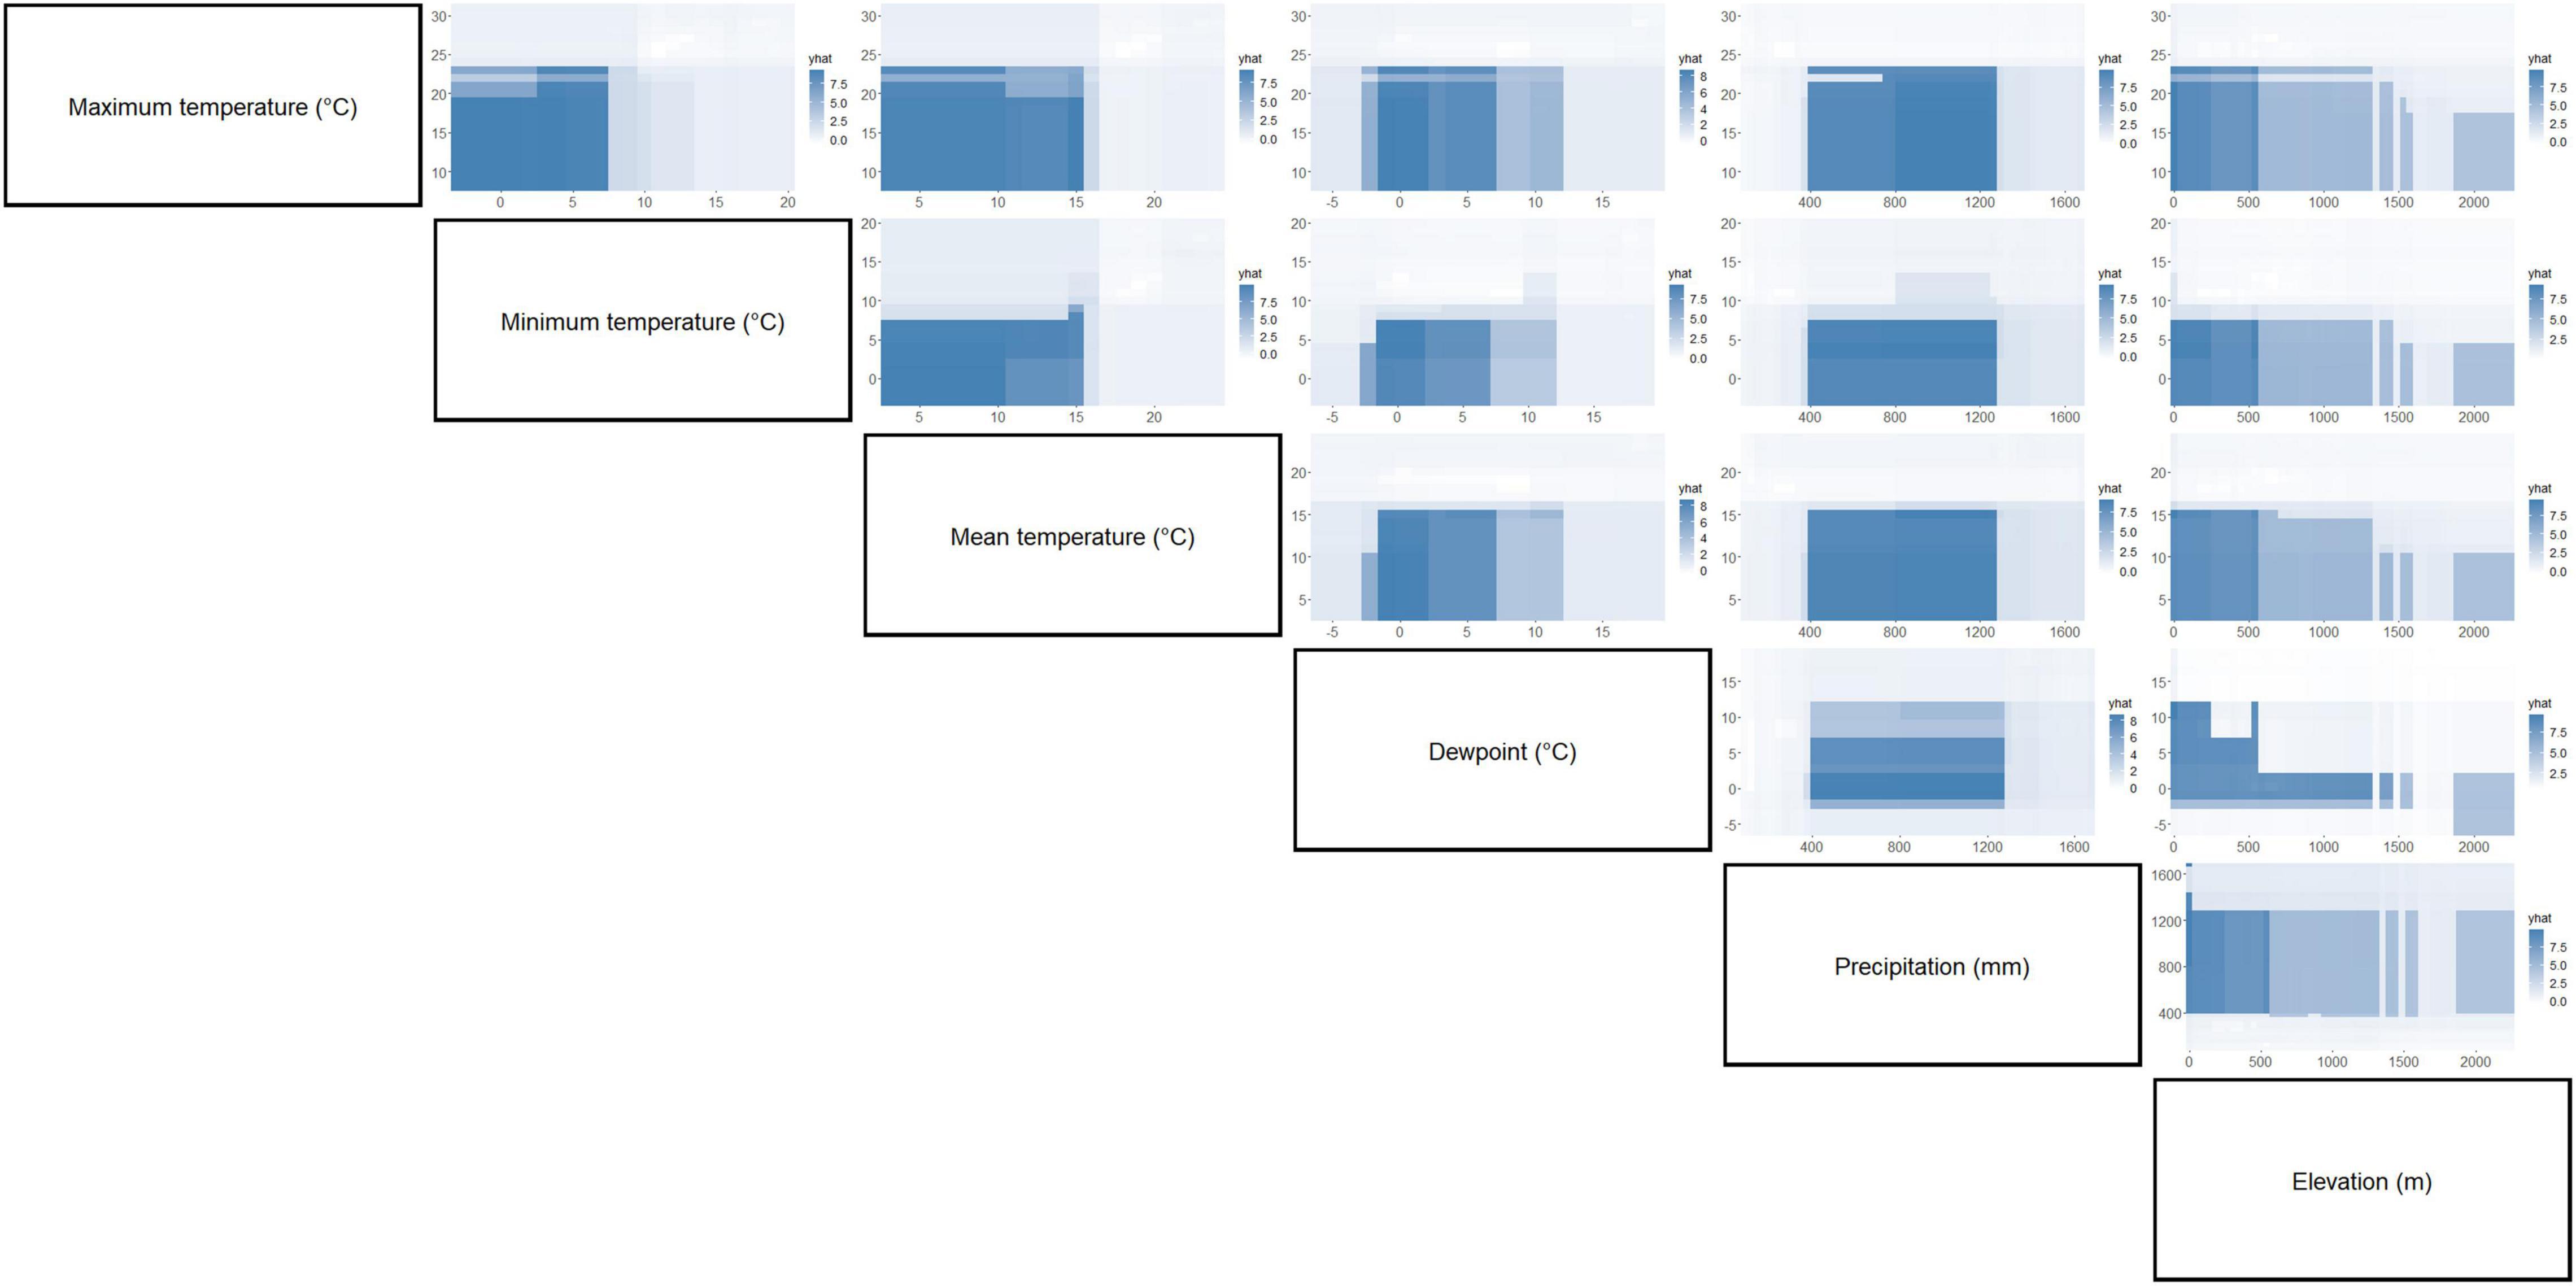
Figure 7. Partial dependence plots of paired environment parameters showing their association with C. quinquefasciatus occurrence. Intensity of color is proportional to partial dependence of C. quinquefasciatus occurrence on various climate factors.
Actual Versus Prediction
We then looked at how well our models predict occurrence and where most of the inaccurate calls (incorrect prediction of presence or absence) were concentrated for each variable. When environmental condition was used as a predictor, most of the inaccurate calls were associated at the values for which C. pipiens were absence and presence overlap, and a similar trend of concentrated inaccurate calls was observed where presence and absence of C. quinquefasciatus overlap, though, more inaccurate calls were presence compared to absence (Supplementary Figures 3–8).
Discussion
Observed and Predicted Patterns
This study examined the relationships between Culex pipiens, the northern house mosquito, and the southern house mosquito Culex quinquefasciatus, and environmental factors, and other mosquitoes. Although these two species can hybridize their divergent life-history traits and unique ecological niches maintain distinctly geographically separate populations in the continental United States. Diapause is an alternative developmental program that results in a suite of profound changes within the mosquito in response to seasonal variations of photoperiod. Among these adaptations are a delay of reproductive development, increased lipid storage, and resistance to desiccation and cold temperature. The ability of C. pipiens to diapause and the lack of the trait in C. quinquefasciatus is thought to contribute to both the temporal and geographic segregation of these populations.
Strength of Predictors
Separation of C. pipiens and C. quinquefasciatus within Euclidian space show temperatures to be the greatest environmental factors contributing to past trappings of both species, with some further within-population separation with differences in precipitation and elevation (Figures 1A,B). As the trap sites and the environmental factors were static, the shape of the population stayed consistent between the two ordinations, but we found a clear separation between the two taxa. Interestingly, our random forest shows that the variables of the greatest importance in explaining the presence of C. pipiens were precipitation, and elevation for C. quinquefasciatus (Figures 2A,B). It is important to note that these plots are not indicators of absence or presence but rather the ability of these measures to account for past mosquito abundance. As such, sharp increases of predictive strength at either end of the x-axes likely indicate the limits of tolerance for these insects at environmental extremes. Valleys between two high accuracy peaks likely reflect environmental gradients between conditions where the mosquitoes optimal and stressed environments. As our partial dependence plots of the environmental factors (Figures 4, 6) show similar trends in association between precipitation and temperatures, minimal differences in the importance of the two taxa factors were unsurprising. Therefore, we created interaction plots of each mosquito and environmental factor that account for these interactions between the environmental factors (Figures 5, 7). The similar shapes of multiple factors give further evidence of the relationship between the factors, and these relationship of environmental variables must be considered when utilizing the model to evaluate the historic occurrence of mosquitos at individual sites In order to statistically test the importance of each factor in impacting occurrence, we performed a generalized linear model with binomial transformations. This test confirmed that all environmental parameters utilized in our models significantly influence the C. pipiens (p < 0.001) and C. quinquefasciatus (p < 0.001) occurrence.
Random forest analyses indicate that the predictive strengths (mean decrease in accuracy) of the abiotic factors were generally high. The sensitivity, or the proportion of correctly predicted species, remained high for absence in both mosquitoes. C. quinquefasciatus demonstrated high sensitivity to presence, but that of C. pipiens was quite low. Generally, predicting the absence should be more accurate than presence. This is because organisms must actively exert effort to spread and maintain populations, and stochastic events are more likely to result in the loss of said populations. The disparity in sensitivity of the two mosquitoes may be due to differences in life-history strategies. C. pipiens can enter diapause, an alternative developmental program in which their metabolic resources are diverted away from reproduction to survival, in anticipation of harsh winter conditions. In contrast, it is thought that C. quinquefasciatus are unable to cope with the rigors of winter and hard frosts act as latitudinal barriers to persistent northern colonization (Kothera et al., 2009). While these mosquitoes may hybridize, the unique populations are suggestive of selective pressure maintaining pure populations (Kothera et al., 2009). With this in mind, one would assume C. pipiens would face less difficulty migrating past the southern boundaries of their historic northern distribution, yet they retain a predominantly northern distribution. It is unknown whether this separation is due to reproductive barriers or purifying selection against another trait, but we chose to investigate whether this phenomenon was associated with broad-scale climatic data. However, we do note that a landmark study found the presence of both mosquitoes and a true hybridization zone in Mexico City (Diaz-Badillo et al., 2011). Interestingly, they found that the densities of the hybrids were higher during the rainy seasons, but it is difficult to determine whether this was driven by directly by changes in the environment or indirectly by increasing populations of C. pipiens and C. quinquefasciatus, which would also be influenced by the precipitation. They suggest the spread of West Nile virus to be a driver of hybridization, and it would be interesting to see how the inclusion of the virus data would impact the RF predictions in future analyses.
The importance of precipitation as a major factor in our analyses is unsurprising. Changes in precipitation often coincide with the time of year in both hot and cold climates. Medical entomologists have long associated large increases in mosquito abundance after periods of increased rains associated with wet seasons. This is evident in the partial precipitation plots. C. pipiens predictive power seems to be strongest at the high and low precipitation extremes (Figure 4), while C. quinquefasciatus seems to be most predictable at moderate levels between the two extremes (Figure 6). This is likely due to the absence being more accurate at explaining the occurrence of C. pipiens using precipitation data, whereas presence data is the more accurate for C. quinquefasciatus data. Whether the increase in accuracy provided by each factor is absence or presence data, these trends persist to a certain degree to other environmental parameters.
Problems
In total, 98.17 and 72.77% of observed variances were explained in our random forest models for C. pipiens and C. quinquefasciatus, respectively. Perhaps this unexplained variability is a result of our use of annual mean data and does not account for monthly or seasonal flux. For example, the importance of minimum temperatures may be reduced by how rarely freezing temperatures are a factor. Alternatively, we acknowledge that it is difficult to discriminate between the two taxa morphologically, and these results may be skewed toward an intrinsic bias classifying mosquitoes found above 39° north latitude, the established upper limit of the hybrid zone, as C. pipiens (Joyce et al., 2018).
Recent studies have indicated that consideration of spatial dependency may improve the quality of random forest models (Georganos et al., 2019). The models described herein did not consider geospatial dependency as a factor, and future studies may be improved by their inclusion. Further, we note that our random forests could have problems coping with data values that fall outside of the training set. Such issues could be caused by migrations caused by anthropogenic and climatic changes in the environment, interactions with other animals or trapping bias. We choose 2017 as the cutoff for our training dataset to maximize the data available to build the random forest models. However, we acknowledge that this reduces the test data set. We emphasize that these model explanations are best used to determine which environmental factors are most likely to be of use to surveillance efforts in the continental United States, the region which they were trained. However, it will be interesting to see how robust the models are to the inclusion of new data as it is collected.
Conclusion
This study shows the potential of Random Forest and its strong explanatory capability in stratifying the environmental factors related to mosquito occurrence. Although it was not able to explain the density of local populations with high accuracy and the dynamics of populations at specific times, perhaps a more sophisticated predictive model for the mosquito population may be achieved if more detailed information of local mosquito populations is collected and climate data according to time fluctuations are supplemented. One may compare the accuracy of each of the six environmental factors at any given site by plotting each on the given partial dependence plots and choose the combination of factors that may lend the most robust explanatory accuracy to future trap events.
Data Availability Statement
The original contributions presented in the study are included in the article/Supplementary Material, further inquiries can be directed to the corresponding author.
Author Contributions
AA and DK designed the study. AA performed the data analysis. AA, CS, DS, and DK analyzed the data, wrote the manuscript, read, and approved the final manuscript.
Author Disclaimer
The mention of trade names or commercial products in this article is solely for the purpose of providing specific information and does not imply a recommendation or endorsement by the U.S. Department of Agriculture. All programs and services of the U.S. Department of Agriculture are offered on a non-discriminatory basis without regard to race, color, national origin, religion, sex, age, marital status, or handicap.
Conflict of Interest
The authors declare that the research was conducted in the absence of any commercial or financial relationships that could be construed as a potential conflict of interest.
Publisher’s Note
All claims expressed in this article are solely those of the authors and do not necessarily represent those of their affiliated organizations, or those of the publisher, the editors and the reviewers. Any product that may be evaluated in this article, or claim that may be made by its manufacturer, is not guaranteed or endorsed by the publisher.
Acknowledgments
We would like to thank Erika Mudrak at the Cornell Statistical Consulting Unit (Cornell University, Ithaca) for advising us on the statistical analyses utilized in this study.
Supplementary Material
The Supplementary Material for this article can be found online at: https://www.frontiersin.org/articles/10.3389/fevo.2021.773360/full#supplementary-material
Footnotes
- ^ https://www.vectorbase.org/popbio/
- ^ http://www.prism.oregonstate.edu/
- ^ https://qgis.org/en/site/
References
Alaniz, A. J., Carvajal, M. A., Bacigalupo, A., and Cattan, P. E. (2019). Global spatial assessment of Aedes aegypti and Culex quinquefasciatus: a scenario of Zika virus exposure. Epidemiol. Infect. 147:e52. doi: 10.1017/S0950268818003102
Amraoui, F., Tijane, M., Sarih, M., and Failloux, A. B. (2012). Molecular evidence of Culex pipiens form molestus and hybrids pipiens/molestus in Morocco, North Africa. Parasit. Vectors 5, 2010–2013. doi: 10.1186/1756-3305-5-83
Arensburger, P., Megy, K., Waterhouse, R. M., Abrudan, J., Amedeo, P., Antelo, B., et al. (2010). Sequencing of Culex quinquefasciatus Establishes a Platform for Mosquito Comparative Genomics. Science 330, 86–88. doi: 10.1126/science.1191864
Barr, A. R. (1957). The Distribution of Culex P. pipiens and C. P. quinquefasciatus in North America. Am. J. Trop. Med. Hyg. 6, 153–165. doi: 10.4269/ajtmh.1957.6.153
Bekker, GFHvG, Addison, M., Addison, P., and van Niekerk, A. (2019). Using machine learning to identify the geographical drivers of Ceratitis capitata trap catch in an agricultural landscape. Comput. Electron. Agric. 162, 582–592. doi: 10.1016/j.compag.2019.05.008
Chaves, L. F., and Kitron, U. D. (2011). Weather variability impacts on oviposition dynamics of the southern house mosquito at intermediate time scales. Bull. Entomol. Res. 101, 633–641. doi: 10.1017/S0007485310000519
Chuang, T. W., Hildreth, M. B., Vanroekel, D. L., and Wimberly, M. C. (2011). Weather and land cover influences on mosquito populations in Sioux Falls, South Dakota. J. Med. Entomol. 48, 669–679. doi: 10.1603/ME10246
Cornel, A. J., Mcabee, R. D., Rasgon, J., Stanich, M. A., Scott, T. W., and Coetzee, M. (2003). Differences in Extent of Genetic Introgression between Sympatric Culex pipiens and Culex quinquefasciatus (Diptera: Culicidae) in California and South Africa. J. Med. Entomol. 40, 36–51. doi: 10.1603/0022-2585-40.1.36
Cutler, D. R., Edwards, T. C. Jr., Beard, K. H., Cutler, A., Hess, K. T., Gibson, J., et al. (2007). Random forests for classification in ecology. Ecology 88, 2783–2792. doi: 10.1890/07-0539.1
De’ath, G., and Fabricius, K. E. (2000). Classification and regression trees: a powerful yet simple technique for ecological data analysis. Ecology 81, 3178–3192. doi: 10.1890/0012-9658(2000)081[3178:CARTAP]2.0.CO;2
Diamond, M. S. (2009). West Nile Encephalitis Virus Infection Viral Pathogenesis and the Host Immune Response. New York: Springer. doi: 10.1007/978-0-387-79840-0
Diaz-Badillo, A., Bolling, B. G., Perez-Ramirez, G., Moore, C. G., Martinez-Munoz, J. P., Padilla-Viveros, A. A., et al. (2011). The distribution of potential West Nile virus vectors, Culex pipiens pipiens and Culex pipiens quinquefasciatus (Diptera: Culicidae), in Mexico City. Parasit. Vectors 4:70. doi: 10.1186/1756-3305-4-70
Dixon, P. (2003). VEGAN, a package of R functions for community ecology. J. Veg. Sci. 14, 927–930. doi: 10.1111/j.1654-1103.2003.tb02228.x
Enkerlin, W., Villaseñor, A., Flores, S., Midgarden, D., Lira, E., Rendon, P., et al. (2016). “Descriptive analysis of the factors affecting the population dynamics of the Mediterranean fruit fly (Ceratitis capitata Wied.) in coffee areas located in Guatemala and its implications in IPM Strategies,” in Proceedings of the 9th International Symposium on Fruit Flies of Economic Importance, (Thailand: International Fruit Fly Steering Committee), 46–63.
Fonseca, D. M., Keyghobadi, N., Malcolm, C. A., Mehmet, C., Schaffner, F., Mogi, M., et al. (2004). Emerging Vectors in the Culex pipiens Complex. Science 303, 1535–1538. doi: 10.1126/science.1094247
Georganos, S., Grippa, T., Niang Gadiaga, A., Linard, C., Lennert, M., Vanhuysse, S., et al. (2019). Geographical random forests: a spatial extension of the random forest algorithm to address spatial heterogeneity in remote sensing and population modelling. Geocarto Int. 36, 121–136. doi: 10.1080/10106049.2019.1595177
Harbach, R. E., Harrison, B. A., and Gad, A. M. (1984). Culex (Culex) molestus Forskal (Diptera: Culicidae): Neotype designation, description, variation, and taxonomic status. Proc. Entomol. Soc. Wash. 86, 521–542.
Hickner, P. V., Mori, A., Chadee, D. D., and Severson, D. W. (2013). Composite linkage map and enhanced genome map for Culex pipiens complex mosquitoes. J. Hered 104, 649–655. doi: 10.1093/jhered/est040
Huang, S., Molaei, G., and Andreadis, T. G. (2011). Reexamination of Culex pipiens hybridization zone in the eastern United States by ribosomal DNA-based single nucleotide polymorphism markers. Am. J. Trop. Med. Hyg. 85, 434–441. doi: 10.4269/ajtmh.2011.10-0679
Joyce, A. L., Melese, E., Ha, P. T., and Inman, A. (2018). Population genetic structure of the Culex pipiens (Diptera: Culicidae) complex, vectors of West Nile virus, in five habitats. Parasit. Vectors 11:10. doi: 10.1186/s13071-017-2594-6
Kang, D., and Sim, C. (2013). Identification of Culex complex species using SNP markers based on high-resolution melting analysis. Mol. Ecol. Resour. 13, 369–376. doi: 10.1111/1755-0998.12083
Kang, D. S., Cotten, M. A., Denlinger, D. L., and Sim, C. (2016). Comparative transcriptomics reveals key gene expression differences between diapausing and Non-Diapausing Adults of Culex pipiens. PLoS One 11:e0154892. doi: 10.1371/journal.pone.0154892
Kang, D. S., Denlinger, D. L., and Sim, C. (2014). Suppression of allatotropin simulates reproductive diapause in the mosquito Culex pipiens. J. Insect. Physiol. 64, 48–53. doi: 10.1016/j.jinsphys.2014.03.005
Kang, D. S., Kim, S., Cotten, M. A., and Sim, C. (2021). Transcript assembly and quantification by RNA-seq reveals significant differences in gene expression and genetic variants in mosquitoes of the Culex pipiens (Diptera: Culicidae) complex. J. Med. Entomol. 58, 139–145. doi: 10.1093/jme/tjaa167
Kothera, L., Nelms, B., Savage, H. M., and Reisen, W. K. (2012). Complexity of the Culex pipiens complex in California. Proc. Pap. Annu. Conf. Mosq. Vector Control Assoc. Calif. 80, 1–3.
Kothera, L., Zimmerman, E. M., Richards, C. M., and Savage, H. M. (2009). Microsatellite characterization of subspecies and their hybrids in Culex pipiens complex (Diptera: Culicidae) mosquitoes along a North-South transect in the central United States. J. Med. Entomol. 46, 236–248. doi: 10.1603/033.046.0208
Kursa, M. B., and Rudnicki, W. R. (2010). Feature selection with the boruta package. J. Stat. Softw. 36, 1–13. doi: 10.18637/jss.v036.i11
Lai, C. H., Tung, K. C., Ooi, H. K., and Wang, J. S. (2000). Competence of Aedes albopictus and Culex quinquefasciatus as vector of Dirofilaria immitis after blood meal with different microfilarial density. Vet. Parasitol. 90, 231–237. doi: 10.1016/S0304-4017(00)00242-9
McAbee, R. D., Green, E. N., Holeman, J., Christiansen, J., Frye, N., Dealey, K., et al. (2008). Identification of Culex pipiens complex mosquitoes in a hybrid zone of West Nile virus transmission in Fresno County, California. Am. J. Trop. Med. Hyg. 78, 303–310. doi: 10.4269/ajtmh.2008.78.303
Meegan, J. M., Khalil, G. M., Hoogstraal, H., and Adham, F. K. (1980). Experimental Transmission and Field Isolation Studies Implicating Culex pipiens as a Vector of Rift Valley Fever Virus in Egypt. Am. J. Trop. Med. Hyg. 29, 1405–1410. doi: 10.4269/ajtmh.1980.29.1405
Midgarden, D., and Lira, E. (2006). “Ecological relationship of medfly and coffee in Guatemala and Mexico,” in Fruit Flies of Economic Importance: From Basic to Applied Knowledge. Proc. 7th Int. Symp. Fruit Flies Econ. Importance, eds R. Sugayama, R. Zucchi, S. Ovrulki, and J. Sivinski (Bahia: Biofabrication), 241–247.
Mori, A., Romero-Severson, J., and Severson, D. W. (2007). Genetic basis for reproductive diapause is correlated with life history traits within the Culex pipiens complex. Insect Mol. Biol. 16, 515–524. doi: 10.1111/j.1365-2583.2007.00746.x
Oksanen, J., Guillaume, F., Friendly, M., Kindt, R., Legendre, P., McGlinn, D., et al. (2020). Vegan: Community Ecology Package. Available online at: https://cran.r-project.org/web/packages/vegan/vegan.pdf. (accessed May 20, 2020).
QGIS (2020). QGIS Geographic Information System. QGIS Association. Available online at: http://www.qgis.org (accessed May 22, 2020).
R Core Team (2020). R: A language and environment for statistical computing (v. 4.0.2)[Computer software]. Vienna: R Foundation for Statistical Computing.
Ruiz, M. O., Chaves, L. F., Hamer, G. L., Sun, T., Brown, W. M., Walker, E. D., et al. (2010). Local impact of temperature and precipitation on West Nile virus infection in Culex species mosquitoes in northeast Illinois, USA. Parasit. Vectors 3:19. doi: 10.1186/1756-3305-3-19
Sim, C., and Denlinger, D. L. (2013). Insulin signaling and the regulation of insect diapause. Front. Physiol. 4:189. doi: 10.3389/fphys.2013.00189
Sim, C., Kang, D. S., Kim, S., Bai, X., and Denlinger, D. L. (2015). Identification of FOXO targets that generate diverse features of the diapause phenotype in the mosquito Culex pipiens. Proc. Natl. Acad. Sci. U. S. A. 112, 3811–3816. doi: 10.1073/pnas.1502751112
Spielman, A. (1967). Population structure in the Culex pipiens complex of mosquitos. Bull. World Health Organ. 37, 271–276.
Wagner, H. H., and Fortin, M. J. (2005). Spatial analysis of landscapes: concepts and statistics. Ecology 86, 1975–1987. doi: 10.1890/04-0914
Keywords: random forest, Culex, mosquito, climate, machine learning
Citation: Arora AK, Sim C, Severson DW and Kang DS (2022) Random Forest Analysis of Impact of Abiotic Factors on Culex pipiens and Culex quinquefasciatus Occurrence. Front. Ecol. Evol. 9:773360. doi: 10.3389/fevo.2021.773360
Received: 09 September 2021; Accepted: 20 December 2021;
Published: 27 January 2022.
Edited by:
Bradley S. Case, Auckland University of Technology, New ZealandReviewed by:
Miguel Moreno-García, Servicios de Salud de Morelos, Coordinación de Enfermedades Transmitidas por Vector y Zoonosis, MexicoCamilo E. Khatchikian, Dartmouth College, United States
Copyright © 2022 Arora, Sim, Severson and Kang. This is an open-access article distributed under the terms of the Creative Commons Attribution License (CC BY). The use, distribution or reproduction in other forums is permitted, provided the original author(s) and the copyright owner(s) are credited and that the original publication in this journal is cited, in accordance with accepted academic practice. No use, distribution or reproduction is permitted which does not comply with these terms.
*Correspondence: David S. Kang, RGF2ZS5LYW5nQHVzZGEuZ292