 Xinzhi Liu
 Shuhua Wei2,3
 Zhenyong Du
 Hu Li
Hu Li Wanzhi Cai
- 1Department of Entomology, MOA Key Lab of Pest Monitoring and Green Management, College of Plant Protection, China Agricultural University, Beijing, China
- 2Institute of Plant Protection, Academy of Ningxia Agriculture and Forestry Science, Yinchuan, China
- 3Ningxia Key Lab of Plant Disease and Pest Control, Yinchuan, China
Biological invasions represent a natural rapid evolutionary process in which invasive species may present a major threat to biodiversity and ecosystem integrity. Analyzing the genetic structure and demographic history of invaded populations is critical for the effective management of invasive species. The spotted alfalfa aphid (SAA) Therioaphis trifolii is indigenous in the Mediterranean region of Europe and Africa and has invaded China, causing severe damages to the alfalfa industry. However, little is known about its genetic structure and invasion history. In this study, we obtained 167 complete mitochondrial genome sequences from 23 SAA populations across China based on high-throughput sequencing and performed population genetic and phylogenomic analyses. High haplotype diversity and low nucleotide diversity were found in SAA populations in China with distinct genetic structures, i.e., all populations diverged into three phylogenetic lineages. Demographic history analyses showed a recent expansion of the SAA population, consistent with the recent invasion history. Our study indicated that SAA may have invaded through multiple introduction events during commercial trades of alfalfa, although this needs further validation by nuclear markers.
Introduction
The spotted alfalfa aphid (SAA), Therioaphis trifolii (Hemiptera: Aphididae), was first described by Monell (1882). It is an indigenous species in the Mediterranean region of Europe and Africa, far north to Scandinavia, south to Ethiopia, and eastward through the Middle East to Afghanistan and India (Van den Bosch, 1957; Lambers and Van den Bosch, 1964; Carver, 1978). This species is now widely distributed in Asia, Oceania, and North America following worldwide invasions. SAA occurs several generations per year via both gamogenesis and parthenogenesis, with eggs and adult females representing the main overwintering stages. SAA’s principal host is alfalfa (Medicago sativa), but it also infests other Fabaceae species of Trifolium, Trigonella, and Melilotus (Peters and Painter, 1957; Bishop and Crockett, 1961; Lambers and Van den Bosch, 1964; Carver, 1978). This aphid damages its host plants by sucking sap of young leaves and twigs, inducing a toxic reaction which causes deformation of leaves, stunting, and plant death (Giles et al., 2002). The invasion of SAA has caused severe economic losses to alfalfa and husbandry industries in southwestern United States, Australia, and China (Howe and Smith, 1957; Van den Bosch et al., 1957; Zhang and Zhong, 1983; Hughes et al., 1987). In China, although some efforts have been made to predict and control this pest, few studies have been performed to assess its genetic structure and invasion history (Hughes et al., 1987).
The invasion of non-native species continues to occur worldwide with the increasing intercontinental and regional trade favoring entry and dissemination. Biological invasions incur not only economic losses but also dramatic ecological and sociological effects (Simberloff et al., 2013; Roques et al., 2016; Nicolas et al., 2018). Introductions of alien species are accompanied by various genetic consequences. For example, populations of invasive species are usually subjected to the founder and bottleneck effects, and the newly established populations may have lower genetic variations (Dlugosch and Parker, 2010). However, multiple introduction events may increase the genetic diversity of the invaded places, especially when several genetically differentiated source populations contribute to the invasion (Facon et al., 2003; Kolbe et al., 2004; Kang et al., 2007). The potentially higher diversity can counterbalance the deleterious effects of genetic drift or inbreeding depression (Ciosi et al., 2008; Lombaert et al., 2010; Estoup et al., 2016). The genetic structure of an invasive population usually reflects its introduction history, and evaluating the genetic structure of native and invasive populations is a crucial step for managing established populations and preventing further invasions (Estoup and Guillemaud, 2010). More specifically, deciphering the genetic structure of non-native populations provides an insight into the dynamics of the invasion, including the number of introduction events, the associated demographic events, or the relationships between different populations (Roderick and Navajas, 2003; Kolbe et al., 2004; Lavergne and Molofsky, 2007). A better understanding of introduction events also plays an important role in the effective management of invasive pests because different control measures need to be applied to populations based on their distinct genetic makeup.
Whole mitochondrial genome (mitogenome) sequences have been proved as powerful molecular markers for analyzing the genetic structure of species (Drag et al., 2015; Du et al., 2019, 2021). In this study, we sequenced mitogenomes of 167 SAA individuals representing 23 geographic populations in China using high-throughput sequencing and analyzed the genetic diversity, phylogenetic structure, and demographic history of SAA. Based on the population genetic analyses, we discussed the possible invasion history of SAA in China and our study would provide a foundation for further analysis of its global introduction events.
Materials and Methods
Sampling and Mitogenome Sequencing
When sampling each population, we chose three to five locations with an interval of more than 5 m and collected five individuals at least for each location. Collected samples were placed in absolute alcohol and stored at −80°C until DNA extraction. A total of 167 SAA adults were selected from 23 natural populations across China (Table 1 and Figure 1). Voucher specimens (NO. VAphA001–VAphA167) were deposited in the Entomological Museum of China Agricultural University. We obtained whole genomic DNA from individual specimen using the DNeasy Blood and Tissue Kit (Qiagen, Hilden, Germany) according to the manufacturer’s protocol. The quality and concentration of extracted DNA were measured using Qubit 3.0 (Invitrogen, United States). Each specimen was identified morphologically (Zhang and Zhong, 1983) and checked by BLAST search in the GenBank database using their COI gene sequence (with percent identity ≥ 99.00%), which was acquired through PCR sequencing under the following conditions: initial denaturation at 95°C for 1 min; 40 cycles at 98°C for 10 s; 45°C for 50 s; 68°C for 1 min; and a final single extension at 72°C for 2 min (with primers, reagents, and reaction system shown in Supplementary Tables 1, 2).
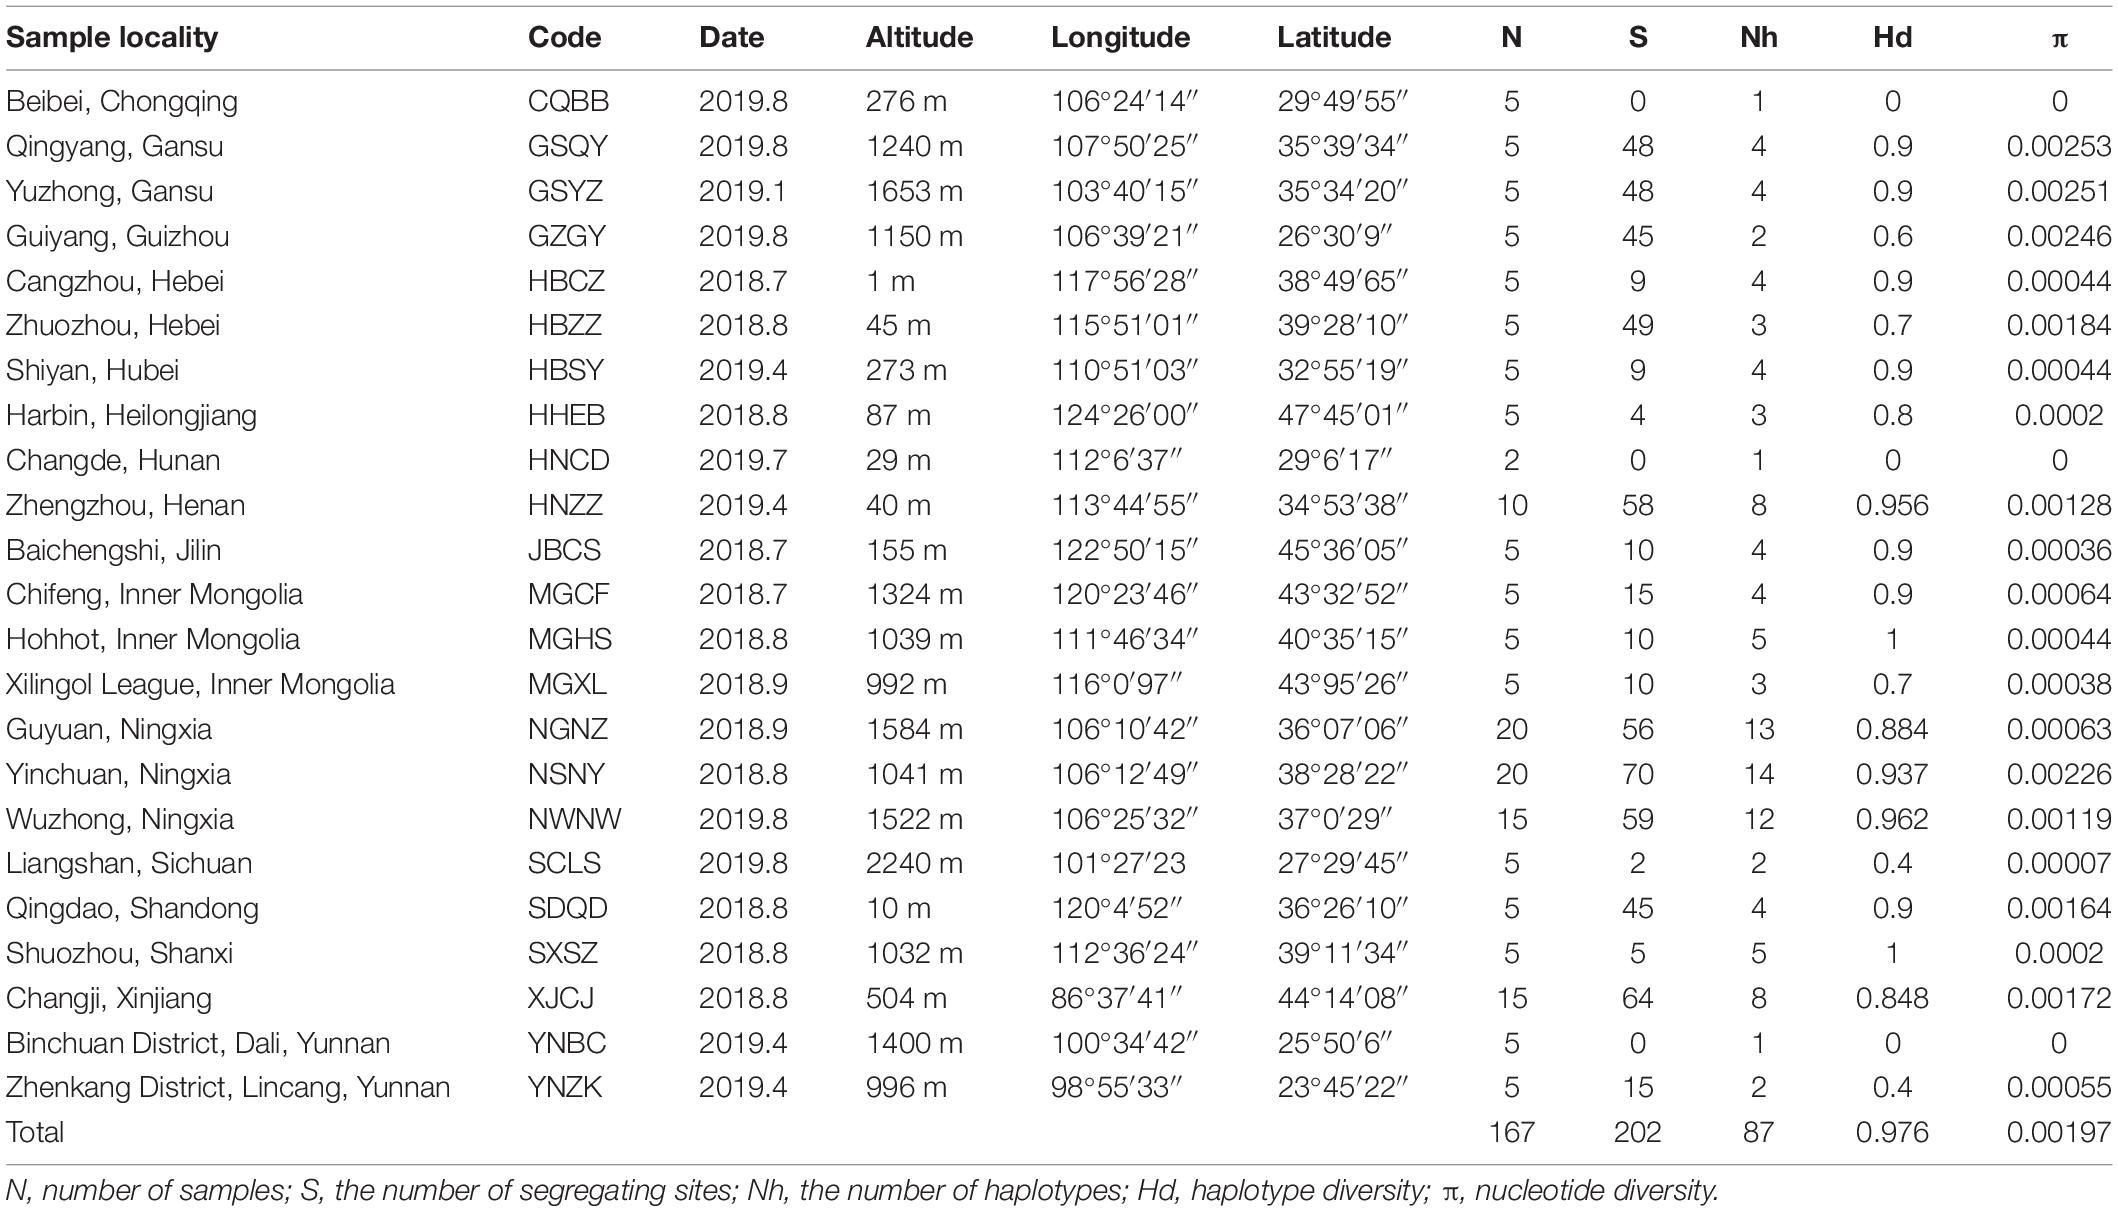
Table 1. Summary of sampling sites and parameters of genetic diversity of Therioaphis trifolii.
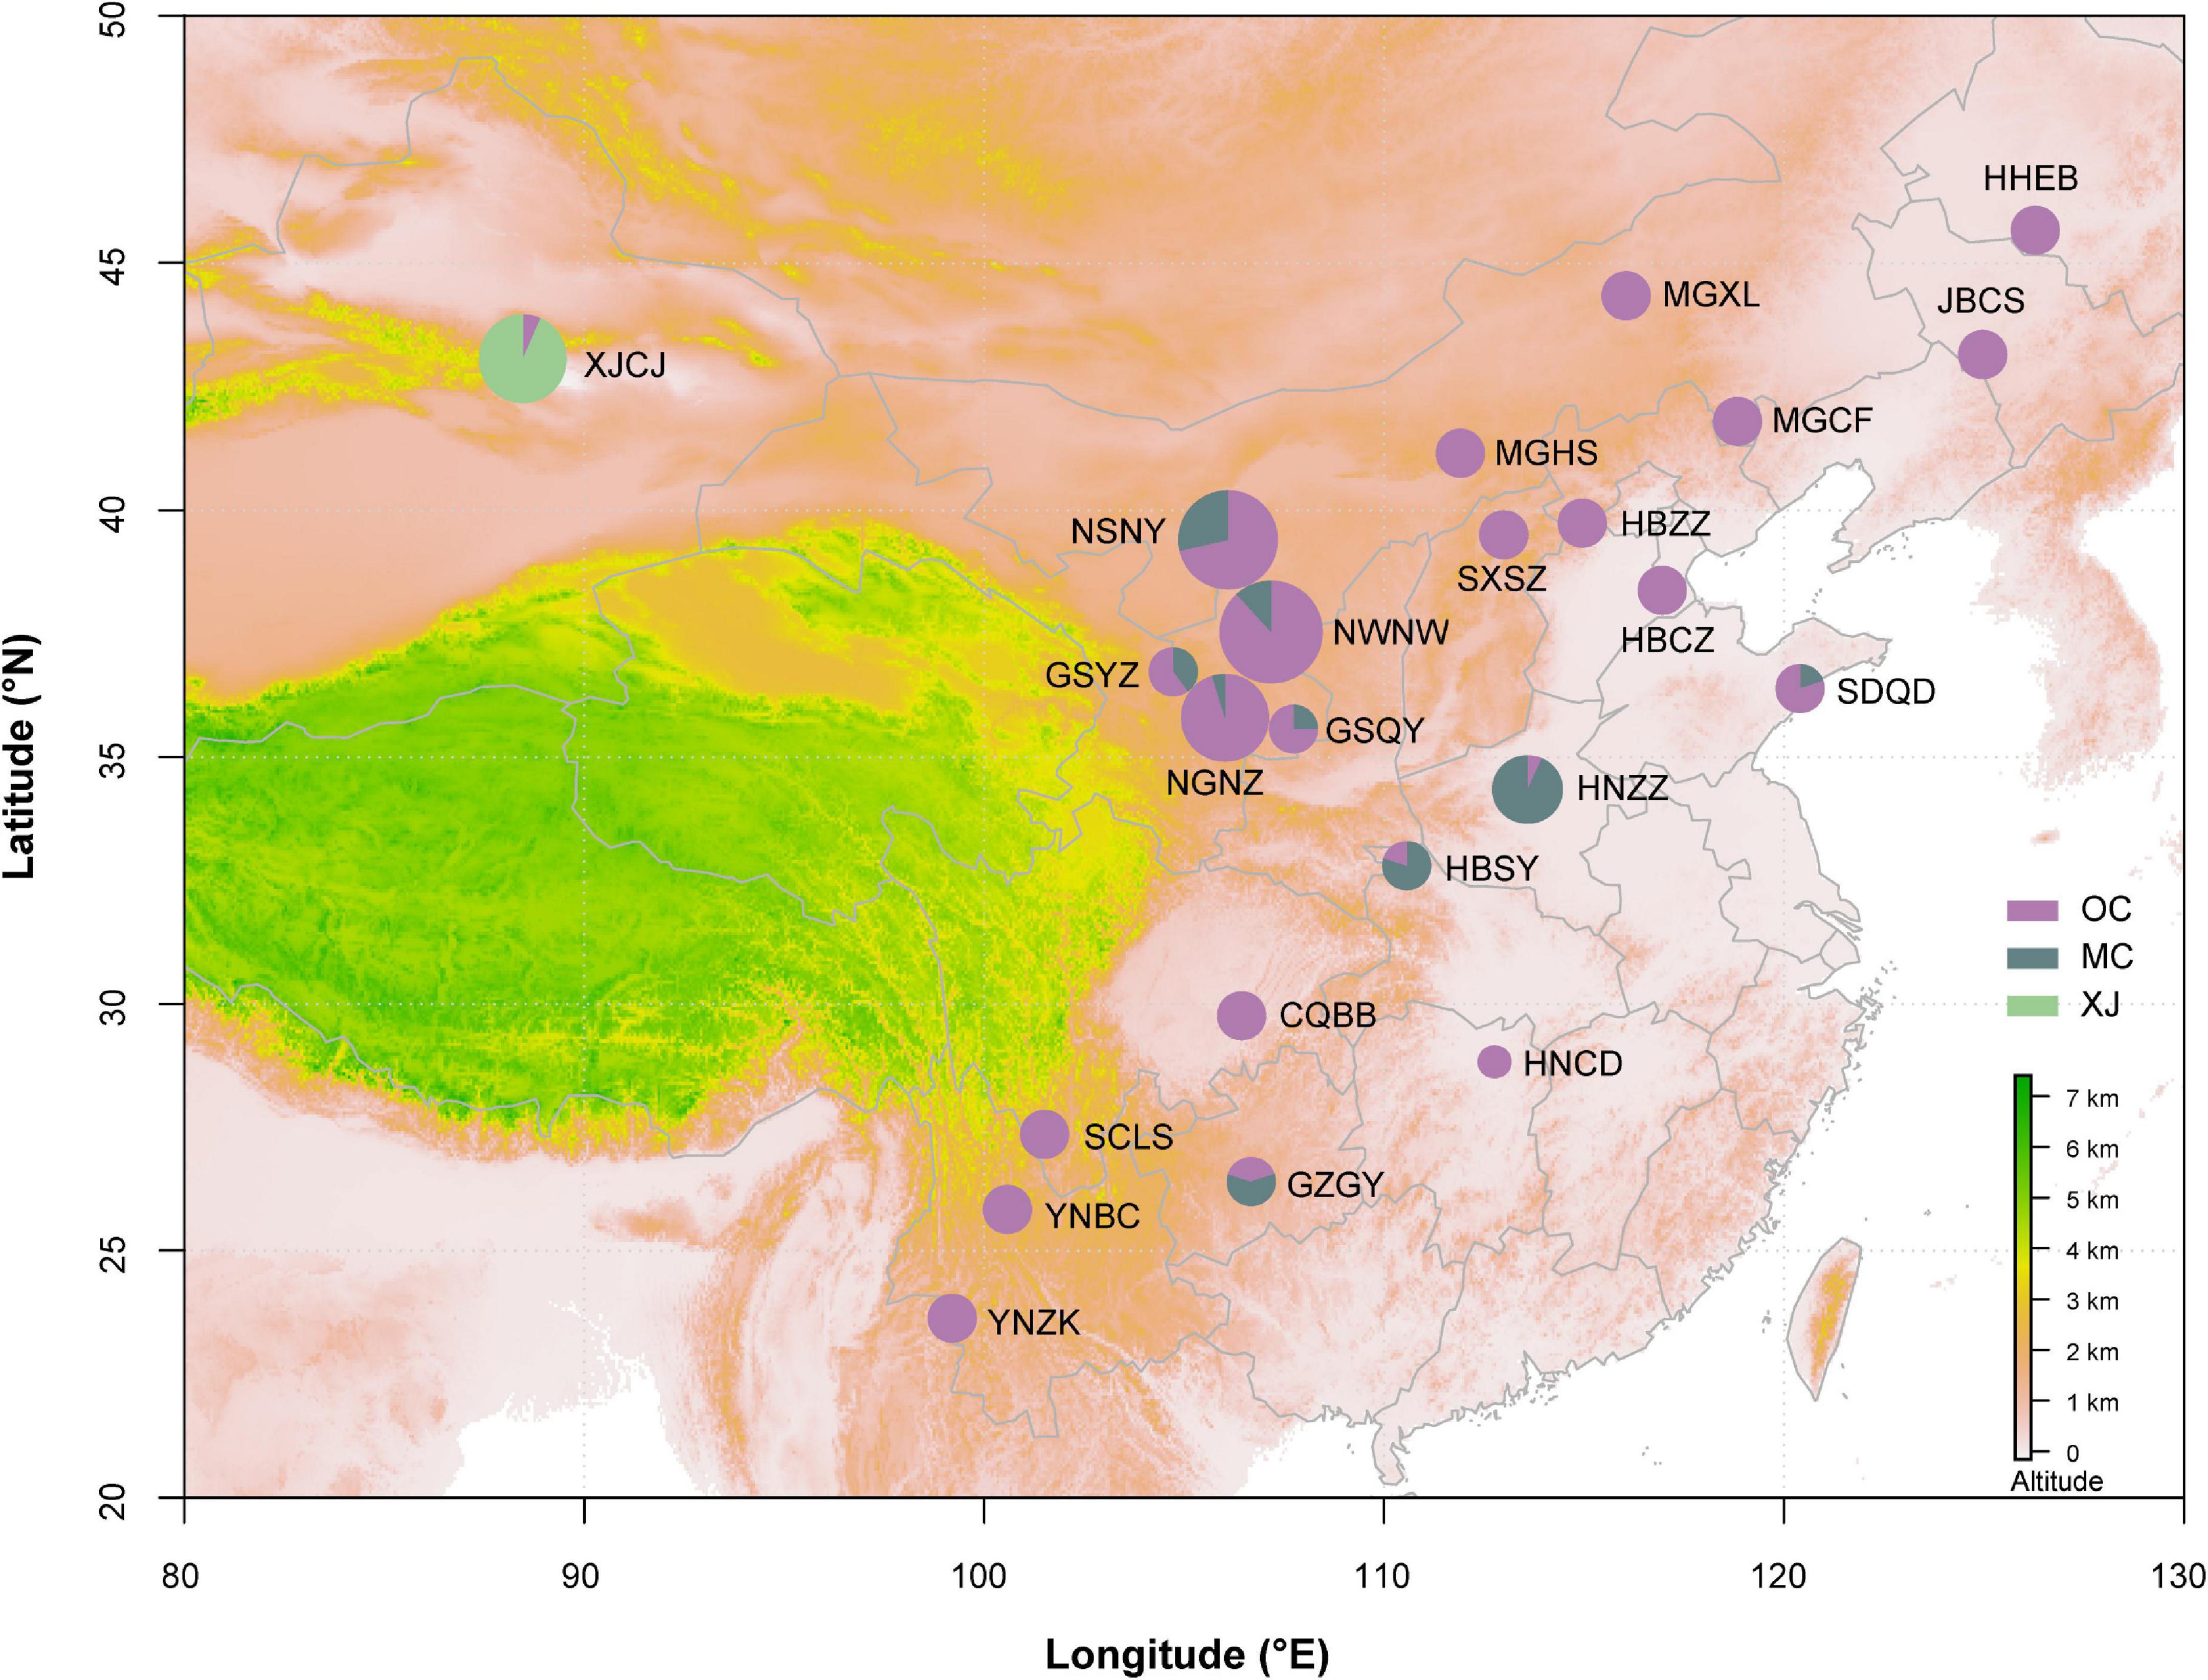
Figure 1. Geographic distribution of samples on the map. Different colors of the circles represent phylogeographic lineages. The information of population code refers to Table 1. The area of circle represents the population size.
A 350 bp insert size library was constructed from each specimen and sequenced in 150 bp pair-end mode to obtain ∼3 Gb of data using an Illumina NovaSeq 6,000 platform (San Diego, CA, United States) at Berry Genomics (Beijing, China). Raw reads were trimmed off adapters using Trimmomatic (Bolger et al., 2014), and low-quality or short reads were discarded with Prinseq (Edwards, 2011). The remaining high-quality reads were mapped onto the published reference mitogenome (GenBank accession: MK766411; Liu et al., 2019) using Geneious 10.1.3,1 allowing for mismatches of up to 2% with a maximum gap size of 5 bp and a minimum overlap of 30 bp. The consensus sequences were generated as novel individual mitogenomes under the threshold of 75% uniformity at each site. Sequences obtained from mapping were annotated in Geneious according to the reference sequence. Annotation of protein-coding genes (PCGs) and ribosomal RNA genes (rRNAs) was aligned with homologous genes of the reference mitogenome. Transfer RNA genes (tRNAs) were rechecked using the MITOS Web Server (Bernt et al., 2013). Each PCG was independently aligned using TranslatorX online platform with the MAFFT method, with all stop codons removed (Abascal et al., 2010), and the PCG dataset was finally obtained. Besides, we also performed ABGD (Automatic Barcode Gap Definition) analysis with the aligned PCG dataset (Pmin = 0.001, Pmax = 0.02) and confirmed that all sequences belong to the same species T. trifolii. Analyses in this study were all based on the PCG dataset.
Genetic Diversity and Population Differentiation
The number of polymorphic sites (S), the number of haplotypes (Nh), nucleotide diversity (π), and haplotype diversity (Hd) were calculated using DnaSP 6.0 (Rozas et al., 2017). To check the differentiation levels in different populations and lineages, we calculated pairwise genetic differentiation (FST) and obtained p-values for FST values with 3,000 permutations using Arlequin 3.5 (Excoffier and Lischer, 2010), and calculated genetic distance (uncorrected p-distance) using MEGA7 (Kumar et al., 2016). Mantel tests were used to test the isolation-by-distance model for all geographic populations except Changde, Hunan population (HNCD) including only two samples. Correlations between FST and linear geographic distance (in km) were plotted with 999 replicates in the ade4 v. 1.7 module of R.
Phylogenetic Analyses and Divergence Time Estimation
Phylogenetic trees were constructed by the Bayesian inference (BI) method using PhyloBayes MPI 1.5a (Lartillot et al., 2013) and the maximum-likelihood (ML) method using IQ-TREE 1.6.5 (Trifinopoulos et al., 2016). PartitionFinder2 (Lanfear et al., 2016) on the CIPRES Science Gateway (Miller et al., 2010) was used to select the optimal partition schemes and substitution models. Thirty-nine (13 × 3) codon partitions were predefined for this dataset, and we used the “greedy” algorithm with branch lengths estimated as “unlinked” and the Akaike information criterion to select the partition schemes and models (summarized in Supplementary Table 3). For the ML analysis, the best evolutionary models predicted before were selected under the corrected Bayesian information criterion (BIC) in IQ-TREE, and the ML tree was obtained with IQ-TREE using an ultrafast bootstrap approximation approach with 10,000 replicates. For BI analysis, we chose the site-heterogeneous mixture model (CAT + GTR), with four independent chains starting from a random tree and running for 30,000 cycles. Trees being sampled every 10 cycles and the initial 25% trees of each MCMC run were discarded as burn-in. A consensus tree was computed from the remaining trees combined from two runs which converged at a MaxDiff < 0.1.
Clustering of individuals was performed with BAPS v. 6.0 (Cheng et al., 2013) under the spatial clustering of groups of individuals. Based on the same dataset, the median-joining network of haplotypes was constructed in PopART (Leigh and Bryant, 2015) to further analyze the relationship among different haplotypes. The frequency of haplotypes was obtained using Arlequin software. We also carried out the hierarchical analysis of molecular variance (AMOVA) among populations and between defined lineages (the result of BAPS) with the Arlequin program to gain a better insight of the biogeographical processes shaping the genetic structure. The significance of differentiation between pairs of populations/groups was evaluated by 1,000 bootstrap replications (Excoffier et al., 1992).
We estimated divergence time using BEAST 2.4.8 (Bouckaert et al., 2014). Given that there were no fossils available to calibrate the nodes, we used a molecular clock for divergence time estimation. COI gene was evaluated as a separate partition with the substitution rate fixed at 1.77% per site per million years (Mya) (Papadopoulou et al., 2010). The other 12 PCGs were applied as another partition with the evolutionary rate estimated accordingly. An uncorrelated lognormal relaxed clock model was applied with the birth-death model for the tree prior. Two independent MCMC runs per 500 million generations were performed with tree sampling every 50,000 generations. Tracer v. 1.7 (Rambaut et al., 2018) was used to verify whether the MCMC runs reached a stationary distribution based on the effective sample sizes (ESS) of each estimated parameter. We required ESS for the posterior, prior, and tree likelihood to be at least 200. The resulting trees for each replicate were combined using LogCombiner program in BEAST, and TreeAnnotator program in BEAST was used to calculate the consensus tree and annotate the divergence times with “mean height” after discarding the initial 25% trees as burn-in.
Demographic History
To test whether expansion occurred, we performed mismatch distribution analyses in Arlequin with 1,000 bootstrap replicates to detect expansion through the linear fitting of observed and simulated curves with the significance of two parameters, the sum of squares deviations (SSD) and Harpending’s raggedness index (r) (Excoffier and Lischer, 2010). Bayesian skyline plots (BSPs) were obtained for different lineages in BEAST under Coalescent Bayesian Skyline model for the tree prior. The same partitions and substitution rates were applied consistent with these in the estimation of divergence time. BEAST analysis was conducted for 300 million generations with sampling trees every 30,000 generations. We determined the effective population size through time using Tracer, discarding the initial 10% of generations as burn-in.
Results
Genetic Diversity, Population Differentiation, and Geographical Structure
We obtained the whole mitogenome sequences for 167 individuals from 23 SAA populations across China (Table 1), with the size of mitogenome ranging from 16,068 to 16,083 bp. We detected 87 haplotypes in total (Table 1 and Supplementary Table 4), with 202 polymorphic sites (S) in average. Overall, populations showed a high haplotype diversity (Hd = 0.976) and a low nucleotide diversity (π = 0.00197). Among all the different geographic populations, GSQY showed the highest nucleotide diversity (π = 0.00253) and three populations showed lowest (π = 0.00000), including CQBB, HNCD, and YNBC.
We estimated pairwise FST and uncorrected p-distance between 23 different geographical populations (Table 2). The FST value between CQBB, HNCD, and YNBC was the highest (1.0000), and the lowest was between HNCD and NGNZ (−0.2310). For the p-distance, the value between HNZZ and YNZK was the highest (0.0038), and the lowest was between SCLS and YNBC (0.0000). Populations from northern China showed low p-distance values from each other. HBSY, HNZZ, and XJCJ populations showed higher FST and p-distance values than those from other populations. We also calculated the p-distance between 87 haplotypes, and the results ranged from 0.0001 to 0.0045 (Supplementary Table 5). The Mantel test indicated that the correlation between geographic distance and genetic differentiation was not significant (r = −0.0374, p = 0.7120, Supplementary Figure 1).
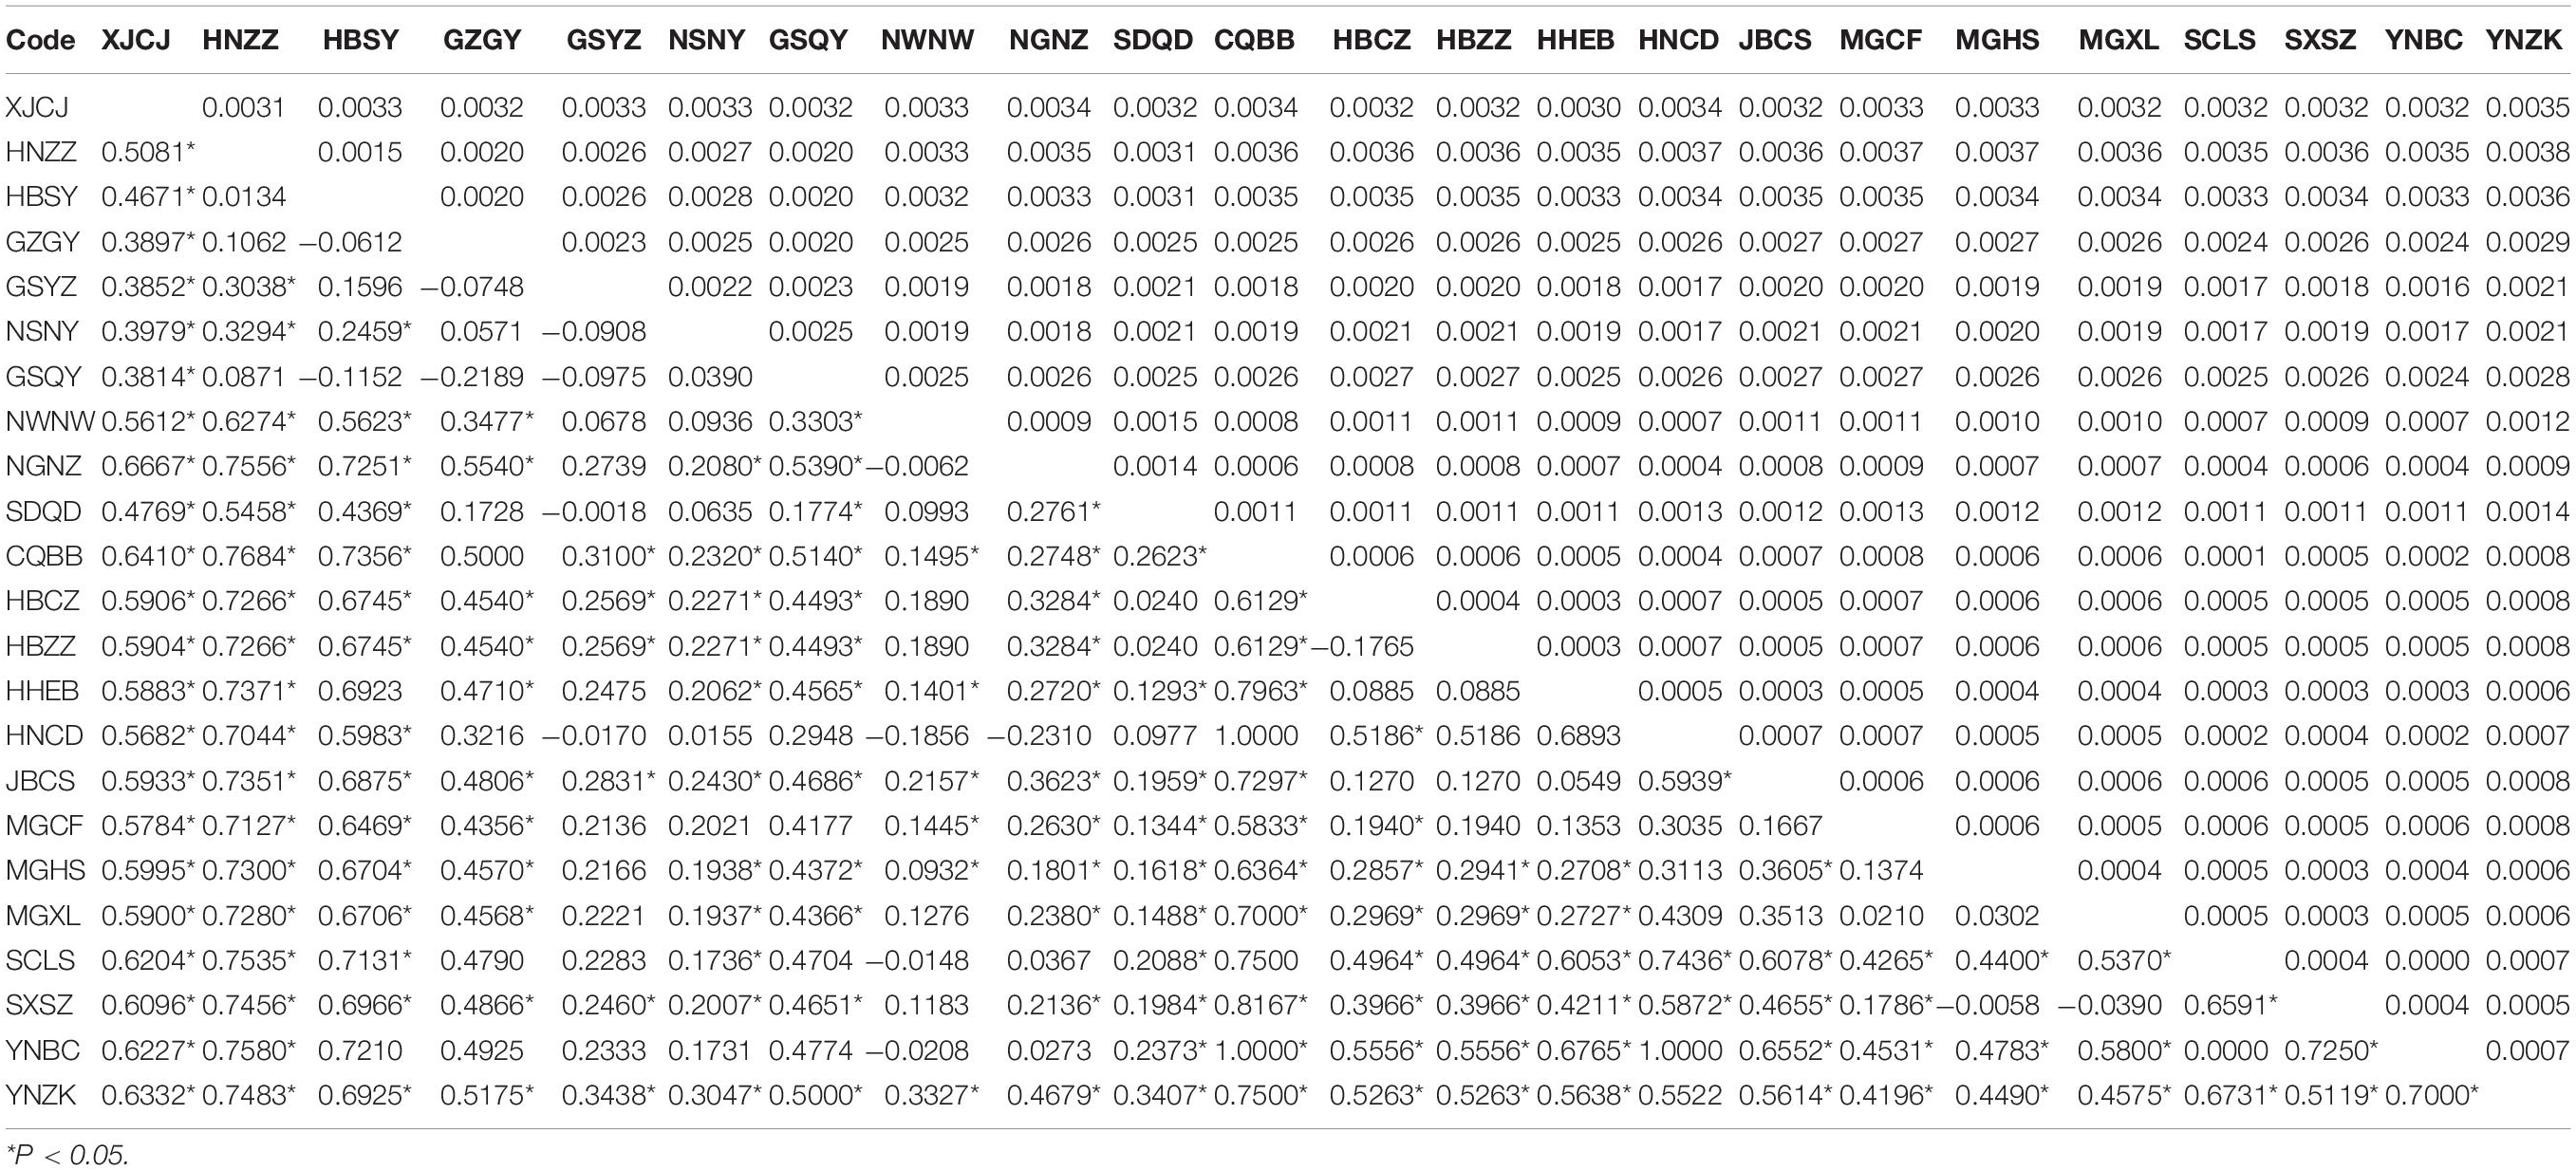
Table 2. Genetic differentiation (FST) (lower left) and p-distance analysis (upper right) of T. trifolii among populations.
Phylogenetic Analyses and Divergence Times
Phylogenetic relationships of major nodes in the ML, BI, and BEAST trees showed similar topologies, even though the nodal supports of some pivotal nodes were not high (Figure 2). The monophyly of the three lineages was well supported: the first lineage included all samples from XJCJ and one individual from another lineage, the second lineage included samples mainly from middle China, and the last lineage included samples from various populations, ranging from northeast to southwest of China. Therefore, we assigned the name of lineages according to their main geographic region, i.e., Xinjiang (XJ), middle China (MC), and other populations within China (OC) lineages, respectively (Figure 2). In MC lineage, most individuals from Ningxia area diverged first followed by samples from nearby cities. Individuals of OC lineage that diverged first were all from north and northeast of China, and individuals that diverged later were mostly from northwest and southwest of China. BAPS result also showed that all samples were divided into three clusters (Figure 1); XJ cluster (blue color in Figure 1) was only distributed in Xinjiang province, the MC cluster (red color in Figure 1) was mainly distributed in the north and middle of China, and the OC cluster (green color in Figure 1) was distributed as a majority (the haplotype from this cluster can be found in every geographical population).
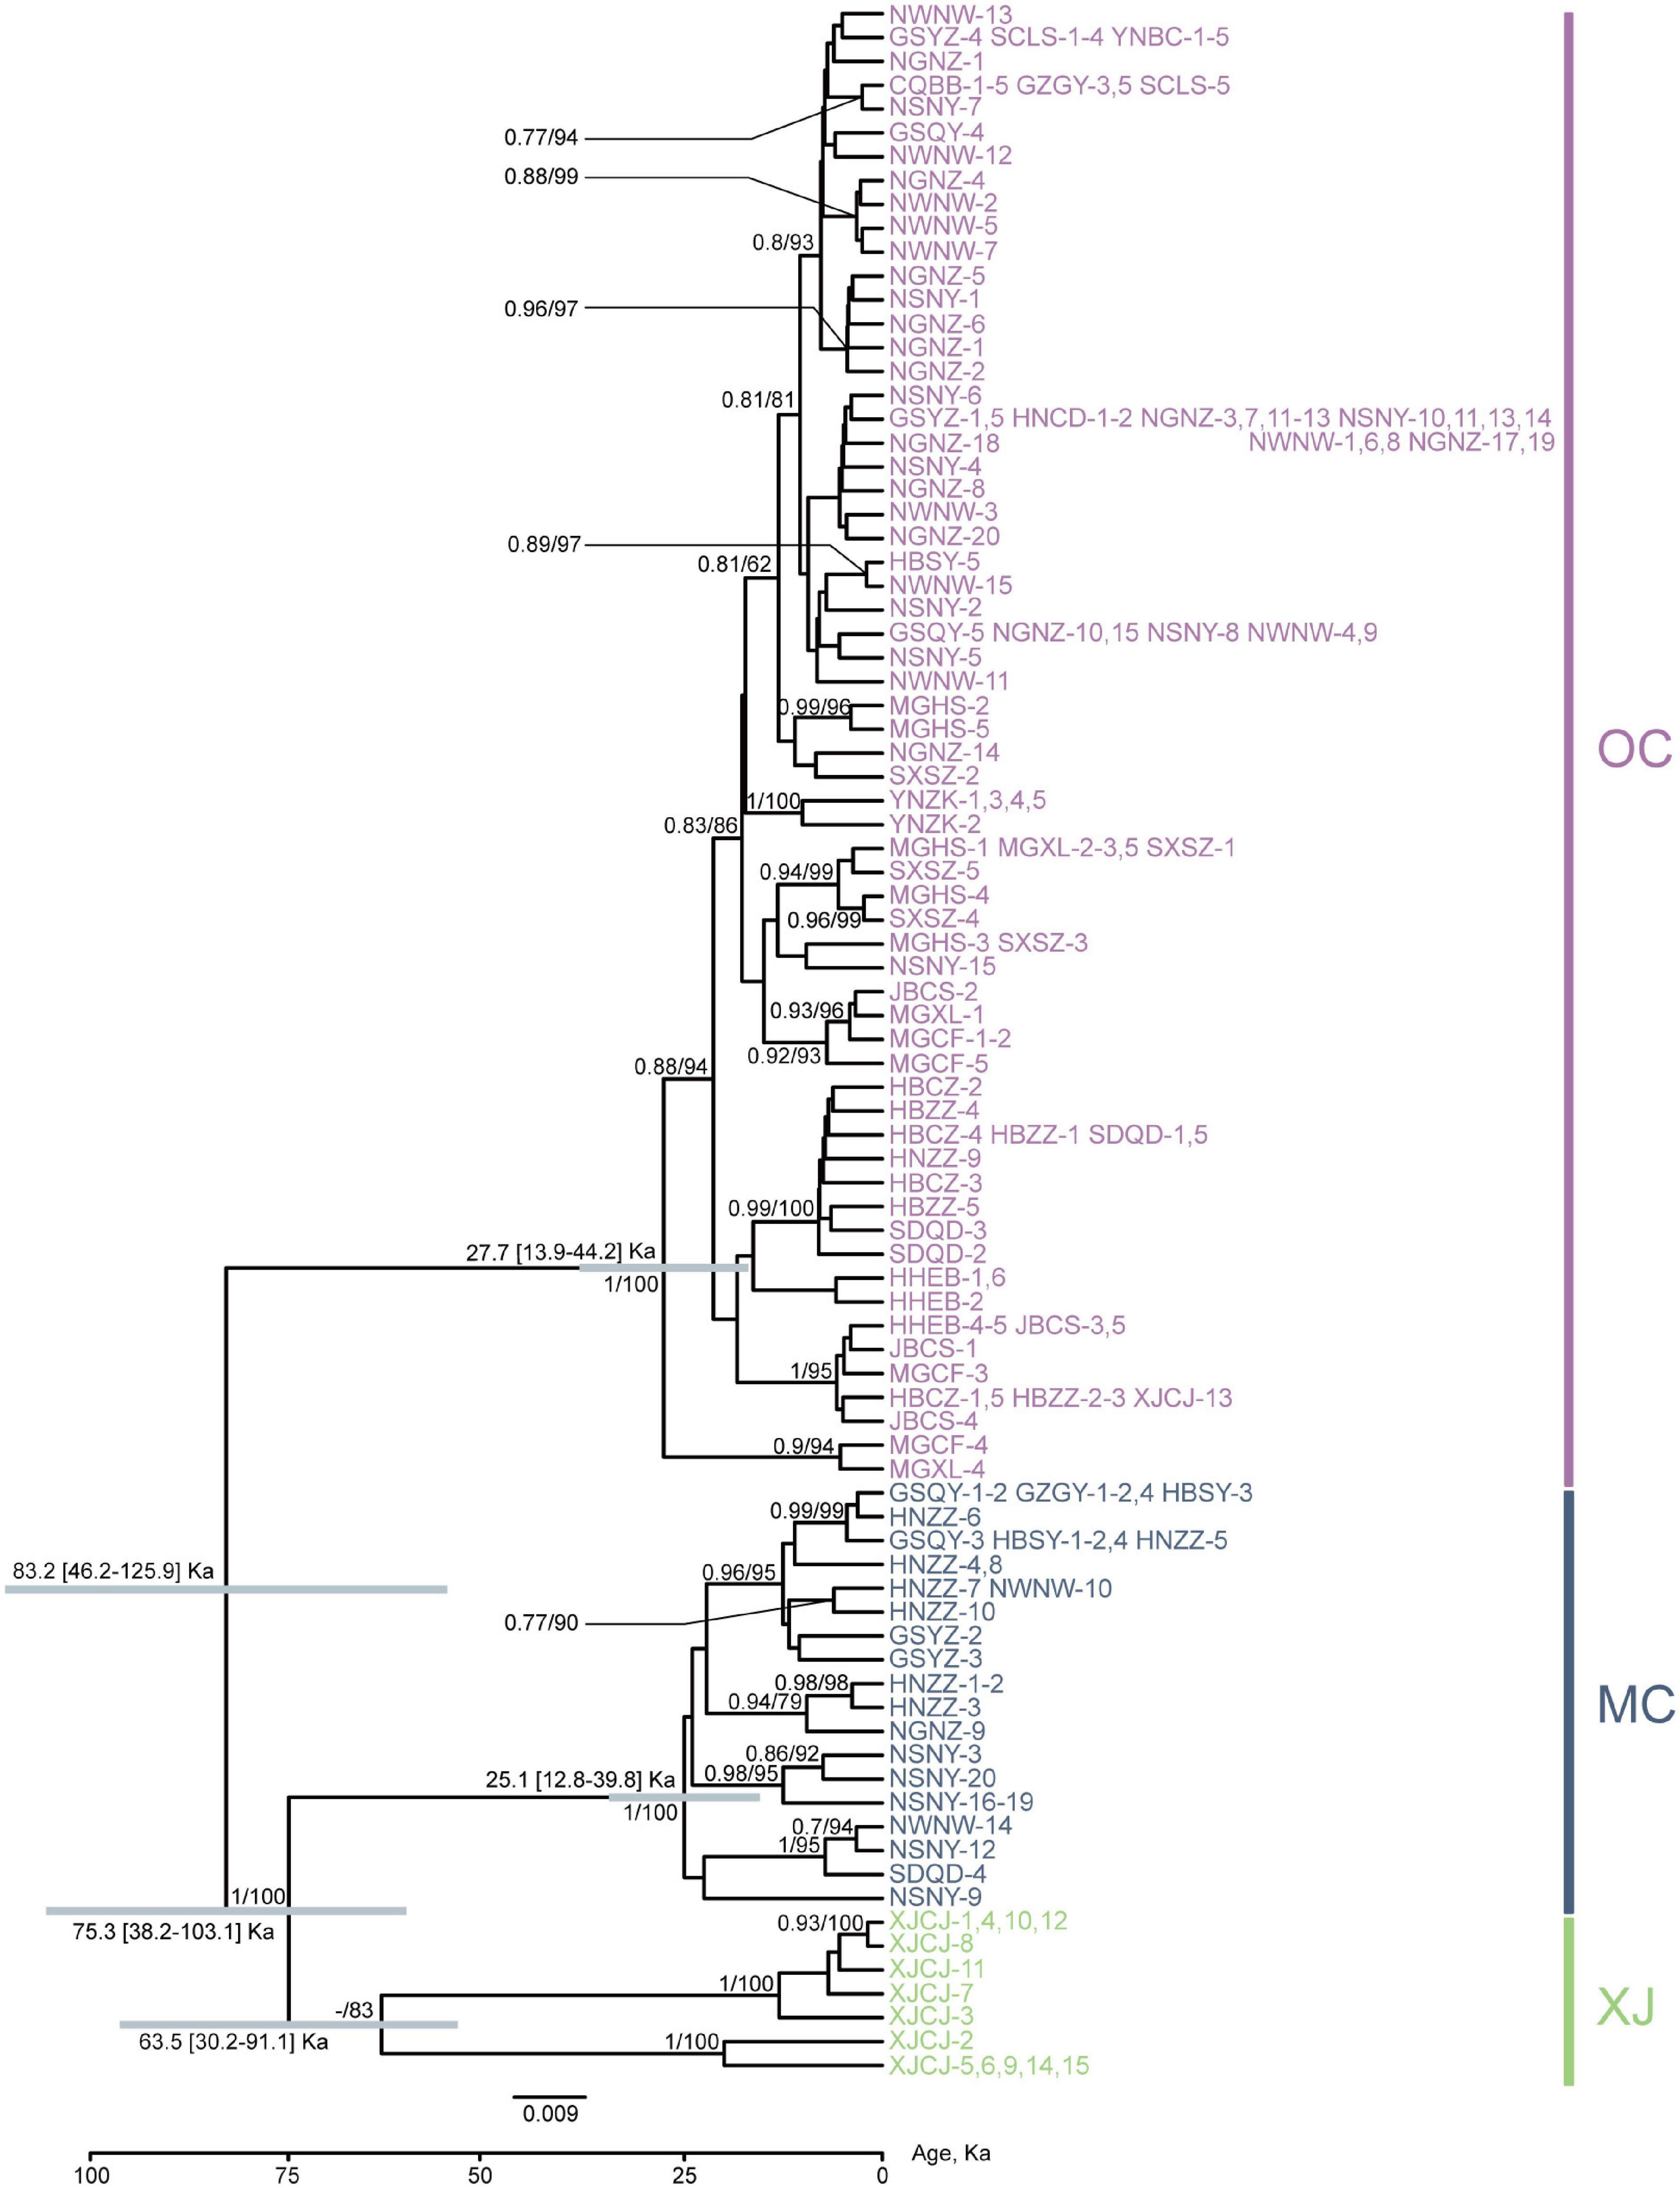
Figure 2. Phylogenetic relationships of major nodes and divergence time inferred from the protein-coding gene (PCG) dataset. Bars in gray show 95% highest posterior density intervals. The node supports shown are posterior probabilities of Bayesian inference and bootstrap percentages in a maximum-likelihood analysis. The information of population code refers to Table 1 and Figure 1. Numbers represent different individuals sharing the same haplotype.
Among the lineages revealed by the phylogenetic analyses, OC lineage with the largest sample size showed the lowest diversity, followed by MC lineage (Table 3), and XJ lineage exhibited the highest values even though it comprised the fewest individuals (Table 3). The p-distance among three lineages varied from 0.0031 to 0.0041 (Table 4). AMOVA analysis showed that the greatest proportion of variation was among lineages (81.79%) and the genetic differentiation among all of the populations was FST = 0.877, p < 0.0001 (Table 5).
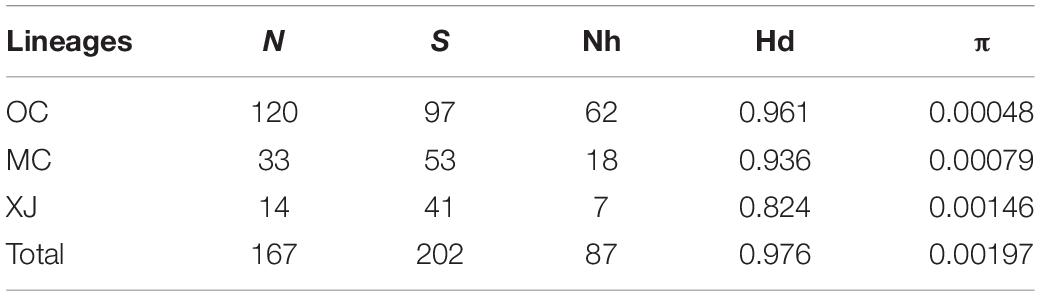
Table 3. Parameters of genetic diversity of three lineages.
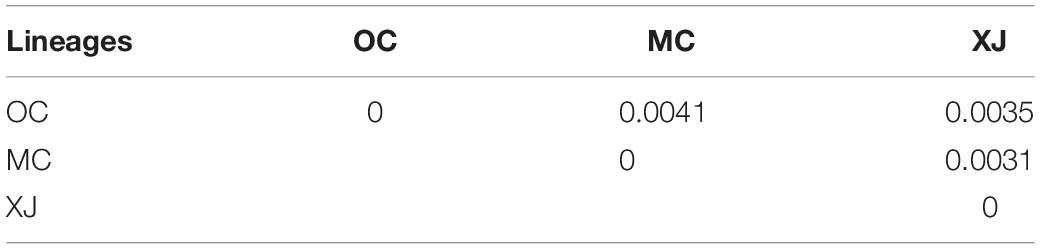
Table 4. The p-distance analysis of T. trifolii among lineages.
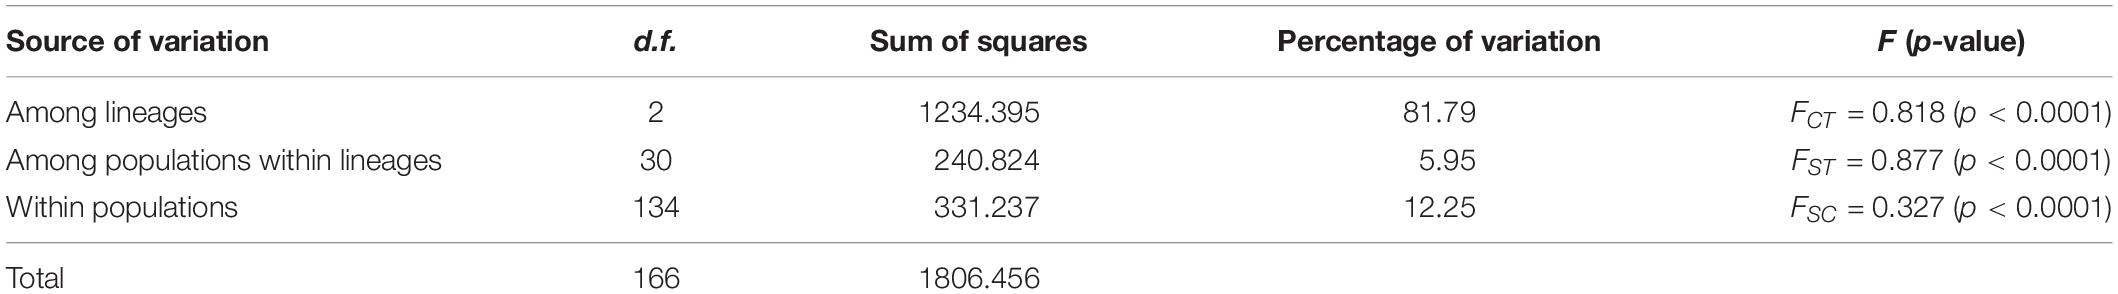
Table 5. Analysis of molecular variance (AMOVA) among populations and between lineages of T. trifolii.
The median-joining network of haplotypes revealed three haplotype groups (Figure 3), consistent with the results of BAPS and phylogenetic trees. For the OC lineage, there were several star-like topologies observed, indicating the recent expansion in this lineage. Haplotype H6 was the most frequently shared haplotype, which included 18 individuals from 10 different populations, followed by haplotype H9, which included 10 individuals from three populations. There were many mutation steps observed between the three lineages in median-joining network.
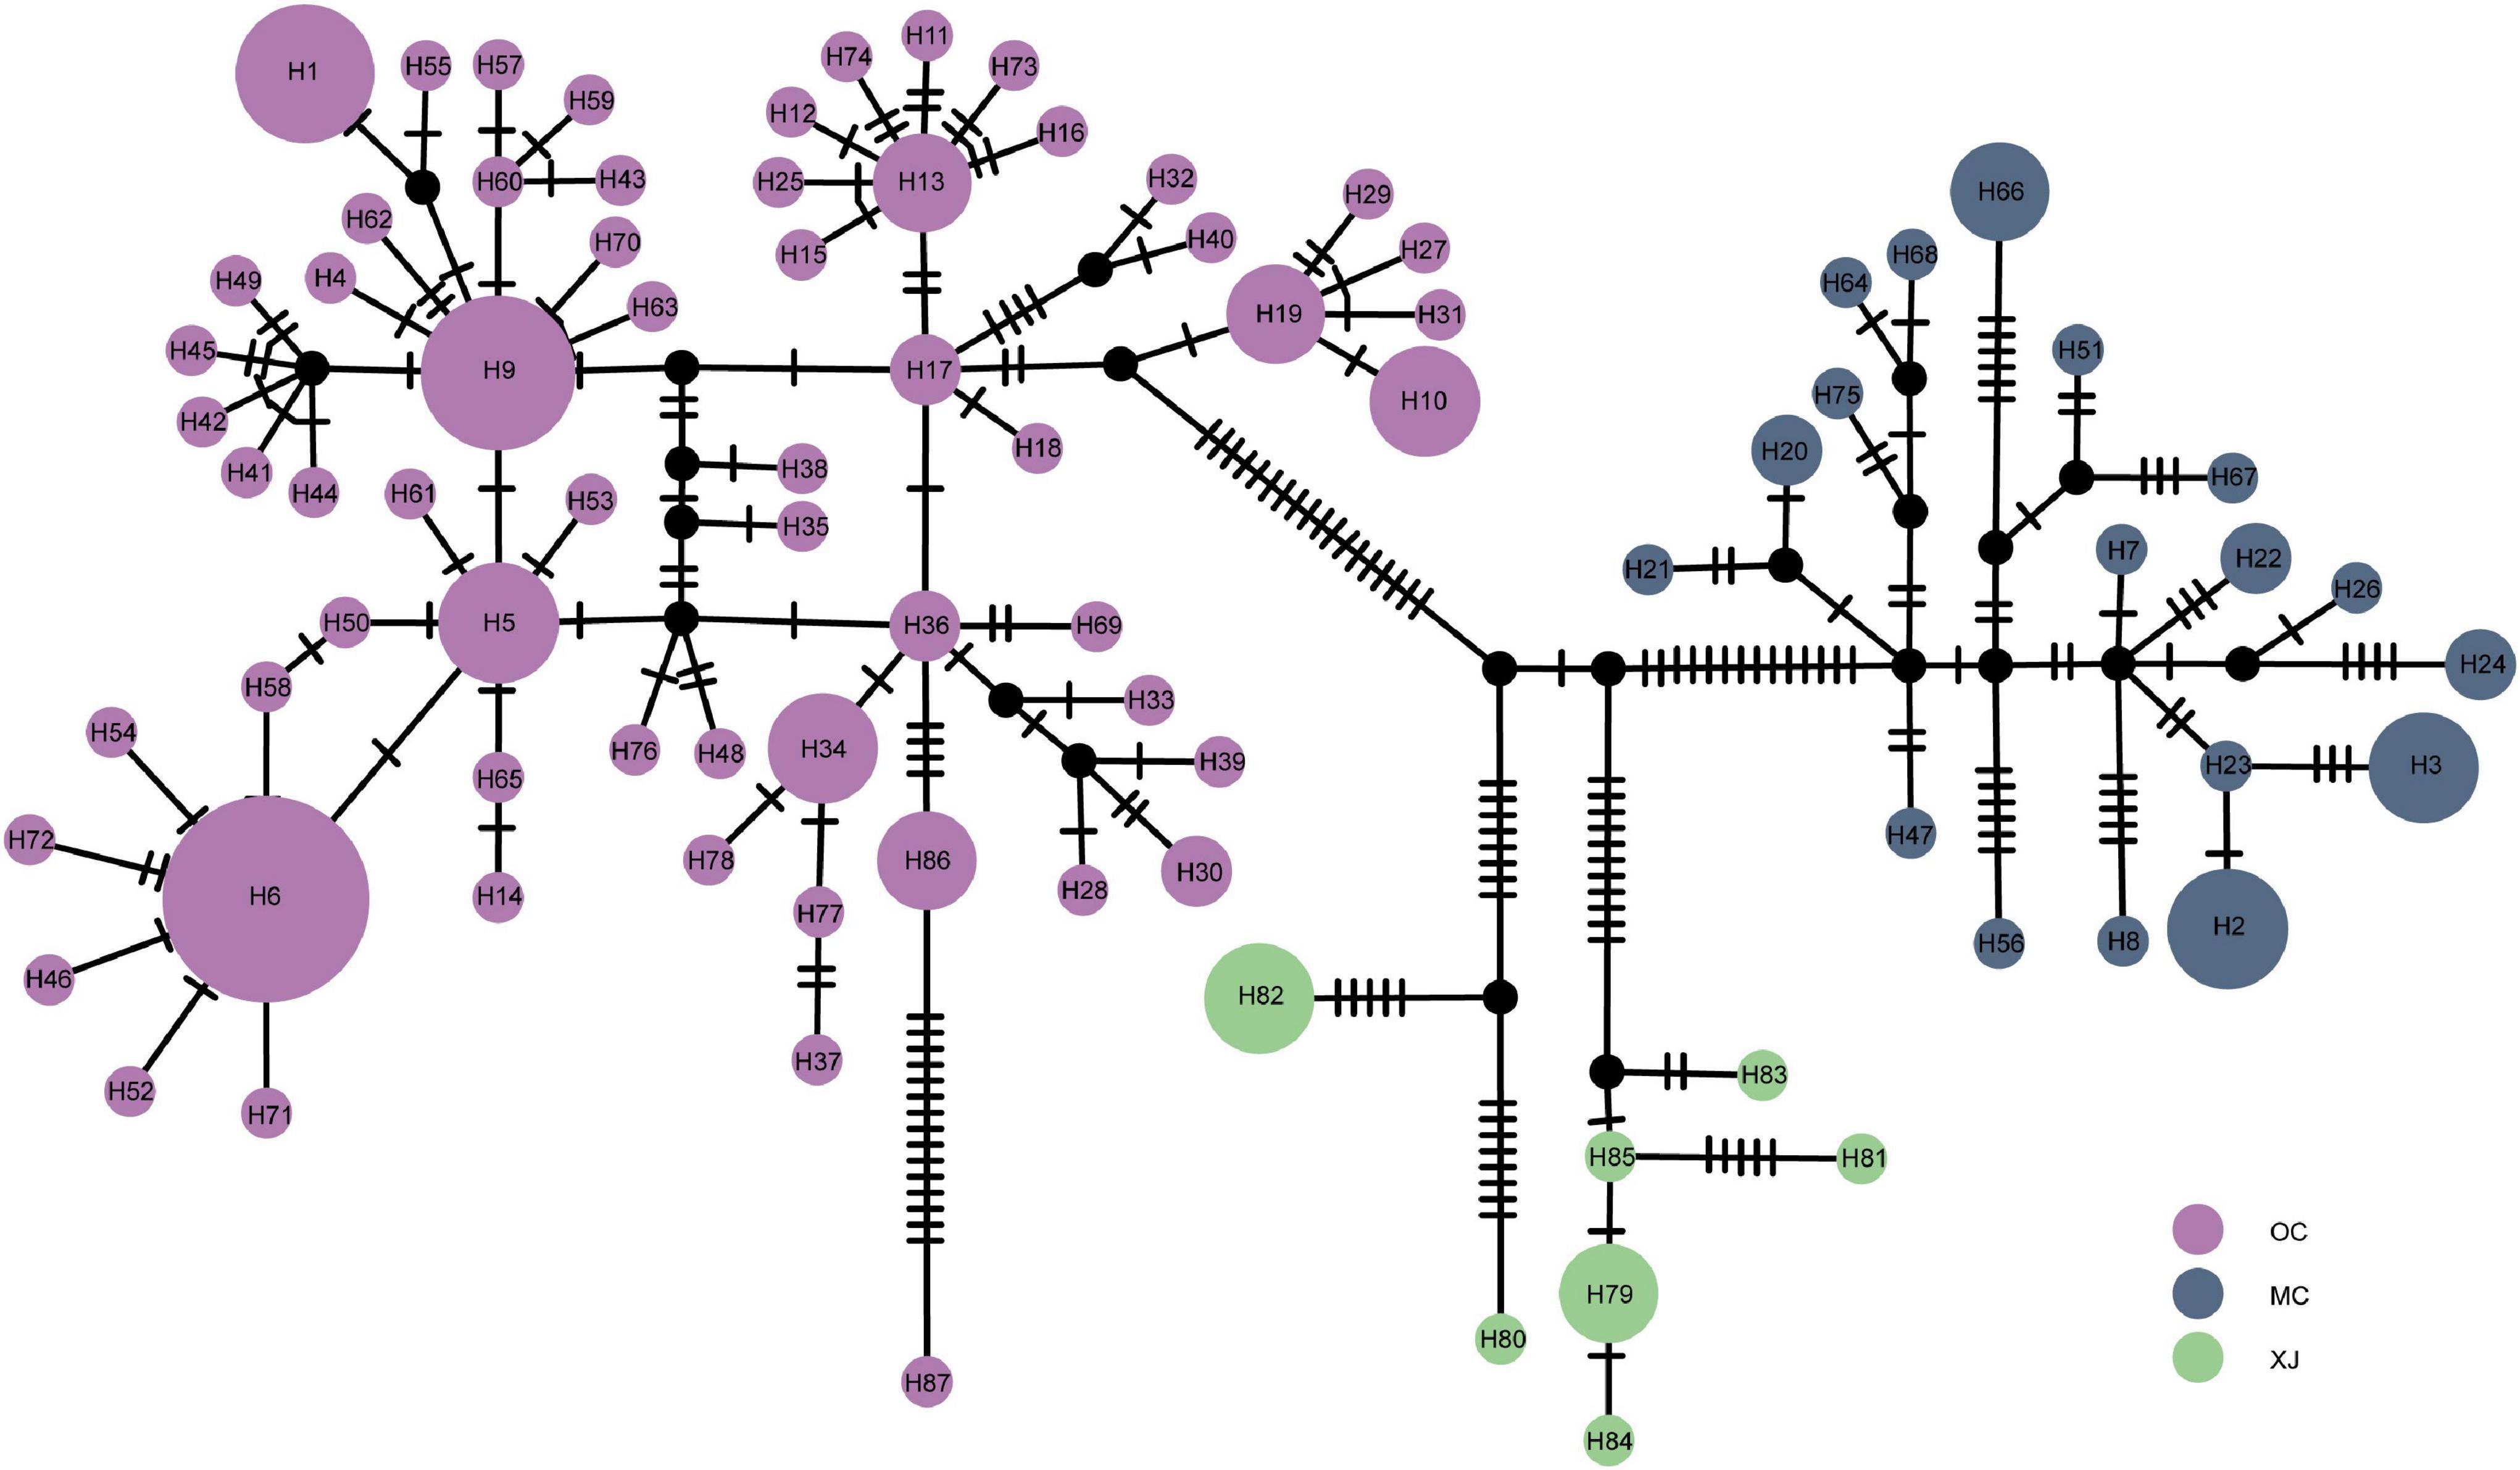
Figure 3. Median-joining network of haplotypes based on the mitogenome. Colored circles represent haplotypes, and black circles represent missing haplotypes that were not observed. The area of the circle is proportional to the number of haplotypes.
Our divergence time estimation suggested that the most recent common ancestor (MRCA) of SAA was 83.2 Ka (kilo-annum) and diverged into the MRCA of XJ and MC, and OC lineages with the ages of 75.3 and 27.7 Ka (Figure 1). The MRCA ages of XJ and MC were 63.5 and 25.1 Ka, respectively. Thus, all three lineages diverged during the late Pleistocene Quaternary.
Demographic History
In the mismatch distribution analyses (Figure 4), the observed and simulated curves did not significantly differ from each other in OC lineage with the parameters of SSD and r being small and insignificant (P > 0.05). Hence, the population expansion process was supported in this lineage. In contrast, XJ and MC lineages exhibited relatively large and significant parameters of SSD and r. Thus, the population expansion event was not supported in these two lineages. BSP analysis (Figure 4) revealed that OC lineage and total samples experienced a significant increase in effective population size about 1500–2000 years ago, which was a very recent expansion event. However, the population size of MC and XJ groups showed a slight decrease after a long steady period.
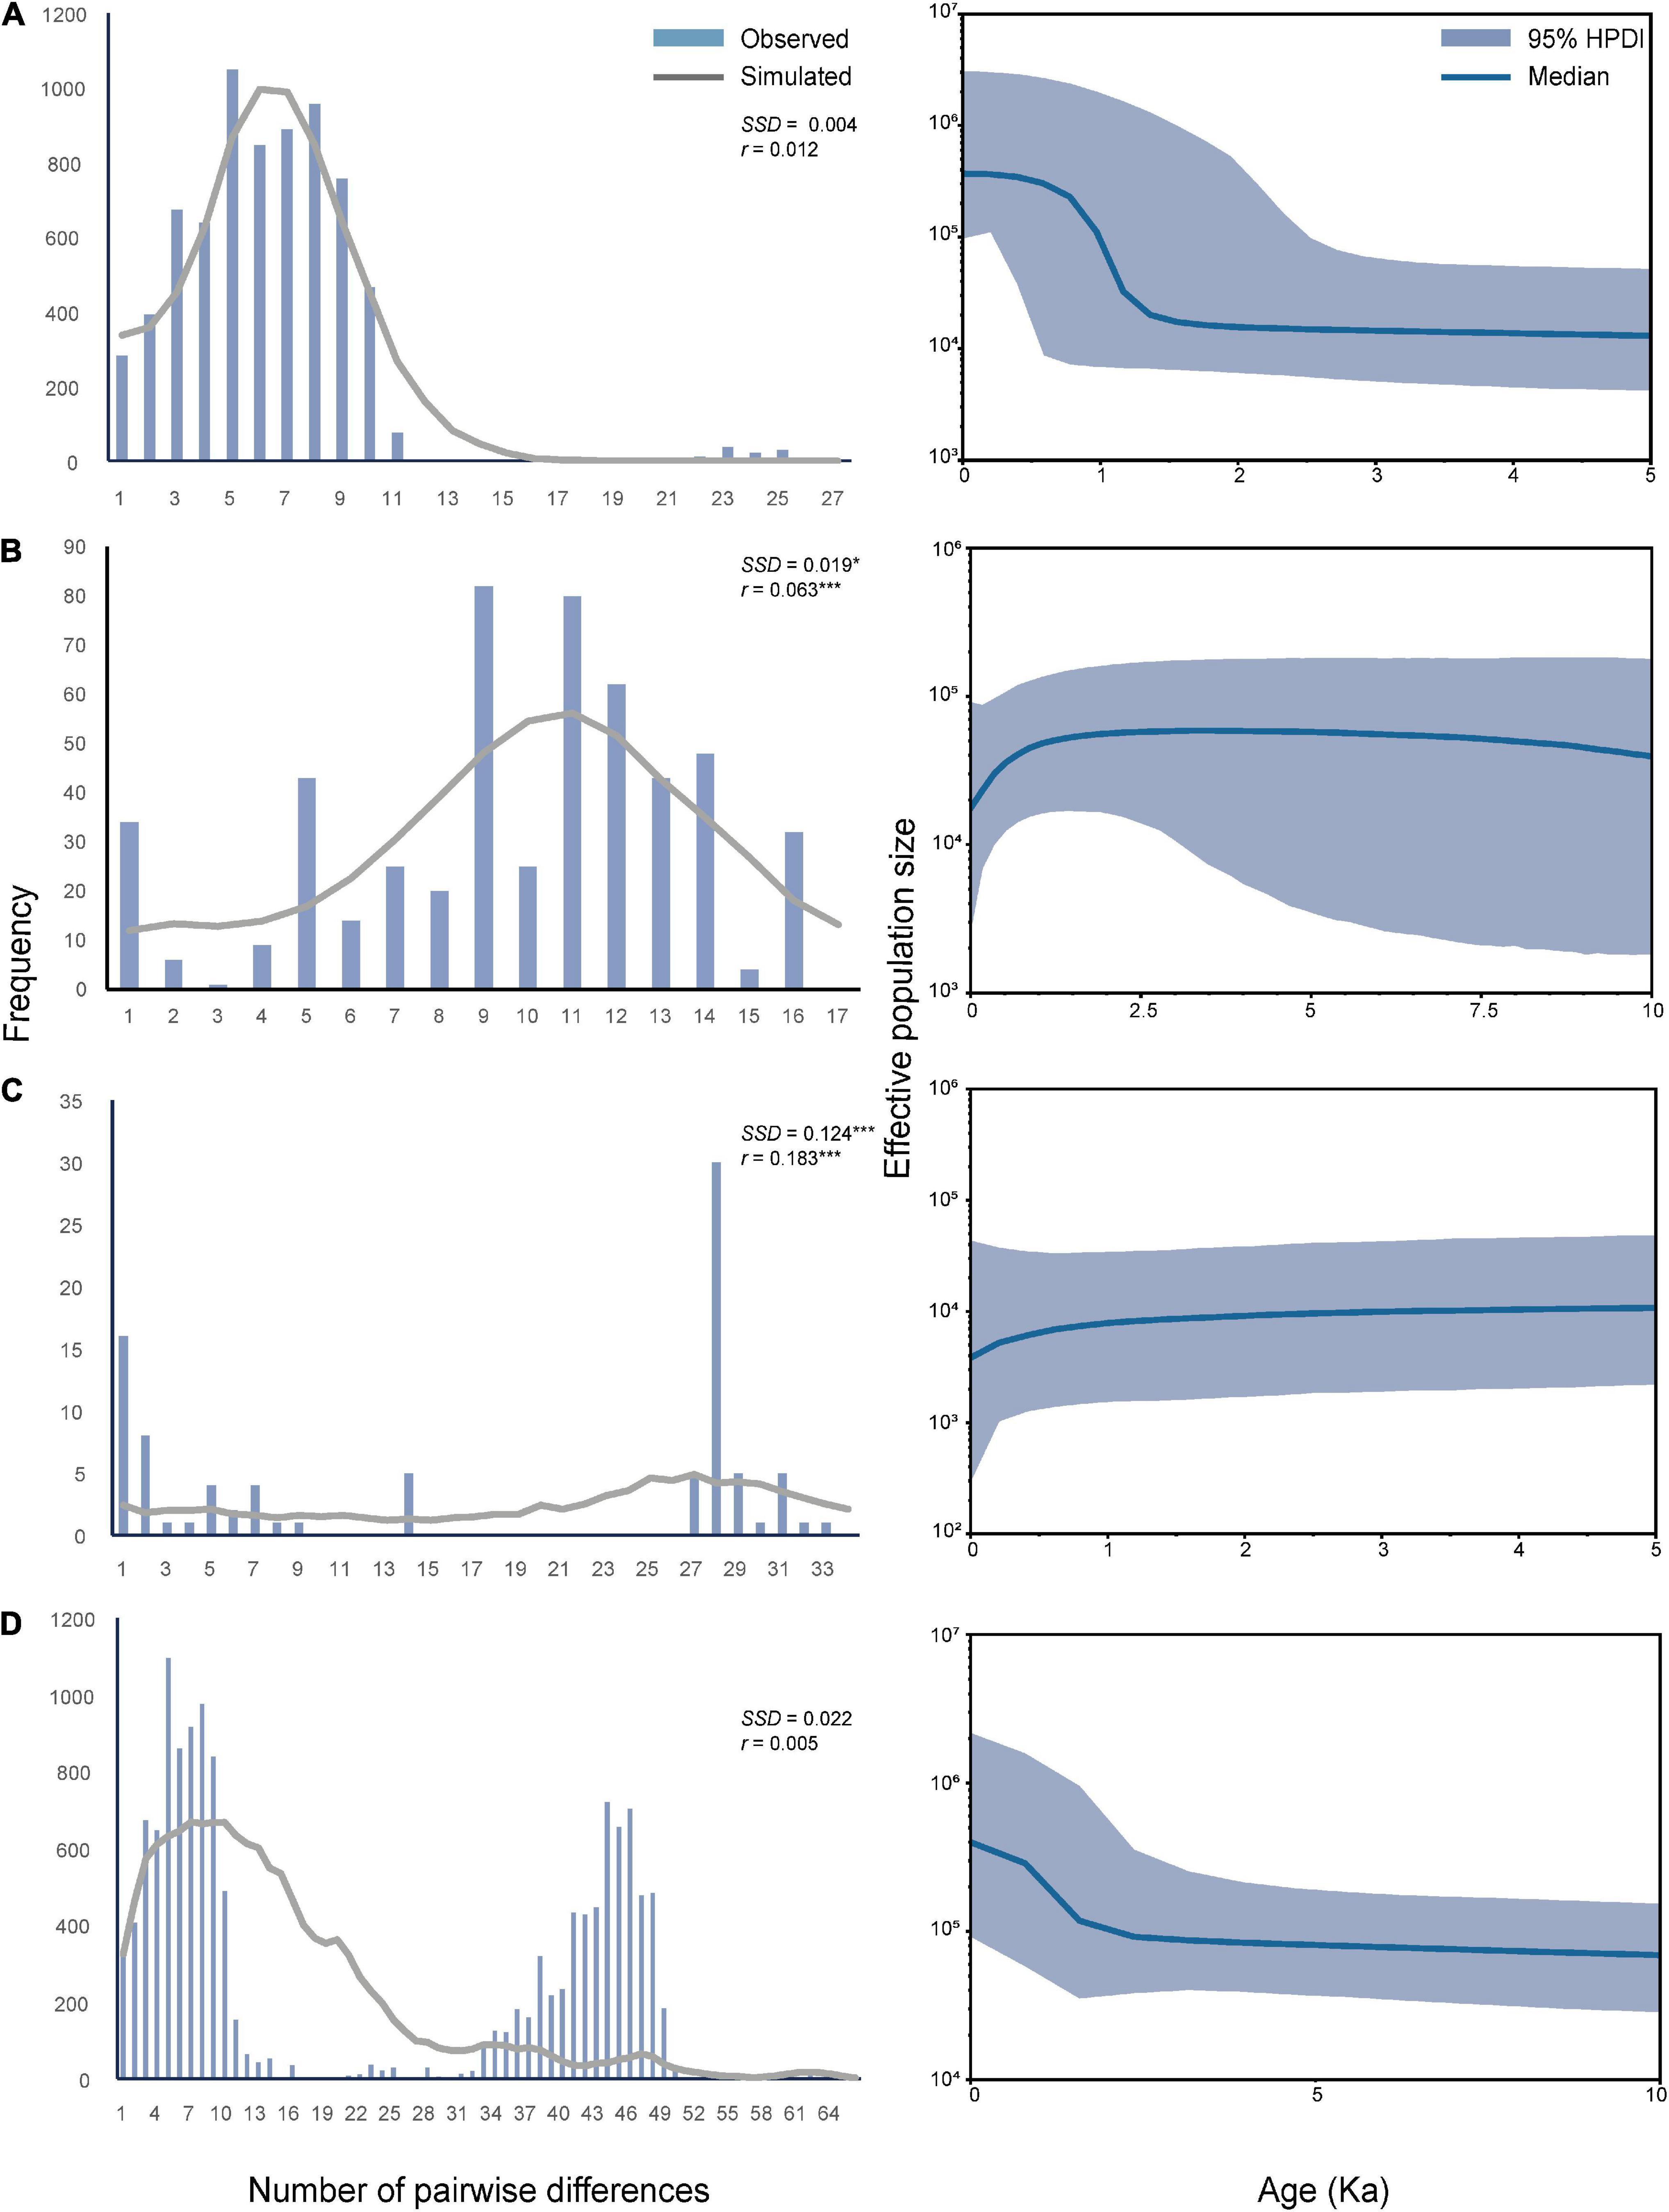
Figure 4. Mismatch distribution analysis and the demographic history of three lineages and whole samples of T. trifolii based on the mitogenome sequences. (A) OC lineage. (B) MC lineage. (C) XJ lineage. (D) All samples. SSD, sum of square deviations; r, Harpending’s raggedness index; *P < 0.05; **P < 0.01; ***P < 0.001. For Bayesian skyline plots, the median estimated effective population sizes (middle lines) are enclosed within the 95% highest posterior density intervals (HPDI, shaded areas).
Discussion
This study investigated the population genetic structure of SAA in China using complete genome sequences. Population genetic structure of species can be inferred from mitochondrial genes and nuclear markers (Zhang et al., 2017; Cao et al., 2021). However, the complete mitogenome may accumulate more variations and provide valuable information for population genetic structure inference (Du et al., 2019, 2021). Although the detected variations are from the same locus, our analyses provided a first insight into genetic diversity and population structure of this economically significant invasive pest.
Overall, the SAA populations in China display relatively low nucleotide diversity but high haplotype diversity. The low nucleotide diversity can be explained by the recent introduction event of SAA, which is associated with the resent expansion and bottleneck effects. Besides, the unique reproduction method of aphid involving parthenogenesis might also lead to the low genetic diversity (Hales et al., 1997). The high haplotype diversity, on the other hand, may be caused by the multiple massive introductions, offsetting the bottleneck effect. There are also some populations, such as GSQY, GSYZ, GZGY, and NSNY, showing a relatively high genetic diversity. This is probably attributed to the mixing OC and MC lineages in those populations.
Based on our analysis, we clarify that the SAA populations in China are composed of three genetically distinct lineages. We inferred that the three lineages are most likely formed by human-mediated introduction instead of natural dispersal, and each lineage possibly has a different invasion source. First of all, the time of the introduction of SAA’s host, M. sativa, in mainland was around 2,000 years ago (Gao, 2012). The divergent time estimation suggests that three groups have been diverged long before the beginning of alfalfa plantation in China. In addition, the Mantel test also supported that the geographical distances were not the main reason of diversification among populations. Moreover, according to the historical records, China’s alfalfa fodder used in animal husbandry, especially the dairy industry, depended heavily on the importation from foreign countries since the early 21st century, including the United States, Canada, Australia, and some European countries such as France, Germany, and Spain.2 Besides, some Chinese fodder companies also introduced high-quality species of lucerne from other continents and long-distance dispersal of the pest might be carried out as a result.3 Subsequently, the domestic alfalfa trade in China may further facilitate the expansion of different lineages across the country. The restricted distribution of XJ lineage may be a result of the remote nature of Xinjiang province and limited inter-province transportations between Xinjiang and other provinces.
Biological invasions showed a natural rapid evolutionary process in contemporary time scale and the invasive species may present a major threat to biodiversity and ecosystem integrity (McKinney and Lockwood, 1999; Olden et al., 2004). The multiple invasion event suspected for SAA is common for invasive alien species (Roman and Darling, 2007; Dlugosch and Parker, 2010). Moreover, most invasions of non-indigenous species were the result of commercial trades among different continents and countries in the last decade. For example, the spotted lanternfly (Lycorma delicatula) is native to China and invaded some Asian countries and north America possibly through timber transportation (Du et al., 2021); the box tree moth (Cydalima perspectalis), native to Asia, spread rapidly because of the trade of ornamental box trees (Bras et al., 2019); the Asian long-horned beetle (Anoplophora glabripennis), native to East Asia, was introduced to other countries via solid wood packing material (Javal et al., 2017); and Drosophila suzukii, indigenous in eastern Asia, had widely expanded its range and became a serious pest in some areas with its introductions related to the trade of host fruits (Vega et al., 2020). At present, the large-scale alfalfa transportation is still ongoing between China and other countries. The suspected multiple invasions in this study highlight the importance of developing effective quarantine measures to prevent continuous introductions from source regions.
Our study provides an insight into the genetic structure of SAA populations in China. The results indicated the presumed multiple introductions. This research included populations from China only, and we intend to collect more samples from other continents to obtain a clearer genetic structure and more accurate invasion history on the dynamics of the introductions. Combining the samples collected from overseas, we may trace its origins and invasion pathways and obtain a better understanding of the global distributions of the invasive populations at different scales. Besides, higher resolution molecular markers, such as single nucleotide polymorphisms obtained from whole-genome resequencing method, are expected in the future studies.
Data Availability Statement
The datasets presented in this study can be found in online repositories. The names of the repository/repositories and accession number(s) can be found below: https://www.ncbi.nlm.nih.gov/genbank/, MW885588–MW885754.
Author Contributions
WC: conceptualization, methodology, and writing—review and editing. RZ: conceptualization and methodology. XL: investigation, formal analysis, and writing—original draft. SW, JH, and XZ: investigation. ZD: formal analysis and writing—original draft. HL: methodology and writing—review and editing. All authors contributed to the article and approved the submitted version.
Funding
This work was supported by grants from the Ningxia Province Sci-Tech Innovation Demonstration Program of High-Quality Agricultural Development and Ecological Conservation (NGSB-2021-15-04) and the Key Research and Development Program of Ningxia Province (2017BY080).
Conflict of Interest
The authors declare that the research was conducted in the absence of any commercial or financial relationships that could be construed as a potential conflict of interest.
Publisher’s Note
All claims expressed in this article are solely those of the authors and do not necessarily represent those of their affiliated organizations, or those of the publisher, the editors and the reviewers. Any product that may be evaluated in this article, or claim that may be made by its manufacturer, is not guaranteed or endorsed by the publisher.
Acknowledgments
We are grateful to Guohua Huang, Minglong Yuan, Tao Li, and many other colleagues for their assistance in sample collection.
Supplementary Material
The Supplementary Material for this article can be found online at: https://www.frontiersin.org/articles/10.3389/fevo.2021.759496/full#supplementary-material
Footnotes
References
Abascal, F., Zardoya, R., and Telford, M. J. (2010). TranslatorX: multiple alignment of nucleotide sequences guided by amino acid translations. Nucleic Acids Res. 38(Suppl. 2), 7–13.
Bernt, M., Donath, A., Jühling, F., Externbrink, F., Florentz, C., Fritzsch, G., et al. (2013). MITOS: improved de novo metazoan mitochondrial genome annotation. Mol. Phylogenet. Evol. 69, 313–319. doi: 10.1016/j.ympev.2012.08.023
Bishop, J. L., and Crockett, D. (1961). The Spotted Alfalfa Aphid in Virginia. Glade Spring, VA: Virginia Agricultural Experimental Station, 22.
Bolger, A. M., Lohse, M., and Usadel, B. (2014). Trimmomatic: a flexible trimmer for Illumina sequence data. Bioinformatics 30, 2114–2120. doi: 10.1093/bioinformatics/btu170
Bouckaert, R., Heled, J., Kühnert, D., Vaughan, T., Wu, C. H., Xie, D., et al. (2014). BEAST2: a software platform for Bayesian evolutionary analysis. PLoS Comput. Biol. 10:e1003537. doi: 10.1371/journal.pcbi.1003537
Bras, A., Avtzis, D. N., Kenis, M., Li, H., Vétek, G., Bernard, A., et al. (2019). A complex invasion story underlies the fast spread of the invasive box tree moth (Cydalima perspectalis) across Europe. J. Pest Sci. 92, 1187–1202. doi: 10.1007/s10340-019-01111-x
Cao, L. J., Li, B. Y., Chen, J. C., Zhu, J. Y., Hoffmann, A. A., and Wei, S. J. (2021). Local climate adaptation and gene flow in the native range of two co-occurring fruit moths with contrasting invasiveness. Mol. Ecol. 30, 4204–4219. doi: 10.1111/mec.16055
Carver, M. (1978). The scientific nomenclature of the spotted alfalfa aphid (Homoptera: Aphididae). Aust. J. Entomol. 17, 287–288. doi: 10.1111/j.1440-6055.1978.tb00159.x
Cheng, L., Connor, T. R., Siren, J., Aanensen, D. M., and Corander, J. (2013). Hierarchical and spatially explicit clustering of DNA sequences with BAPS software. Mol. Biol. Evol. 30, 1224–1228. doi: 10.1093/molbev/mst028
Ciosi, M., Miller, N. J., Kim, K. S., Giordano, R., Estoup, A., and Guillemaud, T. (2008). Invasion of Europe by the western corn rootworm, Diabrotica virgifera virgifera: multiple transatlantic introductions with various reductions of genetic diversity. Mol. Ecol. 17, 3614–3627. doi: 10.1111/j.1365-294X.2008.03866.x
Dlugosch, K. M., and Parker, I. M. (2010). Founding events in species invasions: genetic variation, adaptive evolution, and the role of multiple introductions. Mol. Ecol. 17, 431–449. doi: 10.1111/j.1365-294X.2007.03538.x
Drag, L., Hauck, D., Bérces, S., Michalcewicz, J., Jelaska, L., Aurenhammer, S., et al. (2015). Genetic differentiation of populations of the threatened saproxylic beetle Rosalia longicorn, Rosalia alpina (Coleoptera: Cerambycidae) in Central and South-East Europe. Biol. J. Linn. Soc. 116, 911–925. doi: 10.1111/bij.12624
Du, Z., Hasegawa, H., Cooley, J. R., Simon, C., Yoshimura, J., Cai, W., et al. (2019). Mitochondrial genomics reveals shared phylogeographic patterns and demographic history among three periodical cicada species groups. Mol. Biol. Evol. 36, 1187–1200. doi: 10.1093/molbev/msz051
Du, Z., Wu, Y., Chen, Z., Cao, L., Tadashi, I., Satoshi, K., et al. (2021). Global phylogeography and invasion history of the spotted lanternfly revealed by mitochondrial phylogenomics. Evol. Appl. 14, 915–930. doi: 10.1111/eva.13170
Edwards, R. (2011). Quality control and preprocessing of metagenomic datasets. Bioinformatics 27, 863–864. doi: 10.1093/bioinformatics/btr026
Estoup, A., and Guillemaud, T. (2010). Reconstructing routes of invasion using genetic data: why, how and so what? Mol. Ecol. 19, 4113–4130. doi: 10.1111/j.1365-294X.2010.04773.x
Estoup, A., Ravignné, V., Hufbauer, R., Vitalis, R., Gautier, M., and Facon, B. (2016). Is there a genetic paradox of biological invasion? Annu. Rev. Ecol. Evol. Syst. 47, 51–72. doi: 10.1146/annurev-ecolsys-121415-032116
Excoffier, L., and Lischer, H. (2010). Arlequin suite ver 3.5: a new series of programs to perform population genetics analyses under Linux and Windows. Mol. Ecol. Resour. 10, 564–567. doi: 10.1111/j.1755-0998.2010.02847.x
Excoffier, L., Smouse, P. E., and Quattro, J. M. (1992). Analysis of molecular variance inferred from metric distances among DNA haplotypes: application to human mitochondrial DNA restriction data. Genetics 131, 479–491. doi: 10.1093/genetics/131.2.479
Facon, B., Pointier, J. P., Glaubrecht, M., Poux, C., and David, P. (2003). A molecular phylogeography approach to biological invasions of the new world by parthenogenetic Thiarid snails. Mol. Ecol. 12, 3027–3039. doi: 10.1046/j.1365-294X.2003.01972.x
Gao, F. (2012). Study on Climatic Regionalization of Alfalfa based on Fall Dormancy in China. Ph.D. dissertation, Beijing: Beijing Forestry University.
Giles, K. L., Berberet, R. C., Zarrabi, A. A., and Dillwith, J. W. (2002). Influence of alfalfa cultivar on suitability of Acyrthosiphon kondoi (Homoptera: Aphididae) for survival and development of Hippodamia convergens and Coccinella septempunctata (Coleoptera: Coccinellidae). J. Econ. Entomol. 95, 552–557. doi: 10.1603/0022-0493-95.3.552
Hales, D. F., Tomiuk, J., Wöhrmann, K., and Sunnucks, P. (1997). Evolutionary and genetic aspects of aphid biology: a review. Eur. J. Entomol. 94, 1–55.
Howe, W. L., and Smith, O. F. (1957). Resistance to the spotted alfalfa aphid in lahontan alfalfa. J. Econ. Entomol. 50, 320–324. doi: 10.1093/jee/50.3.320
Hughes, R. D., Woolcock, L. T., Roberts, J. A., and Hughes, M. A. (1987). Biological control of the spotted alfalfa aphid, Therioaphis trifolii f. maculata, on lucerne crops in Australia, by the introduced parasitic hymenopteran Trioxys complanatus. J. Appl. Ecol. 24, 515–537. doi: 10.2307/2403890
Javal, M., Roques, A., Haran, J., Hérard, F., Keena, M., and Roux, G. (2017). Complex invasion history of the Asian long-horned beetle: fifteen years after first detection in Europe. J. Pest Sci. 92, 173–187. doi: 10.1007/s10340-017-0917-1
Kang, M., Buckley, Y. M., and Lowe, A. J. (2007). Testing the role of genetic factors across multiple independent invasions of the shrub Scotch broom (Cytisus scoparius). Mol. Ecol. 16, 4662–4673. doi: 10.1111/j.1365-294X.2007.03536.x
Kolbe, J. J., Glor, R. E., Schettino, L. R., Lara, A. C., Larson, A., and Losos, J. B. (2004). Genetic variation increases during biological invasion by a Cuban lizard. Nature 431, 177–181. doi: 10.1038/nature02807
Kumar, S., Stecher, G., and Tamura, K. (2016). MEGA7: molecular evolutionary genetics analysis version 7.0 for bigger datasets. Mol. Biol. Evol. 33, 1870–1874. doi: 10.1093/molbev/msw054
Lambers, D. R., and Van den Bosch, R. (1964). On the genus Therioaphis Walker, 1870 with descriptions of new species (Homoptera: Aphididae). Zoologische Verhandelingen 68, 1–47.
Lanfear, R., Frandsen, P. B., Wright, A. M., Senfeld, T., and Calcott, B. (2016). PartitionFinder 2: new methods for selecting partitioned models of evolution for molecular and morphological phylogenetic analyses. Mol. Biol. Evol. 34, 772–773. doi: 10.1093/molbev/msw260
Lartillot, N., Rodrigue, N., Stubbs, D., and Richer, J. (2013). PhyloBayes MPI: phylogenetic reconstruction with infinite mixtures of profiles in a parallel environment. Syst. Biol. 62, 611–615. doi: 10.1093/sysbio/syt022
Lavergne, S., and Molofsky, J. (2007). Increased genetic variation and evolutionary potential drive the success of an invasive grass. Proc. Natl. Acad. Sci. U.S.A. 104, 3883–3888. doi: 10.1073/pnas.0607324104
Leigh, J. W., and Bryant, D. (2015). Popart: full-feature software for haplotype network construction. Methods Ecol. Evol. 6, 1110–1116. doi: 10.1111/2041-210X.12410
Liu, X., Wei, S., He, J., Song, F., and Cai, W. (2019). Complete mitochondrial genome of the spotted alfalfa aphid, Therioaphis trifolii (Hemiptera: Aphididae). Mitochondrial DNA B Resour. 4, 3260–3261. doi: 10.1080/23802359.2019.1644232
Lombaert, E., Guillemaud, T., Cornuet, J. M., Malausa, T., Facon, B., and Estoup, A. (2010). Bridgehead effect in the worldwide invasion of the biocontrol harlequin ladybird. PLoS One 5:e9743. doi: 10.1371/journal.pone.0009743
McKinney, M. L., and Lockwood, J. L. (1999). Biotic homogenization: a few winners replacing many losers in the next mass extinction. Trends Ecol. Evol. 14, 450–453. doi: 10.1016/S0169-5347(99)01679-1
Miller, M. A., Pfeiffer, W., and Schwartz, T. (2010). “Creating the CIPRES science gateway for inference of large phylogenetic trees,” in Proceedings of the 2010 Gateway Computing Environments Workshop (GCE 2010) (New Orleans, LA: IEEE Computer Society). doi: 10.1109/GCE.2010.5676129
Nicolas, M., Davide, R., Hurley, B. P., Brockerhoff, E. G., and Haack, R. A. (2018). Common pathways by which non-native forest insects move internationally and domestically. J. Pest Sci. 92, 13–27. doi: 10.1007/s10340-018-0990-0
Olden, J. D., Poff, L. R., Douglas, M. R., Douglas, M. E., and Fausch, K. D. (2004). Ecological and evolutionary consequences of biotic homogenization. Trends Ecol. Evol. 19, 18–24. doi: 10.1016/j.tree.2003.09.010
Papadopoulou, A., Anastasiou, I., and Vogler, A. P. (2010). Revisiting the insect mitochondrial molecular clock: the mid-Aegean trench calibration. Mol. Biol. Evol. 27, 1659–1672. doi: 10.1093/molbev/msq051
Peters, D. C., and Painter, R. H. (1957). A general classification of available small seeded legumes as hosts for three aphids of the “yellow clover aphid complex”. J. Econ. Entomol. 50, 231–235. doi: 10.1093/jee/50.3.231
Rambaut, A., Drummond, A. J., Xie, D., Baele, G., and Suchard, M. A. (2018). Posterior summarization in Bayesian phylogenetics using Tracer 1.7. Syst. Biol. 67, 901–904. doi: 10.1093/sysbio/syy032
Roderick, G. K., and Navajas, M. (2003). Genes in new environments: genetics and evolution in biological control. Nat. Rev. Genet. 4, 889–899. doi: 10.1038/nrg1201
Roman, J., and Darling, J. A. (2007). Paradox lost: genetic diversity and the success of aquatic invasions. Trends Ecol. Evol. 22, 454–464. doi: 10.1016/j.tree.2007.07.002
Roques, A., Auger-Rozenberg, M. A., Blackburn, T. M., Garnas, J., Pyšek, P., Rabitsch, W., et al. (2016). Temporal and interspecific variation in rates of spread for insect species invading Europe during the last 200 years. Biol. Invasions 18, 907–920. doi: 10.1007/s10530-016-1080-y
Rozas, J., Ferrer-Mata, A., Sánchez-DelBarrio, J. C., Guirao-Rico, S., Librado, P., Ramos-Onsins, S. E., et al. (2017). DnaSP 6: DNA sequence polymorphism analysis of large data sets. Mol. Biol. Evol. 34, 3299–3302. doi: 10.1093/molbev/msx248
Simberloff, D., Martin, J. L., Genovesi, P., Maris, V., Wardle, D. A., Aronson, J., et al. (2013). Impacts of biological invasions: what’s what and the way forward. Trends Ecol. Evol. 28, 58–66. doi: 10.1016/j.tree.2012.07.013
Trifinopoulos, J., Nguyen, L. T., Haeseler, A. V., and Minh, B. Q. (2016). W-IQ-TREE: a fast online phylogenetic tool for maximum likelihood analysis. Nucleic Acids Res. 44, 232–235. doi: 10.1093/nar/gkw256
Van den Bosch, R. (1957). The spotted alfalfa aphid and its parasites in the Mediterranean region, Middle East, and East Africa. J. Econ. Entomol. 50, 352–356. doi: 10.1093/jee/50.3.352
Van den Bosch, R., Schlinger, E. I., and Dietrick, E. J. (1957). Imported parasites established: natural enemies of spotted alfalfa aphid brought from Middle East in 1955-56 now established in California. Calif. Agr. 11, 11–12.
Vega, G., Corley, J., and Soliani, C. (2020). Genetic assessment of the invasion history of Drosophila suzukii in Argentina. J. Pest Sci. 93, 63–75. doi: 10.1007/s10340-019-01149-x
Zhang, G., and Zhong, T. (1983). Economic Insect Fauna of China, Homoptera: Aphids (1), Vol. 25. Beijing: Science Press.
Keywords: Therioaphis trifolii, biological invasion, population genetic structure, phylogenetics, mitochondrial genome
Citation: Liu X, Wei S, Du Z, He J, Zhang X, Li H, Zhang R and Cai W (2021) Population Genetic Structure of the Invasive Spotted Alfalfa Aphid Therioaphis trifolii (Hemiptera: Aphididae) in China Inferred From Complete Mitochondrial Genomes. Front. Ecol. Evol. 9:759496. doi: 10.3389/fevo.2021.759496
Received: 16 August 2021; Accepted: 13 September 2021;
Published: 01 October 2021.
Edited by:
Ai-bing Zhang, Capital Normal University, ChinaReviewed by:
Zhijun Zhou, Hebei University, ChinaYuyu Wang, Agricultural University of Hebei, China
Copyright © 2021 Liu, Wei, Du, He, Zhang, Li, Zhang and Cai. This is an open-access article distributed under the terms of the Creative Commons Attribution License (CC BY). The use, distribution or reproduction in other forums is permitted, provided the original author(s) and the copyright owner(s) are credited and that the original publication in this journal is cited, in accordance with accepted academic practice. No use, distribution or reproduction is permitted which does not comply with these terms.
*Correspondence: Wanzhi Cai, Y2Fpd3pAY2F1LmVkdS5jbg==; Rong Zhang, eWN6aHJueEAxNjMuY29t