
95% of researchers rate our articles as excellent or good
Learn more about the work of our research integrity team to safeguard the quality of each article we publish.
Find out more
METHODS article
Front. Ecol. Evol. , 05 January 2022
Sec. Behavioral and Evolutionary Ecology
Volume 9 - 2021 | https://doi.org/10.3389/fevo.2021.743014
This article is part of the Research Topic Cognitive Movement Ecology View all 16 articles
 Shauhin E. Alavi1,2,3*
 Alexander Q. Vining1,2,4
 Damien Caillaud5
 Ben T. Hirsch6,7
 Rasmus Worsøe Havmøller8Linnea W. Havmøller8Roland Kays6,9,10
 Margaret C. Crofoot1,2,3,5
Animal movement along repeatedly used, “habitual” routes could emerge from a variety of cognitive mechanisms, as well as in response to a diverse set of environmental features. Because of the high conservation value of identifying wildlife movement corridors, there has been extensive work focusing on environmental factors that contribute to the emergence of habitual routes between protected habitats. In parallel, significant work has focused on disentangling the cognitive mechanisms underlying animal route use, as such movement patterns are of fundamental interest to the study of decision making and navigation. We reviewed the types of processes that can generate routine patterns of animal movement, suggested a new methodological workflow for classifying one of these patterns—high fidelity path reuse—in animal tracking data, and compared the prevalence of this pattern across four sympatric species of frugivorous mammals in Panama. We found the highest prevalence of route-use in kinkajous, the only nocturnal species in our study, and propose that further development of this method could help to distinguish the processes underlying the presence of specific routes in animal movement data.
Technological and analytical innovations in animal tracking and remote sensing have led to increased opportunities in animal movement research (Nathan et al., 2008; Kays et al., 2015). Tracking data are now available at high sampling rates and researchers are using them to understand animal movement decisions (Nathan et al., 2008; Fagan et al., 2013; Kays et al., 2015; Gurarie et al., 2016). One striking feature that emerges in many of these high-resolution datasets is highly consistent, route-like patterns of movement. While the frequency and fidelity of such movement patterns varies, route-use, nonetheless, appears to be taxonomically widespread. Routine movement is of substantial interest due to its relevance to conservation action and because of the insight it provides into animals’ cognition (Riotte-Lambert et al., 2016). However, few quantitative methods exist for identifying such patterns of movement.
Routineness, namely, the habitual reuse of the same series of locations over time, can occur as the result of commuting (see Glossary) between a set of target destinations. The more deterministic the ordering of visits to said locations, the more route-like patterns of movement will be (e.g., trap-lining honeybees; Lihoreau et al., 2012; Reynolds et al., 2013). The paths an individual takes during a commute can range from highly variable to highly congruent (see Glossary). In practice, researchers working with animal movement tracks are faced with identifying patterns of spatial behavior, from fully diffusive and exploratory to highly routine, and attempting to infer the processes creating this pattern. Areas where animals exhibit highly routine movement, particularly high path reuse fidelity, are of particular interest, as the habitual use of these areas likely indicate their elevated importance to the animals.
Patterns of high-fidelity path reuse can emerge from a number of environmental and behavioral processes. Routine movements with low directional variability can be observed at specific locations in the landscape simply because an individual was constrained by the geometry of that area. This could be due to completely unsuitable habitat (e.g., a narrow strip of forest through a city) or due to more nuanced relationships between a species and the surrounding habitat. For example, individuals might move through areas based on how their motion capacity (i.e., locomotory biomechanics; Nathan et al., 2008) interfaces with constraints imposed by substrate characteristics following, for example, paths that minimize energy expenditure or predation risk (Adriaensen et al., 2003; McRae et al., 2008; Pullinger and Johnson, 2010; LaPoint et al., 2013; Bastille-Rousseau et al., 2020). Areas where routine movements are generated by external factors are typically referred to as corridors within the conservation literature (Forman, 1995; Rosenberg et al., 1997; LaPoint et al., 2013; Bastille-Rousseau and Wittemyer, 2021).
Routine movement can emerge from the cognitive processes underlying animal search and navigation strategies (Mueller and Fagan, 2008; Bracis, 2014; Bracis et al., 2015; Polansky et al., 2015; Riotte-Lambert and Matthiopoulos, 2019). Highly routine modes of movement behavior can result from an individual’s decision to navigate toward a known or perceived target location, and are not necessarily predicted by the physical properties of the environment, but instead by the individual’s understanding of the spatial relationships between itself and its targets. When movement processes rely strictly on perceptual information (i.e., oriented mechanisms; Mueller and Fagan, 2008), animals detect some sensory stimulus within their perceptual range and use various forms of taxis (Fraenkel and Gunn, 1961; Braitenberg, 1965) to bias their movement toward that target location (Mueller and Fagan, 2008). Ants and rodents, for example, have been shown to navigate by following chemical trails left by conspecifics as well as by reacting to other olfactory stimuli in their environment (chemotaxis; Kozakiewicz and Kozakiewicz, 2004; Collett, 2010; Svensson et al., 2014; Buehlmann et al., 2015). In dynamic landscapes, where the distribution of resources is variable in time and space, animals that rely purely on taxis will exhibit directed movements with low path reuse fidelity as a consequence of navigating directly toward the stimulus. In static landscapes, however, animals that rely purely on taxis will always respond the same way to a particular point in space and thus will move predictably between resources. The resulting movement will exhibit a high degree of path reuse fidelity and commute determinism, and produce a similar pattern of routine behavior as seen in corridors.
Even if animals cannot sense their target, if they remember where it is, repeated patterns of high-fidelity movement are expected to arise. These “memory mechanisms” are defined as movements where an individual has prior information about the location of its resources (Mueller and Fagan, 2008). Individuals can then use their prior experience to navigate to resources beyond their perceptual range. Unfortunately, this conceptualization does not explain the differences between patterns generated by oriented mechanisms and memory mechanisms, or the variation in patterns generated by different memory systems such as response learning and place learning. In response learning (see Glossary; reviewed in Goodman, 2021), behavioral responses to specific cues (landmarks) are reinforced if they lead to rewards such as food. Under this mechanism, animals may develop habitual sequences of spatial behavior, such as traplines, without needing to model or “map” their environment. Alternatively, with place learning (see Glossary; reviewed in Goodman, 2021), animals may learn the distances and directions between important locations and plan routes between them. Often referred to as a “cognitive map,” consistent decision-making with the use of place learning may lead to route-formation, but the use of the memory mechanism by animals remains debated. Clarifying the differences between memory systems greatly facilitates an understanding of how routine movement behavior relates to spatial cognition, but the first step in this process is accurately and reproducibly identifying patterns of routine movement.
Within behavioral ecology, and primatology in particular, areas featuring routine movement behavior are typically referred to as “routes.” Influenced largely by early work by Tolman (1948) and O’Keefe and Nadel (1978), these studies point to the repeated use of routes as evidence for egocentric memory systems. Their treatment of “routes,” however, presupposes spatial cognition as the underlying process, and the classification of a path segment as a route is typically done by eye or by grouping similar looking path segments together via some arbitrary distance threshold (Di Fiore and Suarez, 2007; Valero and Byrne, 2007; Presotto and Izar, 2010; Garber and Porter, 2014; Bebko, 2018; de Guinea et al., 2019). We define routes as areas exhibiting sequential behavior with low directional variability and high-fidelity path reuse. Spatial learning can lead to route-use, but routes can also emerge from non-cognitive processes (Figure 1). Furthermore, reliance on expert opinion can lead to challenges fostering generalizable understandings about the process itself, can lead to difficulty comparing across systems, and can hinder reproducibility.
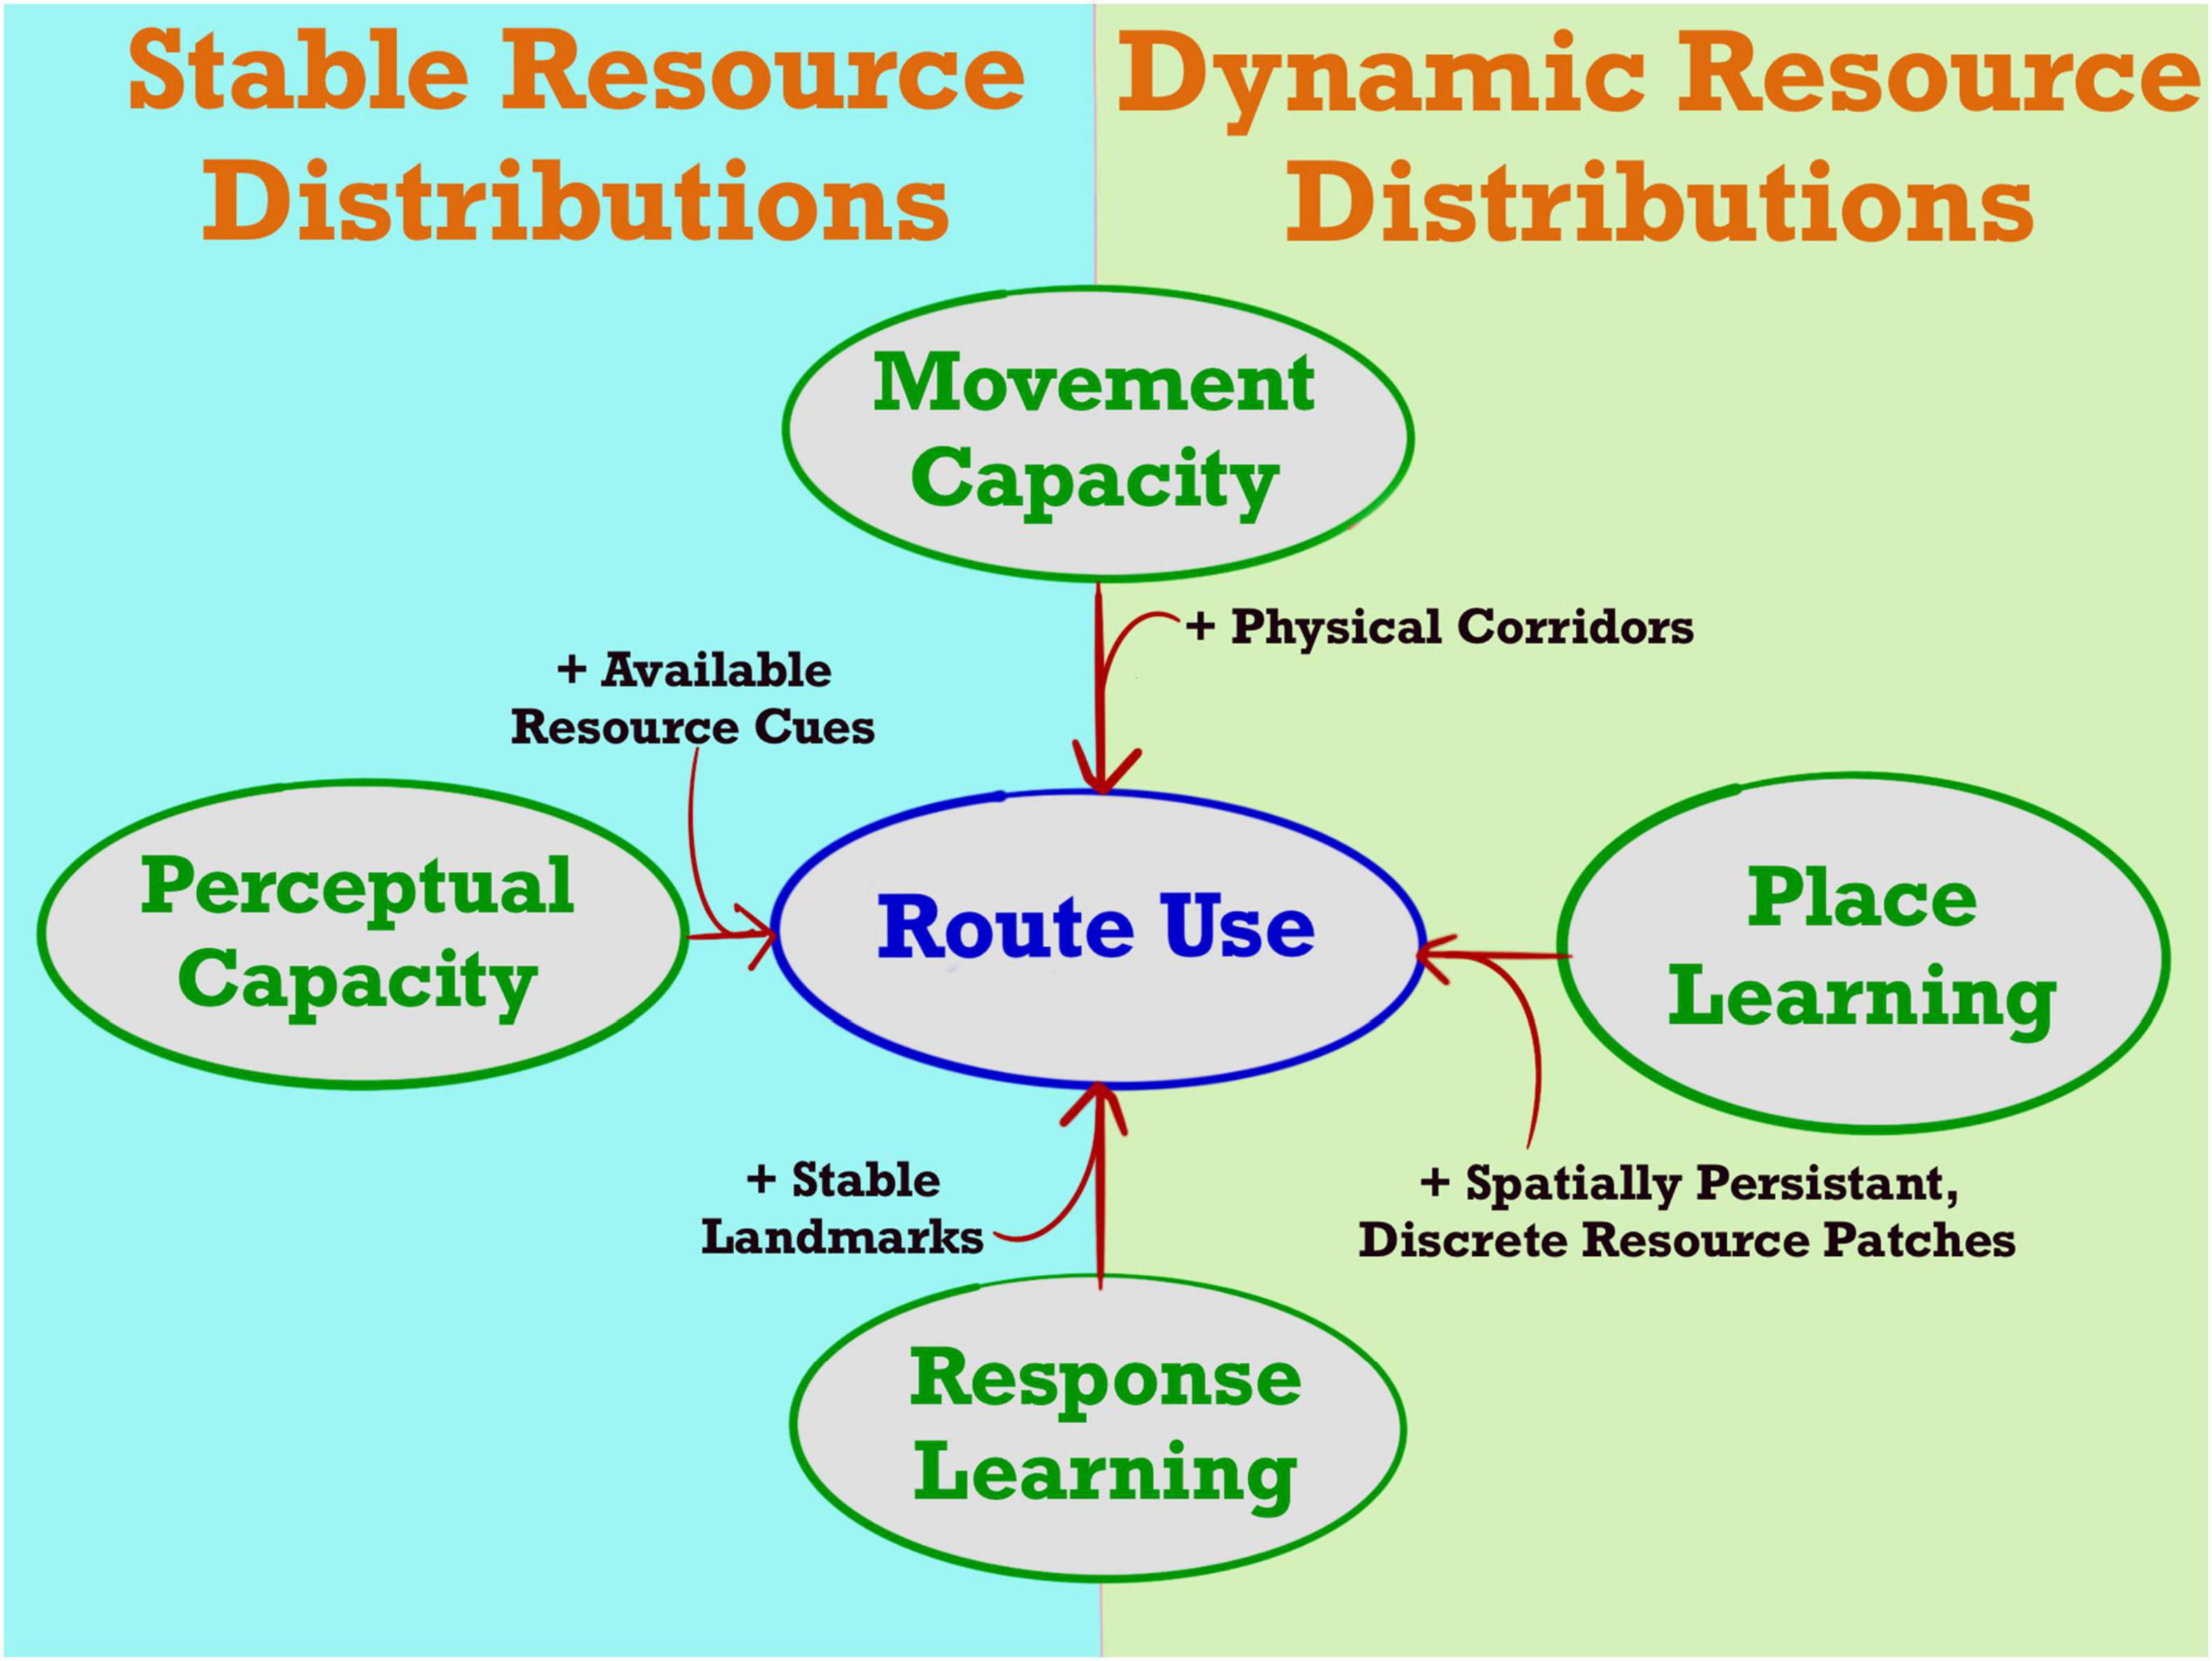
Figure 1. Multiple processes can lead to route use, dependent on the stability of the environment. When a resource gradient is persistent through time, animals that perceive that gradient can form routes by consistently following it (Perceptual Capacity). Similarly, when other permanent perceptual cues indicate the direction of a persistent resource, animals that have learned navigational responses to that cue will generate routes in the cue’s presence (Response Learning). In dynamic environments, animals may also develop routes through response learning, albeit more slowly, so long as average resource acquisition is spatially heterogenous. Whether or not resource distributions are stable in an environment, some animals may form routes due to heterogeneity in their ability to use specific substrates, following paths of least resistance (Movement Capacity). Animals capable of place learning, though less likely to follow routes overall, may consistently infer direct paths between known locations, generating route-like patterns even in dynamic environments or the absence of local landmarks.
Clearly, routine patterns of movement can arise from a mix of external and cognitive processes. Determining what explains the emergence of routine behavior in a given part of an animal’s range will require developing carefully thought-out analyses. The ability to design any analysis of routes, however, presupposes that the routes established by an animal have been previously identified. Before we can properly design studies that differentiate between route generating processes, we must first develop approaches to accurately and reliably identify patterns of routine movement. Hereby, we introduce a method for quantifying the degree to which movement is routine from animal tracking data, and discuss how the results of this approach can be elaborated on to infer cognition.
The majority of the quantitative tools for identifying areas with highly routine movement have been developed to examine revisits to target destinations (e.g., Riotte-Lambert et al., 2016; Ayers et al., 2018; Bracis et al., 2018). Examining recursions to target destinations provides valuable insights into the temporal dynamics of resource use and can provide insights into processes such as traplining, however, these methods aren’t explicitly designed to examine the trajectories animals used between recursive visits. Methods to detect the actual routes an animal used have largely come from research on conservation corridors. These methods may be suitable for recognizing routine movement when it is generated by external factors, however, they may not be ideal when the pattern is generated by spatial cognition. Dynamic Brownian bridges have been used to reveal shared bird migration corridors (e.g., Buechley et al., 2018). Dynamic Brownian bridges, however, are kernel approaches designed for interpolating missing location information in animal tracks (Bullard, 1999; Calenge, 2006). In some cases, the resulting density may reveal areas that visually resemble routes, however, this approach may miss navigation decisions at very local spatial scales, as well as fail to detect route-like spatial patterns in non-migratory species with limited home ranges. Objective comparison across individuals with non-overlapping ranges, however, is not straight forward, and the actual deterministic use of those areas are not accounted for.
Promising approaches are available that involve (a) sweeping through a track with a circular buffer to identify areas of low directional variability and high speed (LaPoint et al., 2013), or (b) binning movement data into grid cells and performing unsupervised clustering on network centrality metrics calculated for each cell (Bastille-Rousseau et al., 2018; Bastille-Rousseau et al., 2020). There are potential drawbacks to both approaches. First, both approaches implicitly assume independence in the data at the scale at which they segment the movement data. The circular buffer approach allows for variable step lengths and sets the buffer radius size to the step length, while the network approach sets the grid size to the median step length. Ideally, an alternative approach would ensure that the scale at which movement is autocorrelated would be estimated and the cell/step sizes would be large enough to capture independent displacements (Fleming et al., 2014; Gurarie et al., 2017, Noonan et al., 2019). Second, these approaches both define corridor behavior as fast, repeated movements with very constrained directional variability (LaPoint et al., 2013; Bastille-Rousseau et al., 2018; Bastille-Rousseau et al., 2020). The speed assumptions about corridor behavior are based on the assumption that animals don’t forage in corridors (Forman, 1995; Rosenberg et al., 1997), while studies of spatial navigation posit that (a) certain forms of taxis can result in movement that is necessarily slow (e.g., Svensson et al., 2014) and (b) animals will establish routes that increase their likelihood of encountering food and will forage along routes (Di Fiore and Suarez, 2007; de Guinea et al., 2019). We do not dispute this conceptualization of corridor behavior; rather we acknowledge that corridor use may be a particular class of route. We define a corridor as a route that emerges due to external constraints and independent of spatial learning (see Glossary). Studies of spatial cognition may require methods designed to detect routes more generally, in order to facilitate the detection of routine behavior emerging as a function of spatial cognition. In this case, a method that does not assume a relationship between route-use and velocity may be more generally useful. Finally, the approach presented by Bastille-Rousseau et al. (2018) characterizes locations utilized by an animal in terms of their graph theoretic properties, some of which may well capture the persistent and deterministic features of routine route use. They do not, however, attempt to explicitly identify or characterize any locations as routes or areas of highly routine behavior.
Here, we present a workflow using unsupervised-learning to estimate the degree to which locations exhibit routine behavior and differentiate habitual routes from other used locations.
Data were collected for a larger study on resource selection and cognition, and were not collected with this paper in mind. Data were collected at the Smithsonian Tropical Research Institute field station on Barro Colorado Island (BCI), a 1,560-ha island of semi-deciduous tropical lowland forest in Lake Gatun, Panama (9° 09′N/79° 51′W). For a full description see Leigh (1999). The island exhibits a distinct dry season from mid-December to mid-April. Fruit availability during the dry season is largely restricted to Dipteryx oleifera, resulting in nearly identical resource distribution for the entire community of frugivorous mammals on the island.
We fit GPS/3-D accelerometer collars (e-Obs Digital Telemetry, Gruenwald, Germany)1 to individuals from four species, two primates, capuchins (Cebus capucinus), spider monkeys (Ateles geoffroyi), and two procyonid carnivores, kinkajou (Potos flavus) and coati (Nasua narica).
Collars were programmed to collect a burst of six consecutive (1 hz) GPS locations every 4 min during the animal’s active periods: 06:00–18:00 for capuchins and spider monkeys, 06:00–18:30 for coatis, and 23:00–6:30 for the nocturnal kinkajous. 3D acceleration was recorded at 1-min intervals to determine activity profiles. Collaring occurred in 2015 and in 2017, with 20 individuals tagged the first field season and 26 individuals tagged the second field season. 8 spider monkeys, 7 capuchin monkeys, 16 coatis, and 14 kinkajous were tagged in total. From December 2015 to March 2016, the GPS sampling regime of collars on kinkajous and coatis was ACC-informed, with collars collecting data as described above when accelerometer readings were above a specified threshold (1,000 mV). ACC-informed sampling was not used in the second field season, from December 2017 to March 2018. All collars were programmed to timeout if they did not acquire a fix after 90 s.
One additional kinkajou was collared during a separate field season in 2019, with GPS programmed to sample every 6 min from 18:00 to 23:00 and every second from 23:00 to 5:00.
The last fix of each burst consistently had the best horizontal accuracy measurement, therefore only the last fix of each burst was used for all analyses. All data were uploaded to Movebank, an online repository for animal movement data2. Duplicate and outlier fixes were removed using Movebank’s data filters, filtering fixes by the height above ellipsoid. All fixes with height above ellipsoid values less than or equal to 21 or greater than 244 were marked as outliers. This corresponds to the first quartile minus twice the interquartile range and the third quartile plus twice the inter quartile range, respectively. Subsequent outlier detection was done using the ctmm package in R (Calabrese et al., 2016), using error information, straight line speeds, and distances from the median latitude and longitude to manually identify outliers via the outlie() function. Further, obviously impossible locations, such as location estimates in the water and clearly outside the boundaries of the island, were marked as outliers.
For ACC informed collars, GPS locations were interpolated for times when the animals were below their ACC thresholds. The error on the interpolated positions was modeled to replicate the observed GPS error of a stationary collar in a tree, and was drawn from a negative binomial distribution with a mean of 5. 46 m and a dispersion parameter of 2.4 m.
We simulated animal movement tracks to illustrate our predictions regarding the spatial patterns we expect to emerge from each learning mechanism outlined in Figure 1. The simulated tracks associated with each prediction are presented in Figure 2. The movement of individuals in this model vary along three axes related to our movement pattern predictions: the consistency of the patch selection (choice determinism), the persistence of their movement direction through time (persistence, a proxy for variable commutes), and the directness of their movement toward a goal (directedness). Details regarding the simulation framework, the parameterization of each agent and the associated environmental constants (including resource density, patch regeneration functions, extraction rate, giving up density, etc.) are provided in Supplementary Material 1, along with R code from which our simulations can be reproduced.
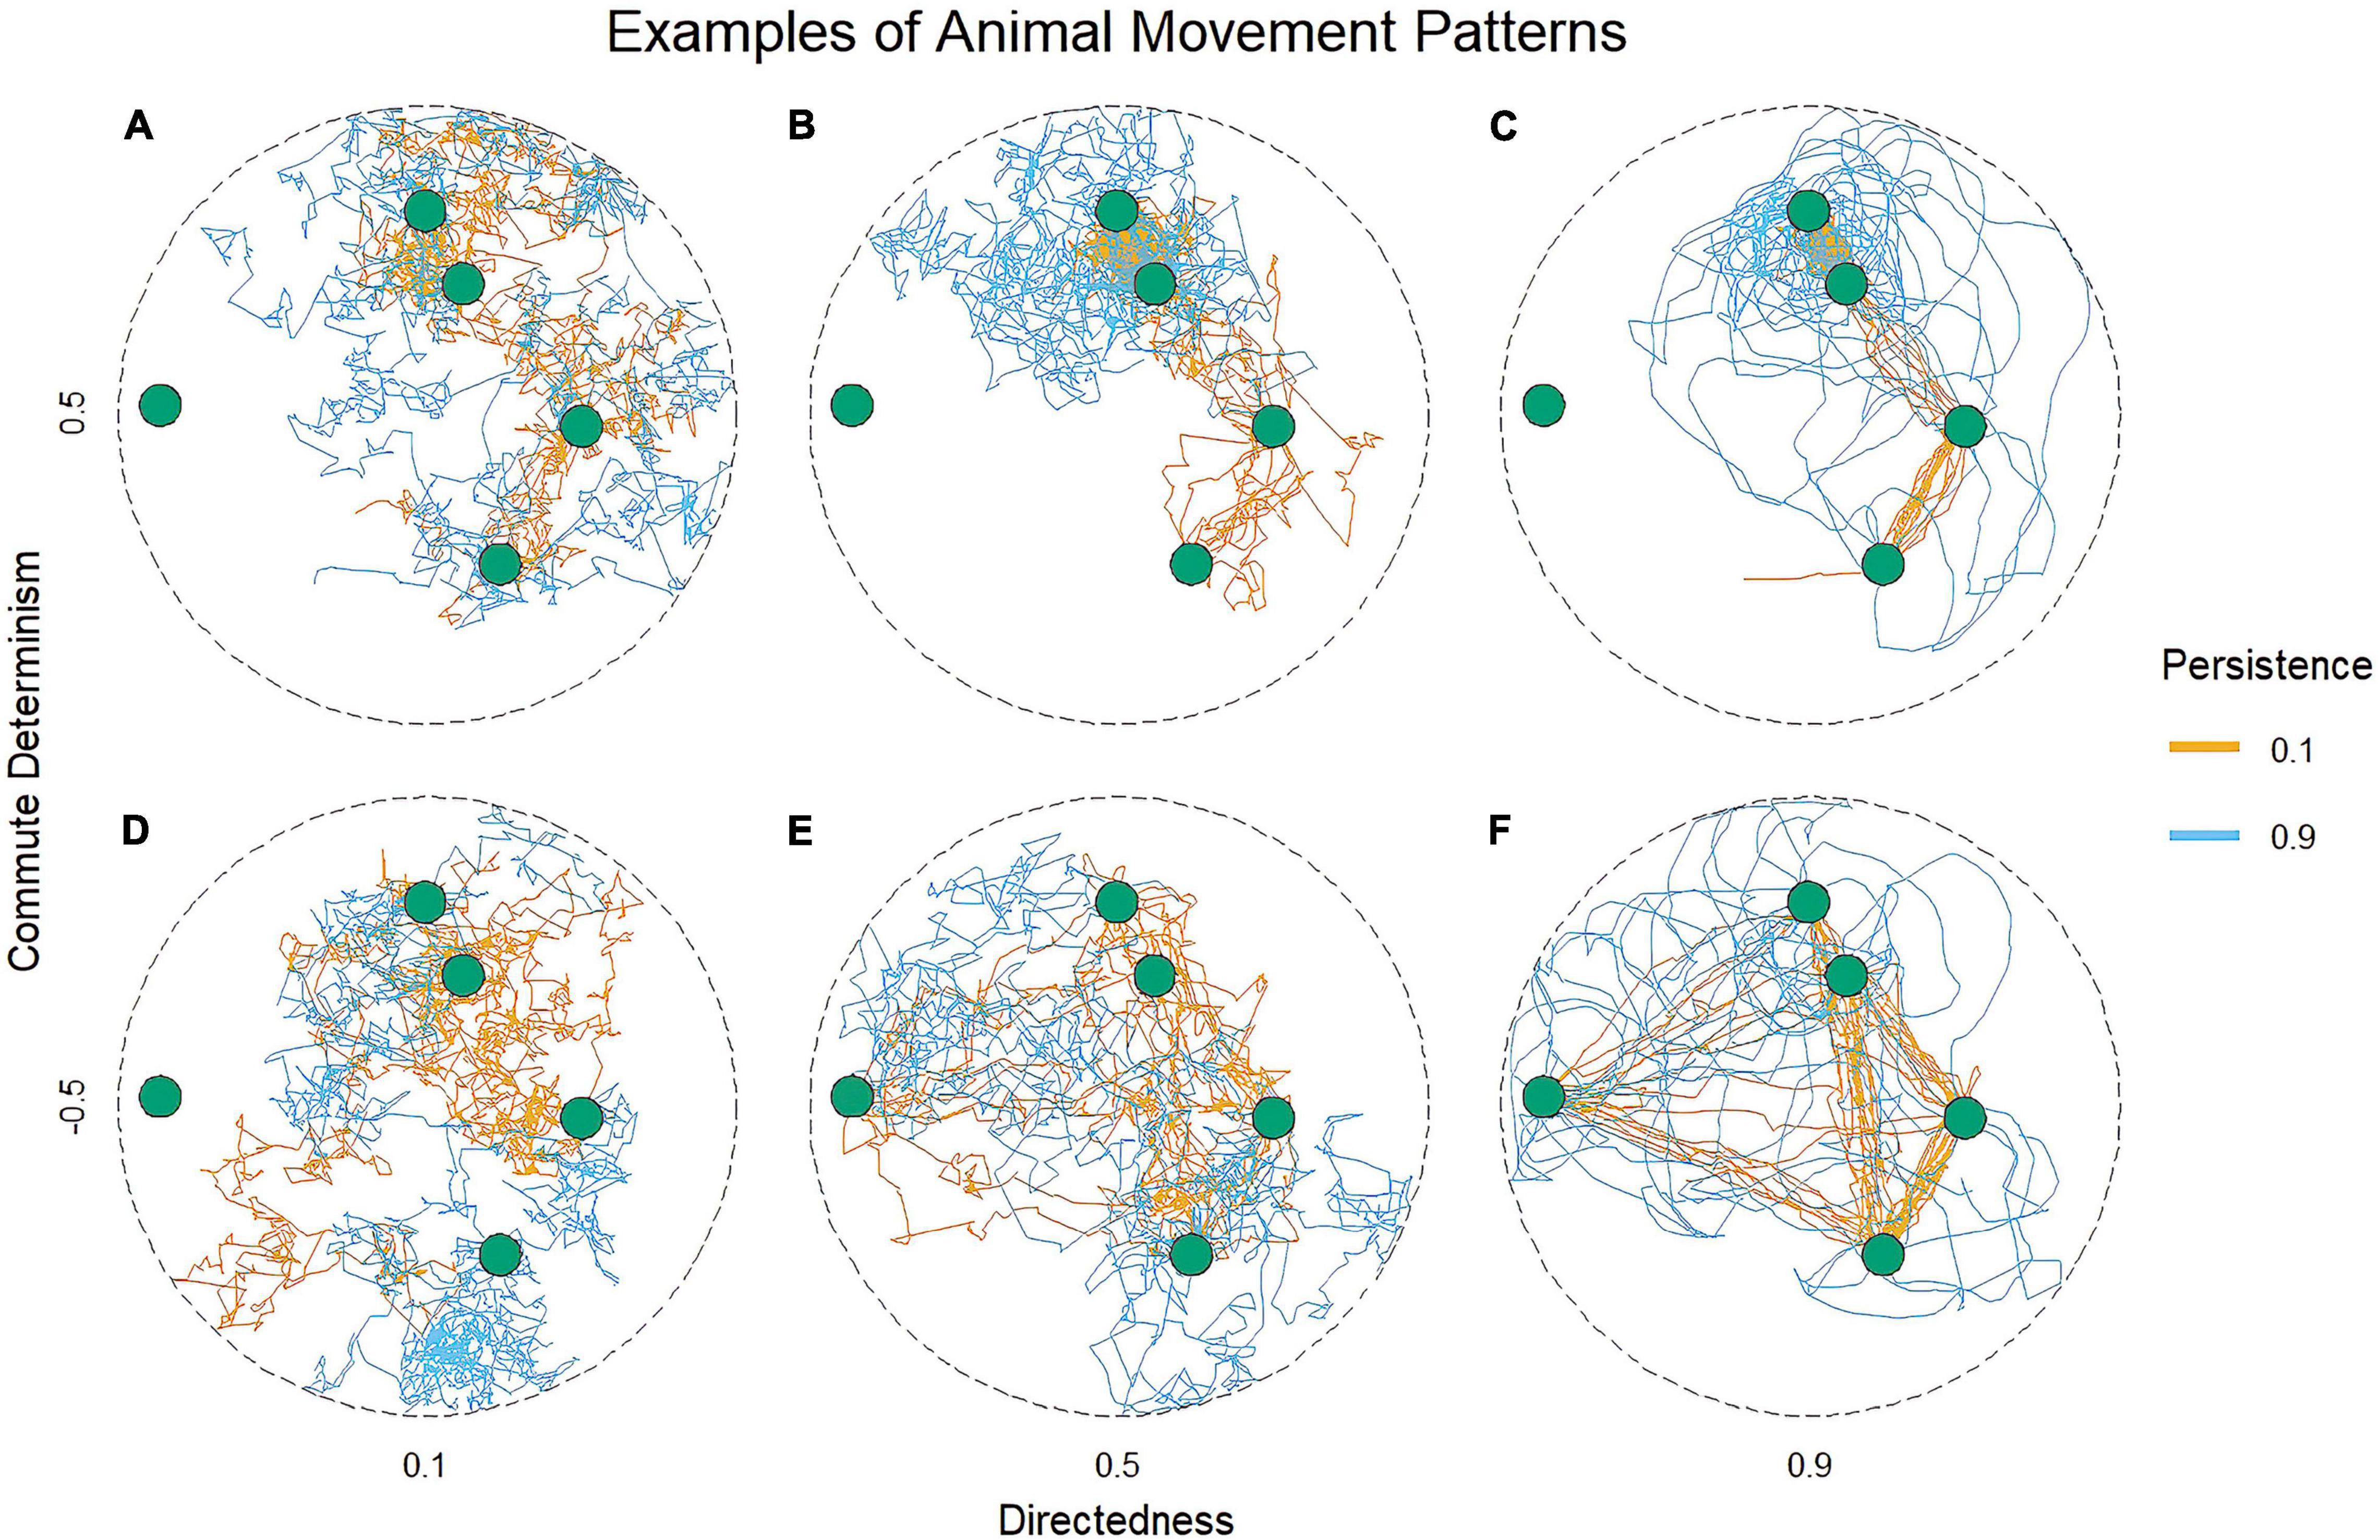
Figure 2. Examples of animal movement patterns. Variation in three movement parameters can produce movement patterns in simulated foraging agents that resemble different degrees and types of route use. All agents foraged by (1) selecting from a set of spatially persistent, renewing resource patches about which the agent had complete information, (2) moving in accordance with the indicated parameter levels until the selected patch was reached, (3) moving at random within the patch while depleting it, and (4) selecting a new patch. Where directedness is low, movement is random regardless of the other parameter levels (A,D). Where commute determinism and persistence are both high, agents produce variable commutes (C), blue path. Where commute determinism is high, but persistence is low, agents produce route-based commutes (C), orange path. Given response learning, animals’ movement patterns ought to resemble paths simulated with high determinism and decreasing persistence over time [top panels (A–C), orange paths, left to right]. The paths of place learning animals may develop in a number of ways over time depending on the structure of the environment, including the formation of route-based commutes in highly stable environments (top panels, orange paths), the formation of routes with low commute determinism in environments where patch values are temporally asynchronous [bottom panels (D–F), orange paths], or the formation of variable commutes where secondary resources are dynamically distributed (blue paths, left to right, top, and bottom).
Here, we propose a procedure for differentiating route-based movement patterns from other patterns of movement within an animal’s range. Our approach is to identify segments of movement tracks that exhibit route-like behavior by calculating a grid cell resolution based on the autocorrelation structure in the data, binning the sampled locations into the grid cells, calculating a series of metrics describing the orientation and determinism of GPS fixes within each cell, and clustering cells with similar modes of movement using unsupervised clustering.
Code for this analyses are available on github: https://git.io/JP1vF.
The first step in the workflow is to reconstruct the original continuous movement path from the sampled four-min GPS track. This serves two functions: to more easily reveal segments with similar modes of behavior, and to maximize the effective sample size of orientations in each cell. To accomplish this, we fit the sampled tracks to continuous time stationary movement models, using the continuous time movement modeling framework (Fleming et al., 2014; Calabrese et al., 2016). The semivariance of the movement tracks are used to estimate the best fit stationary movement process, and model parameters are estimated via maximum likelihood. The best fit model is selected using information criterion (AICc and BIC). We then used the best fit model to interpolate between real sampled locations by simulating realistic movement from the movement model, conditional on the data. Possible trajectories between each set of locations are simulated several times, and the average across the simulated trajectories are used as the interpolated segment of tracks. We simulated 10, 20, 30, 40, and 50 tracks between observed locations in order to determine how sensitive the accuracy of the reconstructed tracks are to the number of iterations used to generate them. All model fitting and simulations were implemented using the ctmm package in r (Calabrese et al., 2016).
The limitations of this path reconstruction approach were assessed by subsampling a 1 hz GPS track to increasingly coarse sampling rates, reconstructing the resampled tracks to continuous time using the ctmm package as described above, and calculating the distance between the location estimates from reconstructed track and observed locations from the original 1 hz GPS track.
The second step in the workflow is to estimate a reasonable grid cell resolution for each individual. Because animal movement data is typically autocorrelated, we attempt to determine a grid size that takes the autocorrelation in the behavior into account. For individuals where the best fit movement model exhibits autocorrelated positions and autocorrelated velocities, the timescale of autocorrelation in the velocity (τv) give us information about the timescale at which the fine scale behavior of the animal is independent. In other words, τvis the timescale at which the movement remains linear, beyond which the behavior changes (Fleming et al., 2014; Gurarie et al., 2017, Noonan et al., 2019). Animals exhibiting small τvtend to have highly tortuous movement, while animals exhibiting large τv exhibit highly directed movement (Fleming et al., 2014; Gurarie et al., 2017, Noonan et al., 2019). Given that τvis a timescale, we can derive a pseudo-step-length by multiplying τv by the average speed and getting a distance. This distance represents the spatial scale at which the movement behavior remains the same on average, thus any changes in orientations happening in locations at least this distance apart are assumed to be independent from each other. Therefore, if the best fit movement model is a model with correlated velocities, then the cell resolution is calculated by multiplying τvby the root mean squared speed (a convenient summary statistic obtainable from the movement model). If the best fit movement model is a model with independent changes in velocity, then the grid cell resolution is simply set to the mean step-length. The raster package (Hijmans, 2021) and rgdal package (Bivand et al., 2021) were used to generate the grid after the cell resolution was determined.
We previously defined routes as locations exhibiting movement with a high degree of path fidelity, specifically high intensity of sequential use and low directional variability. In the context of a spatial grid, this translates to a series of connected cells whereby the overall number of visits to a cell are relatively high, the distribution of orientations within the cell reflect limited and consistent entry and exit points, and the sequence of cells used preceding entry and following exit of a focal cell are also consistent. After data are binned, the following metrics (summarized in Table 1) are calculated for each grid-cell: Density of points; Hellinger distance; the number of modes in the distribution of orientations; the standard deviation of headings; the value range of the orientations; the distance between the modes of the orientations; the mean squared difference of all the above metrics to all neighboring cells; the number of empty neighboring cells; the total number of independent visits to each cell, and the number of cell sequence repetitions (reoccurrences within a single path of consecutive visits to three or more cells) that include the given cell. These metrics were chosen because of their simplicity, their concordance with our definition of routes, and because we think they reflect what researchers are perceiving when classification via expert opinion is attempted. Relative intensity of use is captured by the density of points in the cell. The consistency and constraints on entry and exit points are captured by how significantly different the distribution of orientations is from uniform (Hellinger distance), number of modes in the distribution (e.g., bimodal distribution indicating a bidirectional route and unimodal inticating a unidirectional route), the distance between the modes (closer to 0 indicating highly unidirectional, closer to π indicating highly bidirectional), and the standard deviation and value range of the orientations in the cell. The similarity to neighbor cells (mean squared difference of a focal cell to its neighbors for each metric) and the number of empty neighbors reflect the contrast in relative intensity of use of a route compared to other locations. Finally, calculating how deterministic the sequential visits to a cell are was achieved by adapting methods from Ayers et al. (2018) for identifying traplining behavior, with the assumption that animals utilize routes the same way every time. We quantified the degree to which an animal passed through a given cell while traveling along particular routes by calculating (1) the number of possible comparisons between any two times an individual visited the given cell (recursions, n(n−1)/2, where n is the number of visits to the cell) and (2) the number of recursions in which the compared visits to the given cell were part of an identical sequence of three or more cell visits (repeats). Examples of cells with track segments exhibiting different value ranges from the metrics in Table 1 are visualized in Figure 3.
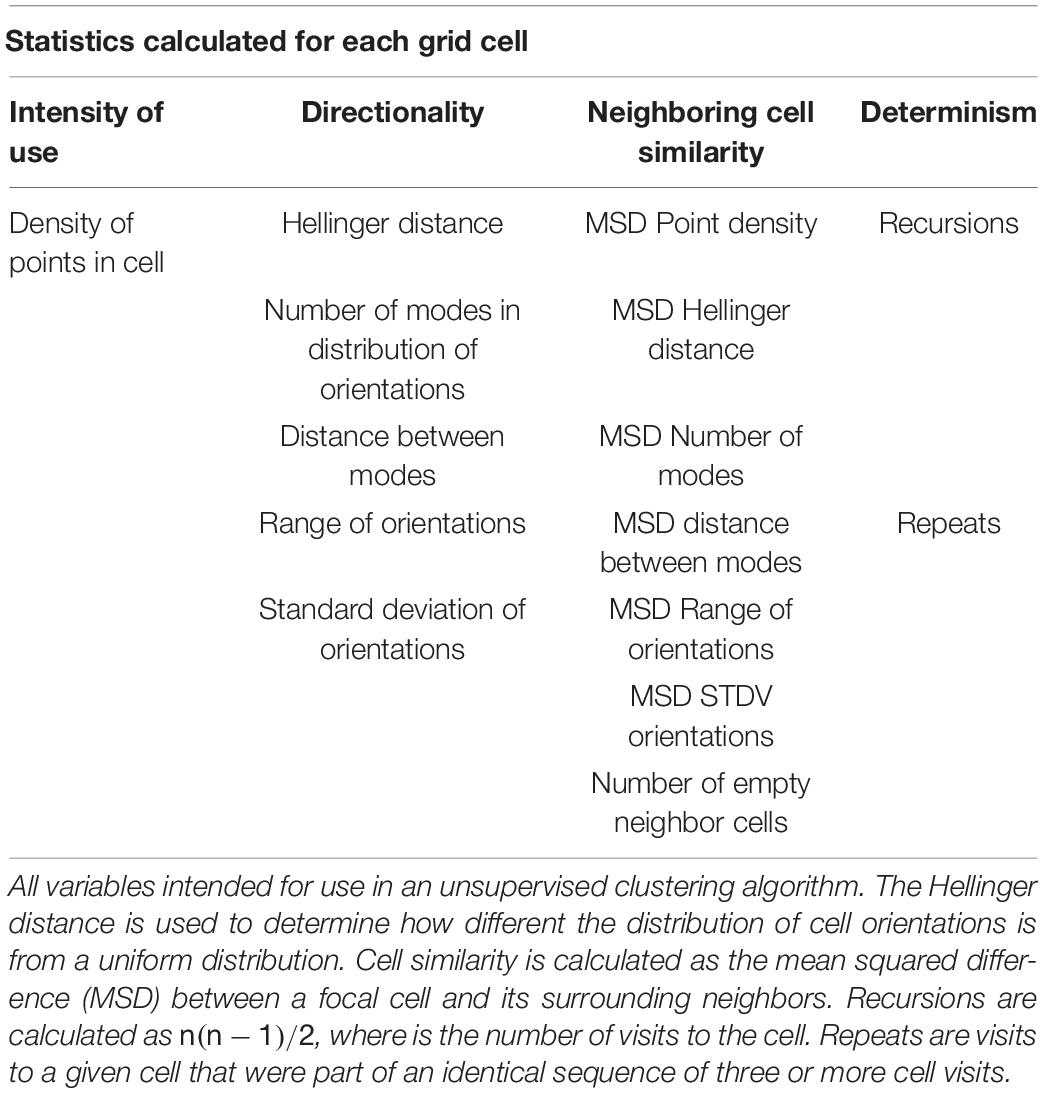
Table 1. Variables calculated for each cell.
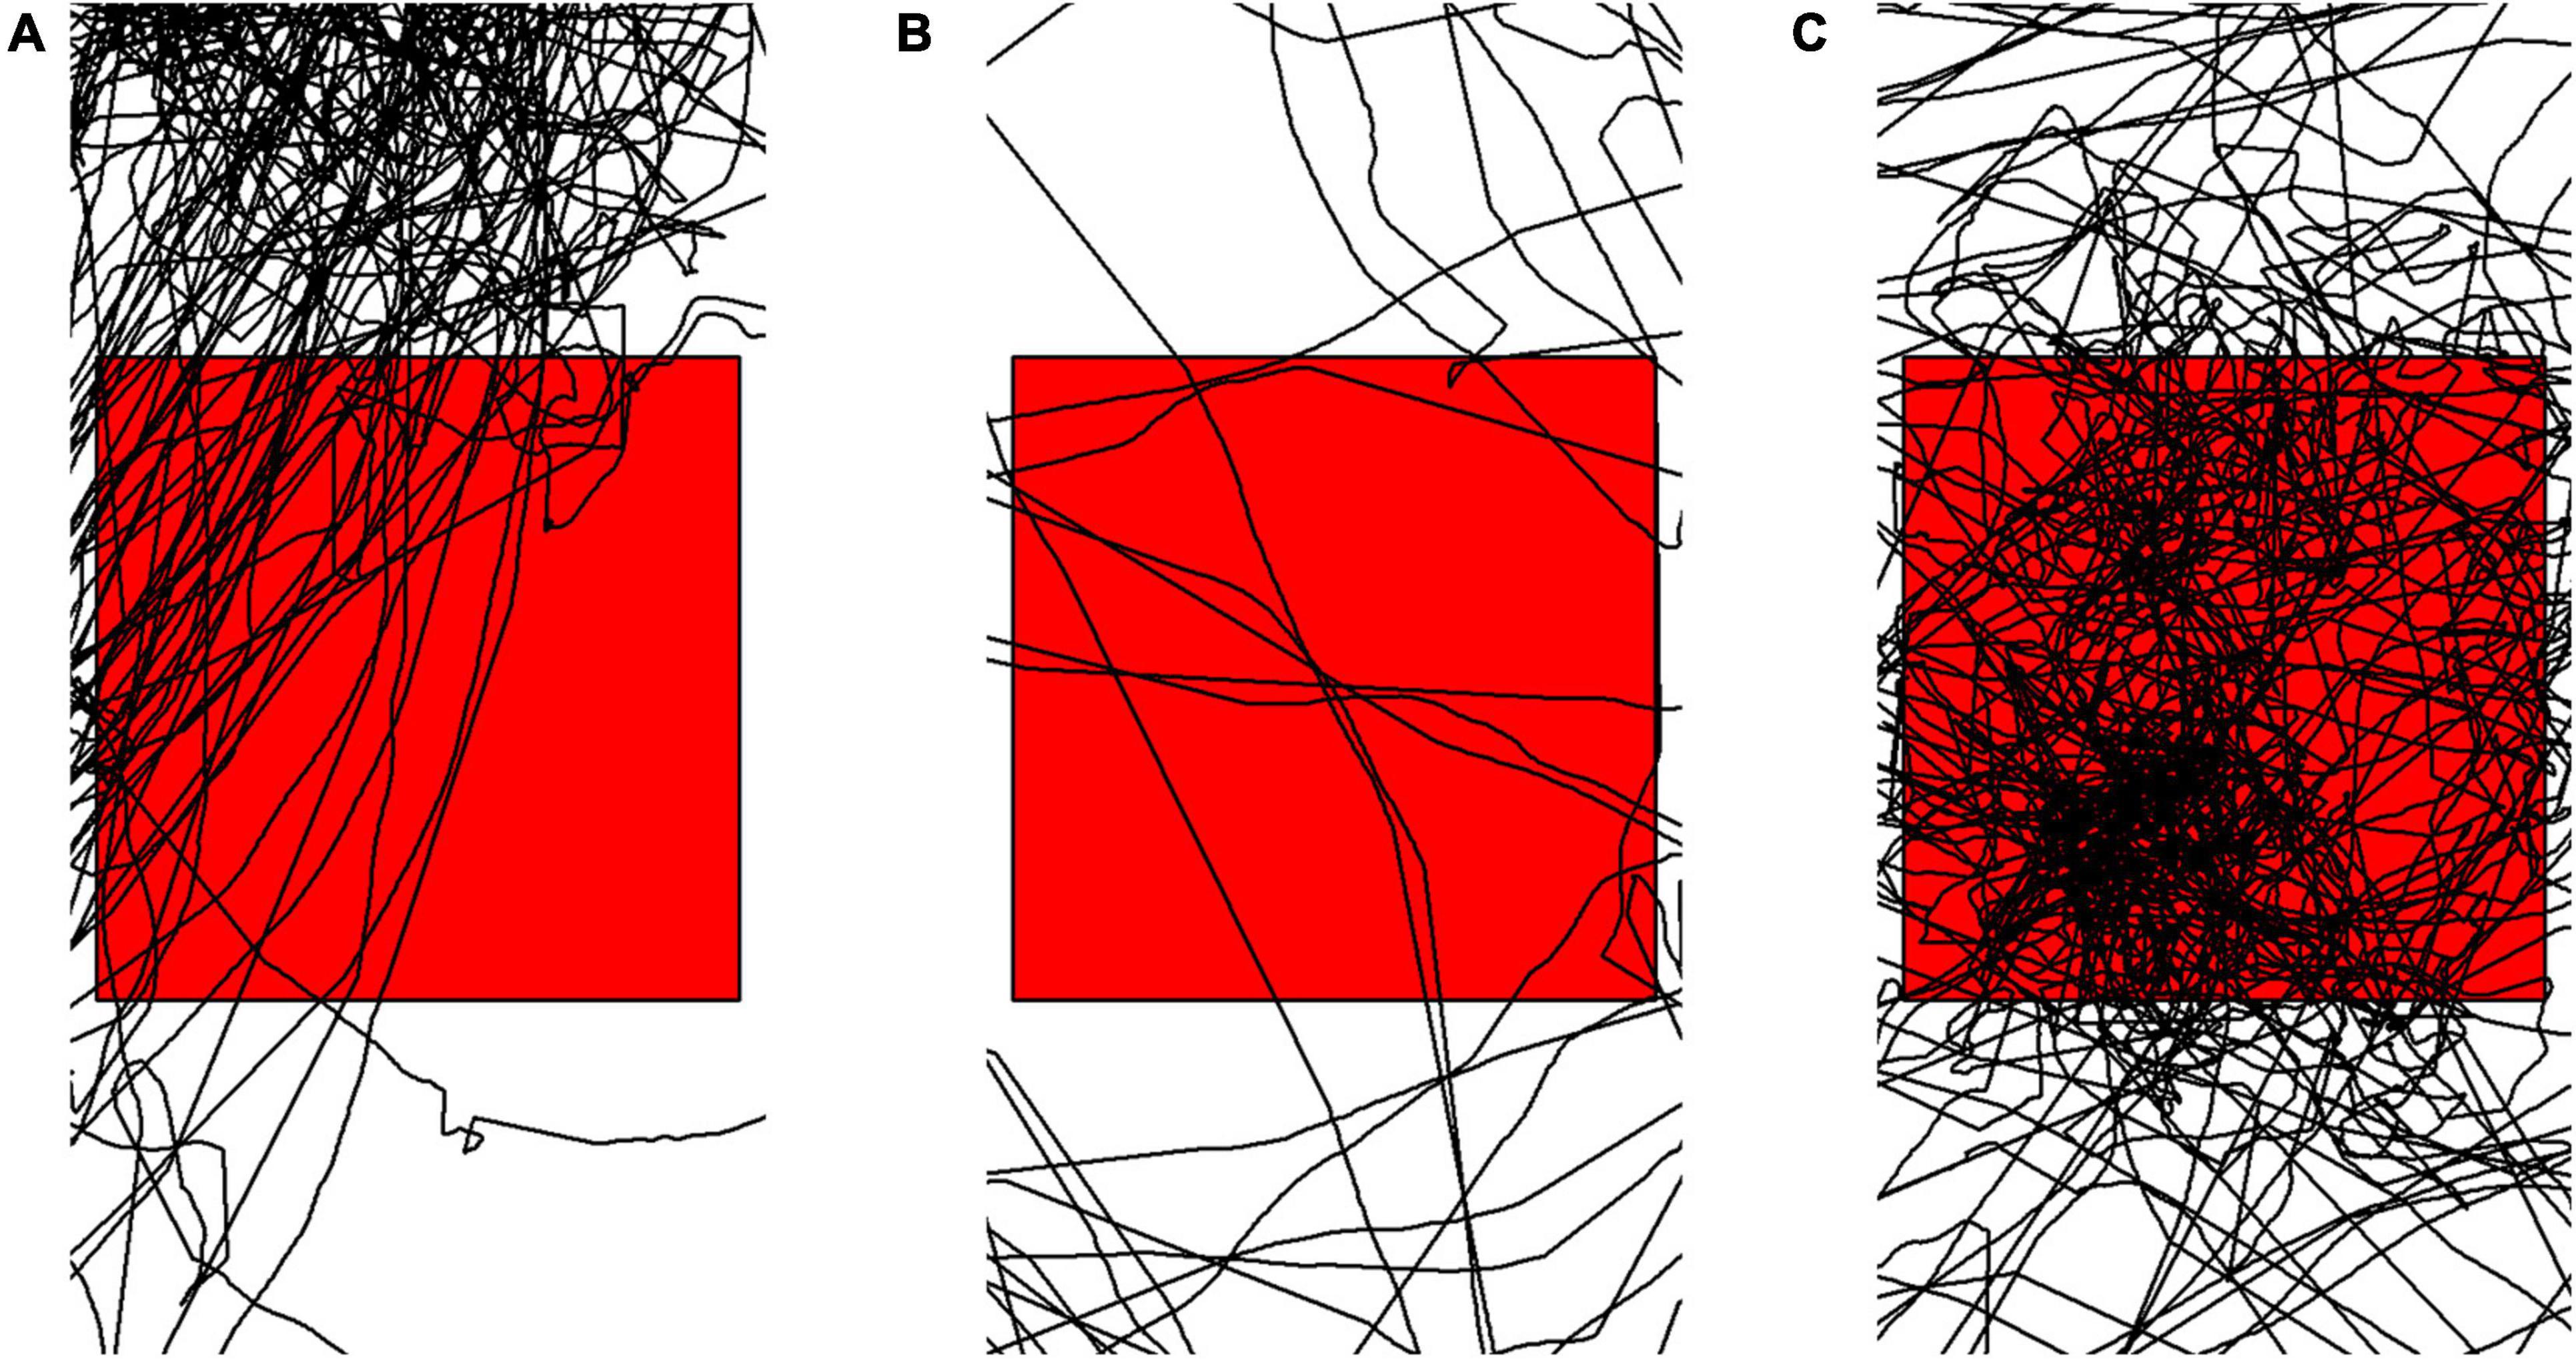
Figure 3. Examples of cell level data showing (A) high use, highly deterministic and bi-directional behavior; (B) low use, not deterministic and directionally variable behavior; and (C) high use, not deterministic and directionally variable behavior.
We use a Gaussian mixture model to cluster cells with similar movement behavior as estimated from the cell level variables above in order to identify cells with similar degrees of path fidelity and sequential behavior. Model based clustering was preferred over hierarchical and k-means clustering because instead of using a heuristic approach, the clusters are modeled as mixtures of distributions and cluster assignment is handled probabilistically. This enables us to use model selection via information criterion to determine how many clusters best fit the data, as well as accounting for variance rather than assume spherical clusters. Gaussian mixture models were fit using the GMM() function in the ClusterR package (Mouselimis, 2021). In an attempt to compare across individuals, all individuals across all species were included in the same model, and BIC was used to determine the optimal number of clusters [Optimal_Clusters_GMM() function in the ClusterR package], resulting in 10 clusters for each animal. The distribution of values of each covariate were compared across clusters to determine which covariates were most distinguishable across cluster categories. The covariates with the clearest separation (density of points per cell, recursions, and repeats) were used to construct a “routineness score” for each cluster. Quartiles for point density, recursions, and repeats were calculated based on the mean values for each cluster category, and cluster categories were associated with their corresponding quartile for each covariate (0.25, 0.5, 0.75, and 1). The routineness score was calculated as
Where Q represents the quartile assignment of each cluster based on point density, recursions, and repeats, respectively. This provides a continuous score for each cluster category representing how intensely used a cell is, weighted by how deterministic visits to that cell are and how predictably sequential movements in and out of that cell are. Larger values represent more routine behavior.
We compare the prevalence of routine behavior across our four study species using hierarchical Bayesian regression. Priors were improper flat following Student−T(3, 0, 2.5), and the model was implemented using the brms package (Bürkner, 2017; Carpenter et al., 2017; Bürkner, 2018).
Continuous time movement models were able to facilitate high fidelity and high-resolution path reconstructions. Increasing the number of simulations did not change the observed error between the reconstructed tracks and the original 1 hz track. Coarsening the sampling rate resulted in substantial increases in error between the reconstructed tracks and original track (Table 2). Movement models fit to lower resolution data were not able to recover fine scale movement behavior, and sampling rates of 30 min or more resulted in error estimates well beyond that of standard GPS error from animal tracking collars and handheld GPS units. Sampling intervals under 30 min had error estimates within or below typical stationary error exhibited in the real animal movement data, and at sampling rates under 10 min reconstructed tracks were nearly indistinguishable from the original 1 hz track. Supplementary Figure 1 shows the increasing distortion in the path reconstructions when models are fit to data resampled to coarse sampling rates, while Supplementary Figure 2 shows a high-fidelity reconstruction overlaid on the original track.
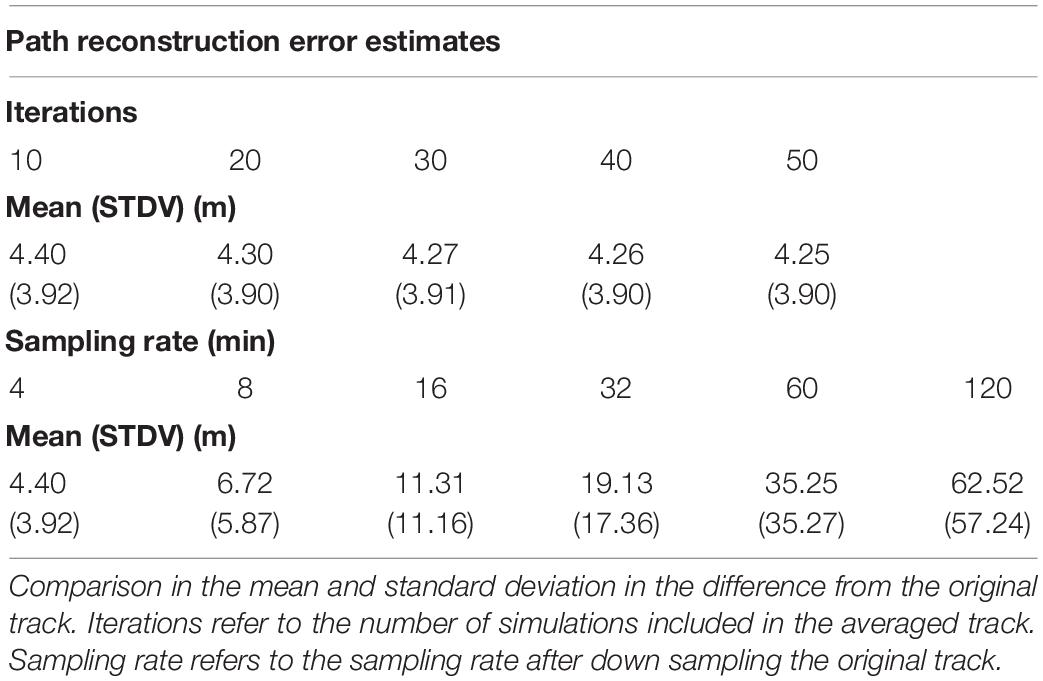
Table 2. Error estimates of the path reconstructions.
The unsupervised clustering was able to reveal varying degrees of routine behavior across the four focal species. A summary of grid cell resolutions for each species is provided in Table 3. The density of points in a cell, total recursions and total repeats were the variables with the clearest and most consistent separation between clusters (Figure 4). Figure 5 provides example trajectories from a spider monkey, capuchin, coati, and kinkajou plotted against the boundaries of the study area. Figure 6 shows the outcome of the route detection procedure on those same individuals, with the tracks colored by the estimated “routineness score.”
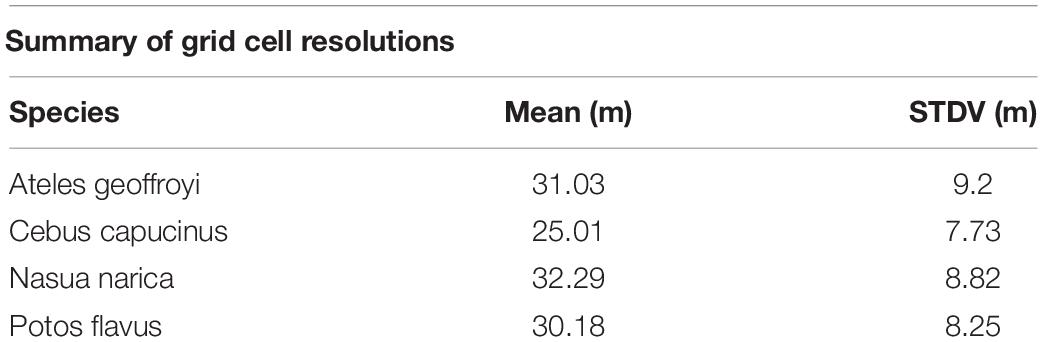
Table 3. Mean and standard deviation of grid cell size across species.
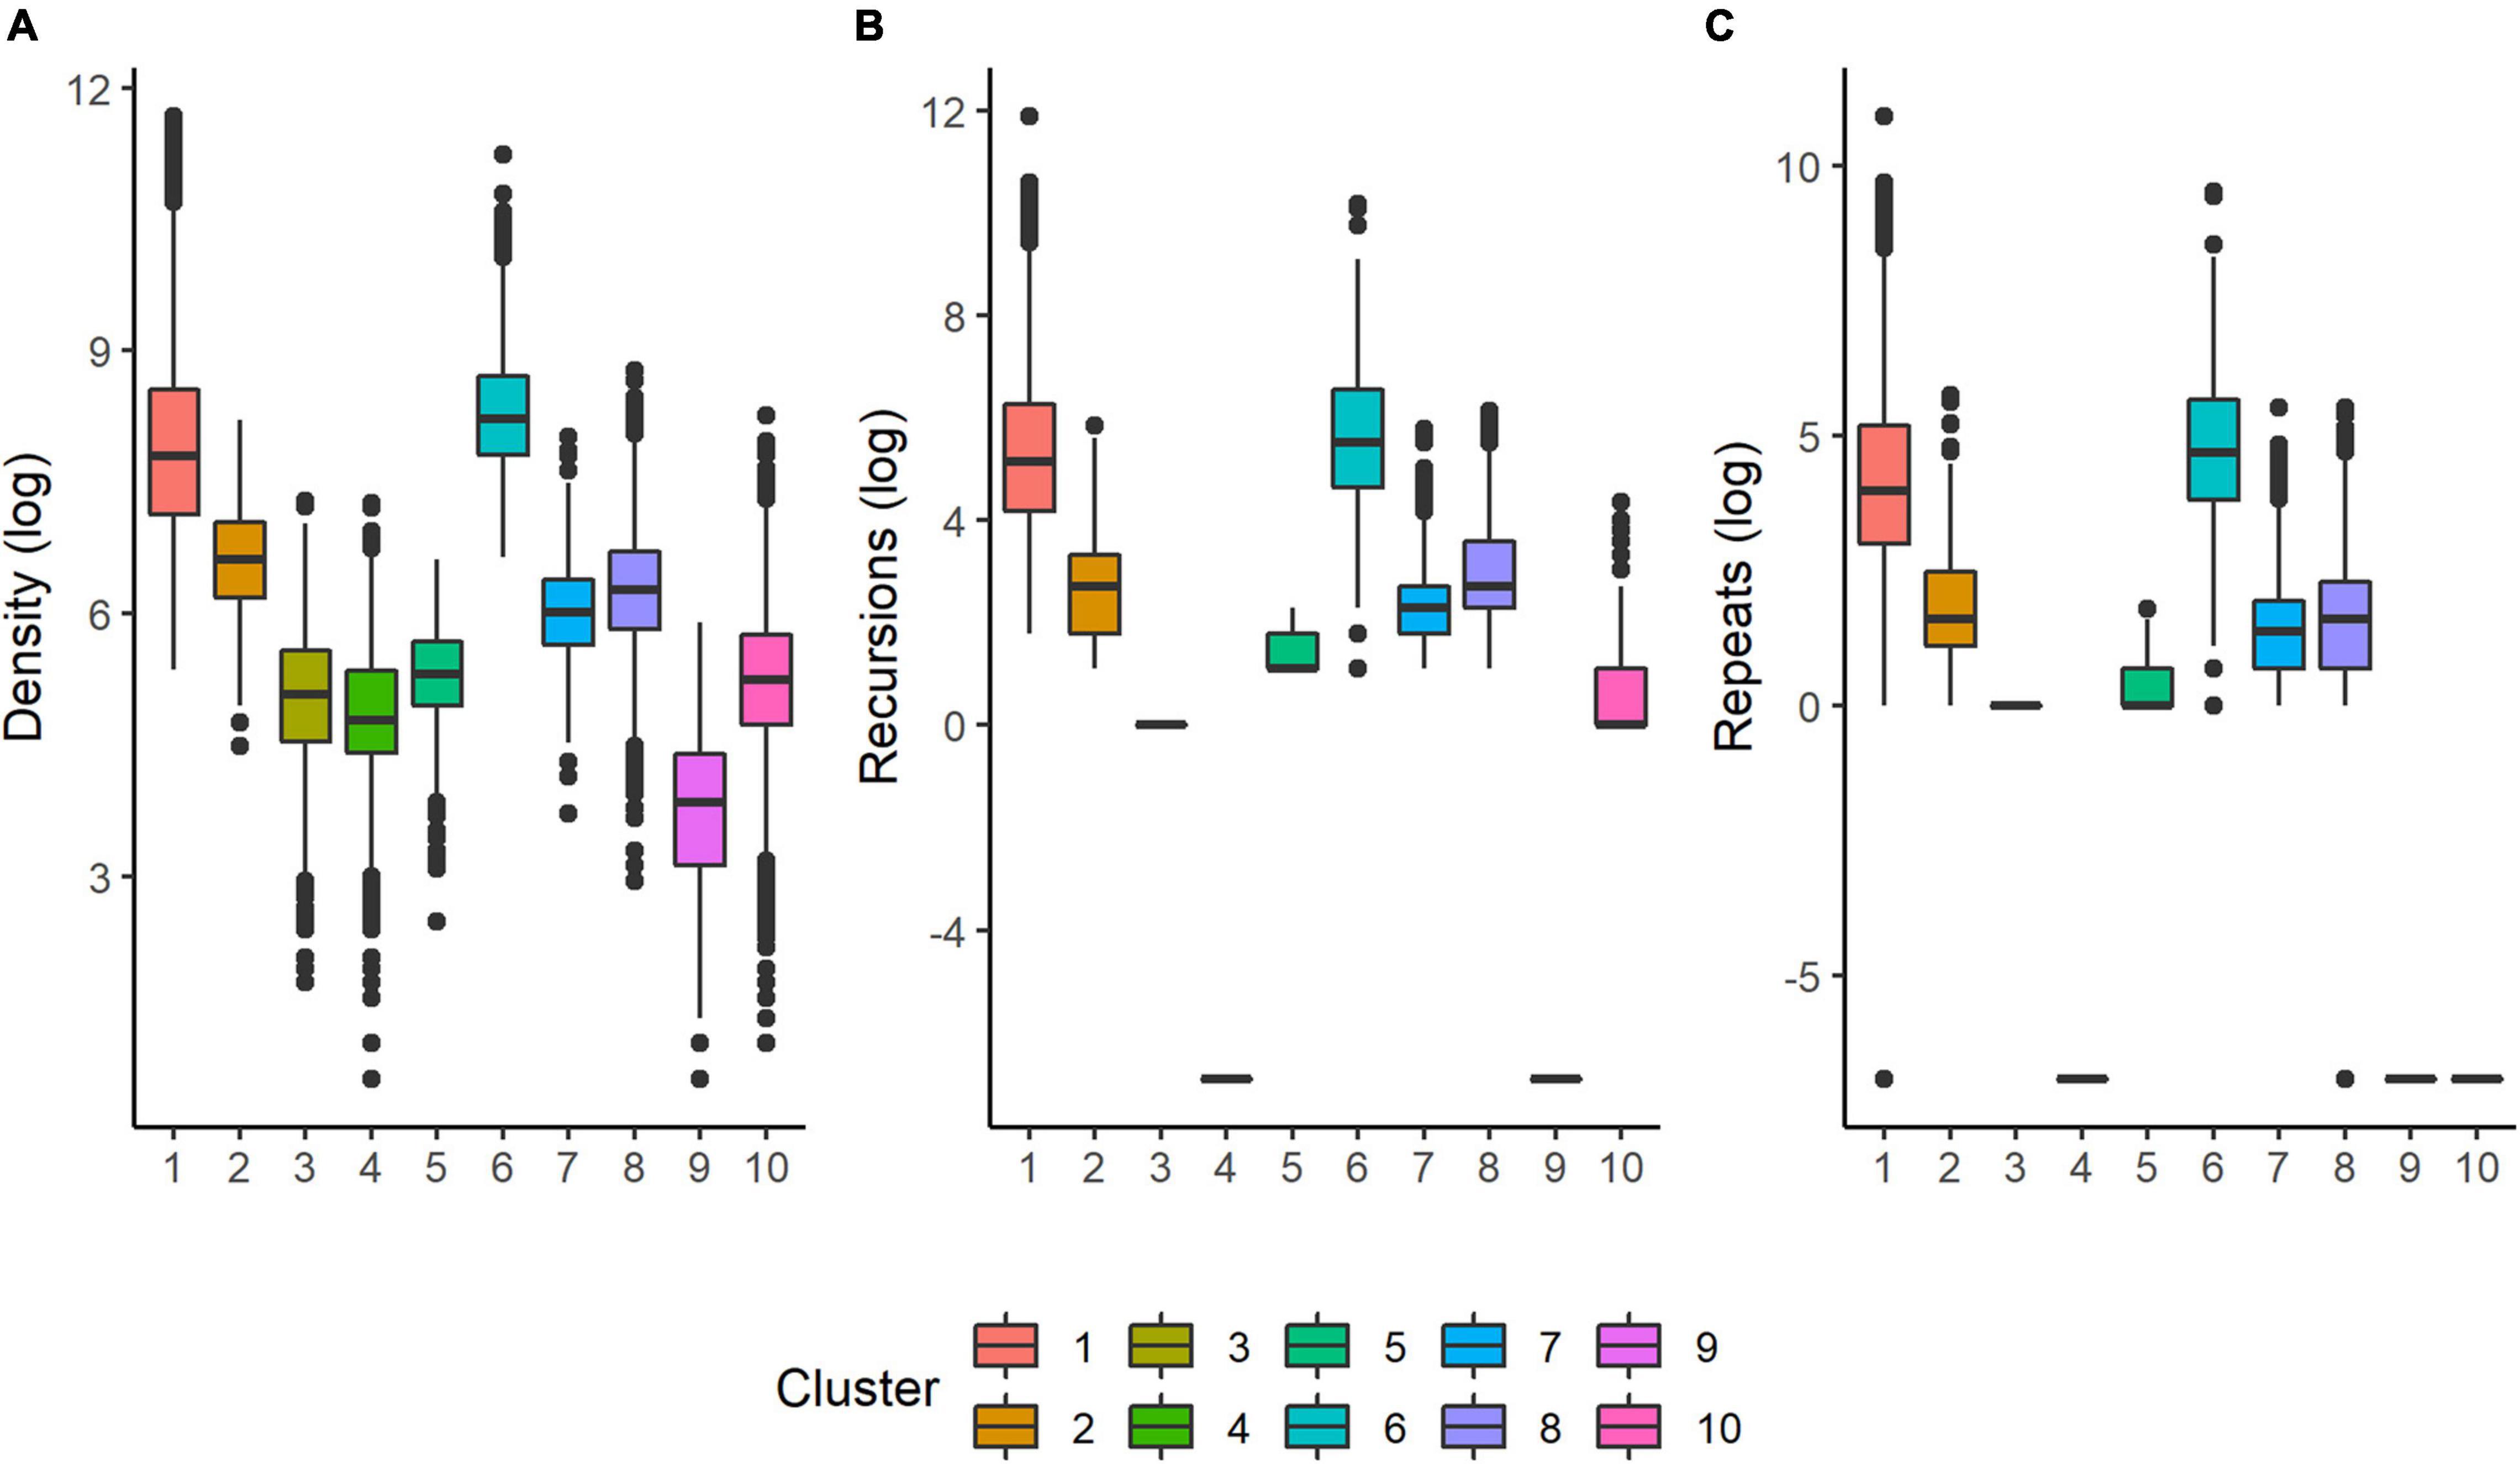
Figure 4. Boxplots of the variables with the clearest separation across clusters. (A) The number of fixes in a focal cell; (B) The total number of recursions to that cell (see “Methods and Materials” section); (C) the total number of repeats (sequential recursions, see “Methods and Materials” section) to that cell.
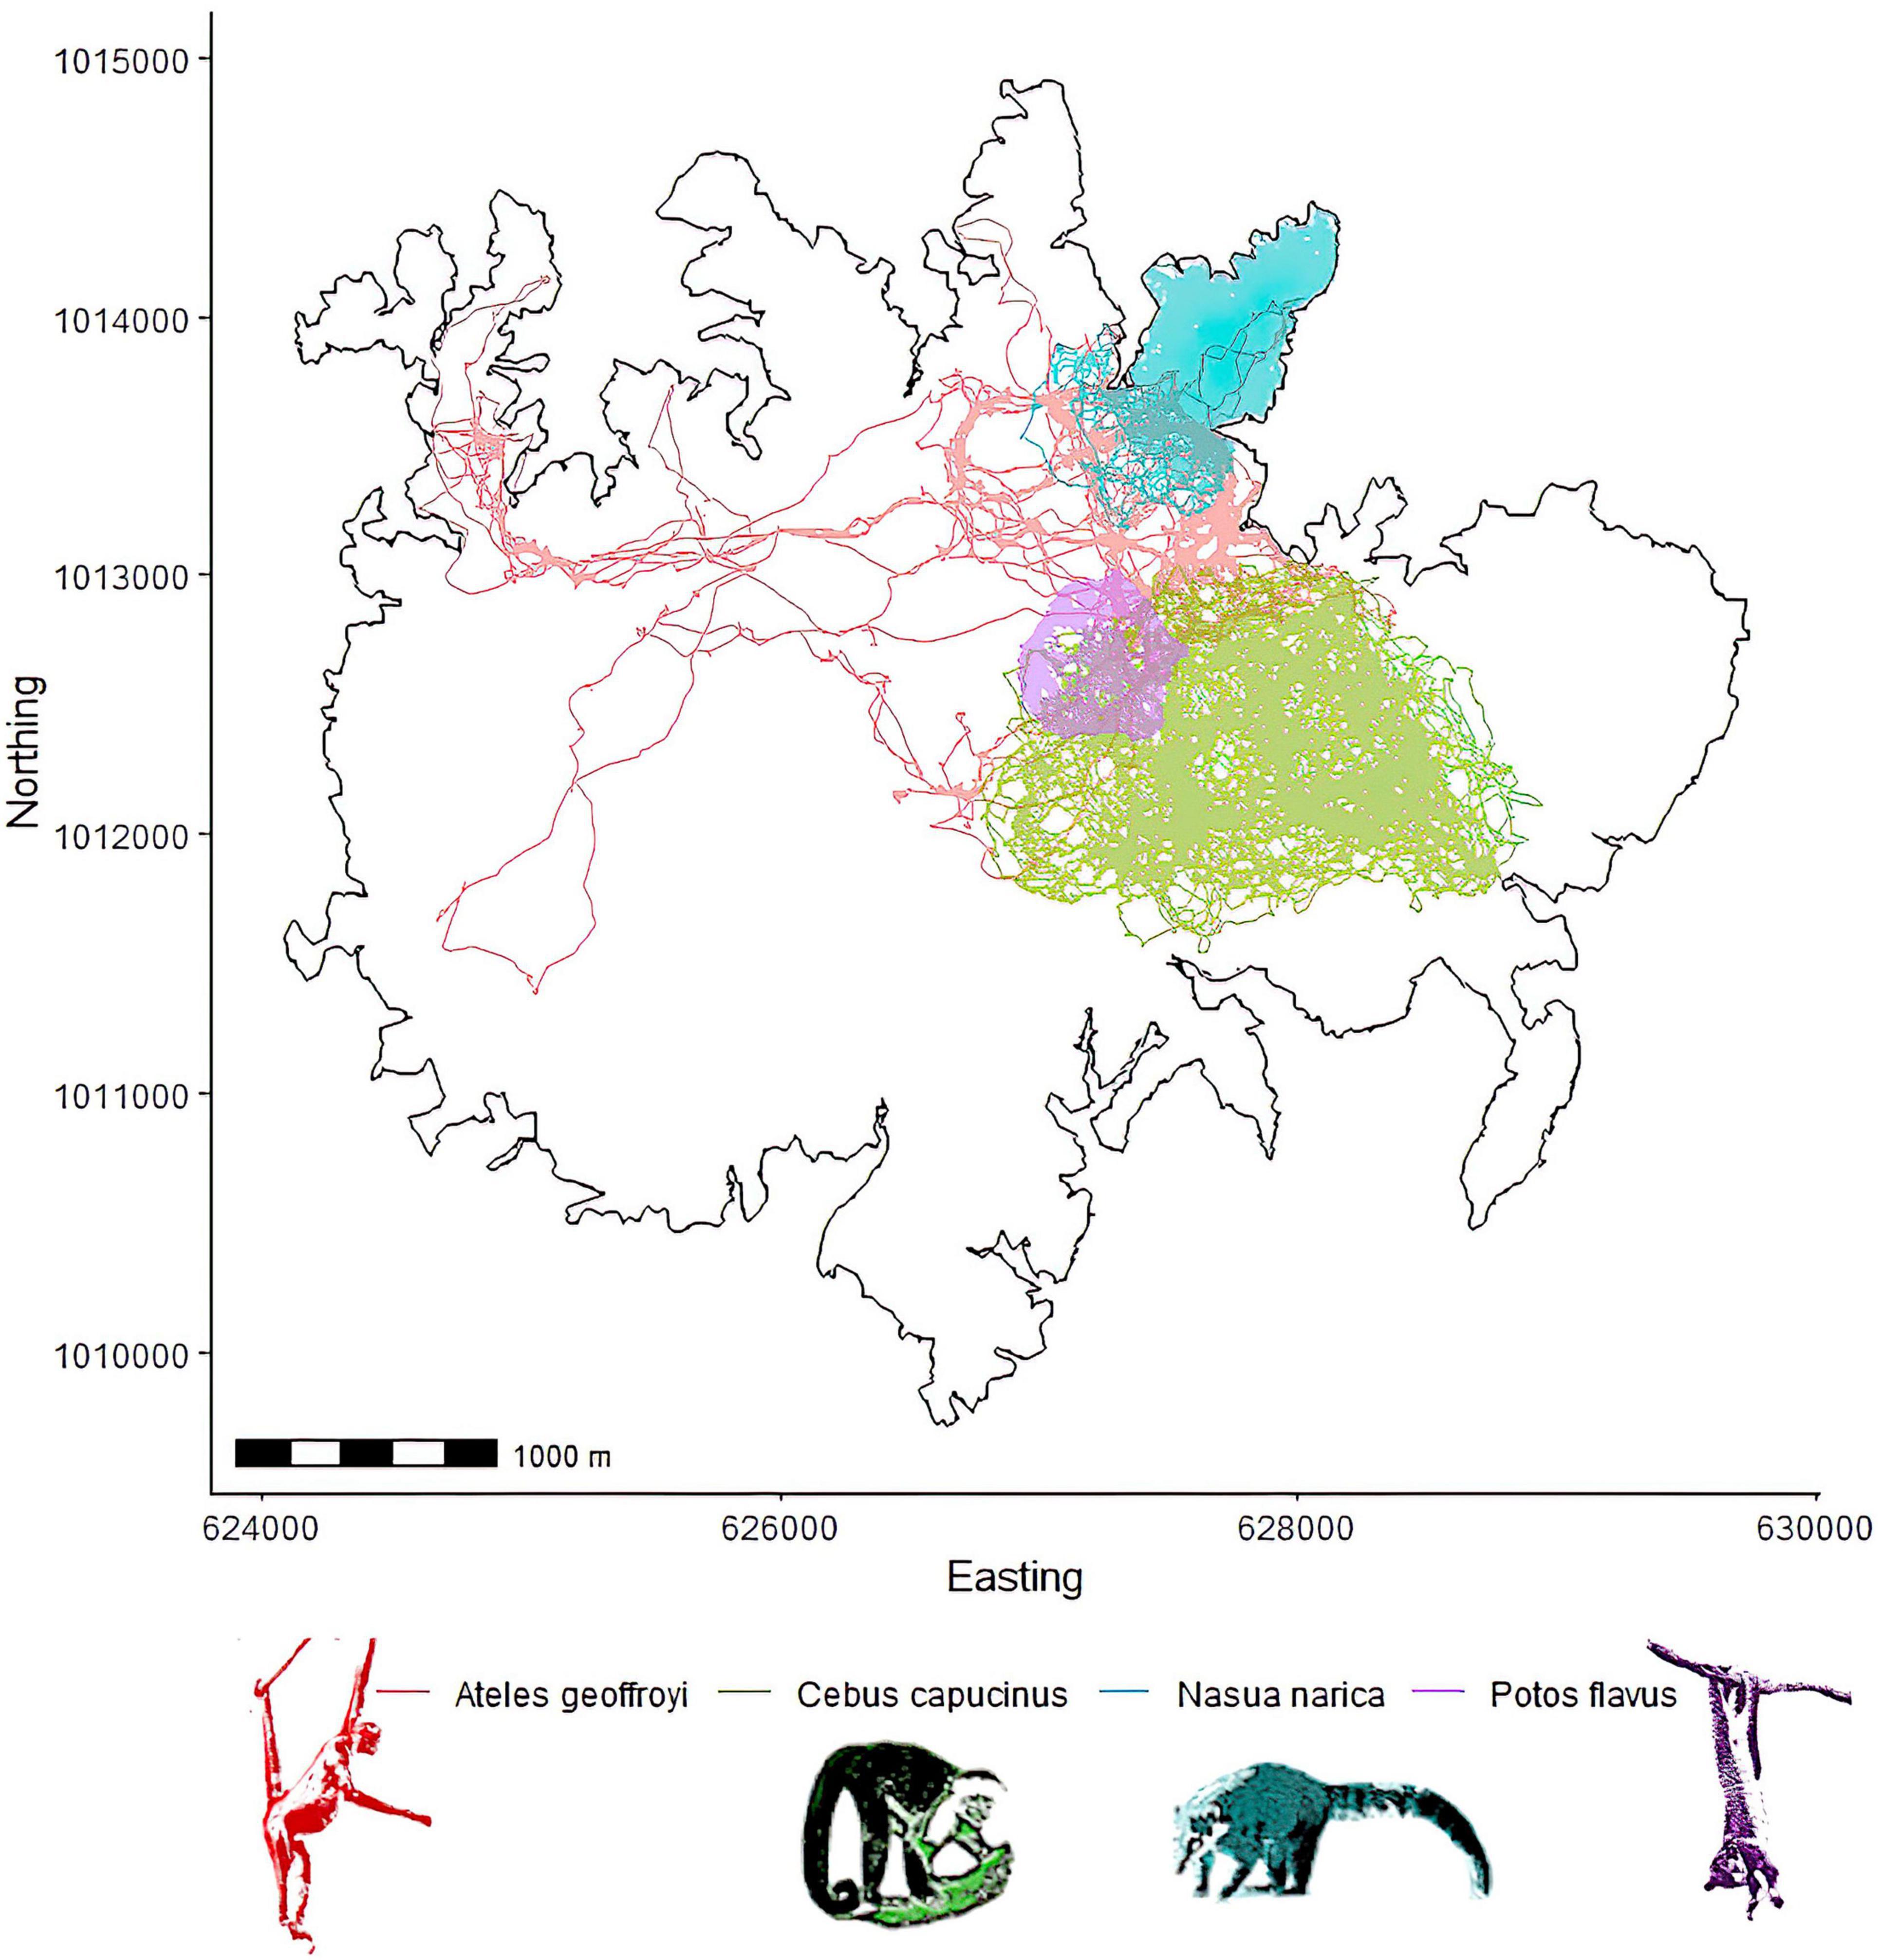
Figure 5. Example trajectories from a spider monkey, a capuchin monkey, a coati, and a kinkajou. All tracks plotted relative to the outline of the island to illustrate any routine behavior due to potential geographical barriers such as the shoreline.
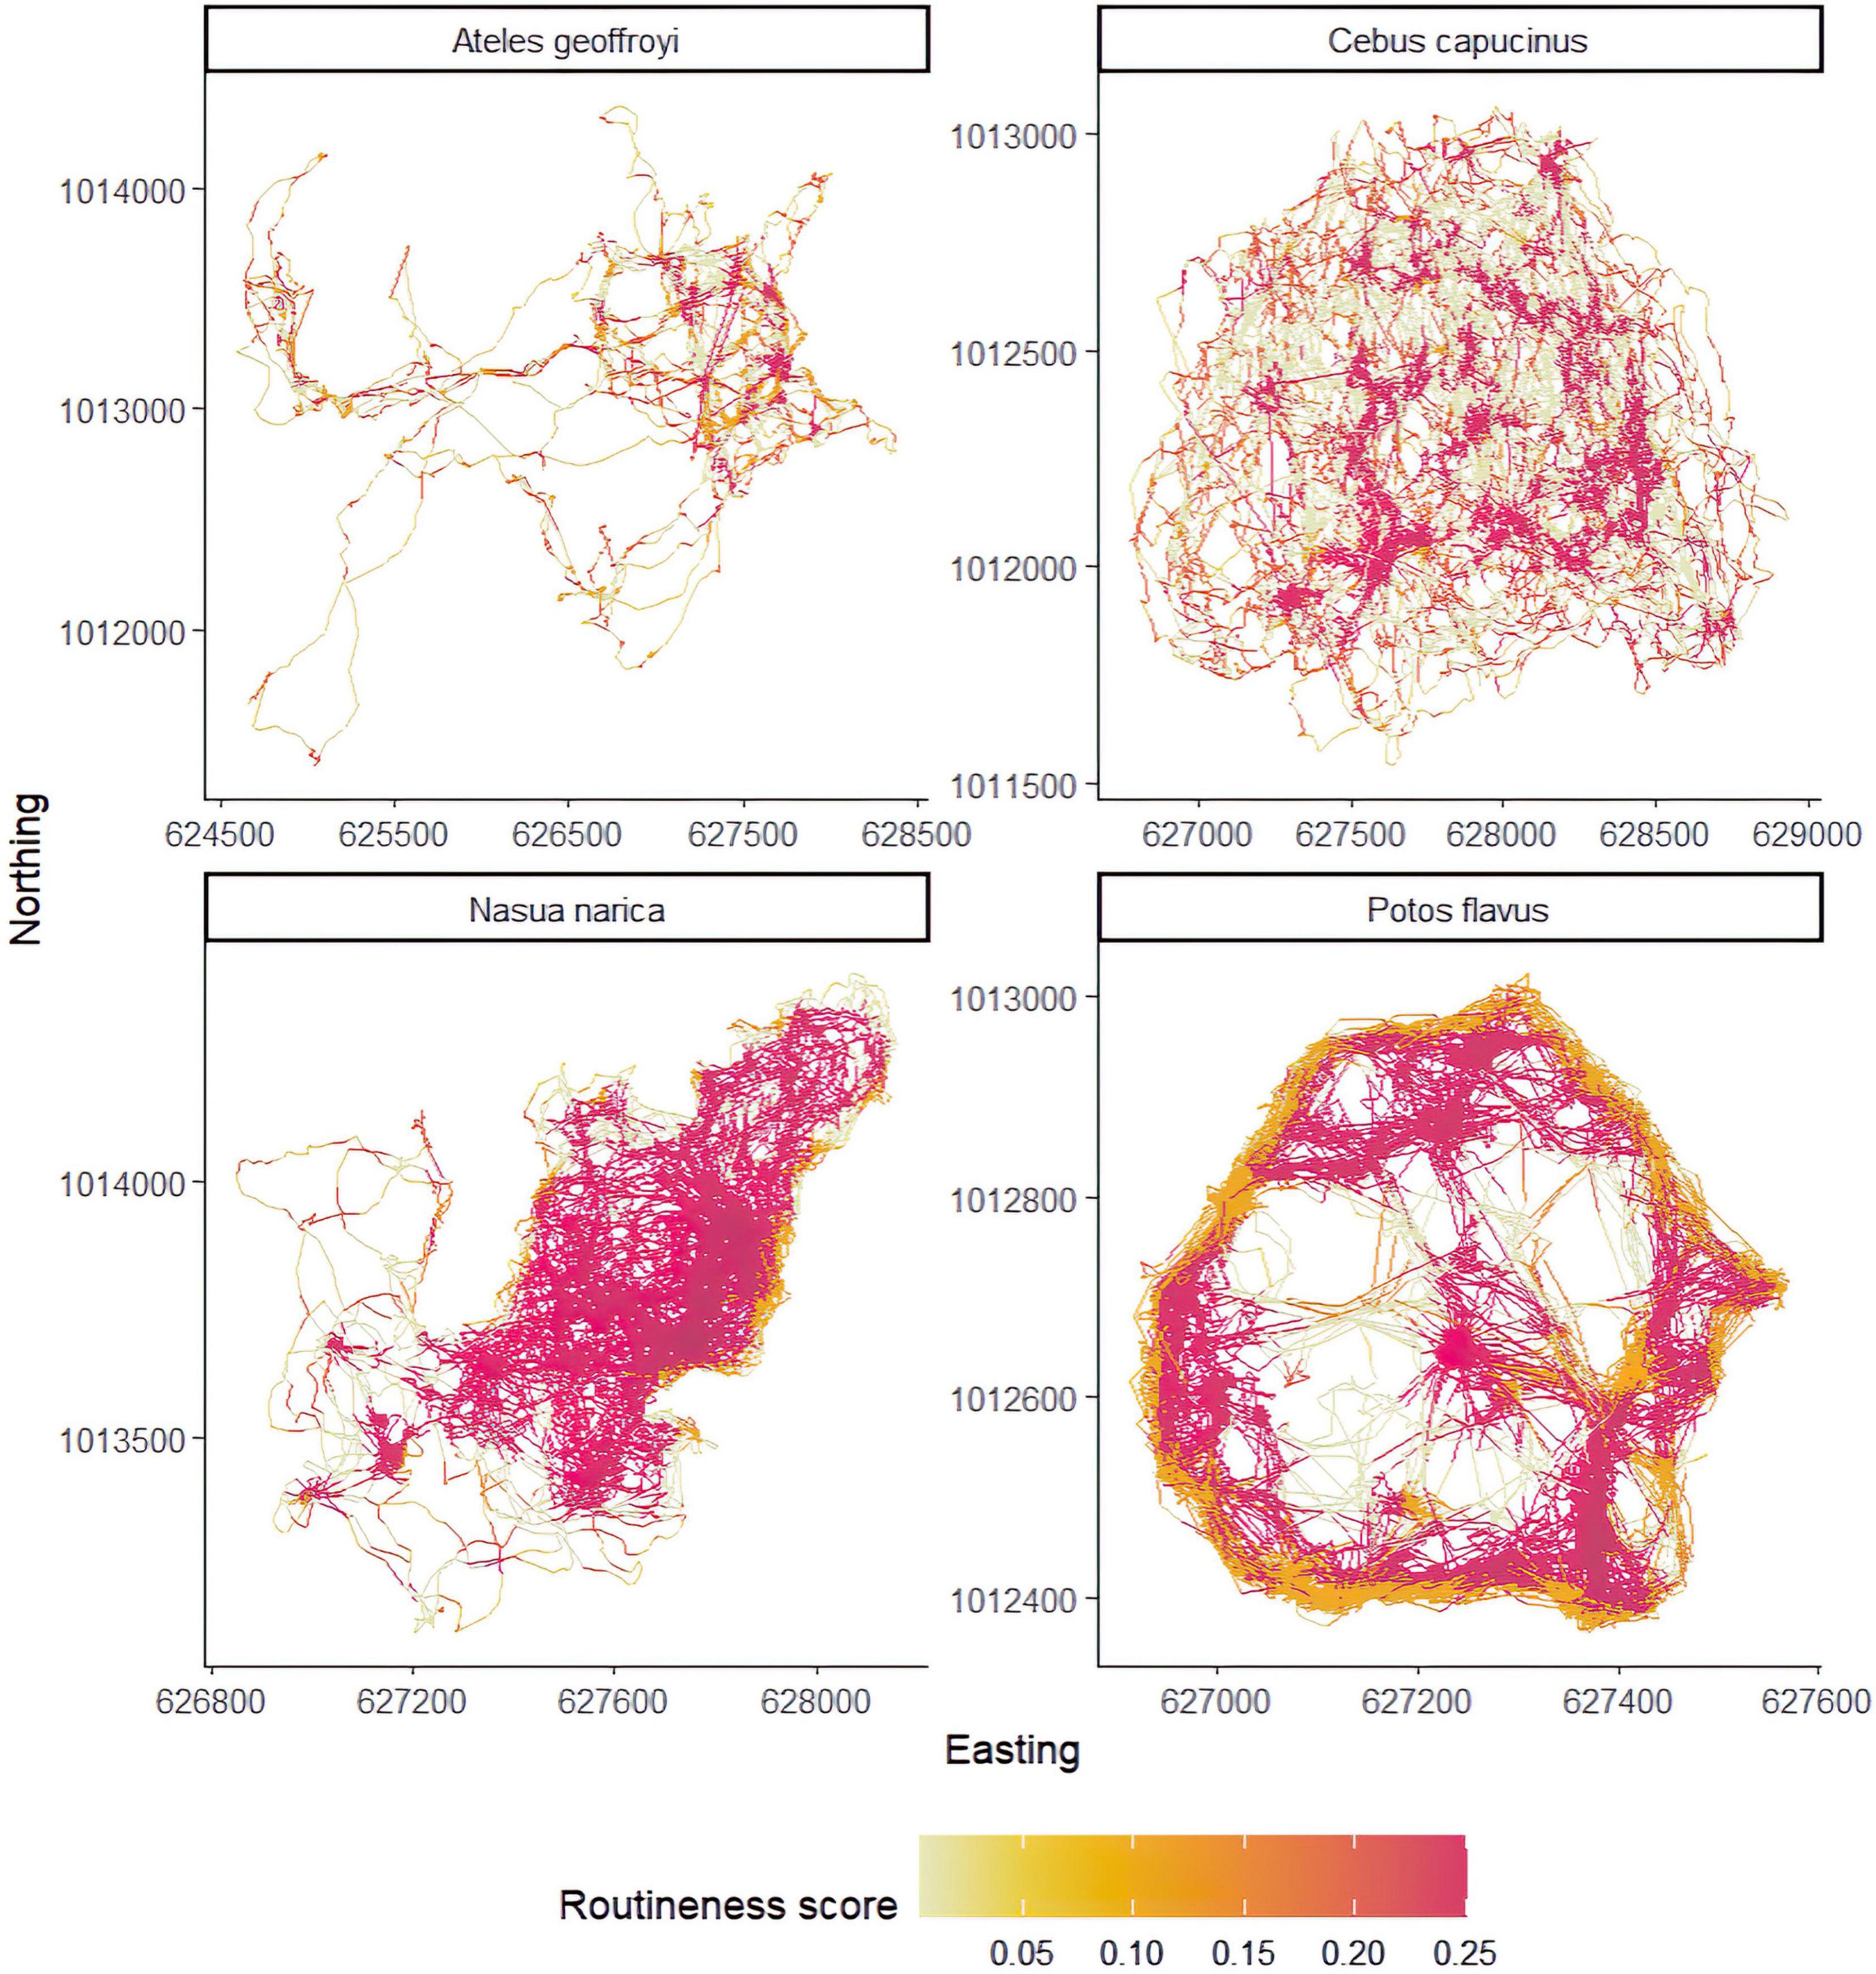
Figure 6. Example results of the route detection procedure. All individuals are the same individuals presented in Figure 5, however, the axis scales are unique for each individual to facilitate easier visual comparison. All track segments have been annotated with the “routineness score” of the cells they occupy.
All species show a mix of locations with routine and non-routine behavior as indicated by their routineness scores. The spider monkey and coati both exhibit the highest routineness scores along the shoreline. In the case of the coati, most of the locations with high routineness values might be explained by the fact that the majority of its range falls within a peninsula, strongly suggesting environmental constraints on movement. The spider monkey in comparison does demonstrate some route-like behavior along the shoreline, but also exhibits high routineness scores at locations unconstrained by the geometry of the island. The capuchin and the kinkajou both exhibit evidence of route-use independent of the geometry of the island, with the capuchin range being far from the shoreline, and the kinkajou seeming to predominantly rely on routine behavior to navigate its range. Kinkajous exhibited the highest overall routineness relative to the any other species (hierarchical Bayesian regression, Figure 7).
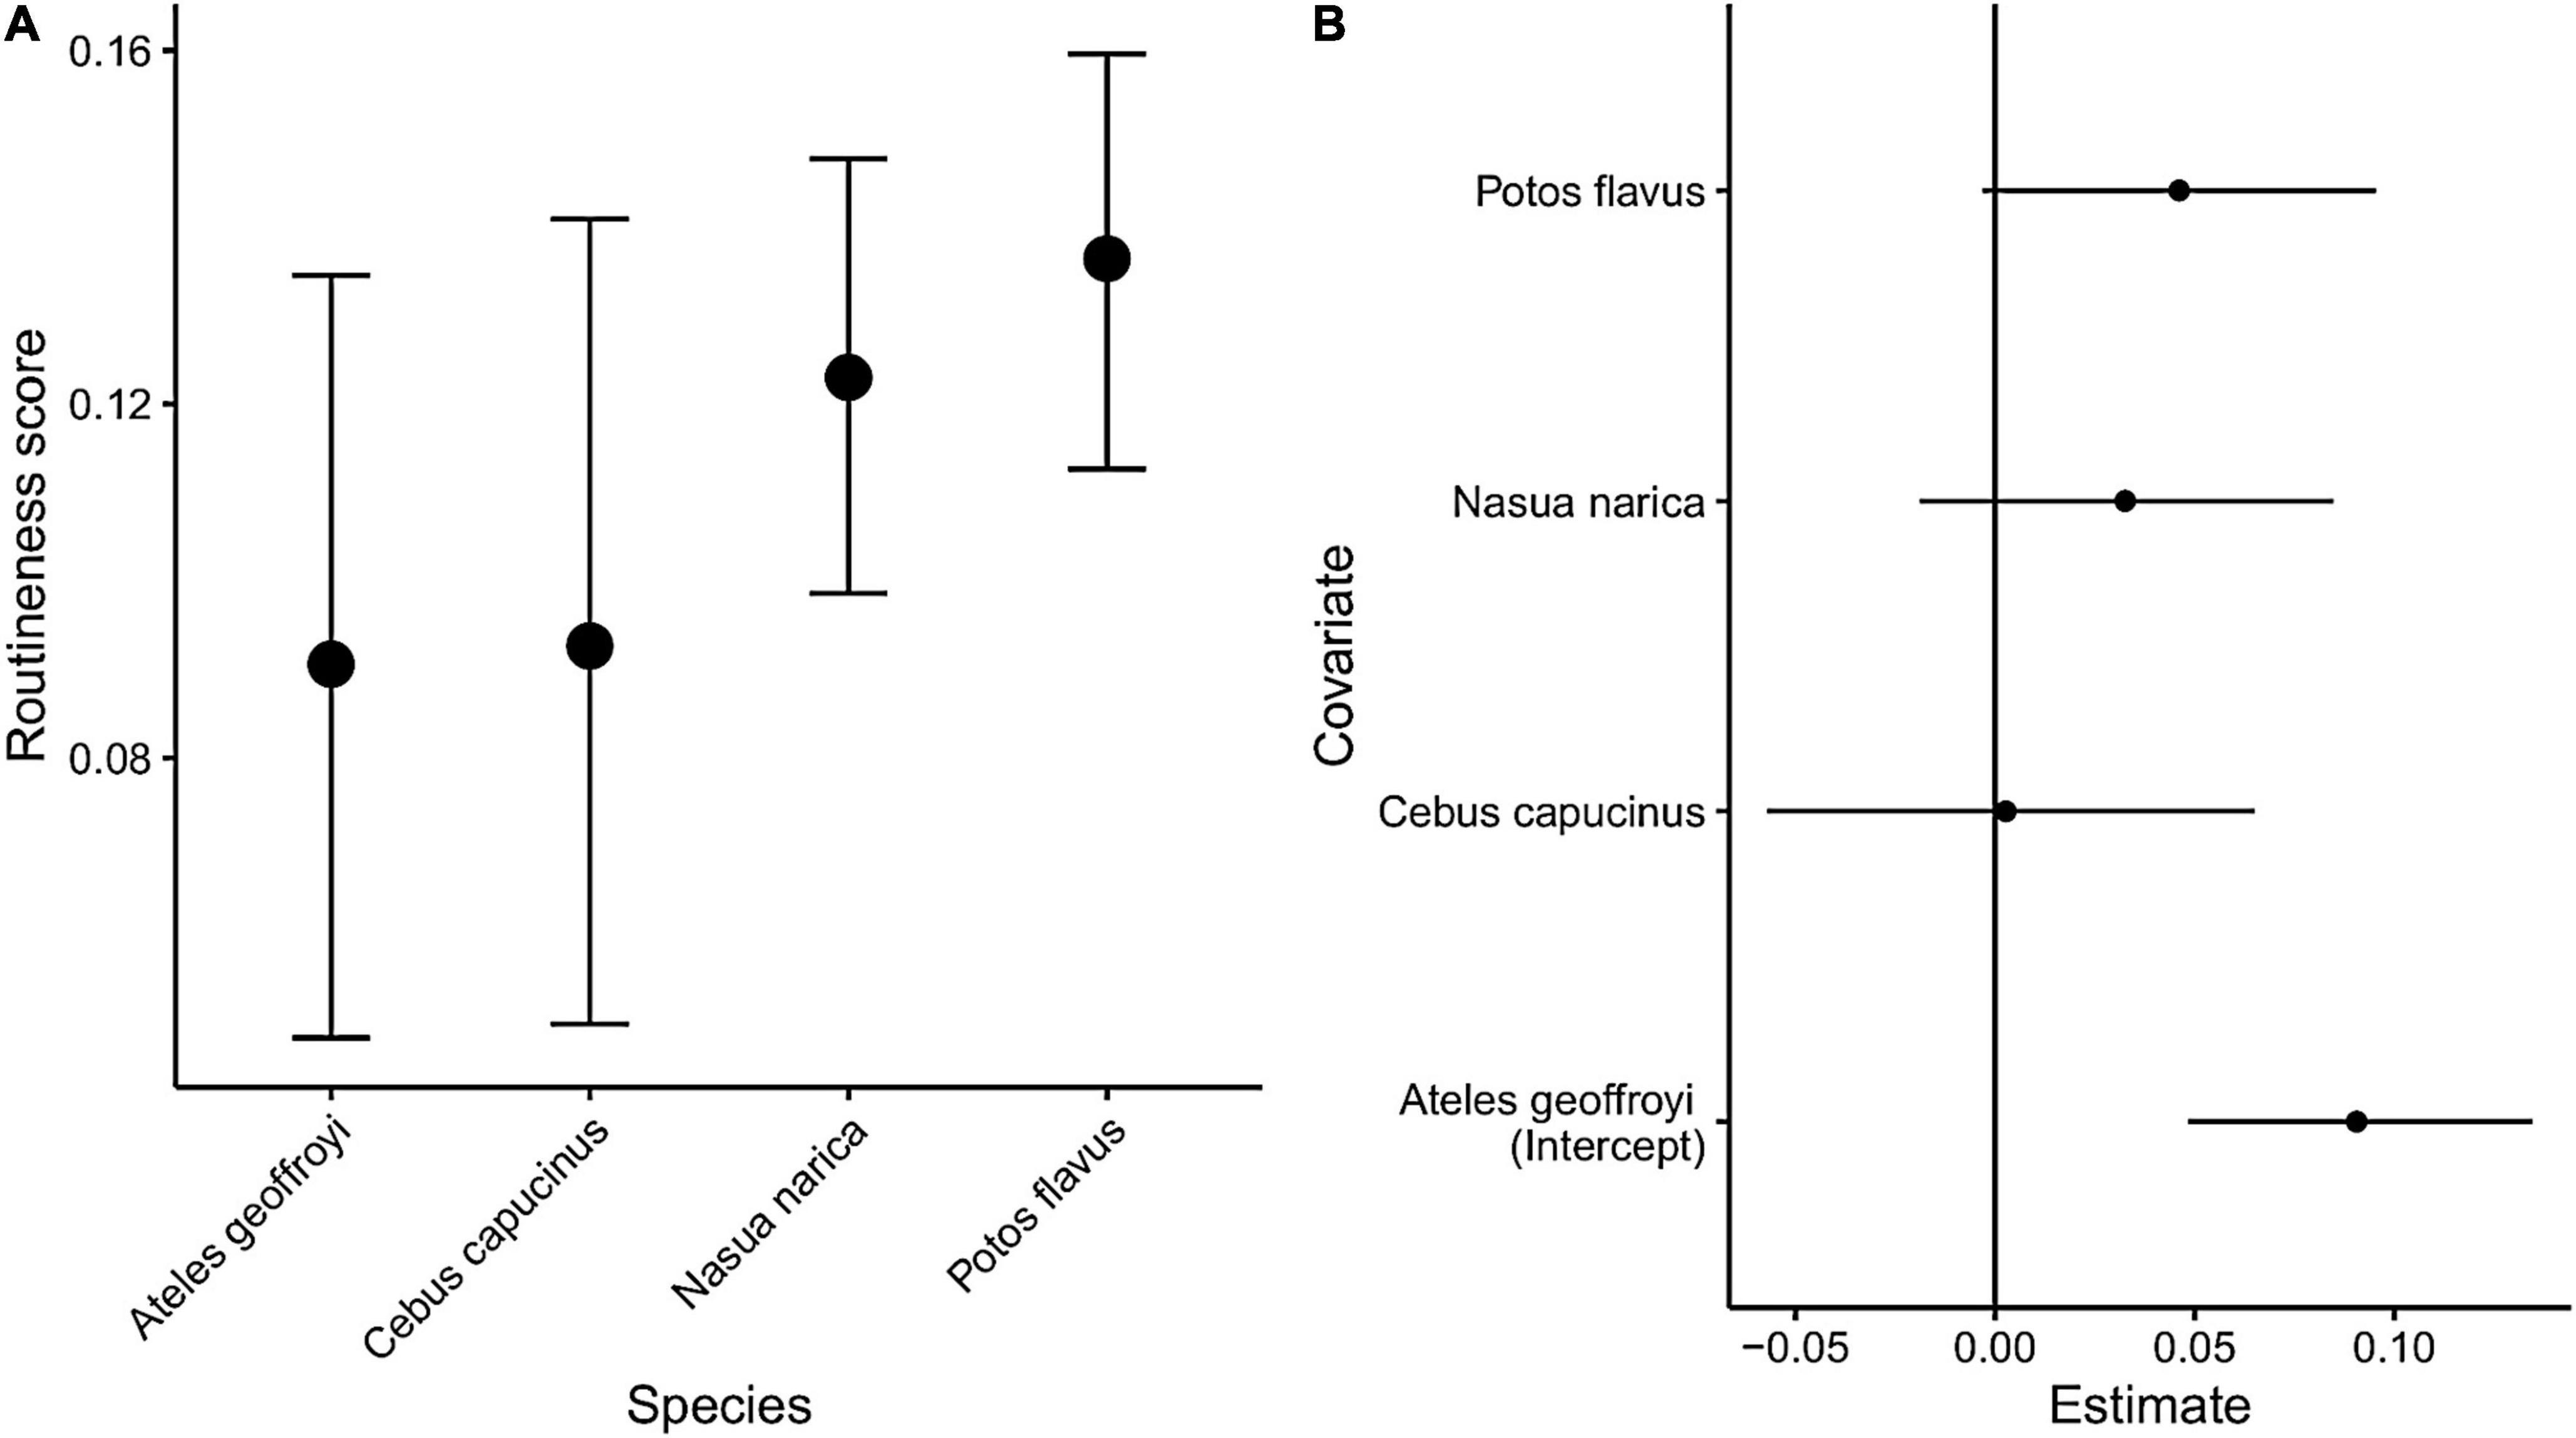
Figure 7. Results of the hierarchical Bayesian regression model. (A) The conditional effects of species on routineness scores. (B) Posterior intervals of Bayesian beta regression. The dots are posterior means and intervals are 95% uncertainty intervals.
The utility of our approach lies in explicitly quantifying the degree to which behavior in a given location is routine, providing researchers a means of differentiating potential habitual travel routes from other locations within an animals’ range. Our routineness score provides a simple and interpretable means of characterizing a location as route-like, with higher values indicating habitually high-use, sequential, and directional behavior. Further analyses can be designed to diagnose whether the presence of routine behavior at a given location is explainable by environmental constraints or if there is evidence for a learned navigation route. This could be achieved by testing the relationship between the presence of the physical features in Figure 1 and the routineness score of a region. For example, the coast of the island in which our data were collected creates a type of physical corridor; areas closer to the coast tend to have higher routineness scores for the coati in Figure 5. Researchers interested an animal’s perceptual capacity might estimate the distance from important resources at which routineness scores increase, while those interested in response learning might estimate the effect of notable landmarks on nearby routineness scores. Simulations such as those presented in Figure 2 can be used to create useful references for the routineness scores that might be expected under different conditions.
Interestingly, our results indicate that among our four study-species, kinkajous, which are both nocturnal and arboreal, exhibited the most consistent and pervasive routine behavior throughout their ranges. One factor that may lead to a greater degree of routine behavior in kinkajous is the perceptual limitations of nocturnal activity. Greater reliance on local landmarks, such as the pattern of foliage against the night sky (Chaib et al., 2021), may require kinkajous to remain within narrower regions of space in order to stay oriented. At the same time, kinkajous may have a greater number of locations that they visit frequently and consistently than other species in this study. First, kinkajous typically limit their sleep to a repertoire of 1–3 secure sleep sites (Kays and Gittleman, 2001), while other species in this study are more flexible, perhaps due to the added security of group-living. Second, recent research in another asocial carnivore, the cheetah, has highlighted the importance of communication nodes for the transfer of information between neighboring conspecifics (Melzheimer et al., 2020). Dependence on a limited number of sleep sites and the routine visitation of communication hubs could limit the ability for kinkajous to flexibly adjust their movement strategies with changing distributions of food resources. Understanding downstream effects of nocturnality and asociality on navigation and space-use strategies will be an important goal for future research.
Elaborations on our method for quantifying routine behavior may be useful in further distinguishing the cognitive mechanism that mediate the relationship between an animal’s ecology and its space-use. Neuropsychologists describe an animal’s mental representation of space as stemming from two parallel memory systems, a relative system where space is experienced in relation to the observer (egocentric), and a geometrically explicit system where the vectorial relationships between locations are independent of the observer (allocentric) (O’Keefe and Nadel, 1978; Nadel, 1992; Nadel and Hardt, 2004). Egocentric systems emerge from the integration of perceptual processing and response learning, such that individuals learn and remember the sequence of responses to some reference cues that lead to successfully acquiring some sought after target (reviewed in Goodman, 2021). Through response learning, for example, animals can use unique cues (landmarks) to behaviorally and neurologically (Knierim and Hamilton, 2011) connect valuable resources separated by spaces greater than the animal’s perceptual range. Such learning on its own typically produces highly routine movements in which both the order of resources visited and the paths taken between them remain consistent over time, as in bumblebees (Lihoreau et al., 2012; Reynolds et al., 2013) and hummingbirds (Garrison and Gass, 1999) foraging on spatially persistent, renewing sources of nectar. The high degree of routine behavior in kinkajous may suggest that they rely more heavily on response learning strategies, relying on stimulus response behavior to encounter important resources. This is in contrast to place learning, whereby the animal learns and remembers the position of some object relative to an absolute frame of reference, independent from the animal’s own position (reviewed in Goodman, 2021). In this case, and with relevant information about its own position relative to this frame of reference, an animal can navigate toward the resource on future occasions regardless of the individual’s starting location, and is not restricted to repeating the exact sequence of movement behaviors it exhibited previously. In Figure 8, we identify additional metrics of routine movement paths that could be used to interrogate the cognitive mechanisms underlying specific routes. Supplementing applications of this route-detection workflow with data on perceptual ranges and resource distributions will aid in determining whether areas of high routineness are best explained by taxis, response learning, or place learning (Figure 8).
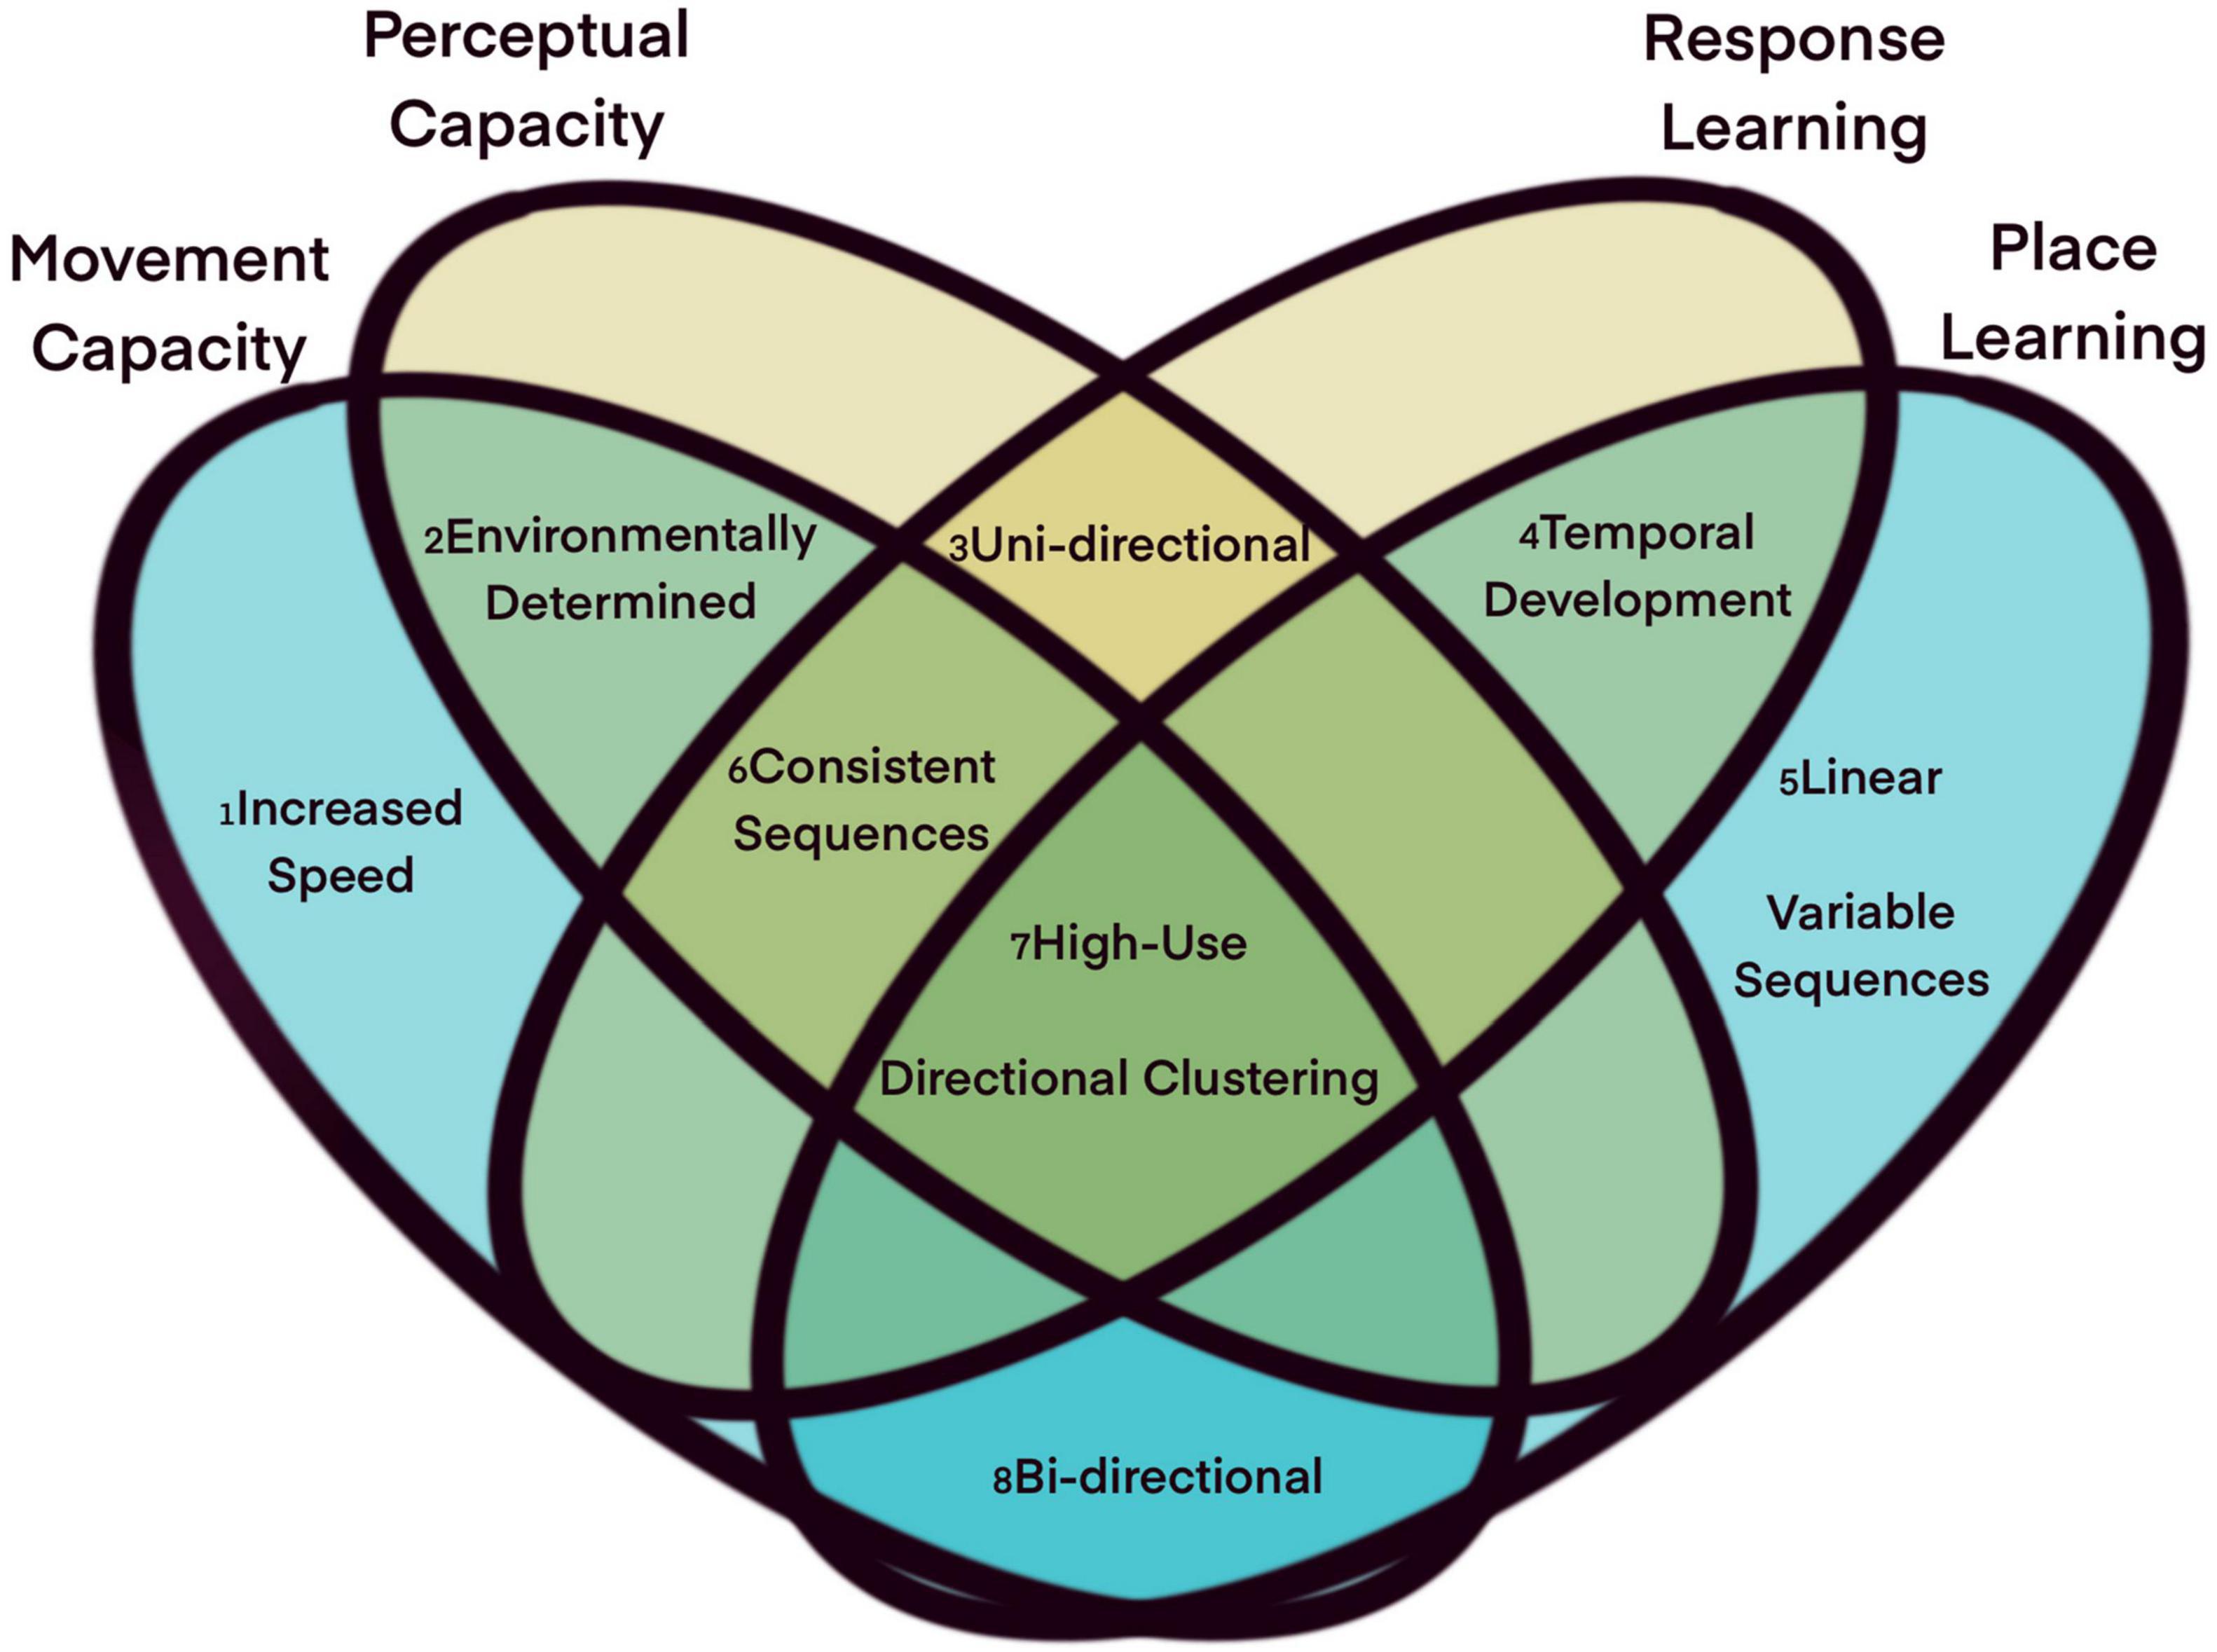
Figure 8. Process dependent route characteristics. Not all routes are the same, and they may have different properties depending on the process from which they arose. (1) When an animal selects a path based on its ability to move, it is less likely to forage in that space and may be able to move faster in that terrain, resulting in in a route characterized by high speed relative to other locations in which the animal moves. (2) When routes emerge from an animal’s capacity to perceive or move along local features, those same features should be identifiable via human observation or remote sensing. (3) Animals following a perceptual gradient or developing learned responses to landmarks should be consistent in the direction of their responses to those cues. (4) Routes emerging from memory processes should show higher path fidelity over time, as an animal’s movement responses are reinforced or their mental map becomes more accurate. (5) Routes that emerge from place learning should be linear and direct, as they represent the animal’s ability to consistently select the shortest path between two locations. Additionally, place learning animals may mix and match route segments as they track temporal changes in resource availability. (6) Routes generated by non-place learning processes should exhibit minimal branching, with animals moving from location to location in the same order along each path through the region. (7) All routes, as defined by our framework, should exhibit frequent use with high spatial fidelity and directionality. (8) Routes emerging for their efficiency, either in movement capacity or distance traveled, may contain paths in either direction through the region.
While the method presented here is a promising step toward diagnosing these particular patterns of behavior, it is important to note its limitations. Our approach does not attempt to explain the paths an animal took as a function of the environment, as methods like step and path selection facilitate (e.g., Fortin et al., 2005; Cushman and Lewis, 2010; Zeller et al., 2015). Similarly, this method is not a tool for estimating unobserved locations that an animal may have used (e.g., via the Brownian bridge movement model). Rather, our approach incorporates an already available continuous time modeling framework as an integral step in our data processing procedure. Because our approach is built around reconstructing the data to continuous time, the accuracy of the reconstructed movement paths are sensitive to the resolution of the data. Our results show that the reconstructions stay reasonably accurate at sampling intervals less than 30 min. At coarser resolutions, the error increases substantially. With high resolution data, this approach does a remarkable job recovering the fine scale tactical decisions made by the animals and has the ability to detect fine scale route use. As sampling rates get more and more coarse, the autocorrelation in the velocity becomes difficult or impossible to estimate, and diffusive models that assume independent velocities must be used (Fleming et al., 2014, Gurarie et al., 2017). Under these circumstances, the grid cell size will equal the mean step length, making this approach analogous to other available approaches. For low resolution datasets, there may not be an advantage to using this approach over the approaches presented by LaPoint et al. (2013) and Bastille-Rousseau et al. (2018).
Areas where animals exhibit routine behavior, particularly route use, indicate the importance of that area to the animals either because they have learned that moving through those locations will lead them to high valued target destinations, or because external factors have constrained their set of usable locations to those areas. We have reviewed the cognitive and non-cognitive mechanisms that can lead to the emergence of routine behavior, particularly route-use, and have suggested one potential way of identifying this pattern of behavior in animal movement data. This conceptual framework and method of classifying routine behavior should provide a helpful step toward the study of these cognitive and non-cognitive mechanisms.
Animal tracking data used in all analyses for this project are hosted on Movebank (Processed data: Movebank ID 1120749252; Unprocessed data: Movebank ID 468460067). Code for all analyses are hosted on github: https://git.io/JP1vF.
The animal study was reviewed and approved by the Smithsonian Tropical Research Institute IACUC protocol numbers 2014-1001-2017, 2017-0912-2020, and 2017-0605-2020, and UC Davis IACUC protocol number 18239.
SA and AV conceptualized the study, developed the glossary, definitions, and developed the figures. SA developed the computational framework and R script for the route-detection procedure and led the writing of the manuscript. AV developed the simulations. RH, LH, MC, BH, DC, and RK collected the data. All authors contributed equally to the text.
This work received funding from the National Science Foundation (BCS-1440755), a Packard Foundation Fellowship (2016-65130), and the Alexander von Humboldt Foundation in the framework of the Alexander von Humboldt Professorship endowed by the Federal Ministry of Education and Research awarded to MC. RH was supported by the Carlsberg Foundation (CF16-0310 and CF17-0539). LH was supported by the European Union’s Horizon 2020 Research and Innovation Program under the Marie Skłodowska-Curie grant agreement No. 801199. LH also received funding from the Smithsonian Tropical Research Institute Short-term Fellowship.
The authors declare that the research was conducted in the absence of any commercial or financial relationships that could be construed as a potential conflict of interest.
All claims expressed in this article are solely those of the authors and do not necessarily represent those of their affiliated organizations, or those of the publisher, the editors and the reviewers. Any product that may be evaluated in this article, or claim that may be made by its manufacturer, is not guaranteed or endorsed by the publisher.
We thank the Smithsonian Tropical Research Institute for permission to conduct the research and for the use of BCI research facilities. We also thank Melissa Cano, Rafael Baptista and Adriana Bilgray for logistical support, and thank Diorene Smith, DVM and Parque Municipal Summit and Suzan Murray from the Smithsonian Conservation Biology Institute for veterinary support and consultation. For assistance during animal capture, downloading of GPS data and fruit collection we thank Rafael Mares, Robert Lessnau, Anthony Di Fiore, Ninon Meyer, Grace Davis, Lucia Torrez, Brianna Pinto, Alexis Omar Moreno, Josue Ortega, Allie Davis, Dan Marsh, Megan O’Keefe, Michelle Faehr, Aimee Owen, April Pitman, Michelle Kuchle, Devin Lindsley, Gregg Cohen, Christina Campbell, Jean Paul Hirwa, Kevin McLean, and Claudio Manuel Monteza. We thank to Christen Fleming for his consultations about ctmm and his advice on grid cell resolutions.
The Supplementary Material for this article can be found online at: https://www.frontiersin.org/articles/10.3389/fevo.2021.743014/full#supplementary-material
Supplementary Figure 1 | The results of path reconstruction across different sampling rates. Plot A. is the original 1 hz GPS data and the basis for comparison against all reconstructions. The 1 hz track was down sampled to emulate data collected at coarser sampling rates. Each down sampled track was fit to its own model and that model was used to reconstruct each down sampled track back to 1 hz. Plots B-G are the resulting reconstructions for each sampling rate. The transparency of the track decreases with time to facilitate readability.
Supplementary Figure 2 | Reconstructed 1 hz path against the original 1 hz track. The original unaltered track is plotted in black, and the reconstructed track is plotted in red. The 1 hz track was down sampled to a four min resolution in order to reflect the sampling rate of our GPS data. The mean error is reported in Table 2. Majority of the track was within two meters of the original data.
BOX 1. Glossary of terms used in the paper.
Exploration: A process of movement determined solely by the internal state of an animal. Results in “random” movement, analogous to the use of “local” information or internal states.
Taxis: The combined cognitive processes that allow an animal to perceive and categorize perceptual cues and direct its movement relative to specific cue types. Analogous to the “taxon” system.
Response Learning: The process of mentally associating perceptual cues to physiological outcomes through specific behaviors.
Place Learning: The process of mentally associating one location (or other mental representation) to another by a distance and a direction.
Path: The actual locations an animal occupied over some contiguous period of time.
Track: An animal path that has been subsampled to a time-series of discrete points in space (e.g., by a GPS collar).
Route: A region of space with high path reuse fidelity: relatively high use by one or more animals in which the animals’ movement bearings exhibit low variability across paths.
Corridor: An environmental feature that causes route-use in the absence of response learning.
Targeted Destination: A region of space with relatively frequent re-use by one or more animals in which movement vectors have low average velocity and relatively low correlation in bearings.
Commute: A habitual transition between two targeted areas.
Variable Commutes: A set of commutes between two targeted destinations that do not occur along a route.
Route-Based Commutes: A set of commutes between two targeted destinations that occur along one or a few routes.
Commute Determinism: The predictability of an animals next commute given its presence at a specific targeted location.
Trapline: A sequence of targeted locations that frequently occur in the same order due to a series of highly route-based commutes.
Adriaensen, F., Chardon, J. P., De Blust, G., Swinnen, E., Villalba, S., Gulinck, H., et al. (2003). The application of ‘least-cost’modelling as a functional landscape model. Landsc. Urban plan. 64, 233–247. doi: 10.1016/S0169-2046(02)00242-6
Ayers, C. A., Armsworth, P. R., and Brosi, B. J. (2018). Statistically testing the role of individual learning and decision-making in trapline foraging. Behav. Ecol. 29, 885–893. doi: 10.1093/beheco/ary058
Bastille-Rousseau, G., Wall, J., Douglas-Hamilton, I., Lesowapir, B., Loloju, B., Mwangi, N., et al. (2020). Landscape-scale habitat response of African elephants shows strong selection for foraging opportunities in a human dominated ecosystem. Ecography 43, 149–160. doi: 10.1111/ecog.04240
Bastille-Rousseau, G., and Wittemyer, G. (2021). Characterizing the landscape of movement to identify critical wildlife habitat and corridors. Conserv. Biol. 35, 346–359. doi: 10.1111/cobi.13519
Bastille-Rousseau, G., Douglas-Hamilton, I., Blake, S., Northrup, J. M., and Wittemyer, G. (2018). Applying network theory to animal movements to identify properties of landscape space use. Ecol. Appl. 28, 854–864. doi: 10.1002/eap.1697
Bebko, A. O. (2018). Ecological and Cognitive Influences on Orangutan Space Use. Ph.D. thesis. Toronto, ON: York University.
Bivand, R., Keitt, T., and Rowlingson, B. (2021). rgdal: Bindings for the ‘Geospatial’ Data Abstraction Library. R Package Version 1.5-2.7. Available online at: https://CRAN.R-project.org/package=rgdal
Bracis, C. I. (2014). Incorporating Cognition Into Models of Animal Movement and Predator–Prey Interaction. Doctoral dissertation. Seattle, WA: University of Washington.
Bracis, C., Bildstein, K. L., and Mueller, T. (2018). Revisitation analysis uncovers spatio-temporal patterns in animal movement data. Ecography 41, 1801–1811. doi: 10.1111/ecog.03618
Bracis, C., Gurarie, E., Van Moorter, B., and Goodwin, R. A. (2015). Memory effects on movement behavior in animal foraging. PLoS One 10:e0136057. doi: 10.1371/journal.pone.0136057
Braitenberg, V. (1965). “Taxis, kinesis and decussation,” in Cybernetics of the Nervous System. Progress in Brain Research, Vol. 17, eds N. Wiener and J. P. Schadé (Amsterdam: Elsevier), 210–222. doi: 10.1016/s0079-6123(08)60163-6
Buechley, E. R., Oppel, S., Beatty, W. S., Nikolov, S. C., Dobrev, V., Arkumarev, V., et al. (2018). Identifying critical migratory bottlenecks and high-use areas for an endangered migratory soaring bird across three continents. J. Avian Biol. 49:e01629. doi: 10.1111/jav.01629
Buehlmann, C., Graham, P., Hansson, B. S., and Knaden, M. (2015). Desert ants use olfactory scenes for navigation. Anim. Behav. 106, 99–105. doi: 10.1016/j.anbehav.2015.04.029
Bullard, F. (1999). Estimating the Home Range of an Animal: A Brownian Bridge Approach. Doctoral dissertation. Baltimore, MD: Johns Hopkins University.
Bürkner, P. C. (2017). brms: an R package for Bayesian multilevel models using stan. J. Stat. Softw. 80, 1–28. doi: 10.18637/jss.v080.i01
Bürkner, P. C. (2018). Advanced Bayesian multilevel modeling with the R package brms. R J. 10, 395–411. doi: 10.32614/RJ-2018-017
Calabrese, J. M., Fleming, C. H., and Gurarie, E. (2016). ctmm: an R package for analyzing animal relocation data as a continuous-time stochastic process. Methods Ecol. Evol. 7, 1124–1132. doi: 10.1111/2041-210X.12559
Calenge, C. (2006). The package “adehabitat” for the R software: a tool for the analysis of space and habitat use by animals. Ecol. Modell. 197, 516–519. doi: 10.1016/j.ecolmodel.2006.03.017
Carpenter, B., Gelman, A., Hoffman, M. D., Lee, D., Goodrich, B., Betancourt, M., et al. (2017). Stan: a probabilistic programming language. J. Stat. Softw. 76, 1–32. doi: 10.18637/jss.v076.i01
Chaib, S., Dacke, M., Wcislo, W., Warrant, E., Chaib, S., Dacke, M., et al. (2021). Report dorsal landmark navigation in a Neotropical nocturnal bee ll ll Dorsal landmark navigation in a Neotropical nocturnal bee. Curr. Biol. 31, 3601–3605.e3. doi: 10.1016/j.cub.2021.05.029
Collett, M. (2010). How desert ants use a visual landmark for guidance along a habitual route. Proc. Natl. Acade. Sci. U.S.A. 107, 11638–11643. doi: 10.1073/pnas.1001401107
Cushman, S. A., and Lewis, J. S. (2010). Movement behavior explains genetic differentiation in American black bears. Landsc. Ecol. 25, 1613–1625. doi: 10.1007/s10980-010-9534-6
de Guinea, M., Estrada, A., Nekaris, K. A. I., and Van Belle, S. (2019). Arboreal route navigation in a neotropical mammal: energetic implications associated with tree monitoring and landscape attributes. Mov. Ecol. 7, 1–12. doi: 10.1186/s40462-019-0187-z
Di Fiore, A., and Suarez, S. A. (2007). Route-based travel and shared routes in sympatric spider and woolly monkeys: cognitive and evolutionary implications. Anim. Cogn. 10, 317–329. doi: 10.1007/s10071-006-0067-y
Fagan, W. F., Lewis, M. A., Auger-Méthé, M., Avgar, T., Benhamou, S., Breed, G., et al. (2013). Spatial memory and animal movement. Ecol. Lett. 16, 1316–1329. doi: 10.1111/ele.12165
Fleming, C. H., Calabrese, J. M., Mueller, T., Olson, K. A., Leimgruber, P., and Fagan, W. F. (2014). From fine-scale foraging to home ranges: a semivariance approach to identifying movement modes across spatiotemporal scales. Am. Nat. 183, E154–E167. doi: 10.1086/675504
Forman, R. T. (1995). Land Mosaics: The Ecology of Landscapes and Regions (1995). The Ecological Design and Planning Reader. Washington, DC: IslandPress, 217–234.
Fortin, D., Beyer, H. L., Boyce, M. S., Smith, D. W., Duchesne, T., and Mao, J. S. (2005). Wolves influence elk movements: behavior shapes a trophic cascade in Yellowstone National Park. Ecology 86, 1320–1330. doi: 10.1890/04-0953
Fraenkel, G. S., and Gunn, D. L. (1961). The Orientation of Animals: Kineses, Taxes and Compass Reactions. New York, NY: Dover Publications.
Garber, P. A., and Porter, L. M. (2014). Navigating in small-scale space: the role of landmarks and resource monitoring in understanding saddleback tamarin travel. Am. J. Primatol. 76, 447–459. doi: 10.1002/ajp.22196
Garrison, J. S., and Gass, C. L. (1999). Response of a traplining hummingbird to changes in nectar availability. Behav. Ecol. 10, 714–725. doi: 10.1093/beheco/10.6.714
Goodman, J. (2021). Place vs. Response learning: history, controversy, and neurobiology. Front. Behav. Neurosci. 14:598570. doi: 10.3389/fnbeh.2020.598570
Gurarie, E., Bracis, C., Delgado, M., Meckley, T. D., Kojola, I., and Wagner, C. M. (2016). What is the animal doing? Tools for exploring behavioural structure in animal movements. J. Anim. Ecol. 85, 69–84. doi: 10.1111/1365-2656.12379
Gurarie, E., Fleming, C. H., Fagan, W. F., Laidre, K. L., Hernández-Pliego, J., and Ovaskainen, O. (2017). Correlated velocity models as a fundamental unit of animal movement: synthesis and applications. Mov. Ecol. 5, 1–18. doi: 10.1186/s40462-017-0103-3
Kays, R., Crofoot, M. C., Jetz, W., and Wikelski, M. (2015). Terrestrial animal tracking as an eye on life and planet. Science 348, 1222–1231. doi: 10.1126/science.aaa2478
Kays, R. W., and Gittleman, J. L. (2001). The social organization of the kinkajou Potos flavus (Procyonidae). J. Zool. 253, 491–504. doi: 10.1017/S0952836901000450
Knierim, J. J., and Hamilton, D. A. (2011). Framing spatial cognition: neural representations of proximal and distal frames of reference and their roles in navigation. Physiol. Rev. 91, 1245–1279. doi: 10.1152/physrev.00021.2010
Kozakiewicz, M., and Kozakiewicz, A. (2004). Chemical information, scent trails and spatial behaviour of small forest rodents. A review. Electron. J. Pol. Agric. Univ. Ser. Biol. 2.
LaPoint, S., Gallery, P., Wikelski, M., and Kays, R. (2013). Animal behavior, cost-based corridor models, and real corridors. Landsc. Ecol. 28, 1615–1630. doi: 10.1007/s10980-013-9910-0
Leigh, E. G. (1999). Tropical Forest Ecology: A View from Barro Colorado Island. New York, NY: Oxford University Press.
Lihoreau, M., Raine, N. E., Reynolds, A. M., Stelzer, R. J., Lim, K. S., Smith, A. D., et al. (2012). Radar tracking and motion-sensitive cameras on flowers reveal the development of pollinator multi-destination routes over large spatial scales. PLoS Biol. 10:e1001392. doi: 10.1371/journal.pbio.1001392
McRae, B. H., Dickson, B. G., Keitt, T. H., and Shah, V. B. (2008). Using circuit theory to model connectivity in ecology, evolution, and conservation. Ecology 89, 2712–2724. doi: 10.1890/07-1861.1
Melzheimer, J., Heinrich, S. K., Wasiolka, B., Mueller, R., and Thalwitzer, S. (2020). Communication hubs of an asocial cat are the source of a human – carnivore conflict and key to its solution. Proc. Natl. Acad. Sci. U.S.A. 117, 33325–33333. doi: 10.1073/pnas.2002487117
Mouselimis, L. (2021). ClusterR: Gaussian Mixture Models, K-Means, Mini-Batch-Kmeans, K-Medoids and Affinity Propagation Clustering. R package version 1.2.5. Available online at: https://CRAN.R-project.org/package=ClusterR
Mueller, T., and Fagan, W. F. (2008). Search and navigation in dynamic environments-from individual behaviors to population distributions. Oikos 117, 654–664. doi: 10.1111/j.0030-1299.2008.16291.x
Nadel, L. (1992). Multiple memory systems: what and why. J. Cogn. Neurosci. 4, 179–188. doi: 10.1162/jocn.1992.4.3.179
Nathan, R., Getz, W. M., Revilla, E., Holyoak, M., Kadmon, R., Saltz, D., et al. (2008). A movement ecology paradigm for unifying organismal movement research. Proc. Natl. Acad. Sci. U.S.A. 105, 19052–19059. doi: 10.1073/pnas.0800375105
Noonan, M. J., Fleming, C. H., Akre, T. S., Drescher-Lehman, J., Gurarie, E., Harrison, A. L., et al. (2019). Scale-insensitive estimation of speed and distance traveled from animal tracking data. Mov. Ecol. 7, 1–15. doi: 10.1186/s40462-019-0177-1
O’Keefe, J., and Nadel, L. (1978). The Hippocampus as a Cognitive Map. Oxford: Oxford university press.
Polansky, L., Kilian, W., and Wittemyer, G. (2015). Elucidating the significance of spatial memory on movement decisions by African savannah elephants using state–space models. Proc. R. Soc. B Biol. Sci. 282, 20143042. doi: 10.1098/rspb.2014.3042
Presotto, A., and Izar, P. (2010). Spatial reference of black capuchin monkeys in Brazilian Atlantic Forest: egocentric or allocentric? Anim. Behav. 80, 125–132. doi: 10.1016/j.anbehav.2010.04.009
Pullinger, M. G., and Johnson, C. J. (2010). Maintaining or restoring connectivity of modified landscapes: evaluating the least-cost path model with multiple sources of ecological information. Landsc. Ecol. 25, 1547–1560. doi: 10.1007/s10980-010-9526-6
Reynolds, A. M., Lihoreau, M., and Chittka, L. (2013). A simple iterative model accurately captures complex trapline formation by bumblebees across spatial scales and flower arrangements. PLoS Comput. Biol. 9:e1002938. doi: 10.1371/journal.pcbi.1002938
Riotte-Lambert, L., and Matthiopoulos, J. (2019). Communal and efficient movement routines can develop spontaneously through public information use. Behav. Ecol. 30, 408–416. doi: 10.1093/beheco/ary180
Riotte-Lambert, L., Benhamou, S., and Chamaillé-Jammes, S. (2016). From randomness to traplining: a framework for the study of routine movement behavior. Behavioral Ecology 28, 280–287. doi: 10.1093/beheco/arw154
Rosenberg, D. K., Noon, B. R., and Meslow, E. C. (1997). Biological corridors: form, function, and efficacy. BioScience 47, 677–687. doi: 10.2307/1313208
Svensson, G. P., Strandh, M., and Löfstedt, C. (2014). “Movements in the olfactory landscape,” in Animal Movement Across Scales, eds L. A. Hansson and S. Åkesson (Oxford: Oxford University Press), 45–66. doi: 10.1093/acprof:oso/9780199677184.003.0011
Valero, A., and Byrne, R. W. (2007). Spider monkey ranging patterns in Mexican subtropical forest: do travel routes reflect planning? Anim. Cogn. 10, 305–315.
Keywords: travel routes, spatial cognition, animal movement, navigation, corridors, unsupervised clustering, routine movement, animal cognition
Citation: Alavi SE, Vining AQ, Caillaud D, Hirsch BT, Havmøller RW, Havmøller LW, Kays R and Crofoot MC (2022) A Quantitative Framework for Identifying Patterns of Route-Use in Animal Movement Data. Front. Ecol. Evol. 9:743014. doi: 10.3389/fevo.2021.743014
Received: 17 July 2021; Accepted: 18 November 2021;
Published: 05 January 2022.
Edited by:
Eliezer Gurarie, University of Maryland, College Park, United StatesReviewed by:
Martin Leclerc, Laval University, CanadaCopyright © 2022 Alavi, Vining, Caillaud, Hirsch, Havmøller, Havmøller, Kays and Crofoot. This is an open-access article distributed under the terms of the Creative Commons Attribution License (CC BY). The use, distribution or reproduction in other forums is permitted, provided the original author(s) and the copyright owner(s) are credited and that the original publication in this journal is cited, in accordance with accepted academic practice. No use, distribution or reproduction is permitted which does not comply with these terms.
*Correspondence: Shauhin E. Alavi, c2FsYXZpQGFiLm1wZy5kZQ==
Disclaimer: All claims expressed in this article are solely those of the authors and do not necessarily represent those of their affiliated organizations, or those of the publisher, the editors and the reviewers. Any product that may be evaluated in this article or claim that may be made by its manufacturer is not guaranteed or endorsed by the publisher.
Research integrity at Frontiers
Learn more about the work of our research integrity team to safeguard the quality of each article we publish.