 Jose A. Ramos
 Richard A. Peters
- Animal Behavior Group, Department of Ecology, Environment and Evolution, La Trobe University, Melbourne, VIC, Australia
Closely related species make for interesting model systems to study the evolution of signaling behavior because they share evolutionary history but have also diverged to the point of reproductive isolation. This means that while they may have some behavioral traits in common, courtesy of a common ancestor, they are also likely to show local adaptations. The Ctenophorus decresii complex is such a system, and comprises six closely related agamid lizard species from Australia: C. decresii, C. fionni, C. mirrityana, C. modestus, C. tjanjalka, and C. vadnappa. In this study, we analyze the motion displays of five members of the C. decresii complex in the context of their respective habitats by comparing signal structure, habitat characteristics and signal contrast between all species. Motor pattern use and the temporal sequence of motor patterns did not differ greatly, but the motion speed distributions generated during the displays were different for all species. There was also variation in the extent to which signals contrasted with plant motion, with C. vadnappa performing better than the other species at all habitats. Overall, this study provides evidence that members of the C. decresii complex exhibit local adaptations in signaling behavior to their respective habitat, but they also maintain some morphological and behavioral traits in common, which is likely a consequence from the ancestral state.
Introduction
Theory suggests that animal signal structure will have phylogenetic determinants, be constrained by morphology and physiology, and influenced by the environment in which signaling takes place. The structure of present day signals can be historically contingent such that related species share characteristics that differ from more distantly related species, but also that the capacity for evolutionary divergence is constrained by the ancestral state (Ord et al., 2011; Ord, 2012). Morphological differences will dictate the kinds of signals that animals can produce. For example, body size constrains acoustic structure in mammals (Reby and McComb, 2003), amphibians (Ryan and Brenowitz, 1985) and insects (Lubanga et al., 2016), while physiological limitations of visual threat displays are related to signal performance (Brandt, 2003). The environment in which signaling takes place is also a major contributor to signal diversity. Differences in microhabitat structure lead to variation in signal structure within species (acoustic signals: Hunter and Krebs, 1979; visual signals: Ramos and Peters, 2017a), while a/biotic noise will lead to long term (Slabbekoorn and Smith, 2002) and short-term changes in signal structure in a variety of signaling systems (Brumm, 2014), including acoustic (Slabbekoorn and Peet, 2003; Slabbekoorn, 2013) and visual (Ord et al., 2007; Peters et al., 2007) signals. What is sometimes difficult to determine is the relative contribution of environmental effects to variations in signal structure within and between species.
The influence of morphology and physiology on signal diversity can often be determined in a straightforward manner by relating specific traits to morphological measurements (Podos, 2001; Podos and Nowicki, 2004) or calculating energetic costs (Vehrencamp et al., 1989; Hoback and Wagner, 1997; Matsumasa and Murai, 2005; Stoddard and Salazar, 2011). Similarly, as closely related species are more likely to exhibit similar traits, the influence of phylogeny is now routinely examined by controlling for shared ancestry in the statistical model using phylogenetic comparative methods (PCMs; Ord and Martins, 2006; Turner et al., 2007). In contrast, environmental effects on signaling are more difficult to quantify and disentangle from morphological and phylogenetic constraints. Consequently, a useful way to consider the relative contribution of habitat characteristics and environmental effects is to select closely related species to minimize variation in phylogeny and morphology/physiology. Our understanding of environmental influence for some signaling modalities, such as sound and static visual signals, has progressed greatly with the use of playback experiments, and specialized tools like sound spectrographs and spectrophotometers (Morton, 1975; Ryan et al., 1990; Leal and Fleishman, 2004; Cocroft and Rodriguez, 2005; McLean et al., 2014). However, less information is available for motion-based visual displays as relevant environmental effects are more complex to quantify (Ramos and Peters, 2017b).
Dynamic visual signals are common in lizards and are used in a variety of contexts including male-female interactions (Peters et al., 2016), predator avoidance (Hasson, 1991), and territorial defense (Carpenter, 1978). Displays produced to defend a territory are particularly useful to lizards as they allow rivals, usually males, to assess each other from a distance and avoid physical confrontations (Peters and Ord, 2003). Color-based visual signals, which are also common among lizard families (Stuart-Fox and Ord, 2004), often require movements to expose brightly colored parts of the body, such as throat, dewlap, chest or abdomen (Mitchell, 1973; LeBas and Marshall, 2000; Stuart-Fox and Moussalli, 2008; Fleishman et al., 2009; Teasdale et al., 2013). The motor patterns involved in motion-based displays vary between species, but they often include dewlap extensions, head bobs, limb waves, tail flicks, or push ups (Carpenter, 1962; Carpenter et al., 1970; Purdue and Carpenter, 1972; Ord and Martins, 2006; Ramos and Peters, 2016).
The detection of lizard displays can be affected by the surrounding environment, as receivers need to filter out irrelevant environmental motion noise (Fleishman and Persons, 2001; Leal and Fleishman, 2002, 2004; Peters and Evans, 2003a; Peters, 2008). In the case of motion-based signaling lizards, the main source of motion noise is wind-blown plants (Fleishman, 1986; Peters and Evans, 2003a). Thus, motion-based signals are most effective when they stimulate the visual system of receivers in a way the noise environment does not (Fleishman, 1992). This means that the motion produced by the signal needs to contrast with the motion generated by the plants surrounding it (Endler, 1991; Fleishman, 1992; Peters et al., 2007; Bian et al., 2019). Additionally, the noise environment is site specific as it stems from the individual plants present and the topography of the area (Peters et al., 2008; Peters, 2013). Consequently, local adaptations to overcome noise and enhance signal efficacy should be expected in species occupying structurally distinct habitats. Within species variability of this kind has been observed (Ramos and Peters, 2017b), but data across species are limited.
We wished to examine whether environmental effects can be detected across multiple Australian agamid lizard species, controlling as much as possible for shared ancestry and differences in morphology. There are 14 genera of agamid lizards in Australia (Wilson and Swan, 2017), from which Ctenophorus is the most diverse (N = 29; McLean et al., 2013; Wilson and Swan, 2017; Dong et al., 2021) and has the highest number of known signaling species (N = 18; Ramos and Peters, 2016; Dong et al., 2021). Some of the most interesting species within the genus in terms of their social behavior belong to the Ctenophorus decresii complex, which consists of six closely related species (Figure 1; McLean et al., 2013): the tawny dragon (C. decresii), the peninsula dragon (C. fionni), the Barrier Range dragon (C. mirrityana), the swift rock dragon (C. modestus), the ochre dragon (C. tjantjalka), and the red-barred dragon (C. vadnappa). A recent study elevated the two lineages of C. decresii into distinct species, C. decresii as the southern lineage (Mount Lofty Ranges, Fleurieu Peninsula and Kangaroo Island in South Australia; Dong et al., 2021) and C. modestus as the northern lineage (Flinders Ranges and Olary Ranges, in South Australia; Dong et al., 2021). These species are sexually dimorphic, and the males usually display bright and conspicuous coloration during the breading season (Gibbons, 1979; McLean et al., 2013). They are also very similar in size, with C. tjantjalka possessing the smallest snout vent length (73 mm; Wilson and Swan, 2017) and C. decresii the largest (96 mm; Wilson and Swan, 2017). All members of the complex are dorsoventrally flattened and long-limbed; both of which are adaptations to their rocky habitats (for detailed descriptions of all species in the complex see Gibbons, 1977; Gibbons, 1979; Johnston, 1992; McLean et al., 2013; Dong et al., 2021). The six species in the C. decresii complex are territorial, and perform aggressive stereotyped motion displays against intruders (Gibbons, 1979; Osborne, 2005; McLean et al., 2013; Ramos, 2017). These displays can be divided in three sequential phases (Gibbons, 1979): lowering of dewlap and limb waves, hind leg push ups with tail coiling and head bobbing. While superficially similar, the displays performed by three members of the complex have been reported to differ both inter- and intra- specifically in speed, amplitude and number of repetitions of individual motor patterns (Gibbons, 1979). Additionally, it has been suggested that these differences could aid in taxonomic differentiation at the species level (Gibbons, 1979).
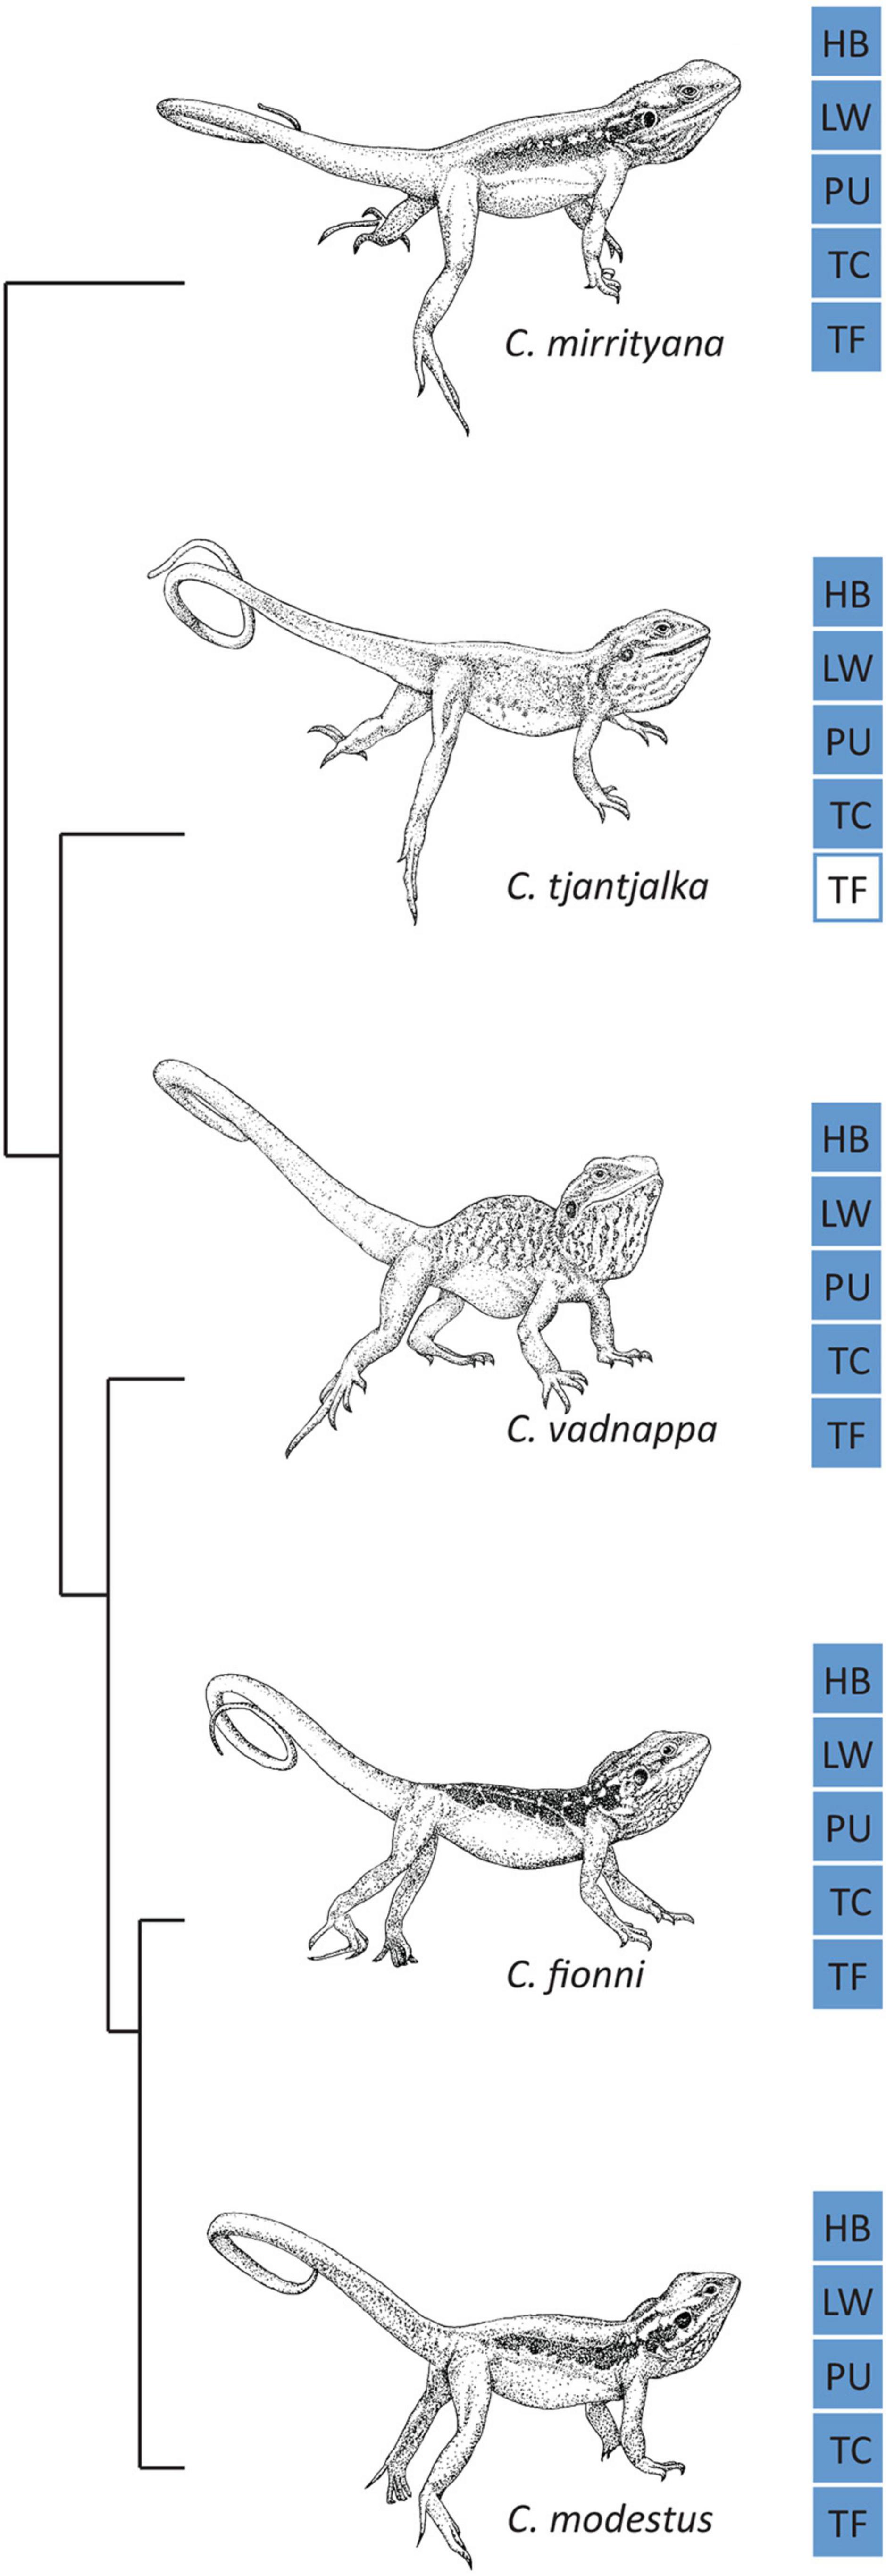
Figure 1. The five species in the Ctenophorus decresii complex included in this study. Ctenophorus decresii is absent due to the recent elevation of its two divergent lineages to distinct species: C. decresii and C. modestus (Dong et al., 2021). Phylogeny is shown on the left (adapted from McLean et al., 2013, with C. modestus as C. decresii) and core motor patterns are shown for each species on the right: HB, head bobs; LW, limb waves; PU, push ups; TC, tail coil; TF, tail flick. Blue squares represent known motor patterns, and white squares represent motor patterns that have not been reported.
Our aim was to explore the signaling behavior of the C. decresii complex to determine whether potential environmental differences would be manifested as differences in signal structure. Our fieldwork preceded the recent reclassification of C. decresii and thus focuses on 5 of the 6 species (excluding C. decresii). This is an ideal group to examine this aim as they are closely related, morphologically similar and utilize signals that are superficially the same. However, they occupy slightly different microhabitats, and their signals have not been subjected to detailed analysis or comparison. Consequently, we address our aim by asking three underlying questions:
1. How similar are the signals of the five species?
2. How similar are the microhabitats of the five species?
3. How effective are the signals of each species in all habitats?
Our work was undertaken in the field and involved locating and filming unrestrained wild animals in situ, then carefully documenting the microhabitats in which signaling takes place. We have combined broad level analysis of the temporal structure and use of male territorial displays, with detailed quantification of displays following the approach described by Ramos and Peters (2017b), which involves reconstructing lizard display motion in three dimensions (3D) and comparing it to the noise environment to calculate signal contrast. By recording the signals and the relevant features of the noise environment independently, we are able to assess the performance of each species at the habitats of the other members of the C. decresii complex without physically translocating the lizards. We hypothesize that signaling displays will reflect the shared ancestry of the five species to some extent, but the details will differ in a manner that is linked to local signaling conditions.
Materials and Methods
Data Collection
We recorded territorial displays from C. fionni, C. mirrityana, C. modestus, C. tjantjalka, and C. vadnappa at different locations in New South Wales and South Australia, Australia, between 2012 and 2017 (see Table 1 for details). Data available for C. tjantjalka is limited due to the difficulty we encountered in locating this species and filming interactions. The display footage we report on herein for C. tjantjalka represents the only record for this species. In order to elicit these displays from free living male lizards, a tethered conspecific intruder was introduced to their territory at a distance of approximately 1 m from the resident. The displays were recorded using a dual camera approach following Hedrick (2008) and Peters et al. (2016), which allowed us to reconstruct lizard motion in 3D. The habitat of the signaling lizard was mapped and characterized in detail by identifying and filming the plants that constituted a source of motion noise under artificially created standardized windy conditions of 4 m/s (see Ramos and Peters, 2017b). As part of this process, signaler-plant distances were recorded for all relevant plants.
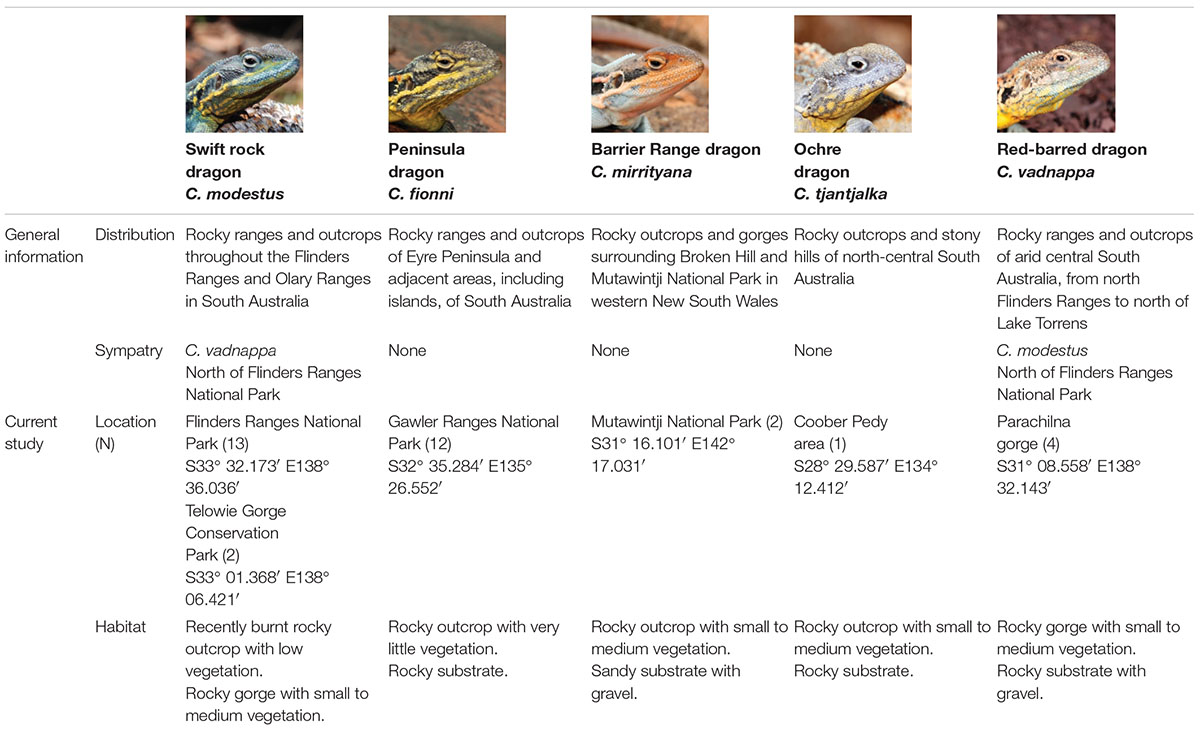
Table 1. General information and current study information for all species belonging to the Ctenophorus decresii complex included in this study.
Display Analysis
Display sequences were analyzed using Observer XT (Noldus Inc.) by recording the start and end point of each individual motor pattern during the displays of all species. We then used these data to describe motor pattern use in terms of duration and total number of motor pattern events. Coefficients of variation within (CVW) and between (CVB) species were computed to determine if any of these variables differed between the members of the complex. The ratio of CVB/CVW provides a measure of the relative coefficient of variation between and within species, where CVW is the average of CVW for all species. When the ratio CVB/CVW is greater than 1, there is more variation between species than within species. We also explored variation in motor pattern use graphically using glyph plots in Matlab (Mathworks Inc.). We used the glyphplot function to define each glyph, and positioned them in space based on non-metric multidimensional scaling of the dissimilarity matrix of our set of display characteristics. Additionally, display sequence information was used to calculate transition probabilities for the motor patterns employed, as well as changes in body position and periods of being stationary during the displays.
Lizard and Plant Motion
Our approach for quantifying signal structure and environmental noise is explained in detail elsewhere (see Ramos and Peters, 2017b; Supplementary Figure 1). Briefly, in order to reconstruct the displays in 3D as x-y-z coordinates, several points along the body of the lizards were digitized in the footage from both cameras. These points corresponded to body parts commonly used during territorial displays, and included the eye (head bobs), both fore limbs (limb waves), and the base of the tail (four-legged push ups). The information from both cameras was then combined using direct linear transformation in Matlab. Once signal motion was reconstructed in 3D, angular speeds at a viewing distance of 1 m were computed as described by Ramos and Peters (2017b), and summarized for all motor patterns in the display individually, and for the display as a whole (all motor patterns combined). We used the ksdensity function in Matlab to generate a vector of relative probability at different angular speeds (kernel density estimates).
The motion generated by wind-blown plants in 5 s of footage (125 frames; 25 frames/s) was quantified using a gradient detector model (Peters et al., 2002). The output from the models comprises direction and magnitude of movements in the image sequences. We retained the magnitude component as a measure of speed and converted from units of pixels to cm using an object of known size in the frame from the plant footage. Comparing lizard displays against the movement of the whole plant would not reflect the motion segmentation task of receivers (see Ramos and Peters, 2017b), so we divide the plant motion output into subregions, and calculated the angular speed vector (kernel density estimate) for each of these subregions, using a viewing distance of 1 m plus the signaler-plant distance for the respective plant. This was repeated for all plants in the scene.
Signal—Noise Analysis
Our goal with this analysis was to determine how well the signals of each species performs compared with other species in the complex, and also to identify the habitats that are more likely to negatively affect motion signals due to their motion noise properties. We have described fully our rationale and approach to quantifying signal contrast elsewhere (see Ramos and Peters, 2017b), and present below a summary of our method (see Figure 2). Angular speeds from lizard displays (Figure 2A) and plant motion (Figure 2D) were quantified separately as described above. For each subregion of a given plant, the angular speed vector (kernel density estimate) for plant motion was subtracted from that of the lizard display to produce a difference curve (Figure 2G). Integrating this difference curve for all values greater than zero (i.e., lizard movement greater than plant motion at that angular speed) provides a value (0–1) representing the probability that lizard movement differs from plant movement. A score close to 1 implies lizard movement is greater than plant movement, while a score of 0 indicates the reverse. This was then repeated for all subregions of the plant. The values obtained from all subregions of a given lizard-plant combination were summarized by obtaining the median as a measure of central tendency (location), as well as a measure of the spread of the data. To represent this spread, we used the scale parameter rather than other measures of variance as it is more suited to non-normal distributions. A higher scale value suggests that lizard displays contrast strongly against parts of the plant, but relatively poorly against other parts because movement is not uniformly distributed across the plant. We refer to location and scale values collectively as contrast scores, and computed these for each lizard and each plant in all habitats (Figure 2I). So, we obtained contrast scores for each species at their own microhabitat, as well as all other microhabitats inhabited by their own and other species. Regardless of which lizard was considered in a given microhabitat, all lizards were positioned in the scene at the same location as the inhabitant of the given microhabitat. As such, signaler-plant distances were constant for a given microhabitat.
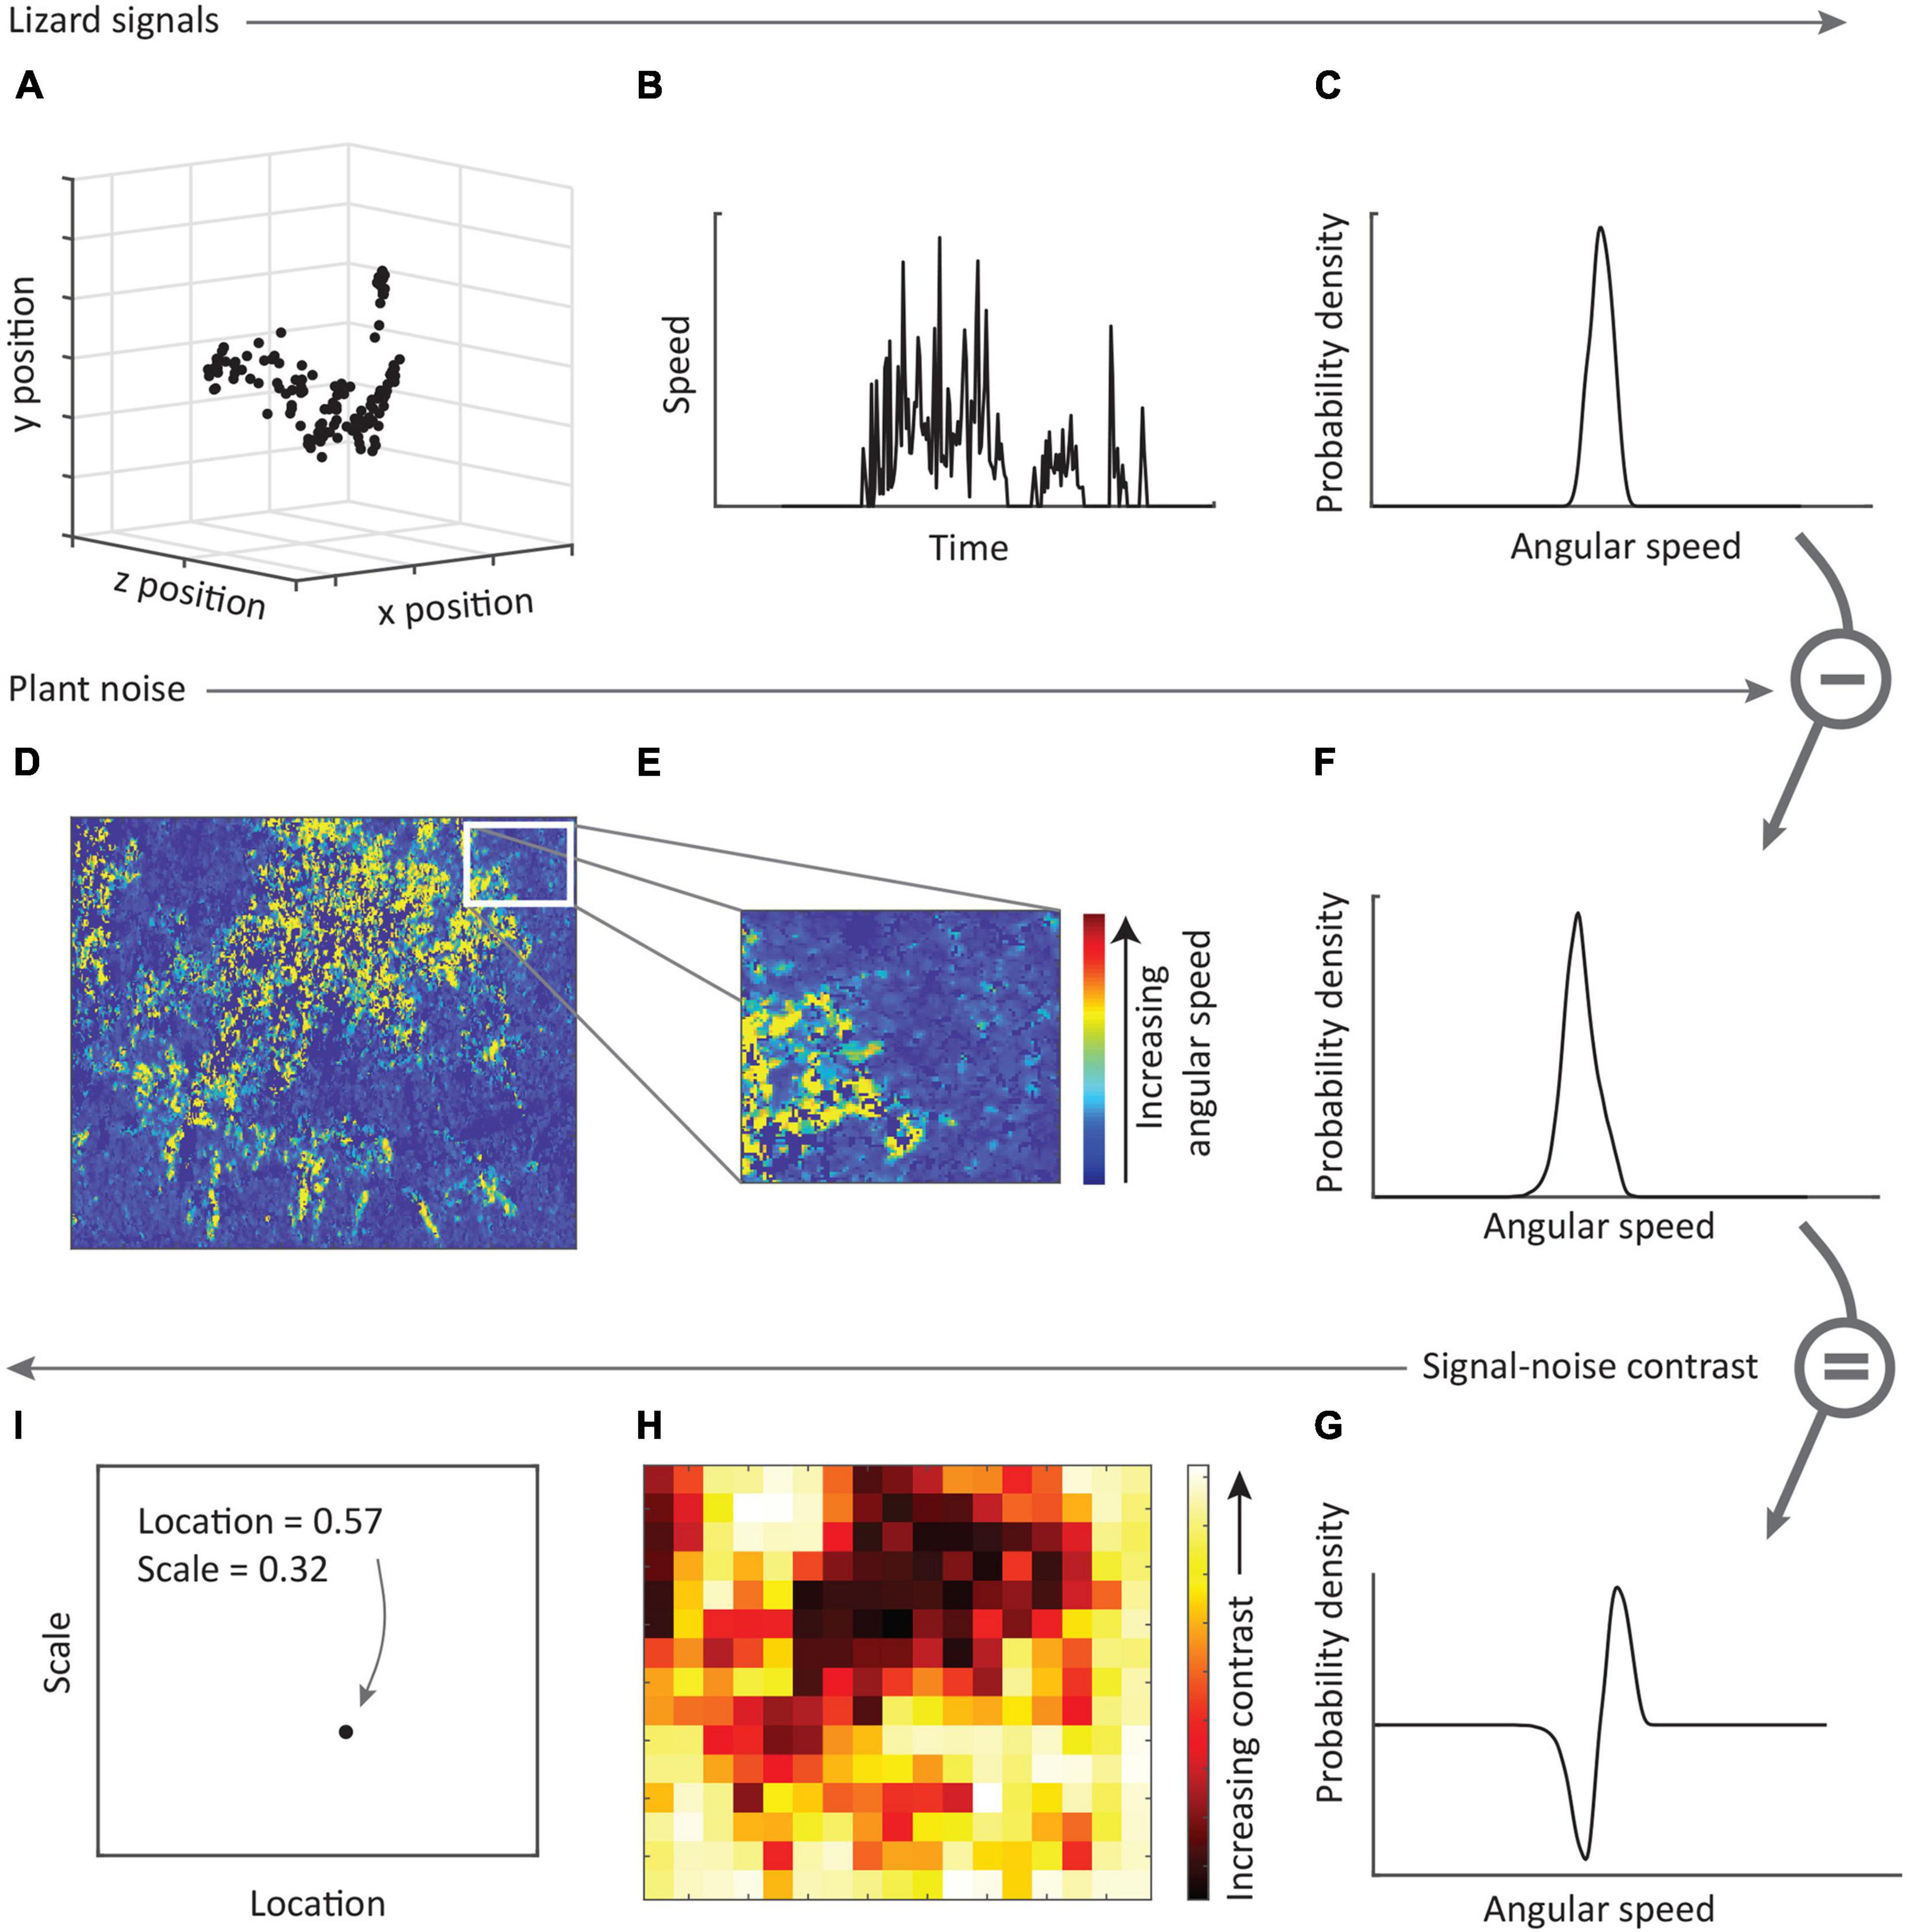
Figure 2. A summary of the approach used to compare lizard signals with plant noise. (A) Lizard displays are digitized to generate x-y-z coordinates representing the position of a given feature in 3D space (see text). (B) Speeds are calculated from the change in position of the feature over time, and (C) probability density vector computed to yield the probability of occurrence of different angular speeds. (D) Footage of plant movement in response to wind is analyzed using gradient detectors (see text) resulting in estimates of velocity, from which we retain the magnitude (speed) of movement. (E) Sub-regions of these plant speeds are selected and the probability density vector computed (F). (G) The density vector for plant movements is then subtracted from the density vector for lizards to yield a difference vector, which was then integrated for all sections greater than zero to produce difference score in the range [0,1]. The process was repeated with the remaining subregions of the plant footage, resulting in a matrix of difference scores (H). (I) The median difference score (location) and a measure of the spread of difference scores (scale) was then computed to produce the final contrast score for this lizard display and plant.
Statistical Analyses
As outlined above, display sequences were analyzed by comparing coefficient of variation values of motor pattern use and computing transition probabilities between motor patterns. In addition, we compared the average speed of movement across species. The speed of movement was computed from the x-y-z coordinates (see above) as the change in position between successive frames (this represents the step prior to computing angular speeds and probability density functions for signal-noise contrast analysis described above). We calculated the average speed per display across all movements, and for movement of the eye, tail base and foreleg separately. Data were analyzed using the lm function in the R statistical environment (R Core Team, 2016) with species as the sole predictor variable and after square-root transformation of dependent variables. The number of plants in each microhabitat was analyzed using a generalized linear model (glm function) in R fitting a poisson error distribution, while variation in signaler-plant distances was analyzed using a linear mixed effects model using the lme function from the nlme package in R (Pinheiro et al., 2018), with species as a fixed effect and site as a random effect to account for multiple plants at a given site. Signal contrast scores were obtained against each plant in each habitat and a convex hull was computed for each display x habitat combination. Convex hulls were compared visually.
Results
How Similar Are the Displays?
To the naked eye, the male territorial displays of the five study species are remarkably similar. They all include the same motor patterns, as described by Gibbons (1979) for C. modestus (as C. decresii), C. fionni and C. vadnappa: limb waves, rear limb push ups and head bobs (Figure 1). Additionally, members of the complex seem to occasionally include tail flicks at the beginning of the displays in a way reminiscent of the introductory tail flick utilized by Amphibolurus muricatus (Peters and Evans, 2003b; Osborne, 2005; Peters et al., 2007).
Transition probabilities between motor patterns show very little differences between species (Figure 3). In general, displays of all species can begin with tail flicking, followed by a series of limb waves, then a period of push ups, often separated by additional limb waves, and finish with a series of head bobs. Lizards might then change position and repeat the process. This sequence matches the phases described by Gibbons (1979), although it does not apply to every single display, and it is not uncommon for individual motor patterns to be absent from a given display. Tail flicking for example, is only rarely used by each species. Pauses in motion and shifts in position are also often observed in between motor patterns (Figure 3), which adds to the behavioral complexity previously described for the group. Notwithstanding small differences, the overall sequences are similar for all species.
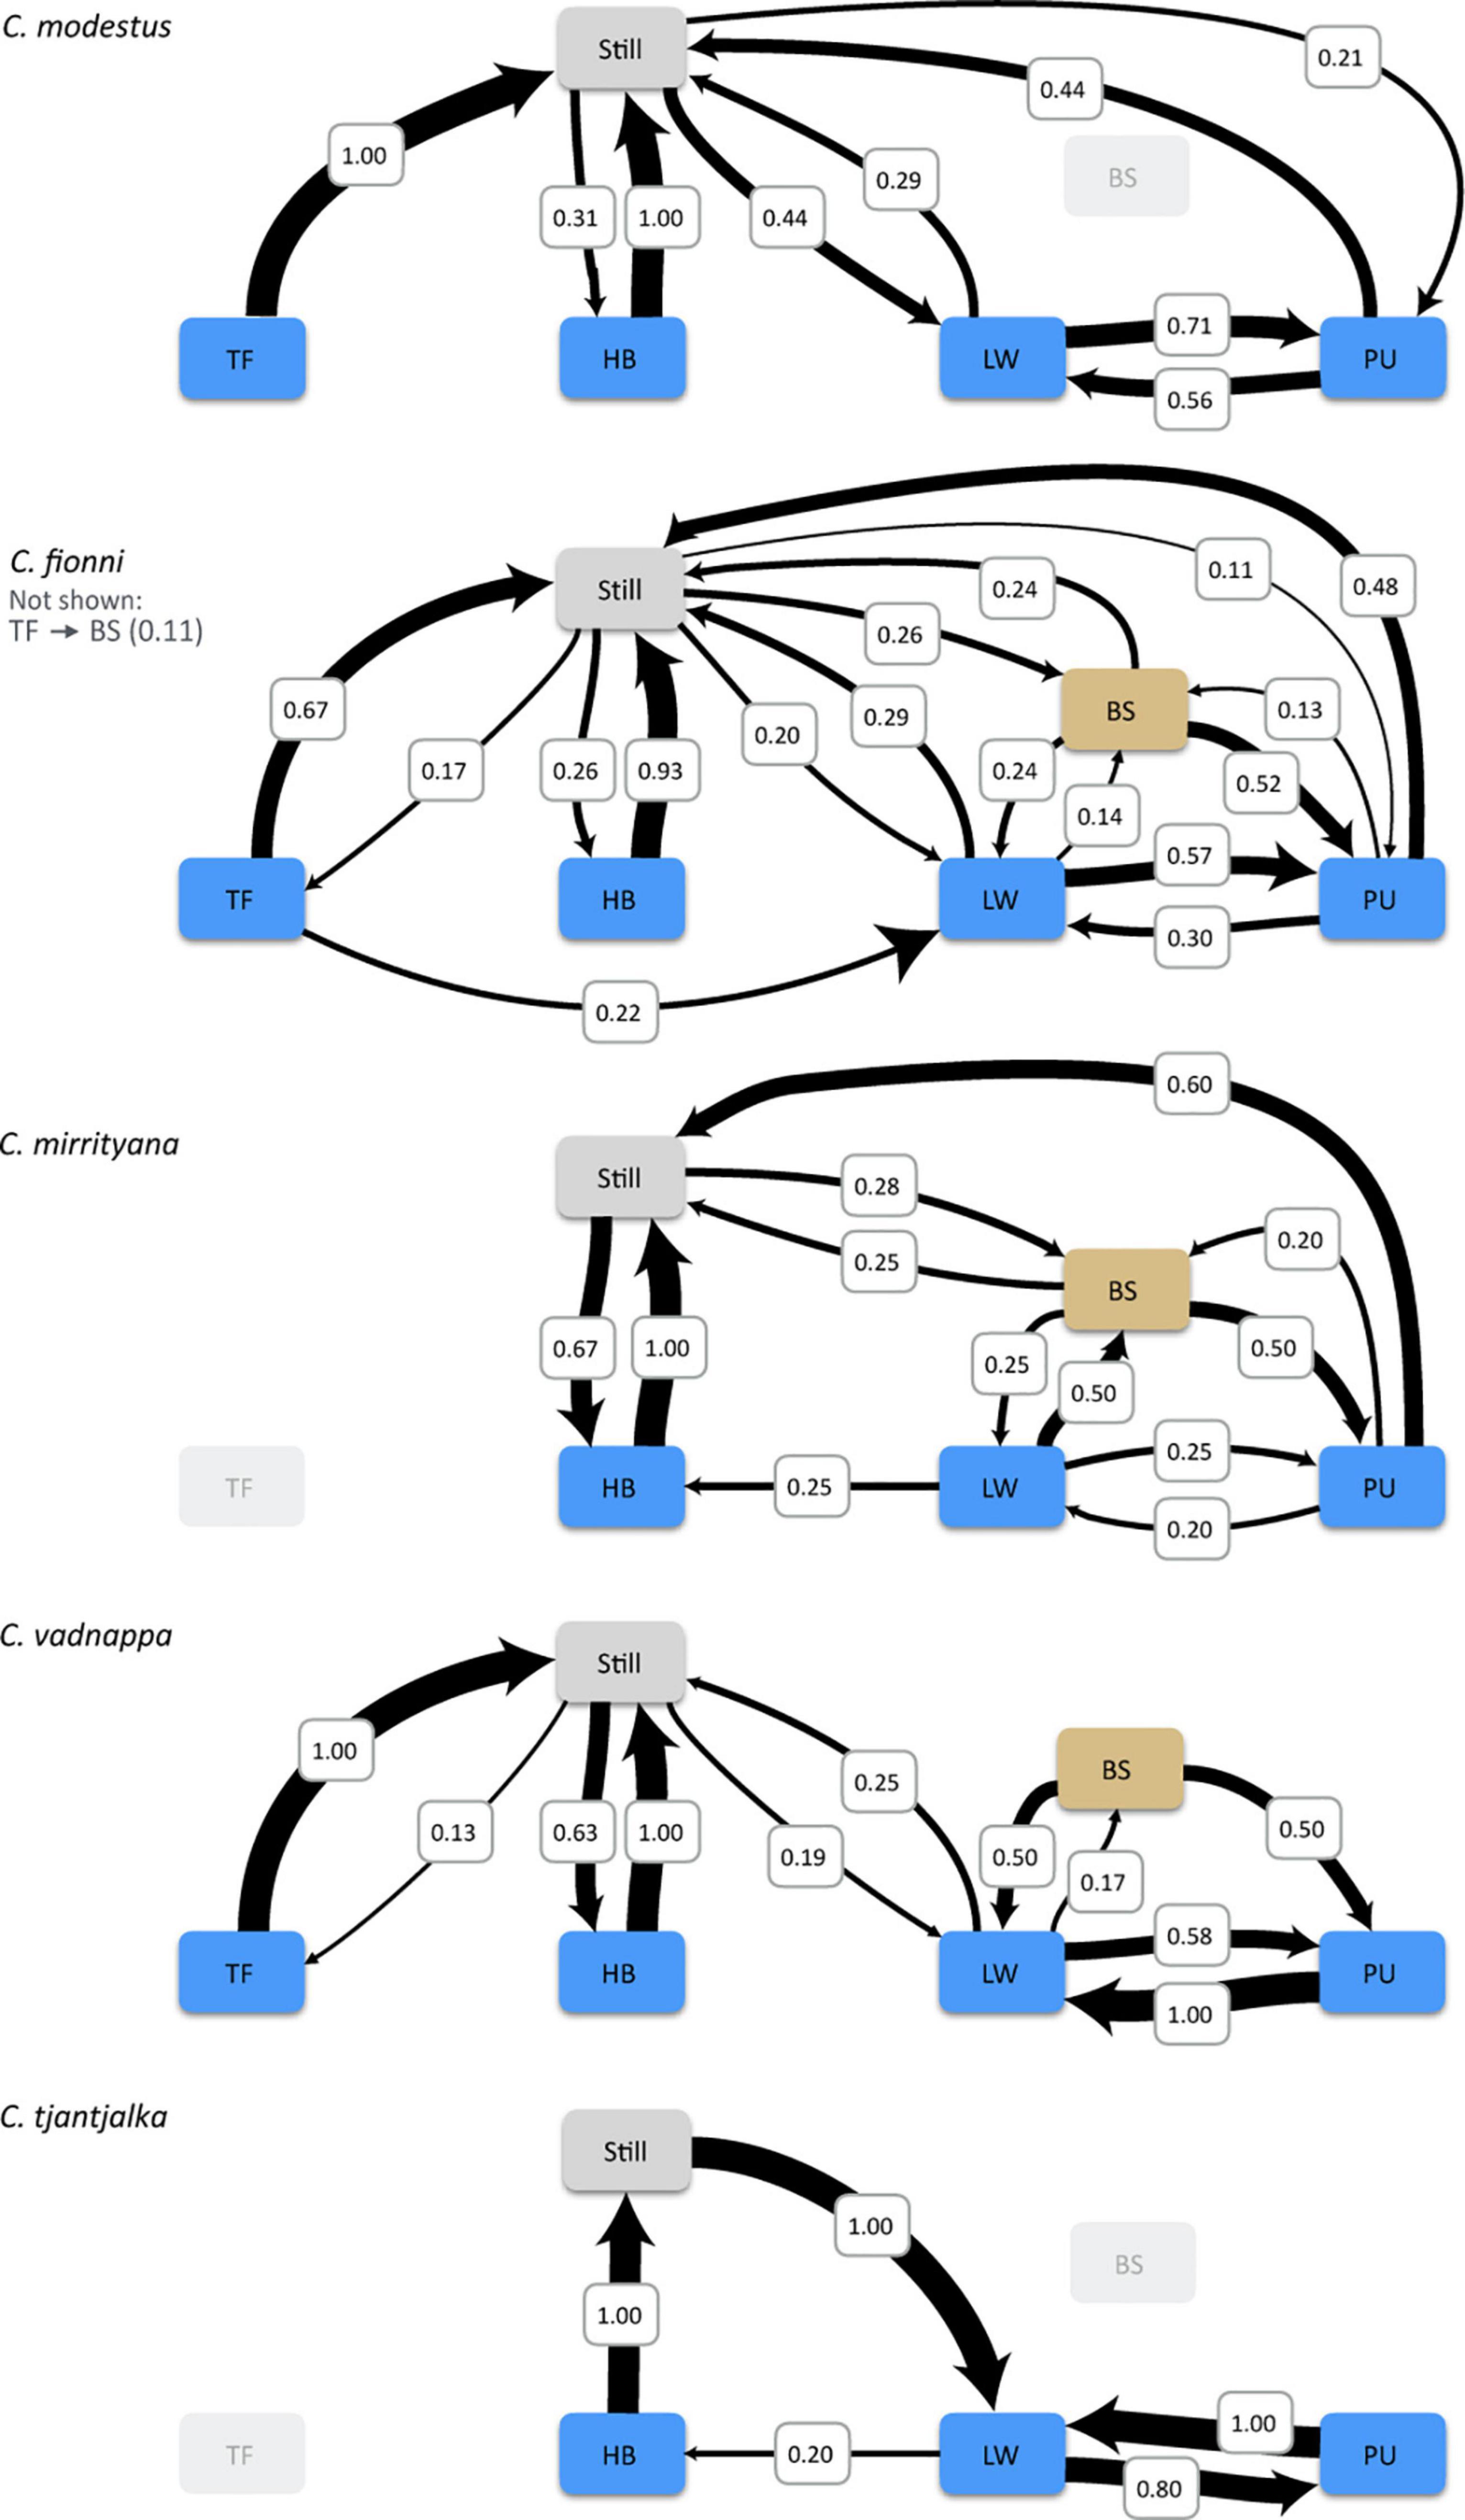
Figure 3. Transition probabilities belonging to the territorial displays of the five study species. The plots illustrate the sequence in which motor patterns (HB, head bob; LW, limb wave; PU, push up; TF, tail flick) and body switch (BS; change in position) are used during the display and the probability that one motor pattern will occur after another. All sequences start from a still position. Tail flicking is known to occur in C. mirrityana but was not observed during the analyses.
However, variation does exist in motor pattern use at the finer scale. The frequency of use and duration of each motor pattern is summarized in Table 2. Coefficients of variation (CVs) revealed that the number of head bobs used during a display is almost twice as variable between species as it is within species. Similarly, the ratio of between and within CVs for both head bob and push up durations suggest between species variability, albeit to a slightly lesser extent than the number of head bobs used. Figure 4 provides a graphic representation of these data and the differences between species. Here, values for each parameter are used as vertices in glyph plots, which are then presented in multi-dimensional space to further highlight similarities/dissimilarities (Figure 4). Ctenophorus modestus, C. fionni, and C. vadnappa are considered more similar, with C. mirrityana and C. tjantjalka being differentiated from them. Interestingly, relative placements within the multi-dimensional space appear to reflect underlying phylogenetic relationships.
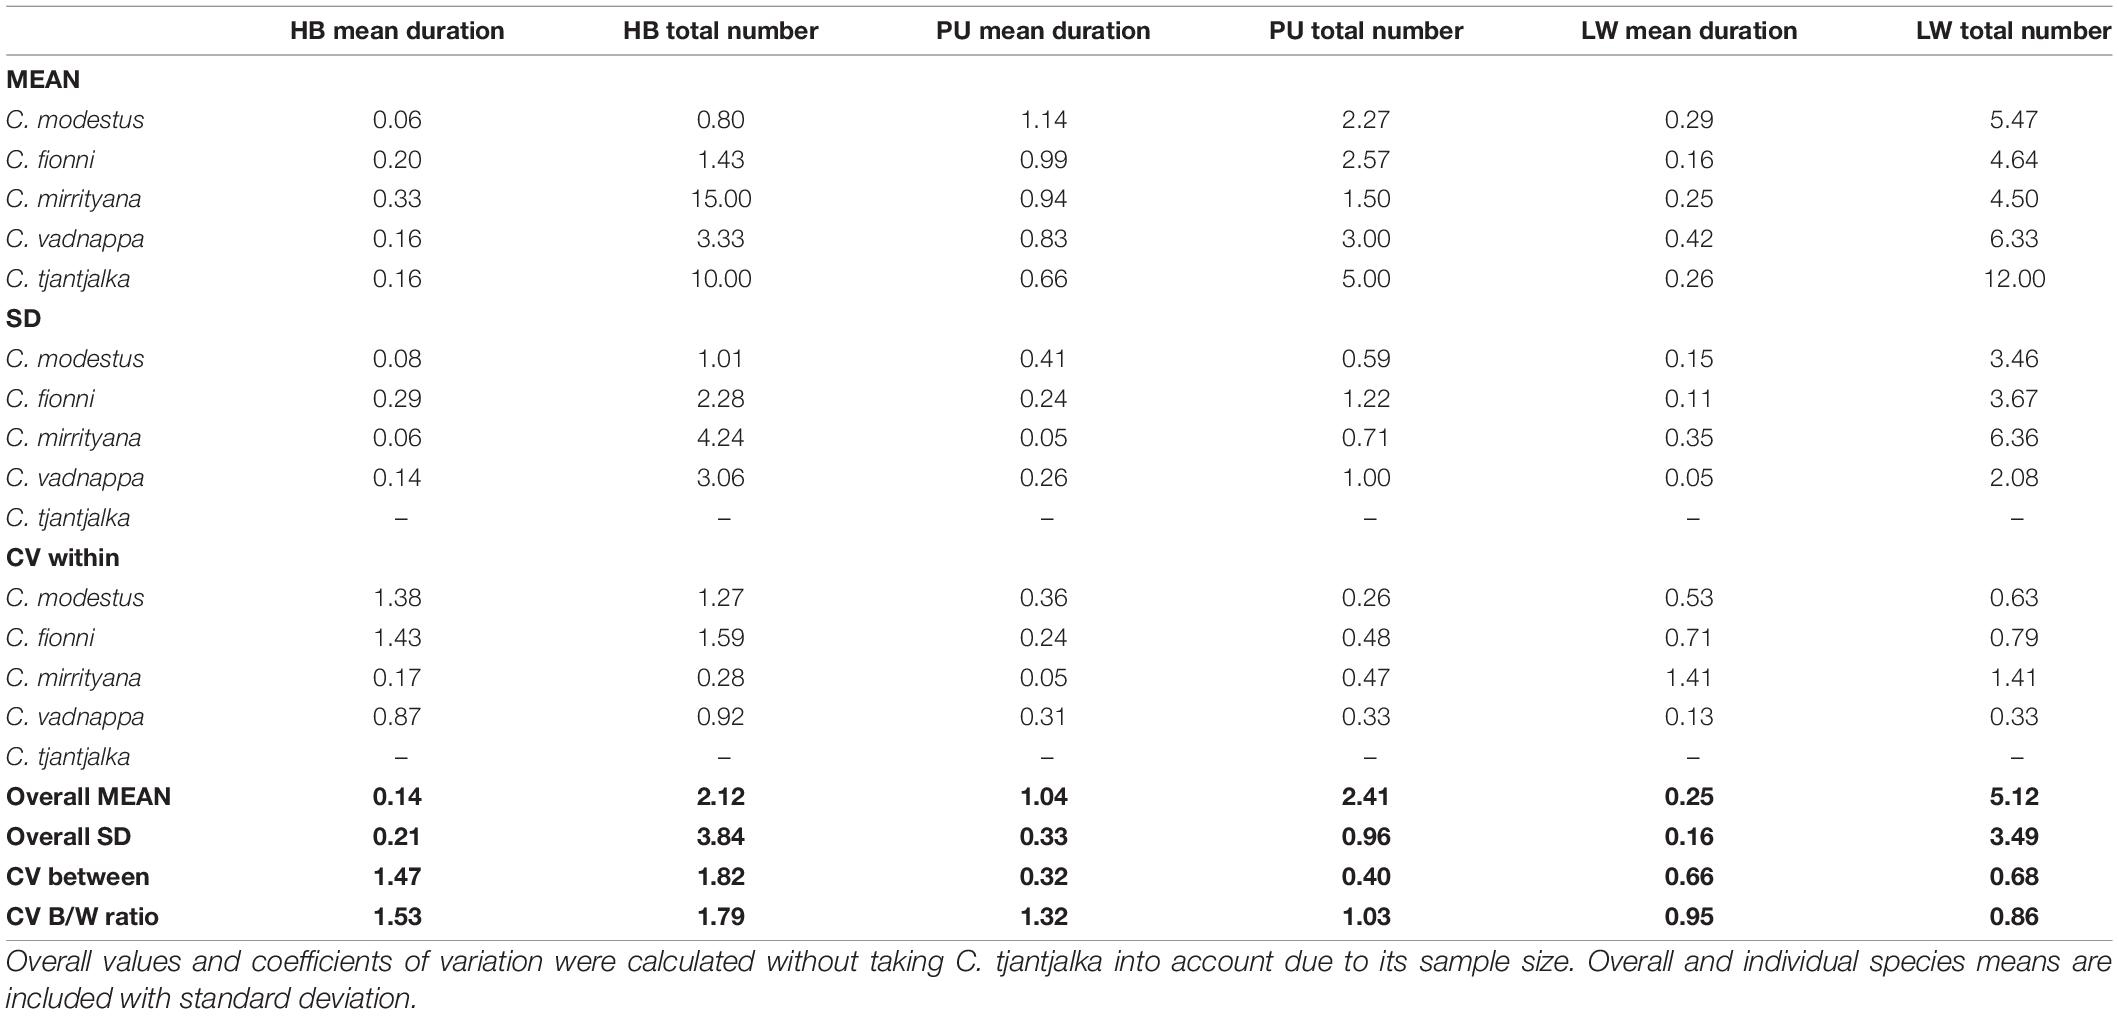
Table 2. Coefficients of variation calculated within and between species for mean duration and total number of motor pattern events (HB, head bobs; PU, push ups; LW, limb waves).
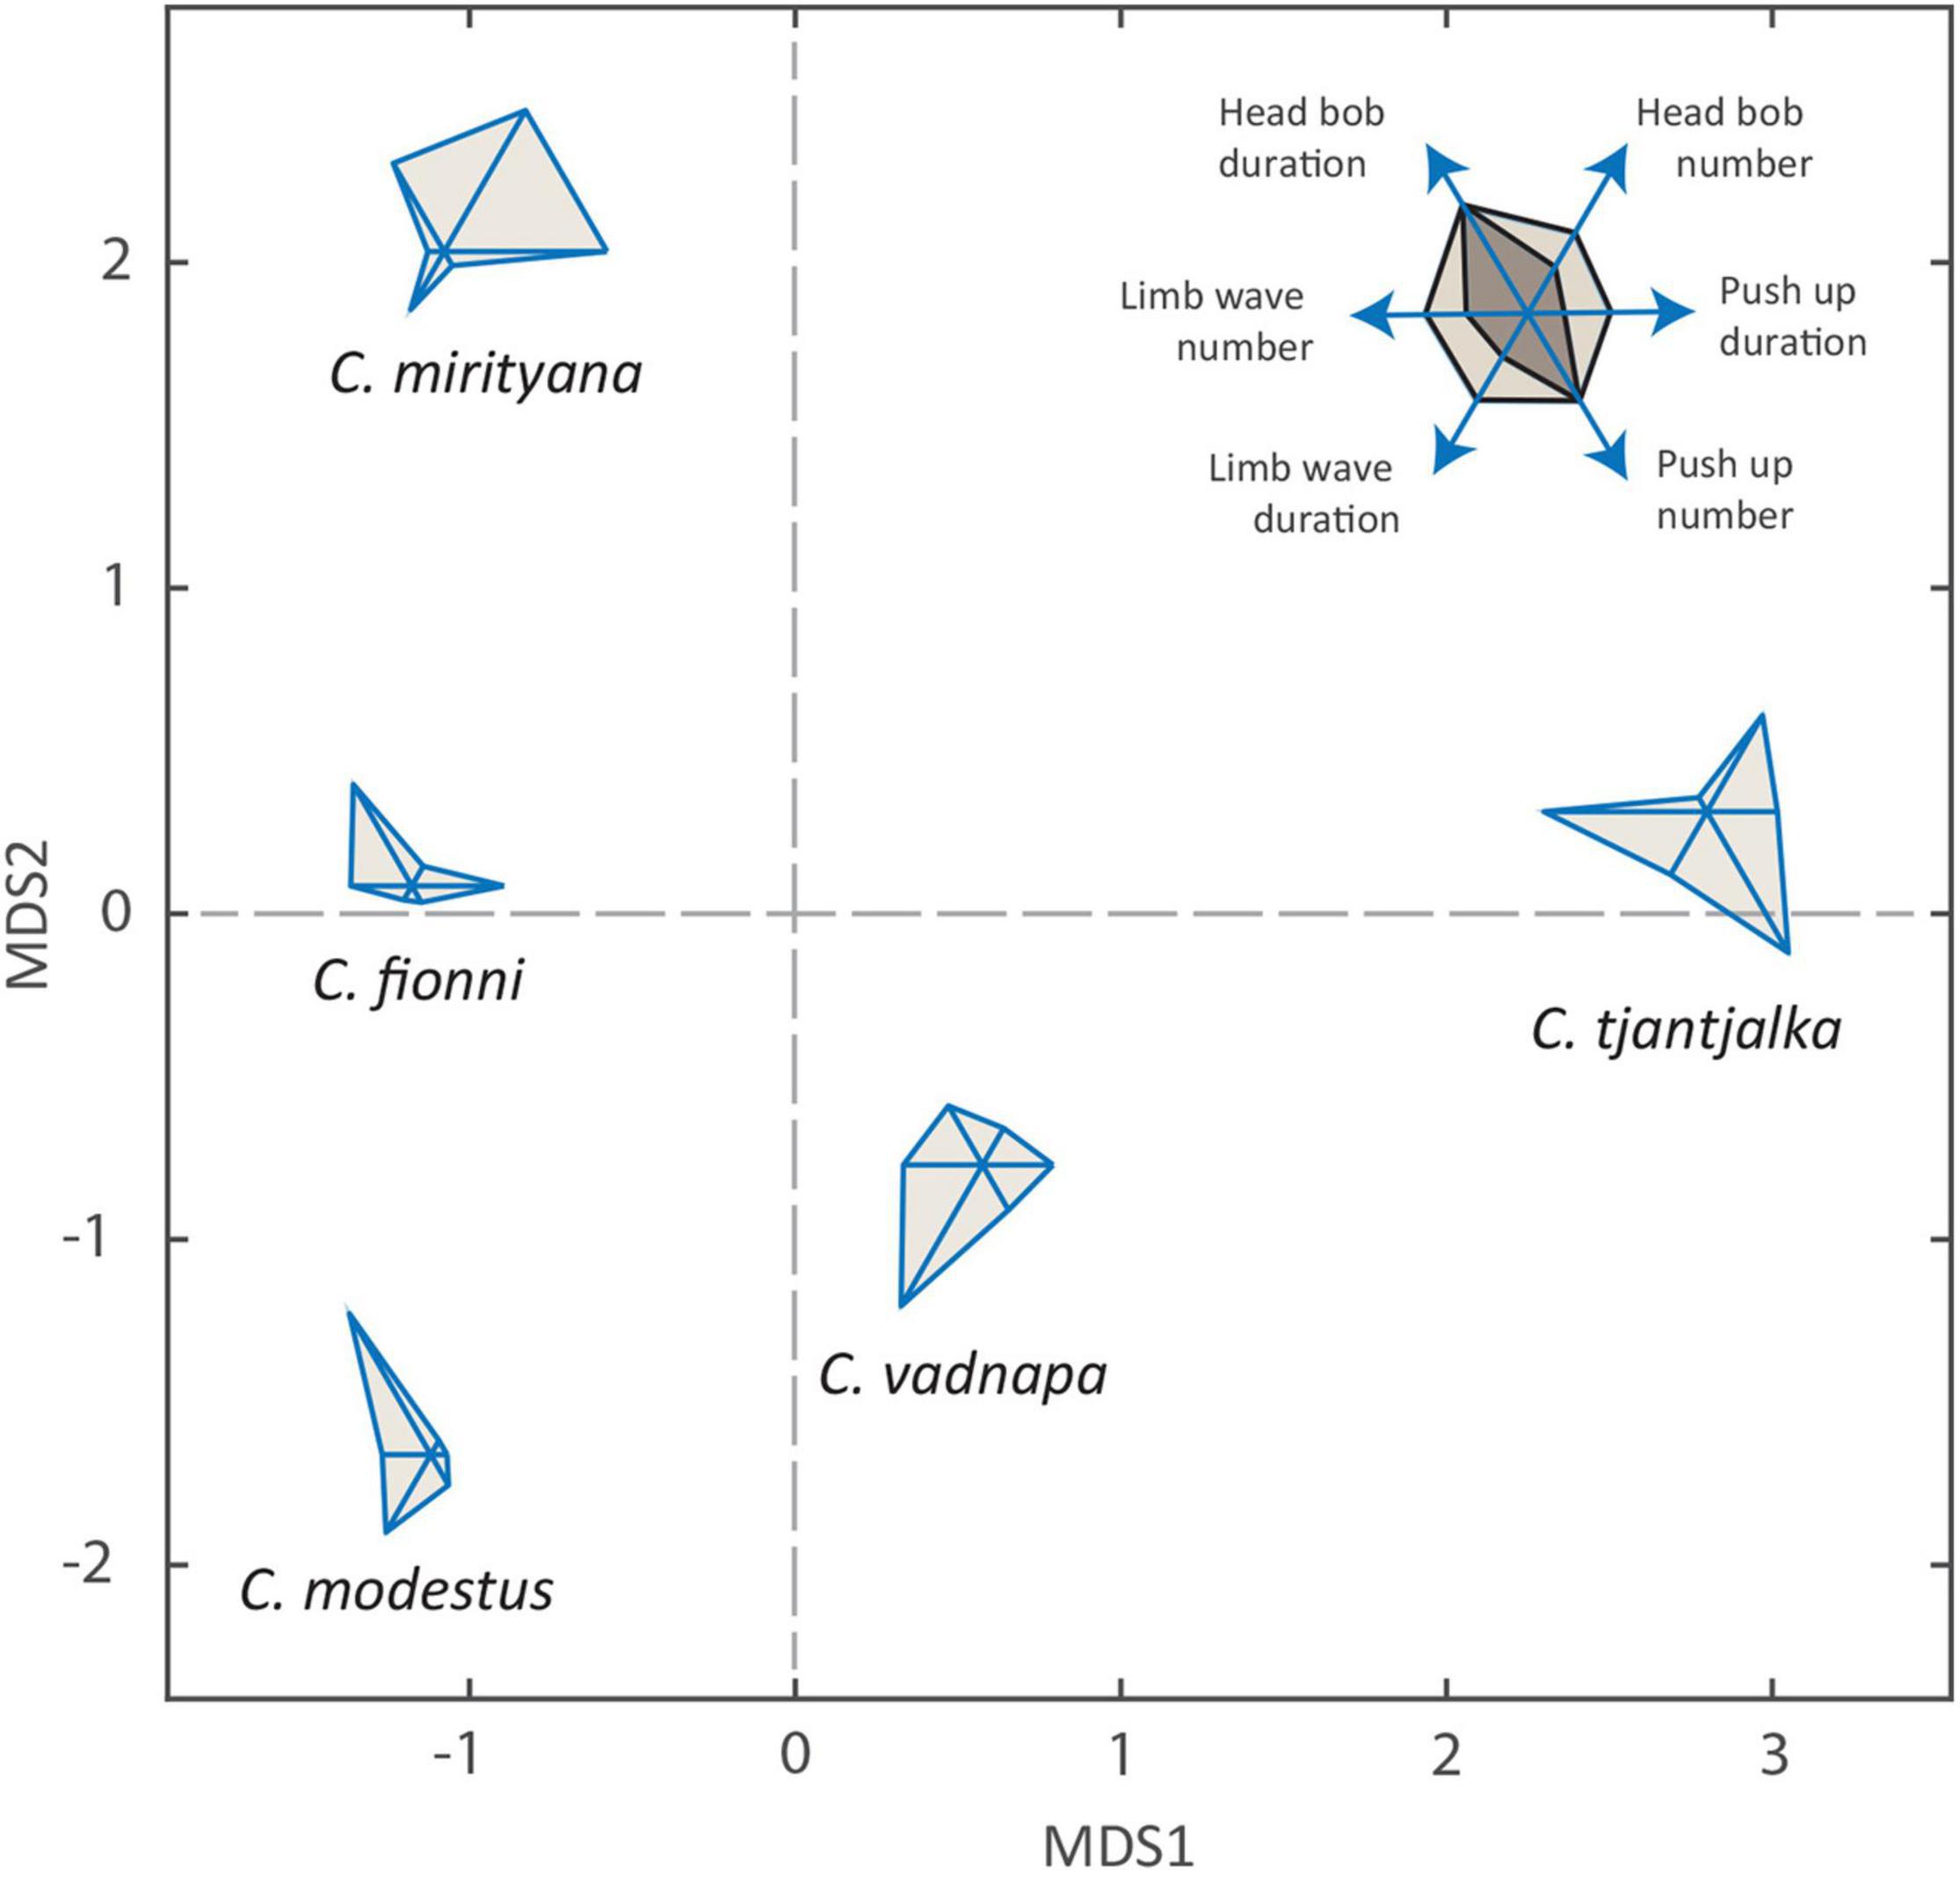
Figure 4. Glyph plots and multidimensional scaling showing the level of similarity between the five study species based on six variables: head bob mean duration, head bob total number, push up mean duration, push up total number, limb wave mean duration and limb wave total number. Inset Mapping of each variable to points on the glyph plot, with two hypothetical examples: the darker shade is equivalent to the lighter shade in head bob duration and number of push ups, but performs half the number of head bobs and leg waves, and spends half as long on push ups and leg waves.
The average speed of movement across all motor patterns is shown in Figure 5 and was found to differ significantly across species (Table 3). Ctenophorus vadnappa displays were significantly faster than C. mirrityana, C. fionni, and C. tjantjalka but equivalent to C. modestus. In addition, C. modestus was significantly faster than C. mirrityana and C. fionni but not quite reaching significance when compared with C. tjantjalka. Table 3 also reports results for each motor pattern separately. An effect of species was seen for movement measured at the eye, but not quite for the tail base or forelegs.
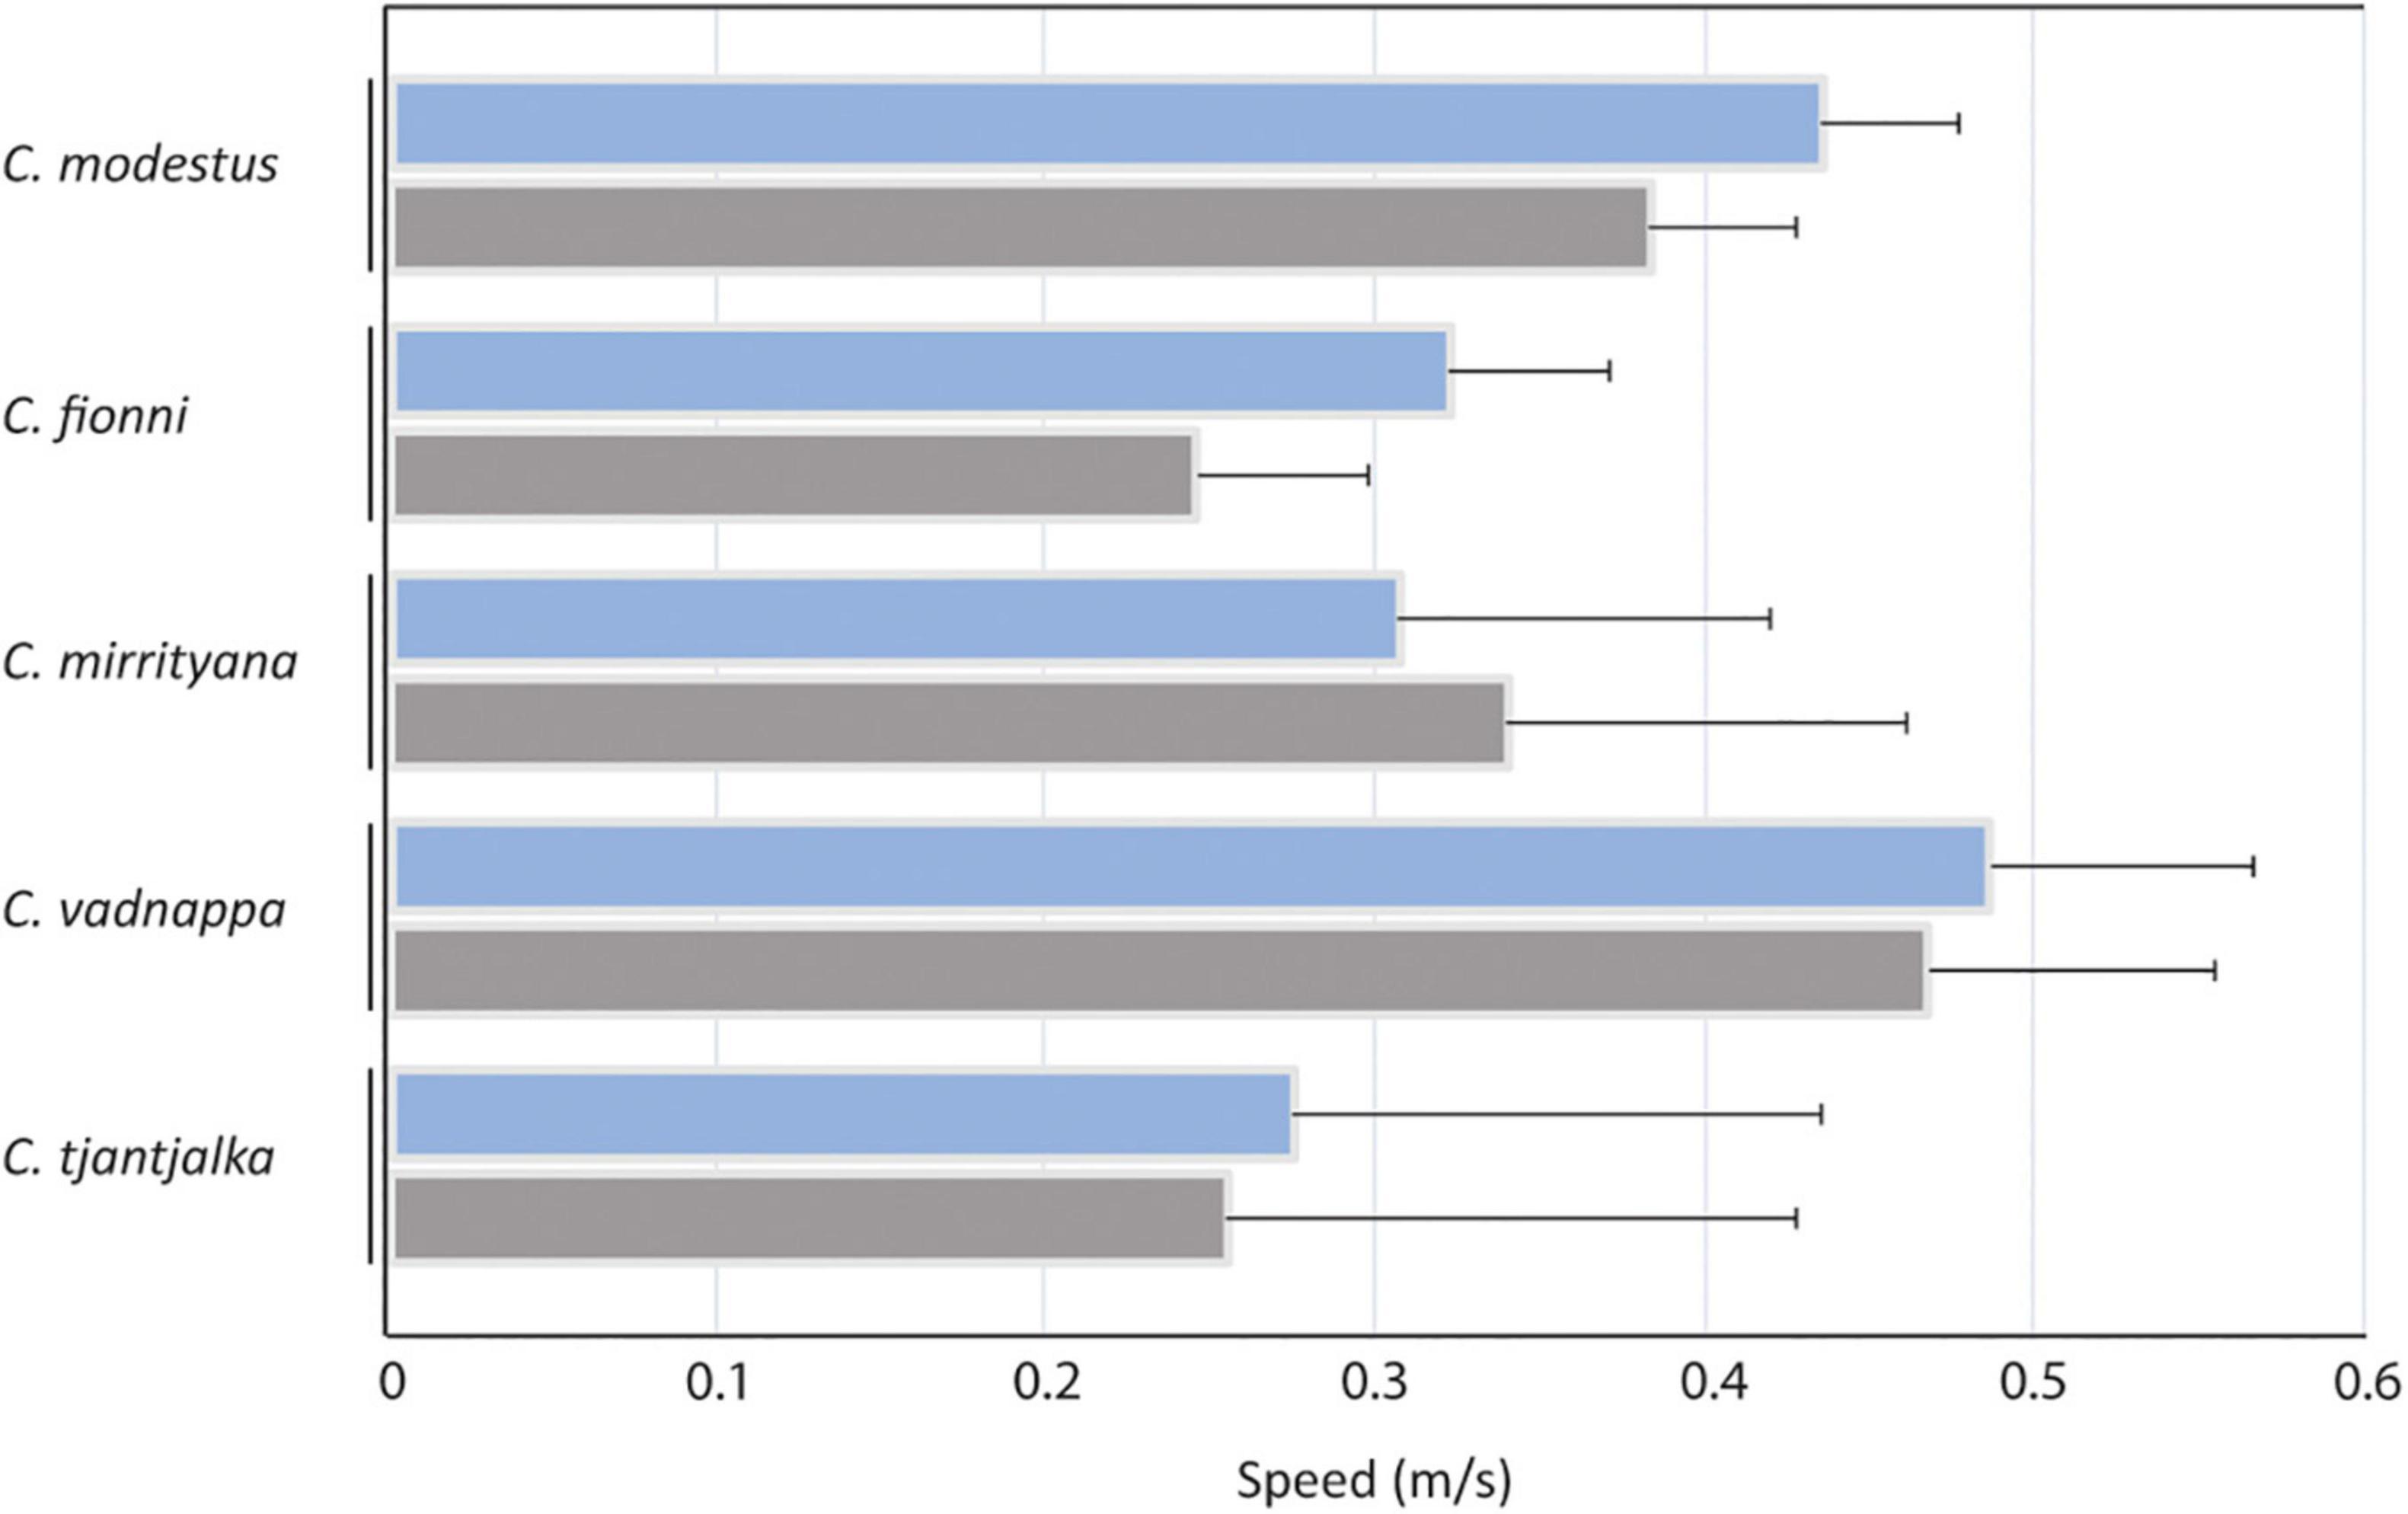
Figure 5. Comparisons of the motion speeds used by all species when all motor patterns are averaged (blue), and individually for head bobs (gray). Estimated marginal means, calculated from the linear model, are presented for C. modestus, C. fionni, C. mirrityana, C. vadnappa and C. tjantjalka. Error bars represent 95% confidence intervals.
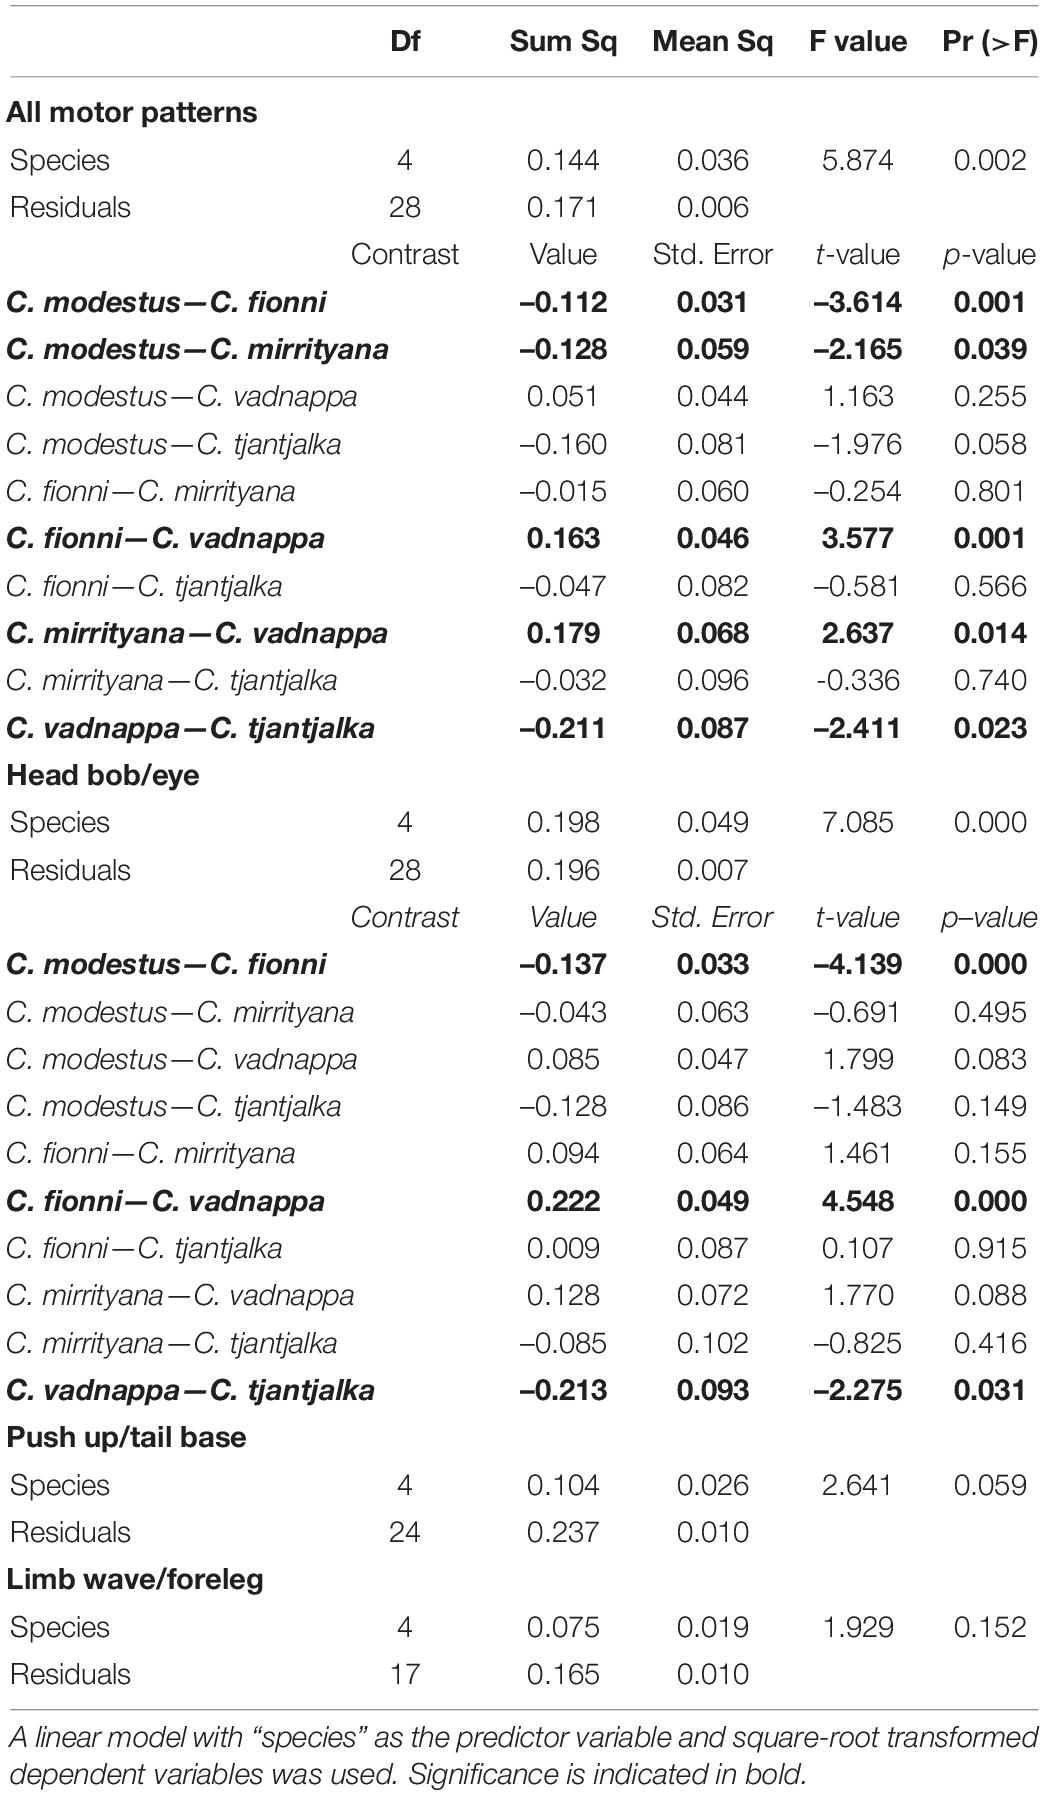
Table 3. Outcome of statistical models for speed of movement, showing the results for all motor patterns combined, and for individual motor patters.
How Similar Are the Microhabitats?
After mapping in detail the locations where the lizards performed their displays, it was clear that species occur in somewhat different plant environments. The signaling locations for C. modestus and C. vadnappa contained on average a greater number of noise producing plants than the locations for C. fionni and C. mirrityana (Figure 6). Furthermore, the signaler-plant distances were much larger for C. modestus and C. vadnappa than for the other species, and C. fionni appears to signal very close to plants when they are present in their territory (Figure 6). Generalized linear models and mixed effects models, respectively, were used to compare these differences and revealed significant differences across species (Table 4). Pairwise contrasts suggest fewer plants present in the microhabitats of C. fionni compared with C. modestus and C. vadnappa, while C. modestus also contained significantly more plants than C. mirrityana. Pairwise contrasts for signaler-plant distances revealed only that C. fionni was signaling significantly closer to plants than C. modestus.
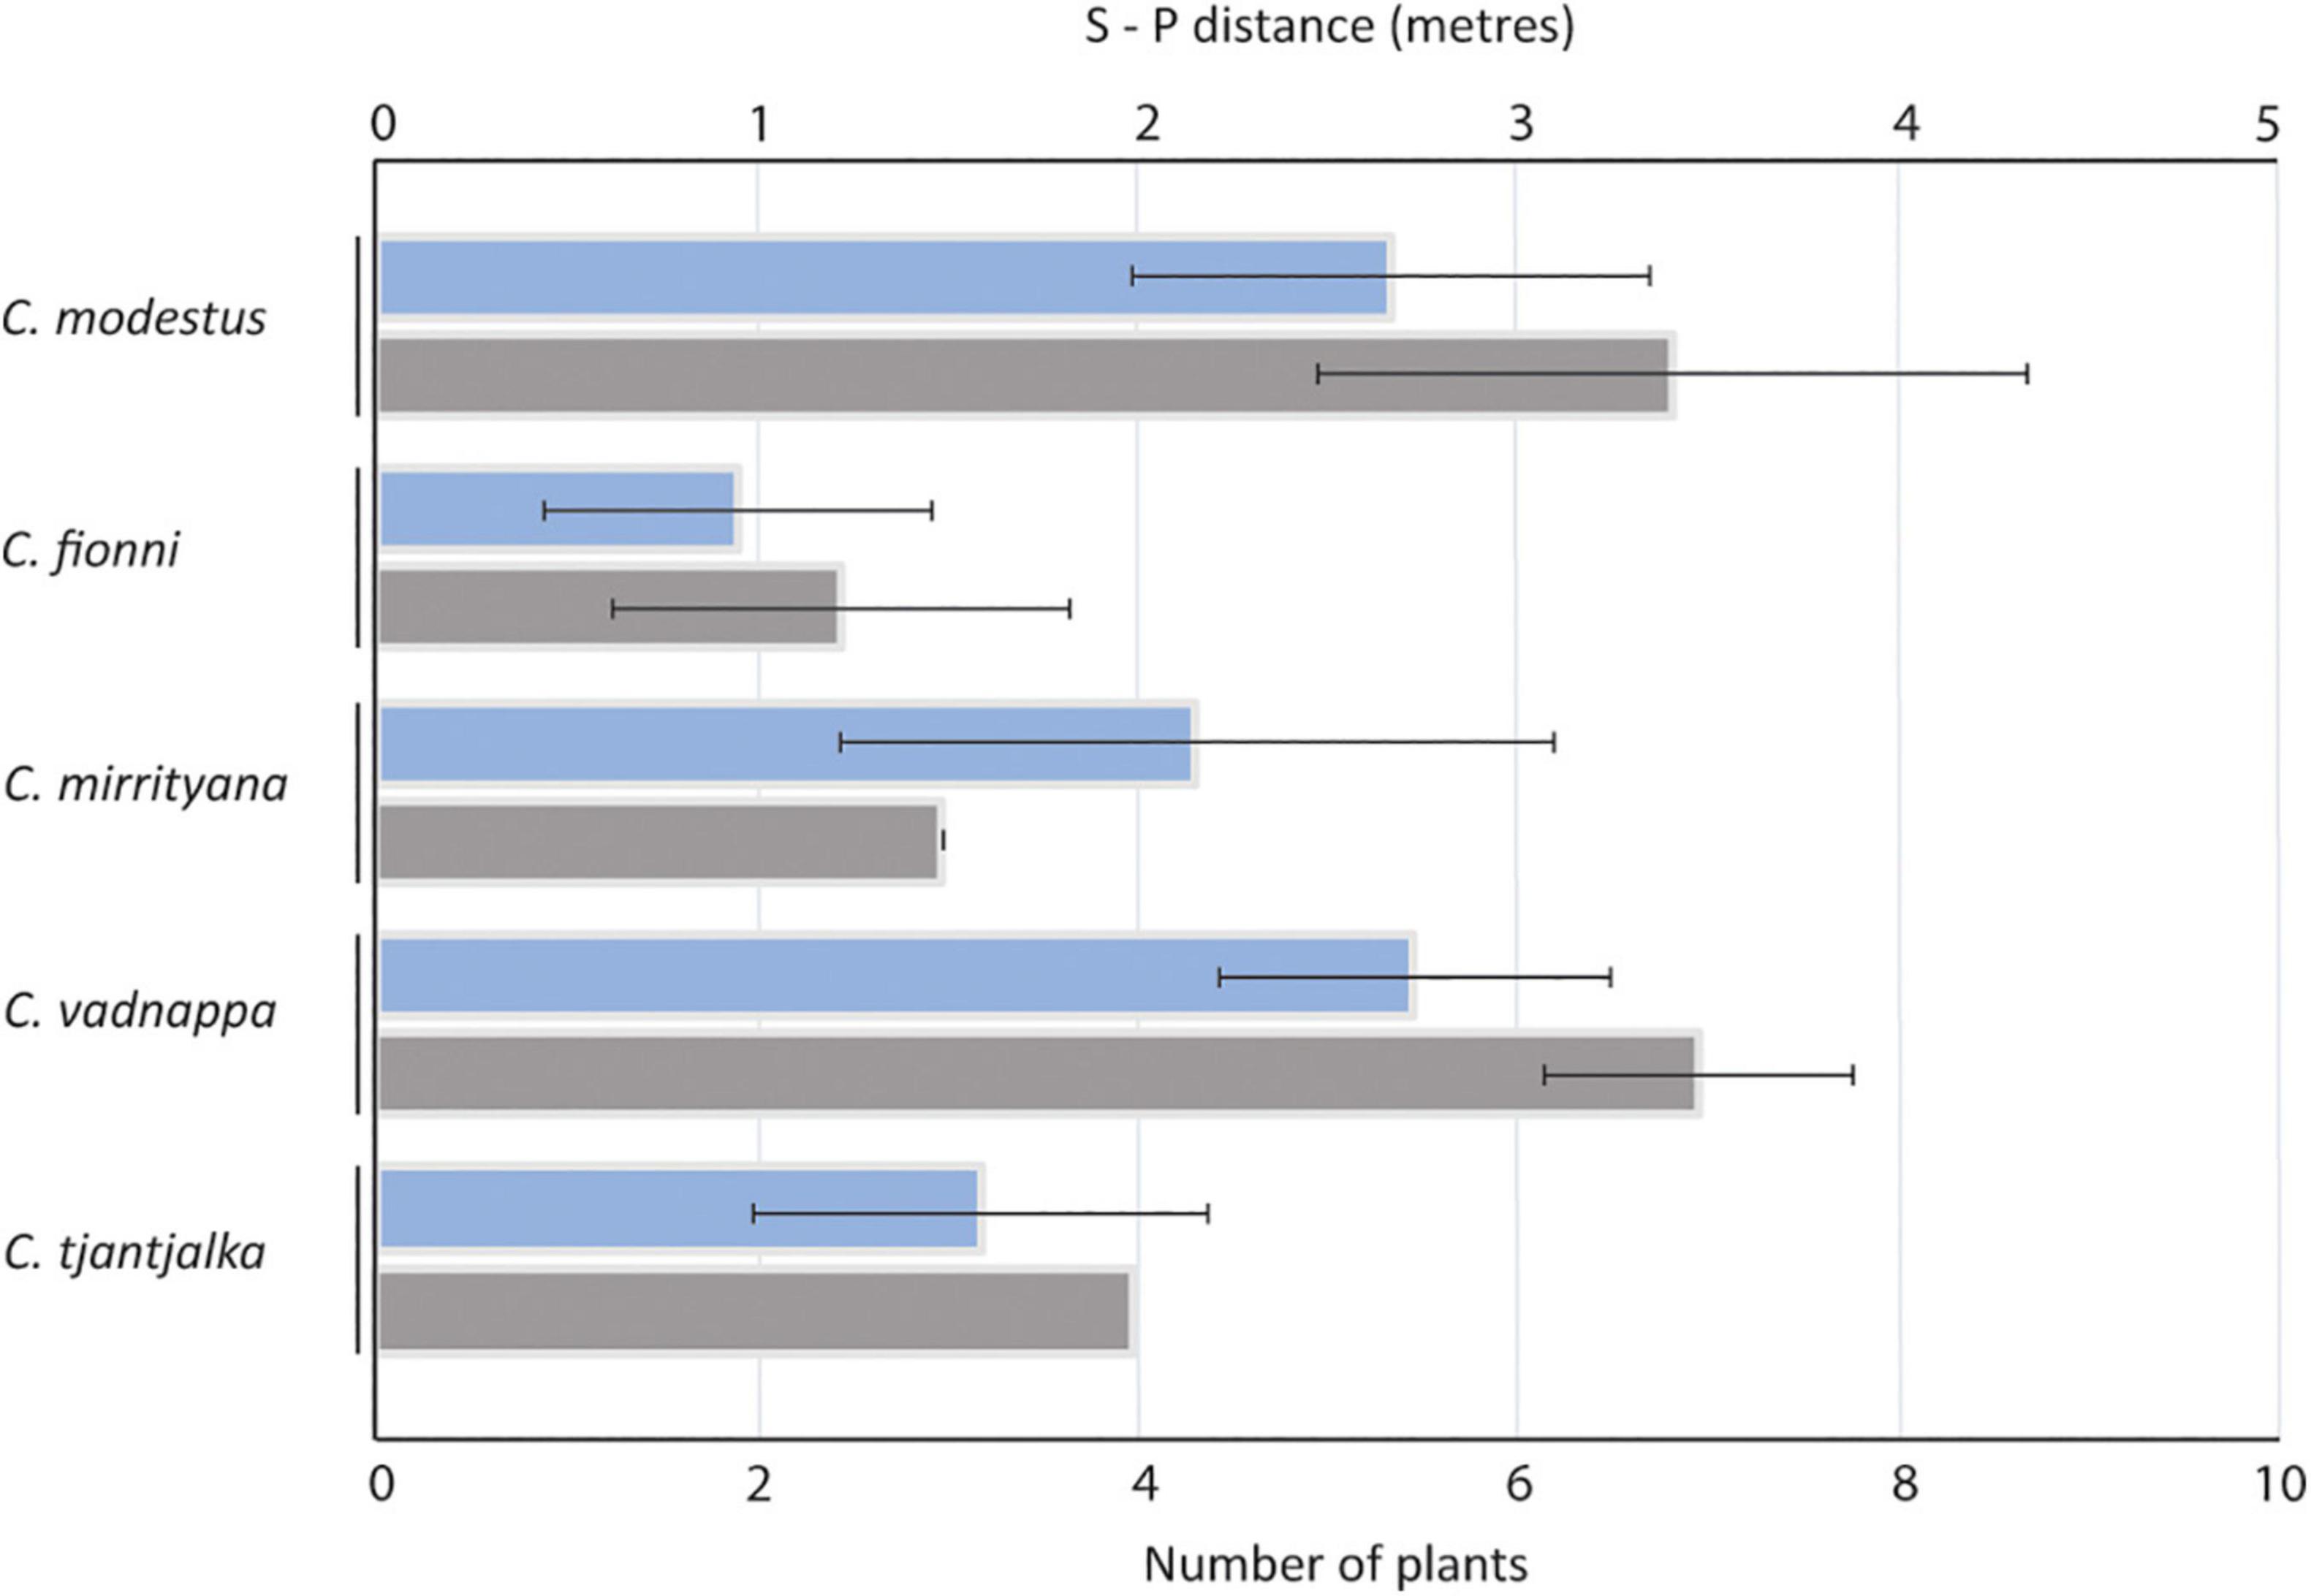
Figure 6. Average signaler-plant distance (blue) and average number of relevant plants (gray) at the signaling habitats for the five study species. Error bars represent standard deviation.
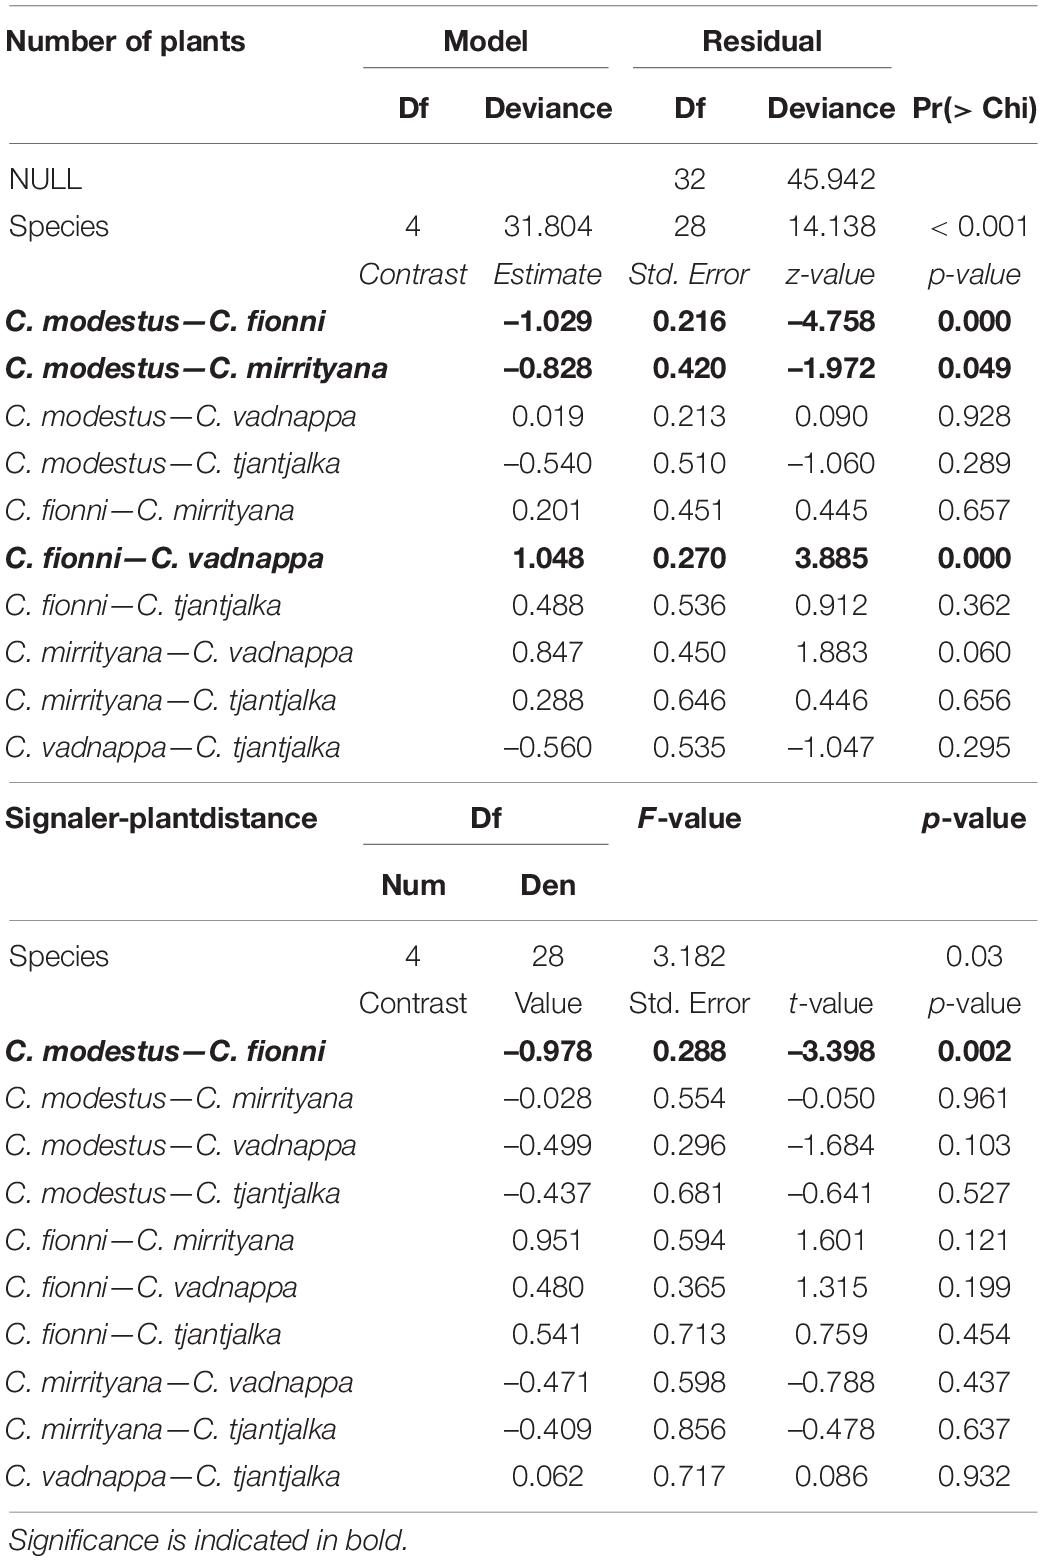
Table 4. Outcome of statistical models for plant number and s-p distances, using a generalized linear model and a linear mixed model, respectively, to compare microhabitat structure for each species.
Are Signals Effective in Each Microhabitat?
Our contrast scores provide insight into the potential masking effect of plant motion in the environment and were calculated as the difference between the motion of display movements (all tracked body parts) and the movements of windblown plants. Contrast scores are binary (location, scale) and are computed separately for each plant in a given microhabitat (see Materials and Methods; Ramos and Peters, 2017b provide the rationale behind this approach). Contrast scores were obtained for all species against all plants in all habitats and are summarized as convex hulls in Figure 7. Species-habitat combinations with large convex hulls implies greater variability in signal-noise contrast scores, and therefore greater heterogeneity in the motion noise environment and more opportunity for signals to be masked by plant motion. Focussing on habitats (comparing columns in Figure 6), the area of convex hulls is greatest for C. modestus, C. fionni, and then C. vadnappa. These habitats also feature the most plants (C. modestus, C. vadnappa) or shortest signaler-plant distances (C. fionni). Focussing on species (comparing rows in Figure 6), C. vadnappa displays are predicted to be the least affected by motion noise at all habitats, followed by C. modestus, C. tjantjalka, C. mirrityana, and lastly, C. fionni. These results correspond with relative signaling speeds of these species.
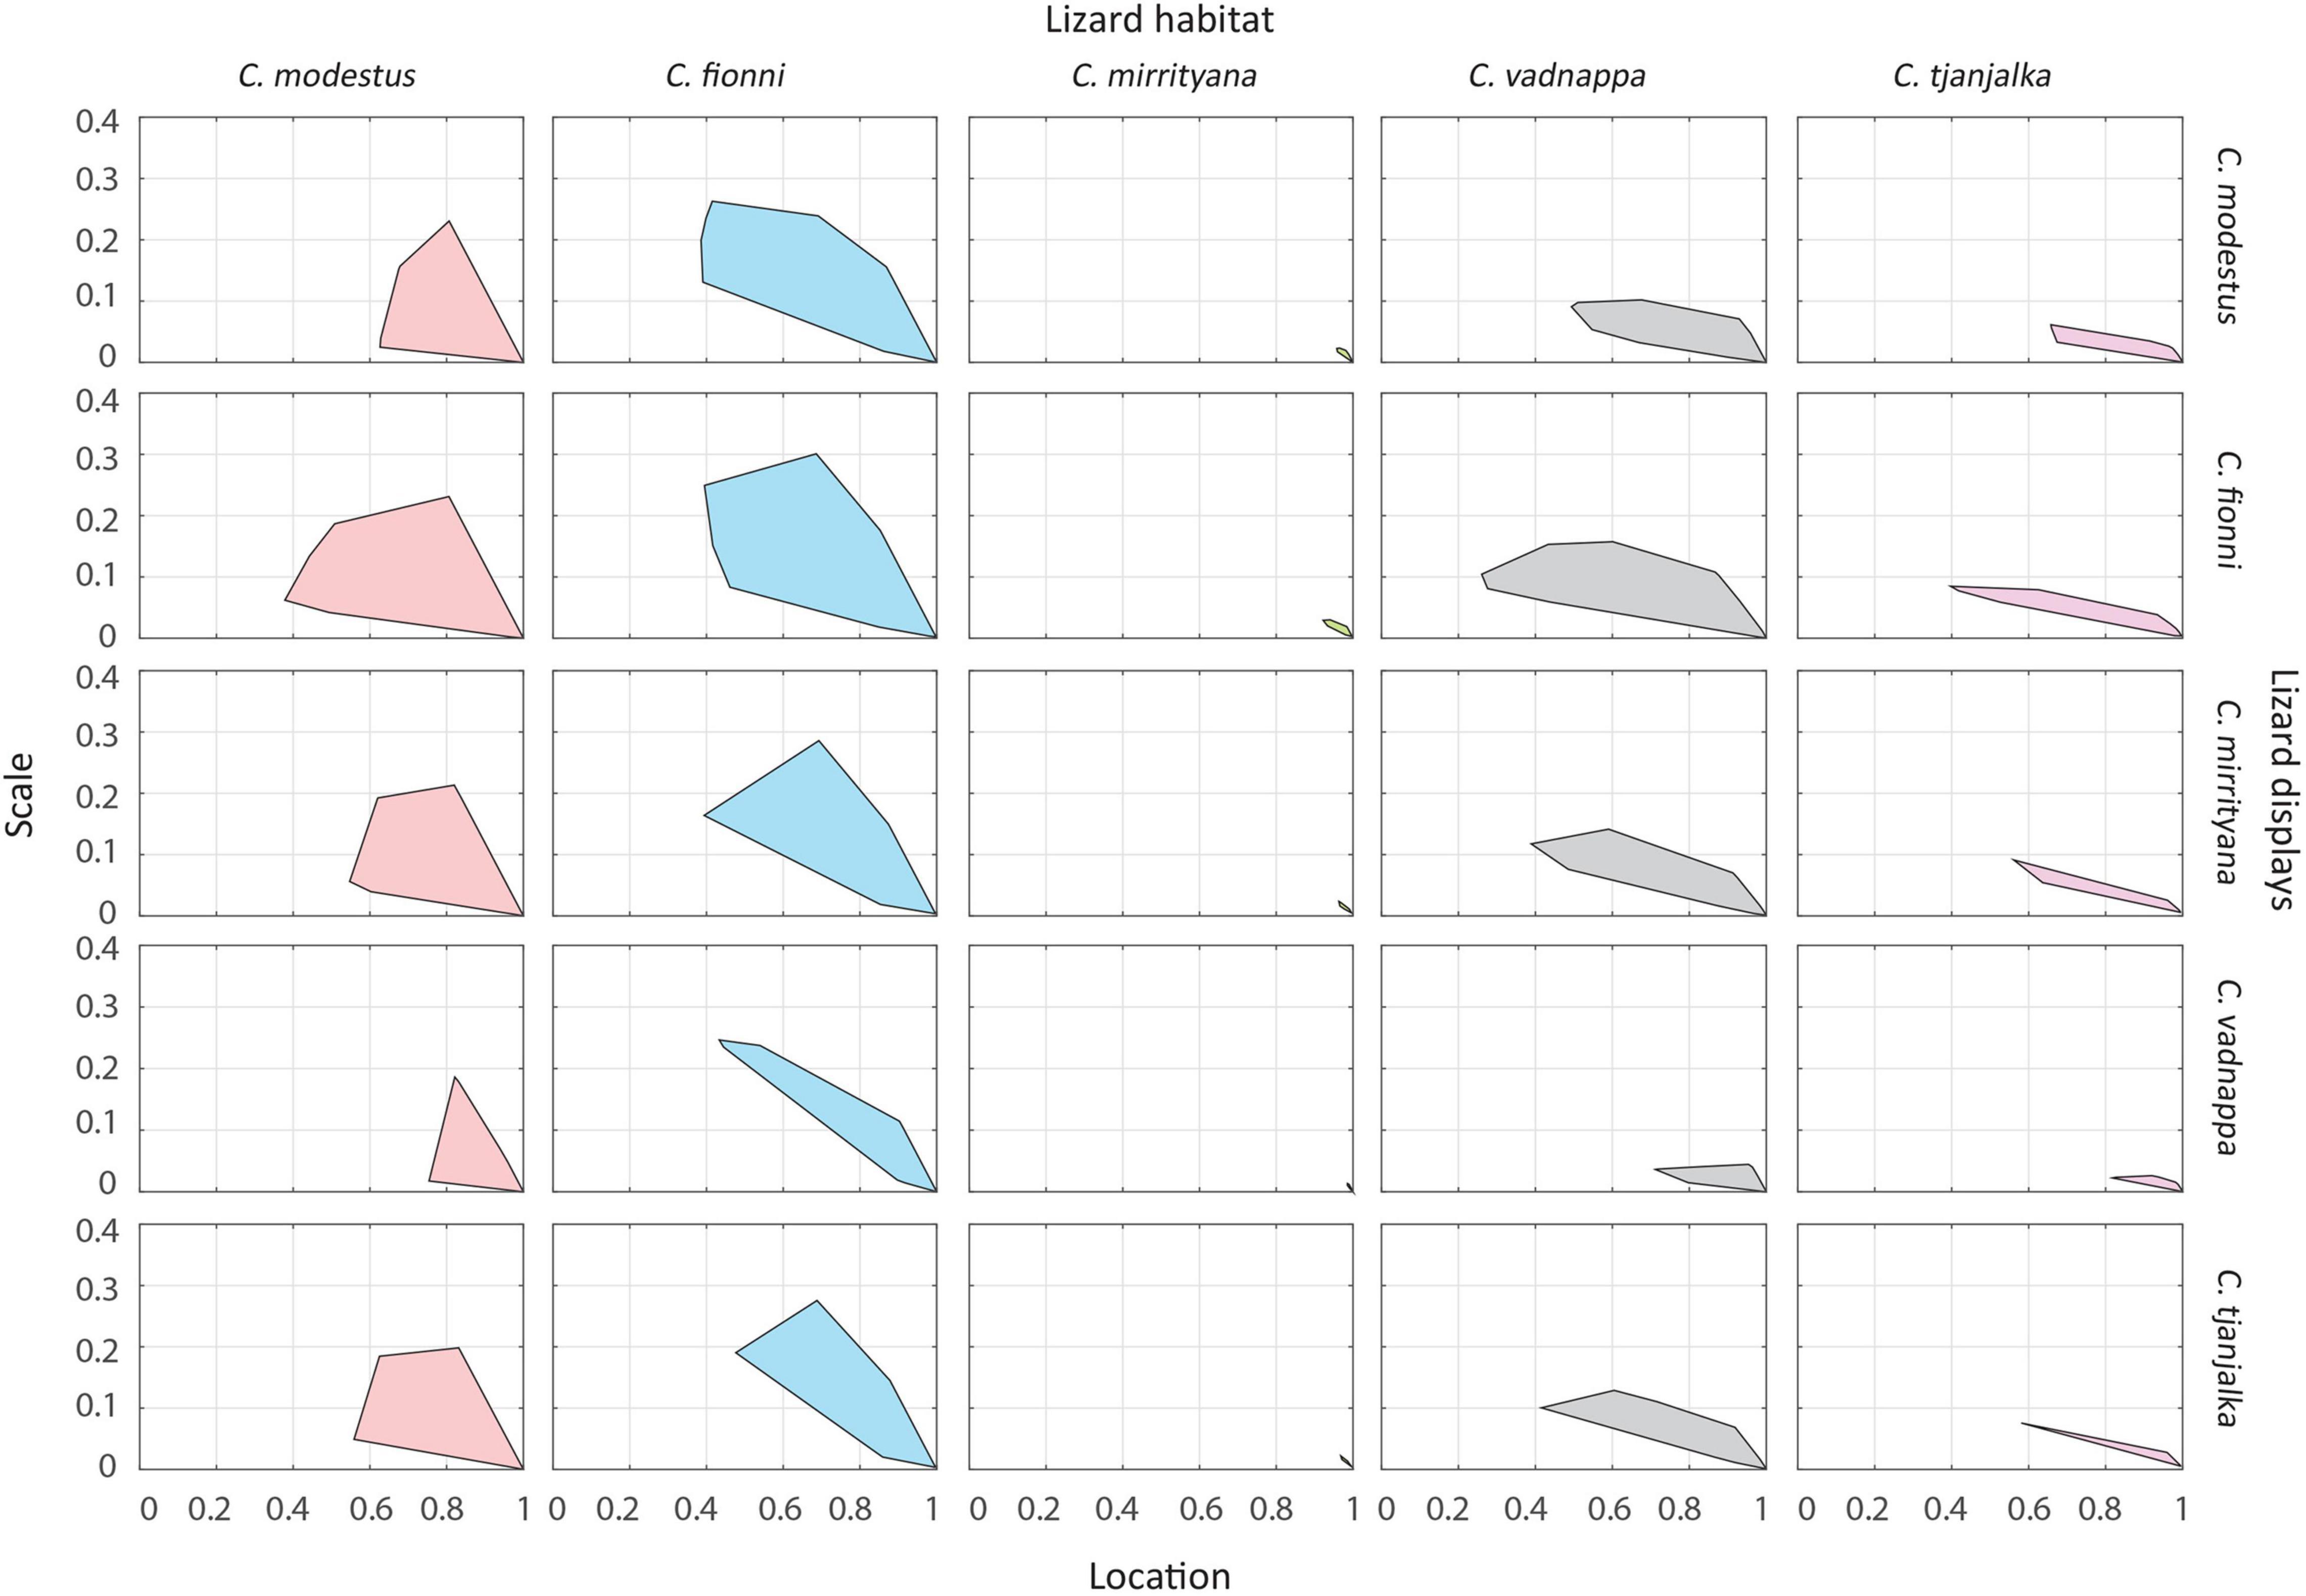
Figure 7. Relative contrast of signals and noise for all species at all habitats. Each convex hull represents all the contrast values of all signals against all plants and views for a particular species at a particular habitat. The location (x axis) shows the central tendency of the contrast value, while the scale (y axis) shows the variation around the central tendency. A location value close to 1 and a scale value close to 0 indicate that display movements are much faster than plant movements. Large convex hulls indicate that there is high variability in signal contrast at the site, with some areas showing high contrast and others low contrast.
Discussion
Results of the present study confirm that the motor pattern repertoire employed during the territorial displays of species in the Ctenophorus decresii complex are almost indistinguishable from each other, as previously reported by Gibbons (1979) for C. modestus (as C. decresii), C. fionni, and C. vadnappa. We consider the implications of our findings below, although we acknowledge that our sample size for two species is low (N = 1 and 2). We made concerted efforts to locate and record the visual displays of all species, but information on the behavior of most Australian dragons is very limited (Melville and Wilson, 2019), which hampered efforts to locate and film natural behavior. Consequently, we acknowledge below when our interpretations are more speculative because of limited data.
The general design of the displays does not seem to differ. However, upon closer inspection, motor pattern use does appear to vary. The coefficients of variation indicate that head bobs, and to a lesser extend push ups, are employed differently by all species (Table 2). This variation in the use of motor patterns appears consistent with their phylogeny, particularly in terms of the number and duration of the components (Figure 4). Ctenophorus modestus, C. fionni and C. vadnappa are more similar to each other (Figure 4). Ctenophorus modestus and C. vadnappa also produce the highest motion speed averages (Figure 5), but in this regard, variation does not occur as neatly along phylogenetic lines. Instead, display speed is fastest in species found in the most planted habitats (Figures 5, 6). Thus, the potential masking effect of environmental noise is high in the habitats of C. modestus and C. vadnappa. This is also true for C. fionni, but in the case of this species, it is likely attributed to slow display speeds (Figure 5), short S-P distances (Figure 6), or both. Consequently, the Ctenophorus decresii complex might be an example of closely related species, retaining ancestral behavioral traits that have been modified to suit their specific habitats.
Results from the signal-noise contrast analyses revealed that displays by C. fionni are more susceptible to environmental noise in all habitats, while C. vadnappa displays are the least affected in each habitat. This was expected given that C. vadnappa produced the fastest motion speed averages. Gibbons (1979) determined that the push ups produced by C. vadnappa had greater amplitude than the equivalent motor patterns from C. modestus and C. fionni. Greater amplitudes can translate into faster speeds if the time intervals are kept equal, which indicates similarities between both studies.
Signal contrast can be used to assess the performance of motion signals and also to infer differences across habitats in the production of noise, as explained by Ramos and Peters (2017a,b). All species seem to perform much better when their signals are considered at the habitats of C. mirrityana, which suggests the noise environment at these sites are less likely to mask the signals produced by the lizards (Figure 7). Although we only recorded at two sites for this species, our findings can be partially explained by looking at the distribution of vegetation at these sites and the surrounding area. Ctenophorus mirrityana habitat not only contains a low density of relevant plants, but the signaler-plant distance average was almost as high as in C. modestus and C. vadnappa habitat (Figure 7). These two traits combined seemed to promote effective signaling in this habitat for all species. The sites utilized by C. fionni for signaling contain an even lower plant density, but this species also displays the shortest signaler-plant distance average of all lizards in the study. This means that C. fionni lizards do not often encounter plants during their territorial displays, but when they do, they signal in very close proximity, and this has consequences for motion segmentation by receivers. As such, despite superficially looking like the ideal signaling location (i.e., mostly large, flat rocks, and scarce vegetation), contrast scores are lower in C. fionni habitats. Overall, the potential for noise and signal masking in the habitats of C. modestus and C. vadnappa is high, but the species manage to perform relatively well according to our data. Signaling faster might be a way for these two species to offset the masking potential. As signaler-plant distances are smaller for C. fionni, attempts to signal faster against plant motion to improve contrast would be less effective (see Peters, 2013). Given the high speeds produced during their displays, it is not surprising that C. vadnappa performs best in all habitats compared to the other four species. Due to the nature of the fieldwork and the restricted and/or inaccessible distribution of some species, the sample sizes between species were inconsistent. Therefore, the results relating to comparisons of all five species should be taken with caution. This could explain the similarities between the convex hulls for C. modestus, C. fionni, and C. vadnappa, although our personal observations of the habitats for all species match well the sites that we sampled. It is also important to mention that despite the small sample size for C. tjantjalka, signaling in this species was reported in the literature for the first time in previous work (Ramos and Peters, 2016), but never recorded in free living lizards until now.
The results of this study suggest that there are signaling differences observed between species in this complex that are consistent with the notion of adaptations to the local environment. However, variation in the use of head bobs does appear relevant in a different context. Gibbons (1979) suggested that several aspects of the head bob motor pattern could have a species recognition function and could also be employed to taxonomically differentiate the species in the complex. While the current study focused on other display characteristics and used a different approach to analyze motion signals, we also identified variation in head bob use, particularly in the average duration and number of bobs performed per display in C. mirrityana. This is not surprising given that the species is the most phylogenetically distant in the complex (McLean et al., 2013). Ctenophorus mirrityana has only recently been described and was not included in Gibbons’ study, but variability in head bob use in our limited sample seems to be consistent. Nonetheless, species recognition might only be relevant for some populations of C. modestus and C. vadnappa that actually occur in sympatry. Gibbons (1979) identified the angle of the tail coil during the push up display as the most likely element for species recognition, and described it as vertical for C. vadnappa and horizontal for C. modestus (as C. decresii) and C. fionni. We did not observe the same pattern in the present study (data not presented). Instead, we compared other aspects of their signaling behavior and habitat. While we did not specifically look for differences between C. modestus and C. vadnappa, our results are mostly consistent with local adaptations and do not provide evidence that signaling behavior has a species recognition function. Historically both species were sympatric in some of our study sites as late as the mid 1970’s (Gibbons, 1979), but there currently does not seem to be an overlap in their distributions at these areas. Further studies on potential species recognition cues should target populations occurring in sympatry and therefore more likely to be influenced by the selective pressure of ensuring species recognition, and to show more obvious divergence in behavior.
Tail flicking behavior is yet another aspect worth exploring further. This motor pattern has been observed in all five species, however, according to our observations it is rarely included in the displays. In A. muricatus, most territorial displays are preceded by tail flicking, which tends to have a duration of several seconds (Peters and Evans, 2003b). In contrast, members of the C. decresii complex perform tail flicks infrequently and briefly. This might be related to the specific structure of the tail flicks, and if they are actually required to attract the attention of receivers and enhance signal efficacy, or it could be a remnant from an ancestral behavior. Regardless, it might be interesting to specifically analyze the function and structure of this motor pattern in the context of the noise environment.
Although there clearly is an effect of shared ancestry, our data provides evidence that members of the C. decresii complex exhibit adaptations in their signaling behavior to the local characteristics of their habitat. Some of these adaptations may also aid in species recognition, but our results are not conclusive in this matter. Many avenues of research remain untested in this group, such as the inclusion of C. decresii in the analyses, detailed studies of sympatric populations, and sampling of multiple populations for the wide-ranging C. modestus and C. fionni, although we are already taking the first steps (Wilson et al., 2021). Clearly, habitat structure can differentially influence the signaling behavior of closely related species with similar general signal design and morphology, which are likely a consequence of the ancestral state.
Data Availability Statement
The raw data supporting the conclusions of this article will be made available by the authors, without undue reservation.
Ethics Statement
The animal study was reviewed and approved by the La Trobe University Animal Ethics Committee and Wildlife Ethics Committee, South Australia.
Author Contributions
JR and RP designed the experiment, analyzed the data, and wrote the manuscript. JR conducted the experiment and collected the data. Both authors reviewed and approved the manuscript.
Funding
Funding was received from the Australian Research Council Discovery Project scheme to RP (DP170102370).
Conflict of Interest
The authors declare that the research was conducted in the absence of any commercial or financial relationships that could be construed as a potential conflict of interest.
Publisher’s Note
All claims expressed in this article are solely those of the authors and do not necessarily represent those of their affiliated organizations, or those of the publisher, the editors and the reviewers. Any product that may be evaluated in this article, or claim that may be made by its manufacturer, is not guaranteed or endorsed by the publisher.
Acknowledgments
We would like to thank Andrea Narvaez, Christine Giuliano, Georgia Troup, Jordan de Jong, Kate Beskeen, Matt Sleeth and Peri Bolton for their support during data collection. Data collection was performed in accordance with the ethical regulations of La Trobe University (AEC 12-37 and AEC 16-59) and South Australia (55/2012), under permits provided by DEPI in Victoria (10006812), DEWNR in South Australia (Q26078 and U26541), and NPWS in New South Wales (SL101426).
Supplementary Material
The Supplementary Material for this article can be found online at: https://www.frontiersin.org/articles/10.3389/fevo.2021.731705/full#supplementary-material
Supplementary Figure 1 | Schematic illustration of the recording of lizards and plants. Middle Panel: Focal (resident) male lizards were located in their natural habitat and two cameras were positioned nearby before a tethered intruder was introduced at a distance of 1 m from the focal lizard. The display response of the focal lizard was filmed with both cameras. After filming was completed and the focal lizard had departed, the scene was mapped to identify the relative position of plants to the focal lizard. This includes all plants surrounding the focal lizard (a full 360o rather than the limited set of four plants A–D shown here). Left Panel: Display movements were digitized separately from the footage of both cameras and subsequently combined to yield 3D positions over time, with the change in position between successive frames yielding measures of speed. Right Panel: The response of plants to standardized wind speed generated by a leaf blower was filmed and subsequently analyzed using motion detector algorithms. The analytical process is explained further in the text and in Figure 2. The rationale for, and full description of, our approach can be found in: Ramos and Peters (2017b). Quantifying Ecological Constraints on Motion Signaling. Frontiers in Ecology and Evolution 5:9.
References
Bian, X., Chandler, T., Pinilla, A., and Peters, R. A. (2019). Now you see me, now you don’t: Environmental conditions, signaler behavior, receiver response thresholds interact to determine the efficacy of a movement-based animal signal. Front. Ecol. Evol. 7:130. doi: 10.3389/fevo.2019.00130
Brandt, Y. (2003). Lizard threat display handicaps endurance. Proc. R. Soc. Lond. B 270, 1061–1068. doi: 10.1098/rspb.2003.2343
Carpenter, C. C. (1962). A comparison of the patterns of display of Urusaurus, Uta, and Streptosaurus. Herpetologica 18, 145–152.
Carpenter, C. C. (1978). “Ritualistic social behaviors in lizards,” in Behavior and Neurology of Lizards: An Interdiciplinary colloquium, eds N. Greenberg and P. D. MacLean (Rockville, MD: National Institude of Mental Health), 253–267.
Carpenter, C. C., Badham, J. A., and Kimble, B. (1970). Behavior patterns of three species of Amphibolurus (Agamidae). Copeia 1970, 497–505. doi: 10.2307/1442277
Cocroft, R. B., and Rodriguez, R. L. (2005). The behavioral ecology of insect vibrational communication. BioScience 55, 323–334. doi: 10.1641/0006-3568(2005)055[0323:tbeoiv]2.0.co;2
Dong, C. M., Johnston, G. R., Stuart-Fox, D., Moussalli, A., Rankin, K. J., and McLean, C. A. (2021). Elevation of divergent color polymorphic and monomorphic lizard lineages (Squamata: Agamidae) to species level. Ichthyol. Herpetol. 109, 43–54.
Endler, J. A. (1991). Variation in the appearance of guppy color patterns to guppies and their predators under different visual conditions. Vision Res. 31, 587–608. doi: 10.1016/0042-6989(91)90109-i
Fleishman, L. J. (1986). Motion detection in the presence and absence of background motion in an Anolis lizard. J. Comp. Physiol. A 159, 711–720. doi: 10.1007/BF00612043
Fleishman, L. J. (1992). The influence of the sensory system and the environment on motion patterns in the visual displays of Anoline lizards and other vertebrates. Am. Nat. 139, S36–S61.
Fleishman, L. J., and Persons, M. (2001). The influence of stimulus and background colour on signal visibility in the lizard Anolis cristatellus. J. Exp. Biol. 204, 1559–1575.
Fleishman, L. J., Leal, M., and Persons, M. H. (2009). Habitat light and dewlap color diversity in four species of Puerto Rican anoline lizards. J. Comp. Physiol. A 195, 1043–1060. doi: 10.1007/s00359-009-0478-8
Gibbons, J. R. H. (1977). Comparative Ecology and Behaviour of Lizards of the Amphibolurus decresii Species Complex. Adelaide, SA: The University of Adelaide.
Gibbons, J. R. H. (1979). The hind leg pushup display of the Amphibolurus decresii species complex (Lacertilia: Agamidae). Copeia 1979, 29–40. doi: 10.2307/1443725
Hasson, O. (1991). Pursuit-deterrent signals: communication between prey and predator. Trends Ecol. Evol. 6, 325–329. doi: 10.1016/0169-5347(91)90040-5
Hedrick, T. L. (2008). Software techniques for two- and three-dimensional kinematic measurements of biological and biomimetic systems. Bioinspir. Biomimet. 3:034001. doi: 10.1088/1748-3182/3/3/034001
Hoback, W. W., and Wagner, W. E. Jr. (1997). The energetic cost of calling in the variable field cricket, Gryllus lineaticeps. Physiol. Entomol0 22, 286–290.
Hunter, M. L., and Krebs, J. R. (1979). Geographical variation in the song of the great tit (Parus major) in relation to ecological factors. J. Anim. Ecol. 48, 759–785.
Johnston, G. R. (1992). Ctenophorus tjantjalka, a new dragon lizard (Lacertilia: Agamidae) from northern South Australia. Record. S. Aust. Museum 26, 51–59. doi: 10.3853/j.2201-4349.65.2013.1600
Leal, M., and Fleishman, L. J. (2002). Evidence for habitat partitioning based on adaptation to environmental light in a pair of sympatric lizard species. Proc. R. Soc. Lond. B 269, 351–359. doi: 10.1098/rspb.2001.1904
Leal, M., and Fleishman, L. J. (2004). Differences in visual signal design and detectability between allopatric populations of Anolis lizards. Am. Nat. 163, 26–39. doi: 10.1086/379794
LeBas, N. R., and Marshall, N. J. (2000). The role of colour in signalling and male choice in the agamid lizard Ctenophorus ornatus. Proc. R. Soc. Lond. B 267, 445–452. doi: 10.1098/rspb.2000.1020
Lubanga, U., Peters, R. A., and Steinbauer, M. J. (2016) Substrate-borne vibrations of male psyllids vary with body size and age but females are indifferent. Anim. Behav. 120, 173—182. doi: 10.1016/j.anbehav.2016.07.033
Matsumasa, M., and Murai, M. (2005). Changes in blood glucose and lactate levels of male fiddler crabs: effects of aggression and claw waving. Anim. Behav. 69, 569–577. doi: 10.1016/j.anbehav.2004.06.017
McLean, C. A., Moussalli, A., and Stuart-Fox, D. (2014). Local adaptation and divergence in colour signal conspicuousness between monomorphic and polymorphic lineages in a lizard. J. Evol. Biol. 27, 2654–2664. doi: 10.1111/jeb.12521
McLean, C. A., Moussalli, A., Sass, S., and Stuart-Fox, D. (2013). Taxonomic assessment of the Ctenophorus decresii complex (Reptilia: Agamidae) reveals a new species of dragon lizard from Western New South Wales. Record. Aust. Museum 65, 51–63.
Melville, J., and Wilson, S. (2019). Dragon Lizards of Australia: Evolution, Ecology and a Comprehensive Fieldguide. Melbourne, Vic: Museums Victoria.
Mitchell, F. J. (1973). Studies on the ecology of the agamid Lizard Amphibolurus maculosus (Mitchell). Trans. R. Soc. S. Aust. 97, 47–76.
Morton, E. S. (1975). Ecological sources of selection on avian sounds. Am. Nat. 109, 17–34. doi: 10.1016/j.heares.2015.05.009
Ord, T. J. (2012). Historical contingency and behavioural divergence in territorial Anolis lizards. J. Evol. Biol. 25, 2047–2055. doi: 10.1111/j.1420-9101.2012.02582.x
Ord, T. J., and Martins, E. P. (2006). Tracing the origins of signal diveristy in anole lizards: phylogenetic approaches to inferring the evolution of complex behaviour. Anim. Behav. 71, 1411–1429. doi: 10.1016/j.anbehav.2005.12.003
Ord, T. J., Charles, G. K., and Hofer, R. K. (2011). The evolution of alternative adaptive strategies for effective communication in noisy environments. Am. Nat. 177, 54–64. doi: 10.1086/657439
Ord, T. J., Peters, R. A., Clucas, B., and Stamps, J. A. (2007). Lizards speed up visual displays in noisy motion habitats. Proc. R. Soc. Lond. B 274, 1057–1062. doi: 10.1098/rspb.2006.0263
Osborne, L. (2005). Information content of male agonistic displays in the territorial tawny dragon (Ctenophorus decresii). J. Ethol. 23, 189–197. doi: 10.1007/s10164-005-0151-9
Peters, R. A. (2008). Environmental motion delays the detection of movement-based signals. Biol. Lett. 4, 2–5. doi: 10.1098/rsbl.2007.0422
Peters, R. A. (2013). “Noise in optic communication: motion from wind-blown plants,” in Animal Communication in Noise, ed. H. Brumm (Heidelberg: Springer), 311–330. doi: 10.1007/978-3-642-41494-7_11
Peters, R. A., and Evans, C. S. (2003a). Design of the Jacky dragon visual display: signal and noise characteristics in a complex moving environment. J. Comp. Physiol. A 189, 447–459. doi: 10.1007/s00359-003-0423-1
Peters, R. A., and Evans, C. S. (2003b). Introductory tail-flick of the Jacky dragon visual display: signal efficacy depends upon duration. J. Exp. Biol. 206, 4293–4307. doi: 10.1242/jeb.00664
Peters, R. A., and Ord, T. J. (2003). Display response of the Jacky Dragon, Amphibolurus muricatus (Lacertilia: Agamidae), to intruders: a semi-Markovian process. Austral Ecol. 28, 499–506. doi: 10.1046/j.1442-9993.2003.01306.x
Peters, R. A., Clifford, C. W. G., and Evans, C. S. (2002). Measuring the structure of dynamic visual signals. Anim. Behav0 64, 131–146. doi: 10.1006/anbe.2002.3015
Peters, R. A., Hemmi, J. M., and Zeil, J. (2007). Signaling against the wind: modifying motion-signal structure in response to increase noise. Curr. Biol. 17, 1231–1234. doi: 10.1016/j.cub.2007.06.035
Peters, R. A., Hemmi, J. M., and Zeil, J. (2008). Image motion environments: background noise for movement-based animal signals. J. Comp. Physiol. A 194, 441–456. doi: 10.1007/s00359-008-0317-3
Peters, R. A., Ramos, J. A., Hernandez, J., Wu, Y., and Qi, Y. (2016). Social context affects tail displays by Phrynocephalus vlangalii lizards from China. Sci. Rep. 6:31573. doi: 10.1038/srep31573
Pinheiro, J., Bates, D., DebRoy, S., Sarkar, D., and R Core Team (2018). _nlme: Linear and Nonlinear Mixed Effects Models_. R Package Version 3.1-137. Available online at: https://CRAN.Rproject.org/package=nlme
Podos, J. (2001). Correlated evollution of morphology and vocal signal structure in Darwin’s finches. Nature 409, 185–188. doi: 10.1038/35051570
Podos, J., and Nowicki, S. (2004). Beaks, adaptations, and vocal evolution in Darwin’s finches. Biosciences 54, 501–510. doi: 10.1641/0006-3568(2004)054[0501:baavei]2.0.co;2
Purdue, J. R., and Carpenter, C. C. (1972). A Comparative Study of the Display Motion in the Iguanid Genera Sceloporus, Uta, and Urosaurus. Herpetologica 28, 137–141.
R Core Team (2016). R: A Language and Environment for Statistical Computing. Vienna: R Foundation for Statistical Computing.
Ramos, J. A., and Peters, R. A. (2016). Dragon wars: movement-based signalling by Australian agamid lizards in relation to species ecology. Austral Ecol. 41, 302–315. doi: 10.1111/aec.12312
Ramos, J. A., and Peters, R. A. (2017a). Habitat-dependent variation in motion signal structure between allopatric populations of lizards. Anim. Behav. 126, 69–78. doi: 10.1016/j.anbehav.2017.01.022
Ramos, J. A., and Peters, R. A. (2017b). Quantifying ecological constraints on motion signaling. Front. Ecol. Evol. 5:9. doi: 10.3389/fevo.2017.00009
Ramos, J. R. (2017). Dragon Wars. Relating signal structure and habitat characteristics in Australian agamid lizards. Ph.D. thesis. Melbourne, Vic: La Trobe University.
Reby, D., and McComb, K. (2003). Anatomical constraints generate honesty: acoustic cues to age and weight in the roars of red deer stags. Anim. Behav. 65, 519–530. doi: 10.1006/anbe.2003.2078
Ryan, M. J., and Brenowitz, E. A. (1985). The role of body size, phylogeny, and ambient noise in the evolution of bird song. Am. Nat. 126, 87–100. doi: 10.1086/284398
Ryan, M. J., Cocroft, R. B., and Wilczynski, W. (1990). The role of environmental selection in intraspecific divergence of mate recognition signal in the cricket frog, Acris crepitans. Evolution 44, 1869–1872. doi: 10.1111/j.1558-5646.1990.tb05256.x
Slabbekoorn, H. (2013). Songs of the city: noise-dependent spectral plasticity in the acoustic phenotype of urban birds. Anim. Behav. 85, 1089–1099. doi: 10.1016/j.anbehav.2013.01.021
Slabbekoorn, H., and Peet, M. (2003). Ecology: birds sing at a higher pitch in urban noise. Nature 424, 267–267. doi: 10.1038/424267a
Slabbekoorn, H., and Smith, T. B. (2002). Habitat-dependent song divergence in the little greenbul: an analysis of environmental selection pressures on acoustic signals. Evolution 56, 1849–1858. doi: 10.1111/j.0014-3820.2002.tb00199.x
Stoddard, P. K., and Salazar, V. L. (2011). Energetic cost of communication. J. Exp. Biol. 214, 200–205. doi: 10.1242/jeb.047910
Stuart-Fox, D., and Moussalli, A. (2008). Selection for social signalling drives the evolution of Chameleon colour change. PLoS Biol. 6:e25. doi: 10.1371/journal.pbio.0060025
Stuart-Fox, D., and Ord, T. J. (2004). Sexual selection, natural selection and the evolution of dimorphic coloration and ornamentation in agamid lizards. Proc. R. Soc. Lond. B 271, 2249–2255. doi: 10.1098/rspb.2004.2802
Teasdale, L. C., Stevens, M., and Stuart-Fox, D. (2013). Discrete colour polymorphism in the tawny dragon lizard (Ctenophorus decresii) and differences in signal conspicuousness among morphs. J. Evol. Biol. 26, 1035–1046. doi: 10.1111/jeb.12115
Turner, C. R., Derylo, M., de Santana, C. D., Alves-Gomes, J. A., and Smith, G. T. (2007). Phylogenetic comparative analysis of electric communication signals in ghost knifefishes (Gymnotiformes: Apteronotidae). J. Exp. Biol. 210, 4104–4122. doi: 10.1242/jeb.007930
Vehrencamp, S. L., Bradbury, J. W., and Gibson, R. M. (1989) The energetic cost of display in male sage grouse. Anim. Behav. 38, 885–896.
Wilson, B. C., Ramos, J. A., and Peters, R. A. (2021). Intraspecific variation in behaviour and ecology in a territorial agamid, Ctenophorus fionni. Aust. J. Zool. 68, 85–97. doi: 10.1071/zo20091
Keywords: agamid, signaling, environmental noise, 3D reconstruction, adaptation, display
Citation: Ramos JA and Peters RA (2021) Territorial Displays of the Ctenophorus decresii Complex: A Story of Local Adaptations. Front. Ecol. Evol. 9:731705. doi: 10.3389/fevo.2021.731705
Received: 28 June 2021; Accepted: 22 November 2021;
Published: 10 December 2021.
Edited by:
Mark A. Elgar, The University of Melbourne, AustraliaReviewed by:
Peter Dijkstra, Central Michigan University, United StatesDaniel Osorio, University of Sussex, United Kingdom
Copyright © 2021 Ramos and Peters. This is an open-access article distributed under the terms of the Creative Commons Attribution License (CC BY). The use, distribution or reproduction in other forums is permitted, provided the original author(s) and the copyright owner(s) are credited and that the original publication in this journal is cited, in accordance with accepted academic practice. No use, distribution or reproduction is permitted which does not comply with these terms.
*Correspondence: Jose A. Ramos, ai5yYW1vc0BsYXRyb2JlLmVkdS5hdQ==