- 1College of Resource and Environment, Shanxi Agricultural University, Jinzhong, China
- 2National Experimental Teaching Demonstration Center for Agricultural Resources and Environment, Shanxi Agricultural University, Jinzhong, China
- 3China Meteorological Administration Training Centre, Beijing, China
Spatio-temporal variation of climatic factors generally contains spatial and temporal components that have different frequencies, which may significantly affect the overall variance structure of vegetation growth at the original scale. The objective of the study was to explore the temporal- and spatial-scale-specific relationships between vegetation growth and climatic factors based on the data of half-monthly normalized difference vegetation index (NDVI), half-monthly averaged daily mean temperature (DMT), half-monthly averaged daily range of temperature (DRT), and half-monthly accumulated precipitation (AP). The complete ensemble empirical mode decomposition (CEEMD) was used to decompose the temporal series of NDVI and climatic factors, and their temporal-scale-specific relationships were examined based on the original half-month scale. Two-dimensional empirical mode decomposition (2D-EMD) was used to decompose the spatial distributions of temporally averaged NDVI and climatic factors, and their spatial-scale-specific relationships were tested based on the original resolution of 1 km. The dominant temporal scales of NDVI were around 3, 15, and >15 years, while the dominant spatial scales of NDVI were around 2 × 10⁴ and >10 × 104 km2. The temporal-scale-specific effects of climatic factors on NDVI were the strongest under mixed forest and were the weakest under broadleaf forest. On a 15-year time scale, NDVI was positively affected by DMT and AP at the 200–1,000 mm precipitation region and negatively affected by DRT at the 200–600 mm precipitation region. Temporal effects of climatic factors had the greatest effects on NDVI in the precipitation region of 200–600 mm and in Yunnan province, and 98.08% of the study area included multi-temporal scale effects. Relationships between NDVI and climatic factors at the half-month scale and other temporal scales were different under different elevation, latitude, longitude, land types, climatic regions, and precipitation. The spatial-scale-specific effects of climatic factors on NDVI were also differed, and the area with effects of the multi-spatial scale was about 64.38%. This indicated that multi-temporal scale and multi-spatial scale analysis could help to understand the mechanisms of effect of climatic factors on vegetation growth and provide the foundation for future vegetation restoration in fragile ecosystems.
Introduction
Increasing temperatures and changes to precipitation patterns caused by climate change will affect variation in vegetation distribution (IPCC, 2013), and exploring the climatic controls on vegetation growth is critical for future vegetation restoration, ecological conservation, and environmental sustainability (Buitenwerf et al., 2015). Many previous studies have explored vegetation variation and its interactions with climatic factors (Jiang et al., 2019; Zheng et al., 2019; Qu et al., 2020). However, most of these studies have focused on a single temporal scale or a single spatial scale and have used traditional analysis, such as linear regression (Tong et al., 2016; Jiang et al., 2019), correlation analysis (Sun et al., 2020), or piecewise regression (Kong et al., 2017).
Single temporal or spatial scale cannot comprehensively capture the temporal or spatial response of vegetation to climate change and may ignore some important information on other temporal or spatial scales (Liu et al., 2018). Temporal relationships between vegetation and climatic factors have been explored using methods, such as wavelet analysis (Peng et al., 2019; Rathinasamy et al., 2019) and ensemble empirical mode decomposition (EEMD) (Liu et al., 2018). However, few studies have focused on the spatial effects of climatic factors on vegetation growth.
The overall variability of vegetation is controlled by a number of processes that occur together at different temporal and spatial scales with different intensities (Goovaerts, 1998), and the relationships with climatic variables are generally non-stationary (Yin et al., 2017). Thus, a linear and stationary assumption is not optimal for analyzing the relationships between vegetation and climatic variables at multiple spatial or temporal scales. Empirical mode decomposition (EMD) was introduced to analyze non-linear and non-stationary signals (Huang et al., 1998). However, EMD can result in an overestimation of the noise in a temporal series due to mode mixing (Wu and Huang, 2009). Although EEMD can avoid the problem of mode mixing (Wu and Huang, 2009), this method can produce some new mode mixing, and the computational cost is higher. The complete ensemble empirical mode decomposition (CEEMD) method is an adaption by Torres et al. (2011) of the original method, and it adds Gaussian white noise to the original series. For two-dimensional (2D) spatial datasets, two-dimensional empirical mode decomposition (2D-EMD) was introduced in a previous study (Huang et al., 2017).
Previous studies demonstrated that temporal variation of climatic variables on vegetation growth occurs at multiple scales regardless of the environmental conditions (Liu et al., 2018; Peng et al., 2019; Rathinasamy et al., 2019). However, it is unclear at what spatial and temporal scales climatic factors affect vegetation growth and distribution. We hypothesize that the factors controlling vegetation growth differ greatly under different temporal or spatial scales because of the differences in location-associated bioclimatic processes. The objectives of this study were to evaluate the relationships between climatic factors and normalized difference vegetation index (NDVI) to determine which temporal and spatial scales most accurately predict NDVI.
Materials and Methods
Study Area
China has a landmass of approximately 960 × 104 km2 covering approximately 50° of latitude and 62° of longitude and has extremely diverse climatic conditions (Bai et al., 2020). The elevation map of China is shown in Figure 1A. Based on the climatic indexes of active accumulated temperature, aridity index, and frost-free period, China can be divided into six climatic regions (Zhao, 1983), as shown in Figure 1B. The land cover-type product of MODIS (MCD12Q1) from 2001 for China is shown in Figure 1C, and the spatial distribution of averaged accumulated precipitation (AP) during 1982–2013 is presented in Figure 1D.
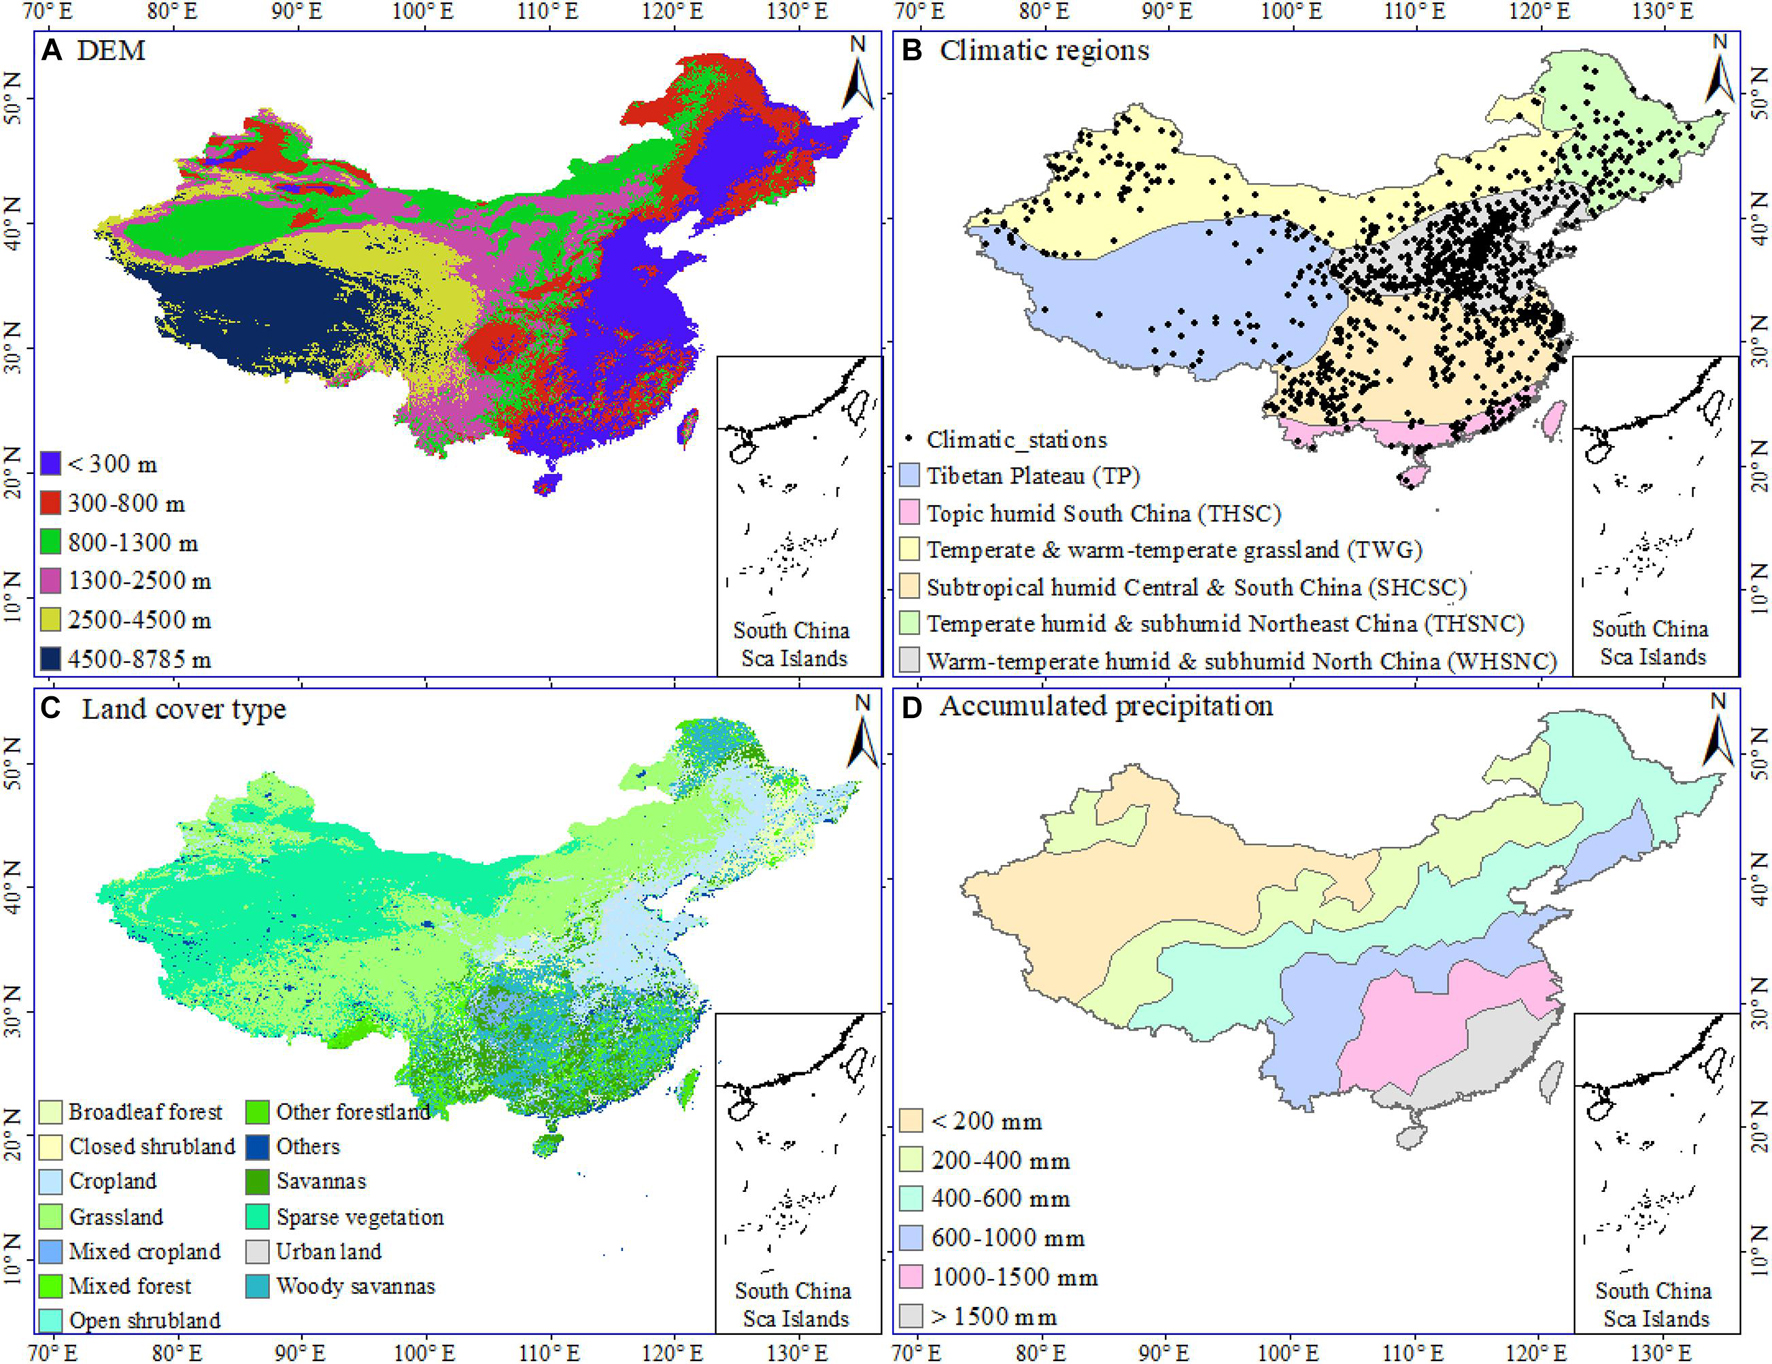
Figure 1. (A) Digital elevation model (DEM), (B) geographic distribution of selected meteorological stations and natural climatic regions, (C) land cover types, and (D) accumulated precipitation in China.
Data Sources
Daily precipitation and temperature were collected from 2,474 meteorological stations across China from 1982 to 2013 from Climatic Data Center, National Meteorological Information Center1. The half-monthly averaged values of daily mean temperature (DMT), daily range of temperature (DRT), and half-monthly AP were calculated as the three major influencing climatic factors, and some meteorological stations with incomplete datasets were eliminated.
The NDVI was derived from the Global Inventory Modeling and Mapping Studies (GIMMS) obtained from the National Oceanic and Atmospheric Administration (NOAA) satellites boarded on the Advanced Very High Resolution Radiometer (AVHRR) sensor2. The 15-day NDVI value from 1982 to 2013 at the meteorological stations was extracted after selecting the stations with good NDVI quality (NDVI quality >85%). Finally, 1,029 time series from these meteorological stations were obtained to analyze for variations in NDVI at multiple temporal scales. The temporal-averaged spatial distributions of NDVI, DMT, DRT, and AP were calculated to analyze NDVI variations at multiple spatial scales.
Complete Ensemble Empirical Mode Decomposition
Empirical mode decomposition is an intuitive, posterior, and adaptive method to analyze non-stationary and nonlinear temporal data series (Huang et al., 1998). CEEMD was introduced to solve the problem of incomplete decomposition with a lower computational cost. The CEEMD method decomposes an original temporal series x(t) (t = 1, 2, …, N) into n components called intrinsic mode functions (IMFs) and a corresponding residue. Decomposition can be done as follows:
(1) Obtain two noisy temporal series [] by adding positive and negative Gaussian white noise and with the same amplitude, respectively.
(2) Apply the EMD method to the noisy temporal series of and to obtain two IMFs of and . A detailed description of EMD can be found in a previous publication (Huang et al., 1998).
(3) The i-th CEEMD IMFs of IMFi(t) are obtained by averaging the corresponding and of the noisy temporal series as follows:
The residue of r(t) is obtained by averaging the corresponding r+(t) and r−(t) of the noisy temporal series as follows:
An original time series could produce a finite number of IMFi(t) and a residue r(t) using CEEMD.
Each component of IMFi(t) stands for the oscillation of the original time series at one temporal scale, and its temporal scale could be calculated through the number of local maxima (peaks) divided by the length of time (n). The residue of r(t) represents a longer scale of the original time series. The relative importance of IMFi(t) or r(t) can be represented by the percentage of variance contribution as follows:
Two-Dimensional Empirical Mode Decomposition
Two-dimensional empirical mode decomposition has been used to separate the overall variation of the spatial distribution of NDVI or climatic factors into different scale components called bi-dimensional intrinsic mode functions (BIMFs) (Biswas, 2018). Unlike EMD, which finds the overall extrema, 2D-EMD determines the local extrema (maxima and minima) of the spatial dataset. The minima and maxima points of each location have to be interpolated, and the mean values of the interpolated minima and maxima points have to be calculated. The 2D-EMD for a 2D spatial dataset of z(x, y) is defined as:
Where BIMFi(x,y) is the i-th BIMF, and r(x,y) is the corresponding residue. In the present study, 2D-EMD was performed by the “spemd” package of R software (Roudier, 2016). 2D-EMD can be expressed as follows:
(1) Triangulate to create an irregular spatial dataset using the tri.mesh function in the “tripack” package of R;
(2) Find local minima and maxima of the spatial dataset, which is the value that is either smaller or larger than its neighbors;
(3) Interpolate the minima and maxima points of each location in the input dataset through multi-level B-splines from the “MBA” package of R;
(4) Define the mean values of the interpolated minima and maxima points as the envelop (E) and extract the detail as d(x,y)=z(x,y)−E;
(5) Replace z(x, y) with d(x, y), repeat 2–4 until d(x, y) satisfied BIMF criteria and then define d(x, y) as BIMFi(x,y);
(6) Replace z(x, y) with , and go to (2) until a monotonic residue is obtained.
An original spatial dataset could produce a finite number of BIMFi(x,y) and a residue r(x, y) using 2D-EMD. Each component of BIMFi(x,y) represents the oscillation of the original spatial dataset at one spatial scale, and its spatial scale could be calculated through the number of local maxima (peaks) divided by the spatial area. The residue of r(x,y) represents longer scales of the spatial dataset. The relative importance of BIMFi(x,y) or r(x,y) could be represented by the percentage of variance contribution as follows:
Results
Multi-Temporal Scale Effects of Climatic Factors on Vegetation
The NDVI, DMT, DRT, and AP time series from 1982 to 2013 from the 1,029 meteorological stations were decomposed into four temporal IMFs and residue. The averaged temporal scales and percentage of variance contribution by each IMF are shown in Table 1. The NDVI, DMT, DRT, and AP scales were close to 3, 5, and 7 for IMF1, IMF2, and IMF3, respectively. Thus, NDVI showed variation at 3-, 5-, 7-, 15-, and >15-year time scales.
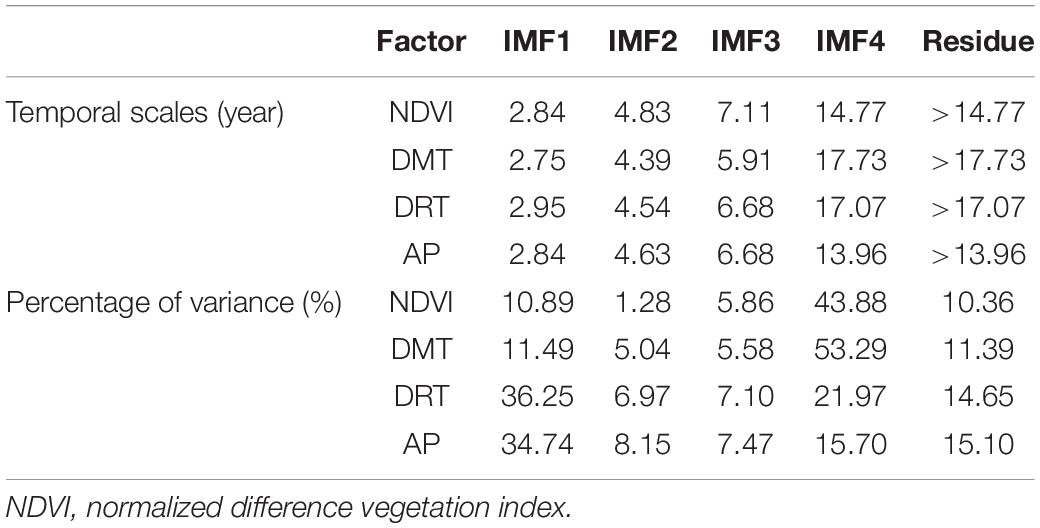
Table 1. The averaged temporal scales and percentage of variance are explained by each intrinsic mode function (IMF) of NDVI, daily mean temperature (DMT), daily range of temperature (DRT), and accumulated precipitation (AP).
The IMF1, IMF4, and residue had the most temporal variance for NDVI and climatic factors, which suggests the variance of vegetation was mainly captured at temporal scales of 3, 15, and >15 years.
The correlations between NDVI and climatic factors at the half-month, 3-, 15-, and >15-year time scales were calculated and are shown in Figure 2. At the original scale of 15 days, the temporal relationships between NDVI and DMT were generally positive. However, the relationships between NDVI and DRT at the half-month scale were negative in the 200–600 mm precipitation zone, and their temporal relationships were positive at other zones. Conversely, the temporal relationships between NDVI and AP at the half-month scale were positive in the 200–1,000 mm precipitation zone, and their relationships were negative at other zones. The results indicated that the relationships between NDVI and DRT (or AP) in the 200–600 mm precipitation zone differed compared with other zones. This might be attributed to the distinction between grassland and forest and the distinction between semi-arid and humid (or arid) areas. At the 3-year scale, there were significant temporal correlations between NDVI and DMT (or DRT) except in the temperate and warm-temperate grassland (TWG) climatic regions. However, the temporal relationships between NDVI and AP were only significant in the south and northeast of China.
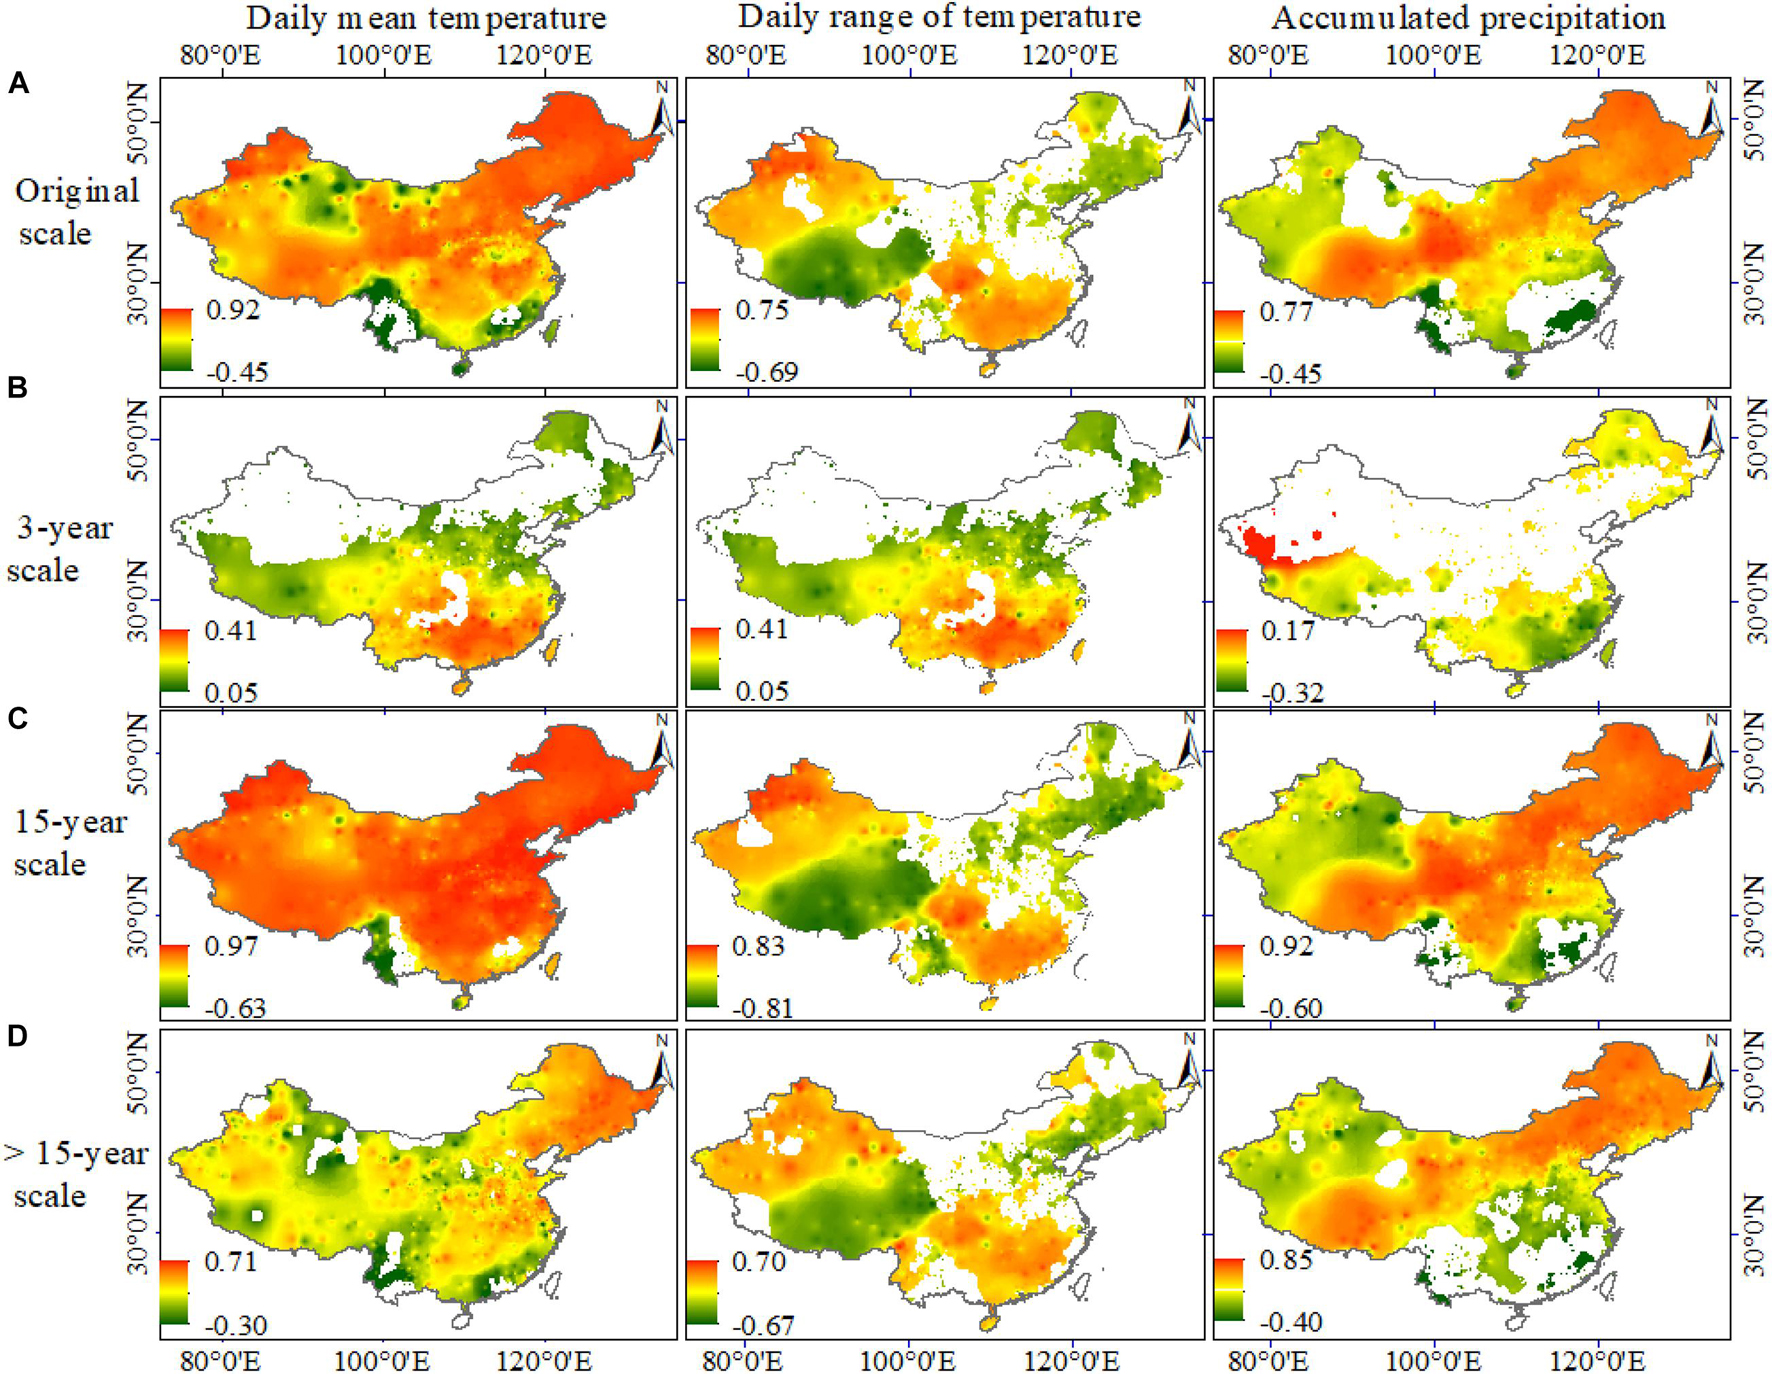
Figure 2. Spatial distribution of correlation coefficients between NDVI and climatic factors (daily mean temperature, daily range of temperature, and accumulated precipitation) during 1982–2013 at different temporal scales, including (A) original scale, (B) 3-year scale, (C) 15-year scale, and (D) >15-year scale. NDVI, normalized difference vegetation index.
At the 15-year timescale, NDVI and DMT were significantly and positively correlated throughout the China. The temporal relationships between NDVI and DRT were significantly negative in the 200–600 mm precipitation zone and were significantly positive in the other areas. However, the temporal relationships between NDVI and AP were positive in the 200–1,000 mm precipitation zone and were significantly negative in the other areas. At the >15-year scale, the positive relationships between NDVI and DAT were greater. In the 200–600 mm precipitation region, the relationships between the NDVI and DRT time series were negative, and in the 200–1,000 mm precipitation region, the relationships between the NDVI and AP time series were positive. The adjusted R2 values of the stepwise multiple linear regression (SMLR) for climatic factors are shown in Figure 3. The greatest R2 was located in the 200–600 mm precipitation zone. The adjusted R2 values of the SMLR from the climatic factors at the selected temporal scales were generally greater than those at the original scale of 15 days. The climate factors affected NDVI on multiple time scales, and the effects were strong in most areas of China, as shown by the R2 values up to 98.08%. The adjusted R2 values of the SMLR based on climatic factors under different land types are shown in Table 2. The adjusted R2 values for the multiple temporal-scaled effects were greatest under mixed forest (0.15) and lowest under broadleaf forest (0.03). The mean R2 of the SMLR at the half-month scale was 0.57 for all of China, while the mean R2 of the SMLR from the multi-temporal scales was 0.63. The multi-temporal scale effect improved the NDVI prediction from climatic factors at the half-month scale by about 0.06 across all of China.

Figure 3. Spatial distribution of adjusted multiple coefficients of determination (adjusted-R2) for multivariate regression analysis based on the climatic factors (A) at the original scale, (B) at multi-temporal scales, and (C) the difference between (A,B).

Table 2. Adjusted R2 of stepwise multiple linear regression (SMLR) based on climatic factors at the half-month scale (R2HM) and multi-spatial scales (R2m).
Temporal Relationships Between Climatic Factors and Vegetation Under Different Regions
The temporal relationships between NDVI and DMT under different regions are shown in Figure 4. Notably, their relationships at the half-month scale were similar to those at the 15-year temporal scale, while their relationships at the 3-year scale were generally insignificant. The relationship between DMT and NDVI was weakest at elevations of 1,300–2,500 m. The influence of DMT on NDVI was increased with the increased latitude. At 95–105° longitude, there were weak relationships between DMT and NDVI. Among the six land types, the effect of DMT on NDVI was the lowest under mixed forest at the half-month scale and the multi-temporal scales. The relationships between DMT and NDVI were the weakest in southeast China and weakest in the <200 mm precipitation zone at the half-month scale, the 15-year scale, and the >15-year scale.
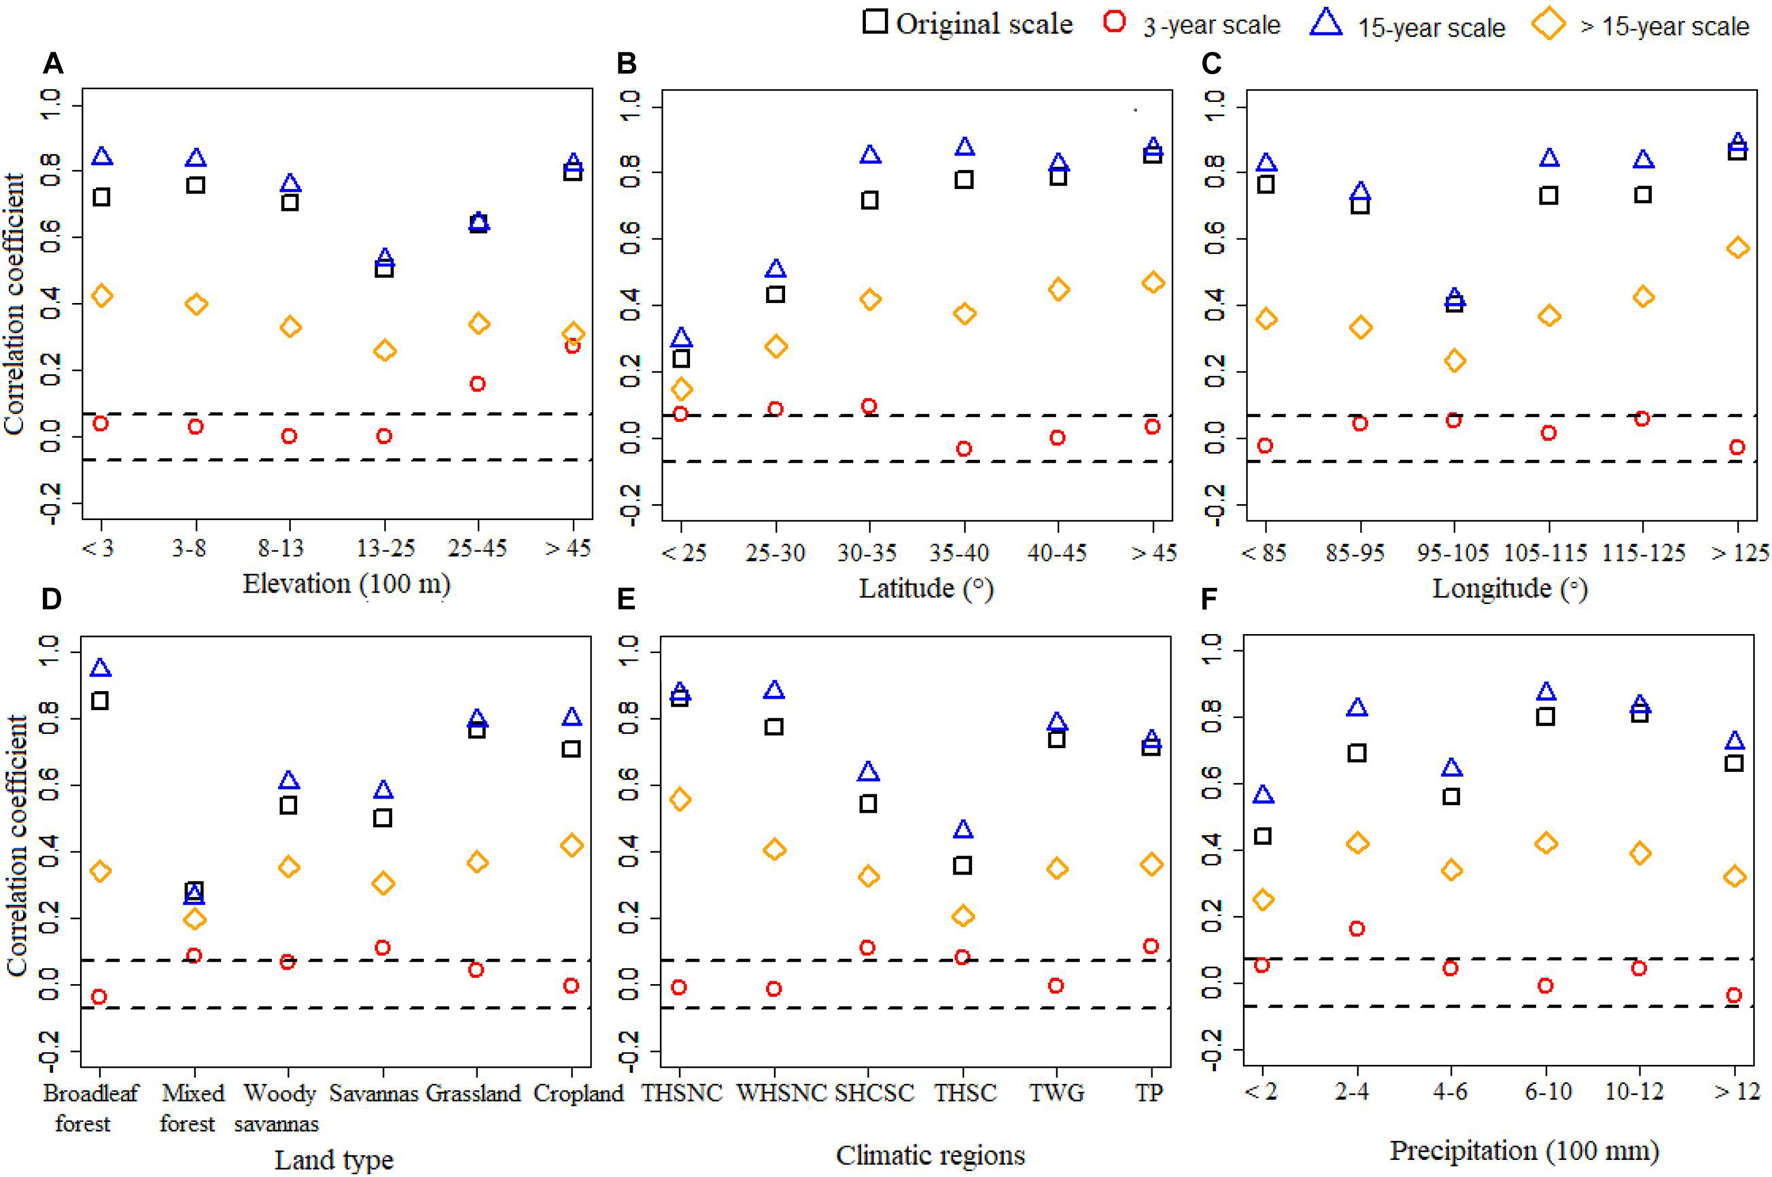
Figure 4. Temporal correlation between NDVI and daily mean temperature (DMT) under different (A) elevation, (B) latitude, (C) longitude, (D) land type, (E) climatic regions, and (F) precipitation at the original scale and multiple temporal scales. NDVI, normalized difference vegetation index.
The temporal relationships between NDVI and DRT under different climatic regions are shown in Figure 5. Relationships under different regions at the half-month scale differed greatly from those at multi-temporal scales. The correlations between NDVI and DRT were generally positive at the 15-year scale and >15-year scale, while correlations under different regions were unstable at the half-month scale or 3-year scale. At the multi-temporal scales, the effect of DRT on NDVI at the 3-year scale may neutralize the significant effect at the 15-year or >15-year scale. The effect of DRT on NDVI at the 15-year scale was the same at different elevations (or different longitude regions or different land types), while the effect of DRT on NDVI was increased gradually with increased latitude. DRT had the lowest effect on NDVI at the half-month, 15-year, and >15-year scales under the Topic Humid South China (THSC) of southeast China. Under different precipitation regions, the effect of DRT on NDVI was weakest under the 200–600 mm precipitation zone.
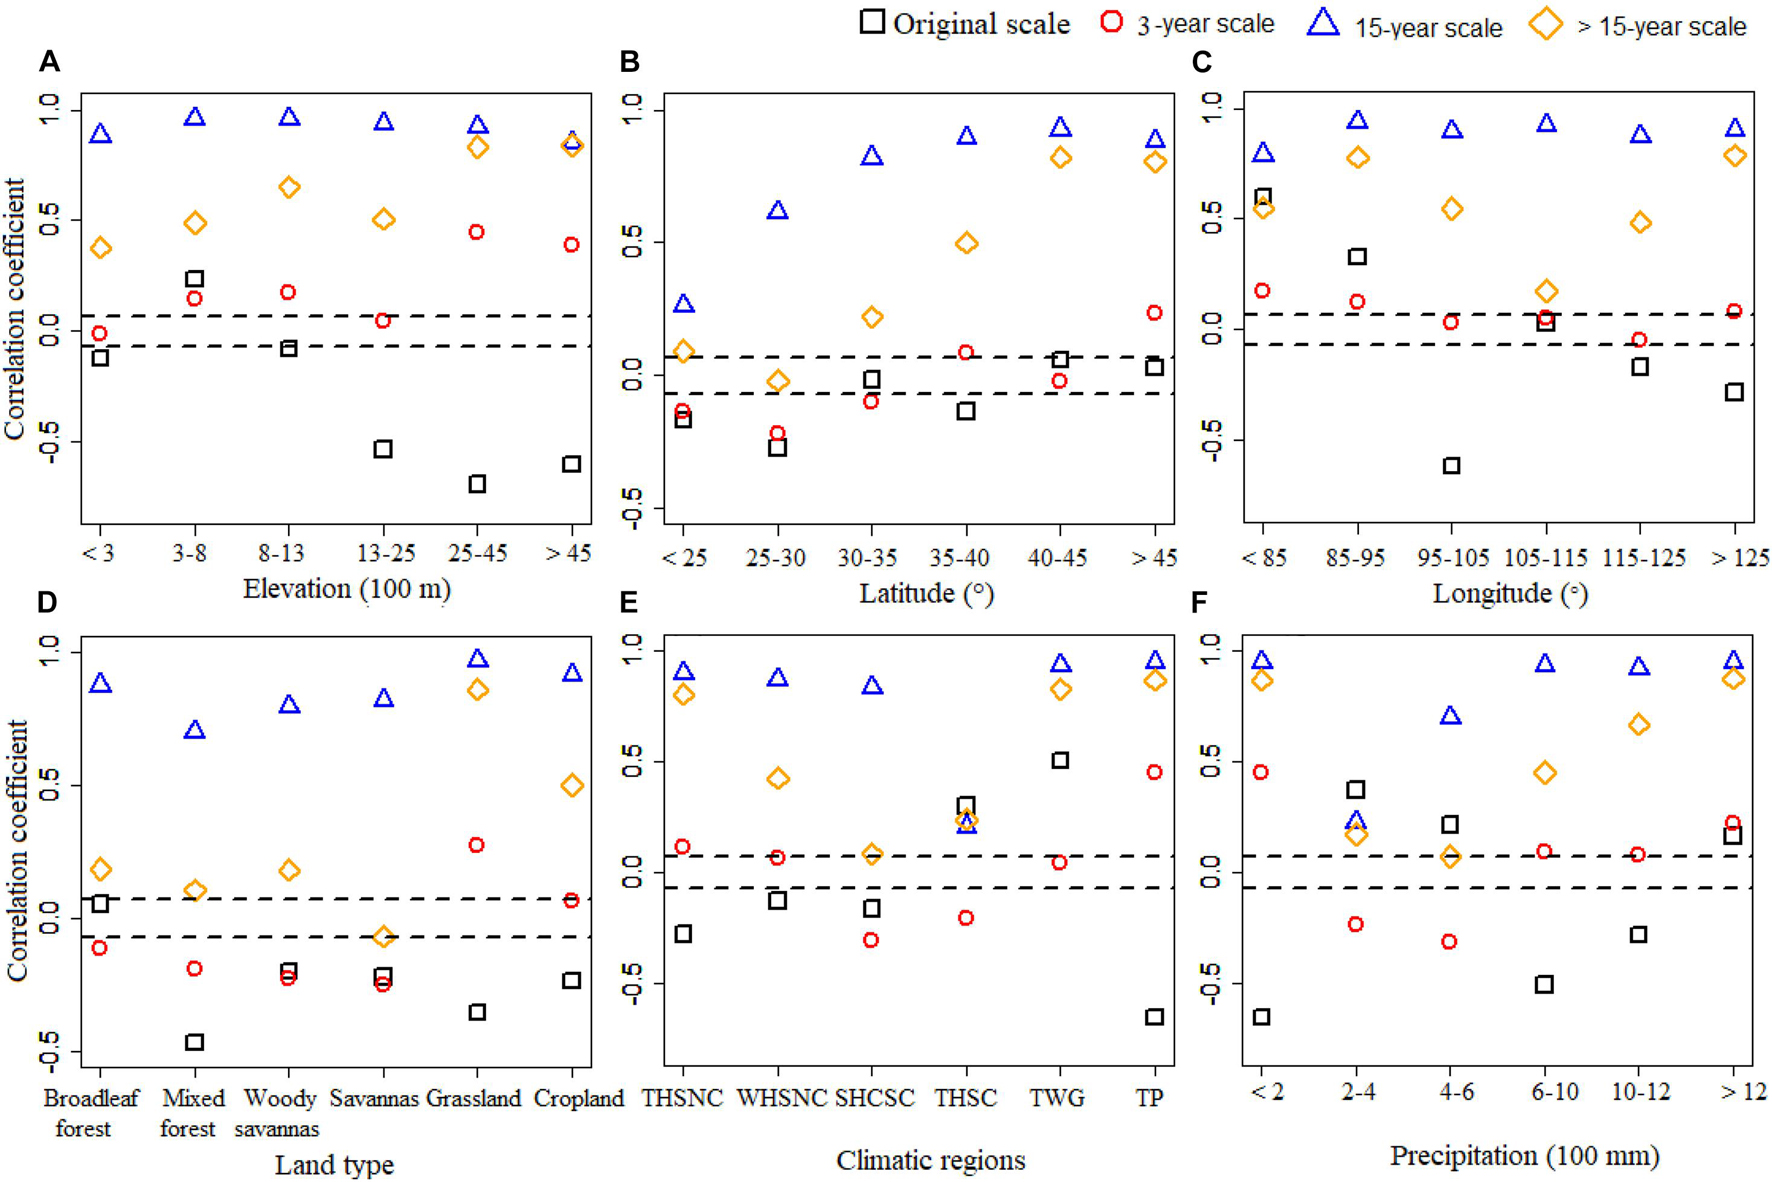
Figure 5. Temporal correlation between NDVI and daily range of temperature (DRT) under different (A) elevation, (B) latitude, (C) longitude, (D) land type, (E) climatic regions, and (F) precipitation at the original scale and multiple temporal scales. NDVI, normalized difference vegetation index.
The temporal relationships between NDVI and AP under different regions are shown in Figure 6. Relationships under different regions at the half-month scale were generally positive and significant and greater than the other multi-temporal scale. At >1,300 elevation, correlations between NDVI and AP were significantly negative at 15 years and >15-year time scales. The strength of the correlation between NDVI and AP was increased with the increased latitude, and their correlations varied greatly under different latitudes at the 3-, 15-, or >15-year scales. At different longitudes, the correlations were similar at the half-month scale, but varied greatly at multi-temporal scales. At different land types, the correlations between NDVI and AP at the half-month and >15-year scales were the weakest under mixed forest, and at the 3- or 15-year scales, the correlations were weakest under cropland. The correlations between NDVI and AP in southeast China were weakest in different climates at the half-month, 15-year, and >15-year scales. The effects of AP on NDVI were weakest in the 200–600 mm precipitation region at the half-month scale.
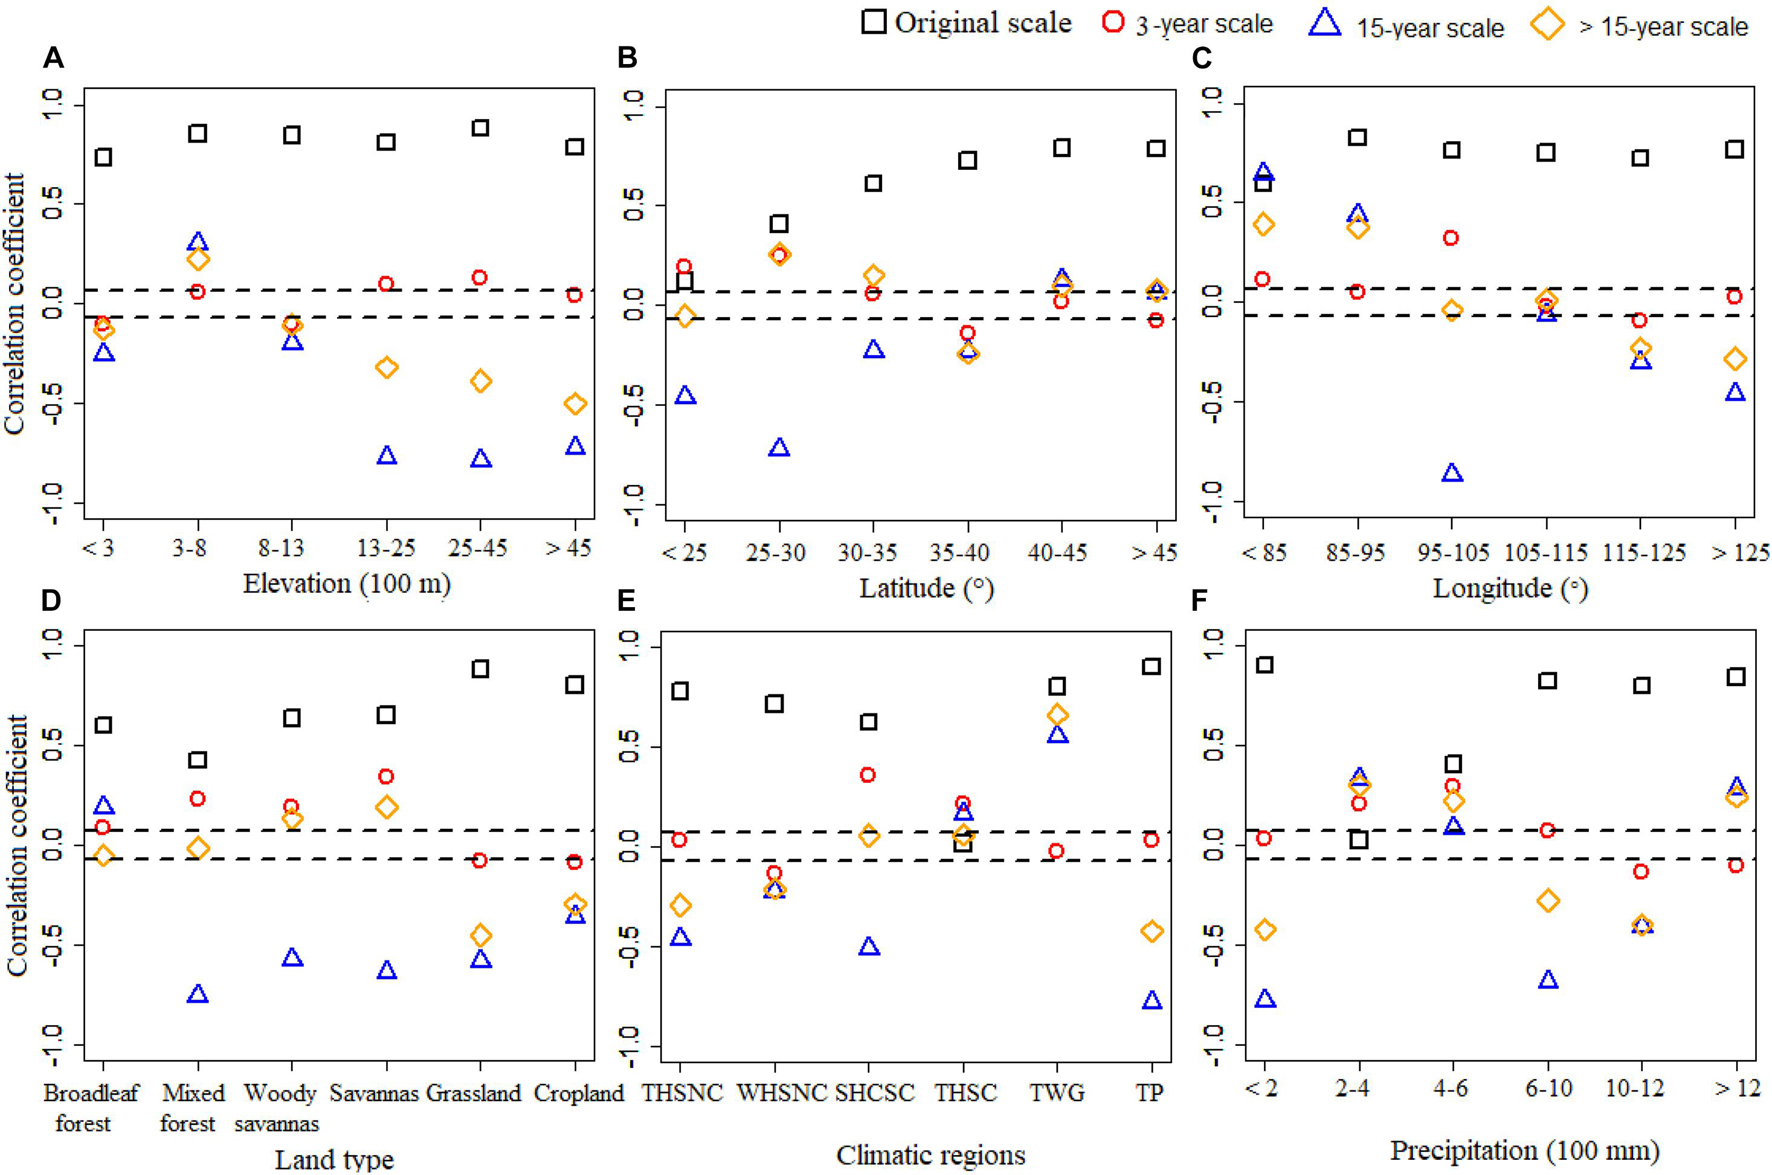
Figure 6. Temporal correlation between NDVI and accumulated precipitation (AP) under different (A) elevation, (B) latitude, (C) longitude, (D) land type, (E) climatic regions, and (F) precipitation at the original scale and multiple temporal scales. NDVI, normalized difference vegetation index.
Multi-Spatial Scale Effects of Climatic Factors on Vegetation
The temporal-averaged NDVI, DMT, DRT, and AP across China were decomposed into three IMFs and residue, and the averaged spatial scales and variance explained by each scale component are shown in Table 3. The dominant variation of the original dataset occurred in IMF1 and the residue, which covered spatial scales of 2 × 10⁴ and >10 × 104 km2, respectively. The spatial distributions of local correlation coefficients between NDVI and climatic factors at the original scale or spatial scales of 2 × 10⁴ and >10 × 104 km2 are shown in Figure 7. At the large scale of >10 × 104 km2, the correlation between NDVI and DMT was negative in TWG and was positive in other land-use types. However, the correlation between NDVI and DRT was positive across all of China except for the warm-temperature humid and subhumid north China (WHSNC) region. The type of relationship between NDVI and AP was mainly positive except in the regions of the northeast and southeast China.
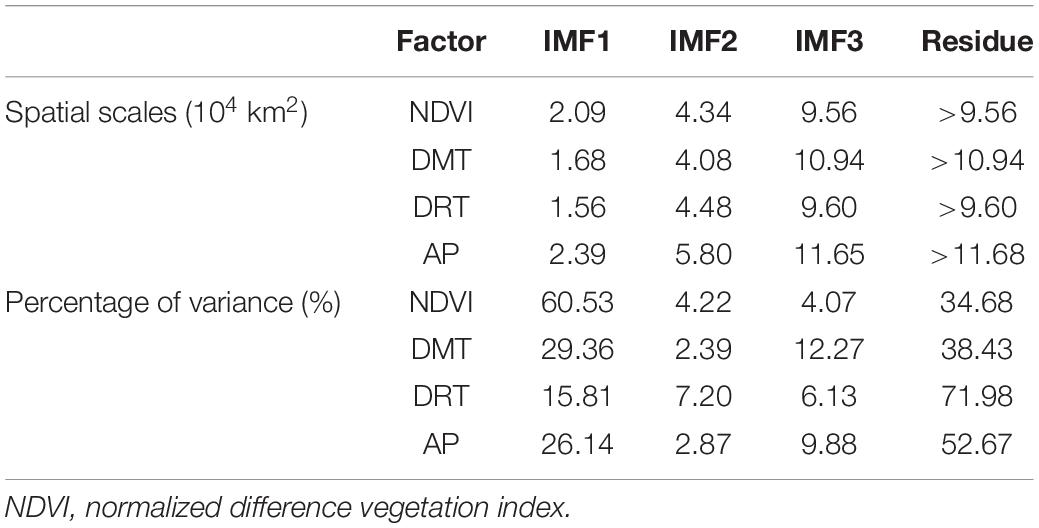
Table 3. The averaged spatial scales and percentage of variance are explained by each intrinsic mode function (IMF) of NDVI, daily mean temperature (DMT), daily range of temperature (DRT), and accumulated precipitation (AP).
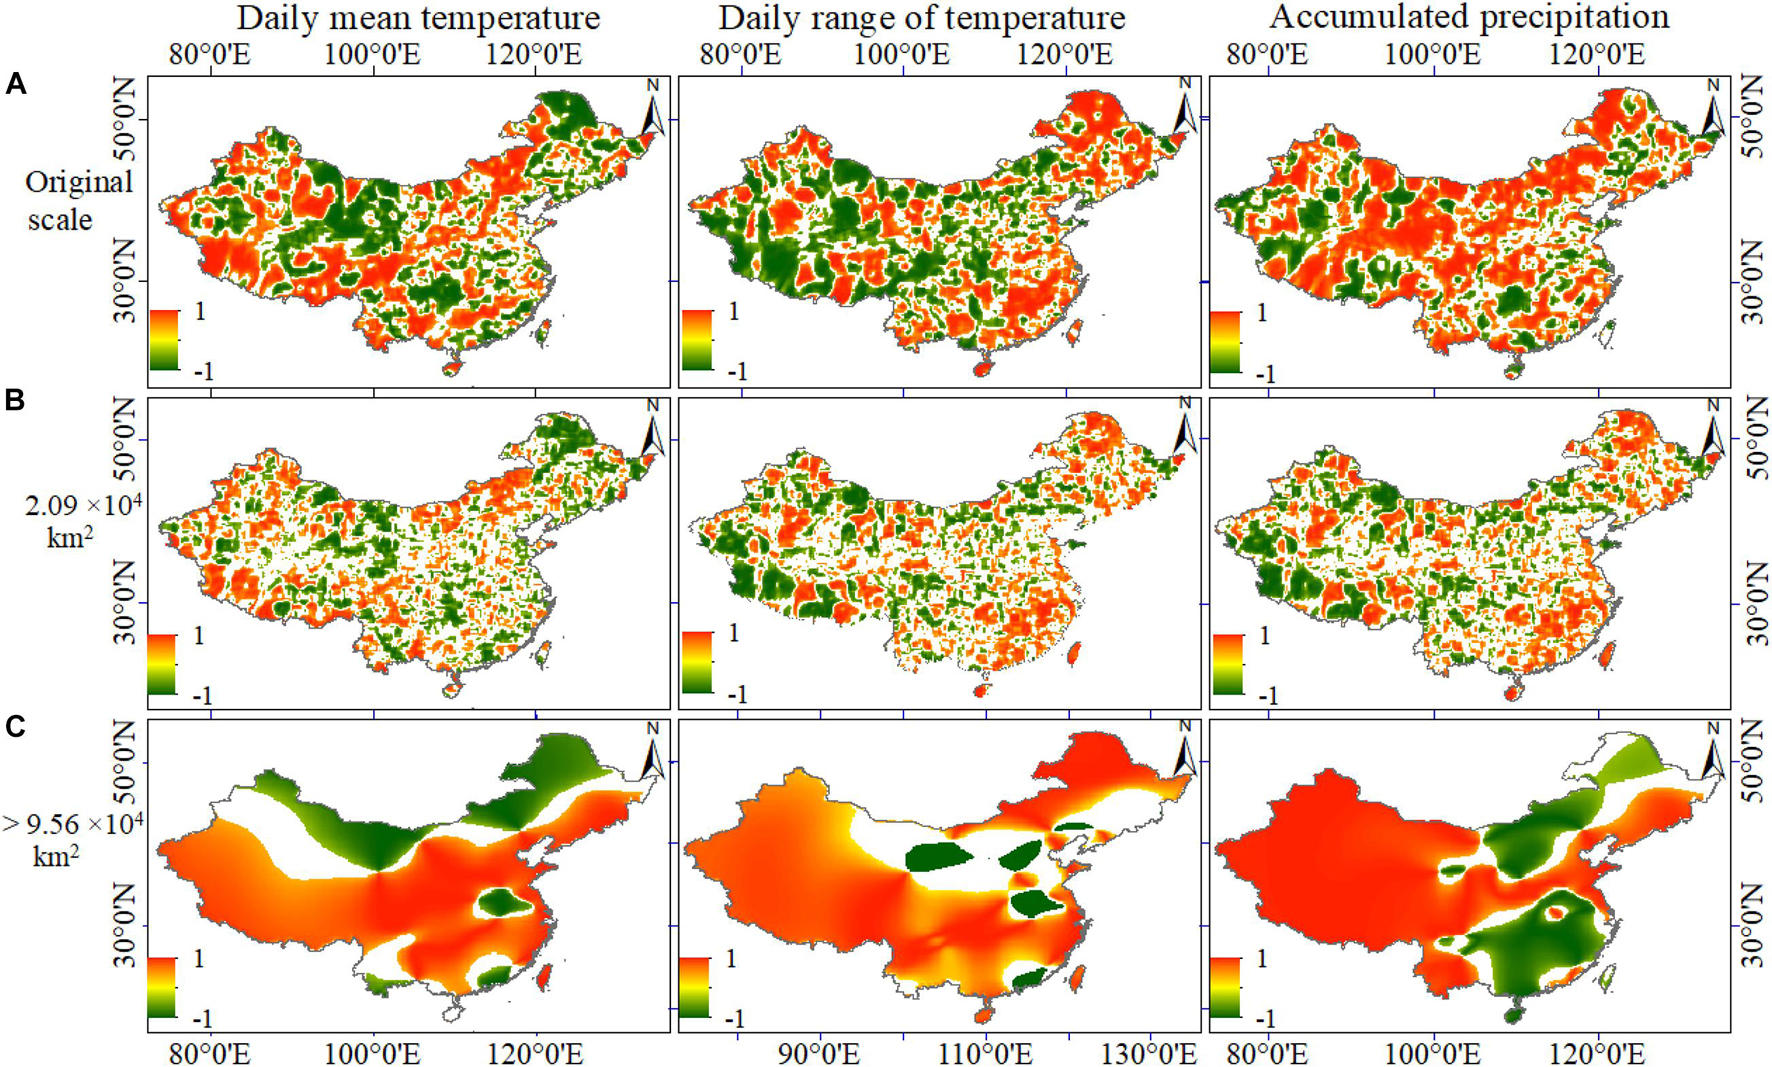
Figure 7. Spatial distribution of local correlation coefficients between mean annual-maximum NDVI and mean annual climatic factors at different spatial scales, including (A) original scale, (B) 2.09 × 10⁴ km2 scale, and (C) >9.56 × 10⁴ km2 scale. NDVI, normalized difference vegetation index.
The spatial distributions of SMLR-predicted error based on climatic factors at the original scale and multi-spatial scales are shown in Figure 8. For the predicted NDVI from climatic factors at the original scale, 57.13% of the area had low predictive values, and 42.87% of the area had high predictive values. The high predictive values were mainly located in the TWG. For the predicted NDVI from climatic factors at the multi-spatial scale, 55.24% of the area had low predictive values, and 44.76% of the area had high predictive values. However, the original scale and the multi-spatial scale predicted errors showed different spatial patterns, as shown in Figure 8C. Based on climatic factors at the multi-spatial scales, 64.38% of the area had low predictive values and 35.28% had high predictive values. Thus, the accuracy of predictions based on the climatic factors at the multi-spatial scale was generally higher and was mainly located in the northwest and south of China.

Figure 8. Spatial distribution of predicted error based on climatic factors using SMLR (A) at the original scale, (B) at multi-spatial scales, and (C) error difference between (A,B). SMLR, stepwise multiple linear regression.
Scatter plots between measured and predicted NDVI using SMLR based on climatic factors at the original scale or the multi-spatial scale are shown in Figure 9. The overall predicted accuracy from climatic factors at the multi-spatial scale was better than those predicted from climatic factors at the original scale. This indicated that considering multi-spatial scale effects improved predictions.
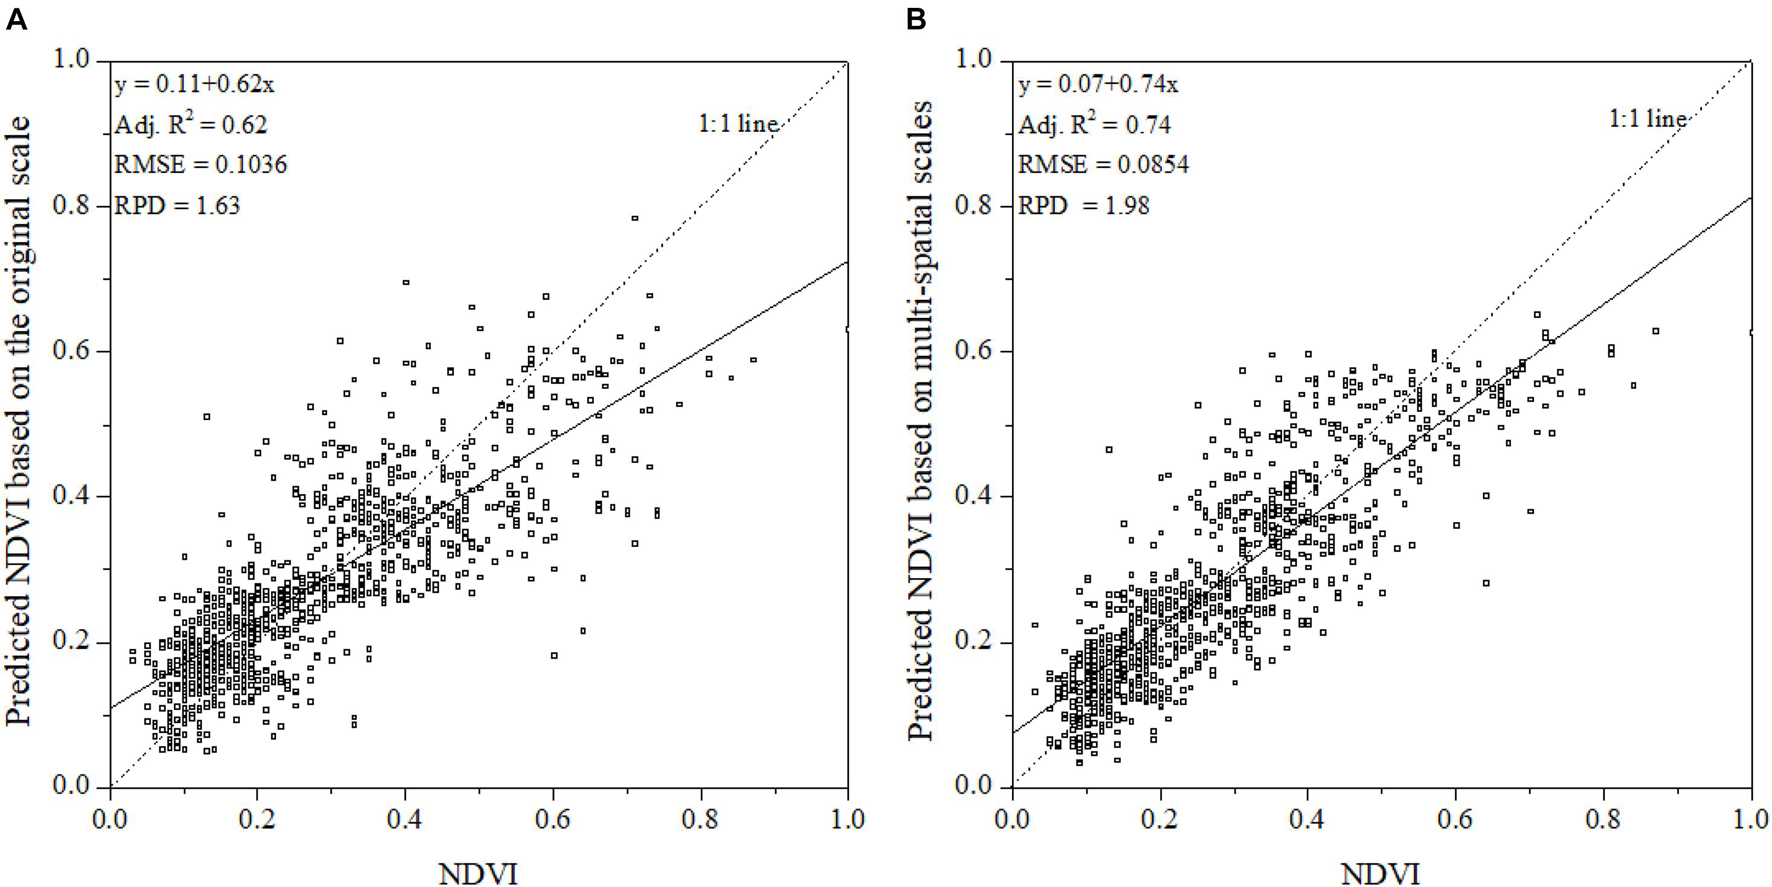
Figure 9. Scatter plots between NDVI and predicted NDVI using SMLR based on climatic factors (A) at the original scale, and (B) at multi-spatial scales. NDVI, normalized difference vegetation index; SMLR, stepwise multiple linear regression.
Discussion
Relationships Between Normalized Difference Vegetation Index and Climatic Factors at Multi-Temporal Scales
The vegetation temporal data were divided into the oscillations at 3-, 5-, 7-, 15-, and >15-year scales and showed an increasing trend using the CEEMD. The 3-, 15-, and >15-year oscillations contributed more variation than the other time scales. Vegetation dynamics were dominated by the 3-, 15-, and >15-year scales. The dominant oscillations at these temporal scales showed spatial variability, which could lead to spatial heterogeneity of the relationships between vegetation and climatic factors. The relationships between NDVI and climatic factors at the 3-year scale were generally not significant in north China, which might be attributed to the difference in climatic conditions. The correlations between NDVI and DRT, and NDVI and AP in the 200–600 mm precipitation zone were differed compared with other areas at the 15 and >15-year temporal scales. This might be attributed to the difference in vegetation types because the transition zones between agriculture and animal husbandry, and the transition zone between grassland and cultivated land, are located in the 200–600 mm precipitation zone (Li et al., 2019).
Previous studies have reported a positive relationship between vegetation and temperature (Hou et al., 2015; Liu et al., 2018), which is consistent with the results at the half-month scale and 15-year scale. However, the spatial heterogeneity of the relationships between NDVI and AP and NDVI and DRT in the 200–600 mm precipitation zone was not captured in previous studies. Moreover, the correlation coefficients at different latitude, longitude, climatic regions, and precipitation were varied at different temporal scales showing that factors affecting NDVI occur at many scales. Previous studies have indicated that spatial heterogeneity of relationships is driven by the spatial variation in climatic conditions, vegetation types, and topography (Hou et al., 2015; Liu et al., 2018). Consistent with this, our results suggest that the relationships between vegetation and climatic factors were varied at different temporal scales, and these relationships were largely driven by variation in climatic conditions, vegetation type, and topography.
The spatial patterns of NDVI prediction accuracy from climatic factors at the half-month scale and at the multi-temporal scale were similar and had the highest R2 in the 200–600 mm precipitation zone. This might be due to variation in vegetation in the transition zone. Although spatial patterns of the half-month scale and multi-temporal scale were the same, predictions were more accurate when the multi-temporal scale data were used instead of the original scale. This suggests the multi-temporal scale should be considered for NDVI prediction in most areas of China.
Relationships Between Normalized Difference Vegetation Index and Climatic Factors at the Multi-Spatial Scales
The spatial distribution of temporal-averaged vegetation could be divided into oscillations of 2 × 10⁴, 4 × 10⁴, 10 × 104, and >10 × 104 km2 scales using the 2D-EMD. The 2 × 10⁴ and >10 × 104 km2 oscillations contributed the most variance and were considered the dominant spatial scales.
At the 9.56 × 10⁴ km2 spatial scale, vegetation and climatic factors demonstrated the spatial trends of their relationships. The relationship between NDVI and DMT was positive in the south and middle of China and negative in the north of China. This indicated the positive effect of DMT on NDVI in areas with high temperature and the negative effect of DMT on NDVI in areas with low temperature. The relationships between NDVI and DRT were mainly positive except in the WHSNC, demonstrating the positive effect of DRT on NDVI in regions with greater ranges in temperature. The relationships between NDVI and AP were mainly negative in the northeast and southeast China, which indicated the negative effect of AP on NDVI in regions with higher precipitation and part of the <200 mm precipitation region.
Comparing the predicted error based on climatic factors at the original scale with that at the multi-spatial scale, the spatial patterns showed the effect of multi-spatial scale climatic factors on NDVI. When predicting NDVI, our results suggest 35.28% of China should use the original data scale while the remaining 64.38% should consider using multi-spatial scale data. The multi-temporal scale effect was more universal than the multi-spatial scale effect on the vegetation indicators.
Conclusion
The multi-temporal scale effects of climatic factors on NDVI were analyzed using the CEEMD method, and their multi-spatial scale effect was analyzed using the 2D-EMD method.
(1) The temporal variation of vegetation was dominated by 3-, 15-, and >15-year time scales, and the spatial variation of vegetation was controlled by spatial scales of 2 × 10⁴ and >10 × 104 km2.
(2) At the 15-year time scale, there were pronounced spatial patterns for the relationships between NDVI and climatic factors. The correlations between DMT and NDVI were mostly positive, the correlations between DRT and NDVI were mainly negative in the 200–600 mm precipitation zone, and the correlations between AP and NDVI were mainly positive in the 200–1,000 mm precipitation zone. The temporal relationships between NDVI and DMT and NDVI and AP were gradually increased with increasing latitude at the 15-day scale, and the temporal relationships between DRT and NDVI were gradually increased with increasing latitude at the 15-year scale. The multi-temporal scale effect was the greatest under mixed forest and the weakest under broadleaf forest. Moreover, 98.08% of the study area included multi-temporal scale effects.
(3) The spatial relationships between NDVI and climatic factors were pronounced at a spatial scale of >10 × 104 km2. The spatial relationship between DMT and NDVI was strongly positive across China except in the TWG region, and the relationship between AP and NDVI was strongly negative in the northeast and southeast regions of China. The area with multi-spatial scale effects was about 64.38%, and regions that were less affected by multi-spatial scales were mainly located in the Xinjiang and Yunnan Provinces.
Data Availability Statement
The original contributions presented in the study are included in the article/supplementary materials, further inquiries can be directed to the corresponding author/s.
Author Contributions
YJ and HZ conceived and designed the manuscript, and analyzed the data. RB discussed the results. HZ wrote the manuscript while the other authors supported in writing the manuscript. All authors contributed to the article and approved the submitted version.
Funding
This work was financially supported by the Natural Science Foundation of Shanxi Province (201801D221103) and Research Project of Shanxi Scholarship Council of China (2017-075).
Conflict of Interest
The authors declare that the research was conducted in the absence of any commercial or financial relationships that could be construed as a potential conflict of interest.
Publisher’s Note
All claims expressed in this article are solely those of the authors and do not necessarily represent those of their affiliated organizations, or those of the publisher, the editors and the reviewers. Any product that may be evaluated in this article, or claim that may be made by its manufacturer, is not guaranteed or endorsed by the publisher.
Footnotes
References
Bai, L., Yang, L., Song, B., and Liu, N. (2020). A new approach to develop a climate classification for building energy efficiency addressing Chinese climate characteristics. Energy 195:116982. doi: 10.1016/j.energy.2020.116982
Biswas, A. (2018). Scale–location specific soil spatial variability: A comparison of continuous wavelet transform and Hilbert–Huang transform. Catena 160, 24–31. doi: 10.1016/j.catena.2017.08.019
Buitenwerf, R., Rose, L., and Higgins, S. I. (2015). Three decades of multi-dimensional change in global leaf phenology. Nat. Clim. Change 5, 364–368. doi: 10.1038/nclimate2533
Goovaerts, P. (1998). Geostatistical tools for characterizing the spatial variability of microbiological and physico-chemical soil properties. Biol. Fert. Soils 27, 315–334. doi: 10.1007/s003740050439
Hou, W., Jiangbo, G., Shaohong, W., and Erfu, D. (2015). Interannual Variations in Growing-Season NDVI and Its Correlation with Climate Variables in the Southwestern Karst Region of China. Remote Sens. 7, 11105–11124. doi: 10.3390/rs70911105
Huang, J., Wu, C., Minasny, B., Roudier, P., and McBratney, A. B. (2017). Unravelling scale- and location-specific variations in soil properties using the 2-dimensional empirical mode decomposition. Geoderma 307, 139–149. doi: 10.1016/j.geoderma.2017.07.024
Huang, N. E., Shen, Z., Long, S. R., Wu, M. C., Shih, H. H., Zheng, Q., et al. (1998). The empirical mode decomposition and the Hilbert spectrum for nonlinear and non-stationary time series analysis. Proc. R. Soc. Lon. Series A 454, 903–995. doi: 10.1098/rspa.1998.0193
IPCC (2013). Climate Change 2013: The Physical Science Basis. Cambridge, MA: Cambridge University Press.
Jiang, H., Xu, X., Guan, M., Wang, L., Huang, Y., and Jiang, Y. (2019). Determining the contributions of climate change and human activities to vegetation dynamics in agro-pastural transitional zone of northern China from 2000 to 2015. Sci. Total Env. 2019:134871. doi: 10.1016/j.scitotenv.2019.134871
Kong, D., Zhang, Q., Singh, V. P., and Shi, P. (2017). Seasonal vegetation response to climate change in the northern hemisphere (1982–2013). Glob. Planet. Change 2017:S0921818116302260.
Li, Y., Xie, Z., Qin, Y., and Zheng, Z. (2019). Estimating Relations of Vegetation, Climate Change, and Human Activity: A Case Study in the 400 mm Annual Precipitation Fluctuation Zone, China. Remote Sens. 11:1159. doi: 10.3390/rs11101159
Liu, H., Zhang, M., Lin, Z., and Xu, X. (2018). Spatial heterogeneity of the relationship between vegetation dynamics and climate change and their driving forces at multiple time scales in Southwest China. Agricult. Forest Meteorol. 25, 10–21. doi: 10.1016/j.agrformet.2018.02.015
Peng, H., Guo, Q., Ding, H., Hong, B., Zhu, Y., Hong, Y., et al. (2019). Multi-scale temporal variation in methane emission from an alpine peatland on the Eastern Qinghai-Tibetan Plateau and associated environmental controls. Agricult. Forest Meteorol. 27:107616. doi: 10.1016/j.agrformet.2019.107616
Qu, S., Wang, L., Lin, A., Yu, D., Yuan, M., and Li, C. A. (2020). Distinguishing the impacts of climate change and anthropogenic factors on vegetation dynamics in the Yangtze River Basin, China. Ecol. Indicat. 108:105724. doi: 10.1016/j.ecolind.2019.105724
Rathinasamy, M., Agarwal, A., Sivakumar, B., Marwan, N., and Kurths, J. (2019). Wavelet analysis of precipitation extremes over India and teleconnections to climate indices. Stochast. Env. Res. Risk Assessment 33, 2053–2069. doi: 10.1007/s00477-019-01738-3
Roudier, P. (2016). spemd: A Bi-dimensional Implementation of the Empirical Mode Decomposition for Spatial Data, R Package Version 0.1-0. doi: 10.5281/zenodo.58317
Sun, C., Liu, Y., Song, H., Li, Q., Cai, Q., Wang, L., et al. (2020). Tree-ring evidence of the impacts of climate change and agricultural cultivation on vegetation coverage in the upper reaches of the Weihe River, northwest China. Sci. Total Env. 707:136160. doi: 10.1016/j.scitotenv.2019.136160
Tong, S., Zhang, J., Ha, S., Lai, Q., and Ma, Q. (2016). Dynamics of Fractional Vegetation Coverage and Its Relationship with Climate and Human Activities in Inner Mongolia, China. Remote Sens. 8:776.
Torres, M. I. E., Colominas, M. A., Schlotthauer, G. N., and Flandrin, P. (2011). “A Complete Ensemble Empirical Mode Decomposition with Adaptive Noise,” in Proceedings of the IEEE International Conference on Acoustics, Speech, and Signal Processing, ICASSP-11, (EEE), 4144–4147.
Wu, Z., and Huang, N. (2009). Ensemble Empirical Mode Decomposition: a Noise-Assisted Data Analysis Method. Adv. Adapt. Data Anal. 1, 1–41. doi: 10.1142/S1793536909000047
Yin, Y., Ma, D., Wu, S., Dai, E., Zhu, Z., and Myneni, R. B. (2017). Nonlinear variations of forest leaf area index over China during 1982–2010 based on EEMD method. Internat. J. Biometeorol. 61, 977–988. doi: 10.1007/s00484-016-1277-x
Zhao, S. (1983). A new scheme for comprehensive physical regionalization in China. Acta Geograph. Sin. 50, 1–10.
Keywords: multiple temporal scale, multiple spatial scale, complete ensemble empirical mode decomposition (CEEMD), two-dimensional empirical mode decomposition (2D-EMD), scale component
Citation: Jing Y, Zhu H, Bi R and Hou M (2021) Using Temporal and Spatial Scales to Unravel the Effects of Climatic Factors on Vegetation Variations in China. Front. Ecol. Evol. 9:730673. doi: 10.3389/fevo.2021.730673
Received: 25 June 2021; Accepted: 13 October 2021;
Published: 11 November 2021.
Edited by:
Marco Casazza, University of Naples Parthenope, ItalyReviewed by:
Costica Nitu, Politehnica University of Bucharest, RomaniaMin Li, Northwest A&F University Herbarium, China
Copyright © 2021 Jing, Zhu, Bi and Hou. This is an open-access article distributed under the terms of the Creative Commons Attribution License (CC BY). The use, distribution or reproduction in other forums is permitted, provided the original author(s) and the copyright owner(s) are credited and that the original publication in this journal is cited, in accordance with accepted academic practice. No use, distribution or reproduction is permitted which does not comply with these terms.
*Correspondence: Hongfen Zhu, aG9uZ2Z6aEAxNjMuY29t
 Yaodong Jing1,2
 Hongfen Zhu