 Xun Zhang
 Yike Liang
 Xiang Li
 Gang Lin
 Ying Liu
- 1Beijing Key Laboratory of Big Data Technology for Food Safety, School of Computer Science and Engineering, Beijing Technology and Business University, Beijing, China
- 2Key Laboratory of Resources Utilization and Environmental Remediation, Institute of Geographic Sciences and Natural Resources Research, Chinese Academy of Sciences (CAS), Beijing, China
- 3College of Geoscience and Surveying Engineering, China University of Mining and Technology-Beijing, Beijing, China
- 4Institute of Geographic Sciences and Natural Resources Research, Chinese Academy of Sciences (CAS), Beijing, China
Under the background of global climate change, the impact from drought on the ecosystem exhibits the characteristics of complexity and multi-process, especially for the main component, which is the grassland ecosystem of the overall ecosystem. Identifying past droughts and predicting future ones is vital in limiting their effects. However, the random and non-linear nature of drought variables makes accurate drought prediction still a challenging scientific problem. In this study, the boundaries, Land Surface Temperature (LST) and Enhanced Vegetation Index (EVI) of Asian Grassland Ecosystem (AGE) were obtained by Google Earth Engine (GEE), which were used to construct LST-EVI feature spaces to calculate the dry-wet edge fitting equations and Temperature Vegetation Drought Index (TVDI). Mann–Kendall test and Sen trend degrees were further used to analyze the drought trend of AGE. The results showed that there were obvious spatial differences in the wet and dry conditions of AGE, which showed that the TVDI increased from east to west and from north to south, with humid areas mainly concentrated in northern Asia and severe drought areas concentrated in southern Asia. From 2010 to 2018, the area of humid areas and severe drought areas of AGE decreased, and some humid areas changed to normal areas or even drought areas, while the drought in severe drought areas was alleviated. The results of the Sen trend test further show that the aggravating trend of drought in severe drought areas of South Asia is relatively low, and some areas show a trend of changing to humidity. However, there is an obvious aggravating trend of drought in humid areas or low drought areas of South Asia, these areas should also be the focus areas for drought prevention in the future. This study identified the spatio-temporal distribution characteristics and evaluated the evolution trend of the drought of AGE, which is of great significance to the management and prevention of drought of AGE.
Introduction
Under the influence of global warming, global extreme weather events are frequent. Drought, as one of the extreme weather events, is common in various historical periods of the world. It is characterized by high frequency, long cycles, and a wide range of impacts. With the passage of time, meteorological drought has gradually evolved into agricultural and hydrological drought, which has had profound effects on agricultural production (Zhang et al., 2015; Gan et al., 2016), water resources (Piao et al., 2010; Craft et al., 2015), ecosystem function (Zhong et al., 2019; Bastos et al., 2020) and environmental sustainability (Sun and Li, 2013; Sharafi et al., 2020). During periods of drought, reduced water flows into wetlands and groundwater aquifers, coupled with increased human water demand. This further reduces the availability of water to ecosystems, thus altering hydrogeological processes and affecting water bodies and terrestrial ecosystems in various ways. The end results are ecological droughts, with multiple knock-on effects such as ecological deterioration, ecosystem vulnerability and loss of ecological services (Li L. et al., 2020; Wang et al., 2021).
A large number of scholars have devoted themselves to the research of ecological drought monitoring, the driving mechanism of meteorological factors to ecological aridity, the driving mechanism of groundwater to ecological drought, and the evaluation of the ecological arid vulnerability. For example, Kim et al. (2019) conducted a quantitative assessment of water quality risks due to ecological drought by applying non-parametric kernel density estimates and hypothesizing the probability of rivers exceeding water-quality targets after extreme droughts. Studies have also been carried out to establish ecological drought indicators based on ecological flows. The study of Chu et al. (2019) showed that the Normalized Differential Vegetation Index (NDVI) in the growing season in the northeast of Heilongjiang was mainly regulated by precipitation, and the temperature was the dominant factor affecting the growth of spring vegetation, while there was a negative correlation between NDVI and precipitation in autumn. The work of Zhang G. et al. (2020) established the non-linear relationship between NDVI and groundwater depth based on information entropy. In the study of Crausbay et al. (2017), they established an ecological drought vulnerability research framework to reflect the ability of humans and natural systems to mitigate or adapt to drought, as well as the potential impact of drought on ecosystems. During this period, a series of drought indices, such as the Standardized Drought Vulnerability Index (SDVI) (Oikonomou et al., 2019), the Standard Precipitation Indices (SPI) (Mckee et al., 1993), the Palmer Drought Severity Indicator (PDSI) (Palmer, 1965), and the Standardized Precipitation-Evapotranspiration Index (SPEI) (Vicente-Serrano et al., 2010) were also established to represent the characteristics of drought in different regions and types.
With the development of remote sensing technology, many research methods have been widely used, such as using sensors to obtain spectral information of large-area surface vegetation, establishing different models of remote-sensing inversion and drought monitoring indexes, and then judging the degree and distribution range of the surface drought. For example, the Temperature Vegetation Dryness Index (TVDI) based on remote sensing data of vegetation and surface temperature calculation can indirectly reflect the effects of drought on vegetation and water consumption of vegetation. It is often used to describe the drought condition of terrestrial ecosystems. Several studies have also proved the reliability of this model (Sandholt et al., 2002; Du et al., 2017; Li C. et al., 2020; Kang et al., 2021).
Asia has a vast territory and great differences in topography. Under the combined effects of solar radiation, atmospheric circulation, and other factors, it has formed a prominent climate feature with a complete climate belt and complex climatic types. At the same time, large areas of Asia are affected by droughts, such as Thailand in Southeast Asia and the “no river countries” in West Asia (the “no river countries” refers to a country with no rivers which mainly includes Saudi Arabia, Kuwait, Oman, the United Arab Emirates, Qatar, Yemen, Bahrain, etc.) (Zong et al., 2017; Dai and Wang, 2020). The Taklamakan Desert, the second largest desert in the world, is also located in north-western China, East Asia. Therefore, the drought index measurement and drought trend analysis are very important for the terrestrial ecosystem in Asia, especially the grassland ecosystem, which is the main part of the whole ecosystem. Based on this, the boundaries, Land Surface Temperature (LST) and Enhanced Vegetation Index (EVI) of Asian Grassland Ecosystem (AGE) were obtained by Google Earth Engine (GEE), and TVDI and Sen trend degrees were used to evaluate the spatio-temporal distribution characteristics and evolution trend of AGE. Furthermore, the impact of changes in climate and environmental factors on ecosystems under the background of global climate change was explored. This was for the following aims: (1) provide data for drought monitoring of AGE; (2) provide a scientific basis for decision-makers to formulate targeted prevention and control measures to limit the development of drought; (3) provide technical support for the region to deal with terrestrial ecological drought caused by climate change.
Study Area and Data
Study Area
As the main body of the Eurasian continent, Asia has the highest plateaus, mountains, and peaks in the world, with a great difference in topography (Figure 1). At the same time, Asia has the widest north-south latitude span and the longest East-West distance (77°43′N∼11°7′S, 169°40W∼26°3′E), including all kinds of climatic zones from the equator to the Arctic, and the complicated topography and changeable climate caused the uneven spatio-temporal distribution of temperature and rainfall in Asia (Ge et al., 2015). For example, West Asia, which is deeply inland, is controlled by the continental air mass, making water vapor difficult to reach, so it is relatively arid. Although East Asia and South Asia are offshore, they are seriously affected by unstable monsoons. During the weak summer monsoon years, there is lower rainfall and drought disasters are more likely to occur. In addition, the spatial distribution of surface water in Asia is asymmetrically radiating under the constraints of geomorphological structure, mainly including desert-centered inland water systems, outflow systems on the outskirts of inland watersheds, and a few small rivers that flow into the Black Sea and the Mediterranean Sea, respectively. The extremely uneven distribution of surface water systems even led to the existence of “no river countries” such as Saudi Arabia, Kuwait, Oman, and other countries in West Asia (Gao, 2010; Li, 2020).
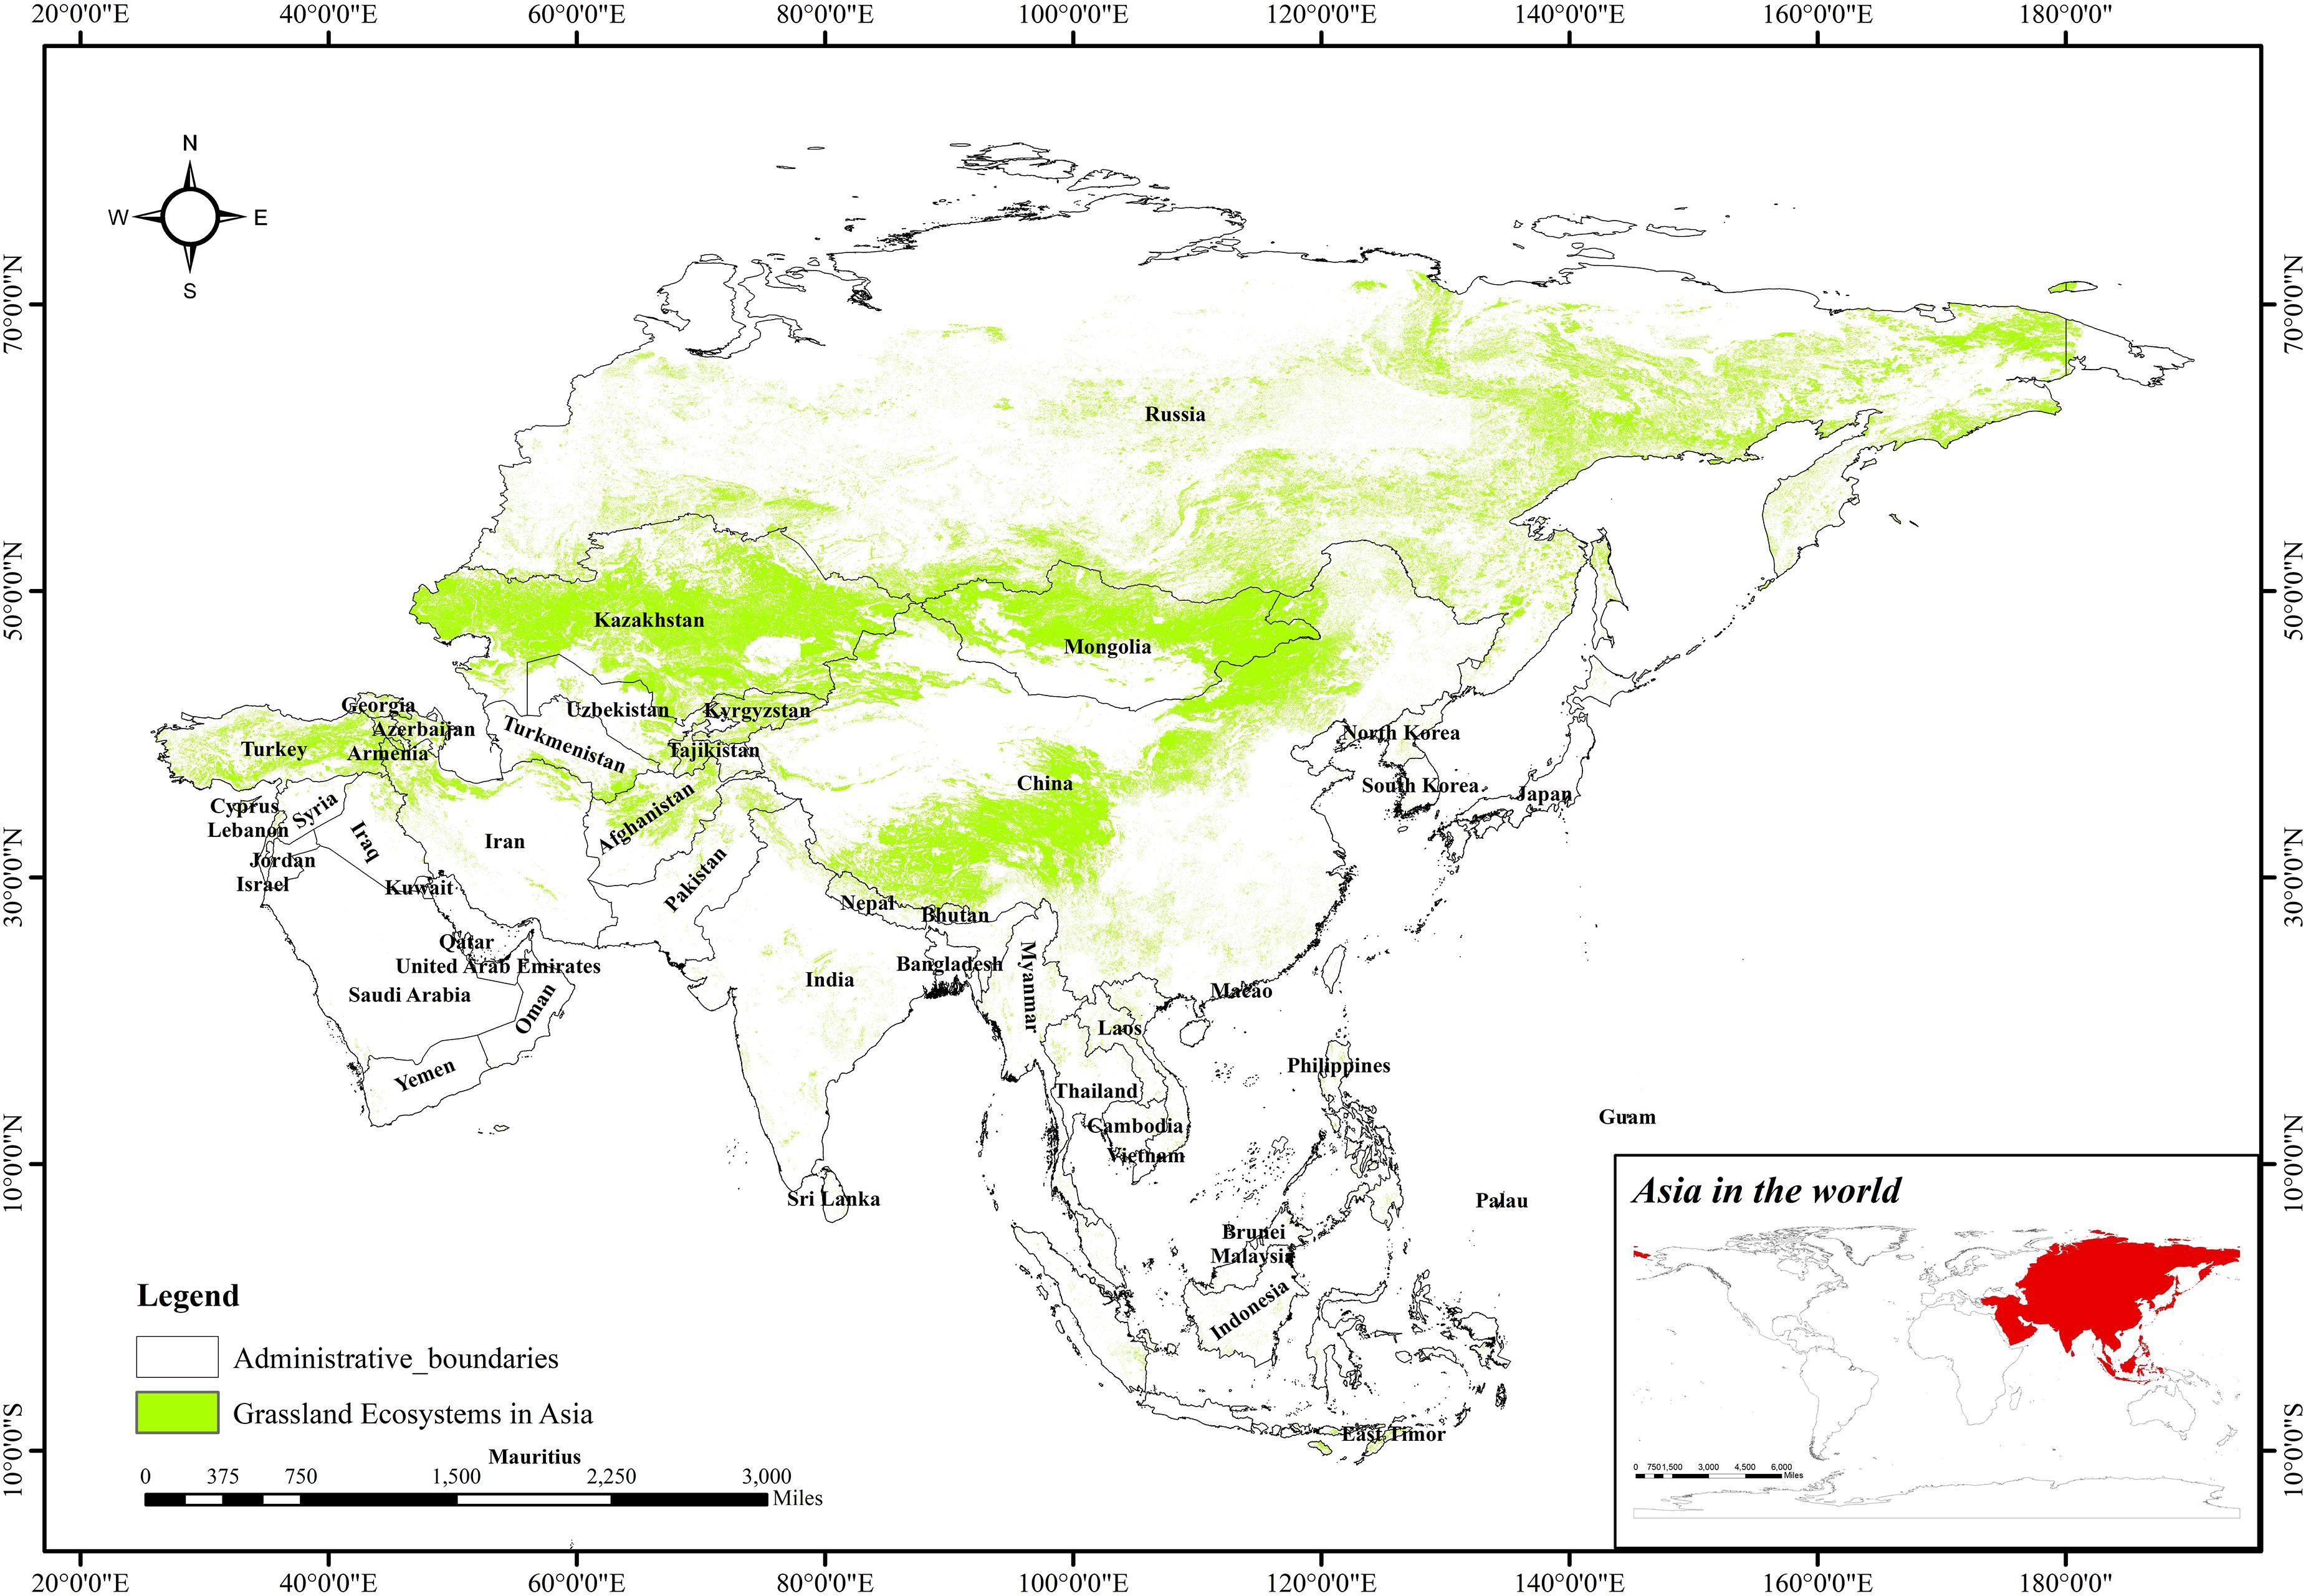
Figure 1. Location and topography of the study area (The boundaries, names, and designations are for illustrative purposes only and do not represent an official endorsement).
The vast spatial distribution has created regional differences between the coastal and inland regions of Asia, while at the same time creating geographical and landscape diversity, extremes, and typical. It provides the basis for the rich grassland ecosystems in Asia. The area of grassland ecosystems in Asia is about 2.897 billion hectares, accounting for 65.84% of the total terrestrial ecosystems of Asia, distributed mainly in Russia, China, Kazakhstan, Mongolia, Turkey, India, Indonesia, Iran, Afghanistan, Uzbekistan, and other countries (Table 1; Hu, 1999). With the intensification of global climate change, complex climate types in Asia are more affected, with droughts and intense evaporation in most areas, making the ecological environment in the region more fragile and the problem of grassland ecosystem drought more acute.
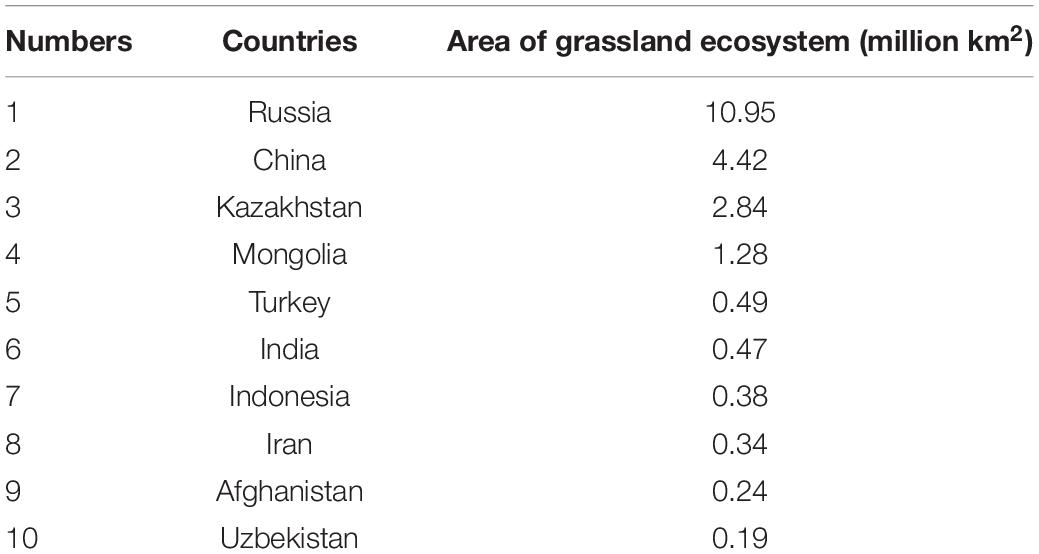
Table 1. Area of grassland ecosystems in major Asian countries or regions.
Data Acquisition
The administrative boundary data used in this study to describe the geographical position in Asia was derived from Global Map data archives, in vector data format, developed in cooperation with the National Geospatial-Intelligence Agency (NGIAs) and geospatial intelligence agency in other countries. The location and administrative boundaries information covering 48 countries or regions of Asia had been obtained in this study.
The data used to calculate TVDI in this study was derived from the MODelation-resolving Image Spectrometer (MODIS), which was processed by the GEE platform due to the large area and long time span of the calculated data (Gao, 2010; Didan, 2015; Wan et al., 2015; Friedl and Sulla-Menashe, 2019; Sun et al., 2021). After data acquisition, quality check, projection, resampling, clipping, and other pre-processing are carried out and the data at different time scales are calculated as annual data.
Asian Grassland Ecosystem was derived from global land cover data of a grid of 500 m2 provided by the MCD12Q1 V6 product (Friedl and Sulla-Menashe, 2019), which divided global land cover into 17 types. The Woody Savannas (tree cover 30–60%), Savannah (tree cover 10–30%), and Grasslands (dominated by herb bags annuals) from the Land Cover_Type1 (LC_Type1) classification of MCD12Q1 V6 product were extracted to the boundaries of AGE. Finally, the grassland in GlobeLand30 2020 has also been further adapted to modify the boundaries of AGE in this study (Jiang et al., 2006; Liu et al., 2021).
Land Surface Temperature was land surface temperature data of a grid of 1,200 km2 for an average of 8 days from MOD11A2 V6 (Wan et al., 2015). The value of each pixel in MOD11A2 V6 was a simple mean of all corresponding MODO11A1 LSTs collected during the 8 days and included data on day-time LDST, night-time LST, 31 and 32 band channel emissivity, and quality control. Twice as long as the 8-day cycle was the precise ground tracking repeat cycle of Terra and Aqua platforms, which to some extent ensured the accuracy of the LST data.
Enhanced Vegetation Index data minimized canopy background changes and maintained sensitivity under dense vegetation conditions. The EVI used in this study selected the best available pixel values from MOD13A2 V6 product collected over a 16-day period, which was calculated based on the atmospheric correction of the two-way surface albedo (Didan, 2015). Water, clouds, heavy aerosols, and cloud shadows were shielded. The EVI also used a blue band to remove residual atmospheric pollution from smog and subpixel thin clouds, using the criteria of low cloud cover, low perspective, and maximum EVI values. The data are presented in Table 2.
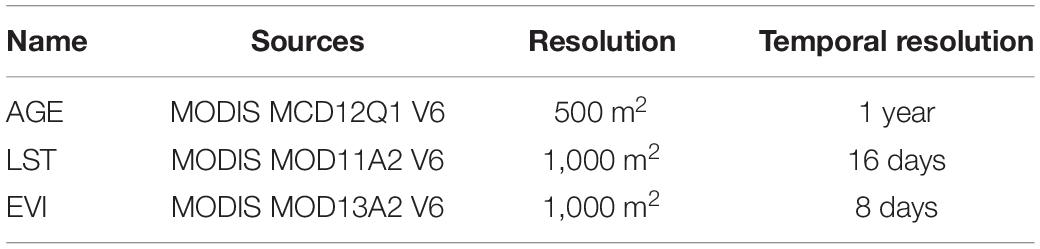
Table 2. Data description.
Methodology
Research Framework
The following steps had been taken to develop a framework for drought monitoring and spatio-temporal characteristics of drought trends for AGE (Figure 2):
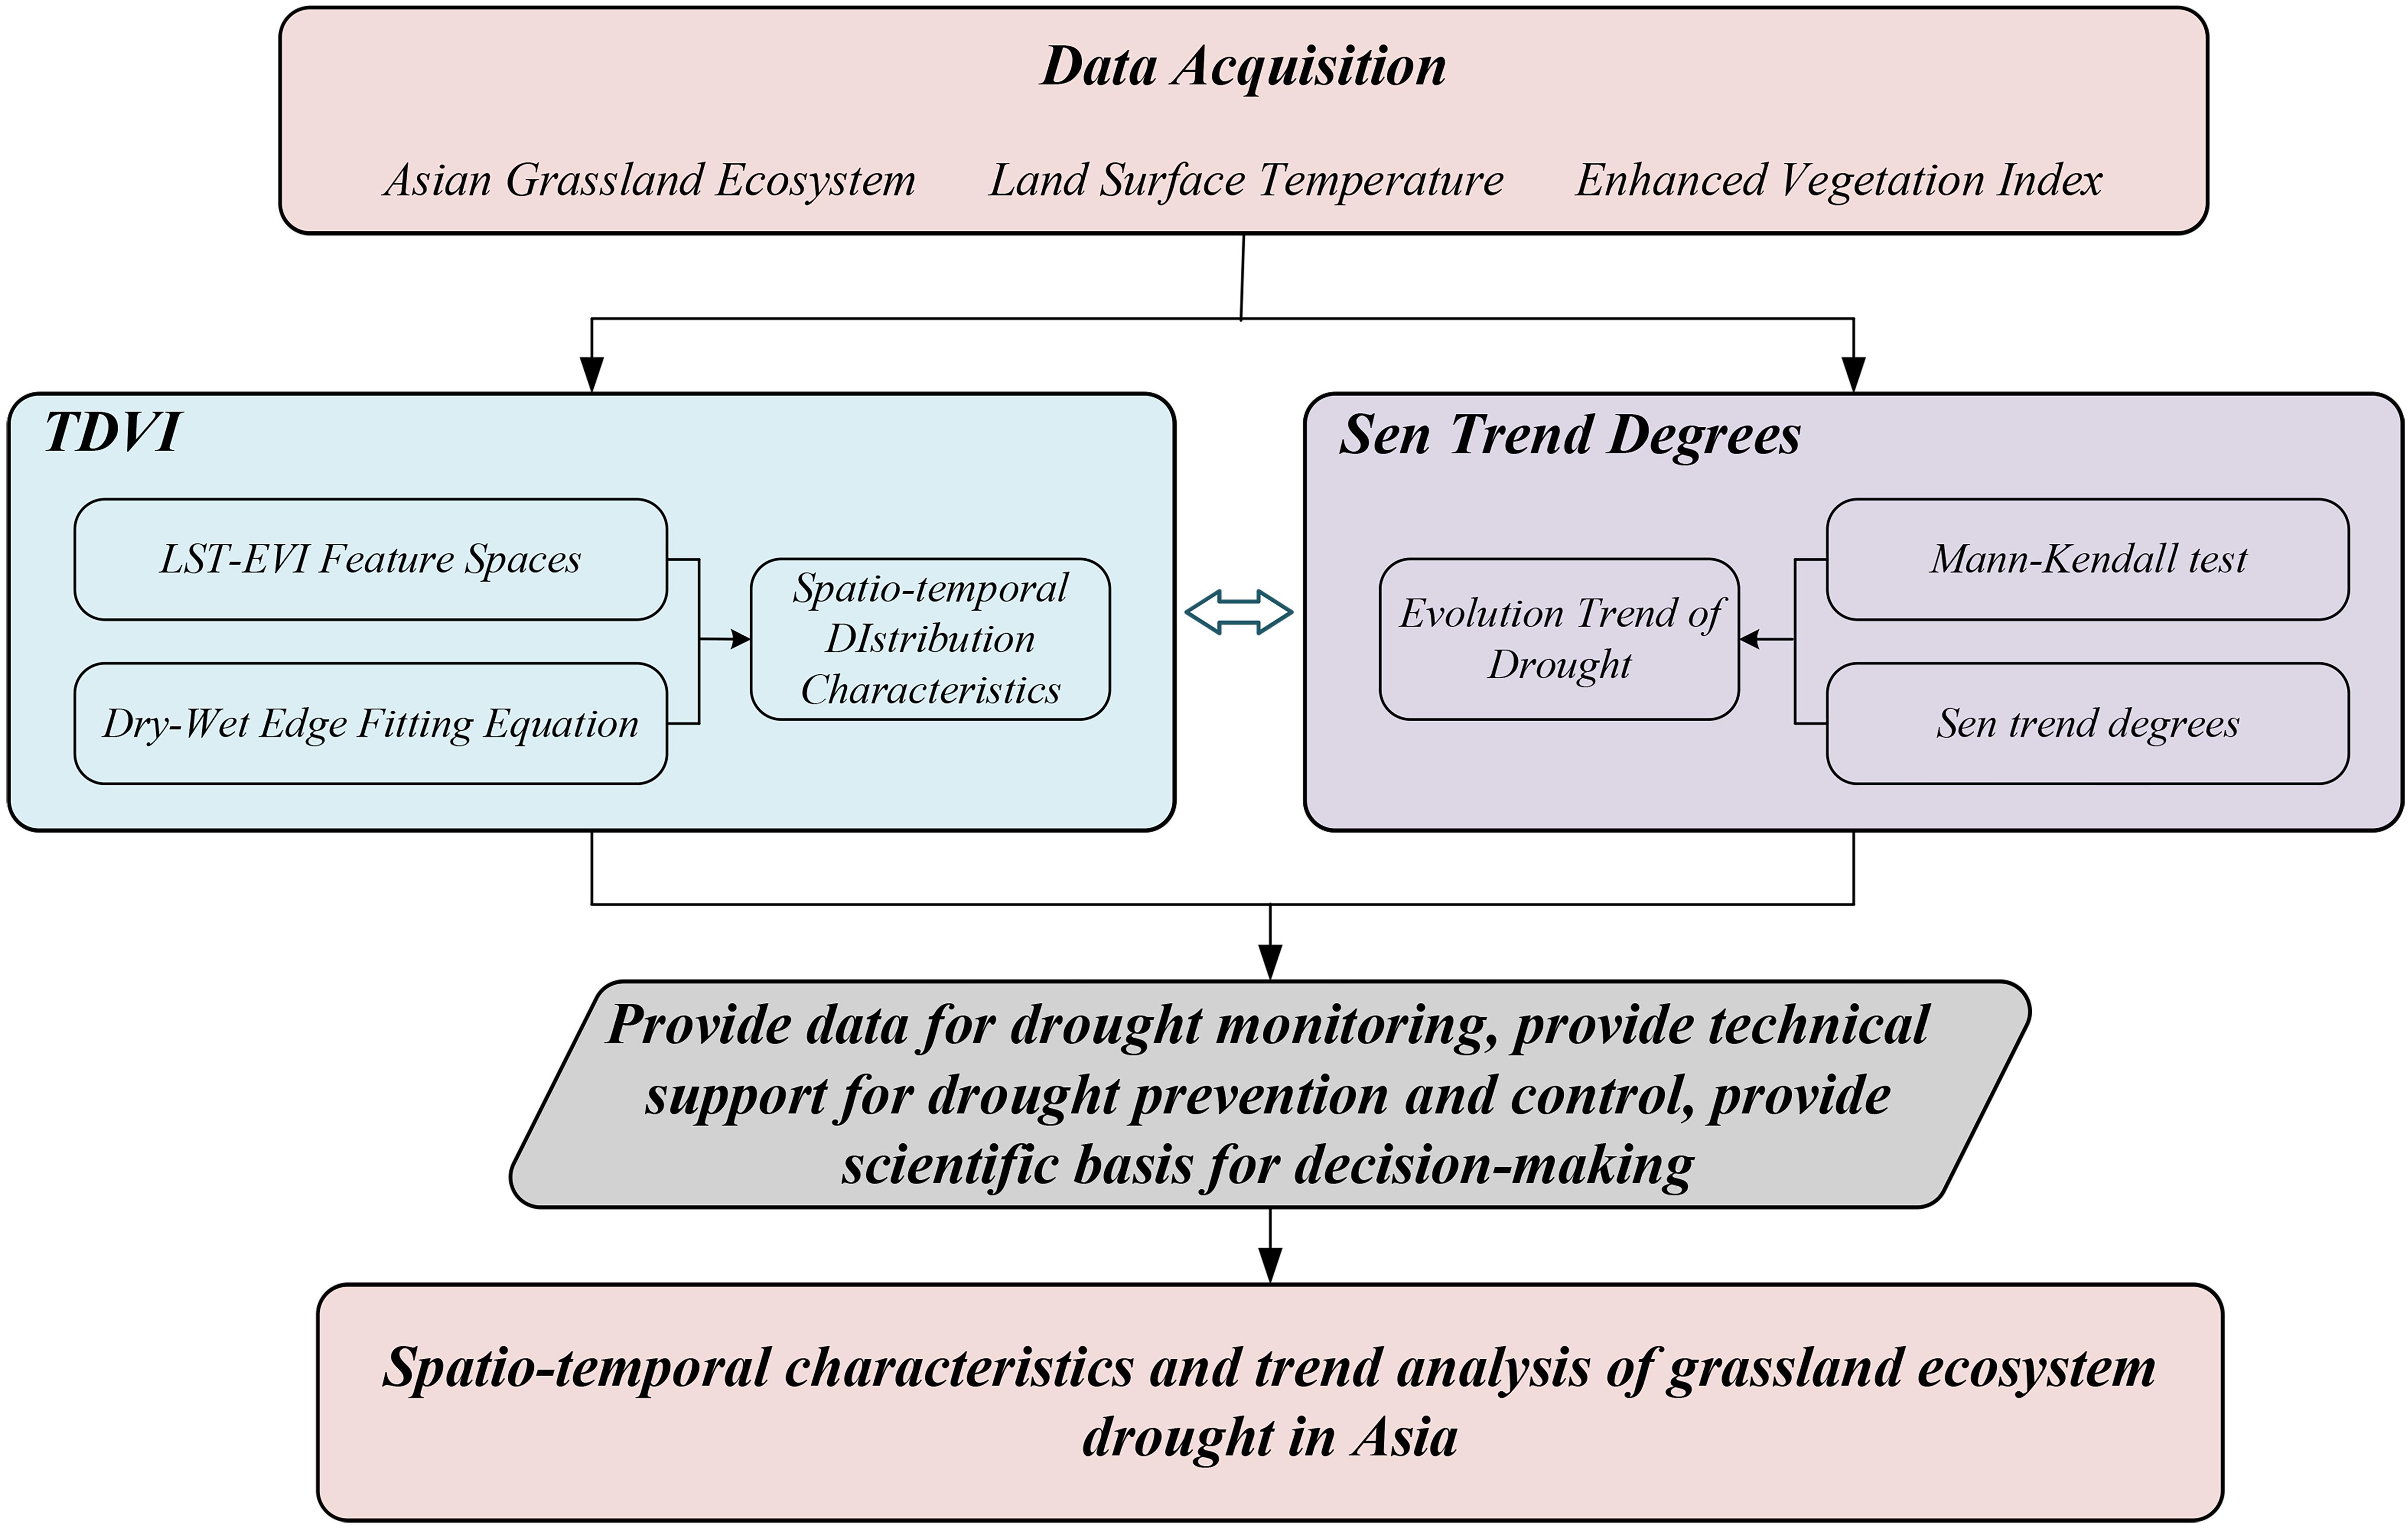
Figure 2. Research technology roadmap.
Step 1: The LST and EVI data were pre-processed for quality inspection, projection, resampling, clipping, and so on. The areas with vegetation indices < 0.1 or > 0.85 were removed and the overestimation of sparse cover and underestimation of high-density cover in linear trend fitting were ruled out.
Step 2: At intervals of 0.02, EVI each year was divided into 50 categories. The minimum and maximum surface temperatures corresponding to each of them were determined. Then, LSTmin-EVI and LSTmax-EVI spatial fitting were carried out to solve the corresponding dry-wet edge fitting equations.
Step 3: A TVDI model based on LST and EVI was established according to the obtained dry-wet edge fitting equations to analyze the spatial distribution of TVDI of AGE from 2010 to 2018.
Step 4: The Mann–Kendall test and Sen trend degrees were used to calculate the Sen trend degrees of annual TVDI on a grid point, and then Mann–Kendall trend test was carried out to calculate the spatial drought trend of AGE.
Temperature Vegetation Drought Index
The inversion of soil drought using TVDI was based on the effect of water evaporation and vegetation transpiration which brought the surface temperature down. The value of TVDI depended on the spatial conditions of LST-EVI. The effect of surface evaporation and transpiration on TVDI resulted from the effect on LST-EVI space (Goward et al., 2002). In recent years, a series of studies had shown that vegetation cover, soil moisture, surface thermal characteristics, and other factors had an influence on the relationship between LST and EVI. However, the remote sensing image sensor selected in the study and resolution has little influence on it (Yan and Wang, 2009; Song et al., 2011). Among them, soil moisture was the main influencing factor of LST-EVI space, and EVI could reflect vegetation cover status. Therefore, TVDI obtained from LST-EVI space could largely reflect the status of soil humidity. The study of Price, Carlson, Sandholt, and others analyzed the acquired remote sensing data and concluded that the characteristic spatial relationship between LST and EVI was triangular (Price, 1990; Carlson et al., 1994; Sandholt et al., 2002). The work of Gillies et al. (1997) further used remote sensing data and the LST-EVI triangle to measure soil moisture content. The study of Goward et al. (2002) proposed a dry-wet edge fitting equation. Based on these studies, Sandholt et al. (2002) proposed a TVDI, which is expressed as follows:
Where LST is the land surface temperature of any pixel. LST data of MODIS were used in this study. a1+b1 × EVI is the maximum surface temperature corresponding to a value of EVI. It was the dry edge of characteristic space. a1 and b1 are the coefficients of the dry edge fitting equation. a2+b2 × EVI is the minimum surface temperature corresponding to an EVI. This corresponded to the wet edge of characteristic spaces. a2 and b2 are the coefficients of the wet edge fitting equation. The value range of TVDI is 0∼1, and the higher the value is, the more severe the water shortage and drought in the area. Conversely, the smaller the value is, the wetter the area.
Mann–Kendall Test and Sen Trend Degrees
Mann–Kendall Tendency Test was the main method for judging trends in the field of meteorological hydrology. It judged the trend salience of the sequence according to the test statistic Z. At the significance level α = 0.05, when the test statistic |Z| > 1.96, it meant significant trend; when the |Z| < 1.96, it indicated no significant trend (Tao and Zhang, 2020).
The Sen trend degree is a method proposed by Sen to study the variation of long time series of variables (Sen, 1968). For the time series x1, x2, …, xn, trend degree β is defined as:
where xj and xi are time series values at different times respectively, Median is the median function. When β > 0, it indicated the time series of the variables to be analyzed is increasing; when β < 0, it indicated the time series of the variables to be analyzed is decreasing.
Results and Discussion
Analysis of Temperature Vegetation Drought Index in Asian Grassland Ecosystem
Based on the data pre-processing, the EVI data of each year were reclassified with the step size of 0.02, the maximum and minimum values of the LST values with the same EVI were extracted. By establishing the two-dimensional feature spaces fitting diagram of LST-EVI, the corresponding equation of dry-wet edge fitting (Figures 3, 4) was obtained. As can be seen from Figures 3, 4, the two ends of the dry-wet t edge fitting curve were relatively discrete, which was due to the deviation of the actual condition of vegetation reflected by the vegetation index when the vegetation coverage was very low or even bare soil, or when the vegetation coverage was very high. Thus, the points with EVI values lower than 0.1 and higher than 0.85 did not participate in linear regression fitting, so that the dry and wet edge fitting could meet the TVDI extraction precision of most pixels.
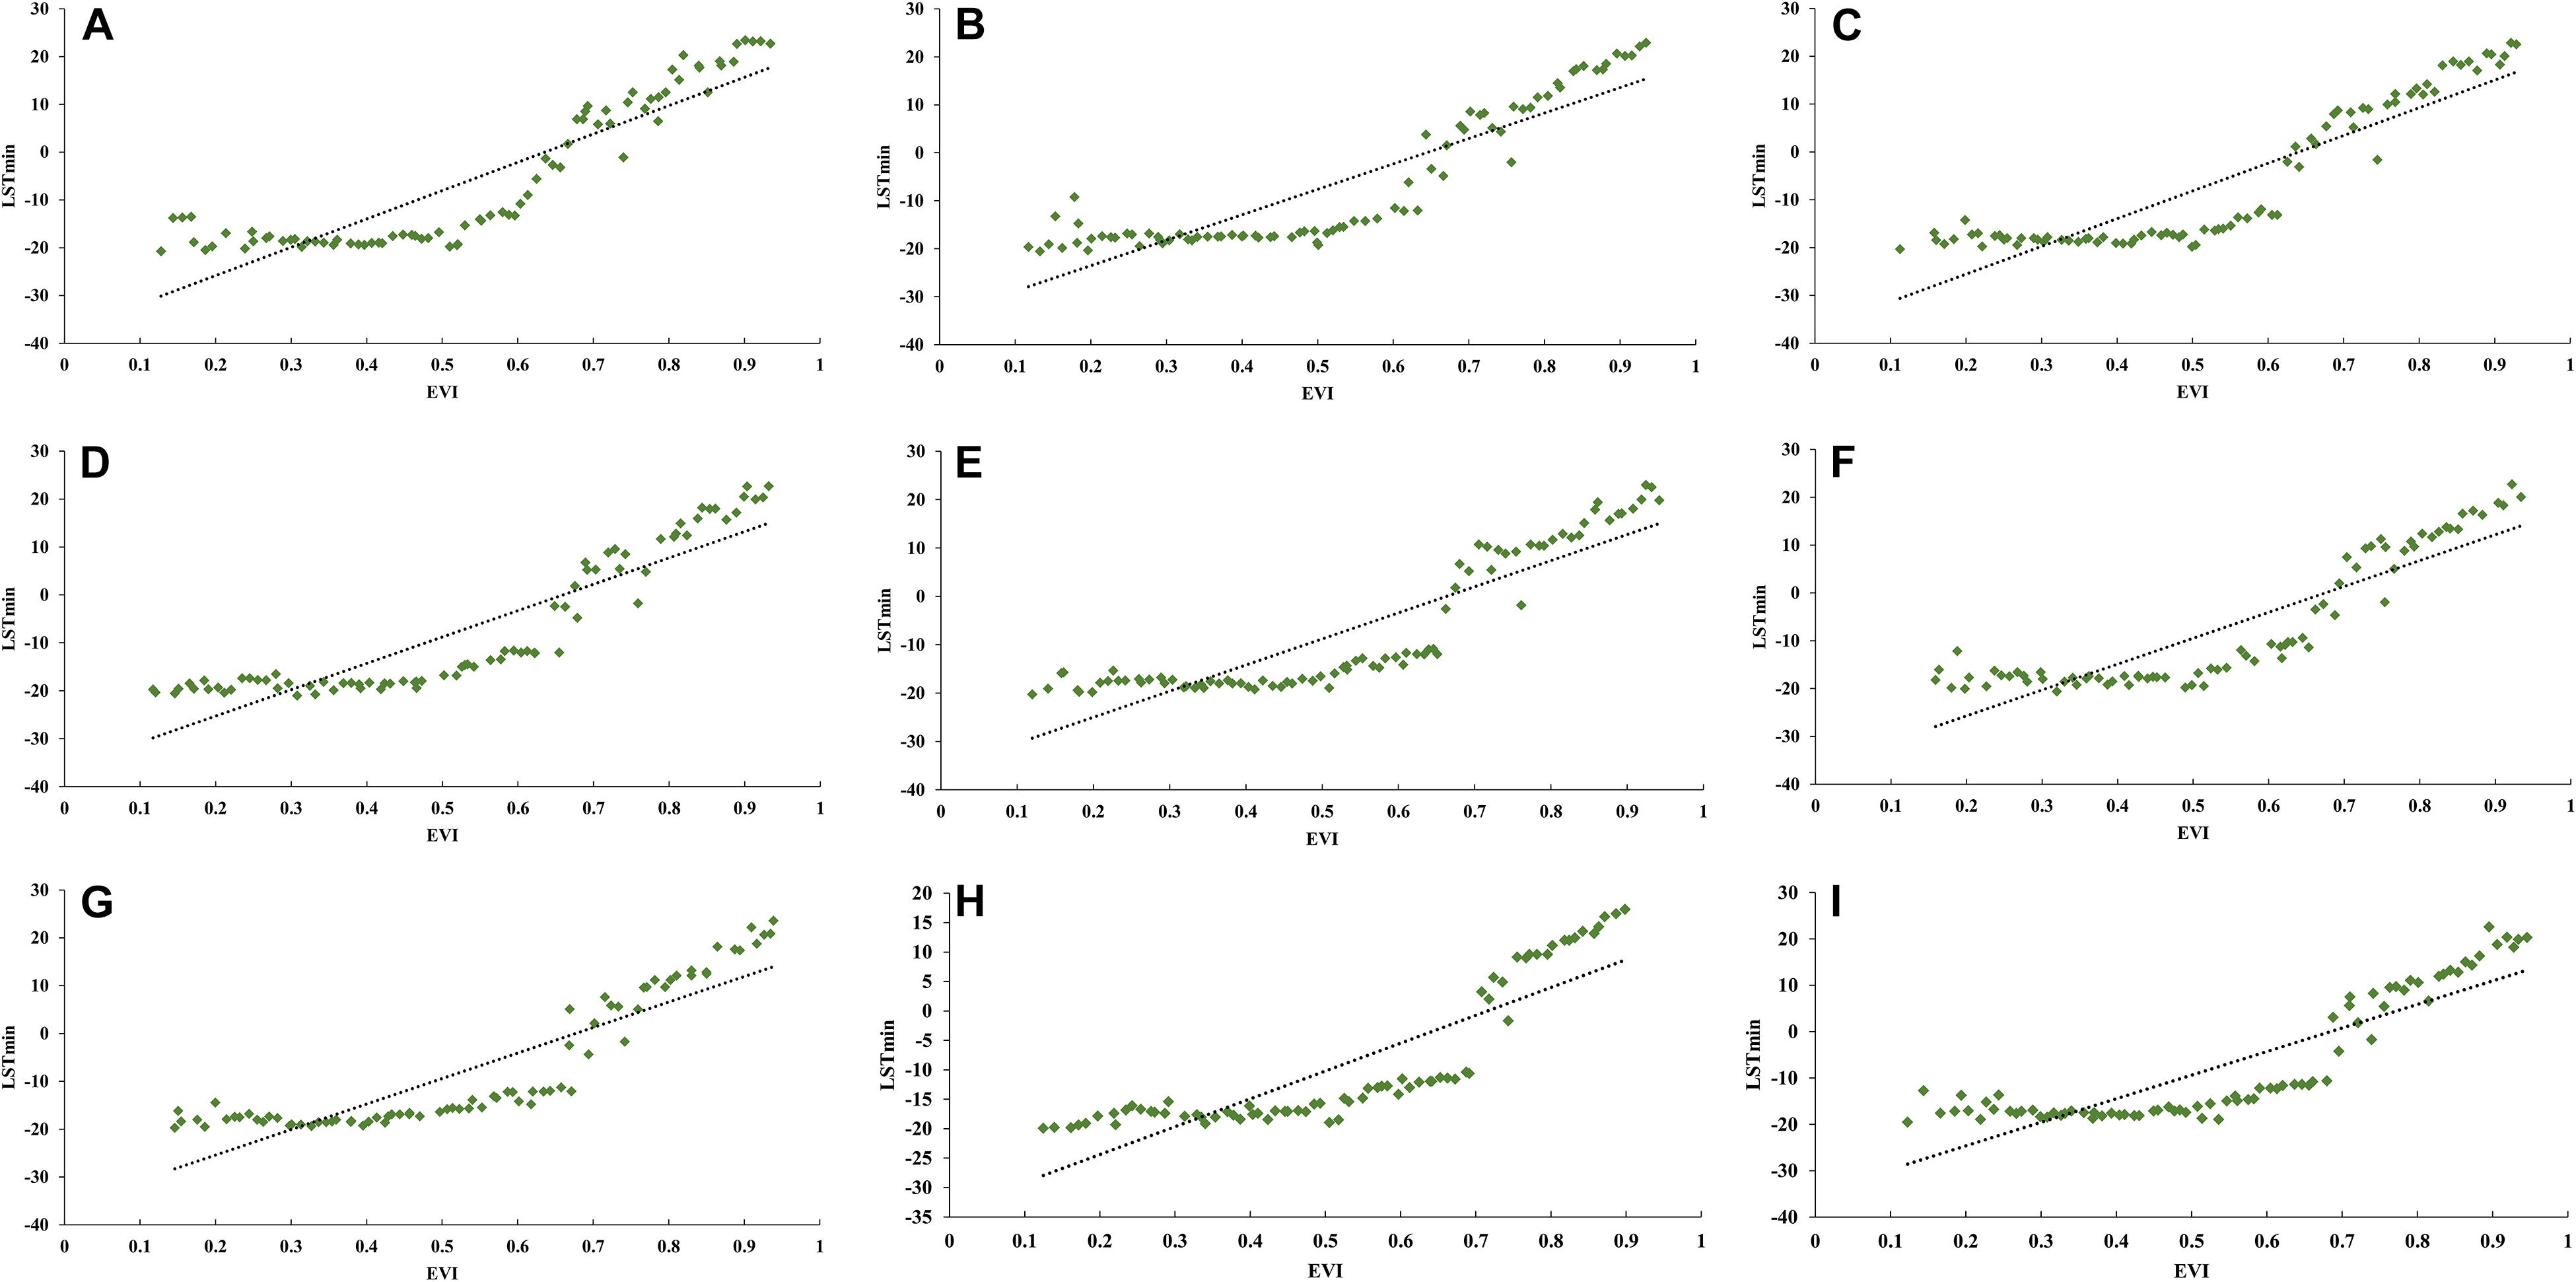
Figure 3. LSTmin-EVI feature spatial fitting map of AGE for (A) 2010, (B) 2011, (C) 2012, (D) 2013, (E) 2014, (F) 2015, (G) 2016, (H) 2017, and (I) 2018.
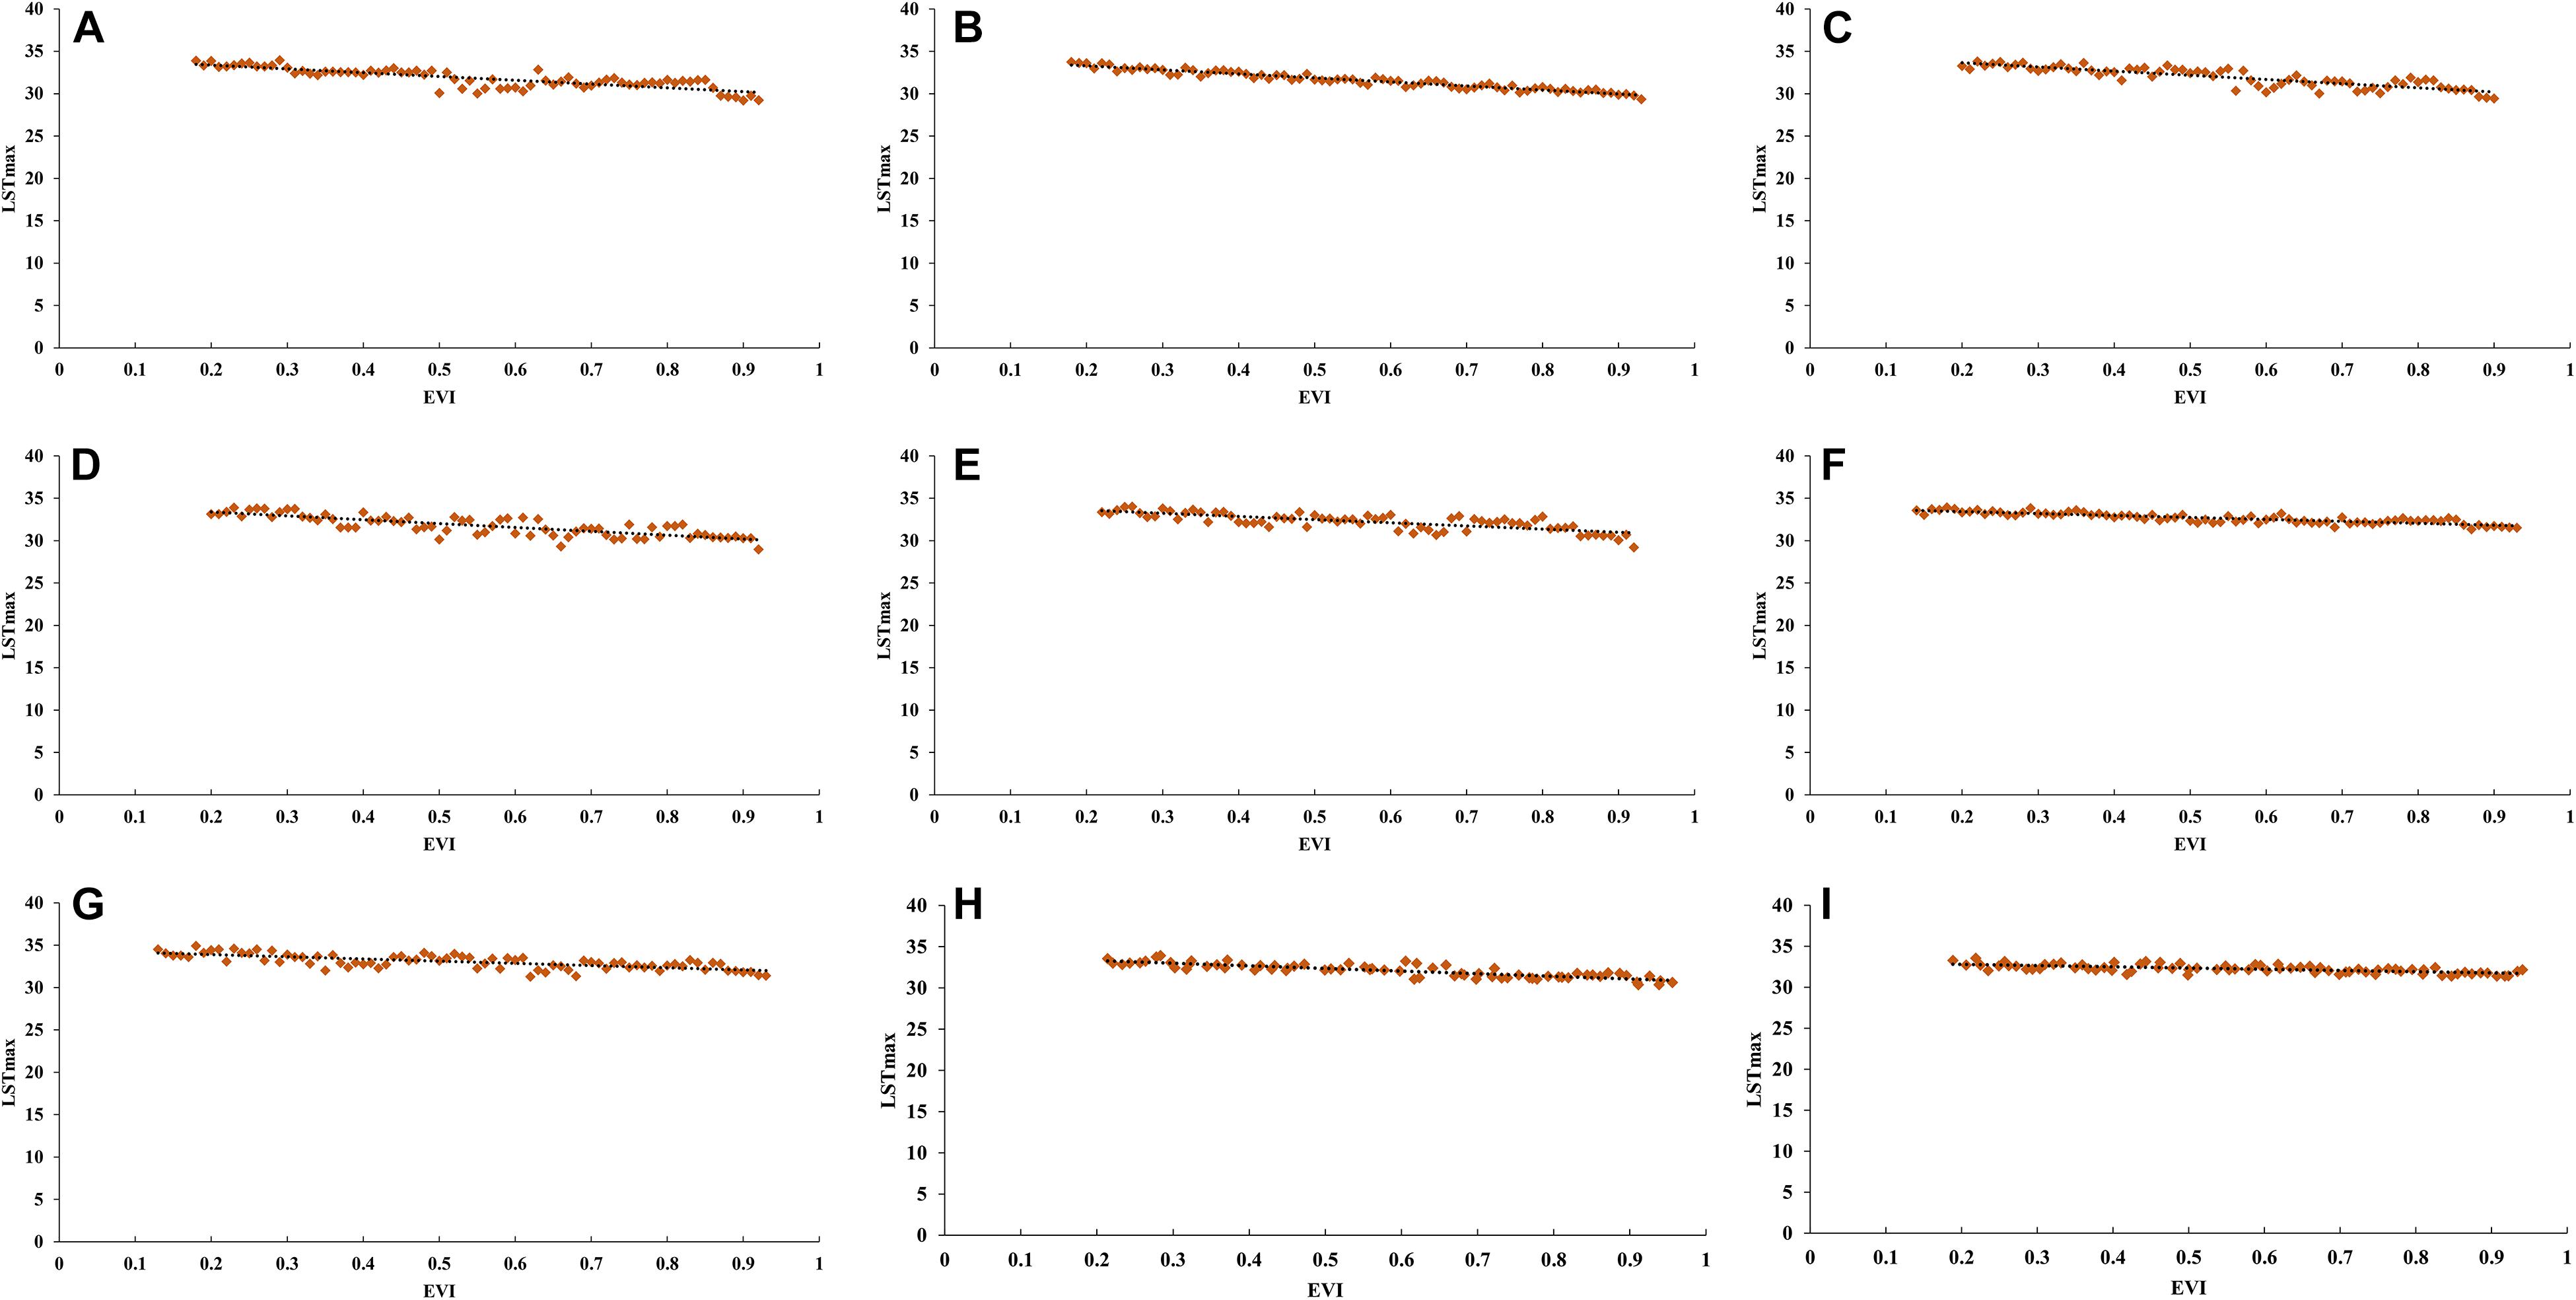
Figure 4. LSTmax-EVI feature spatial fitting map of AGE for (A) 2010, (B) 2011, (C) 2012, (D) 2013, (E) 2014, (F) 2015, (G) 2016, (H) 2017, and (I) 2018.
Based on the obtained dry-wet edge fitting equation, the TVDI of AGE was calculated by using the formula of the TVDI model. The results of TVDI calculated from low to high were re-classified into five grades, 0 < TVDI ≤ 0.3 was humidification, 0.3 < TVDI ≤ 0.5 was normal, 0.5 < TVDI ≤ 0.65 was light drought, 0.65 < TVDI ≤ 0.77 was medium drought, and 0.77 < TVDI ≤ 1 was severe drought (Sun et al., 2021). The result is shown in Figure 5.
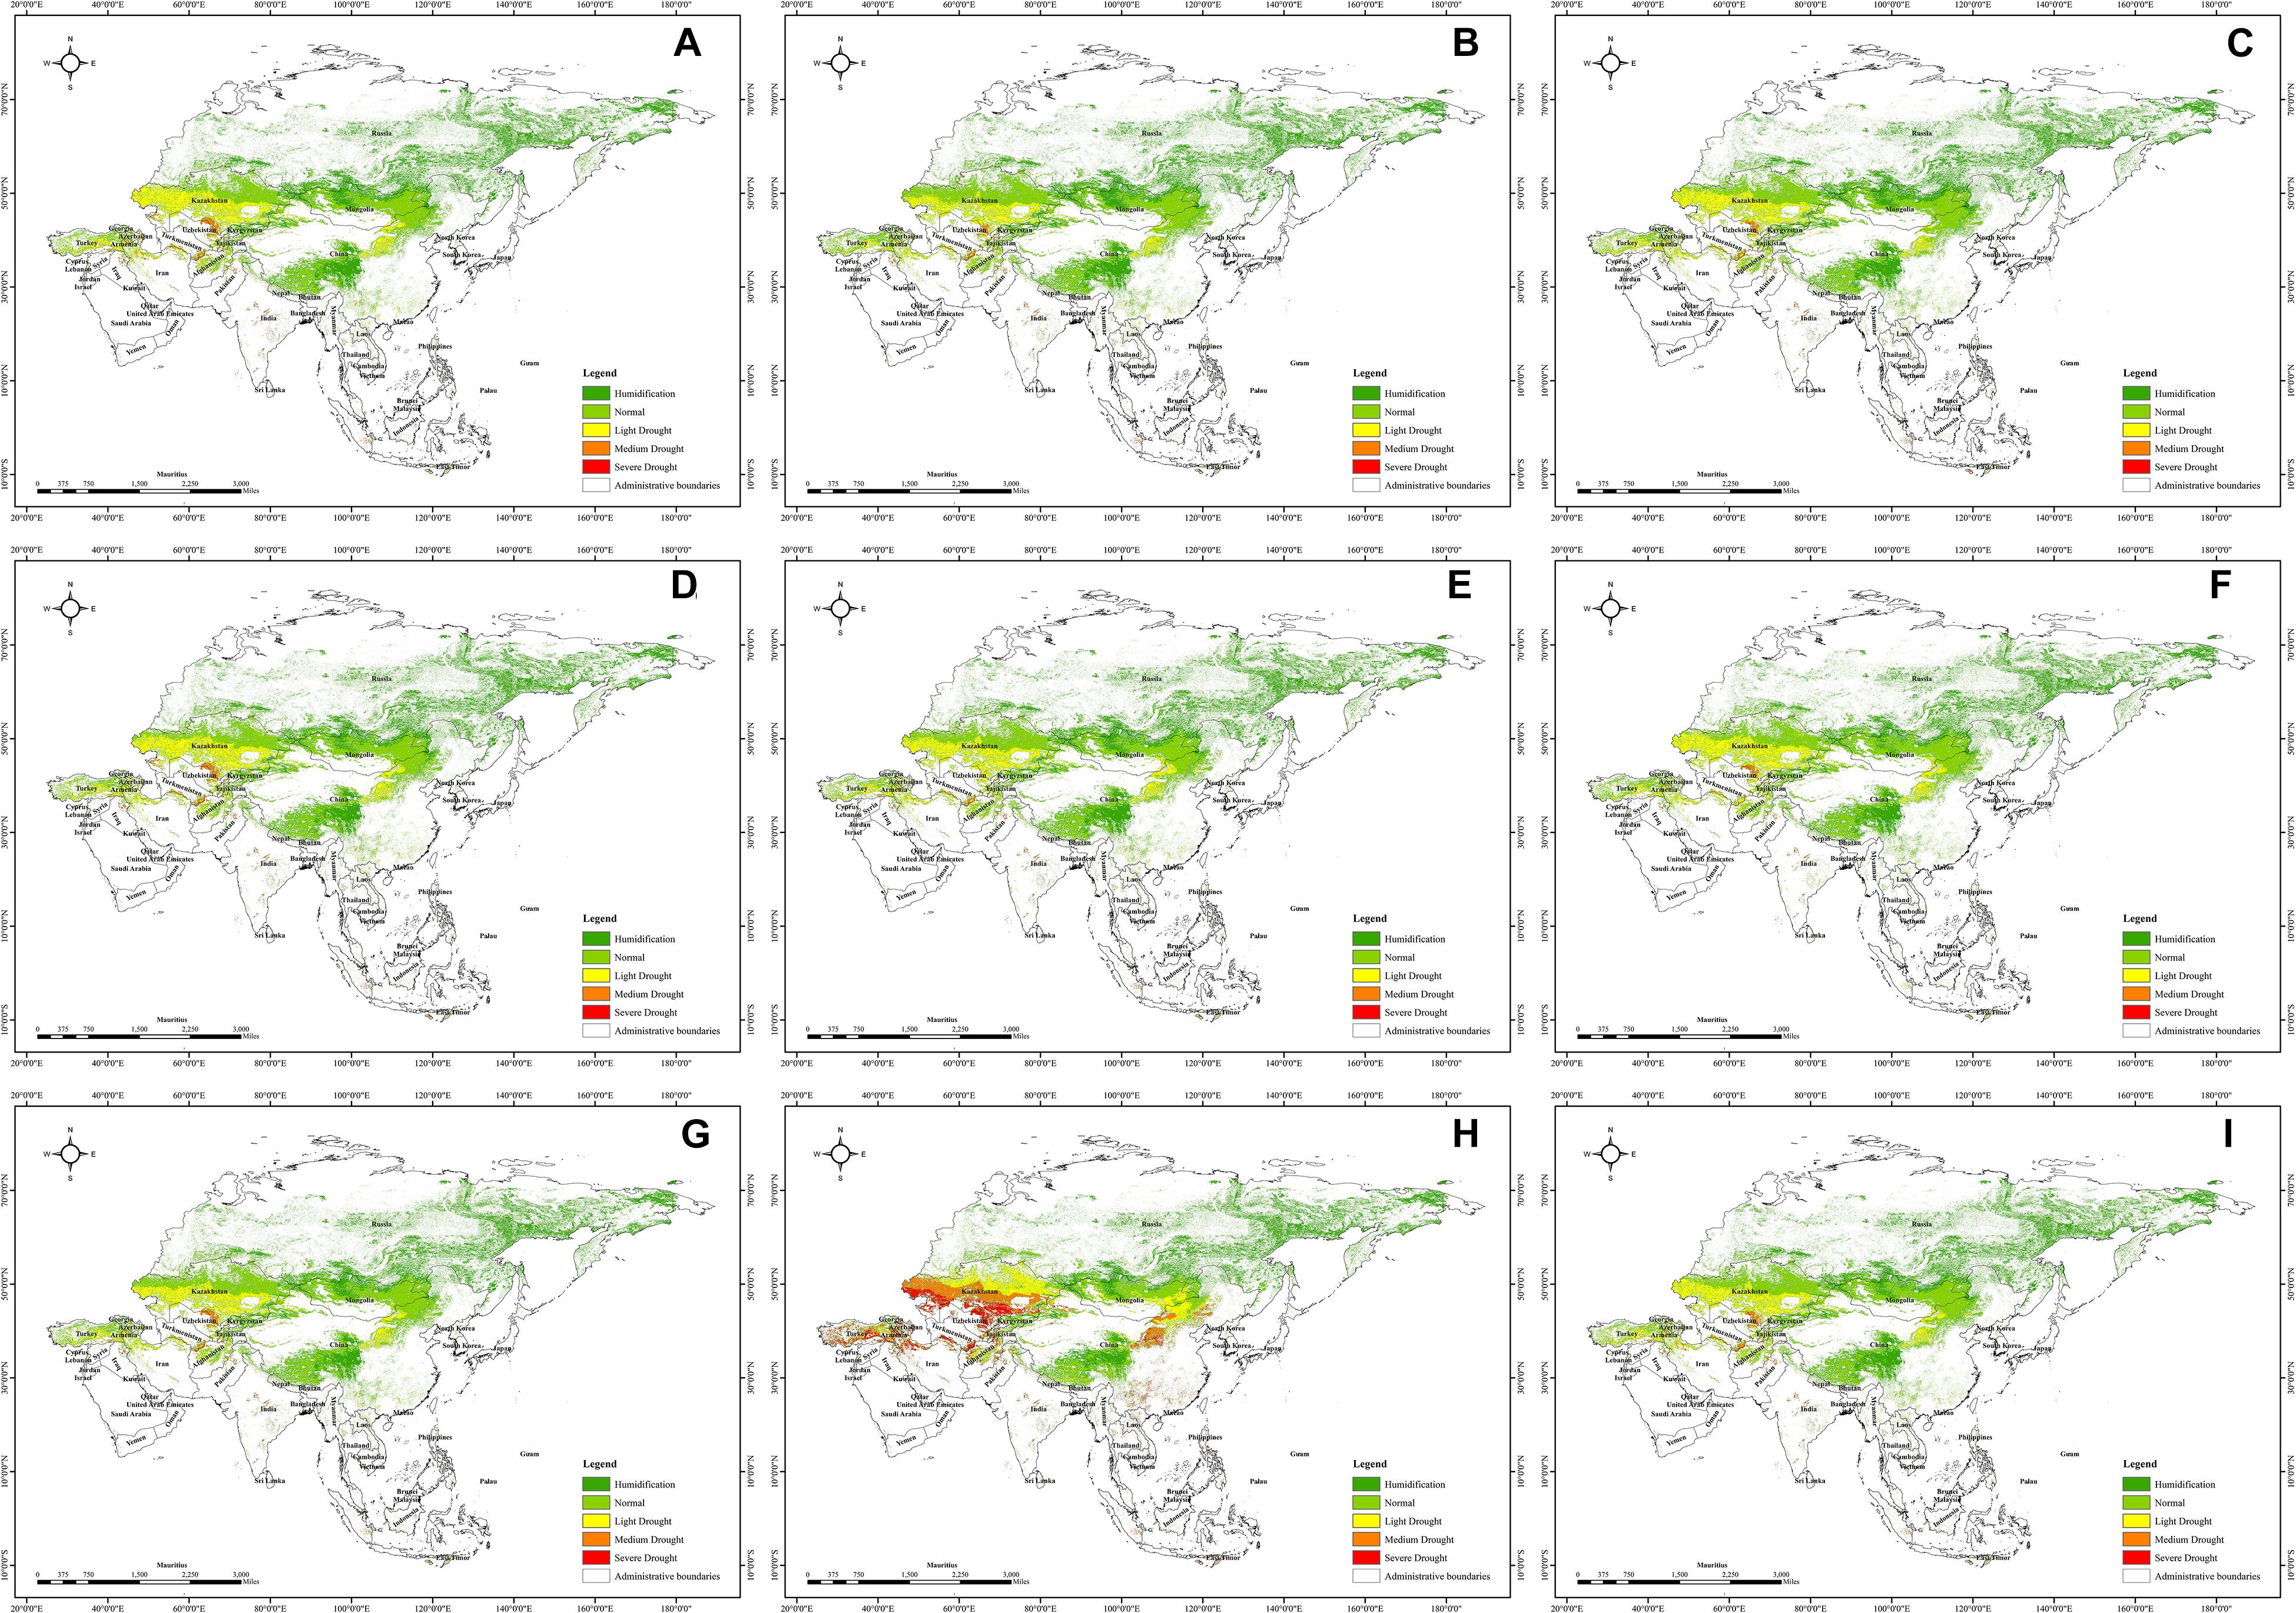
Figure 5. TVDI in AGE for (A) 2010, (B) 2011, (C) 2012, (D) 2013, (E) 2014, (F) 2015, (G) 2016, (H) 2017, and (I) 2018.
The correlation analysis was obtained from soil moisture data and TVDI data at the corresponding locations of AGE. There was a significant correlation between TVDI and measured water content of soil surface layer. The linear fitting results of TVDI and soil moisture both passed the t-test of confidence coefficient α = 0.05, and the correlation was good. This indicated that the temperature vegetation drought index could reflect the changing trend of soil moisture condition, and it was reasonable as an index of drought evaluation.
According to the drought of AGE, as reflected in TVDI (Figure 5), there were marked spatial differences in dry and wet conditions of AGE, specifically the degree of soil aridity increases from east to west and from north to south in general. Under this general trend, combined with the local topography and climate, the degree of drought varied greatly from country to country. The humid and normal areas were mainly concentrated in Russia, Mongolia, Kyrgyzstan, Tajikistan, Afghanistan, Georgia, north of Kazakhstan, and northeast and southwest China. The light drought areas were mainly concentrated in Iran, Afghanistan, Turkey, the center of Kazakhstan, the center of China, and other places in western Asia. Most of the southern and south-western parts of Asia were characterized by medium and severe drought conditions, particularly in Iraq, Pakistan, India, Indonesia, and other places in South Asia, which had reached severe drought.
After further screening and attribute surface area extraction, a histogram of the different levels of drought for AGE from 2010 to 2018 was obtained (Figure 6). Figure 6 shows a decreasing trend in humid areas of AGE from 2010 to 2018. The area of the normal area increased from year to year. The area of light drought areas increased from 2010 to 2015 but decreased from 2015 to 2018. The area of the medium drought areas increased year by year, and the area in the severe drought areas shows a decreasing trend. It is noteworthy that in 2011, 2015, and 2017, there was a significant increase in the area of humid and normal areas compared with 2010. There was a significant reduction in the area of light and severe drought areas in 2011 compared with 2010. In 2015, the area of severe drought was significantly less. In 2017, the area of humid areas, normal areas, and light drought areas all decreased significantly. The area of medium and severe drought areas increased greatly. In 2010, humid areas of AGE covered an area of 8.1776 million km2, and severe drought areas had covered an area of 4.4141 million km2. By 2018, humid areas of grassland ecosystems in Asia had been reduced to 8.0785 million km2 and severe drought areas to 0.0418 million km2. In 2018, the area of humid areas decreased by 1.21% compared with 2010, and the severe drought areas were reduced by 5.27%. Overall, there was an improvement in severe drought for AGE from 2010 to 2018. At the same time, drought was occurring in some humid areas. Regional TVDI changed from humid to normal and even to drought.

Figure 6. The area of different drought grades for AGE from 2010 to 2018.
Analysis of Mann–Kendall Test and Sen Trend Degrees in Asian Grassland Ecosystem
The Sen trend of the inter-annual scale TVDI was calculated grid point by grid point, and the Mann–Kendall trend test was performed on it (Figure 7). Figure 7 shows that there was an overall increasing trend of year-scale meteorological drought in AGE, mainly concentrated in the regions with humid and normal areas, such as Russia, Mongolia, north of Kazakhstan, and northeast China. Conversely, in the severe drought areas of the south of South Asia, the drought intensity in 2010–2018 was still very severe. It had a relatively low trend toward increased aridity, even moderating in places such as Laos, Thailand, Cambodia, and south of China. The Sen trend of TVDI shifting in direction (toward humid).
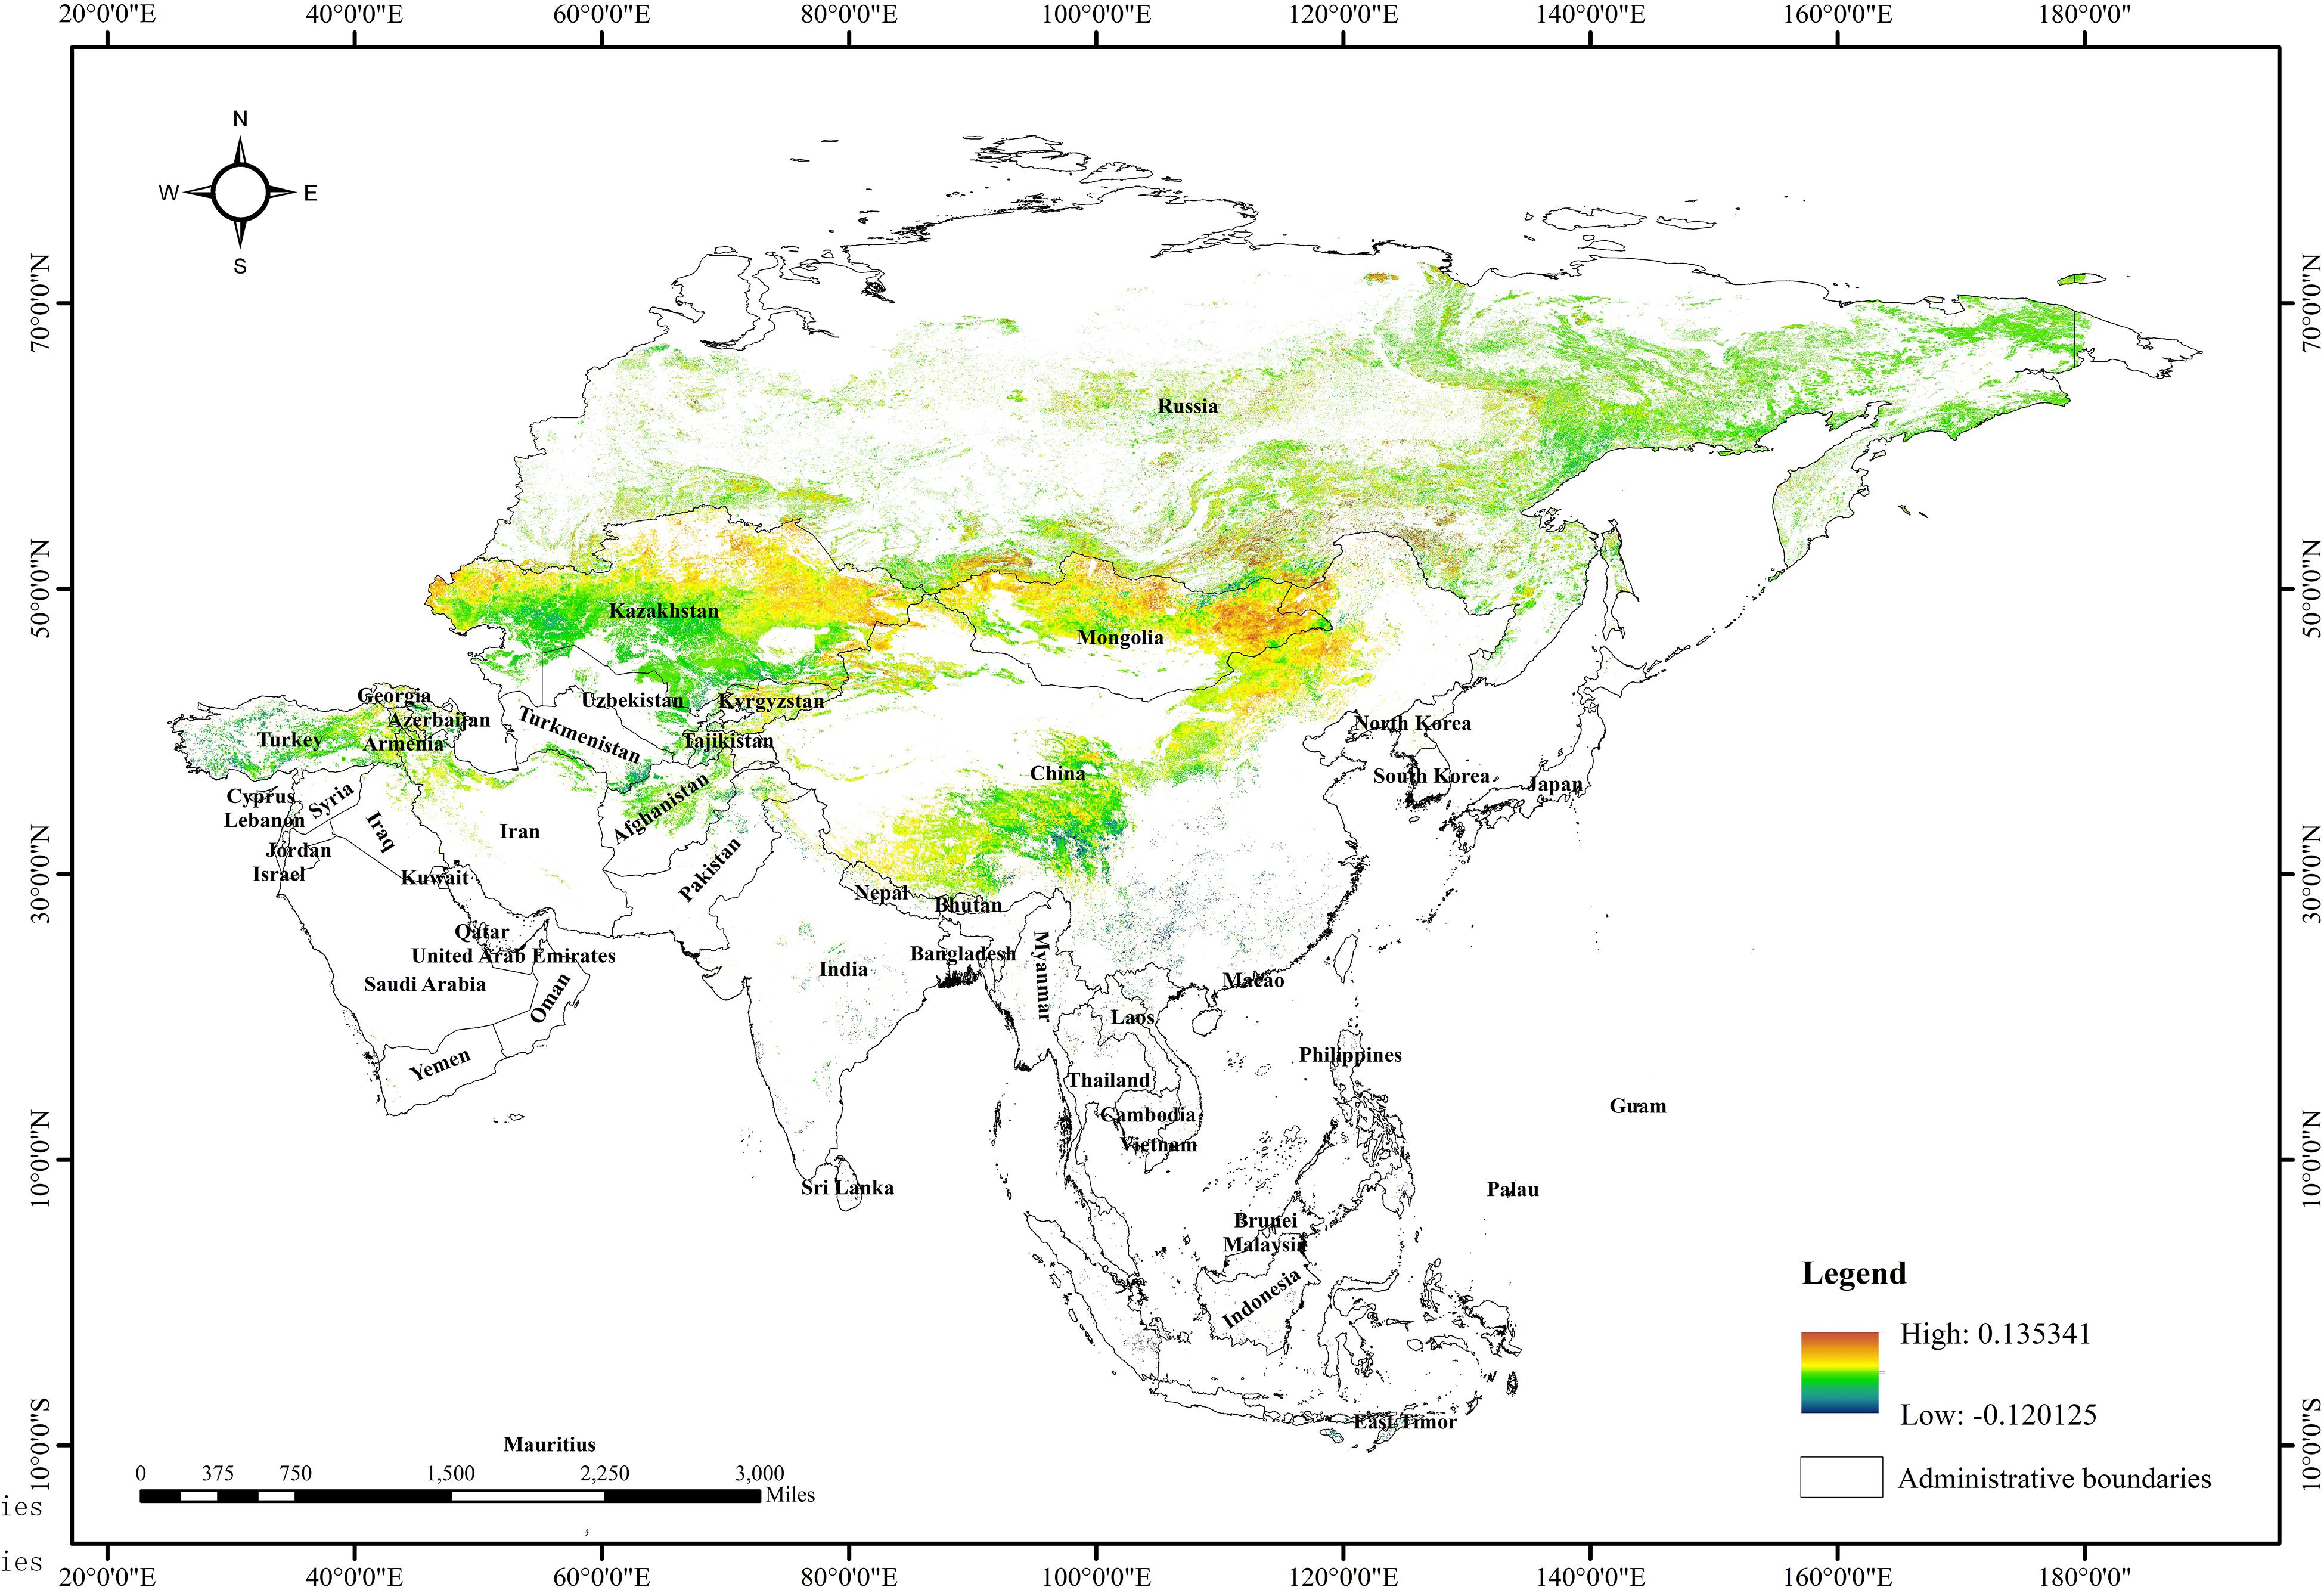
Figure 7. Sen trend degrees of TVDI for AGE.
In summary, this study used TVDI and Sen trend degrees to evaluate the spatio-temporal distribution characteristics and evolution trend of AGE. It was found that there were obvious spatial differentiation characteristics of drought degree of AGE under the influence of temperature, environment, and other factors. The drought degree has increased or decreased in varying degrees from 2010 to 2018, mainly in South Asia and East Asia with wetter dry conditions had become drier and drier, changing to drier conditions, while severe dry conditions in certain areas had changed to wetter conditions. Other relevant studies have also confirmed the accuracy of this result (Ummenhofer et al., 2013; Manolache et al., 2020; Chandrasekara et al., 2021; Hina et al., 2021). In addition, the study of Manolache et al. (2020) explored the obstacles of different grassland management measures and the uniqueness to be considered in the selection, which was of great significance to provide different grassland management schemes for grassland ecosystems with different drought degrees. Combined with the results of this study, they could help decision-makers better formulate targeted prevention and control measures to deal with terrestrial ecological drought caused by climate change.
Limitations
There are limitations in this study starting from the MODIS data which provided data support for the assessment of drought conditions in AGE, with long time series and high temporal resolution and with high spatial reality. However, uncertainties in global data observations and the conversion of the data used in the study to annual data at higher temporal resolutions had, to some extent, eliminated differences in data extremes, especially the differences in regions with different seasons and different degrees of drought (Sun et al., 2021). For example, the seasonal features of LST that were higher in summer and autumn but lower in winter and spring were ignored in the correlation analysis. Therefore, the assessment results of trends in drought conditions by the annual data used in this study require further calibration. In addition, several studies showed that drought is caused by a combination of factors such as precipitation, water resources in rivers and lakes, soil moisture content, and soil potential evapotranspiration (Zhang X. Y. et al., 2020; Hina et al., 2021; Su et al., 2021). The TVDI calculated from LST and EVI data in this study could represent the drought of AGE to some extent. However, further studies on drought in AGE affected by multiple factors are still needed.
Conclusion
In this study, the spatio-temporal distribution characteristics and evolution trend of drought in the AGE were analyzed by using TVDI and Sen trend degrees. The results showed that the humid areas of the AGE are mainly concentrated in the north of Asia, and the severe drought areas were mainly concentrated in the south of Asia. From 2010 to 2018, the transition from humid areas to arid areas was obvious, and the results of the Sen trend also showed that the drought degree had an aggravating trend. These findings provided a foundation to explore the impact of climate and environmental factors on ecosystems. Further study should concentrate on the analysis of the seasonal characteristics of drought evolution. Furthermore, the method used in this study could also be used to evaluate the evolution trend of ecosystem drought in other regions, so that the decision-makers could make targeted prevention and control measures to limit the development of drought, which is worth promoting.
Data Availability Statement
The original contributions presented in the study are included in the article/supplementary material, further inquiries can be directed to the corresponding author/s.
Author Contributions
XZ and XL contributed to all aspects of this work. YKL and GL conducted data analysis. XL and GL wrote the main manuscript. YL gave some useful comments and suggestions to this work. All authors reviewed the manuscript.
Funding
This work was supported by the National Natural Science Foundation of China (Grant No. 42101470), Research Project of the Ministry of Science and Technology of China (Grant No. 2019YFC0507800), Strategic Priority Research Program of the Chinese Academy of Sciences (Grant No. XDA23100403-2), and 2020 Undergraduate Education and Teaching Reform and Research Project of China University of Mining and Technology-Beijing (Grant No. J200308).
Conflict of Interest
The authors declare that the research was conducted in the absence of any commercial or financial relationships that could be construed as a potential conflict of interest.
Publisher’s Note
All claims expressed in this article are solely those of the authors and do not necessarily represent those of their affiliated organizations, or those of the publisher, the editors and the reviewers. Any product that may be evaluated in this article, or claim that may be made by its manufacturer, is not guaranteed or endorsed by the publisher.
Acknowledgments
We would like to thank the editors and reviewers for their helpful remarks.
References
Bastos, A., Ciais, P., Friedlingstein, P., Sitch, S., and Zaehle, S. (2020). Direct and seasonal legacy effects of the 2018 heat wave and drought on european ecosystem productivity. Sci. Adv. 6:eaba2724. doi: 10.1126/sciadv.aba2724
Carlson, T. N., Gillies, R. R., and Perry, E. M. (1994). A method to make use of thermal infrared temperature and NDVI measurements to infer surface soil water content and fractional vegetaional cover. Remote Sens. Rev. 9, 45–59. doi: 10.1080/02757259409532220
Chandrasekara, S. S. K., Kwon, H. H., Vithanage, M., Obeysekera, J., and Kim, T. W. (2021). Drought variability at the northern fringe of the Asian summer monsoon region over the past millennia. Atmosphere 12:369. doi: 10.3390/atmos12030369
Chu, H., Venevsky, S., Chao, W., and Wang, M. (2019). Ndvi-based vegetation dynamics and its response to climate changes at amur-heilongjiang river basin from 1982 to 2015. Sci. Total Environ. 650, 2051–2062. doi: 10.1016/j.scitotenv.2018.09.115
Craft, K. E., Mahmood, R., King, S. A., Goodrich, G., and Yan, J. (2015). Twentieth century droughts and agriculture: examples from impacts on soybean production in Kentucky, USA. Ambio 44, 557–568. doi: 10.1007/s13280-014-0598-4
Crausbay, S. D., Ramirez, A. R., Carter, S. L., Cross, M. S., and Sanford, T. (2017). Defining ecological drought for the twenty-first century. Bull. Am. Meteorol. Soc. 98, 2543–2550. doi: 10.1175/BAMS-D-16-0292.1
Dai, X. G., and Wang, P. (2020). A Review of Aridity Studies for Central Asia with Mechanism Analysis. Desert Oasis Meteorol. 14, 1–12.
Didan, K. (2015). MOD13A2 MODIS/Terra Vegetation Indices 16-Day L3 Global 1km SIN Grid V006. South Dakota: NASA EOSDIS Land Processes DAAC, doi: 10.5067/MODIS/MOD13A2.006
Du, L. T., Liu, K., Hu, Y., Zhu, Y., and Gong, F. (2017). Ecological drought characteristics and analysis of driving factors of different ecological zones in Ningxia from 2000 to 2010. J. Nat. Disasters 26, 149–156. doi: 10.13577/j.jnd.2017.0517
Friedl, M., and Sulla-Menashe, D. (2019). MCD12Q1 MODIS/Terra+Aqua Land Cover Type Yearly L3 Global 500m SIN Grid V006. South Dakota: NASA EOSDIS Land Processes DAAC, doi: 10.5067/MODIS/MCD12Q1.006
Gan, T. Y., Ito, M., Hülsmann, S., Qin, X., Lu, X. X., Liong, S. Y., et al. (2016). Possible climate change/variability and human impacts, vulnerability of drought-prone regions, water resources and capacity building for Africa. Hydrol. Sci. J. 61, 1209–1226. doi: 10.1080/02626667.2015.1057143
Gao, F. (2010). On “no flow country” and seawater desalination. Hydro Sci. Cold Zone Eng. 08, 29–31.
Ge, Q. S., Zheng, J. Y., and Hao, Z. X. (2015). PAGES synthesis study on climate changes in Asia over the last 2000 years:Progresses and perspectives. Acta Geogr. Sin. 70, 355–363. doi: 10.11821/dlxb201503001
Gillies, R. R., Kustas, W. P., and Humes, K. S. (1997). A Verification of the ‘riangle’ method for obtaining surface soil water content and energy fluxes from remote measurements of the Normalized Difference Vegetation Index (NDVI) and surface radiant temperature. Int. J. Remote Sens. 18, 3145–3166. doi: 10.1080/014311697217026
Goward, S. N., Xue, Y., and Czajkowski, K. P. (2002). Evaluating land surface moisture conditions from the remotely sensed temperature/vegetation index measurements: an exploration with the simplified simple biosphere model. Remote Sens. Environ. 79, 225–242. doi: 10.1016/S0034-4257(01)00275-9
Hina, S., Saleem, F., Arshad, A., Hina, A., and Ullah, L. (2021). Droughts over Pakistan: possible cycles, precursors and associated mechanisms. Geomat. Nat. Hazards Risks 12, 1638–1668. doi: 10.1080/19475705.2021.1938703
Jiang, L. P., Qin, Z. H., Lu, L. P., Xie, W., and Li, W. J. (2006). Monitoring grassland ecosystem degradation using EOS/MODIS data in north China. Proc. SPIE Int. Soc. Opt. Eng. 63661V. doi: 10.1117/12.689414
Kang, Y., Guo, E. L., Wang, Y. F., Bao, Y. L., Bao, Y. H., Na, R. M., et al. (2021). Application of temperature vegetation dryness index for drought monitoring in Mongolian Plateau. Chin. J. Appl. Ecol. 32, 2534–2544. doi: 10.13287/j.1001-9332.202107.018
Kim, J. S., Jain, S., Lee, J. H., Chen, H., and Park, S. Y. (2019). Quantitative vulnerability assessment of water quality to extreme drought in a changing climate. Ecol. Indic. 103, 688–697. doi: 10.1016/j.ecolind.2019.04.052
Li, C., Li, X. M., Tian, Y. L., and Ren, R. (2020). Time and Space Fusion Model Comparison of Temperature Vegetation Drought Index. Remote Sens. Technol. Appl. 35, 832–844.
Li, L., Zheng, Z., Biederman, J. A., Qian, R., Ran, Q., Zhang, B., et al. (2020). Drought and heat wave impacts on grassland carbon cycling across hierarchical levels. Plant Cell Environ. 44, 2402–2413. doi: 10.1111/pce.13767
Li, X. N. (2020). Assessment Of Surface Water Resources And Climatic-Ecological-Hydrological Regionalization In Large-Scale Areas. Beijing: China Institute of Water Resources & Hydropower Research (IWHR).
Liu, Y. Y., Ren, H. Y., Zhou, R. L., Basang, C. M. J., Zhang, W., Zhang, Z. Y., et al. (2021). Estimation and Dynamic Analysis of the Service Value of Grassland Ecosystem in China. Acta Agrestia Sin. 29, 1522–1532. doi: 10.11733/j/issn/1007-0435/2021/07.019
Manolache, S., Nita, A., Hartel, T., Miu, I. V., Ciocanea, C. M., and Rozylowicz, L. (2020). Governance networks around grasslands with contrasting management history. J. Environ. Manage. 273:111152. doi: 10.1016/j.jenvman.2020.111152
Mckee, T. B., Doesken, N. J., and Kleist, J. (1993). “The relationship of drought frequency and duration to time scales,” in Proceedings of the 8th Conference on Applied Climatology (Boston: American Meteorological Society).
Oikonomou, P. D., Tsesmelis, D. E., Waskom, R. M., Grigg, N. S., and Karavitis, C. A. (2019). Enhancing the standardized drought vulnerability index by integrating spatiotemporal information from satellite and in situ data. J. Hydrol. 569, 265–277. doi: 10.1016/j.jhydrol.2018.11.058
Palmer, W. C. (1965). Meteorological Drought,” Research Paper No. 45. Washington DC: US Department of Commerce, Weather Bureau.
Piao, S., Ciais, P., Huang, Y., Shen, Z., Peng, S., Li, J., et al. (2010). The impacts of climate change on water resources and agriculture in china. Nature 467, 43–51. doi: 10.1038/nature09364
Price, J. C. (1990). Using spatial context in satellite data to infer regional scale evapotranspiration. IEEE Trans. Geosci. Electron. 28, 940–948. doi: 10.1109/36.58983
Sandholt, I., Rasmussen, K., and Andersen, J. (2002). A simple interpretation of the surface temperature-vegetation index space for assessment of surface moisture status. Remote Sens. Environ. 79, 213–224. doi: 10.1016/S0034-4257(01)00274-7
Sen, P. K. (1968). Estimates of the regression coefficient based on Kendall’s tau. J. Am. Stat. Assoc. 63, 1379–1389. doi: 10.1080/01621459.1968.10480934
Sharafi, L., Zarafshani, K., Keshavarz, M., Azadi, H., and Passel, S. V. (2020). Drought risk assessment: towards drought early warning system and sustainable environment in western iran. Ecol. Indic. 114:106276. doi: 10.1016/j.ecolind.2020.106276
Song, C. J., You, S. C., Liu, G. H., and Ke, L. H. (2011). The Spatial Pattern of Soil Moisture in Northern Tibet Based on TVDI Method. Prog. Geogr. 30, 569–576. doi: 10.11820/dlkxjz.2011.05.008
Su, X. L., Jiang, T. L., and Niu, J. P. (2021). Concept and research progress of ecological drought. Water Resour. Prot. 37, 15–21.
Sun, L. J., Liu, X., and Zhu, Y. H. (2021). Study on the Inversion of Drought Degree in Henan Province Based on MODIS Data. Geomat. Spat. Inf. Technol. 44, 140–142.
Sun, Y. X., and Li, K. (2013). Cause analysis and Countermeasures of drought in Hubei Province. Chin. Flood Drought Manage. 23, 56–57. doi: 10.16867/j.cnki.cfdm.2013.02.022
Tao, R., and Zhang, K. (2020). PDSI-based analysis of characteristics and spatiotemporal changes of meteorological drought in China from 1982 to 2015. Water Resour. Prot. 36, 50–56.
Ummenhofer, C. C., D’Arrigo, R. D., Anchukaitis, K. J., Buchley, B. M., and Cook, E. R. (2013). Links between Indo-Pacific climate variability and drought in the Monsoon Asia Drought Atlas. Clim. Dyn. 40, 1319–1334. doi: 10.1007/s00382-012-1458-1
Vicente-Serrano, S. M., Beguerfa, S., and Lopez-Moreno, J. I. (2010). A multiscalar drought index sensitive to global warming: the standardized precipitation evapotranspiration index. J. Clim. 23, 1696–1718. doi: 10.1175/2009JCLI2909.1
Wan, Z., Hook, S., and Hulley, G. (2015). MOD11A2 MODIS/Terra Land Surface Temperature/Emissivity 8-Day L3 Global 1km SIN Grid V006. South Dakota: NASA EOSDIS Land Processes DAAC, doi: 10.5067/MODIS/MOD11A2.006
Wang, L., Huang, S., Huang, Q., Leng, G., Han, Z., Zhao, J., et al. (2021). Vegetation vulnerability and resistance to hydrometeorological stresses in water- and energy-limited watersheds based on a Bayesian framework. Catena 196:104879. doi: 10.1016/j.catena.2020.104879
Yan, F., and Wang, Y. J. (2009). Estimation of soil moisture from Ts-EVI feature space. Acta Ecol. Sin. 29, 4884–4891. doi: 10.3321/j.issn:1000-0933.2009.09.035
Zhang, G., Su, X., and Singh, V. P. (2020). Modelling groundwater-dependent vegetation index using entropy theory. Ecol. Modell. 416:108916. doi: 10.1016/j.ecolmodel.2019.108916
Zhang, X. Y., Wei, W., Zhou, L., Guo, Z. C., Li, Z. Y., Zhang, J., et al. (2020). Analysis on spatio-temporal evolution of ecological vulnerability in arid areas of Northwest China. Acta Ecol. Sin. 41, 4707–4719.
Zhang, Z., Chen, X., Xu, C. Y., Hong, Y., Hardy, J., and Sun, Z. (2015). Examining the influence of river-lake interaction on the drought and water resources in the poyang lake basin. J. Hydrol. 522, 510–521. doi: 10.1016/j.jhydrol.2015.01.008
Zhong, R., Chen, X., Lai, C., Wang, Z., Lian, Y., Yu, H., et al. (2019). Drought monitoring utility of satellite-based precipitation products across mainland China. J. Hydrol. 568, 343–359. doi: 10.1016/j.jhydrol.2018.10.072
Keywords: land surface temperature, enhanced vegetation index, temperature vegetation drought index, Sen trend degrees, Asian grassland ecosystem
Citation: Zhang X, Liang Y, Li X, Lin G and Liu Y (2021) Spatio-Temporal Characteristics and Trend Analysis of Grassland Ecosystem Drought in Asia From 2010 to 2018. Front. Ecol. Evol. 9:703447. doi: 10.3389/fevo.2021.703447
Received: 30 April 2021; Accepted: 28 September 2021;
Published: 25 October 2021.
Edited by:
Mesenbet Yibeltal, Bahir Dar University, EthiopiaReviewed by:
Pratheesh C. Mammen, Kerala State Disaster Management Authority (SDMA), IndiaAndreea Nita, University of Bucharest, Romania
Copyright © 2021 Zhang, Liang, Li, Lin and Liu. This is an open-access article distributed under the terms of the Creative Commons Attribution License (CC BY). The use, distribution or reproduction in other forums is permitted, provided the original author(s) and the copyright owner(s) are credited and that the original publication in this journal is cited, in accordance with accepted academic practice. No use, distribution or reproduction is permitted which does not comply with these terms.
*Correspondence: Xiang Li, bHhfY3VtdGJAMTYzLmNvbg==; Gang Lin, bGluZ0BscmVpcy5hYy5jbg==