
95% of researchers rate our articles as excellent or good
Learn more about the work of our research integrity team to safeguard the quality of each article we publish.
Find out more
ORIGINAL RESEARCH article
Front. Ecol. Evol. , 05 October 2021
Sec. Conservation and Restoration Ecology
Volume 9 - 2021 | https://doi.org/10.3389/fevo.2021.697511
This article is part of the Research Topic Benchmarking Biodiversity in an Era of Rapid Change View all 9 articles
 W. Douglas Robinson1*
 Dan Errichetti1
 Henry S. Pollock2
 Ari Martinez3
 Philip C Stouffer4,5
 Fang-Yu Shen1
 John G. Blake6,7
Extensive networks of large plots have the potential to transform knowledge of avian community dynamics through time and across geographical space. In the Neotropics, the global hotspot of avian diversity, only six 100-ha plots, all located in lowland forests of Amazonia, the Guianan shield and Panama, have been inventoried sufficiently. We review the most important lessons learned about Neotropical forest bird communities from those big bird plots and explore opportunities for creating a more extensive network of additional plots to address questions in ecology and conservation, following the model of the existing ForestGEO network of tree plots. Scholarly impact of the big bird plot papers has been extensive, with the papers accumulating nearly 1,500 citations, particularly on topics of tropical ecology, avian conservation, and community organization. Comparisons of results from the plot surveys show no single methodological scheme works effectively for surveying abundances of all bird species at all sites; multiple approaches have been utilized and must be employed in the future. On the existing plots, abundance patterns varied substantially between the South American plots and the Central American one, suggesting different community structuring mechanisms are at work and that additional sampling across geographic space is needed. Total bird abundance in Panama, dominated by small insectivores, was double that of Amazonia and the Guianan plateau, which were dominated by large granivores and frugivores. The most common species in Panama were three times more abundant than those in Amazonia, whereas overall richness was 1.5 times greater in Amazonia. Despite these differences in community structure, other basic information, including uncertainty in population density estimates, has yet to be quantified. Results from existing plots may inform drivers of differences in community structure and create baselines for detection of long-term regional changes in bird abundances, but supplementation of the small number of plots is needed to increase generalizability of results and reveal the texture of geographic variation. We propose fruitful avenues of future research based on our current synthesis of the big bird plots. Collaborating with the large network of ForestGEO tree plots could be one approach to improve understanding of linkages between plant and bird diversity. Careful quantification of bird survey effort, recording of exact locations of survey routes or stations, and archiving detailed metadata will greatly enhance the value of benchmark data for future repeat surveys of the existing plots and initial surveys of newly established plots.
The Neotropics is the global hotspot of avian diversity (Harvey et al., 2020), but its bird communities generally lack sufficient benchmark measurements of bird species composition and abundance. Establishment of such baselines provides the historical context required for effective evaluation of change through time and is becoming increasingly important in a rapidly changing world (Magurran et al., 2010; McNellie et al., 2020). Patterns of abundance across species are a fundamental characteristic of any community, and the absence of such data presents a formidable impediment to advancement of ecological knowledge. The combination of abundance data and species traits also permits analysis of functional diversity and evaluation of ecosystem services (Şekercioğlu, 2012). The need for foundational data from the world’s richest biomes can be remedied with solutions for the methodological and logistical challenges associated with thorough characterization of its rich and diverse communities.
Methodological challenges have included basic aspects of species identification in diverse and poorly studied communities, a lack of standardized counting protocols, and issues accounting for interspecific variation in detectability, which can impede accurate estimation of species’ abundances (Banks-Leite et al., 2014). Reasonably complete community inventories require reliable information on taxonomy, which has greatly improved in the last few decades despite a growing appreciation that many cryptic species continue to lack formal recognition (Bickford et al., 2007). Current information, however, is certainly sufficient to produce reliable identifications for most species. Our abilities to identify birds by their vocalizations have greatly improved recently with the proliferation of freely available online sound recording archives (https://www.xeno-canto.org/ and eBird.org). Many Neotropical bird species inhabit structurally complex habitats such as forests, and are more often heard than seen, so detection from vocal cues is critical during community surveys (Celis-Murillo et al., 2012). Furthermore, even when vocalizations are learned exhaustively, low vocalization rates and population densities may hamper detectability of certain species and impede accurate abundance estimation (Anderson et al., 2015). As new techniques for handling sampling difficulties continue to be developed, we anticipate wider application of modern approaches to estimate detectability and generate reliable estimates of population density (e.g., Gómez et al., 2018).
Logistical issues have also hindered the establishment of benchmark tropical bird surveys. Recognition that most species, at least in tropical forests, occur at very low abundances, established a logistical hurdle because population densities of most species could only reasonably be estimated in large (suggested to be at least 100-ha) plots (Terborgh et al., 1990). Surveys of large plots require substantial and consistent sampling effort that may not be feasible in tropical countries where obtaining funding for long-term research has been challenging (Barlow et al., 2018). In addition, most sites selected for such large plots have been placed in relatively low-elevation and accessible terrain to facilitate plot access. No large plots yet exist in mountainous terrain, which may bias perspectives and limit generalizations about the structure of Neotropical bird communities.
The current focus by tropical ornithologists on conservation of at-risk landscapes has probably also contributed to the lack of benchmark surveys in undisturbed forest (Robinson et al., 2004). Neotropical forests, for example, have been experiencing some of the fastest rates of deforestation and habitat conversion worldwide (Kim et al., 2015; Giam, 2017). Thus, most previous research has focused on conservation-relevant topics such as the impacts of fragmentation and habitat loss on Neotropical forest bird communities (Boyle and Sigel, 2015; Stouffer, 2020). Yet, the establishment of reliable biodiversity benchmarks from intact forests has provided the opportunity to quantify long-term, gradual changes in bird communities from relatively undisturbed areas. For example, even in remote Tiputini, Ecuador, and Brazilian Amazonia, evidence for subtle changes in the avifauna over the last two decades, perhaps driven by climate change, has been found (Blake and Loiselle, 2015; Stouffer et al., 2021).
Here, we review the history of the six big bird plots surveyed in the Neotropics (Table 1). We summarize the motivations for establishment of these plots, the primary methodological approaches used to inventory Neotropical forest bird communities, as well as the key ecological questions addressed from the resultant datasets. After comparing the major findings from the plots, we briefly evaluate and interpret differences in community structure and organization. Because scope of inference has been limited by the small number of big plots in exclusively lowland forests, we suggest that a more extensive network of plots is both needed and feasible. As a guide to the potential of creating a larger network of bird plots, we look to the extensive conceptual advances created through the global network of tree plots established by the ForestGEO group (Davies et al., 2021). We then connect the potential gain in knowledge from expanding the network of big bird plots with the challenges of establishing such a network. Finally, we identify and address challenges that need to be addressed if we are to reap potential benefits of an expanded network of tropical bird plots.
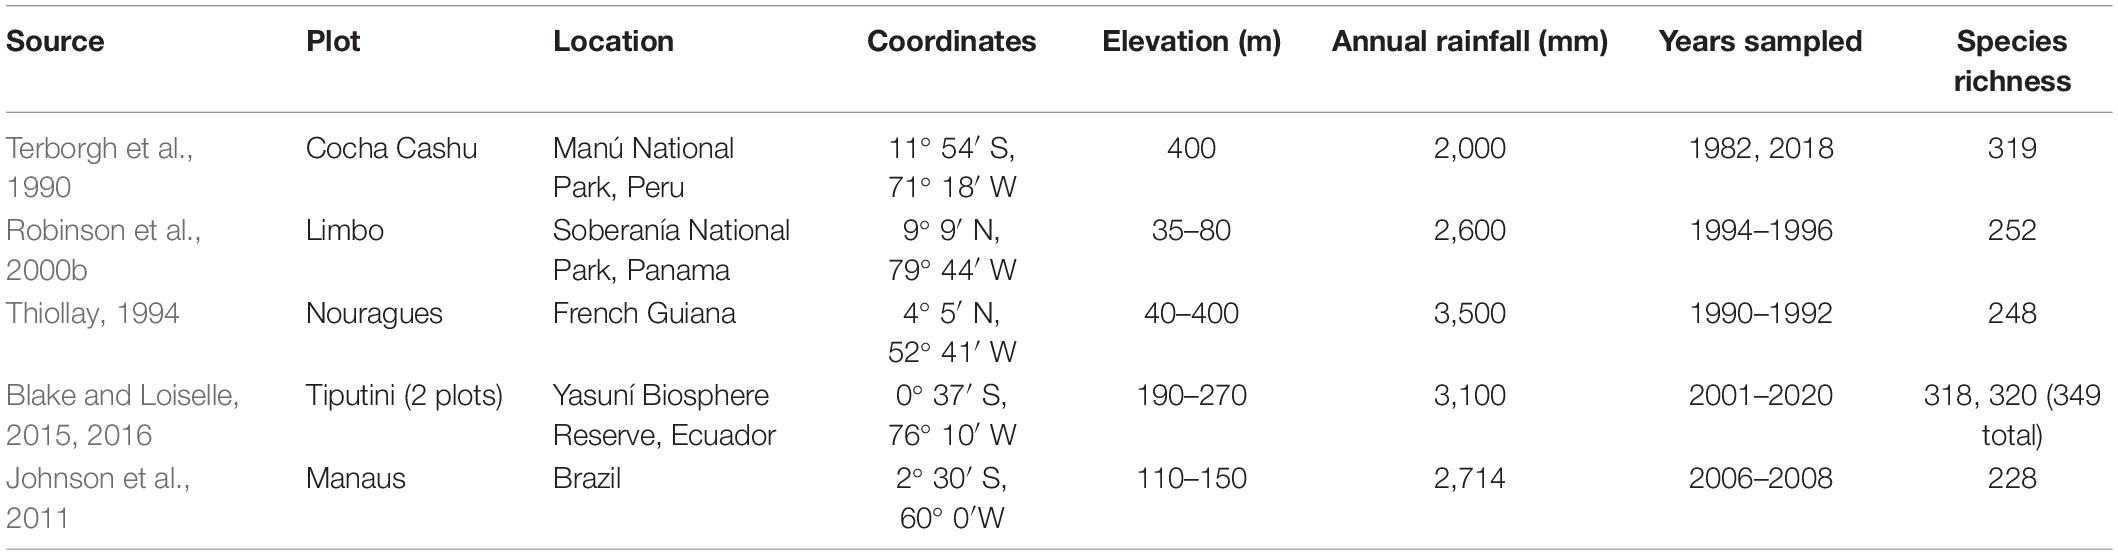
Table 1. Summary of the ∼100-ha plots used to characterize Neotropical bird communities, including their locations, basic environmental characteristics, geographic coordinates, range of years sampled, and species richness.
The history of large plots used to study Neotropical bird communities is paradoxically both long and brief, being initiated in the 1980s but including only a few big plots surveyed, mostly, for short, discrete time periods (Table 1). Perhaps inspired by the North American network of plots surveyed by volunteers (Johnston, 1990), mostly via spot-mapping, Karr recognized the absence of similar data from the Neotropics (Karr, 1971). He established a 2-ha plot in Soberanía National Park, Panama, in the late 1960s, apparently creating the first effort to go beyond simple listing of species occurrences to estimation of abundances. Observing that, at least in Amazonia, most bird species were rare and had very large home-ranges, Terborgh et al. (1990) concluded that any plot-based effort aimed at estimating population densities of most tropical forest bird species would have to be much larger. Consequently, they established the 97-ha Cocha Cashu plot near the Manú River in southeastern Peru. Completing surveys in the late 1980s, they discovered that, indeed, most species occurred at densities of less than 2.5 pairs/100 ha and had home ranges many times larger than the 2-ha Soberanía plot, validating the need for large plots. Even from surveys of nearly 100 ha, the Cocha Cashu plot was still too small to allow reliable estimates for a quarter of the species detected (Terborgh et al., 1990), but nearly all of those were assumed to be quite rare or transients. Furthermore, they realized that multiple methods were needed to survey Neotropical birds given their tremendous ecological and life-history diversity, often low rates and amplitudes of vocalizations, and variation in detectability (Robinson et al., 2000b, 2018).
The successful accomplishment of a nearly complete inventory of species alongside population density estimates allowed assessment of guild structure and biomass distribution. Linking the basic measurements of richness and abundance with species traits opened the door to test for differences in functional diversity and community structure between tropical and temperate bird communities. The idea that 100 ha is a useful plot size in which to study tropical forest birds gained traction and led to the eventual establishment of analogous plots in French Guiana (1986), Panama (1994), Ecuador (2001), and Brazil (2008) to improve and evaluate the generalizability of the Cocha Cashu results, as well as address other particular questions of interest detailed in the individual plot histories below.
Situated alongside an oxbow lake for which it is named, Cocha Cashu Biological Station was established in 1968 within the meander belt of the Manú River in southeastern Peru. Consequently, the vegetation throughout the meander belt represents a mix of successional stands reflecting the periodic flooding dynamics of the river. The 97-ha plot itself is in a mature floodplain forest that remains above the normal annual flooding level of the river. The plot is surrounded by the oxbow lake, fig swamps, and is contiguous to a larger tract of mature floodplain forest. An extensive trail system became the basis for a study grid system which encompasses the original 97-ha plot and has expanded to approximately 10 km2. The trail system was converted into a grid by mapping trail markers every 25 m along all trails.
At the time of the establishment of the plot, ornithological knowledge was on the cusp of allowing reliable identification of most Neotropical bird species by sight and sound. The development of these identification criteria, which had long been a cornerstone of studies in temperate systems, allowed for the incorporation of survey techniques such as spot-mapping to evaluate the organization and structure of rich Neotropical bird communities. Multiple techniques were employed to overcome the challenges of counting the variety of species with diverse life histories and behaviors, which included traditional methods such as spot-mapping, and also employed mist-netting and visual counts to estimate the density of flocking and colonial species. Even some radio-tracking was implemented to map territories of woodcreepers. Based upon survey work of forest surrounding the Cocha Cashu plot in which just three additional species were detected, Terborgh et al. (1990) estimated that the plot encompassed 99% of the bird community. It should be noted, however, that although the plot was estimated to be large enough to detect 99% of the bird community, this was still not adequate for estimating population density for a quarter of the species.
In sum, the original survey included >15,000 spot-map registrations which yielded an average of ∼15 detections per territory. The use of mist-nets on the plot was employed on 6 separate mist net lines and captured ∼755 different birds representing ∼80 species. This was supplemented by focal studies on Yellow-rumped Caciques (Cacicus cela) which yielded greater than 1,000 color-banded individuals (Robinson, 1986), and 1,173 individual group counts of monospecific flocks of parrots. Combining all these different survey efforts yielded 1,920 birds/100 ha. In total, 319 species were detected and density estimates were derived for 245 species that held territories on the plot. Most species tended to be somewhat rare, with a median of 2.5 pairs/100 ha. Among foraging guilds, insectivores had the highest species richness but accounted for the smallest fraction of overall biomass (18%), whereas granivores comprised the largest portion of biomass (43%) of any given foraging guild. Thus, as the first exhaustive survey of a Neotropical bird community at a relatively large spatial scale, the results showed the exceptional richness, domination of the community rank-abundance curve by a long tail of rare species, concentration of most avian biomass among granivores and frugivores, and a large diversity of lifestyles requiring implementation of multiple survey techniques.
The Nouragues field station, established in 1986, was located in continuous primary lowland rainforest of the Eastern Amazonian interior of French Guiana. The Nouragues bird plot was located deep in forest interior to facilitate bird population and behavioral studies, as well as to provide a comparison of community structure with the Cocha Cashu plot. Standardized surveying commenced at the 100-ha plot in 1990 (Thiollay, 1994). The plot’s location was designed to avoid habitat-edge effects, but an effort to describe internal spatial heterogeneity created by treefall gaps was included. On a central, 24-ha subplot, 78 treefall gaps that accounted for 3.7% of the area were mapped in 1991, one of the primary years of the bird counting work. Spot-mapping and mist-netting were the primary approaches used to generate population density estimates during 8 months of surveys between February 1990 and November 1992. The plot was systematically searched from dawn to dusk to map residents using a grid of 1-ha quadrats. A subset of 1-ha quadrats were scrutinized in nine 33 m × 33 m sub-squares to facilitate territory mapping and estimation of typical territory sizes. Mist-netting took place within a core 24-ha quadrat in September 1991 and March and October 1992. Twenty 12-m mist nets were placed along seven 400-m parallel trails and operated for 5880 net-hours resulting in 694 marked individuals. Data were supplemented by an earlier study (5 years of effort) where 1,353 mist-netted birds of 99 species were followed and spot-mapped. Supplementary surveys such as the use of acoustic playback, nest locations, nocturnal surveys, radio-telemetry, color-band resighting and canopy observations were conducted to quantify community composition and home-range sizes.
Collectively, J. L. Dujardin and M. Jullien mapped 6,658 individuals comprised of 248 resident species on the 100-ha plot (Thiollay, 1994). 220 species had a density of ≥0.50 pair/100 ha and 157 species had a density of ≥1 pair/100-ha. The estimated density on the entire plot was 829 pairs/100 ha (about 1,658 individuals), quite similar to the 1,910 individuals/100 ha at Cocha Cashu (Terborgh et al., 1990). According to Thiollay (1994), 441 resident species occurred in the 80,000 km2 of the interior primary forest of French Guiana. Of these, more than half (58%) had an average density under one pair/100 ha. The species found at Nouragues included 77% (234/305) of the most forest-restricted species of the region. The community was dominated by two species that had 28 and 38 pairs on the plot and ten “subdominant” species with 14–18 pairs in the 100 ha. Those dozen species made up 31% of the estimated bird density on the plot. Defining rare species as those with <2 pairs/100 ha, Thiollay (1994) suggested the Nouragues plot had 137 rare species representing every guild, family, and ecological niche of the region; 64 were species considered to occur at densities <1 pair/100 ha. By definitions used in Terborgh et al. (1990), 37% of the 248 species were rare (≤1 pair/100 ha), including species of large body mass with large home ranges as well as patchily distributed species. Distributions on the Nouragues plot were often patchy, also a characteristic of birds in Cocha Cashu, Peru (Terborgh et al., 1990). Thiollay (1994) hypothesized that the local absences from the Nouragues plot of some common French Guianan species could be attributed simply to patchiness of distributions. Overall, the community structure was remarkably similar to that at Cocha Cashu.
The Limbo plot (104 ha), located in Soberanía National Park on the isthmus of central Panama, was established in 1994 following scouting for site placement in 1993 (Robinson et al., 2000b). The site had a prior history of mist-netting studies extending back to the 1960s. Those efforts were centered at the Limbo Hunt Club, a former camp site and small cabin used by military personnel during hunting trips along the Pipeline Road (Karr, 1971). A 2-ha plot was established at the site in 1968 by Karr (1971), following the success of similarly sized plots in measuring bird community structure across North America (e.g., Short, 1979). The community was studied via mist-netting and mapping observations of color-marked birds to estimate territory sizes and densities. Richness on the original 2-ha Limbo plot was 140 resident species (Karr, 1971). Extrapolation of abundances to 100-ha suggested a combined density of 1,800 pairs. The richness and density values per 100 ha were eventually questioned when the Cocha Cashu plot, nearly 50 times larger (97 ha), discovered much different community structure, with many more rare species and lower maximum abundances. Importantly, territory sizes of most Amazonian species averaged 4.5 ha, more than twice the size of the original Limbo plot (Terborgh et al., 1990). The Cocha Cashu results, therefore, suggested the Limbo 2-ha plot may have been too small to adequately characterize the community if species were too wide-ranging or if their distributions were too patchy, as reported from French Guiana (Thiollay, 1994), to be sampled by a small plot. Because of these concerns and how they might influence interpretation of geographical differences in community structure, a larger plot was established at Limbo (104 ha) to facilitate fairer comparisons with South American plots. In addition to increasing plot size, a wider variety of survey methods, focused on extensive spot-mapping of territories, was also used. Thus, the primary questions posed by Robinson et al. (2000b) were: (1) Are results from the original 2-ha Limbo plot influenced by the small spatial scale of the initial study? (2) Is organization of the Panama bird community fundamentally different from communities in Amazonia and, if so, why?
The 104-ha plot was positioned to overlap the original 2-ha plot. It encompassed tropical moist forest ranging in age from 250 or more years old (largely on and near the original plot) to less than 15 years old along the margins of Pipeline Road and at large treefall gaps created by windstorms. Aside from the one-lane unimproved road passing through it, the plot was more than 3.5 km from edges at the eastern park boundary and Gatun Lake. Its permanently flowing Rio Limbo, a small creek arcing through the northern and eastern portions of the plot, attracted some riparian species. Otherwise, most of plot was terra firme forest in a relatively flat basin.
The Limbo plot was constructed of north-south transects spaced at 100-m intervals and three east-west transects, one each at the northern and southern plot boundaries and one through the plot center. Surveys were conducted largely by one observer (WDR) who walked each transect, stopping every 100 m to conduct 8-min point counts where the direction and distance of each bird was noted. The points were surveyed 8 times each in 1994–1996 to facilitate density measurements and also to establish an easily repeatable survey method to allow future re-surveys. Extensive mist-netting to color-mark birds was conducted largely by two observers at 8 different routes across the plot. Point count data and mapping of color-marked bird observations were used to spot-map, along with discoveries of nests for a subset of species (Robinson et al., 2000a, c), then clusters were identified to enumerate density. For wide-ranging and patchily distributed species, transects and encounter rates were used to estimate densities.
Altogether, more than 30,000 bird observations were mapped on the 104-ha Limbo plot, representing 252 species. Of those, 152 resident species were present in densities of at least 0.5 pairs/100 ha. The original 2-ha plot results suggested that the Panama and Amazonian bird communities were structured quite differently, a conclusion confirmed by the 104-ha plot results. The Limbo community was dominated by eight very common species whose abundances were several times greater than the most common species at the Cocha Cashu and Nouragues plots.
Tiputini Biological Station (TBS) is located adjacent to Yasuní National Park and within Yasuní Biosphere Reserve, one of the most diverse regions of the world (Bass et al., 2010). Although TBS itself is only ∼700 ha, it is surrounded by extensive areas of intact forest. An initial site visit was made to Tiputini Biodiversity Station (TBS) in 2000 to determine the feasibility of establishing long-term study plots. The goal was to find a site that was diverse, surrounded by large expanses of forest, and reasonably accessible, where we could establish two replicate 100-ha plots, something that had not been done at other sites. Two plots provide the opportunity to compare community composition at a relatively small spatial scale. The station and nearby areas are dominated by terra firme forest and also include várzea forest, palm swamps, and various successional habitats.
Two 100-ha plots (ca 1 km × 1 km each) were established in terra firme forest during 2001. Plots are approximately 1.5 km apart at the closest point. Both plots are gridded (100 × 200-m grid lines) and marked with 1.5-m PVC tubes. The Harpia plot is characterized by more dissected upland forest while the Puma plot is flatter overall. Both areas experience partial inundation when small streams back up as the Tiputini River rises; Puma has more areas that fill with persistent standing water during the rainy season. Dominant vegetation on both plots is tall, evergreen forest.
We had several different objectives for long-term studies. At the most basic level, we wanted to investigate spatial patterns of species distribution at within-and-between-plot scales and how those patterns might change over time. By employing capture-mark-recapture analyses we wanted to be able to estimate survival rates for a diverse set of species (Blake and Loiselle, 2008, 2013). A second major focus was on behavior, spatial distribution, genetic relatedness, and seed dispersal by manakins (family Pipridae; e.g., Loiselle et al., 2007; Blendinger et al., 2008, 2011; Ryder et al., 2009), with the majority of the studies based on the two plots.
We took two approaches to sample the birds: mist nets and visual observations. Mist nets (12 × 2.6 m, 36-mm mesh) set at ground level were arranged in a series of eight sets of 12 nets on each plot (96 sites per plot). Each set of 12 nets formed a rectangle (100 × 200 m) with nets set ∼50 m apart; maximum distance between nets on a plot was approximately 920 m. Each set of nets was run for one day (∼0600–1200 h) in January (peak of breeding for many species) and one day in March (late breeding season for many species), starting in March 2001. March samples have largely been discontinued during the last few years, primarily because heavy rains precluded netting. Captured birds were identified and most were banded with aluminum leg bands. Most manakins were also marked with color bands. Blood samples were collected from many species during the first years of the project and were used to investigate occurrence of blood parasites (e.g., Svensson-Coelho et al., 2014).
To obtain a more complete picture of the community, JGB has conducted transect observations that started in 2005. Locations of all birds seen or heard were noted on scale maps of each plot while walking along transects; unknown songs were recorded for later identification. Approximately 1–1.4 km of transects were covered during a morning with starting positions distributed throughout the plots. Each plot took ∼12–13 days to cover. Transects covered the entire plot but were not repeated during a given sample, precluding the more traditional spot-map analyses. From 2013 to 2017, passive acoustic monitors were deployed on both plots to evaluate their effectiveness as a sampling tool (Blake, 2021). Results from the recordings were compared to transect counts conducted during the same periods. Finally, a long-term camera trapping project has provided additional information on some of the larger, terrestrial species, such as tinamous (family Tinamidae) and trumpeters (family Psophidae; Blake et al., 2017).
To date (2001–2020), 180 species have been captured in mist nets (16,883 captures) on the two plots combined, including 160 on Harpia (8307 captures) and 155 on Puma (8576 captures). A total of 336 species have been detected during transect counts, with 302 on Harpia (34,249 records) and 304 on Puma (29,719 records). With both captures and observations combined, 320 species have been recorded on Harpia, 318 on Puma, and 349 with both plots combined. Patterns of species accumulation, capture rates, and observation rates are generally similar on both plots. Family and overall species composition also are similar on the two plots; the same species are the most dominant on both plots (Blake, 2007; Blake and Loiselle, 2009). Despite the overall similarities, many species showed differences in abundance (captures or observations) across the plots with differences often related to small-scale variation in topography and habitat between the plots. For example, Screaming Piha (Lipaugus vociferans) has a large lek on the Harpia plot but is absent from Puma. In contrast, Wire-tailed Manakin (Pipra filicauda) is common on Puma but has no leks on Harpia. Comparisons with other sites (e.g., Cocha Cashu, French Guiana, Panama) showed stronger similarities between Cocha Cashu than with other sites, particularly Panama (Blake and Loiselle, 2009).
Plots at Tiputini have been surveyed annually since 2001, something that has not been done at the other big plots. As such, we have a more detailed picture of temporal fluctuations in bird numbers than at the other plots. Capture rates and observations fluctuated over the first years – 2001–2009 – but showed no consistent pattern of change. Since 2009, however, captures and observations have declined by approximately 50% on both plots, in the absence of any change in local anthropogenic influences (e.g., logging, hunting) (Blake and Loiselle, 2015, 2016). Declines have occurred across many guilds and species, with insectivores particularly hard-hit. Some terrestrial insectivores (e.g., Formicarius antthrushes, Sclerurus leaftossers) largely disappeared for some years, although numbers have increased slightly in the last few years. Initial declines coincided with some strong La Niña events, which bring periods of heavy rains. Despite a lack of such strong events in the last few years, numbers of captures and observations have remained low.
Research with birds has been an integral part of the Biological Dynamics of Forest Fragments Project (BDFFP) since the project began in 1979 (Stouffer, 2020). The original intent of the BDFFP was to follow biological processes, including bird communities, in fragments of rainforest that would be isolated by agricultural development in an area of undisturbed rainforest about 80 km north of Manaus, Amazonas, Brazil (Bierregaard et al., 2001). During the 1980s, research fragments were isolated, and the BDFFP established a control site of continuous forest at KM 41 of the ZF3 road, at the far eastern end of the BDFFP, connected to nearly unbroken forest to the north and east. With the gradual construction of what became a permanent camp and some 500 ha of continuous forest gridded with 100 m × 100 m trails, KM41 provided a research base for projects in unfragmented forest. At a larger spatial scale, deforestation mostly ceased by the late 1980s, with the overall BDFFP area remaining ∼90% forested to the present, maintaining unbroken connection to vast rainforest with minimal disturbance (Rutt et al., 2019).
Several projects at KM41 set the stage for the big-plot survey. Standardized mist-netting, beginning in the late 1980s, contributed to the BDFFP bird capture database. We described mixed-species flock structure and space use (Develey and Stouffer, 2001). We spot-mapped and radio-tagged terrestrial insectivores over 10 years (Stouffer, 2007). In the days before GPS could provide accurate locational information under the rainforest canopy, the accuracy of spatial data for these studies hinged on the 100 m × 100 m trail grid. During work at KM41 and elsewhere at the BDFFP we identified criteria for aging birds and assembled audio recordings of almost all bird species, eventually producing two important resources for the big plot survey (Naka et al., 2008; Johnson and Wolfe, 2017).
In 2008, we had accumulated the necessary experience and resources to conduct a community-wide survey at the scale of a 100-ha plot, with metrics that could be compared to the handful of other studies that estimated space use and absolute abundance (Terborgh et al., 1990; Thiollay, 1994; Robinson et al., 2000b). Our objectives were to determine: species richness; density, biomass, and territory size of individual species; and the distribution of these metrics by foraging guild (Johnson et al., 2011).
The plot was within the gridded network at KM41, in an area that we considered representative terra firme forest. As is typical at the BDFFP, the topography included steep ascents and descents along old stream beds. One small stream passed through the plot. We sampled with mist nets from June to November 2008, with spot-mapping concentrated in June and July. Our methods for spot-mapping and interpretation of spot-map data were generally concordant with Terborgh et al. (1990). We improved abundance estimates for three of the most common species in the mist-net sample by estimating density of adults. Color-banded birds and radio-tagged birds helped us discover territory boundaries. Overall, we recorded 5,581 unique observations (sometimes of multiple individuals, as of a pair together or a monospecific flock) of 228 species and found community structure to be very similar to that at Cocha Cashu. Lower species richness compared to other Amazonian plots can be mostly attributed to the homogeneity of the surrounding landscape, which precluded the wandering birds that contribute to species richness without being part of the core resident avifauna (Johnson et al., 2011).
The common theme across the Neotropical big plot studies was to characterize the species composition in the bird communities as fully as possible, and for most of them, to estimate plot-level densities of as many species as possible using a variety of methods (Supplementary Table 1). We explored differences in community structure across the plots by compiling data on a suite of ecological traits including categorical (taxonomic family, migratory tendency and diet) and continuous variables (average body mass, population density; Supplementary Table 2). Population densities and body masses were unavailable for the Tiputini plots. To identify major differences across the plots in our categorical variables, we visually compared cross-plot differences using bar charts. For continuous variables, we compared distributions across the plots using pairwise Kolmogorov-Smirnov tests. We used a Bonferroni correction to generate adjusted p-values that corrected for multiple pairwise comparisons among the four plots. We used logarithmic transformations to normalize distributions of body masses and densities.
Across the six plots, fifty-four bird families were recorded. Cocha Cashu, Peru, had the highest species richness, followed by the two Tiputini plots, Nouragues, Limbo and Manaus (Table 1). Migrant species were minor components of most communities except for Limbo (Figure 1). Overall, plots were quite similar with respect to the number of species per family, with a few notable exceptions (Supplementary Figure 1). At Cocha Cashu, species richness of certain families was disproportionately high, including ovenbirds (Furnariidae), antbirds (Thamnophilidae), parrots (Psittacidae), and tinamous (Tinamidae). Conversely, at the only Central American plot (Limbo, Panama), species richness was disproportionately low for ovenbirds, antbirds and parrots. With respect to diet, Cocha Cashu had more granivores and insectivores than the other plots, whereas Panama had the most omnivorous species (Supplementary Table 1).
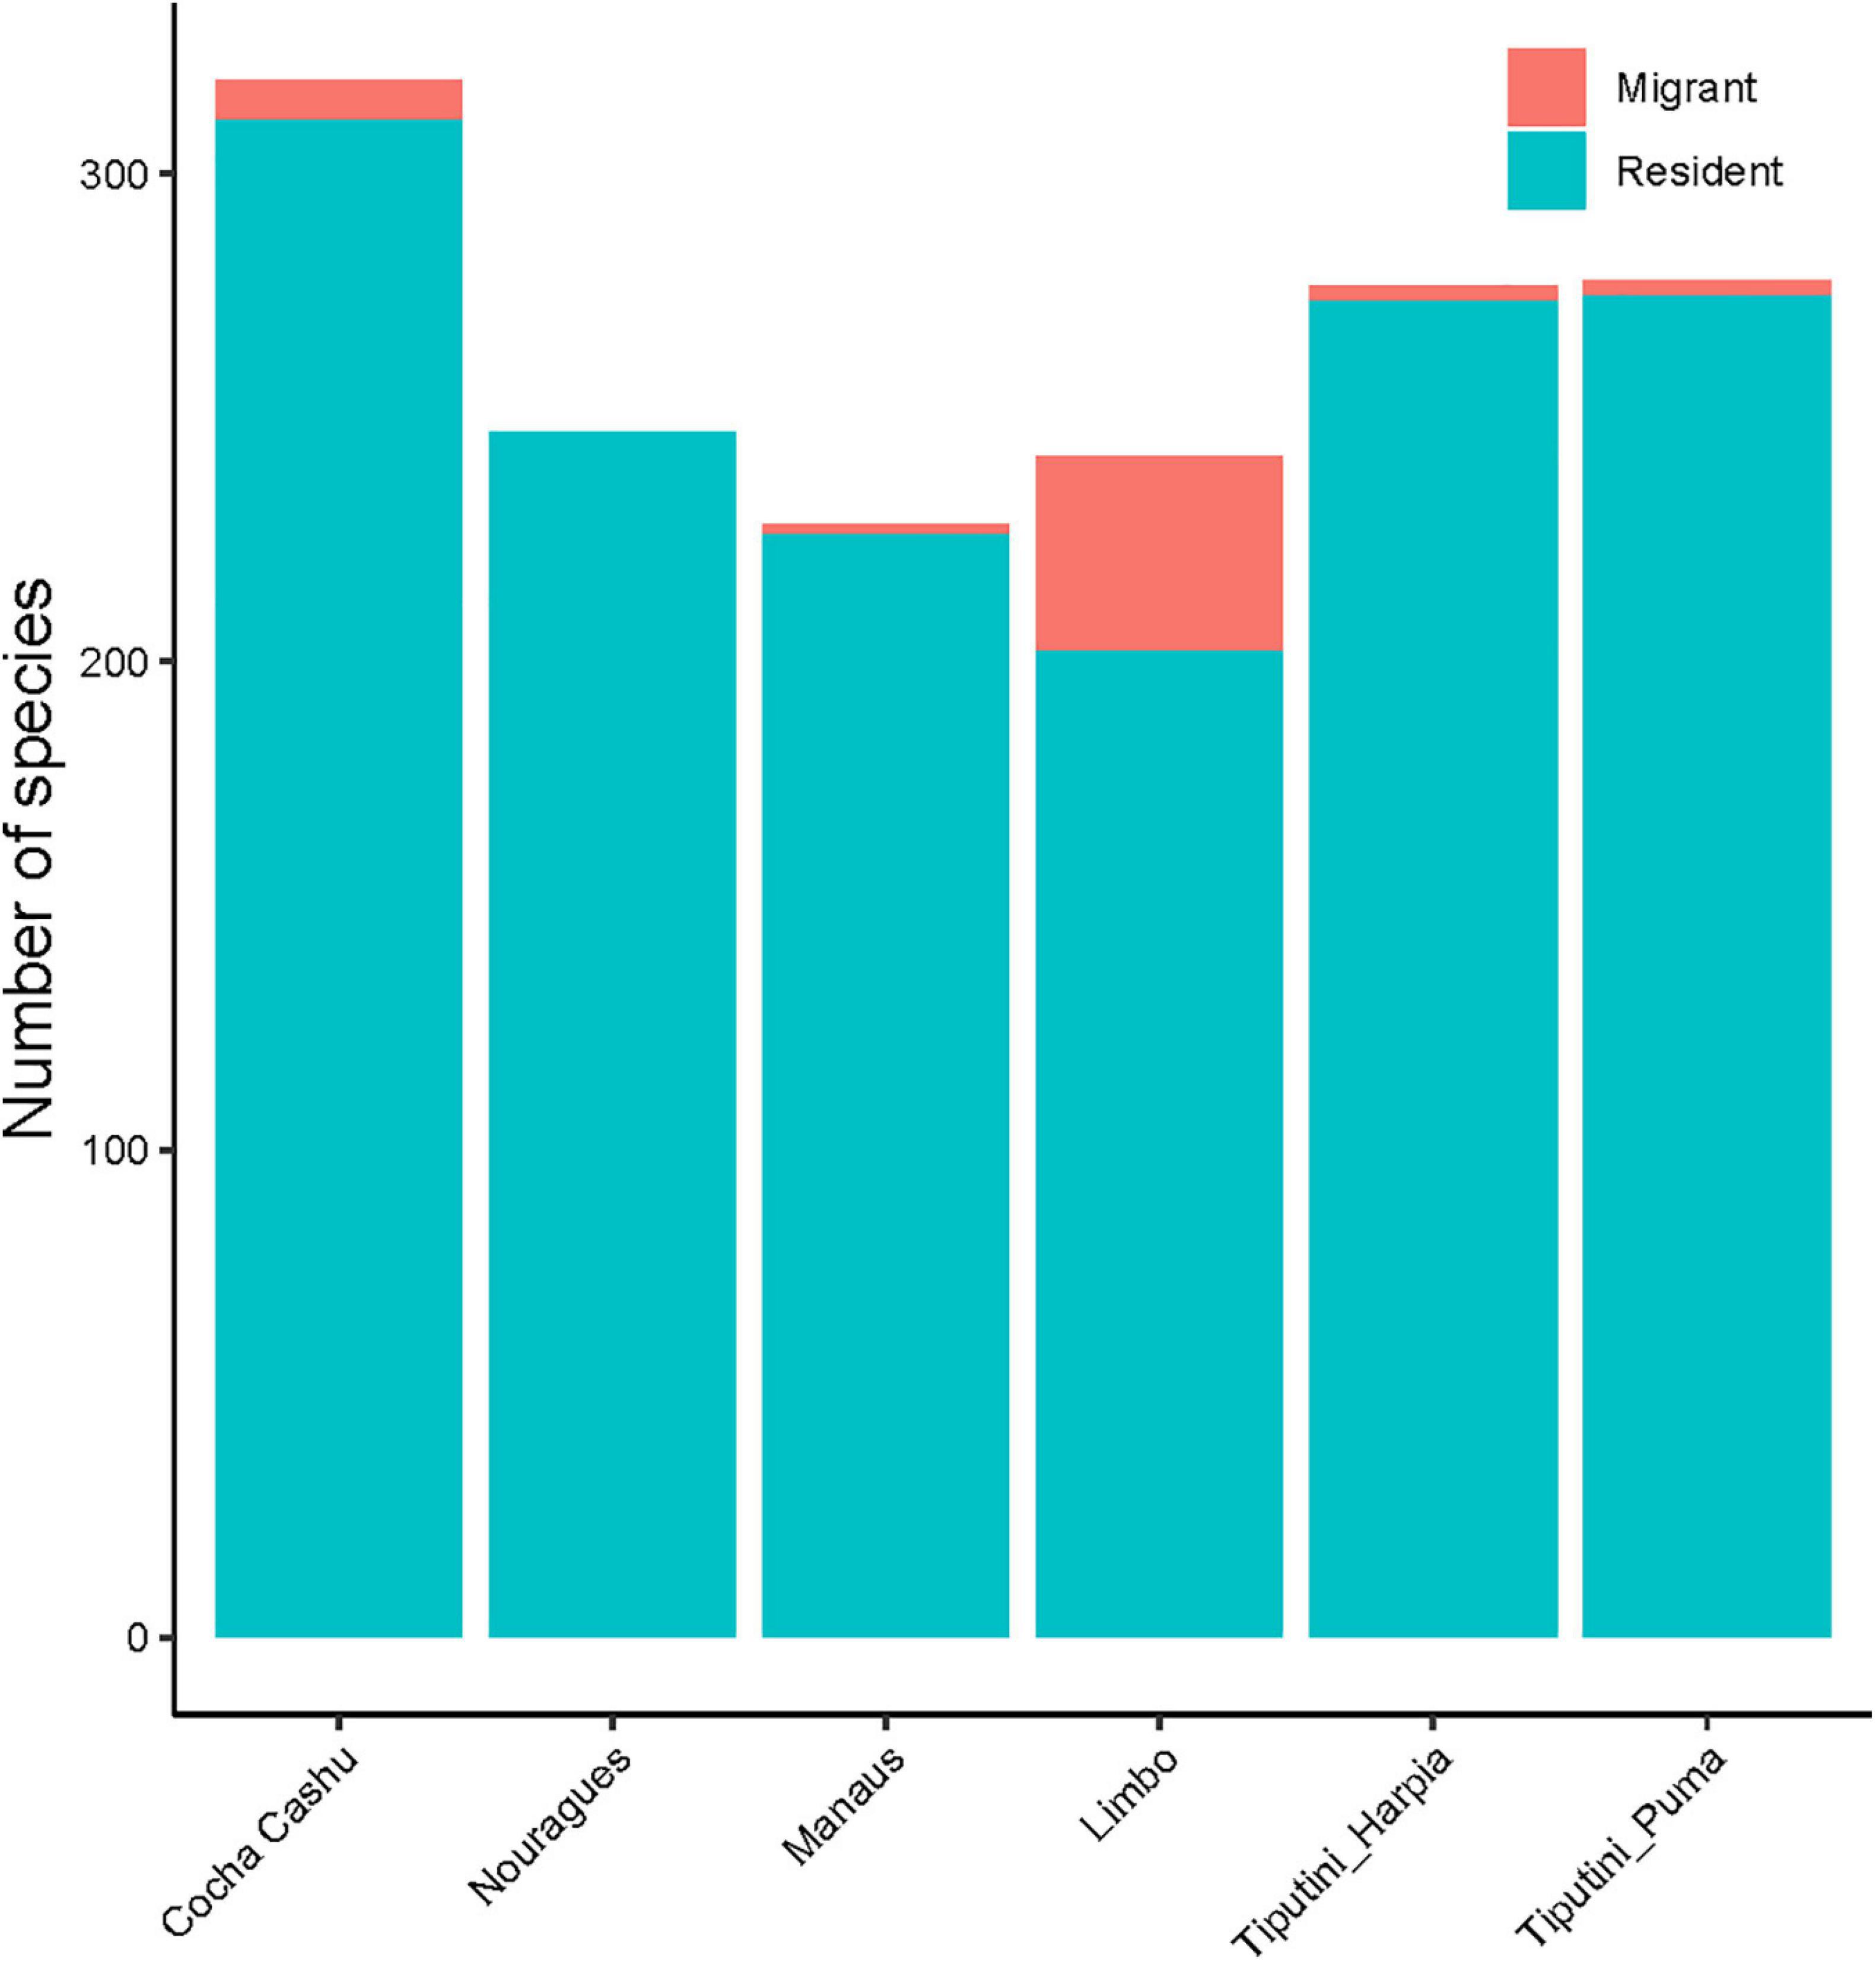
Figure 1. Species richness of migrants and residents at six of the big Neotropical bird plots.
Population density distributions varied substantially among the plots (Figure 2). Limbo supported an average density of 7 versus 2.5 pairs/100 ha at the Amazonian plots. Total number of birds was estimated to be 3,230/100 ha at Limbo, nearly twice the densities in Amazonia. Yet, the total bird biomass was quite similar. Distributions of body masses across size categories were also remarkably similar across the four plots for which body mass data were available and pairwise comparisons did not reveal any significant differences among the plots (Kolmogorov-Smirnov tests, all p > 0.05; Supplementary Figure 2). Body size distributions favored many small insectivores at Limbo, versus larger granivores and frugivores in Amazonia. Collectively, the South American sites were most similar to one another while the structure of the Panama community exhibited lower richness and higher number of migratory species. Differences in species identities across the plots are obvious as are differences in richness and abundance values, suggesting different mechanisms structuring the communities. But, similarities in body mass distributions, in particular, suggest that some mechanisms determining community structure are common to all the plots. The biogeographic and human history of the Panamanian isthmus might be responsible for the differences between Limbo and the Amazonian plots owing to disturbances associated with changing sea levels and human alteration of forest structure and, to some extent, hunting of large-bodied birds. However, the small number of plots limits our ability to evaluate hypotheses rigorously. Furthermore, the degree to which potential errors in estimating densities may influence determination of community-level abundance patterns cannot yet be explored because of inherent limitations in survey methodologies.
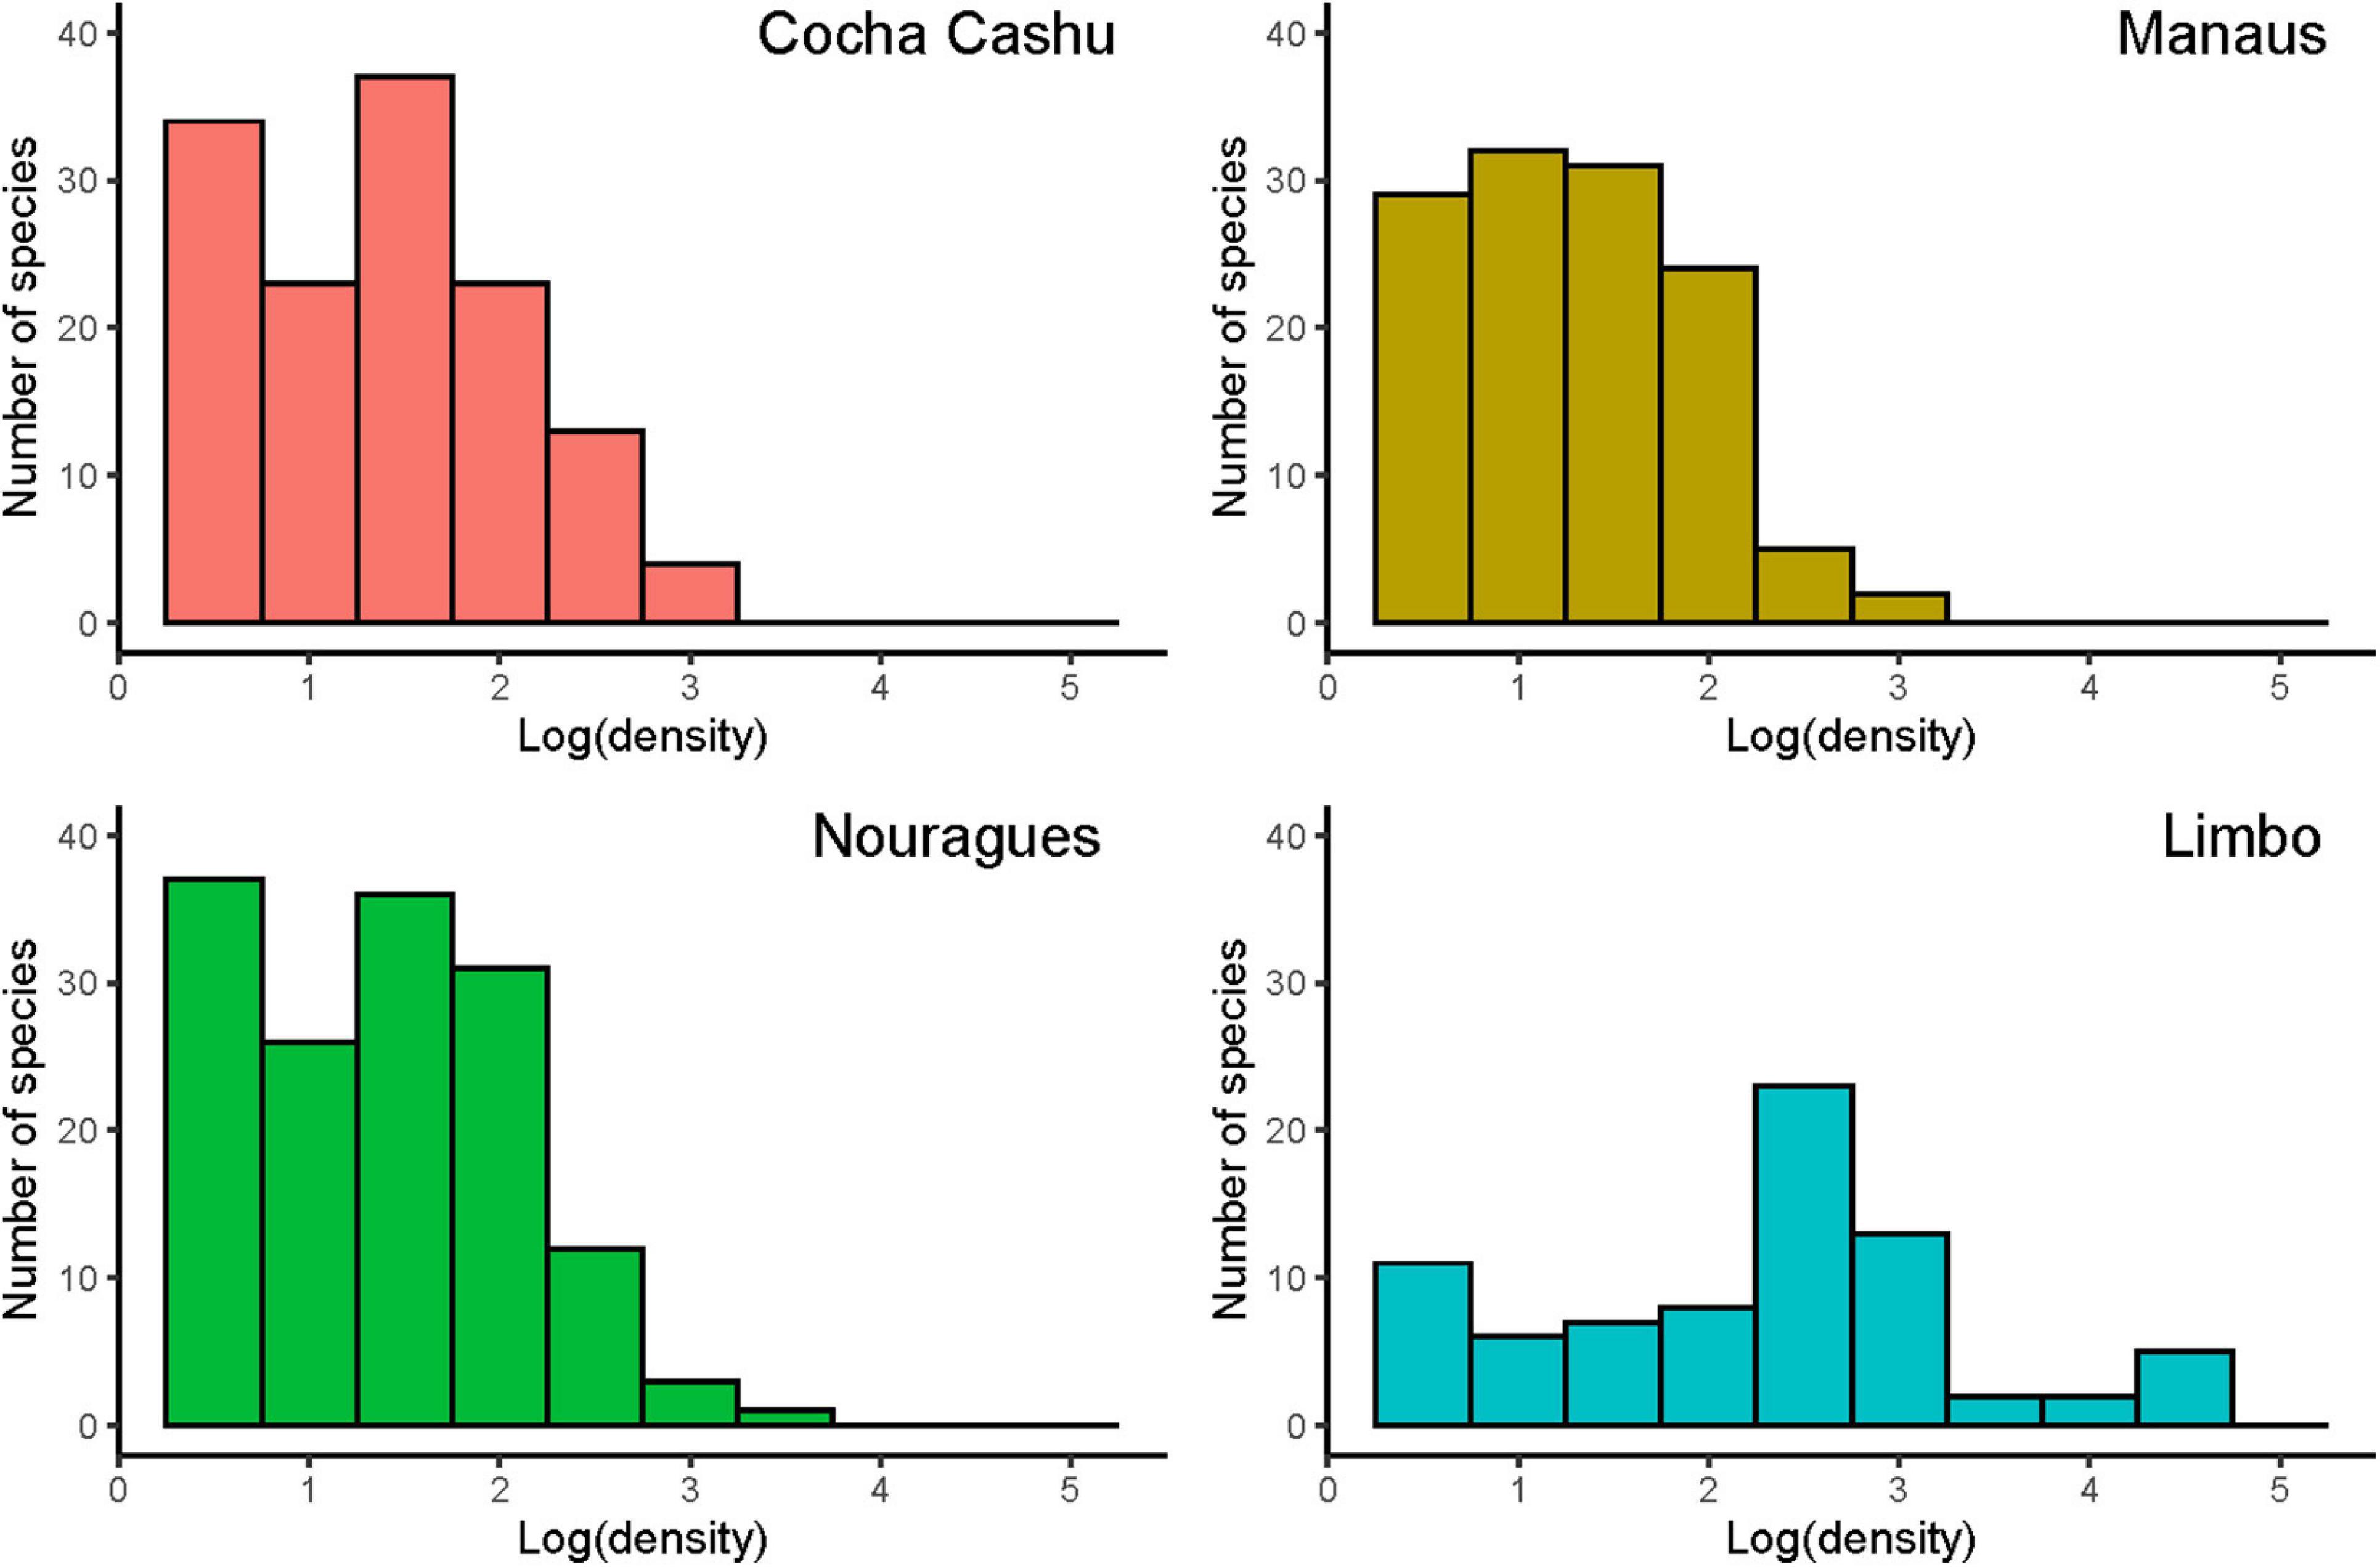
Figure 2. Population density (log 2 intervals) across species in the four Neotropical bird communities where density was estimated. The South American sites (Cocha Cashu, Manaus, and Nourages) are largely similar but quite different from the Central American site (Limbo).
To explore influence of the plot studies on the scientific literature, we examined citation patterns by compiling all sources citing the bird plot papers from Web of Science and utilizing Vos Viewer (van Eck and Waltman, 2010) to conduct network analyses of keywords. For each citation, we also extracted metadata including the year of publication, whether or not the citing source collected data from the same geographic location (binary yes vs. no), the range of latitudes at which the study was conducted (temperate, tropical, subtropical, global), the research theme (biogeography, conservation, ecology, evolution, natural history), and the taxa studied.
Through the end of 2020, the six big bird plot papers had been cited 1,443 times (Google Scholar, accessed 18 Feb 2021). Overall, citations peaked between 2005 and 2010. Citations of the Cocha Cashu paper, in particular, have declined in recent years. The primary influences of the papers included topics focused on ornithology, ecological, biogeographical, and conservation-related themes. The papers have had extensive influence on specific topics ranging from forest fragmentation to community dynamics and from community organization to frugivory and dispersal (Figure 3). Studies citing the papers have focused almost exclusively on birds and been largely conducted at tropical latitudes. Most of the citing research took place at different study sites than the original studies. Importantly, most plots have also spawned numerous additional studies conducted on the plots, illustrating the value of providing logistical access for researchers and advancing scientific knowledge more broadly. Aside from the present collection of big bird plots being developed at least partly as a consequence of establishment of the Cocha Cashu plot, we did not see evidence that publication of the plot results has spawned production of additional tropical bird plots despite the strong citation rates. In addition, while most of the big bird plot publications interpret results in the context of findings from the other plots, no effort to analyze in depth the results across plots or coordinate development of additional plots has emerged. Therefore, looking to other plot networks, such as the global collection of tree plots, could provide a useful guide.
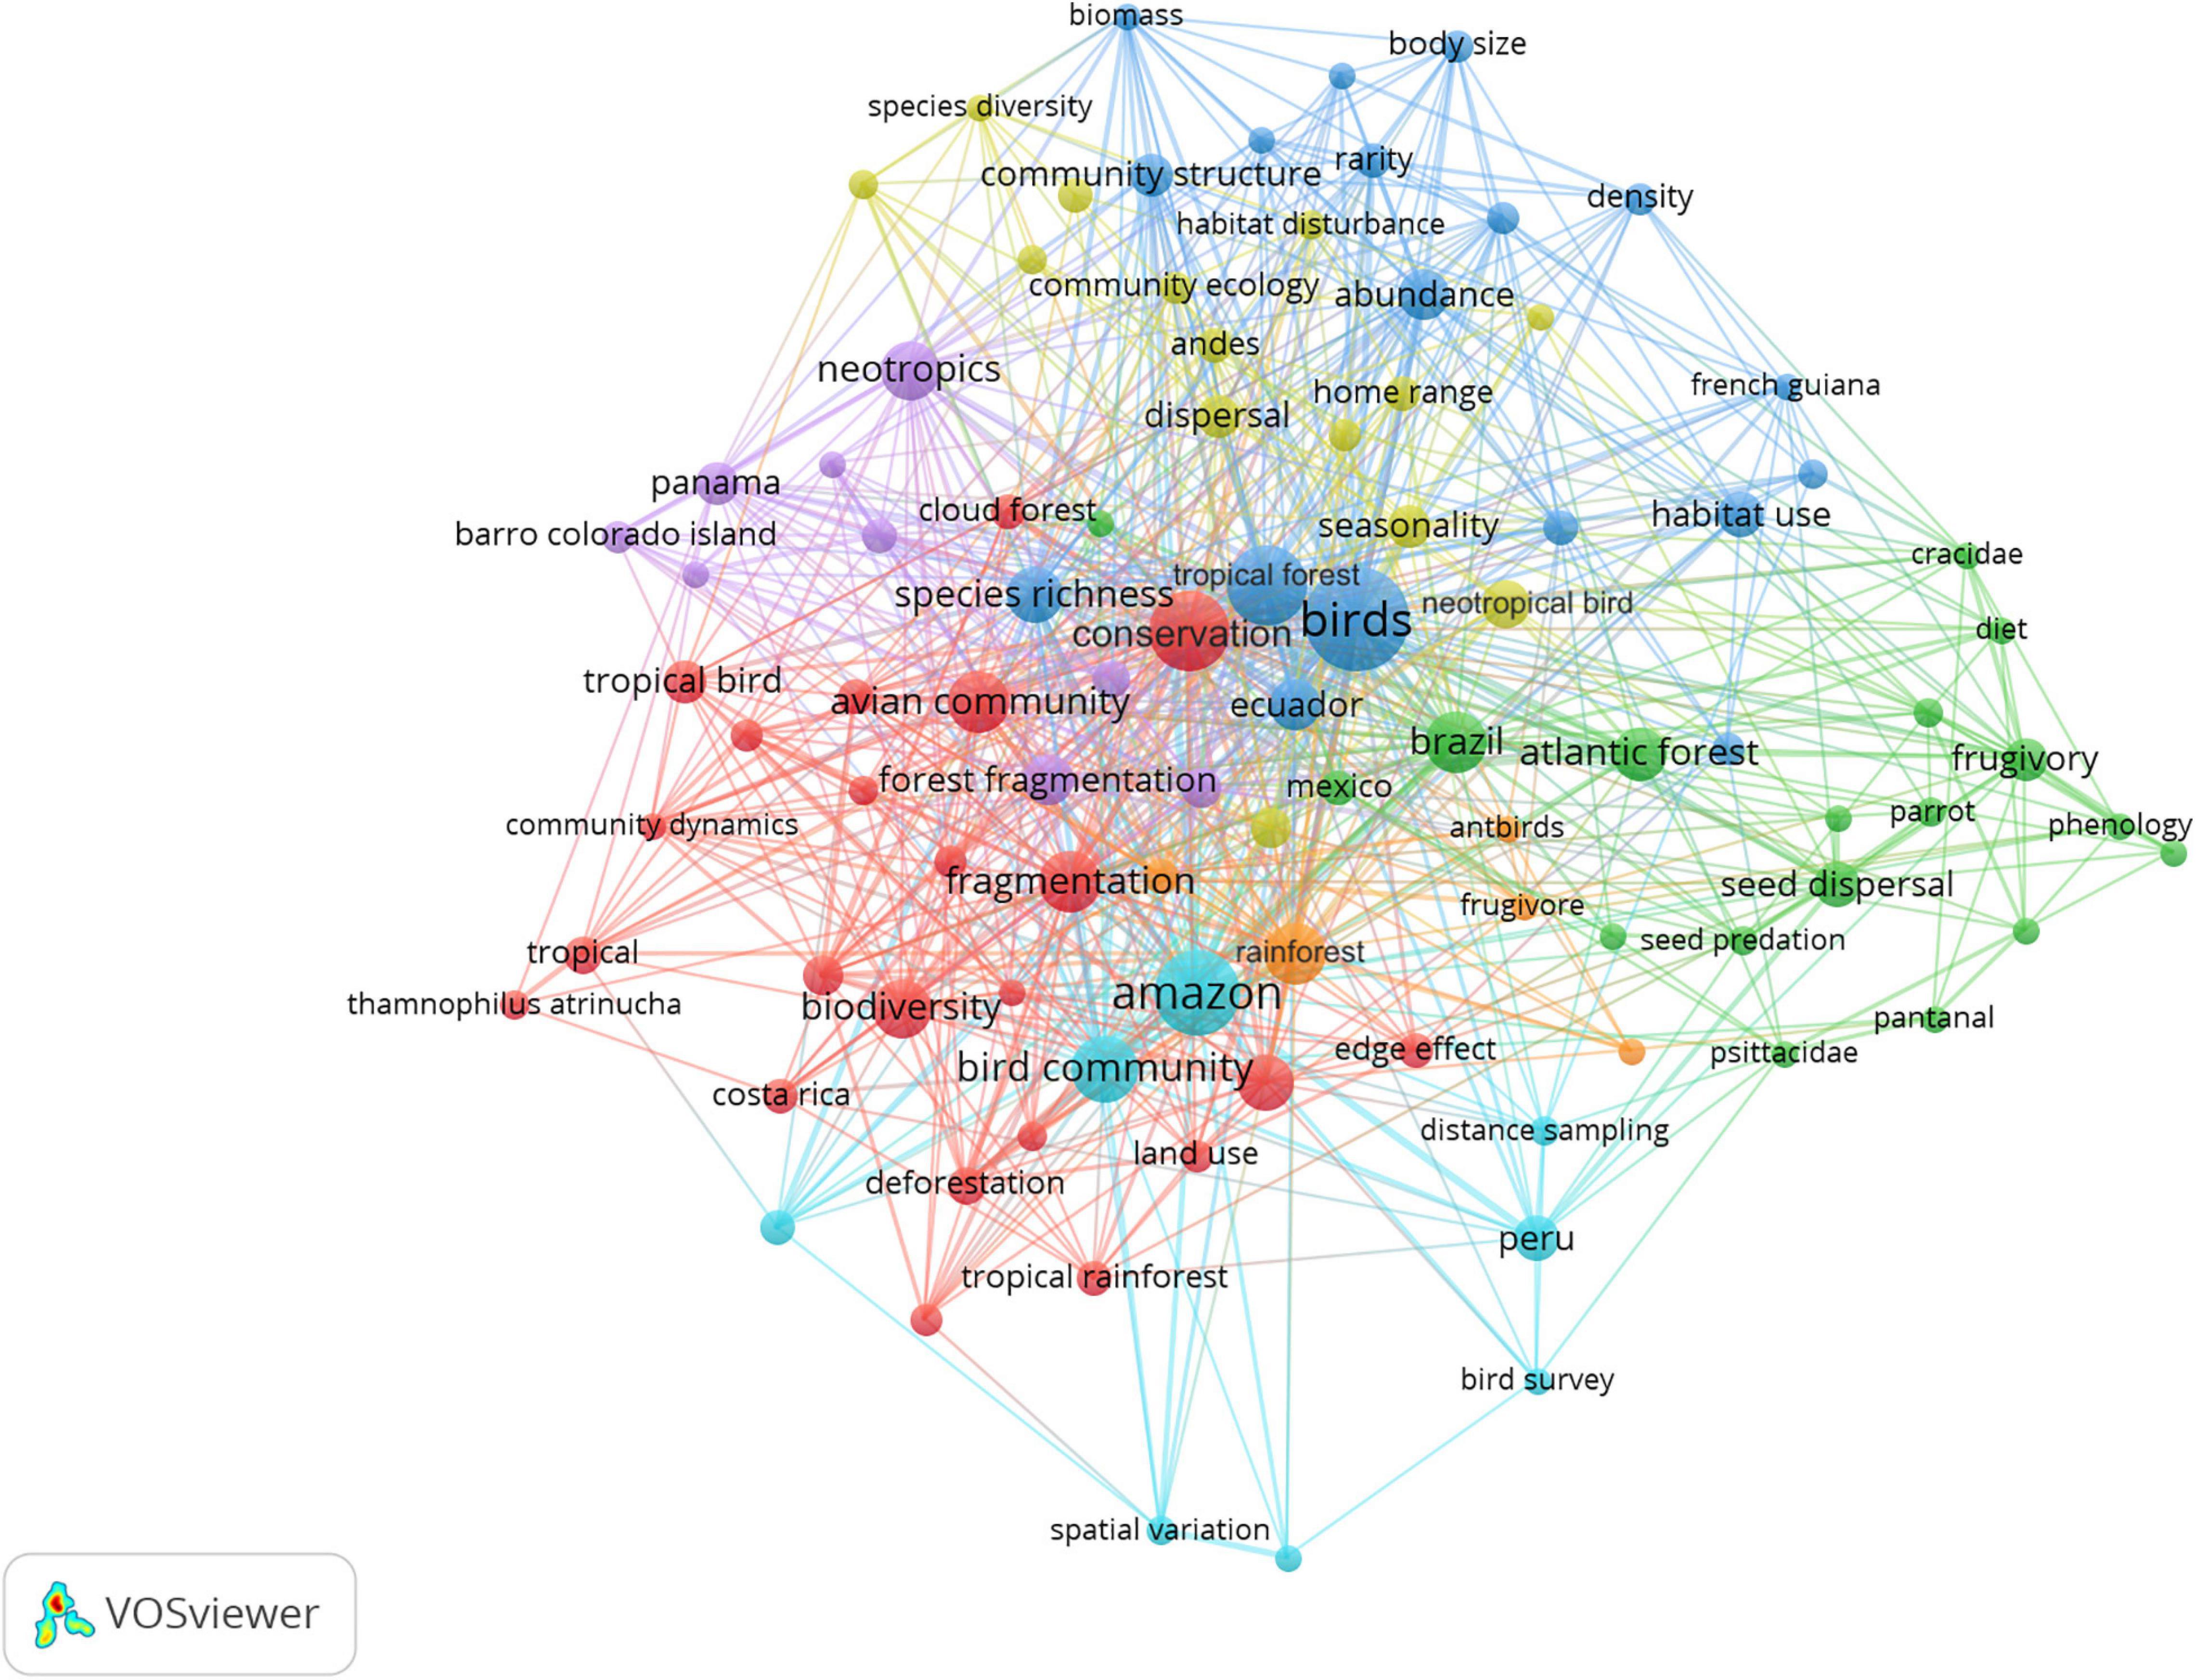
Figure 3. Network analysis of the influence of the big bird plot papers on the scientific literature. Keywords occurring five or more times in citing literature are included. Colors indicate major associations of co-occurring keywords.
A network of tropical tree plots began with the Hubbell-Foster 50-ha plot on Barro Colorado Island, Panama, in 1980. Motivations for creation of that plot were to generate horizontal life table data on tropical trees, quantify change so as to test competing equilibrium and non-equilibrium hypotheses for the creation and maintenance of species diversity, and to map individual trees to facilitate additional research by collaborators (Anderson-Teixeira et al., 2015; Davies et al., 2021). Within the next decade similar plots were established in Malaysia and India. Today, the network includes 71 plots ranging in size from 4 to 120 ha (average of 26 ha) with every individual of more than 7 million trees mapped and identified to species or morphospecies. Two simple, but logistically challenging, innovations of Hubbell and Foster catalyzed rapid change in our understanding of tropical forest dynamics: (1) establishing plots sufficiently large to sample most of the tree species present and to contain reasonable sample sizes of most rare species; and (2) including individual trees down to 1 cm diameter at breast height. Previous tree plot studies were normally 1 ha or less and measured only trees 10 cm dbh or greater, missing a substantial portion of species diversity present and thereby inhibiting abilities to provide robust tests of hypotheses about species diversity and to quantify tree life table parameters.
The collaborative efforts of hundreds of scientists in the ForestGEO network have produced nearly 1,400 scientific publications, including dozens in top-tiered journals that have addressed fundamental ideas in ecology, global change, evolution, and forest management (Ashton et al., 1999; Losos and Leigh, 2004). To facilitate collaboration, standardization of protocols for data collection and management, metadata, data sharing agreements, as well as analyses through freely sharing R code, was implemented. These steps moved scientific knowledge gained from a collection of case studies, examining data from one plot at a time, to examination of emergent patterns across many sites. By creating the network, more generalizable conclusion about the drivers of species coexistence, creation and maintenance of species diversity, and factors influencing ecological function of tropical forests were within reach. The incorporation of data from many plots led to creation of new ideas such as neutral theory (Hubbell, 2001), the relative impacts of density-dependence on recruitment (Comita et al., 2010), the influence of pathogens on diversity and increasingly robust assessments of the intermediate disturbance hypothesis (Wills, 2006; LaManna et al., 2017). We suggest that the ForestGEO network should serve as a model for the development of a pantropical network of big bird plots, creating opportunities to discover mechanisms influencing the structure of tropical bird communities and to identify factors responsible for long-term drivers of diversity change (Blake and Loiselle, 2015; Stouffer et al., 2021).
Would the ForestGEO model be effective for birds? Trees stay where you leave them. The mobility of birds and the challenges of detecting and attempting to count them accurately can be formidable (Robinson et al., 2018). Nevertheless, we argue that creation of a network of big bird plots, which expands beyond the existing six plots, could provide new insights into tropical, avian and conservation ecology. Formally establishing collaborative agreements so that birds can be sampled on the existing ForestGEO plots could quickly produce ecological insights regarding the roles of birds in tropical forests, especially the linkages between bird and plant diversity. Because plants are identified and mapped, and in many locations their phenological patterns, herbivorous consumers and fruit production patterns are quantified, opportunities to measure roles of birds as seed dispersers and in control of herbivorous insects are unprecedented. Two potential challenges might reduce collaborative opportunities. First, any disturbance of plants by ornithological activities, particularly mist-netting that involves clearing of plants or trampling by repeatedly walking the same routes across plots, could negatively influence plant communities, but carefully constructed collaborative agreements should minimize such challenges. Second, most ForestGEO plots are 50 ha or less (averaging 26 ha), thus are smaller than the current notion of an ideal size for sampling tropical birds (100 ha). However, no critical analysis of optimal tropical bird plot sizes has yet to be conducted. Depending on the questions of interest, more 50 ha plots might be better solutions than fewer 100 ha plots. Current data do indicate that bigger plots sample more species and provide more opportunities to characterize space use (territory sizes) for a greater percentage of the bird community. If, however, primary goals are to benchmark smaller fractions of each community for tracking change in numbers through time, to link bird and plant community data, and to connect bird diversity data with other forms of habitat data (e.g., satellite observations) and predict distributions across geographic space, then smaller plots can be useful. As the ForestGEO network has demonstrated, many research questions can be addressed within single large plots, whereas other questions may be addressed with data gathered from collections of much smaller plots (Condit et al., 2012). Thus, the questions drive and are influenced by the details of sampling designs.
The success of the existing six big bird plots indicates that creation of an expanded network like the ForestGEO forest dynamics plots would produce new insights. For example, even with the small sample of plots currently, clear differences in richness, abundance patterns and biomasses appear across the plots. Amazonian sites tend to be similar but show obvious variability in abundances even within the same species. Such geographic variation in abundances as well as life history traits remains largely undocumented (Wolfe et al., 2014). The Panama community hosts a larger proportion of migrants than the Amazonian sites. The Amazonian sites have many more large granivores. How do all of these observed differences translate to meaningful ecological dynamics? Without more coordinated studies across more plots, particularly addition of more Central American sites, it is challenging to draw robust conclusion. Finally, beyond advancement of scientific knowledge per se, plots can also build capacity for local researchers to develop and share expertise, contribute data, and publish results. The successful development of a big bird plot network, or extension of collaborations with the existing ForestGEO plots, should involve collaborations with local experts as foundational aspects of the work.
Plots can play a major role in developing methodologies for larger scale efforts to facilitate long-term monitoring of community dynamics as well as quantifying community structure and how it varies according to relative influences of biotic and abiotic processes (Kraft et al., 2008; Gómez et al., 2020). Knowledge of long-term population trends is essential for effective evaluation of potential regional and global changes on bird populations. Large-scale plots can facilitate field-intensive techniques such as spot-mapping or radio telemetry to determine territory sizes and the number of territories for a subsample of species representing a broad range of traits (e.g., body size). By establishing known density estimates for a number of species, these plots can then be used to calibrate abundance estimates derived from point counts, which can be more easily replicated consistently across larger temporal and spatial scales, also then providing opportunities to precisely repeat surveys and monitor temporal changes. Historically, point counts have been limited by difficulties detecting and estimating abundances of social species and rare species, in particular (Robinson et al., 2018). The differences in estimates between spot-mapping and point counts can be used to calibrate the detection probabilities used in statistical models. Furthermore, with the development of N-mixture models which take into account both probabilities of detection and abundance (Gómez et al., 2018), assumptions can be built into the models which will allow for the estimation of densities of rarely detected species. If a goal is reliable estimation of population densities for all or nearly all species occurring on plots, then utilizing combinations of methods, and those currently under development, will improve quantity and quality of data available for analyses.
For most questions addressing patterns of community structure or species diversity, plots must be sufficiently large to include most of the species locally present. Many forest species have large home ranges, patchy distributions, and are rare, being present in densities of less than five individuals per 100 ha. In addition, the intrinsic scale of many forms of disturbance, which will affect species composition on the local scale, such as treefall gaps, occurs at the spatial extent of 0.5–5 ha. Thus, plots of 100 ha or more in size are likely to contain multiple individuals of most species and should be less likely to have patterns of species composition driven mostly by local disturbance dynamics. Therefore, large plots increase the chances to more fully characterize local communities while reducing chances that any especially local effects, such as smaller-scale past disturbances, strongly influence community structure. Even if 100 ha plots are too small to include sufficient numbers of most rare species for detection of statistically significant trends over time, alternative methods of community composition analysis can characterize patterns of rare species loss. Plot-based studies still face challenges of how to estimate numbers of the most mobile species, such as parrots and many raptors, colonial species that utilize plots but may breed elsewhere, and the most cryptic components of the avifauna that elude detection with traditional methods.
If tracking temporal trends in bird numbers is an objective, precise repeatability of sampling methods is important. Stationary, or point, counts provide a high degree of repeatability because the same locations can be monitored, even repeating surveys on the same date and time of day in future years (Robinson and Curtis, 2020). Large plots also provide, obviously, a larger number of points, again improving sample sizes and increasing statistical power to detect trends. Even as new analytical methods for estimating abundances or population densities are developed, the simple elegance of a design where qualified surveyors or automatic recording units are deployed at exactly the same locations through time creates opportunities to accurately measure temporal change, establishing the benchmarking value of large plots (Robinson and Curtis, 2020).
Another potential value of large observational plots is that they are less likely to be affected by unpredictable land use, especially if those plots attract other scientists to study various aspects of the site’s biology. Well-constructed plots (for example, with trail networks permitting easier access) allow for coordinated research with scientists addressing a broader array of ecological questions. Such plots also may serve as a focal point for building social capital by engaging local inhabitants in plot construction, maintenance, and data collection, as well as building scientific literacy. Ideally, plots could and should be established by in-country residents who know the landscapes and their avifauna the best. The involvement of regional scientists as project leaders can contribute to advancing equity in ecological sciences and open more efficient avenues for educating local residents of the value of characterizing dynamics of native biodiversity (Seidler et al., 2021). At the same time, establishment of trail networks near human settlements may have the detrimental effect of elevating harvest for food, particularly cracids and other game species, and for the pet trade (Peres and Lake, 2003; Peres et al., 2006; Ferreguetti et al., 2018). Such consequences might be evaluated by establishing plots so that some are in undisturbed sites isolated from easy human access whereas others are less isolated. This approach might also permit detection of global-change-driven temporal changes versus changes influenced mostly by local landscape effects (e.g., hunting, introduced species).
The academic culture of ecological science normally values testing of period-specific hypotheses and publications in peer-reviewed journals. Although we have clearly argued that a network of big bird plots can align with such values, we also note that establishment of such plots with a goal of tracking changes in bird populations over long time periods can be perceived by some as having lower value. Yet, a tension certainly exists between testing modern ecological ideas, addressing pressing conservation issues in landscapes with the world’s most diverse bird communities, and the continuing challenge of filling information needs concerning basic natural history of species, proper taxonomic identification and the iterative development and improvement of reliable sampling methods. We consider that the effect of certain academic philosophies is well-illustrated by the demise of the former, very extensive, North American network of bird spot-mapping plots (e.g., Short, 1979). After several decades of surveys in the 1900s with results being published in ornithological journals, the effort was deemed too unimportant and unproductive to take up valuable journal space. The disappearance of journal support eroded the volunteer base and the network died.
Despite the current academic cultural emphasis on ecological publications in high-impact journals as the yardstick by which “success” and “importance” are measured, some new methods for publishing and archiving big plot data have arisen. For example, electronic archiving of metadata so that they remain available through open access is becoming increasingly common. The opportunities for publishing “data papers” where extensive community inventory observations may be made available also continue to increase. Such opportunities may promote the proliferation of further academic specialization where people skilled at identifying and counting birds but uninterested or unable to publish hypothesis-focused papers can share information publicly and concomitantly receive credit for their expertise. Emphasizing the benchmark value of bird population and community studies, additional progress toward recognizing the value of Transgenerational Collaborations, where current community members establish a well-designed survey so that it can be precisely repeated in the future, needs to be made. The insights provided by several famous studies and their recent re-surveys such as the Grinnell project (Tingley et al., 2009) and Forbes’s early 19th century of Illinois birds (Walk et al., 2010) demonstrate the value of well-executed benchmark studies. Expanding opportunities to develop such benchmark datasets outside the traditional academic realm offers to increase inclusivity and build social capital, particularly in human communities with less opportunities for advanced academic training.
Without long-term, high-quality data, we have no reliable way to identify mechanisms of population or community change through time and across geography in the world’s richest bird communities. Recent declines of some insectivorous species have occurred in bird communities of mature forests with no evidence of direct impacts from anthropogenic activities (Blake and Loiselle, 2015; Stouffer et al., 2021). Presumably, declines in insectivores, particularly terrestrial species, may have some link to subtle shifts in regional precipitation or climatic conditions, but the mechanisms cannot be reliably identified yet and cannot even be separated from simple stochastic processes that play out over long periods of time. Even basic information on tracking relevant insect populations is generally lacking (Lamarre et al., 2020; Montgomery et al., 2021). In short, the paucity of basic data on bird populations from the world’s richest locations is a glaring deficiency in our abilities to understand drivers of change, community structuring mechanisms and the importance of birds as interactants on their ecological stage.
We recommend two major steps in using tropical big bird plots to enhance knowledge of tropical avian ecology. First, assemble metadata and data from existing plots and make them publicly accessible to facilitate future re-surveys. Many options for storage of metadata now exist. The ForestPlots.Net group database could provide a useful model (ForestPlots.net et al., 2021) if big bird plot data were to be managed as a stand-alone resource. Addition of a Neotropical node in Avian Knowledge Network would be appropriate (Robinson and Curtis, 2020) and has the advantage that the diversity of methods used to survey birds are already included. With current efforts to resurvey some plots, now is an appropriate time to establish data archival sites. The Cocha Cashu plot has recently been resurveyed and a planned re-survey of the Limbo plot was postponed by the coronavirus pandemic. Existing plots have the immediate advantage of the initial surveys to facilitate analysis of temporal change. During re-surveys, adopting new methodologies, such as deployment of automated recording units, and utilizing methods that improve precise repeatability of surveys (stationary counts) and help adjust for detectability issues when estimating density are important. Additionally, quantifying other aspects of plot characteristics, such as environmental conditions at the time of surveys, habitat patchiness owing to treefall gaps and other disturbances, and even insect sampling would provide opportunities to link changes in bird numbers or richness with potential mechanisms influencing change. Training local technicians to contribute can add temporal continuity and social value to re-survey efforts.
Second, we recommend expanding the size of the network of plots. This could be done by linking with the ForestGEO network, through development of collaborative agreements to add bird surveys where such data would be logistically feasible and mutually beneficial and building on that network’s standing support infrastructure to provide opportunities to link with existing data on plant communities. Most ForestGEO plots are smaller than 100 ha, so expansion by adding bird surveys around those plots in buffers would be necessary (Robinson and Curtis, 2020). Alternatively, ForestGEO could be invited to expand their network to incorporate portions of big bird plots. Addition of plots in other locations should also be relatively straightforward if the main goal is to benchmark current bird populations in a manner that uses highly repeatable survey methods (Robinson and Curtis, 2020). In that case, labor-intensive methods such as mist-netting, which sample portions of tropical communities that may be difficult to accurately measure with auditory surveys, are potentially de-emphasized in favor of efficient and more precisely repeatable sampling methods. If exhaustive surveys of communities are desired, then multiple methods extending beyond the grids of stationary counts and collections of transects advocated by Robinson and Curtis (2020) will need to be employed as we discussed earlier.
Estimated costs of surveying big plots for birds are important to consider. Decisions about intensiveness of survey effort, whether or not plots are already existing or will be established at new locations, plot size and costs of labor and travel will influence estimated costs per plot. The existing big plots were largely established and surveyed by foreign scientists, elevating travel and labor costs above potential costs if local talent were available. A probable key to long-term success of a big bird plot network would be to enhance local human capacity to establish and monitor plots. Despite potential large variability in costs, it is probably worth suggesting that surveying Neotropical bird plots may not cost much relative to the estimated costs of surveying tree plots. For example, the ForestPlots.Net assemblage of 1105 small plots (normally averaging about 1 ha in size) costs about 27,000 USD to install a plot (ForestPlots.net et al., 2021). Those costs are high because each individual tree is mapped and identified. Subsequent resurveys of plots have been estimated to cost less, about 18,000 USD or around 30 USD per tree. Because we argue large plots, approximately 100 ha in size, are necessary for adequate surveys of forest bird communities, costs could be prohibitively high per plot if costs of surveying birds were as high as they are for trees. However, the spatial precision with which birds can be mapped, given their mobility, is much lower, the total number of birds per plot is much smaller than that of trees, and the taxonomy is much better known so identifications are not as time-consuming. If the advice of Robinson and Curtis (2020) is heeded to create a simple benchmark survey designed to measure species richness accurately and estimate abundances of most species in a community, they estimated the effort could be accomplished in 4 weeks. Assuming two skilled surveyors are involved, as they recommended, and the plot has already been established, such as with a large ForestGEO plot, the costs for surveying a single plot in one year could be approximately 4,800 USD (320 h times 15 USD/h) notwithstanding consideration of travel and lodging costs. If new plots were established, we estimate at least 4 weeks to create the basic trail system with measured stops along transect routes, which could double initial costs. The costs assume surveyors are already sufficiently experienced to reliably detect, identify and count birds. Building capacity of local surveyors is also an important cost and contribution (Magnusson et al., 2013). Teaching bird surveying skills to local scientists would add to the time and funds required in the short-term but would save costs in the long-term and also contribute to the development of human capacity for ecological research. We consider our estimate to be at the low end of a potentially large range in costs influenced by local labor costs, terrain, lodging, and many other considerations including annual plot maintenance and data management.
How many plots should be added and where should they be located? This remains an open question that might be addressed with modeling experiments or considerations of specific scientific goals. If questions comparing broad patterns in community organization require less detailed data from each plot, then larger numbers of smaller plots sampled less intensively may be suitable (Rosa et al., 2021). On the other hand, highly detailed data from fewer big plots might be needed to assess geographic variation in patterns of community structure, species rank-abundance profiles, and beta diversity, and determine if those patterns are parallel in trees and birds, or at least correlated. Data from the ForestGEO plots might be used to predict the quantity and distribution of big bird plots that could sufficiently characterize Neotropical forest bird communities. From our simple comparisons of community structure among the existing forest bird plots, it is clear that Limbo, Panama, stands out as being quite different. Adding plots in Central America should, therefore, be a priority to better understand differences between Central and South American bird communities. At this point in history, any plot at any location would be a welcome addition and would promise to expand perspective on geographic variation in community structure.
We also recommend a few specific priorities for addition of new plots. Add plots in a wider diversity of “undisturbed” forest types and across elevational gradients. Add plots in sites recovering from disturbance to provide opportunities to characterize long-term successional effects on bird communities. Locate plots in threatened habitats that may be most likely to change in the near future, either within the plots themselves or in the surrounding landscapes, to provide before-after perspectives on local and landscape-level influences on communities, such as the role of mass effects on plot-level diversity (Condit et al., 2012). Use as many methods as possible to characterize entire communities as not all guilds or functional groups are equally responsive to each potential driver of change. Beyond enumeration of richness and density, inclusion of new approaches to sample diets and genetic and genomic diversity can help identify interactions of birds with other forms of biodiversity (Garcia and Robinson, 2021). Finally, as the sample size of well-surveyed plots is increased and data are associated with environmental aspects of each plot, the information may be connected with the growing effort to use satellites to track and predict global biomass and diversity, offering opportunities to model patterns across huge geographic extents (Quegan et al., 2019; Tang et al., 2019; Dubayah et al., 2020).
Of the practical aspects affecting creation of a network of big bird plots, establishment of detailed best practices for survey methodology is still necessary. The existing big plots were all surveyed with multiple methods, yet no specific coordination of common methods was attempted. Given the complexities of tropical bird communities, especially those in forests where many species are cryptic and/or range widely, further attention to survey methodology strengths and weaknesses is still required. It may be possible that cross-plot comparisons of densities or biomass may be reliable for only certain subsets of communities that can be surveyed with precisely repeatable methods. Yet, exhaustive surveys using multiple methods might still permit useful general comparisons of community organization like we have summarized here. Overall, more advances are needed to establish the most reliable set of survey methodologies for consistent and standardized data collection to benchmark such diverse species communities.
The original contributions presented in the study are included in the article/Supplementary Material, further inquiries can be directed to the corresponding author.
WR and HP conceived the study. DE, HP, and F-YS organized the database. HP and F-YS performed the statistical analysis. WR, DE, HP, AM, JB, and PS wrote sections of the manuscript. All authors contributed to manuscript revision, read, and approved the submitted version.
The authors declare that the research was conducted in the absence of any commercial or financial relationships that could be construed as a potential conflict of interest.
All claims expressed in this article are solely those of the authors and do not necessarily represent those of their affiliated organizations, or those of the publisher, the editors and the reviewers. Any product that may be evaluated in this article, or claim that may be made by its manufacturer, is not guaranteed or endorsed by the publisher.
We thank the many technicians and field biologists who helped gathering the data on each of the big bird plots, as well as the relevant authorities for permitting such surveys.
The Supplementary Material for this article can be found online at: https://www.frontiersin.org/articles/10.3389/fevo.2021.697511/full#supplementary-material
Supplementary Figure 1 | Number of species per taxonomic family across the six big Neotropical bird plots.
Supplementary Figure 2 | Distribution of species richness across body mass categories at four of the big Neotropical bird plots. Body mass data were unavailable from the two Tiputini plots.
Supplementary Table 1 | Additional characteristics of survey effort on the ∼100-ha plots and the landscape context in which each plot occurs.
Supplementary Table 2 | Data from the six big Neotropical bird plots.
Anderson, A. S., Marques, T. A., Shoo, L. P., and Williams, S. E. (2015). Detectability in audio-visual surveys of tropical rainforest birds: the influence of species, weather and habitat characteristics. PLoS One 10:e0128464. doi: 10.1371/journal.pone.0128464
Anderson-Teixeira, K. J., Davies, S. J., Bennett, A. C., Gonzalez-Akre, E. B., Muller-Landau, H. C., Wright, S. J., et al. (2015). CTFS-ForestGEO: a worldwide network monitoring forests in an era of global change. Glob. Change Biol. 21, 528–549. doi: 10.1111/gcb.12712
Ashton, P. S., Boscolo, M., Liu, J., and LaFrankie, J. V. (1999). A global programme in interdisciplinary forest research: the CTFS perspective. J. Trop. For. Sci. 11, 180–204.
Banks-Leite, C., Pardini, R., Boscolo, D., Cassano, C. R., Püttker, T., Barros, C. S., et al. (2014). Assessing the utility of statistical adjustments for imperfect detection in tropical conservation science. J. Appl. Ecol. 51, 849–859. doi: 10.1111/1365-2664.12272
Barlow, J., França, F., Gardner, T. A., Hicks, C. C., Lennox, G. D., Berenguer, E., et al. (2018). The future of hyperdiverse tropical ecosystems. Nature 559, 517–526. doi: 10.1038/s41586-018-0301-1
Bass, M. S., Finer, M., Jenkins, C. N., Kreft, H., Cisneros-Heredia, D. F., McCracken, S. F., et al. (2010). Global conservation significance of Ecuador’s Yasuní National Park. PLoS One 5:e8767. doi: 10.1371/journal.pone.0008767
Bickford, D., Lohman, D. J., Sodhi, N. S., Ng, P. K. L., Meier, R., Winker, K., et al. (2007). Cryptic species as a window on diversity and conservation. Trends Ecol. Evol. 22, 148–155. doi: 10.1016/j.tree.2006.11.004
Bierregaard, R. O., Gascon, C., Lovejoy, T. E., and Mesquita, R. (2001). Lessons from Amazonia: The Ecology and Conservation of a Fragmented Forest. New Haven, CT: Yale University Press.
Blake, J. G. (2007). Neotropical forest bird communities: a comparison of species richness and composition at local and regional scales. Condor 109, 237–255. doi: 10.1093/condor/109.2.237
Blake, J. G. (2021). Acoustic monitors and direct observations provide similar but distinct perspectives on bird assemblages in a lowland forest of eastern Ecuador. PeerJ 9:e10565. doi: 10.7717/peerj.10565
Blake, J. G., and Loiselle, B. A. (2008). Estimates of apparent survival rates for forest birds in eastern Ecuador. Biotropica 40, 485–493. doi: 10.1111/j.1744-7429.2007.00395.x
Blake, J. G., and Loiselle, B. A. (2009). Species composition of neotropical understory bird communities: local versus regional perspectives based on capture data. Biotropica 41, 85–94. doi: 10.1111/j.1744-7429.2008.00445.x
Blake, J. G., and Loiselle, B. A. (2013). Apparent survival rates of forest birds in eastern ecuador revisited: improvement in precision but no change in estimates. PLoS One 8:e81028. doi: 10.1371/journal.pone.0081028
Blake, J. G., and Loiselle, B. A. (2015). Enigmatic declines in bird numbers in lowland forest of eastern Ecuador may be a consequence of climate change. PeerJ 3:e1177. doi: 10.7717/peerj.1177
Blake, J. G., and Loiselle, B. A. (2016). Long-term changes in composition of bird communities at an “undisturbed” site in eastern Ecuador. Wilson J. Ornithol. 128, 255–267. doi: 10.1676/wils-128-02-255-267.1
Blake, J. G., Mosquera, D., Loiselle, B. A., Swing, K., and Romo, D. (2017). Long-term variation in abundance of terrestrial mammals and birds in eastern Ecuador as measured by photographic rates and occupancy estimates. J. Mammal. 98, 1168–1178. doi: 10.1093/jmammal/gyx046
Blendinger, P. G., Blake, J. G., and Loiselle, B. A. (2011). Composition and clumping of seeds deposited by frugivorous birds varies between forest microsites. Oikos 120, 463–471. doi: 10.1111/j.1600-0706.2010.18963.x
Blendinger, P. G., Loiselle, B. A., and Blake, J. G. (2008). Crop size, plant aggregation, and microhabitat type affect fruit removal by birds from individual melastome plants in the Upper Amazon. Oecologia 158, 273–283. doi: 10.1007/s00442-008-1146-3
Boyle, W. A., and Sigel, B. J. (2015). Ongoing changes in the avifauna of La Selva Biological Station, Costa Rica: twenty-three years of Christmas Bird counts. Biol. Conserv. 188, 11–21. doi: 10.1016/j.biocon.2015.01.004
Celis-Murillo, A., Deppe, J. T., and Ward, M. P. (2012). Effectiveness and utility of acoustic recordings for surveying tropical birds. J. Field Ornithol. 83, 166–179.
Comita, L. S., Muller-Landau, H. C., Aguilar, S., and Hubbell, S. P. (2010). Asymmetric density dependence shapes species abundances in a tropical tree community. Science 329, 330–332. doi: 10.1126/science.1190772
Condit, R., Chisholm, R. A., and Hubbell, S. P. (2012). Thirty years of forest census at barro colorado and the importance of immigration in maintaining diversity. PLoS One 7:e49826. doi: 10.1371/journal.pone.0049826
Davies, S. J., Abiem, I., Abu Salim, K., Aguilar, S., Allen, D., Alonso, A., et al. (2021). ForestGEO: Understanding forest diversity and dynamics through a global observatory network. Biol. Conserv. 253:108907. doi: 10.1016/j.biocon.2020.108907
Develey, P. F., and Stouffer, P. C. (2001). Effects of roads on movements by understory birds in mixed-species flocks in central Amazonian Brazil. Conserv. Biol. 15, 1416–1422. doi: 10.1111/j.1523-1739.2001.00170.x
Dubayah, R., Blair, J. B., Goetz, S., Fatoyinbo, L., Hansen, M., Healey, S., et al. (2020). The Global Ecosystem Dynamics Investigation: high-resolution laser ranging of the Earth’s forests and topography. Sci. Remote Sens. 1:100002. doi: 10.1016/j.srs.2020.100002
Ferreguetti, ÁC., Pereira-Ribeiro, J., Prevedello, J. A., Tomás, W. M., Rocha, C. F. D., and Bergallo, H. G. (2018). One step ahead to predict potential poaching hotspots: modeling occupancy and detectability of poachers in a Neotropical rainforest. Biol. Conserv. 227, 133–140. doi: 10.1016/j.biocon.2018.09.009
ForestPlots.net Blundo, C., Carilla, J., Grau, R., Malizia, A., Malizia, L., et al. (2021). Taking the pulse of Earth’s tropical forests using networks of highly distributed plots. Biol. Conserv. 260:108849. doi: 10.1016/j.biocon.2020.108849
Garcia, N. C., and Robinson, W. D. (2021). Current and forthcoming approaches for benchmarking genetic and genomic diversity. Front. Ecol. Evol. 9:622603. doi: 10.3389/fevo.2021.622603
Giam, X. (2017). Global biodiversity loss from tropical deforestation. Proc. Natl. Acad. Sci. U.S.A. 114, 5775–5777. doi: 10.1073/pnas.1706264114
Gómez, J. P., Ponciano, J. M., Londoño, G. A., and Robinson, S. K. (2020). The biotic interactions hypothesis partially explains bird species turnover along a lowland Neotropical precipitation gradient. Glob. Ecol. Biogeogr. 29, 491–502. doi: 10.1111/geb.13047
Gómez, J. P., Robinson, S. K., Blackburn, J. K., and Ponciano, J. M. (2018). An efficient extension of N-mixture models for multi-species abundance estimation. Methods Ecol. Evol. 9, 340–353. doi: 10.1111/2041-210X.12856
Harvey, M. G., Bravo, G. A., Claramunt, S., Cuervo, A. M., Derryberry, G. E., Battilana, J., et al. (2020). The evolution of a tropical biodiversity hotspot. Science 370, 1343–1348. doi: 10.1126/science.aaz6970
Hubbell, S. P. (2001). The Unified Neutral Theory of Biodiversity and Biogeography (MPB-32). Princeton, NJ: Princeton University Press.
Johnson, E. I., and Wolfe, J. D. (2017). Molt in Neotropical Birds: Life History and Aging Criteria. Boca Raton, FL: CRC Press.
Johnson, E. I., Stouffer, P. C., and Vargas, C. F. (2011). Diversity, biomass, and trophic structure of a central Amazonia rainforest bird community. Rev. Bras. Ornitol. 17, 1–16.
Johnston, D. W. (1990). “Description of surveys: breeding bird censuses,” in Survey Design And Statistical Methods For The Estimation of Avian Population Trends Fish and Wildlife Service Biological Report, eds J. R. Sauer and S. Droege (Washington, D.C: U.S. Fish And Wildlife Service), 33–36.
Karr, J. R. (1971). Structure of avian communiites in selected Panama and Illinois habitats. Ecol. Monogr. 41, 207–233.
Kim, D.-H., Sexton, J. O., and Townshend, J. R. (2015). Accelerated deforestation in the humid tropics from the 1990s to the 2000s. Geophys. Res. Lett. 42, 3495–3501. doi: 10.1002/2014GL062777
Kraft, N. J. B., Valencia, R., and Ackerly, D. D. (2008). Functional traits and niche-based tree community assembly in an amazonian forest. Science 322, 580–582. doi: 10.1126/science.1160662
LaManna, J. A., Mangan, S. A., Alonso, A., Bourg, N. A., Brockelman, W. Y., Bunyavejchewin, S., et al. (2017). Plant diversity increases with the strength of negative density dependence at the global scale. Science 356, 1389–1392. doi: 10.1126/science.aam5678
Lamarre, G. P. A., Fayle, T. M., Segar, S. T., Laird-Hopkins, B. C., Nakamura, A., Souto-Vilarós, D., et al. (2020). “Chapter eight – monitoring tropical insects in the 21st century,” in Advances in Ecological Research Tropical Ecosystems in the 21st Century, eds A. J. Dumbrell, E. C. Turner, and T. M. Fayle (Cambridge, MA: Academic Press), 295–330. doi: 10.1016/bs.aecr.2020.01.004
Loiselle, B. A., Blake, J. G., Durães, R., Ryder, T. B., and Tori, W. (2007). Environmental and spatial segregation of leks among six co-occurring species of manakins (pipridae) in eastern Ecuador. Auk 124, 420–431.
Losos, E. C., and Leigh, E. G. (2004). Forest Diversity and Dynamism: Findings From a Network of Large-Scale Tropical Forest Plots. Chicago, IL: University of Chicago Press.
Magnusson, W., Braga-Neto, R., Pezzini, F., Baccaro, F., Bergallo, H., Penha, J., et al. (2013). Biodiversidade e Monitoramento Ambiental Integrado. First. Manaus: Attema Editorial.
Magurran, A. E., Baillie, S. R., Buckland, S. T., Dick, J. M., Elston, D. A., Scott, E. M., et al. (2010). Long-term datasets in biodiversity research and monitoring: assessing change in ecological communities through time. Trends Ecol. Evol. 25, 574–582. doi: 10.1016/j.tree.2010.06.016
McNellie, M. J., Oliver, I., Dorrough, J., Ferrier, S., Newell, G., and Gibbons, P. (2020). Reference state and benchmark concepts for better biodiversity conservation in contemporary ecosystems. Glob. Change Biol. 26, 6702–6714. doi: 10.1111/gcb.15383
Montgomery, G. A., Belitz, M. W., Guralnick, R. P., and Tingley, M. W. (2021). Standards and best practices for monitoring and benchmarking insects. Front. Ecol. Evol. 8:513. doi: 10.3389/fevo.2020.579193
Naka, L. N., Stouffer, P. C., Cohn-Haft, M., Marantz, C., Whittaker, A., and Bierregaard, R. O. Jr. (2008). Vozes Da Amazônia Brasileira, Vol. 1. Aves Das Florestas De Terra Firme Ao Norte De Manaus: Área De Endemismo Das Guianas/Voices of The Brazilian Amazon, Vol. 1. Birds of The Terra Firme Forests North of Manaus: Guianan Area of Endemism. Manaus: Editora INPA.
Peres, C. A., and Lake, I. R. (2003). Extent of nontimber resource extraction in tropical forests: accessibility to game vertebrates by hunters in the amazon basin. Conserv. Biol. 17, 521–535. doi: 10.1046/j.1523-1739.2003.01413.x
Peres, C. A., Barlow, J., and Laurance, W. F. (2006). Detecting anthropogenic disturbance in tropical forests. Trends Ecol. Evol. 21, 227–229. doi: 10.1016/j.tree.2006.03.007
Quegan, S., Le Toan, T., Chave, J., Dall, J., Exbrayat, J.-F., Minh, D. H. T., et al. (2019). The European space agency BIOMASS mission: measuring forest above-ground biomass from space. Remote Sens. Environ. 227, 44–60. doi: 10.1016/j.rse.2019.03.032
Robinson, S. K. (1986). Three -speed foraging during the breeding cycle of yellow-rumped caciques (Icterinae: Cacicus Cela). Ecology 67, 394–405. doi: 10.2307/1938582
Robinson, W. D., Brawn, J. D., and Robinson, S. K. (2000b). Forest bird community structure in central Panama: influence of spatial scale and biogeography. Ecol. Monogr. 70, 209–235.
Robinson, T. R., Robinson, W. D., and Edwards, E. C. (2000a). Breeding ecology and nest-site selection of Song Wrens in central Panama. Auk 117, 345–354.
Robinson, W. D., Robinson, T. R., Robinson, S. K., and Brawn, J. D. (2000c). Nesting success of understory forest birds in central Panama. J. Avian Biol. 31, 151–164.
Robinson, W. D., and Curtis, J. R. (2020). Creating benchmark measurements of tropical forest bird communities in large plots. Condor 122:duaa015. doi: 10.1093/condor/duaa015
Robinson, W. D., Angehr, G. R., Robinson, T. R., Petit, L. J., Petit, D. R., and Brawn, J. D. (2004). Distribution of bird diversity in a vulnerable Neotropical landscape. Conserv. Biol. 18, 510–518. doi: 10.1111/j.1523-1739.2004.00355.x
Robinson, W. D., Lees, A. C., and Blake, J. G. (2018). Surveying tropical birds is much harder than you think: a primer of best practices. Biotropica 50, 846–849. doi: 10.1111/btp.12608
Rosa, C., Baccaro, F., Cronemberger, C., Hipólito, J., Barros, C. F., Rodrigues, D. D. J., et al. (2021). The program for biodiversity research in Brazil: the role of regional networks for biodiversity knowledge, dissemination, and conservation. An. Acad. Bras. Ciênc. 93:e20201604. doi: 10.1590/0001-3765202120201604
Rutt, C. L., Jirinec, V., Cohn-Haft, M., Laurance, W. F., and Stouffer, P. C. (2019). Avian ecological succession in the Amazon: a long-term case study following experimental deforestation. Ecol. Evol. 9, 13850–13861. doi: 10.1002/ece3.5822
Ryder, T. B., Parker, P. G., Blake, J. G., and Loiselle, B. A. (2009). It takes two to tango: reproductive skew and social correlates of male mating success in a lek-breeding bird. Proc. Biol. Sci. 276, 2377–2384. doi: 10.1098/rspb.2009.0208
Seidler, R., Primack, R. B., Goswami, V. R., Khaling, S., Devy, M. S., Corlett, R. T., et al. (2021). Confronting ethical challenges in long-term research programs in the tropics. Biol. Conserv. 255:108933. doi: 10.1016/j.biocon.2020.108933
Şekercioğlu, C. H. (2012). Bird functional diversity and ecosystem services in tropical forests, agroforests and agricultural areas. J. Ornithol. 153, 153–161. doi: 10.1007/s10336-012-0869-4
Short, J. J. (1979). Patterns of alpha-diversity and abundance in breeding bird communities across North America. Condor 81:21. doi: 10.2307/1367850
Stouffer, P. C. (2007). Density, territory size, and long-term spatial dynamics of a guild of terrestrial insectivorous birds near Manaus, Brazil. Auk 124, 291–306. doi: 10.1093/auk/124.1.291
Stouffer, P. C. (2020). Birds in fragmented Amazonian rainforest: lessons from 40 years at the Biological Dynamics of Forest Fragments Project. Condor 122:duaa005. doi: 10.1093/condor/duaa005
Stouffer, P. C., Jirinec, V., Rutt, C. L., Bierregaard, R. O., Hernández-Palma, A., and Johnson, E. I, et al. (2021). Long-term change in the avifauna of undisturbed Amazonian rainforest: ground-foraging birds disappear and the baseline shifts. Ecol. Lett. 24, 186–195. doi: 10.1111/ele.13628
Svensson-Coelho, M., Ellis, V. A., Loiselle, B. A., Blake, J. G., and Ricklefs, R. E. (2014). Reciprocal specialization in multihost malaria parasite communities of birds: a temperate-tropical comparison. Am. Nat. 184, 624–635. doi: 10.1086/678126
Tang, H., Armston, J., Hancock, S., Marselis, S., Goetz, S., and Dubayah, R. (2019). Characterizing global forest canopy cover distribution using spaceborne lidar. Remote Sens. Environ. 231:111262. doi: 10.1016/j.rse.2019.111262
Terborgh, J., Robinson, S. K., Parker, T. A., Munn, C. A., and Pierpont, N. (1990). Structure and organization of an Amazonian forest bird community. Ecol. Monogr. 60, 213–238. doi: 10.2307/1943045
Thiollay, J.-M. (1994). Structure, density and rarity in an Amazonian rainforest bird community. J. Trop. Ecol. 10, 449–481. doi: 10.1017/S0266467400008154
Tingley, M. W., Monahan, W. B., Beissinger, S. R., and Moritz, C. (2009). Birds track their Grinnellian niche through a century of climate change. Proc. Natl. Acad. Sci. U.S.A. 106, 19637–19643. doi: 10.1073/pnas.0901562106
van Eck, N. J., and Waltman, L. (2010). Software survey: VOSviewer, a computer program for bibliometric mapping. Scientometrics 84, 523–538. doi: 10.1007/s11192-009-0146-3
Walk, J. W., Ward, M. P., Benson, T. J., Deppe, J. L., Lischka, S. A., Bailey, S. D., et al. (2010). Illinois birds: a Century of Change. Illinois Natural History Survey. Available online at: https://experts.illinois.edu/en/publications/illinois-birds-a-century-of-change (accessed March 16, 2021).
Wills, C. (2006). Nonrandom processes maintain diversity in tropical forests. Science 311, 527–531. doi: 10.1126/science.1117715
Keywords: Neotropical forests, bird community structure, biogeography, foraging guild, species richness, bird survey methods
Citation: Robinson WD, Errichetti D, Pollock HS, Martinez A, Stouffer PC, Shen F-Y and Blake JG (2021) Big Bird Plots: Benchmarking Neotropical Bird Communities to Address Questions in Ecology and Conservation in an Era of Rapid Change. Front. Ecol. Evol. 9:697511. doi: 10.3389/fevo.2021.697511
Received: 19 April 2021; Accepted: 10 September 2021;
Published: 05 October 2021.
Edited by:
Umesh Srinivasan, Indian Institute of Science (IISc), IndiaReviewed by:
Andres Garcia, National Autonomous University of Mexico, MexicoCopyright © 2021 Robinson, Errichetti, Pollock, Martinez, Stouffer, Shen and Blake. This is an open-access article distributed under the terms of the Creative Commons Attribution License (CC BY). The use, distribution or reproduction in other forums is permitted, provided the original author(s) and the copyright owner(s) are credited and that the original publication in this journal is cited, in accordance with accepted academic practice. No use, distribution or reproduction is permitted which does not comply with these terms.
*Correspondence: W. Douglas Robinson, ZG91Z2xhcy5yb2JpbnNvbkBvcmVnb25zdGF0ZS5lZHU=
Disclaimer: All claims expressed in this article are solely those of the authors and do not necessarily represent those of their affiliated organizations, or those of the publisher, the editors and the reviewers. Any product that may be evaluated in this article or claim that may be made by its manufacturer is not guaranteed or endorsed by the publisher.
Research integrity at Frontiers
Learn more about the work of our research integrity team to safeguard the quality of each article we publish.