
95% of researchers rate our articles as excellent or good
Learn more about the work of our research integrity team to safeguard the quality of each article we publish.
Find out more
ORIGINAL RESEARCH article
Front. Ecol. Evol. , 29 September 2021
Sec. Biogeography and Macroecology
Volume 9 - 2021 | https://doi.org/10.3389/fevo.2021.685753
This article is part of the Research Topic Predicting and Managing Climate-Driven Range Shifts in Plants View all 12 articles
 Philipp Semenchuk1*
 Dietmar Moser1Franz Essl1
 Stefan Schindler2,3Johannes Wessely1Andreas Gattringer1Stefan Dullinger1
Climate driven species’ range shifts may interfere with existing protected area (PA) networks, resulting in a mismatch between places where species are currently protected and places where they can thrive in the future. Here, we assess the climate-smartness of the Austrian PA network by focusing on endemic species’ climatic niches and their future representation within PAs. We calculated endemic species’ climatic niches and climate space available in PAs within their dispersal reach under current and future climates, with the latter represented by three climate change scenarios and three time-steps (2030, 2050, and 2080). Niches were derived from the area of occupancy of species and the extent of PAs, respectively, and calculated as bivariate density kernels on gradients of mean annual temperature and annual precipitation. We then computed climatic representation of species’ niches in PAs as the proportion of the species’ kernel covered by the PA kernel. We found that under both a medium (RCP 4.5) and severe (RCP 8.5) climate change scenario, representation of endemic species’ climatic niches by PAs will decrease to a sixth for animals and to a third for plants, on average, toward the end of the century. Twenty to thirty percent of Austrian endemic species will then have no representation of their climatic niches in PAs anymore. Species with larger geographical and wider elevational ranges will lose less climatic niche representation. The declining representation of climatic niches in PAs implies that, even if PAs may secure the persistence of a part of these endemics, only a small portion of intraspecific diversity of many species may be represented in PAs in the future. We discuss our findings in the context of the varied elevational gradients found in Austria and suggest that the most promising strategies for safeguarding endemic species’ evolutionary potential are to limit the magnitude of climate change and to reduce other pressures that additionally threaten their survival.
Economic growth, increasing resource consumption, land use change, pollution, and over-harvesting have led to a biodiversity crisis (Díaz et al., 2019; Dasgupta, 2021) that may well develop into a sixth global mass extinction (Barnosky et al., 2011). Across Europe, natural landscapes have been transformed and almost all natural and semi-natural habitat types have been subject to loss, degradation or fragmentation during the last decades (Ellis et al., 2013; Watson et al., 2016). Area-based conservation measures are pivotal to prevent further loss of habitats and associated species (Watson et al., 2014). By and large, protected areas (PAs) have been successful in safeguarding biodiversity within their boundaries, with species richness being mostly higher within than outside PAs (Thomas and Gillingham, 2015). In the future, however, climate change and associated range shifts of species may interfere with the effectiveness of the existing PA networks, resulting in a mismatch between places where species are currently protected and places where they can thrive under future climatic conditions not encompassed by PAs (Lawler et al., 2015; Elsen et al., 2020).
Whether PA networks will support the protection of species under a changing climate will depend on their spatial configuration. For instance, large, continuous PAs may allow poleward range shifts and tracking of suitable climates during climate warming. Longer elevational gradients within PAs provide access to a higher variety of future climates, including analogues to current ones, within short distances (Elsen et al., 2018), and may also offer a variety of micro-refugia (Scheffers et al., 2014). PAs may also serve as stepping stones for species tracking their climatic niches, so that in larger and sufficiently connected PA networks losses of populations in one PA may be offset by establishment in others (Hole et al., 2011; Thomas and Gillingham, 2015).
Yet, the functioning of such relocation processes relies on range characteristics and the dispersal abilities of species, and may be futile for many endemics. Their defining feature—a narrow geographic range—often is a consequence of limited dispersal ability, be it for the particular traits of these species (Dullinger et al., 2012a) or because the habitats or climatic conditions they are adapted to are geographically isolated (Ohlemüller et al., 2008; Flantua et al., 2020). As a consequence, many endemic species may be too slow to track their climatic niches (Loarie et al., 2009) even within a continuously protected habitat irrespective of its size, or they may get further trapped in increasingly fragmented habitats (Dobrowski and Parks, 2016). Endemics may moreover be ecologically highly specialized and hence have particular problems to cross an impermeable matrix between PAs and use them as stepping stones during migration (Dullinger et al., 2015; Wessely et al., 2017). Hence, lack of sufficient, continuous and reachable climate space may render current PA networks ineffective for narrow-range species when the climate is changing (Araújo et al., 2011; Lawler et al., 2015; Batllori et al., 2017). This is particularly problematic as PA networks arguably have a special responsibility for those species which are endemic to their spatial domain.
Whether a PA network is “climate-smart” (Maxwell et al., 2020) has so far mostly been evaluated by comparing its extent to the projected geographic distribution of its target features (e.g., species or habitats under protection) under future climatic conditions (Hole et al., 2009; Araújo et al., 2011; Ayebare et al., 2018; Fuentes-Castillo et al., 2019). Unfortunately, occurrence data for endemic species are often sparse, and dispersal limitations interfere with ecological requirements in determining species’ geographic distributions (Early and Sax, 2014). As a consequence, geographic projections of suitable ranges are difficult to calculate for many endemics, especially for those restricted to very small areas (Scherrer et al., 2019).
Moreover, apart from the size of the climatically suitable area that remains protected, a potentially important additional criterion for assessing the climate smartness of PA networks is whether and to which extent they will cover the ecological niches of target species in the future. In fact, changes of the overlap between species and PAs in geographical and ecological space are not necessarily correlated. When geographical ranges of species shift from smaller, but climatically diverse PAs to larger, but climatically monotonous ones, the suitable area under protection might increase while the protected part of the climatic niche might decrease. In topographically diverse areas, correspondence between changes in geographical and climatic representation of species in PA networks are particularly hard to predict because they depend on the configuration or shape of the mountains which can vary considerably (Elsen and Tingley, 2015; García-Rodríguez et al., 2021).
Taking changes of climatic niche representation within PAs into consideration is important because the species’ climatic niches are abstractions resulting from aggregations of ecotypes with diverging specializations (Clark et al., 2011). For instance, the climatic niche of a single species may entail a suite of ecotypes with somewhat different niches, which may lose protection if this part of the niche is no longer represented in PAs. Focusing on the overarching species niches and their representation in geographic space may thus result in massive underestimation of hidden, intraspecific biodiversity loss (Bálint et al., 2011) even at phylogenetic and functional levels (Hidasi-Neto et al., 2019; Prieto-Torres et al., 2021). As evolutionary lineages within species may partition niche space while sharing geographic space, predictions of change in available niche space are likely more indicative of threats to intraspecific diversity than predictions of change in available geographic area. In addition, a broader niche space will, by trend, be associated with larger genetic diversity and hence a higher potential of species to adapt to a changing climate (Cotto et al., 2017). For these reasons, we argue that assessing climate-smartness of PA-networks should pay more attention to the target species’ climatic niche space (Hanson et al., 2020) and its future representation within PAs.
On a global scale, the representation of vertebrates’ climatic niches in PAs under current climate has recently been shown to be insufficient (Hanson et al., 2020). Here, we demonstrate how such an assessment can be conducted on a regional scale for range-restricted endemic plants and invertebrates, and how the evaluation of climatic representation under current climate can be projected onto future climates. As a case study, we use the national PA network of Austria and the endemic species it harbors. Due to its biogeographical location, topography and glacial history, the Austrian flora and fauna is relatively rich in endemic species (Rabitsch and Essl, 2009). In our analysis, we focus on 530 endemic plant and invertebrate species and ask how the representation of their climatic niches within PAs would change over the 21st century under three different climate change scenarios. We understand the study as an evaluation of the Austrian PA network’s climate smartness, a basic challenge for area-based conservation in the 21st century (Maxwell et al., 2020). We expect that this smartness will decrease with the magnitude of climate change, i.e., that PAs will represent species’ niches less in the future, the more pronouncedly the climate changes. We have no specific assumptions on whether endemic plants and invertebrates differ in their respective sensitivity. We expect, however, that across taxonomic groups the future mismatch of the (current) PA network and the niches of species will be more pronounced, in the case study region and perhaps generally, for species with smaller ranges and narrower niches because their chance to find analogue climates in geographically proximate PAs should be lower, on average.
We extracted range maps of 530 Austrian endemic species (including sub-endemics, i.e., species with >75% of their known distribution in Austria) of vascular plants and a number of invertebrate taxa (insects, crustaceans, mites, spiders, springtails, millipedes, and snails), hereafter divided into plants and animals, respectively, from Rabitsch and Essl (2009). The maps represent the species’ extents of occurrence in 3 × 5 arcmin grid cells (c. 35 km2) across the country’s domain. As many of the species are cryptic and likely understudied, the published range maps may underestimate the actual distribution. To compensate for that, we assumed that each species occurs not only in the mapped grid cells, but also in a one-cell buffer around them. We refer to the mapped cells plus the buffer as species’ range in the following (cf. Figure 1).
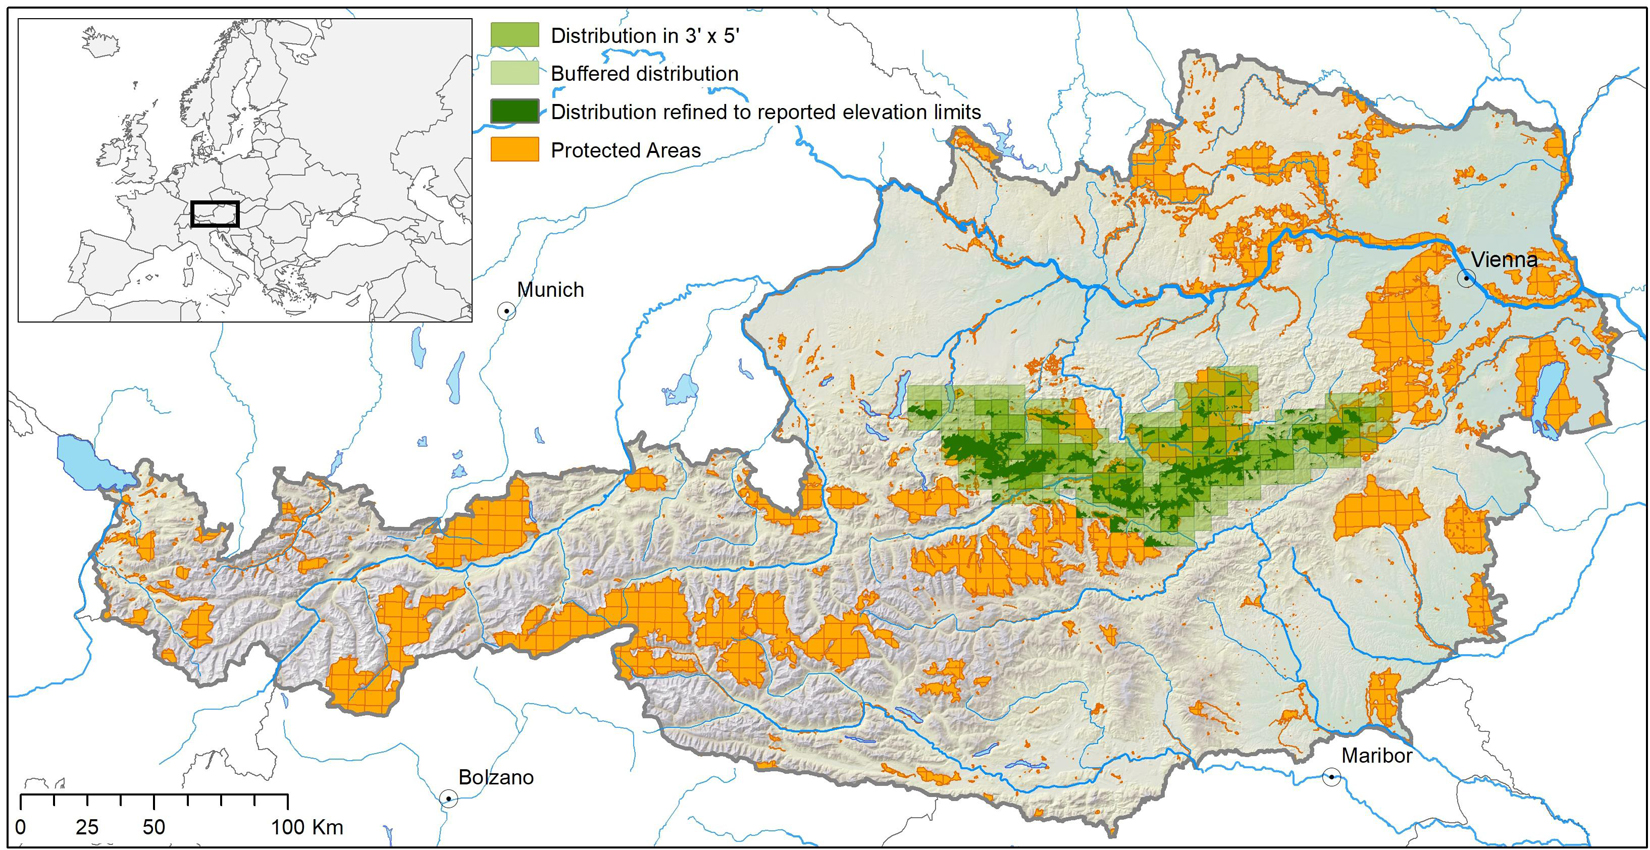
Figure 1. Derivation of species distribution from 3′ × 5′ raster maps and information on elevational range limits illustrated for the vascular plant species Achillea clusiana. The light green area describes the range extent at the 3′ × 5′ raster-scale, and the dark-green area the assumed occupancy within this extent at the 1 ha scale. For more details see text. Country borders are adaped from GADM (https://gadm.org/); rivers are adaped from OSM (www.openstreetmap.org).
Point occurrence data for most of these species are rare or lacking completely and parameterizing species distribution models (at finer scales) is hence barely possible. However, apart from the range maps, Rabitsch and Essl (2009) deliver information about each species’ upper and lower elevational range margins. We used this information to further constrain each species’ range. We therefore overlaid the species ranges by a 100 m × 100 m (= 1 ha) digital elevation model (EU-DEM1) and assumed the species’ occupancy in all cells within their reported elevational range (Figure 1). Species with published elevational ranges narrower than 100 m (i.e., the difference between lower and upper elevation limits) were excluded, as we assumed these species to be studied incompletely.
On the part of the PAs, we used the IUCN protected areas categories Ia (Strict Nature Reserve), Ib (Wilderness Area), II (National Park), III (Natural Monument or Feature), and IV (Habitat/Species Management Area) available from the IUCN (UNEP-WCMC and IUCN, 2021), and the Austrian Natura 2000 network (DG ENV2). We then overlaid the PA network with each species’ range and defined, for each species, the PAs within its range as being within reach given the species’ assumed dispersal capacities and hence relevant for the respective species until the end of the century (cf. Figure 1). In other words, we assumed that each species can reach all suitable future climatic space within the 3 × 5 arcmin cells it currently occupies plus the one-cell buffer, but is not able to migrate beyond this range.
For calculating climatic niches of the species and climatic spaces of their associated PAs, we overlaid the species’ range and PA maps (at 1 ha scale, see above) with climatic raster maps of current and future climates (as calculated by climate change scenarios). Predictions of monthly time series of mean temperature and precipitation sums for the 21st century were extracted from the Cordex data portal.3 The CORDEX experiment provides regional climate change simulations for Europe using various regional climate models at a resolution of 0.11°. In this study, we used predictions calculated by Météo-France/Centre National de Recherches Météorologiques using the CNRM-ALADIN53 regional climate model, fed by output from the global circulation model CNRM-CM5 (Tramblay et al., 2013). We selected projections based on CNRM-ALADIN53 because they predict “mean” temperature and precipitation trends for the study area, i.e., neither particularly strong nor particularly weak changes. We included predictions for three IPCC scenarios from the Representative Concentration Pathways-family representing mild (RCP 2.6), medium (RCP 4.5), and severe (RCP 8.5) climate change to consider the uncertainty in climate predictions. The RCP 2.6 scenario assumes that radiative forcing reaches nearly 3 W m–2 (ca. 490 ppm CO2 equivalent) mid-century and will decrease to 2.6 W m–2 by 2080. Average temperature rise thereby is predicted to increase by 1.46°C in the study area compared to the year 2000. The RCP 4.5 scenario assumes an increase of 4.5 W m–2 (ca. 650 ppm CO2 equivalent) until 2100. Temperature is predicted to increase by ca. 2.3°C in the study area. The RCP 8.5 scenario assumes radiative forcing to continuously rise throughout the 21st century and reaches >8.5 W m–2 (ca. 1370 ppm CO2 equivalent) at the end of the century (Moss et al., 2010) which translate to an increase of temperature by 3.7°C.
We statistically downscaled the 0.11° resolution time series to match the resolution of the 1 ha species distribution maps. Downscaling was done using the delta method by (a) calculating differences (“deltas”) between future values and hindcasted values (i.e., current climatic conditions; mean 1970–2005) at the original spatial resolution of 0.11°; (b) spatially interpolating these differences to a resolution of 1 ha using cubic splines; and (c) adding them to fine scaled maps of current climate (Karger et al., 2017) separately for each climatic variable (for more details on the delta method see e.g., Zimmermann et al., 2009; Dullinger et al., 2012a). From the resulting annual time series of monthly temperature and precipitation from 2011 to 2100 we calculated average values of mean annual temperature (Tmean) and annual precipitation (Prec) in 20-year intervals centered on 2020, 2030, 2050, and 2080 for every RCP scenario. We acknowledge that mean annual temperature and annual precipitation sums are coarse descriptors of climatic niches and may not adequately describe the more specific climatic requirements of many individual species (Körner and Hiltbrunner, 2018). However, as more detailed information on each of the 530 species’ climatic needs is missing, and these variables are often closely correlated with other climatic descriptors at regional scales, we consider our variable selection a reasonable simplification.
Since climate projections are modeled data each with characteristic boundary conditions they deviate slightly from climate data produced by interpolation of climate station data (like e.g., Worldclim, Fick and Hijmans, 2017) even in overlapping regions. In order to ensure that current (2020) and future (2030, 2050, and 2080) climate data represent a consistent time series, we used long term means/hindcasts calculated from the climate projections to describe the current climate.
Our aim was to quantify the proportion of each species’ climatic niche that overlaps with the climatic conditions offered by the PAs situated within its range under current and future climates. For each species and associated PA, we therefore constructed climatic niches and climatic space offered by the PA, respectively, following the approach of Broennimann et al. (2012) via the function ecospat.grid.clim.dyn of the ecospat package in R (Di Cola et al., 2016; R Core Team, 2017). This method creates bivariate density kernels from the above described mapped climatic data (Tmean, Prec), i.e., from the grid cells occupied by a species, or covered by a PA, standardized by the density of the same climatic variables in a background area. The bivariate kernels are thus three-dimensional histograms which describe the empirical density of combinations of two variables [instead of the density of one variable in a conventional histogram, see Broennimann et al. (2012) for details] and represent the species’ climatic niche and the PAs’ climatic space in the two dimensions considered (mean annual temperature and annual precipitation). For our calculations we defined the species range (mapped 3 × 5 arcmin cells + buffer) as the background area. We used the current climatic conditions (2020) as the climate of this background area in all calculations because comparing volumes of bivariate kernels as defined here (see below) requires a common extent of the climatic data, i.e., a common value range or interval over which the kernels are calculated.
We derived the species’ climatic niches from the overlay of their current occupancy (at the 1 ha scale) and the current climatic maps (2020). For calculating the species’ niches’ representations in PAs under future climates, we only considered those parts of their niches which will still be available in the future within their ranges (3 × 5 arcmin scale). To do so, we truncated their niches by excluding the combinations of Tmean and Prec no longer realized within a species’ range in the future from the bivariate kernels. Because this potentially shrinks species’ niches in the future, and one and the same PA may represent a larger proportion of a species’ niche when the species’ total niche is smaller, the calculation of the change in niche representation in PAs is potentially conservative. However, as unavailable climatic space can neither be part of a species’ realized niche nor protected by PAs, we nevertheless consider this a sensible approach. We moreover emphasize that this approach assumes that the species are able to colonize their future climatic niche in geographical space completely, corresponding to a “full dispersal” scenario, which is, however, constrained to their current range extent (Figure 1).
On the part of the PAs, we calculated their currently available climate space similarly as for the species, i.e., from the overlay of their geographic extent and the current climatic maps. For future scenarios, however, we assumed that PA locations will remain unchanged. With respect to PAs our approach hence corresponds to a “no dispersal” scenario. For calculating the future climatic space offered by the PA network within a species range we hence overlaid its current extent with the maps of the future climate and re-calculated the bivariate kernels. We then excluded non-analogue climates from the calculation of the PA climate space in the future, i.e., those cells within its extent that would have a climate in the future which is not realized within the species’ range (mapped 3 × 5 arcmin cells + buffer) currently. As long as we assume that the species’ ecological niche will stay the same and not evolve, this truncation of the future PA climate space does not affect, but technically facilitates the computation of the species niche’s representation in the PA (see below).
To determine each species’ climatic niche’s representation within its associated PA’s climate space, we calculated the proportion of its bivariate density grid covered by the PA’s density grid. We therefore overlaid the density grids of associated species and PAs, set the densities in the PA-grid to zero where the density in the species’ grid was zero, calculated the volume of this reduced PA climatic space as the sum of the remaining non-zero values, and divided this sum by the volume of the species niche. A value of 1 hence indicates full representation of the species’ niche, and a value of 0 means that no part of the species’ niche is represented by its associated PAs. The calculation was done separately for each combination of time steps and climate scenarios. These calculations were done in R (R Core Team, 2017), and scripts to repeat the analysis may be requested by the corresponding author.
To summarize the temporal trend of the representation of climatic niches in PAs across time steps and scenarios and over all species, we applied a generalized linear mixed effect model with climatic niche representation as response and species as random factor via the package glmmTMB in R (Brooks et al., 2017; R Core Team, 2017). We assumed the response to follow a beta distribution and hence applied the beta-family in the generalized model. Eighteen species (3.4% of all species) had no climatic niche representation in their affiliated PAs at one or several time-steps, i.e., the data contained zeroes. As the range of values over which the link function of the beta distribution is defined does not include zero (or one, but note that the climatic representation never reached one), we applied the lemon squeezer transformation of Smithson and Verkuilen (2006) prior to modeling [value ∗ (n - 1) + 0.5)/n], which basically moves all values slightly toward 0.5 without changing relative differences. For our full model, we used the thus transformed climatic niche representation as response variable, and the combination of time step and scenario (as one factor variable, i.e., time step/scenario combination, for instance 2050-RCP4.5 or 2080-RCP8.5) together with the taxonomic group (plants, animals) as interactive fixed-effects predictor variables to test whether plants’ and animals’ climatic representations react differently to climate change. To account for the usage of the same species across time steps and scenarios (pseudo-replication) we moreover estimated random intercepts for each species. To test whether the interaction between time step, scenario and taxonomic groups was significant, we compared the full model to the corresponding additive model by means of a likelihood ratio test. Finally, we performed Tukey-corrected pair-wise comparisons across all factor levels in the final model to test whether the climatic scenarios and/or the taxonomic groups differ statistically significantly in terms of niche representation, taking pair-wise contrasts as significantly different with p < 0.05.
In addition to test for differences in the niche representation across time, scenarios and taxonomic groups, we graphically evaluated the relationship between the change of niche representation in the future and some attributes of the species, namely their current occupancies, their current mean elevations, as well as the widths of their current elevational ranges. For this purpose, we scaled the niche representation such, that a value of −1 means complete loss of representation, zero means no change, and a value of 1 means a doubling of representation.
Under current climate, i.e., in 2020, the climatic niches of 18 (or 3.4%) of the 530 species considered here have no representation of their climatic niches within their associated PAs (see Supplementary Table 1 for results of each species). None of these 18 species will gain representation under future climates in any scenario, even though PAs are situated within their range (3 × 5 arcmin scale and buffer). In contrast, 77 species (or 14.5%) had more than 90% of their climatic niches represented within their associated PAs under current climate. Under future climates, all of them are expected to experience representation losses at some point, with 29 species completely losing representation until 2080.
A total of 256 species (or 48%) experienced increases of their climatic niche representation in PAs at some time-step and climate change scenario. However, these increases were generally small, most frequent during the first time-step under the RCP 2.6 and RCP 4.5 climate change scenarios, and usually offset by subsequent decreases in later time-steps (Supplementary Table 1). For instance, under RCP 4.5, 158 species gained representation until 2030. However, only 12 of these species could sustain these increases while the majority of these species (129) experienced decreases, with 17 species experiencing a complete loss of representation until 2080.
At the end of the period considered (year 2080) under the RCP 8.5 scenario, the climatic niches of 152 species (or 28.7%) have no representation in their associated PAs. This number of unrepresented species was lower for the two less severe scenarios, namely 103 (or 19.4%) and 25 (or 4.7%) for RCP 4.5 and 2.6, respectively (for a visualization of this result, compare the increase in the number of -1 values in RCP 4.5 and 8.5 across Figures 3–5).
The full model (including an interaction between the predictor variables time-step, scenario and taxonomic group) was the most appropriate to summarize future trends of climatic niche representation across all species (likelihood ratio test, interaction vs. additive model, p < 0.00001). All scenarios and time-steps had statistically significantly different representations of species’ climatic niches in PAs, and plants and animals also differed in this respect (Tukey-corrected pair-wise comparisons p < 0.05, for details see Figure 2).
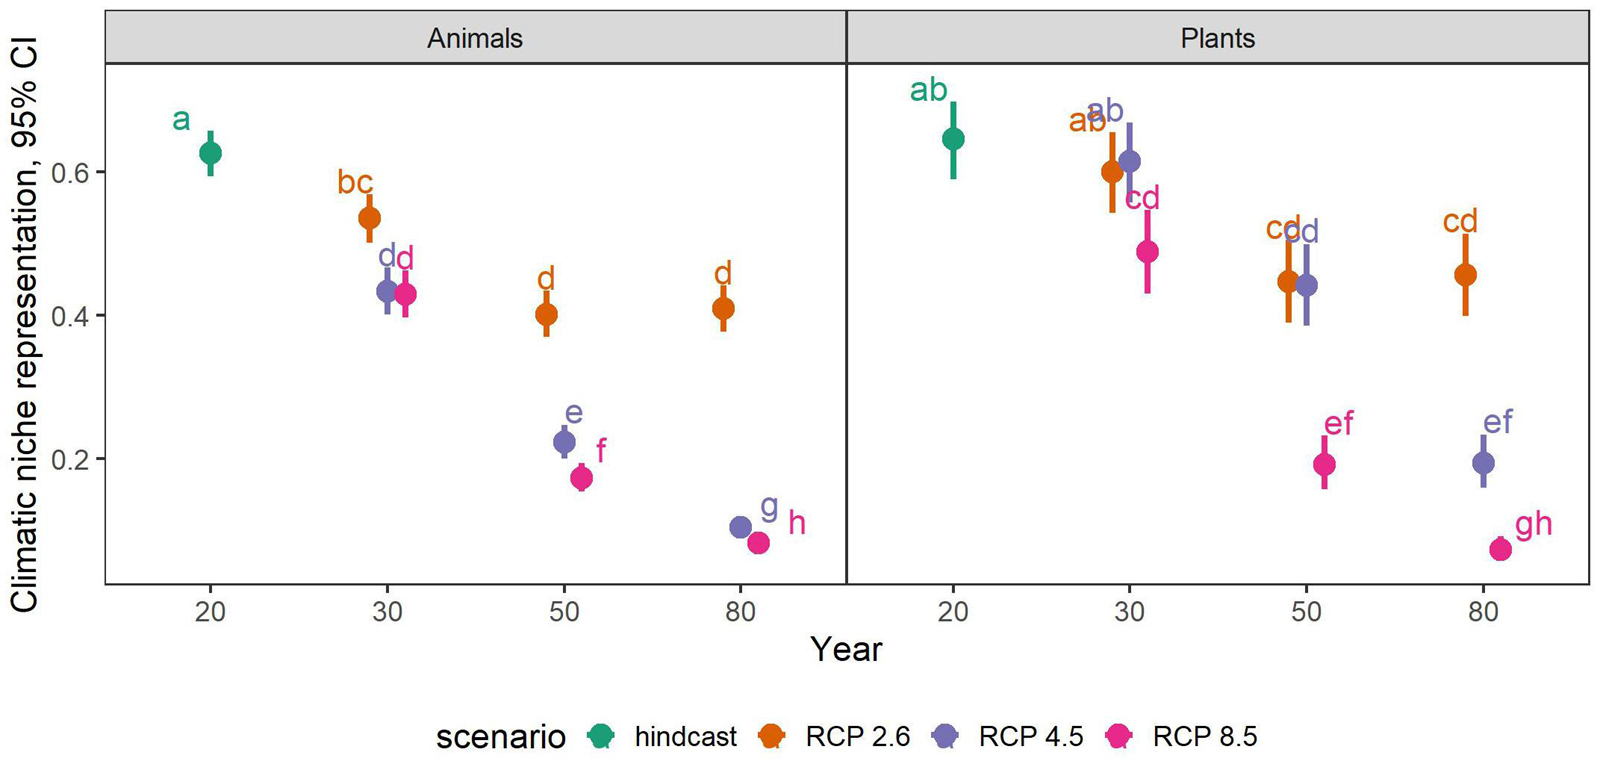
Figure 2. Proportional representation of climatic niches in PAs across all 530 endemic plant and animal species considered in this study. Shown are estimates and 95% confidence intervals (CI) from a generalized linear mixed effects model including a significant interaction between time-step, scenario and taxonomic groups. Please note that all data presented here come from a single model, even though the taxonomic groups are displayed in two separate panels for overview. The different colors represent the climatic scenarios RCP 2.6, RCP 4.5, and RCP 8.5, while the hindcast represents the current climate (i.e., year 2020). Numbers on the x-axis refer to the modeled year with 20, 30, 50, and 80 referring to the years 2020, 2030, 2050, and 2080, respectively. Pair-wise contrasts (Tukey-method corrected) are statistically significant at p < 0.005 (letters).
Under current climate, an average of 62.6 and 64.6% of the species’ climatic niches across animals and plants, respectively, were represented in their associated PAs. This value, however, decreased rapidly with each time-step of the future scenarios, reaching levels as low as 8.2 and 7.3% in 2080 under RCP 8.5 (Figure 2). Under RCP 2.6, years 2050 and 2080 were not significantly different from each other for both taxonomic groups, i.e., the initial decrease of representation halted after 2050 under RCP 2.6, while the decrease continued until 2080 under the other scenarios. For animals in the year 2030, representation was almost equal between RCP 4.5 and 8.5, i.e., the trajectories of representation loss were more or less similar between these scenarios until 2030, after which they furcated. For plants, this was the case in years 2030 and 2050 for scenarios RCP 2.6 and RCP 4.5, respectively.
Independent of scenario or taxonomic group, species with small range sizes (at the 1 ha occupancy scale), experienced higher loss of climatic niche representation than more widespread ones. This difference became more pronounced over time, i.e., in 2050 and 2080 the loss of representation is particularly biased toward small-range species, especially in the RCP2.6 and 4.5 scenarios (Figure 3). Across the elevational gradient, species from intermediate elevations were predicted to lose less climatic representation in PAs than those from higher and lower ones, with these differences somewhat more pronounced in plants than in animals (Figure 4). Finally, the elevational range of a species, as an indicator of its climatic niche breadth, was negatively related to loss rates (Figure 5), a result consistent with higher loss rates found for species with narrower geographical range (Figure 3). As in the case of geographical range size, this trend was consistent across scenarios and taxonomic groups, but became more pronounced over time, especially in the scenarios RCP4.5 and 8.5.
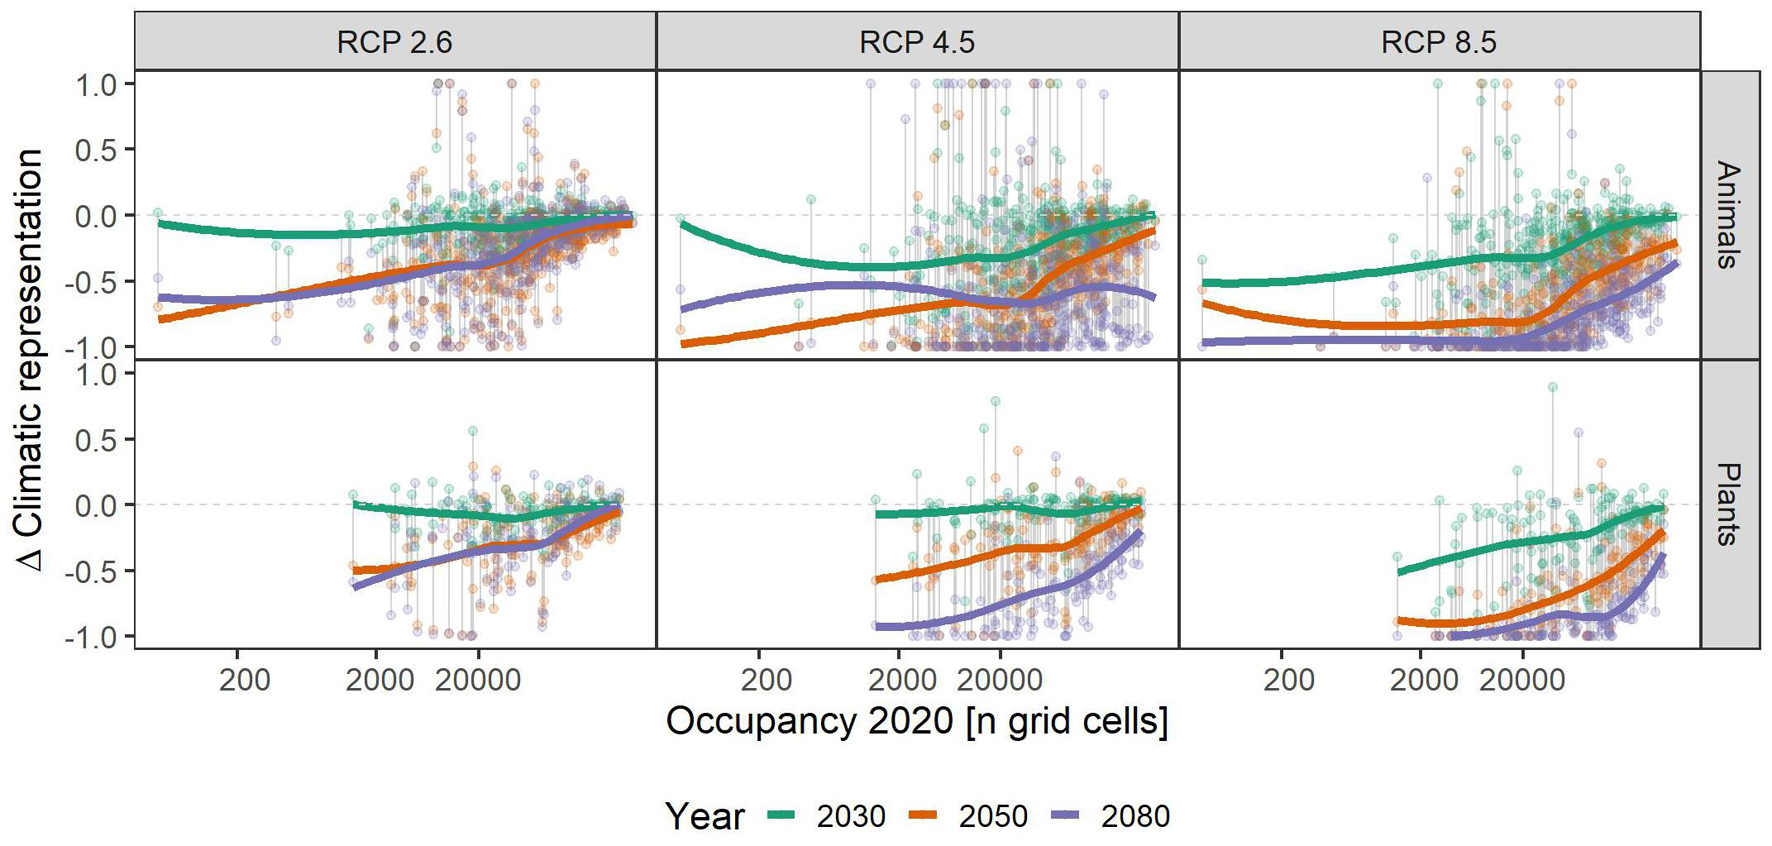
Figure 3. Relationship of species’ assumed area of occupancy and their respective gains and losses of climatic representation in the future under climate change scenarios RCP 2.6, RCP 4.5, and RCP 8.5. Colored, bold lines represent splines within each time-step (colors) and scenario (panels) for overview. Gray vertical lines connect data points belonging to one species. A value of -1 means complete loss of representation, and a value of 1 means a doubling of representation. Please note that some species had a relative change >1, and that for overview, we set those to 1. See Supplementary Table 1 for details.
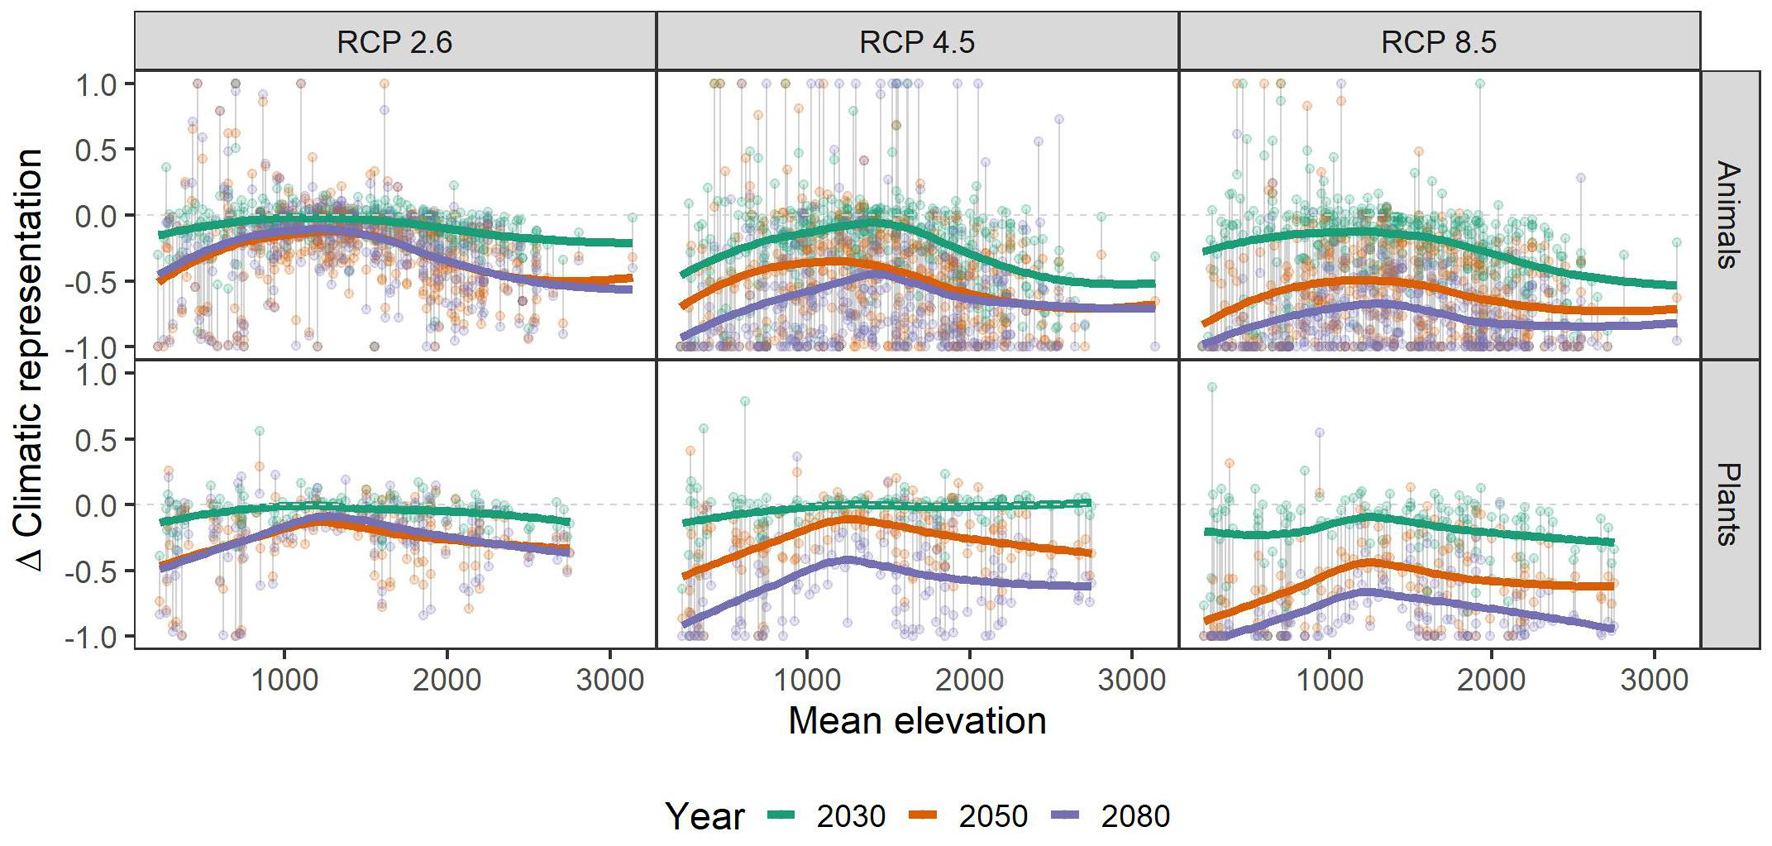
Figure 4. Relationship of mean elevation (meters) of the species’ assumed area of occupancy and their respective gains and losses of representation in the future under climate change scenarios RCP 2.6, RCP 4.5, and RCP 8.5. Colored, bold lines represent splines within each time-step (colors) and scenario (panels) for overview. Gray vertical lines connect data points belonging to one species. A value of -1 means complete loss of representation, and a value of 1 means a doubling of representation. Please note that some species had a relative change >1, and that for overview, we set those to 1. See Supplementary Table 1 for details.
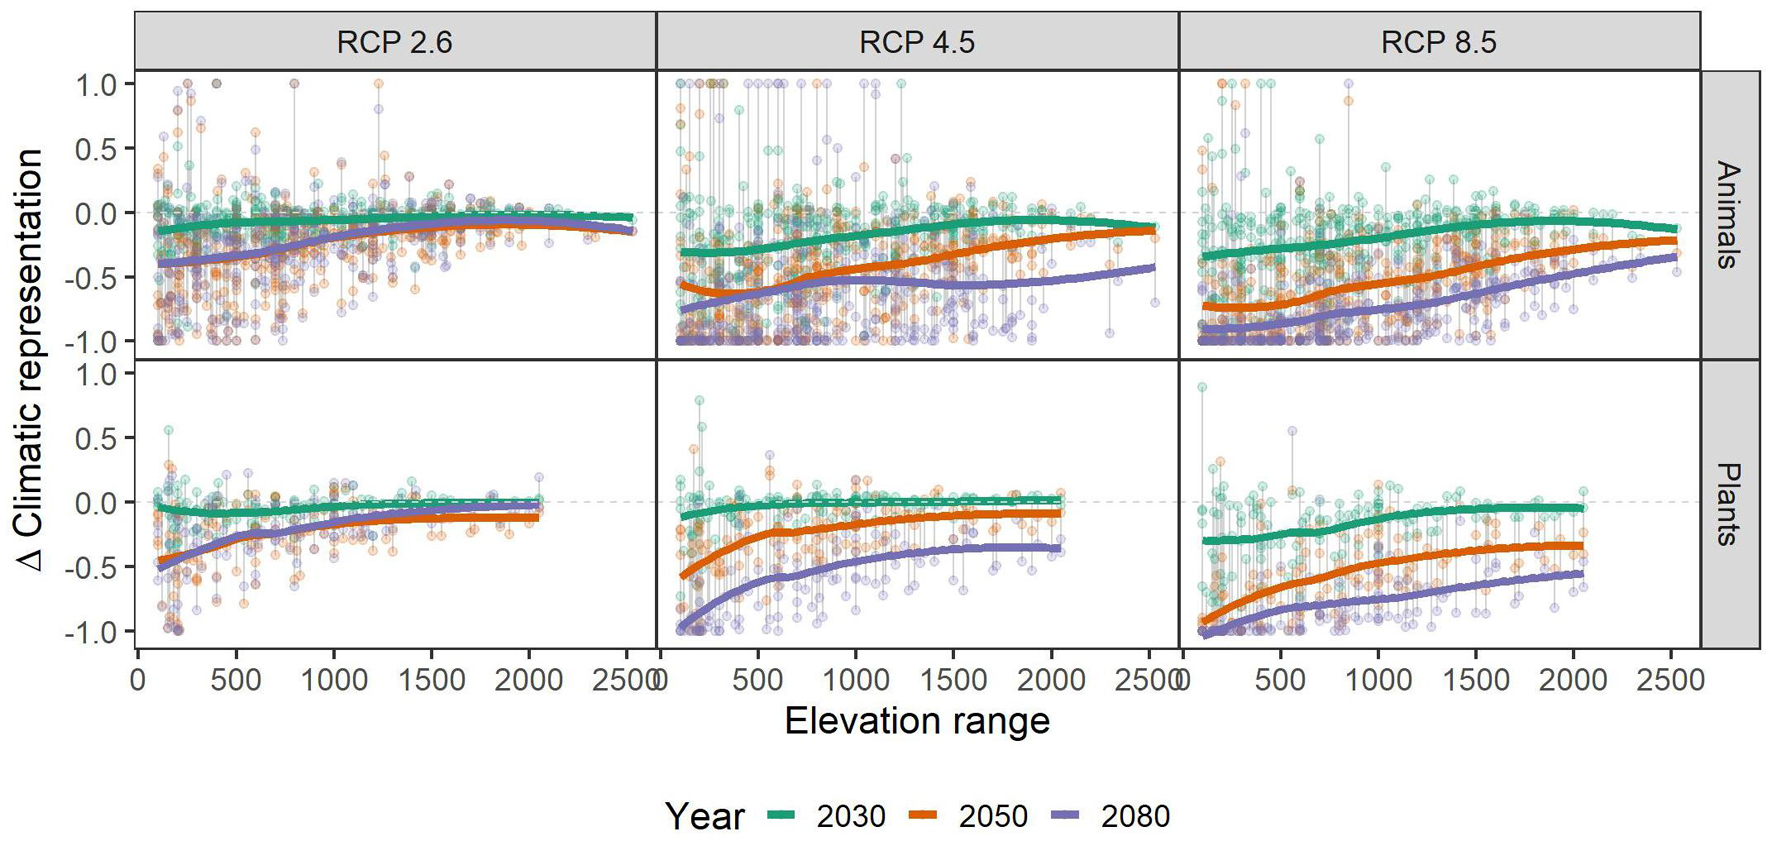
Figure 5. Relationship of the species’ elevational range (in meters) and their respective gains and losses of representation in the future under climate change scenarios RCP 2.6, RCP 4.5, and RCP 8.5. Colored, bold lines represent splines within each time-step (colors) and scenario (panels) for overview. Gray vertical lines connect data points belonging to one species. A value of -1 means complete loss of representation, and a value of 1 means a doubling of representation. Please note that some species had a relative change >1, and that for overview, we set those to 1. See Supplementary Table 1 for details.
The protection of rare endemic species is arguably an important asset of PAs, and with regard to this criterion we conclude that the Austrian PA network is unfit for climate change under two of the three climate scenarios tested here (i.e., RCP 4.5 and RCP 8.5). Under these scenarios, until 2080 the representation of currently realized climatic niches of the 530 endemic species in PAs drops to below 20%, on average. A sizeable portion of 20–30% of these species will even completely lose access to their climatic niches, or exclusively find suitable climate space outside PAs where colonization and establishment are less likely (Thomas et al., 2012). These findings generally underpin other warnings that climate change may significantly reduce the efficiency of current PA-networks in the future (Araújo et al., 2011; Nori et al., 2016; Batllori et al., 2017; Hidasi-Neto et al., 2019; Elsen et al., 2020; Prieto-Torres et al., 2021) if they remain static and their extent is not adapted to mitigate climate change impacts.
It has been argued that the world is not currently on track to the RCP 8.5 scenario but rather to an RCP 4.5 climate change-future (Hausfather and Peters, 2020). However, differences between the RCP 8.5 and the RCP 4.5 scenario were quantitatively small in the case of animals, each leading to a ca. 6-fold decrease of climatic niche representations of endemics in their associated PAs. In case of plants, the two scenarios differed more strongly, but climatic niche representation in 2080 still dropped to ca. 30% of its current value under the RCP 4.5 scenario. We don’t know the reason for the differences between plants and animals, but we hypothesize that the peculiar distribution patterns of species in relationship with associated PAs is the main driver. Even under the very stringent RCP 2.6 scenario, which inspired the Paris climate agreement, endemics would face an approximate 30%-loss of climatic niche representation according to our calculations. Nevertheless, as the climate stabilizes after 2050 in this scenario, adapting spatial distributions to the changed suitability patterns is probably much easier for most species than under the continued or even accelerating change predicted by the RCP 4.5 and 8.5 scenarios. We add, however, that our calculations were only based on predictions of one particular global circulation model. The use of other models may have added additional variability to our results. However, the effect of varying R on species’ range shift projections is usually more pronounced than the effect of GCMs (Thuiller et al., 2019). We hence believe that the general pattern of a massive loss of species’ niche representation in PAs, especially in the more pronounced climatic scenarios, is most likely robust.
A major reason why the Austrian PA falls short of protecting endemics in the future is the assumed lack of dispersal capabilities of these species, i.e., the restriction of the calculations to the current extent of species’ ranges. While this assumption might not be true in each single case, the majority of these endemics has been shown by previous studies to have narrow ranges precisely because of their limited dispersal abilities (Essl et al., 2011; Dullinger et al., 2012b). With respect to the subset of species that are sufficiently mobile, climate smartness of the Austrian PA network might, however, score differently. Indeed, several studies have shown that bird and well flying insect species may remain represented within larger PA networks because they can more easily track their niches to PAs outside the extent of the current ranges (Hole et al., 2009; Thomas and Gillingham, 2015). However, while these highly mobile animal groups may be able to migrate through fragmented landscapes or pass landscapes with unsuitable climates that separate individual PAs, this is less likely for plants and many other invertebrate groups, be they endemic or not (Wessely et al., 2017). Consequently, our approach may easily represent an overestimation of the study species’ future climatic representation within PAs, because many of them might not even be able to reach nearby PAs (Prieto-Torres et al., 2021).
Our calculations suggest that species with larger distribution areas and wider elevational ranges will lose less climatic niche representation in their associated PAs. These two factors are correlated (Supplementary Figure 1), however, it is beyond the scope of this study to determine their relative contribution to the loss or gain of climatic niche representation. In any case, high values in any or both of these factors may be a result of larger climatic niches and hence increase the likelihood of representation by the PA network now and in the future. Hence, our results support the general notion that smaller range sizes lead to higher extinction risk (Manne and Pimm, 2001), even within the group of narrow-range species studied here.
We found that species from intermediate elevations (i.e., with their occurrence at a mean elevation of around 1,000–1,500 m) have lower loss of climatic niche representation than species occurring in lower or higher elevations. These species live at elevations low enough to allow tracking climatic niches via the assumed short distance dispersal along topoclimate gradients (Ackerly et al., 2010). Additionally, the presence of PAs is larger at higher elevations, mainly because competing interest from other land-use is lower (cf. Figure 4). As a corollary, a warming climate will shift the climatic niches of these mid-elevation species “into PAs.” Species from lowest elevations may profit less from this PA pattern, because they may be geographically separated from mountainous areas and have no access to topoclimate gradients. Moreover, these lowland endemics of Austria often are specialists of peculiar, rare and isolated habitat types (Rabitsch and Essl, 2009), and hence often have particularly small ranges and narrow climatic niches. Small ranges and narrow niches, in turn, reduce the likelihood that PAs with appropriate environmental conditions are within reachable distance of a species. On the other end of the elevation spectrum, species may already occupy the highest elevations available and hence have little scope to shift ranges when climate warms, as no higher elevations can be reached (Dirnböck et al., 2011). We emphasize, however, that the microclimatic variation is often particularly pronounced at highest elevations, and that the respective microrefugia could not be accounted for in our analyses. Climatic representation of alpine and sub-nival species in these microrefugia may hence buffer future loss of meso-climatic representation to a certain extent (Scherrer and Körner, 2011).
Low representation of endemics’ climatic niches by PAs implies that, even if PAs secure the persistence of populations of these species in geographic space, only a small portion of intraspecific genetic diversity may be represented in that space. As a result, the ability of species to overcome the shrinking representation of their climatic niches in PAs by phenotypic plasticity or genetic adaptation, i.e., by shifting their niche instead of their distribution, may also shrink (Barrett and Schluter, 2008; Salamin et al., 2010). Little is known about the intraspecific diversity of these endemic species, but as most of them have probably undergone severe demographic bottlenecks during Pleistocene climatic fluctuations (Rabitsch and Essl, 2009), the level of this diversity might often be low (Ellegren and Galtier, 2016) and its further reduction particularly critical. For the endemic species considered here, this risk might be higher for plants than for many of the animals, because plants are mostly long-lived, and the odds of evolutionary rescue decreases with the species lifespan (Cotto et al., 2017). However, all species are likely to face severe loss of ongoing diversification processes when just small fractions of their climatic niches will be conserved in the future.
Our niche calculations of endemic species are based on the simplifying assumption that species (a) occupy all geographic space within reported elevational range limits and (b) may freely disperse across the whole suitable climatic space within their ranges. This is certainly not true because occupancy is additionally determined by factors other than climate, for instance by resource availability (e.g., water and nutrients in case of plants, host plants or other food resources in case of invertebrates) or dispersal capabilities (Pagel et al., 2020; Treurnicht et al., 2020), and the distribution of the species will hence be patchy rather than continuous within their elevational limits. Further, dispersal and incidence across the climatically suitable space of a species may likewise be constrained by biotic factors not considered here such as the presence and abundance of competitors and mutualists (Estrada et al., 2016). The area of occupancy that we derived for the study species is hence rather a potential area and almost certainly overestimates real occupancy. In addition, it may also overestimate niche breadth, and hence niche representation in PAs, because reported elevational range limits neither distinguish source from sink populations nor account for mismatches between niches and distribution that are due to other reasons such as persistence of long-lived species at sites no longer suitable to them (Pagel et al., 2020). Alternative approaches, such as those that directly measure demographic rates along environmental gradients (Treurnicht et al., 2020) could deliver more accurate niche characterizations. However, these approaches require considerable measurement effort and appear unfeasible for large sets of rare species as those modeled here, despite recent efforts to compile available demographic information (Salguero-Gómez et al., 2015, 2016). For such sets, the approach taken here should provide a reasonable approximation of the climatic niche because elevation is closely correlated to climate, especially to temperature, and elevational limits are hence a reasonable indicator of (realized) niche boundaries. If the focus is on climatic niches only, our simplified rectilinear envelop approach may even have advantages as it abstracts from other abiotic or biotic constraints on species’ distribution that may confound the derivation of species climatic niches from occurrence records. In general, however, the estimation of the species’ realized niche is certainly less accurate with such an approach, as also illustrated by comparisons of various niche modeling algorithms (Zimmermann et al., 2010; Blonder, 2018). For species with sufficient documentation of real occupancy, using this more precise information for determining niches is hence clearly preferable. In addition, information on functional traits has demonstrated potential to improve the characterization of species’ niches and their ability to respond to climatic changes (Estrada et al., 2016; Treurnicht et al., 2020). However, trait information is usually least available for narrow-range species, and in many invertebrate groups modeled here the relevance of particular traits for niche characterization is yet little explored.
Taken together, our results suggest that under a set of climate change scenarios, the Austrian PA-network will perform poorly in safeguarding its endemic species, i.e., the group of species for which it has a particular responsibility. In order to conserve species’ climatic niches, and thereby intraspecific diversity and evolutionary potential, expansions of PAs based on prioritization of climatic conditions should be considered (Hanson et al., 2020). In Austria, land-use and its associated threats to biodiversity are less intense at higher elevations also outside of PAs. Therefore, the survival of high-elevation species tracking their climatic niches during climate change may depend less on the presence of PAs, as unprotected land may still offer intact suitable habitats. In contrast, the survival of lowland species tracking their niches may depend more strongly on the presence of PAs if suitable habitat outside of PAs is scarce due to human pressures. However, despite a general decrease of land use intensity, human pressure can be considerable even at high elevations, e.g., from tourism, energy production or resource extraction, and conflicts between conservation and competing interests are frequent in various parts of the Alps.
Increasing the elevational gradients covered in PAs is a suggested strategy to adapt PA networks to a warming climate (Elsen et al., 2018). However, there are obvious limits to this strategy for species that already now live close to the highest elevations in their surroundings. As endemism in the European Alps is spatially biased toward marginal areas that have not been glaciated during the Last Glacial Maximum (Schönswetter et al., 2005; Dirnböck et al., 2011), and as these marginal parts of the Alps are mostly lower than the more central ones, scope for securing the protection of endemics through upward expansion of PAs appears indeed restricted. The most promising strategies are hence to limit the magnitude of climate change as far as possible, and to effectively reduce other pressures than climate change that additionally impact endemic species.
The original contributions presented in the study are included in the article/Supplementary Material, further inquiries can be directed to the corresponding author.
PS, SS, FE, and SD designed the study. DM compiled species range and climate data. JW and AG provided future climate data maps. PS performed climatic niche representation calculations and all other analyses and wrote the text with further input from all authors. All authors contributed to the article and approved the submitted version.
The authors declare that the research was conducted in the absence of any commercial or financial relationships that could be construed as a potential conflict of interest.
All claims expressed in this article are solely those of the authors and do not necessarily represent those of their affiliated organizations, or those of the publisher, the editors and the reviewers. Any product that may be evaluated in this article, or claim that may be made by its manufacturer, is not guaranteed or endorsed by the publisher.
We thank the Austrian Climate Research Program ACRP for funding (CCCCCS, pr.no. KR17AC0K13678).
The Supplementary Material for this article can be found online at: https://www.frontiersin.org/articles/10.3389/fevo.2021.685753/full#supplementary-material
Ackerly, D. D., Loarie, S. R., Cornwell, W. K., Weiss, S. B., Hamilton, H., Branciforte, R., et al. (2010). The geography of climate change: implications for conservation biogeography. Diversity Distribut. 16, 476–487. doi: 10.1111/j.1472-4642.2010.00654.x
Araújo, M. B., Alagador, D., Cabeza, M., Nogués-Bravo, D., and Thuiller, W. (2011). Climate change threatens european conservation areas. Ecol. Lett. 14, 484–492. doi: 10.1111/j.1461-0248.2011.01610.x
Ayebare, S., Plumptre, A. J., Kujirakwinja, D., and Segan, D. (2018). Conservation of the endemic species of the albertine rift under future climate change. Biol. Conserv. 220, 67–75. doi: 10.1016/j.biocon.2018.02.001
Bálint, M., Domisch, S., Engelhardt, C. H. M., Haase, P., Lehrian, S., Sauer, J., et al. (2011). Cryptic biodiversity loss linked to global climate change. Nat. Climate Change 1, 313–318. doi: 10.1038/nclimate1191
Barnosky, A. D., Matzke, N., Tomiya, S., Wogan, G. O., Swartz, B., Quental, T. B., et al. (2011). Has the earth’s sixth mass extinction already arrived? Nature 471, 51–57. doi: 10.1038/nature09678
Barrett, R. L., and Schluter, D. (2008). Adaptation from standing genetic variation. Trends Ecol. Evol. 23, 38–44. doi: 10.1016/j.tree.2007.09.008
Batllori, E., Parisien, M.-A., Parks, S. A., Moritz, M. A., and Miller, C. (2017). Potential relocation of climatic environments suggests high rates of climate displacement within the north american protection network. Global Change Biol. 23, 3219–3230. doi: 10.1111/gcb.13663
Blonder, B. (2018). Hypervolume concepts in niche- and trait-based ecology. Ecography 41, 1441–1455. doi: 10.1111/ecog.03187
Broennimann, O., Fitzpatrick, M. C., Pearman, P. B., Petitpierre, B., Pellissier, L., Yoccoz, N. G., et al. (2012). Measuring ecological niche overlap from occurrence and spatial environmental data. Global Ecol. Biogeography 21, 481–497. doi: 10.1111/j.1466-8238.2011.00698.x
Brooks, M. E., Kristensen, K., van Benthem, K. J., Magnusson, A., Berg, C. W., and Nielsen, A. (2017). GlmmTMB balances speed and flexibility among packages for zero-inflated generalized linear mixed modeling. R J. 9, 378–400.
Clark, J. S., Bell, D. M., Hersh, M. H., Kwit, M. C., Moran, E., Salk, C., et al. (2011). Individual-Scale variation, species-scale differences: inference needed to understand diversity. Ecol. Lett. 14, 1273–1287. doi: 10.1111/j.1461-0248.2011.01685.x
Cotto, O., Wessely, J., Georges, D., Klonner, G., Schmid, M., Dullinger, S., et al. (2017). A dynamic eco-evolutionary model predicts slow response of alpine plants to climate warming. Nat. Commun. 8:15399. doi: 10.1038/ncomms15399
Di Cola, V., Broennimann, O., Petitpierre, B., Breiner, F. T., D’Amen, M., Randin, C., et al. (2016). Ecospat: an R package to support spatial analyses and modeling of species niches and distributions. Ecography 40, 774–787. doi: 10.1111/ecog.02671
Díaz, S., Settele, J., Brondízio, E. S., Ngo, H. T., Agard, J., Arneth, A., et al. (2019). Pervasive human-driven decline of life on earth points to the need for transformative change. Science 366, 1–10. doi: 10.1126/science.aax3100
Dirnböck, T., Essl, F., and Rabitsch, W. (2011). Disproportional risk for habitat loss of high-altitude endemic species under climate change. Global Change Biol. 17, 990–996. doi: 10.1111/j.1365-2486.2010.02266.x
Dobrowski, S. Z., and Parks, S. A. (2016). Climate change velocity underestimates climate change exposure in mountainous regions. Nat. Commun. 7:12349. doi: 10.1038/ncomms12349
Dullinger, S., Dendoncker, N., Gattringer, A., Leitner, M., Mang, T., Moser, D., et al. (2015). Modelling the effect of habitat fragmentation on climate-driven migration of european forest understorey plants. Diversity Distribut. 21, 1375–1387. doi: 10.1111/ddi.12370
Dullinger, S., Gattringer, A., Thuiller, W., Moser, D., Zimmermann, N. E., Guisan, A., et al. (2012a). Extinction debt of high-mountain plants under twenty-first-century climate change. Nat. Climate Change 2, 619–622. doi: 10.1038/nclimate1514
Dullinger, S., Willner, W., Plutzar, C., Englisch, T., Schratt-Ehrendorfer, L., and Moser, D. (2012b). Post-Glacial migration lag restricts range filling of plants in the european alps. Global Ecol. Biogeography 21, 829–840. doi: 10.1111/j.1466-8238.2011.00732.x
Early, R., and Sax, D. F. (2014). Climatic niche shifts between species’ native and naturalized ranges raise concern for ecological forecasts during invasions and climate change. Global Ecol. Biogeography 23, 1356–1365. doi: 10.1111/geb.12208
Ellegren, H., and Galtier, N. (2016). Determinants of genetic diversity. Nat. Rev. Genet. 17, 422–433. doi: 10.1038/nrg.2016.58
Ellis, E. C., Kaplan, J. O., Fuller, D. Q., Vavrus, S., Goldewijk, K. K., and Verburg, P. H. (2013). Used planet: a global history. Proc. Natl. Acad. Sci. U S A. 110, 7978–7985. doi: 10.1073/pnas.1217241110
Elsen, P. R., Monahan, W. B., Dougherty, E. R., and Merenlender, A. M. (2020). Keeping pace with climate change in global terrestrial protected areas. Sci. Adv. 6:eaay0814. doi: 10.1126/sciadv.aay0814
Elsen, P. R., Monahan, W. B., and Merenlender, A. M. (2018). Global patterns of protection of elevational gradients in mountain ranges. Proc. Natl. Acad. Sci. U S A. 115, 6004–6009. doi: 10.1073/pnas.1720141115
Elsen, P. R., and Tingley, M. W. (2015). Global mountain topography and the fate of montane species under climate change. Nat. Climate Change 5, 772–776. doi: 10.1038/nclimate2656
Essl, F., Dullinger, S., Plutzar, C., Willner, W., and Rabitsch, W. (2011). Imprints of glacial history and current environment on correlations between endemic plant and invertebrate species richness. J. Biogeography 38, 604–614. doi: 10.1111/j.1365-2699.2010.02425.x
Estrada, A., Morales-Castilla, I., Caplat, P., and Early, R. (2016). Usefulness of species traits in predicting range shifts. Trends Ecol. Evol. 31, 190–203. doi: 10.1016/j.tree.2015.12.014
Fick, S. E., and Hijmans, R. J. (2017). WorldClim 2: new 1-km spatial resolution climate surfaces for global land areas. Int. J. Climatol. 37, 4302–4315. doi: 10.1002/joc.5086
Flantua, S. G. A., Payne, D., Borregaard, M. K., Beierkuhnlein, C., Steinbauer, M. J., Dullinger, S., et al. (2020). Snapshot isolation and isolation history challenge the analogy between mountains and islands used to understand endemism. Global Ecol. Biogeography 29, 1651–1673. doi: 10.1111/geb.13155
Fuentes-Castillo, T., Scherson, R. A., Marquet, P. A., Fajardo, J., Corcoran, D., Román, M. J., et al. (2019). Modelling the current and future biodiversity distribution in the chilean mediterranean hotspot. the role of protected areas network in a warmer future. Diversity Distribut. 25, 1897–1909. doi: 10.1111/ddi.12988
García-Rodríguez, A., Velasco, J. A., Villalobos, F., and Parra-Olea, G. (2021). Effects of evolutionary time, speciation rates and local abiotic conditions on the origin and maintenance of amphibian montane diversity. Global Ecol. Biogeography 30, 674–684. doi: 10.1111/geb.13249
Hanson, J. O., Rhodes, J. R., Butchart, S. H. M., Buchanan, G. M., Rondinini, C., Ficetola, G. F., et al. (2020). Global conservation of species’. Niches. Nature 580, 232–234. doi: 10.1038/s41586-020-2138-2137
Hausfather, Z., and Peters, G. P. (2020). Emissions – the ‘business as usual’ story is misleading. Nature 577, 618–620. doi: 10.1038/d41586-020-00177-173
Hidasi-Neto, J., Joner, D. C., Resende, F., de Macedo Monteiro, L., Faleiro, F. V., Loyola, R. D., et al. (2019). Climate change will drive mammal species loss and biotic homogenization in the cerrado biodiversity hotspot. Perspect. Ecol. Conserv. 17, 57–63. doi: 10.1016/j.pecon.2019.02.001
Hole, D. G., Huntley, B., Arinaitwe, J., Butchart, S. H. M., Collingham, Y. C., Fishpool, L. D. C., et al. (2011). Toward a management framework for networks of protected areas in the face of climate change. Conserv. Biol. 25, 305–315. doi: 10.1111/j.1523-1739.2010.01633.x
Hole, D. G., Willis, S. G., Pain, D. J., Fishpool, L. D., Butchart, S. H. M., Collingham, Y. C., et al. (2009). Projected impacts of climate change on a continent-wide protected area network. Ecol. Lett. 12, 420–431. doi: 10.1111/j.1461-0248.2009.01297.x
Karger, D. N., Conrad, O., Böhner, J., Kawohl, T., Kreft, H., Wilber Soria-Auza, R., et al. (2017). Climatologies at high resolution for the earth’s land surface areas. Sci. Data 4:170122. doi: 10.1038/sdata.2017.122
Körner, C., and Hiltbrunner, E. (2018). The 90 ways to describe plant temperature. Perspect. Plant Ecol. Evol. Systematics 30, 16–21. doi: 10.1016/j.ppees.2017.04.004
Lawler, J. J., Ackerly, D. D., Albano, C. M., Anderson, M. G., Dobrowski, S. Z., Gill, J. L., et al. (2015). The theory behind, and the challenges of, conserving nature’s stage in a time of rapid change. Conserv. Biol. 29, 618–629. doi: 10.1111/cobi.12505
Loarie, S. R., Duffy, P. B., Hamilton, H., Asner, G. P., Field, C. B., and Ackerly, D. D. (2009). The velocity of climate change. Nature 462, 1052–1055. doi: 10.1038/nature08649
Manne, L. L., and Pimm, S. L. (2001). Beyond eight forms of rarity: which species are threatened and which will be next? Animal Conserv. 4, 221–229. doi: 10.1017/S1367943001001263
Maxwell, S. L., Cazalis, V., Dudley, N., Hoffmann, M., Rodrigues, A. S. L., Stolton, S., et al. (2020). Area-Based conservation in the twenty-first century. Nature 586, 217–227. doi: 10.1038/s41586-020-2773-z
Moss, R. H., Edmonds, J. A., Hibbard, K. A., Manning, M. R., Rose, S. K., van Vuuren, D. P., et al. (2010). The next generation of scenarios for climate change research and assessment. Nature 463, 747–756. doi: 10.1038/nature08823
Nori, J., Torres, R., Lescano, J. N., Cordier, J. M., Periago, M. E., and Baldo, D. (2016). Protected areas and spatial conservation priorities for endemic vertebrates of the gran chaco, one of the most threatened ecoregions of the world. Diversity Distribut. 22, 1212–1219. doi: 10.1111/ddi.12497
Ohlemüller, R., Anderson, B. J., Araújo, M. B., Butchart, S. H. M., Kudrna, O., Ridgely, R. S., et al. (2008). The coincidence of climatic and species rarity: high risk to small-range species from climate change. Biol. Lett. 4, 568–572. doi: 10.1098/rsbl.2008.0097
Pagel, J., Treurnicht, M., Bond, W. J., Kraaij, T., Nottebrock, H., Schutte-Vlok, A., et al. (2020). Mismatches between demographic niches and geographic distributions are strongest in poorly dispersed and highly persistent plant species. Proc. Natl. Acad. Sci. U S A. 117, 3663–3669. doi: 10.1073/pnas.1908684117
Prieto-Torres, D. A., Sánchez-González, L. A., Ortiz-Ramírez, M. F., Ramírez-Albores, J. E., García-Trejo, E. A., and Navarro-Sigüenza, A. G. (2021). Climate warming affects spatio-temporal biodiversity patterns of a highly vulnerable neotropical avifauna. Climatic Change 165:57. doi: 10.1007/s10584-021-03091-3093
R Core Team (2017). R: A Language and Environment for Statistical Computing. Vienna: R Foundation for Statistical Computing.
Rabitsch, W., and Essl, F. (2009). Endemiten - Kostbarkeiten in Österreichs Pflanzen- Und Tierwelt. Vienna: Naturwissenschaftlicher Verlag für Kärnten und Umweltbundesamt.
Salamin, N., Wüest, R. O., Lavergne, S., Thuiller, W., and Pearman, P. B. (2010). Assessing rapid evolution in a changing environment. Trends Ecol. Evol. 25, 692–698. doi: 10.1016/j.tree.2010.09.009
Salguero-Gómez, R., Jones, O. R., Archer, C. R., Bein, C., Buhr, H., Farack, C., et al. (2016). COMADRE: a global data base of animal demography. J. Animal Ecol. 85, 371–384. doi: 10.1111/1365-2656.12482
Salguero-Gómez, R., Jones, O. R., Archer, C. R., Buckley, Y. M., Che-Castaldo, J., Caswell, H., et al. (2015). The COMPADRE plant matrix database: an open online repository for plant demography. J. Ecol. 103, 202–218. doi: 10.1111/1365-2745.12334
Scheffers, B. R., Edwards, D. P., Diesmos, A., Williams, S. E., and Evans, T. A. (2014). Microhabitats reduce animal’s exposure to climate extremes. Global Change Biol. 20, 495–503. doi: 10.1111/gcb.12439
Scherrer, D., Christe, P., and Guisan, A. (2019). Modelling bat distributions and diversity in a mountain landscape using focal predictors in ensemble of small models. Diversity Distribut. 25, 770–782. doi: 10.1111/ddi.12893
Scherrer, D., and Körner, C. (2011). Topographically controlled thermal-habitat differentiation buffers alpine plant diversity against climate warming. J. Biogeography 38, 406–416. doi: 10.1111/j.1365-2699.2010.02407.x
Schönswetter, P., Stehlik, I., Holderegger, R., and Tribsch, A. (2005). Molecular evidence for glacial refugia of mountain plants in the european alps. Mol. Ecol. 14, 3547–3555. doi: 10.1111/j.1365-294X.2005.02683.x
Smithson, M., and Verkuilen, J. (2006). A better lemon squeezer? maximum-likelihood regression with beta-distributed dependent variables. Psychol. Methods 11, 54–71.
Thomas, C. D., and Gillingham, P. K. (2015). The performance of protected areas for biodiversity under climate change. Biol. J. Linnean Soc. 115, 718–730. doi: 10.1111/bij.12510
Thomas, C. D., Gillingham, P. K., Bradbury, R. B., Roy, D. B., Anderson, B. J., Baxter, J. M., et al. (2012). Protected areas facilitate species’ range expansions. Proc. Natl. Acad. Sci. U S A. 109, 14063–14068. doi: 10.1073/pnas.1210251109
Thuiller, W., Guéguen, M., Renaud, J., Karger, D. N., and Zimmermann, N. E. (2019). Uncertainty in ensembles of global biodiversity scenarios. Nat. Commun. 10:1446. doi: 10.1038/s41467-019-09519-w
Tramblay, Y., Ruelland, D., Somot, S., Bouaicha, R., and Servat, E. (2013). High-Resolution Med-CORDEX regional climate model simulations for hydrological impact studies: a first evaluation of the ALADIN-Climate model in morocco. Hydrol. Earth System Sci. 17, 3721–3739. doi: 10.5194/hess-17-3721-2013
Treurnicht, M., Pagel, J., Tonnabel, J., Esler, K. J., Slingsby, J. A., and Schurr, F. M. (2020). Functional traits explain the hutchinsonian niches of plant species. Global Ecol. Biogeography 29, 534–545. doi: 10.1111/geb.13048
UNEP-WCMC, and IUCN (2021). Protected Planet: The World Database on Protected Areas (WDPA) and World Database on Other Effective Area-Based Conservation Measures (WD-OECM). Cambridge: UNEP-WCMC.
Watson, J. E. M., Dudley, N., Segan, D. B., and Hockings, M. (2014). The performance and potential of protected areas. Nature 515, 67–73. doi: 10.1038/nature13947
Watson, J. E. M., Shanahan, D. F., Di Marco, M., Allan, J., Laurance, W. F., Sanderson, E. W., et al. (2016). Catastrophic declines in wilderness areas undermine global environment targets. Curr. Biol. 26, 2929–2934. doi: 10.1016/j.cub.2016.08.049
Wessely, J., Hülber, K., Gattringer, A., Kuttner, M., Moser, D., Rabitsch, W., et al. (2017). Habitat-Based conservation strategies cannot compensate for climate-change-induced range loss. Nat. Climate Change 7, 823–827. doi: 10.1038/nclimate3414
Zimmermann, N. E., Edwards, T. C., Graham, C. H., Pearman, P. B., and Svenning, J. C. (2010). New trends in species distribution modelling. Ecography 33, 985–989. doi: 10.1111/j.1600-0587.2010.06953.x
Keywords: conservation, dispersal, habitat suitability, niche modeling, range, range-restricted species
Citation: Semenchuk P, Moser D, Essl F, Schindler S, Wessely J, Gattringer A and Dullinger S (2021) Future Representation of Species’ Climatic Niches in Protected Areas: A Case Study With Austrian Endemics. Front. Ecol. Evol. 9:685753. doi: 10.3389/fevo.2021.685753
Received: 25 March 2021; Accepted: 30 August 2021;
Published: 29 September 2021.
Edited by:
Emily V. Moran, University of California, Merced, United StatesReviewed by:
Martina Treurnicht, Stellenbosch University, South AfricaCopyright © 2021 Semenchuk, Moser, Essl, Schindler, Wessely, Gattringer and Dullinger. This is an open-access article distributed under the terms of the Creative Commons Attribution License (CC BY). The use, distribution or reproduction in other forums is permitted, provided the original author(s) and the copyright owner(s) are credited and that the original publication in this journal is cited, in accordance with accepted academic practice. No use, distribution or reproduction is permitted which does not comply with these terms.
*Correspondence: Philipp Semenchuk, UGhpbGlwcC5zZW1lbmNodWtAdW5pdmllLmFjLmF0; orcid.org/0000-0002-1949-6427
Disclaimer: All claims expressed in this article are solely those of the authors and do not necessarily represent those of their affiliated organizations, or those of the publisher, the editors and the reviewers. Any product that may be evaluated in this article or claim that may be made by its manufacturer is not guaranteed or endorsed by the publisher.
Research integrity at Frontiers
Learn more about the work of our research integrity team to safeguard the quality of each article we publish.