Abstract
Elevation gradients present enigmatic diversity patterns, with trends often dependent on the dimension of diversity considered. However, focus is often on patterns of taxonomic diversity and interactions between diversity gradients and evolutionary factors, such as lineage age, are poorly understood. We combine forest census data with a genus level phylogeny representing tree ferns, gymnosperms, angiosperms, and an evolutionary depth of 382 million years, to investigate taxonomic and evolutionary diversity patterns across a long tropical montane forest elevation gradient on the Amazonian flank of the Peruvian Andes. We find that evolutionary diversity peaks at mid-elevations and contrasts with taxonomic richness, which is invariant from low to mid-elevation, but then decreases with elevation. We suggest that this trend interacts with variation in the evolutionary ages of lineages across elevation, with contrasting distribution trends between younger and older lineages. For example, while 53% of young lineages (originated by 10 million years ago) occur only below ∼1,750 m asl, just 13% of old lineages (originated by 110 million years ago) are restricted to below ∼1,750 m asl. Overall our results support an Environmental Crossroads hypothesis, whereby a mid-gradient mingling of distinct floras creates an evolutionary diversity in mid-elevation Andean forests that rivals that of the Amazonian lowlands.
Introduction
Environmental gradients are commonly associated with trends in diversity, and the elevational diversity gradient (EDG) is one of the most widely discussed and enigmatic patterns in ecology (Humboldt and Bonpland, 1805; Rahbek, 1995; Guo et al., 2013). In the simplest terms, diversity broadly declines with elevation, yet there is substantial variation amongst taxa and across systems, with many non-monotonic and non-linear diversity trends (Rahbek, 1995; Guo et al., 2013). In systems with complex climatic trends superimposed on elevation, such as tropical montane forests (TMF), the EDG is nuanced and not fully understood, particularly at middle elevations (Lieberman et al., 1996; Kessler, 2000; Nottingham et al., 2018). While many investigations of diversity variation focus on taxonomic measures such as, species richness, interest has expanded to include quantification of evolutionary diversity (e.g., Faith, 1992; Dexter et al., 2019), providing potential for a new temporal perspective to the EDG. Possible contrasts between evolutionary diversity and measures of current taxonomic richness have yet to be fully explored in the context of the EDG. Further, the interaction between the EDG and variation in the evolutionary ages of lineages at different elevation is still unclear.
South American TMF provide an excellent context in which to investigate environmental and evolutionary aspects of the EDG. Within TMF, environmental conditions and ecological processes vary substantially with elevation (Sundqvist et al., 2013), many species occupy narrow thermal niches (Perez et al., 2016), and closely related tree lineages tend to occur at similar elevations (Griffiths et al., 2021). In addition, TMFs are globally outstanding centers of endemism and biodiversity (Myers et al., 2000) and provide vital ecosystem services such as regulation of hydrological processes (Bruijnzeel et al., 2011), soil stabilization, and carbon storage (Zimmermann et al., 2010). They also encompass distinctive tropical montane cloud forests, with the cloud-base ecotone representing an understudied ecological phenomenon (Griffiths et al., 2021). A deeper exploration of the evolutionary dimension of the EDG of trees in TMF can provide important context to our ecological understanding of TMFs, as well as the wider spatial organization of diversity.
TMF elevational diversity patterns for plants vary. However, linear decreases with elevation (Gentry, 1988; Vazquez and Givnish, 1998; Jankowski et al., 2013), plateaus (Tiede et al., 2015), and mid-elevation peaks (Kessler, 2000; Girardin et al., 2014), are consistent with wider EDG variation (Rahbek, 1995; McCain and Grytnes, 2010; Guo et al., 2013). The broad influence of climatic factors, such as temperature and precipitation, on diversity trends (Currie, 1991; Currie et al., 2004; Kreft and Jetz, 2007) are likely to be key factors influencing patterns within TMF. However, tolerance to freezing or other factors (Zanne et al., 2014; Segovia et al., 2020), and eco-geographic barriers, such as the subtropical arid belt (Smith et al., 2012; Bacon et al., 2013) are also thought to modulate broad scale spatial variation in diversity. Similarly, along TMF elevation gradients the environmental shifts occurring at the cloud-base ecotone (Bruijnzeel, 2001; Halladay et al., 2012; Fadrique et al., 2018), such as light availability (Fyllas et al., 2017) and precipitation regime (Rapp and Silman, 2012), can influence the distribution patterns of taxa (Griffiths et al., 2021), and as such may interact with the shape of diversity patterns. To our knowledge there has been no substantial consideration of a cloud-base ecotone influence on diversity patterns.
Integration of an evolutionary dimension into our understanding of spatial variation in diversity has found a fertile testing ground in the warm-to-cool thermal gradients of latitude and elevation. The Tropical Niche Conservatism (TNC) (Wiens and Donoghue, 2004) and Out of the Tropics (OTT) (Jablonski et al., 2006) hypotheses suppose a warm-tropical ancestral origin for the angiosperm clade (Crane et al., 1995). TNC supposes niche conservatism of warm-tropical ancestral characteristics with recent and infrequent dispersal of lineages into cool climates, resulting in higher species richness, evolutionary diversity, and older clade ages in present tropical climates (Wiens and Donoghue, 2004; Holt, 2009). OTT, or Out of the Tropical Lowlands (OTL) in the context of tropical elevation gradients (Qian and Ricklefs, 2016), proposes niche convergence and random, early dispersal into cooler climates followed by slow diversification, resulting in a predominance of older lineages in cool climates, with lower evolutionary relatedness among lineages present and relatively higher evolutionary diversity (Jablonski et al., 2006; Qian and Ricklefs, 2016). Observations to date provide mixed support for the TNC, OTT, and OTL hypotheses: latitudinal decreases in evolutionary diversity (Kerkhoff et al., 2014) and angiosperm family ages (Hawkins et al., 2011; Romdal et al., 2013) have been reported, but also an increase in basal−weighted phylogenetic beta diversity to high latitudes (McFadden et al., 2019). Evolutionary diversity has been found to decrease with elevation in tropical montane forest (Bergamin et al., 2020), but also to increase along with increasing family age (Qian et al., 2014; Tiede et al., 2015).
Perspectives beyond the TNC and OTT/OTL hypotheses have also been explored. For example, biome affiliation and climate may be the key determinants of evolutionary diversity trends in woody plants (Rezende et al., 2017), while the Environmental Crossroads (EC) hypothesis suggests that intermediate conditions along environmental gradients should support the highest diversity due to coexistence of distinct evolutionary lineages from gradient extremes (Neves et al., 2020). The EC hypothesis has yet to be applied to EDGs. By weighing the expectations of the EC hypothesis against predictions of decreases in evolutionary diversity and mean lineage age with elevation (TNC), or increase in evolutionary diversity and mean lineage age with elevation (OTL), we can gain greater insight into the EDG in TMF.
In this paper, we explore the taxonomic and evolutionary diversity of trees along a large Amazon-to-Andes tropical montane forest elevation gradient. While we do not aim to consider patterns of phylogenetic community structure, we do integrate a deeper evolutionary perspective through the analysis of lineage age trends. Framed by the context of broad scale diversity trends predicted by the TNC, Out of the Tropical Lowlands, and Environmental Crossroads hypotheses, our analyses aim to address three core questions: (1) What is the shape of the EDG within tropical montane forest? (2) Do elevational trends of taxonomic and phylogenetic diversity differ along this gradient? (3) Is there elevational variation in lineage age patterns along this gradient?
Materials and Methods
Study Site and Plot Inventories
We utilize plot census data for all woody stems ≥ 10 cm diameter at breast height (130 cm above the ground; DBH) in a network of 23 one-hectare forest plots located along an Amazon-to-Andes elevation gradient spanning 425–3625 m asl. This plot network was established and is maintained by the Andes Biodiversity and Ecosystem Research Group (ABERG)1 and is centered on the Kosñipata valley on the edge of Manu National Park in south-eastern Peru. Given numerous indeterminate species identifications, all analyses presented here were conducted at the genus-level.
From lowland/sub-montane forests at 425 m asl, up to the tropical montane treeline at 3,625 m, the gradient encompasses large variation in habitat and environmental variables (Girardin et al., 2010). The cloud-base ecotone at around 1,500–2,000 m asl marks the lower limit of the tropical montane cloud forest (Girardin et al., 2010; Rapp and Silman, 2012), with a characteristic cloud immersion which reaches peak frequency between 2,000 and 3,500 m asl (Halladay et al., 2012). Along the gradient, mean annual temperatures range from c.24°C at low elevations, to c.9°C at higher elevation (Malhi et al., 2017). Mean total annual precipitation follows a non-linear trend from c.3,000 mm yr–1 at low elevations to a peak c.5,000 mm yr–1 at around 1,000 m asl before declining monotonically to c.1,000 mm yr–1 at the very highest elevations (Rapp and Silman, 2012), though precipitation exceeds potential evapotranspiration at all elevations. The edaphic character of this gradient is complex and varies non-linearly (Zimmermann et al., 2010; Nottingham et al., 2015).
Taxonomic and Phylogenetic Diversity
We quantified taxonomic diversity in terms of genus richness, the number of genera in each plot. We quantified three metrics of phylogenetic diversity for each plot, using a temporally calibrated phylogeny (Figure 1), based on matK and rbcL sequences, representing 275 angiosperm, gymnosperm, and tree fern genera, and published in Griffiths et al. (2021). (1) Faith’s phylogenetic diversity (PD), the sum of all the branch lengths of a phylogeny for taxa in a community, including the root branch (Faith, 1992). PD is weighted toward diversity in recent evolutionary time (Dexter et al., 2019). (2) The standard effect size of phylogenetic diversity (sesPD), which is obtained by comparing the observed phylogenetic diversity versus. expected phylogenetic diversity. Expected diversity is estimated by random shuffling of the phylogeny tips. Positive values of sesPD indicate greater phylogenetic diversity than expected given species richness, negative values indicate less diversity than expected. (3) time-integrated lineage diversity (TILD) which evenly weights phylogenetic diversity across recent and deep evolutionary time and is calculated by integrating the area under a lineage through time plot (sensuYguel et al., 2016), after log-transforming the y-axis, or the number of lineages at each time point (Dexter et al., 2019). PD and sesPD were calculated using the “picante” package (Kembel et al., 2010), TILD was calculated using a new R function (Dexter et al., 2019; Supplementary Material).
FIGURE 1
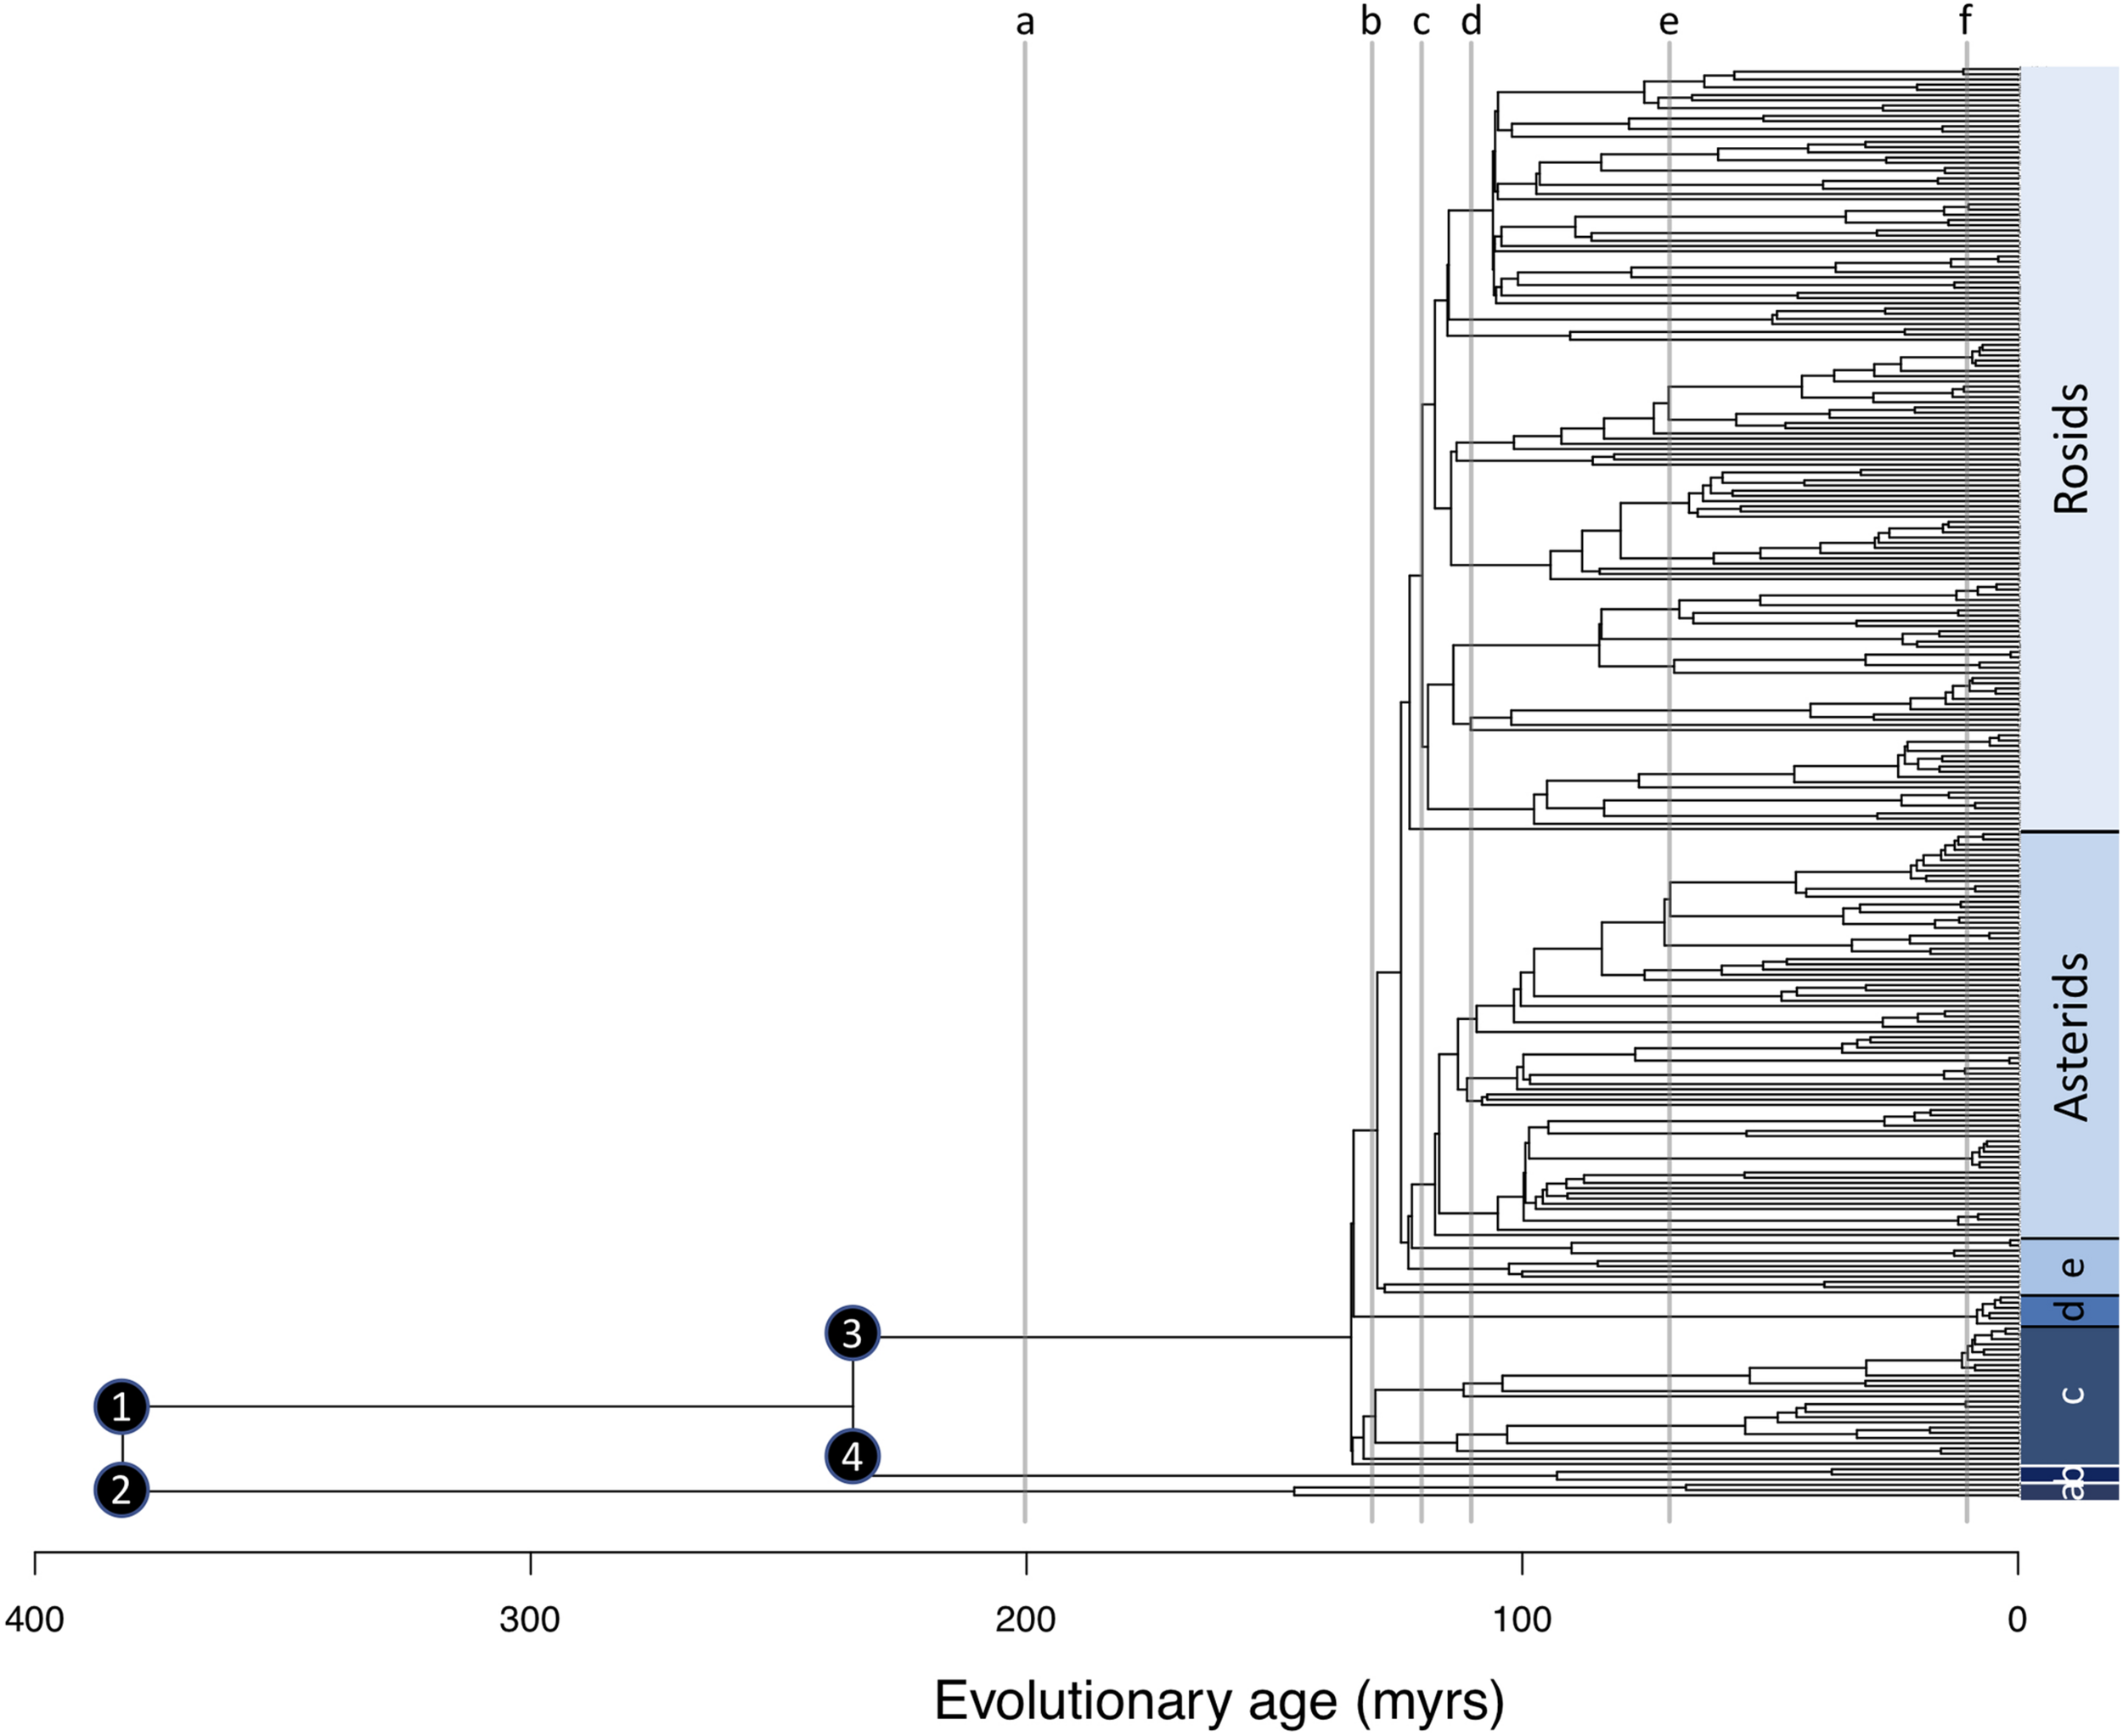
Genus level phylogeny for 275 genera occurring across 23 plots along an elevation gradient from 425 to 3,625 m asl. Numbered nodes relate to lineages mentioned in the text: 1 = seed plants, 2 = tree ferns, 3 = angiosperms, 4 = gymnosperms. Gray vertical lines relate to evolutionary depths of 10, 70, 110, 120, 130, and 200 myrs with letters relating to the panels presented in Figure 3. Major lineages are indicated in a bar on the right where a = tree ferns, b = gymnosperms, c = Magnoliids and Hedyosmum, d = Monocots, and e = basal Eudicots.
To ensure comparability, all diversity metrics were calculated on data subset to the 275 genera in our phylogeny. There is large variation in the number of individual stems sampled across plots for our phylogenetic subset (min = 320, max = 1,509), and richness is influenced by sample size (Colwell et al., 2012). Therefore, before calculation of richness metrics, we rarefied plot data to 320 individual stems per plot, as this was the lowest number of stems recorded among plots in our phylogenetic subset. We conducted 100 rarefactions and from these calculated the mean of each metric for each plot. Some genera are present in plots but not in the phylogeny (n = 26). Therefore, to check genus richness calculated from the phylogenetic subset is representative, we correlated the rarefied genus richness of our phylogenetic subset with the rarefied genus richness of data for all genera (rarefied to 459 individuals per plot, the lowest number of individuals in a plot for the full dataset). Rarefactions were conducted using the “rrarefy” function in the “vegan” package (Oksanen et al., 2018). We then conducted pairwise correlations of the metrics, based on Spearman’s rank correlation coefficient.
We applied linear, quadratic, and breakpoint regression models to identify which pattern best describes the elevational richness gradient for each metric. Linear and quadratic regression were conducted using the “lm” function in the R package stats (R Core Team, 2018). Breakpoint regressions were conducted using the “segmented” function in the R package segmented (Muggeo, 2008). The model with the best fit was established based on a comparison of adjusted R2 values. Due to the potentially strong influence of the long branch lengths leading to tree ferns and gymnosperm, all analyses were repeated excluding these lineages and considering only angiosperms.
Evolutionary Age Patterns
We further investigated the evolutionary dimension of the observed diversity patterns by considering the elevational distribution trends of lineages at different evolutionary depths. Evolutionary depths here represent lineage age time slices on our temporally calibrated phylogeny for every 10 million years from the present day to 382 million years old—our age estimate for the split between seed plants and ferns (Silvestro et al., 2015). This does not reflect an ancestral range reconstruction, but rather the present distribution of lineages at different evolutionary depths. We calculated the number of lineages and elevational range of each lineage for each 10-million-year time slice. We additionally calculated which elevations are occupied by the highest number of lineages at each 10-million-year time slice. As an illustration, at an evolutionary depth of 200 million years, there are a total of three lineages in our phylogeny. One branch leading to all angiosperms, one branch leading to all gymnosperms, and one branch leading to all tree ferns. In terms of present elevational range, angiosperms occur from 425 to 3,625 m asl, gymnosperms occur from 1,250 to 3,000 m asl, and tree ferns occur from 800 to 3,450 m asl. Thus, the maximum lineage diversity for an evolutionary depth of 200 million years is found between 1,250 and 3,000 m asl, where all three lineages are present, while outside this range there are only one or two lineages at this evolutionary depth.
Results
Taxonomic and Phylogenetic Richness
Across all 23 plots, excluding individuals not identified to genus (n = 458), a total of 20,926 individuals were recorded, belonging to 301 genera and 100 families. The most abundant genera were Cyathea (2,410 individuals), Weinmannia (1,843 individuals), and Miconia (1,530 individuals). Based on the raw data, the highest generic richness occurs in plot SPD-02 at 1,500 m asl, with a total of 109 genera. After 100 rarefactions, accounting for the effect of variation in stem density, the highest generic richness remains in plot SPD-02, at 1,500 m asl (mean = 78 genera SD = 3.8; Figure 1a). After 100 rarefactions, the highest mean values for phylogenetic richness metrics occur in plot SAI-01 at 1,500 m asl for PD (mean = 6,227 myrs, SD = 288; Figure 1b), plot TRU-01 at 3,450 m asl for sesPD (mean = 1.93, SD = 0.23; Figure 1c), and plot SAI-01 at 1,500 m asl for TILD (mean = 663 [log(myrs)], SD = 33; Figure 1d).
Pairwise correlations show that all metrics, with the exception of sesPD with TILD, display significant positive or negative correlations with each other. Genus richness has a positive correlation with PD (rho = 0.91, p < 0.001), a positive correlation with TILD (rho = 0.54, p < 0.01), and a negative correlation with sesPD (rho = −0.66, p < 0.001). PD is negatively correlated with sesPD (rho = −0.5, p < 0.05), and positively correlated with TILD (rho = 0.76, p < 0.001). sesPD and TILD are not correlated (rho = 0.04, p > 0.05). Further, rarefied genus richness based on our phylogenetic subset in highly correlated with rarefied genus richness for all genera (rho = 1, p < 0.001), suggesting genus richness calculated based on our phylogenetic subset is representative of the complete genera data.
Despite these pairwise correlations, the elevational patterns for the different richness metrics differ in terms of the best fitting model (Table 1). The elevational pattern of genus richness is best described by a breakpoint regression (adjusted R2 = 0.9), though the amount of variation explained by this model is not markedly better than a linear regression (adjusted R2 = 0.87) or quadratic regression (adjusted R2 = 0.87). The genus richness of plots is relatively constant up until an estimated breakpoint at 1,383 m asl (± 294 m), above which genus richness decreases with elevation (Figure 2A). A break point regression also provides the best fit for the elevational pattern of PD (adjusted R2 = 0.94); PD increases up to an estimated breakpoint at 1,410 m asl (± 129m), and then decreases with elevation (Figure 2B). The pattern of sesPD across elevation (Figure 2C) is best described by a quadratic regression model (adjusted R2 = 0.75). TILD follows a hump-shaped pattern across elevation (Figure 2D), with a quadratic regression giving the best fit to the data (adjusted R2 = 0.77). These results are not notably different when considering only angiosperm lineages, though the mid-elevation peak for evolutionary diversity metrics is less pronounced.
TABLE 1
| Linear regression | Quadratic regression | Breakpoint regression | ||||
| Adjusted R2 | p-value | Adjusted R2 | p-value | Adjusted R2 | p-value | |
| Genus richness | 0.87 | <0.001 | 0.87 | <0.001 | 0.89 | N/A |
| PD | 0.81 | <0.001 | 0.89 | < 0.001 | 0.94 | N/A |
| sesPD | 0.46 | <0.001 | 0.75 | <0.001 | 0.73 | N/A |
| TILD | 0.19 | 0.022 | 0.77 | <0.001 | 0.66 | N/A |
Comparison of regression model fits for elevational patterns of genus richness, phylogenetic diversity (PD), standardized effect size phylogenetic diversity (sesPD), and time-integrated lineage diversity (TILD).
Numbers in bold indicate highest model R2 value for each diversity measure.
FIGURE 2
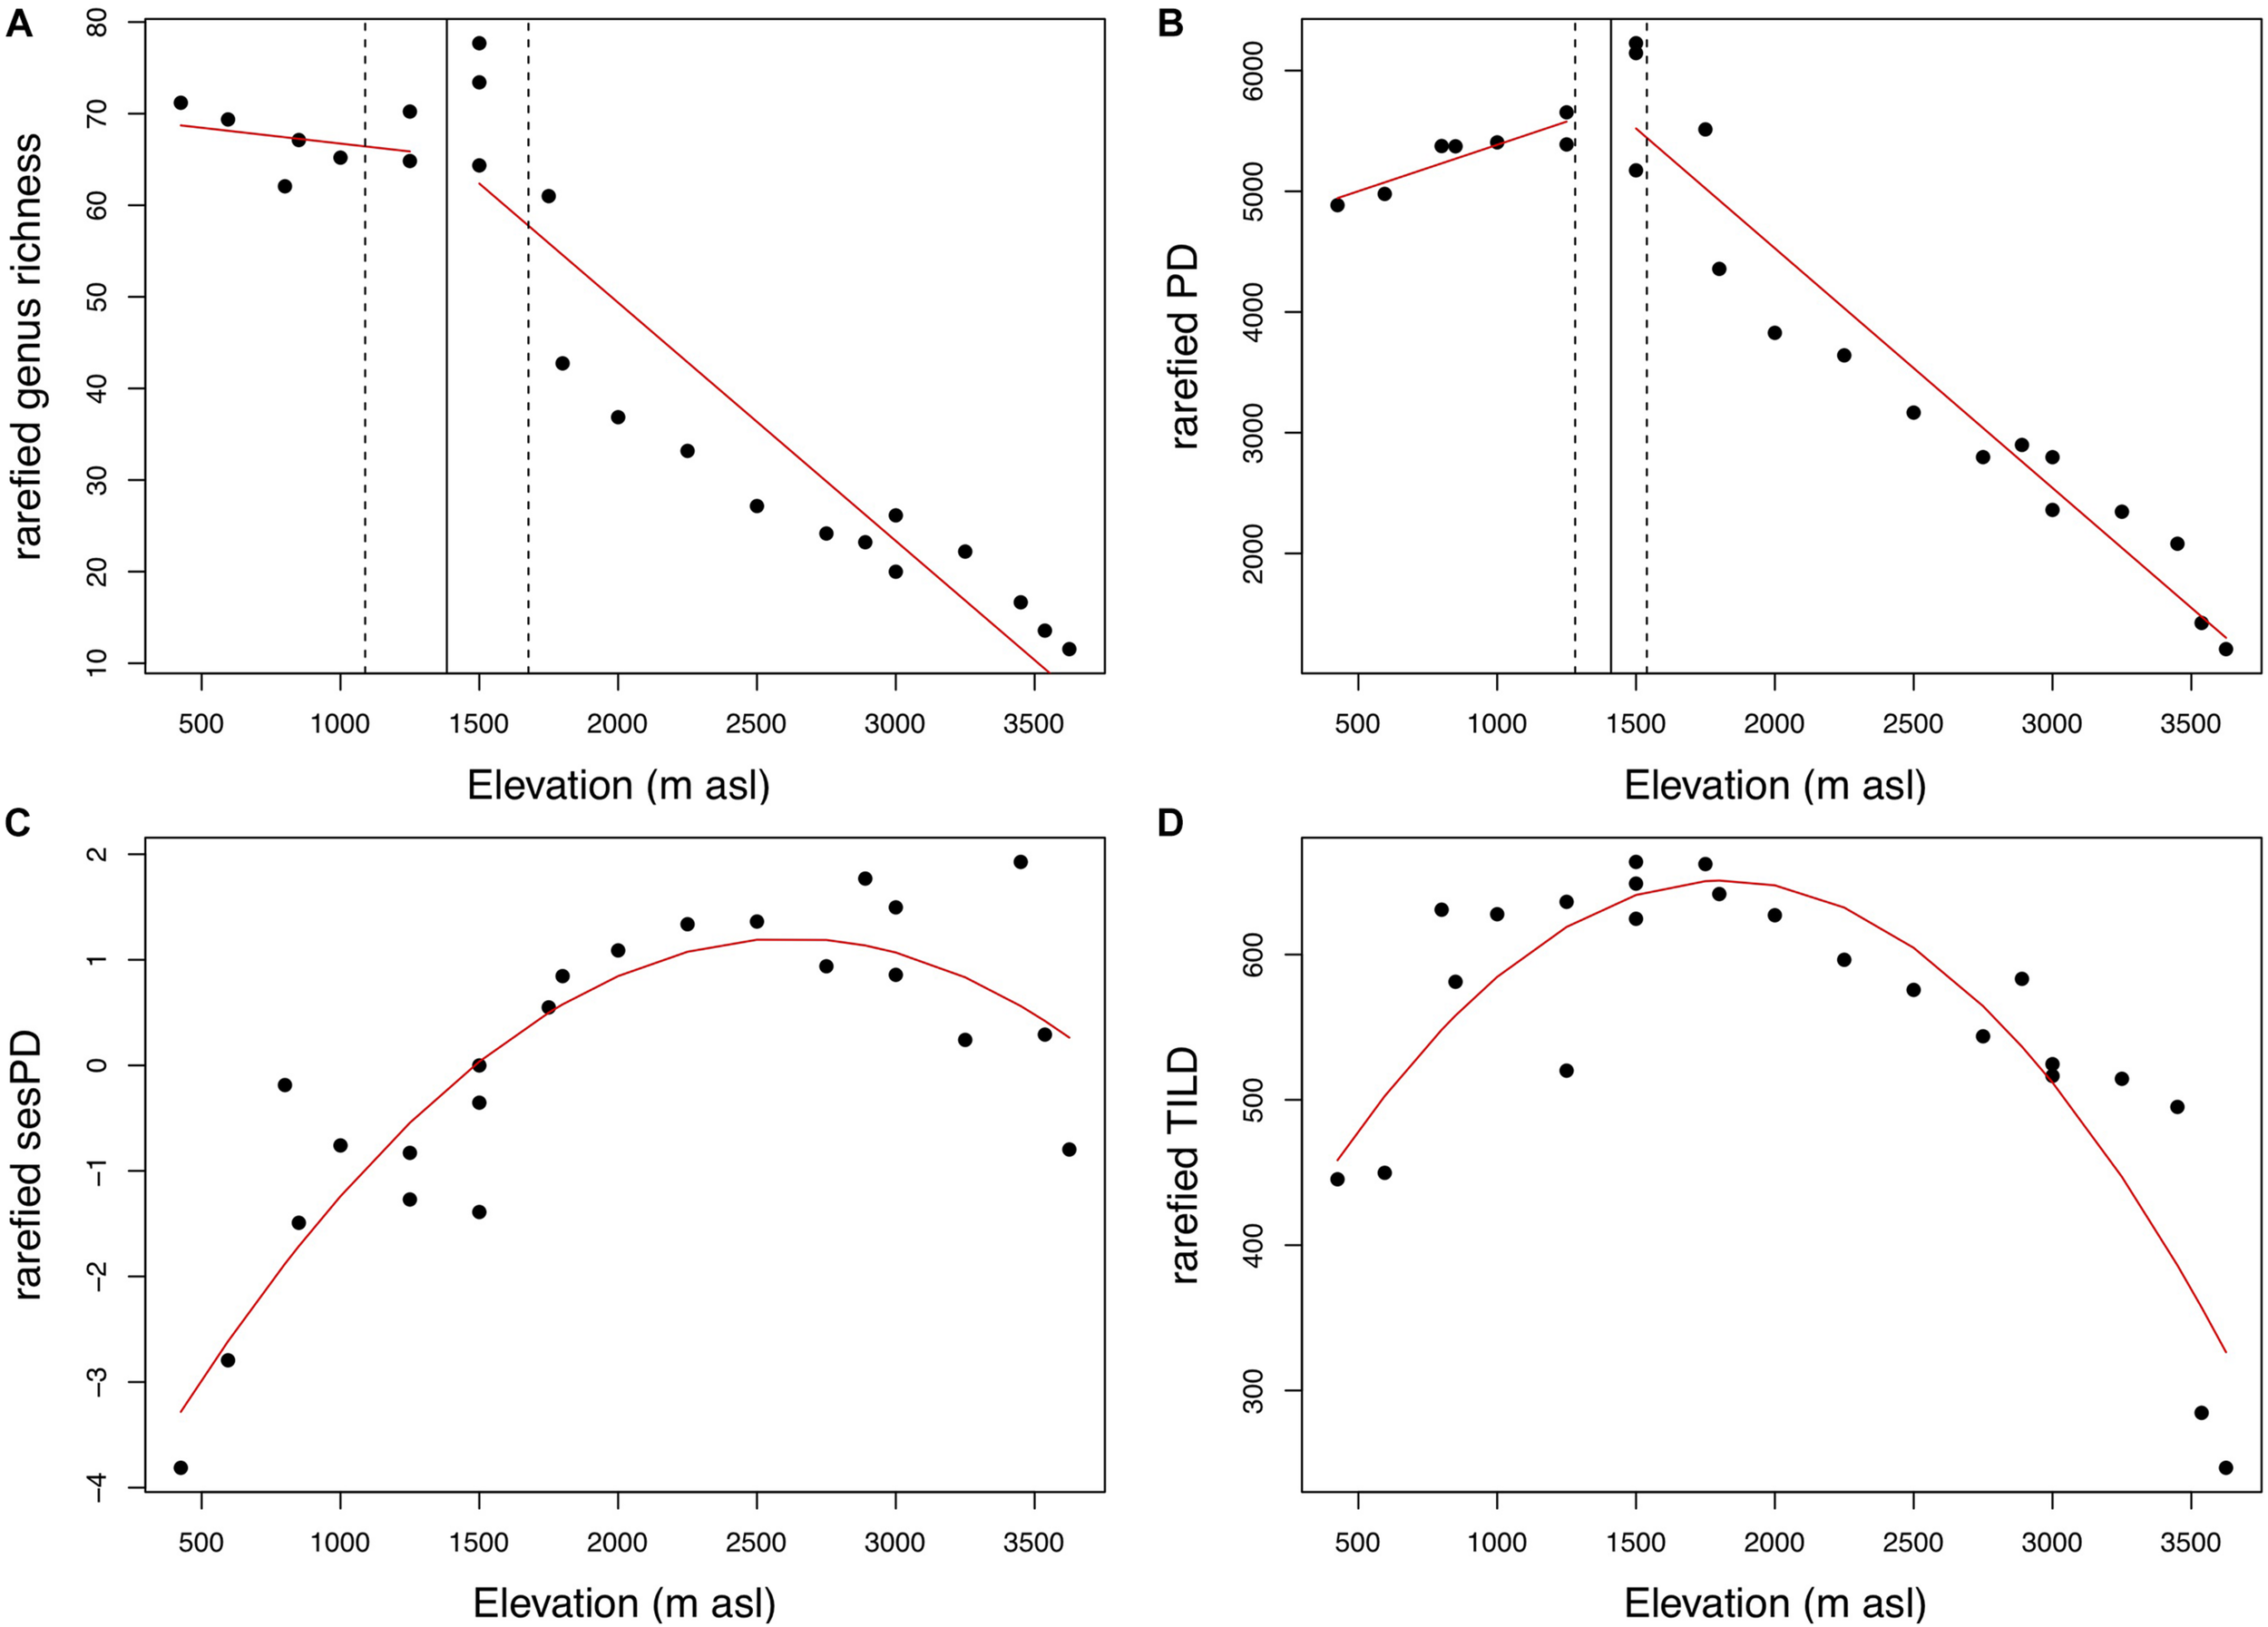
The shape of the elevational richness gradient varies between metrics. (A) Genus richness and (B) phylogenetic diversity (PD) are best described by breakpoint regression models. (C) Standardized effect size phylogenetic diversity (sesPD) and (D) time integrated lineage diversity (TILD), are best described by quadratic regression models. Points are mean rarefied metric values for each plot. Red lines represent regression lines from the best fitting model for each metric. For figures a and b, the solid vertical line indicates the estimated breakpoint, with respective standard error represented by vertical dashed lines.
Evolutionary Age Patterns
Only extant lineages are included in our phylogeny. Therefore, the number of lineages at different evolutionary depths necessarily increases from two 382 million years old lineages (1 lineage leading to tree ferns, 1 lineage leading to seed plants), to 275 modern lineages, equal to the total number of genera in plots that are present in our phylogeny (Figure 1). The pattern of elevational range distribution of lineages and peak in number of lineages varies at different evolutionary depths (Table 2 and Figure 3). The highest number of younger lineages is found at lower elevations, with many younger lineages restricted to lower elevations. Older lineages are more prevalent at mid-elevations. Fewer older lineages are restricted to lower elevations and a greater percentage extend to higher elevations.
TABLE 2
| Evolutionary depth (myrs) | Total no. lineages | No. lineages only <1,750 m asl | No. lineages only >1,750 m asl | Elevation of peak lineage richness (m asl) | No. lineages at richness peak |
| 10 | 238 | 125 | 17 | 1,300–1,500 | 117 |
| 70 | 101 | 33 | 9 | 1,300–1,500 | 65 |
| 110 | 30 | 4 | 1 | 1,300–1,500 | 27 |
| 120 | 16 | 1 | 1 | 1,300–1,900 | 13 |
| 130 | 8 | 0 | 1 | 1,500–2,000 | 7 |
| 200 | 3 | 0 | 0 | 1,300–3,000 | 3 |
Summary of lineage elevational range trends and richness at six illustrative evolutionary depths.
FIGURE 3
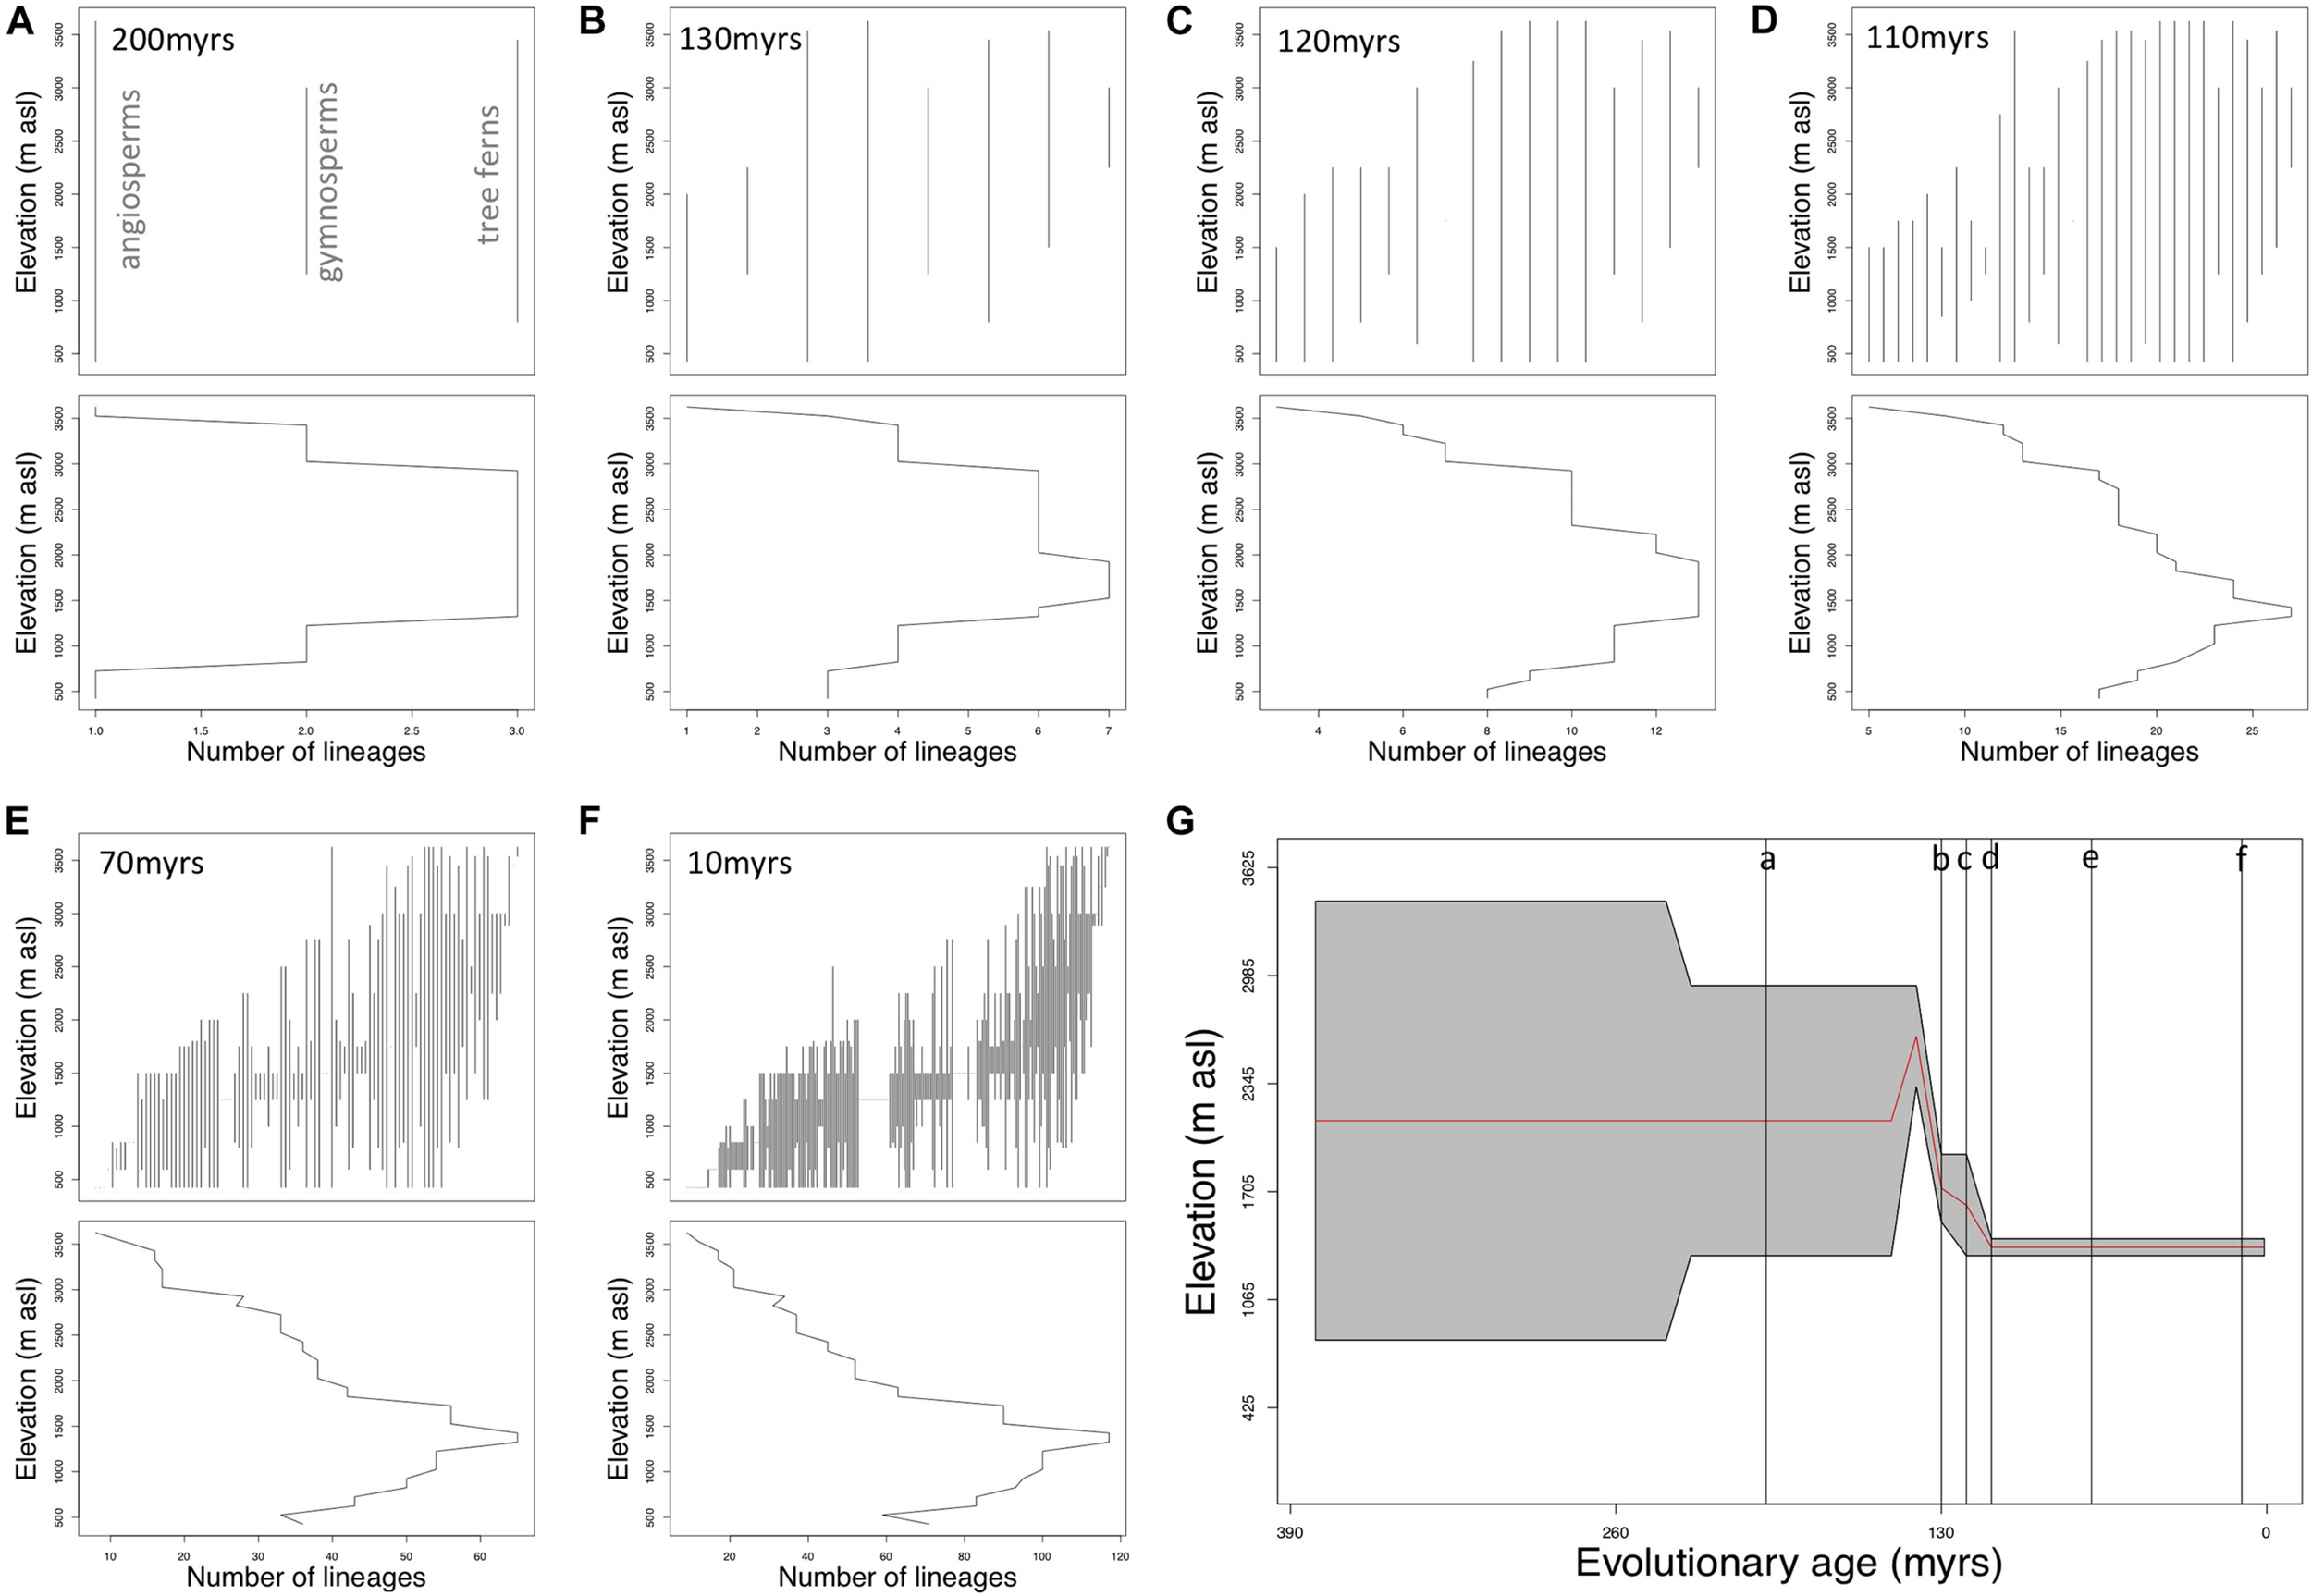
(A–F) Illustrate how evolutionary age structure varies across elevation and at six notable evolutionary depths (A) 200 myrs, (B) 130 myrs, (C) 120 myrs, (D) 110 myrs, (E) 70 myrs, and (F) 10 myrs. Within each panel, the upper plot illustrates the elevational ranges of lineages. Vertical lines represent each individual lineage present at the respective evolutionary depth. Lower plots represent the number of lineages (x-axis) across elevation (y-axis) at each of the size evolutionary depths. (G) Illustrates how the elevations at which lineage richness is most numerous changes across different evolutionary depths. The gray shaded area represents the elevations most numerous in lineages across evolutionary depths. The red line illustrates mean elevation of the peak number of lineages. Vertical gray lines in (G) with letters relate to (A–F).
Six illustrative evolutionary time slices are presented in Table 2 and Figure 3. These time slices were chosen to capture the main points of variation across the evolutionary depth of our phylogeny. For example, at an evolutionary depth of 10 myrs (Figure 3F), there are 238 lineages that presently occur along the elevation transect. One-hundred and twenty-five of those lineages do not presently occur above 1,750 m asl, the mid-point of our cloud-base ecotone estimate. Seventeen lineages at 10 myrs evolutionary depth only occur above 1,750 m asl. The peak in the number of 10 myr old lineages (n = 117) is between 1,300 and 1,500 m asl (Figures 3F,G). Data for each 10-million-year time slices is presented in Supplementary Material.
Discussion
Our results demonstrate a discernible contrast between patterns of taxonomic and phylogenetic diversity of trees along an Amazon-to-Andes elevation gradient. Average genus richness is essentially invariant with elevation below 1,383 m asl (± 294 m) but decreases with elevation above this point. Evolutionary richness metrics peak at mid-elevations, a pattern driven by a greater number of older lineages at mid to high elevations, and many more-recently diverged lineages failing to occur above 1,500–1,750 m asl. These findings do not match the linear expectations of the TNC or Out of the Tropical Lowlands (OTL) hypotheses. The observed prevalence of older lineages at higher elevations is anticipated by the OTL hypothesis, but our findings are most closely aligned with the Environmental Crossroads hypothesis (EC; Neves et al., 2020), which predicts the highest levels of evolutionary diversity at intermediate environmental conditions.
The observed trend in genus richness—a relatively invariant pattern up to mid-elevations and then steep diversity decline above that (Figure 2A)—matches previous species-level trends reported for this gradient (Jankowski et al., 2013), and is consistent with patterns in neo TMF more broadly (Gentry, 1988; Vazquez and Givnish, 1998), though these reports have sometimes been incorrectly interpreted as linear decreases. Many factors, such as richness-area effects (MacArthur and Wilson, 1963; Rosenzweig, 1995), the association between environmental heterogeneity and richness (Kreft and Jetz, 2007; Antonelli et al., 2018), and a non-linear precipitation gradient (Rapp and Silman, 2012), are likely to modulate the observed equivalence of low elevation and mid-elevation taxonomic richness; additional research will be needed to tease apart the contributions of these different factors.
Contrasting the trend in taxonomic richness, the evolutionary diversity metrics PD and TILD both show increasing diversity up to mid-elevations, followed by a subsequent decrease toward higher elevations. A similar peak in evolutionary diversity at mid-elevations has recently been reported in Tropical Andean forests in Colombia (González-Caro et al., 2020). In our data, PD displays a distinct mid elevation peak between c.1,300–1,500 m asl (Figure 2B); TILD follows a more gradual hump-shaped pattern across elevation, with the highest values observed across a broad range of intermediate elevations (Figure 2D). TILD values only drop markedly at the extremes of the elevational gradient. The elevational pattern for sesPD is a non-linear increase with elevation with a decrease at the highest elevations sampled (Figure 2C). However, it has been suggested that variation in standardized phylogenetic diversity metrics may be an artifact of variation in taxonomic richness (Sandel, 2018) and that sesPD may be a poor estimator of the richness dimension of diversity (Tucker et al., 2017; Dexter et al., 2019). These results must be put in the context of an analysis focused on trees. Given some lineages encompass multiple forms, studies incorporating life forms, such as lianas or shrubs, may find different patterns.
The nuanced variation observed between PD and TILD is likely to be associated with the way each metric weights the different evolutionary depths. TILD gives equal weight to diversity across all the evolutionary depths of a phylogeny, while PD gives greater weight to more-recently diverged lineages (Dexter et al., 2019). Basically, the contrast in results between TILD and PD show that older evolutionary lineages (picked up by TILD, but not represented well by PD) are present across a broad range of elevations and only really drop out at the extremes of the gradient.
Our exploration of patterns in evolutionary age of tree lineages across elevation reveals further trends. The tendency for older lineages to be found at mid and high elevations, and younger lineages to be found at lower elevations, is demonstrated by the changing number, and distribution pattern, of lineages at different evolutionary depths (Figures 3A–F). The elevational ranges of lineages at younger evolutionary depths (Figures 3E,F) indicate that for example, 53% of the lineages (n = 125) that are 10 million years old are not found above 1,750 m asl, and 33% of lineages (n = 33) that are 70 million years old, are not found above 1,750 m asl. This pattern in many younger lineages could reflect a lowland tropical origin and failure to adapt to environmental conditions at higher elevations. At older evolutionary depths, though older lineages do occur at lower elevations, fewer are restricted there and a greater percentage extend to higher elevations. For example, just 13% (n = 4) of lineages that are 110 million years old are restricted below ∼1,750 m asl, and no lineages older than 130 million years are restricted to a distribution below 1,750 m asl. Between evolutionary depths of 110 and 130 million years, there is a discernible shift in the elevation with the peak number of lineages. For lineages that are 130 million years old, the highest number of lineages occurs between 1,500 and 2,000 m asl, but for lineages that are 110 million years old the elevation where the highest number of lineages occur is lower, between 1,300 and 1,500 m asl (Figure 3G).
The prevalence of older lineages at mid and high elevations, combined with the restriction of many young lineages to lower elevations, is consistent both with expectations of the OTL hypothesis (Qian and Ricklefs, 2016) and previous findings suggesting a positive association between elevation and lineage age, as quantified by mean family ages (Segovia and Armesto, 2015; Tiede et al., 2015; Qian and Ricklefs, 2016). However, we suggest that our analysis based on phylogenetic depth may be more evolutionarily meaningful than previously utilized family ages, which are based on relatively subjective taxonomic circumscription of families.
Integrating lineage age into our understanding of the EDG clearly demonstrates the biodiversity significance of mid-elevation TMF. However, variation in evolutionary age trends across elevation is not, in and of itself the driver of the diversity trend. The observation of highest evolutionary diversity in mid-elevation TMF may be explained by the meeting of distinct evolutionary floras at the intermediate region of an environmental gradient as posited by the EC hypothesis (Neves et al., 2020). This explanation is supported by the occurrence of a tropical montane flora that is evolutionarily distinct to that found in the lowlands (Segovia and Armesto, 2015; Griffiths et al., 2021) as has also been suggested for Andean forests in Colombia (González-Caro et al., 2020). Further, TMF appear to comprise a unique tree flora that is also evolutionarily distinct from the more temperate affiliated tree flora found at the highest Andean elevations (Segovia et al., 2020).
Along this Amazon-to-Andes gradient, an environmental crossroads type process may also intersect with the presence of the cloud-base ecotone at mid-elevations around 1,500–2,000 m asl (Halladay et al., 2012; Rapp and Silman, 2012; Fadrique et al., 2018). Ecotonal transitions may represent areas of high diversity (Odum, 1971; Risser, 1995; Kernaghan and Harper, 2001; Silva-Pereira et al., 2020) with the possible influence of mass effects, where individuals are able to occur in marginal habitat on the edge of their species’ core range (Shmida and Wilson, 1985). Moreover, ecotones may actually act as generators of diversity (Moritz et al., 2000). Although this has yet to be explicitly tested, the cloud-base ecotone, with its environmental transitions, could represent a “leaky barrier” influencing the mixing of representatives from both the tropical montane flora above, and the lowland flora below, and providing a boost to evolutionary diversity.
While the cloud-base ecotone may play some part in the shape of the TMF EDG, other processes may be of stronger and broader influence. Historical processes, such as Andean uplift are recognized as of broad influence on the biogeographic patterns of the South American flora (Antonelli et al., 2009). The evolutionary ages of many lineages at higher elevations substantially exceeds the relatively recent uplift of the Andes (Graham, 2009) and fits suggestions that colonization by older lineages, preadapted to extratropical environments, likely played an important role in the assembly of TMF communities (Gentry, 1982; Segovia and Armesto, 2015). Mid-elevation TMF may represent the region where these colonizing lineages mix with those taxa from lowland Amazonian communities that adapted to a cooler climate during the Pleistocene, and reach their elevational limit around 1,700 m asl (Silman, 2007).
The shape of the EDG for trees clearly depends upon the dimension of diversity that is quantified. Our results demonstrate clear contrasts between taxonomic and evolutionary patterns of alpha diversity, as well as variation across different evolutionary depths. The high values of evolutionary diversity at mid-elevations support the Environmental Crossroads hypothesis (Neves et al., 2020) more strongly than competing hypotheses, and we argue that our observations support the hypothesized mixing of evolutionarily distinct tropical montane and tropical lowland floras at mid-elevations. Given the potential impact of environmental changes, such as a shift in cloud-base dynamics under climate change (Helmer et al., 2019), broader acknowledgment of this globally unique diversity is urgent. Lowland Amazonia has historically been considered as containing the most diverse forests on the planet (Henderson et al., 1991), yet as revealed here, lowland richness is rivaled by that of mid-elevation montane forests, especially when factoring in the full evolutionary depth of lineages.
Publisher’s Note
All claims expressed in this article are solely those of the authors and do not necessarily represent those of their affiliated organizations, or those of the publisher, the editors and the reviewers. Any product that may be evaluated in this article, or claim that may be made by its manufacturer, is not guaranteed or endorsed by the publisher.
Statements
Data availability statement
Publicly available datasets were analyzed in this study. This data is provided in Supplementary Material for Griffiths et al. (2021), Biotropica. Including GenBank accession numbers.
Author contributions
AG and KD conceived the manuscript. MS, WF-R, and PM designed and established the plot network. KF, WF-R, KC, and NS contributed to data collection and taxonomic identification. AG, KD, and RS conducted the analyses. Writing of the manuscript was led by AG with input from all co-authors. All authors contributed to the article and approved the submitted version.
Funding
AG was supported by the NERC-E3DTP studentship (grant no. NERC NE/L002558/1) and a grant from the Moss family. PM was supported by NERC (grant no. NE/G018278/1) and ARC (grant no. DP170104091). KF was supported by the US National Science Foundation (grant no. NSF DEB LTREB 1754664). MS was supported by NSF DEB LTREB (grant no. 1754647). Andes Biodiversity and Ecosystem Research Group (ABERG) tree plots were funded by the Gordon and Betty Moore Foundation Andes-Amazon Program, ForestPlots, and US National Science Foundation LTREB grant no. 1754647.
Acknowledgments
This manuscript is a product of the Andes Biodiversity and Ecosystem Research Group (ABERG). We thank the administration and staff of Manu National Park, the Peruvian Protected Areas Service (SERNANP) for logistical support and permission to carry out the work. Special thanks to the hundreds of young Peruvian scientists who have given body and soul to carry out the field work in this forbidding but essential environment. In addition we thank the two reviewers for their contributions toward improving this manuscript.
Conflict of interest
The authors declare that the research was conducted in the absence of any commercial or financial relationships that could be construed as a potential conflict of interest.
Supplementary material
The Supplementary Material for this article can be found online at: https://www.frontiersin.org/articles/10.3389/fevo.2021.680041/full#supplementary-material
Footnotes
References
1
AntonelliA.KisslingW. D.FlantuaS. G. A.BermúdezM. A.MulchA.Muellner-RiehlA. N.et al (2018). Geological and climatic influences on mountain biodiversity.Nat. Geosci.11718–725. 10.1038/s41561-018-0236-z
2
AntonelliA.NylanderJ. A. A.PerssonC.SanmartinI. (2009). Tracing the impact of the Andean uplift on Neotropical plant evolution.Proc. Natl. Acad Sci.1069749–9754. 10.1073/pnas.0811421106
3
BaconC. D.MoraA.WagnerW. L.JaramilloC. A. (2013). Testing geological models of evolution of the Isthmus of Panama in a phylogenetic framework.Bot. J. Linn. Soc.171287–300. 10.1111/j.1095-8339.2012.01281.x
4
BergaminR. S.SegerG. D. S.CarlucciM. B.MolzM.MelloR. S. P.MartinsR.et al (2020). Elevational shifts in phylogenetic diversity of angiosperm trees across the subtropical Brazilian Atlantic Forest.Austral Ecol.46:12996. 10.1111/aec.12996
5
BruijnzeelL. A. (2001). Hydrology of tropical montane cloud forests: A Reassessment.Land Use Water Resour. Res.1:1.
6
BruijnzeelL. A.MulliganM.ScatenaF. N. (2011). Hydrometeorology of tropical montane cloud forests: Emerging patterns.Hydrol. Process.25465–498. 10.1002/hyp.7974
7
ColwellR. K.ChaoA.GotelliN. J.LinS.-Y.MaoC. X.ChazdonR. L.et al (2012). Models and estimators linking individual-based and sample-based rarefaction, extrapolation and comparison of assemblages.J. Plant Ecol.53–21. 10.1093/jpe/rtr044
8
CraneP. R.FriisE. M.PedersenK. R. (1995). The origin and early diversification of angiosperms.Nature37427–33. 10.1038/374027a0
9
CurrieD. J. (1991). Energy and large-scale patterns of animal- and plant-species richness.Am. Nat.13727–49. 10.1086/285144
10
CurrieD. J.MittelbachG. G.CornellH. V.FieldR.GuéganJ.-F.HawkinsB. A.et al (2004). Predictions and tests of climate-based hypotheses of broad-scale variation in taxonomic richness.Ecol. Lett.71121–1134. 10.1111/j.1461-0248.2004.00671.x
11
DexterK. G.SegoviaR. A.GriffithsA. R. (2019). Exploring the concept of lineage diversity across north american forests.Forests10:520. 10.3390/f10060520
12
FadriqueB.BáezS.DuqueA.MaliziaA.BlundoC.CarillaJ.et al (2018). Widespread but heterogeneous responses of Andean forests to climate change.Nature564207–212. 10.1038/s41586-018-0715-9
13
FaithD. P. (1992). Conservation evaluation and phylogenetic diversity.Biol. Conserv.611–10. 10.1016/0006-3207(92)91201-3
14
FyllasN. M.BentleyL. P.ShenkinA.AsnerG. P.AtkinO. K.DíazS.et al (2017). Solar radiation and functional traits explain the decline of forest primary productivity along a tropical elevation gradient.Ecol. Lett.20730–740. 10.1111/ele.12771
15
GentryA. (1982). Neotropical floristic diversity: phytogeographical connections between central and south america. pleistocene climatic fluctuations, or an accident of the andean orogeny?Ann. Mo. Bot. Gard.69557–593. 10.2307/2399084
16
GentryA. H. (1988). Changes in plant community diversity and floristic composition on environmental and geographical gradients.Ann. Mo. Bot. Gard751–34. 10.2307/2399464
17
GirardinC. A. J.Farfan-RiosW.GarciaK.FeeleyK. J.JørgensenP. M.MurakamiA. A.et al (2014). Spatial patterns of above-ground structure, biomass and composition in a network of six Andean elevation transects.Plant Ecol. Divers.7161–171. 10.1080/17550874.2013.820806
18
GirardinC. A. J.MalhiY.AragãoL. E. O. C.MamaniM.Huaraca HuascoW.DurandL.et al (2010). Net primary productivity allocation and cycling of carbon along a tropical forest elevational transect in the Peruvian Andes.Glob Change Biol.163176–3192. 10.1111/j.1365-2486.2010.02235.x
19
González-CaroS.DuqueA.FeeleyK. J.CabreraE.PhillipsJ.RamirezS.et al (2020). The legacy of biogeographic history on the composition and structure of Andean forests.Ecology101:e03131. 10.1002/ecy.3131
20
GrahamA. (2009). The Andes: A Geological Overview from a Biological Perspective.Ann. Mo. Bot. Gard.96371–385. 10.3417/2007146
21
GriffithsA. R.SilmanM. R.Farfán RiosW.FeeleyK. J.García CabreraK.MeirP.et al (2021). Evolutionary heritage shapes tree distributions along an Amazon−to−Andes elevation gradient.Biotropica5338–50. 10.1111/btp.12843
22
GuoQ.KeltD. A.SunZ.LiuH.HuL.RenH.et al (2013). Global variation in elevational diversity patterns.Sci. Rep.3:3007. 10.1038/srep03007
23
HalladayK.MalhiY.NewM. (2012). Cloud frequency climatology at the Andes/Amazon transition: 2. Trends and variability.J. Geophys. Res. Atmospheres117:D23103. 10.1029/2012JD017789
24
HawkinsB. A.RodriguezM. A.WellerS. G. (2011). Global angiosperm family richness revisited: Linking ecology and evolution to climate.J. Biogeogr.381253–1266. 10.1111/j.1365-2699.2011.02490.x
25
HelmerE. H.GersonE. A.BaggettL. S.BirdB. J.RuzyckiT. S.VoggesserS. M. (2019). Neotropical cloud forests and páramo to contract and dry from declines in cloud immersion and frost.PLoS One14:e0213155. 10.1371/journal.pone.0213155
26
HendersonA.ChurchillS. P.LuteynJ. L. (1991). Neotropical plant diversity.Nature351:21.
27
HoltR. D. (2009). Bringing the hutchinsonian niche into the 21st century: ecological and evolutionary perspectives.Proc. Nat. Acad. Sci.10619659–19665. 10.1073/pnas.0905137106
28
HumboldtA. V.BonplandA. (1805). Essai sur la géographie des plantes.Whitefish, MT: Kessinger Publishing
29
JablonskiD.RoyK.ValentineJ. W. (2006). Out of the tropics: evolutionary dynamics of the latitudinal diversity gradient.Science314102–106. 10.1126/science.1130880
30
JankowskiJ. E.MerkordC. L.RiosW. F.CabreraK. G.RevillaN. S.SilmanM. R. (2013). The relationship of tropical bird communities to tree species composition and vegetation structure along an Andean elevational gradient.J. Biogeogr.40950–962. 10.1111/jbi.12041
31
KembelS. W.CowanP. D.HelmusM. R.CornwellW. K.MorlonH.AckerlyD. D.et al (2010). Picante: R tools for integrating phylogenies and ecology.Bioinformatics261463–1464. 10.1093/bioinformatics/btq166
32
KerkhoffA. J.MoriartyP. E.WeiserM. D. (2014). The latitudinal species richness gradient in New World woody angiosperms is consistent with the tropical conservatism hypothesis.Proc. Nat. Acad. Sci.1118125–8130. 10.1073/pnas.1308932111
33
KernaghanG.HarperK. A. (2001). Community structure of ectomycorrhizal fungi across an alpine/subalpine ecotone.Ecography24181–188. 10.1034/j.1600-0587.2001.240208.x
34
KesslerM. (2000). Elevational gradients in species richness and endemism of selected plant groups in the central Bolivian Andes.Plant Ecol.149181–193. 10.1023/A:1026500710274
35
KreftH.JetzW. (2007). Global patterns and determinants of vascular plant diversity.Proc. Nat. Acad. Sci.1045925–5930. 10.1073/pnas.0608361104
36
LiebermanD.LiebermanM.PeraltaR.HartshornG. S. (1996). Tropical forest structure and composition on a large-scale altitudinal gradient in costa rica.J. Ecol.84137–152. 10.2307/2261350
37
MacArthurR. H.WilsonE. O. (1963). An equilibrium theory of insular zoogeography.Evolution17:373. 10.2307/2407089
38
MalhiY.GirardinC. A. J.GoldsmithG. R.DoughtyC. E.SalinasN.MetcalfeD. B.et al (2017). The variation of productivity and its allocation along a tropical elevation gradient: A whole carbon budget perspective.New Phytol.2141019–1032. 10.1111/nph.14189
39
McCainC. M.GrytnesJ.-A. (2010). Elevational Gradients in Species Richness. (Hoboken.NJ: John Wiley & Sons, Ltd (Ed.)), 10.1002/9780470015902.a0022548
40
McFaddenI. R.SandelB.TsirogiannisC.Morueta HolmeN.SvenningJ.EnquistB. J.et al (2019). Temperature shapes opposing latitudinal gradients of plant taxonomic and phylogenetic β diversity.Ecol. Lett.221126–1135. 10.1111/ele.13269
41
MoritzC.PattonJ. L.SchneiderC. J.SmithT. B. (2000). Diversification of rainforest faunas: an integrated molecular approach.Ann. Rev. Ecol. Syst.31533–563. 10.1146/annurev.ecolsys.31.1.533
42
MuggeoV. M. (2008). Segmented: An R package to fit regression models with broken-line relationships.R News820–25.
43
MyersN.MittermeierR. A.MittermeierC. G.Da FonsecaG. A. B.KentJ. (2000). Biodiversity hotspots for conservation priorities.Nature403:853. 10.1038/35002501
44
NevesD. M.DexterK. G.BakerT. R.Coelho de SouzaF.Oliveira-FilhoA. T.QueirozL. P.et al (2020). Evolutionary diversity in tropical tree communities peaks at intermediate precipitation.Sci. Rep.10:1188. 10.1038/s41598-019-55621-w
45
NottinghamA. T.FiererN.TurnerB. L.WhitakerJ.OstleN. J.McNamaraN. P.et al (2018). Microbes follow Humboldt: Temperature drives plant and soil microbial diversity patterns from the Amazon to the Andes.Ecology992455–2466. 10.1002/ecy.2482
46
NottinghamA. T.WhitakerJ.TurnerB. L.SalinasN.ZimmermannM.MalhiY.et al (2015). Climate warming and soil carbon in tropical forests: insights from an elevation gradient in the peruvian andes.BioScience65906–921. 10.1093/biosci/biv109
47
OdumE. P. (1971). Fundamentals of ecology (3d ed). Belmont, CA: Thomson Brooks/Cole.
48
OksanenJ.BlanchetF.FriendlyM.KindtR.LegendreP.McGlinnD.et al (2018). Vegan: Community Ecology Package. R package version 2.5-2, 2018.
49
PerezT. M.StroudJ. T.FeeleyK. J. (2016). Thermal trouble in the tropics.Science3511392–1393. 10.1126/science.aaf3343
50
QianH.HaoZ.ZhangJ. (2014). Phylogenetic structure and phylogenetic diversity of angiosperm assemblages in forests along an elevational gradient in Changbaishan.China. J. Plant Ecol7154–165. 10.1093/jpe/rtt072
51
QianH.RicklefsR. E. (2016). Out of the tropical lowlands: latitude versus elevation.Trends Ecol Evol31738–741. 10.1016/j.tree.2016.07.012
52
R Core Team (2018). R: A language and environment for statistical computing.Vienna: R Core Team.
53
RahbekC. (1995). The elevational gradient of species richness: A uniform pattern?Ecography18200–205. 10.1111/j.1600-0587.1995.tb00341.x
54
RappJ.SilmanM. (2012). Diurnal, seasonal, and altitudinal trends in microclimate across a tropical montane cloud forest.Clim. Res.5517–32. 10.3354/cr01127
55
RezendeV. L.DexterK. G.PenningtonR. T.Oliveira-FilhoA. T. (2017). Geographical variation in the evolutionary diversity of tree communities across southern South America.J. Biogeogr.442365–2375. 10.1111/jbi.13013
56
RisserP. G. (1995). The Status of the Science Examining Ecotones.BioScience45318–325. 10.2307/1312492
57
RomdalT. S.AraújoM. B.RahbekC. (2013). Life on a tropical planet: Niche conservatism and the global diversity gradient.Glob. Ecol. Biogeogr.22344–350. 10.1111/j.1466-8238.2012.00786.x
58
RosenzweigM. L. (1995). Species Diversity in Space and Time.Cambridge, MA: Cambridge University Press.
59
SandelB. (2018). Richness-dependence of phylogenetic diversity indices.Ecography41837–844. 10.1111/ecog.02967
60
SegoviaR. A.ArmestoJ. J. (2015). The gondwanan legacy in south american biogeography.J. Biogeogr.42209–217. 10.1111/jbi.12459
61
SegoviaR. A.PenningtonR. T.BakerT. R.Coelho de SouzaF.NevesD. M.DavisC. C.et al (2020). Freezing and water availability structure the evolutionary diversity of trees across the Americas.Sci. Adv.6:eaaz5373. 10.1126/sciadv.aaz5373
62
ShmidaA.WilsonM. V. (1985). Biological determinants of species diversity.J. Biogeogr.121–20. 10.2307/2845026
63
SilmanM. R. (2007). “Plant species diversity in Amazonian forests,” in Tropical Rainforest Responses to Climatic Change, edsBushM. B.FlenleyJ. R. (Berlin: Springer), 269–294. 10.1007/978-3-540-48842-2_10
64
Silva-PereiraI.Meira-NetoJ. A. A.RezendeV. L.EisenlohrP. V. (2020). Biogeographic transitions as a source of high biological diversity: Phylogenetic lessons from a comprehensive ecotone of South America.Perspect. Plant Ecol. Evol. Syst.44:125528. 10.1016/j.ppees.2020.125528
65
SilvestroD.Cascales-MiñanaB.BaconC. D.AntonelliA. (2015). Revisiting the origin and diversification of vascular plants through a comprehensive Bayesian analysis of the fossil record.New Phytol.207425–436. 10.1111/nph.13247
66
SmithB. T.AmeiA.KlickaJ. (2012). Evaluating the role of contracting and expanding rainforest in initiating cycles of speciation across the Isthmus of Panama.Proc. Biol Sci.2793520–3526. 10.1098/rspb.2012.0706
67
SundqvistM. K.SandersN. J.WardleD. A. (2013). Community and ecosystem responses to elevational gradients: processes. mechanisms, and insights for global change.Ann. Rev. Ecol. Evol. Syst.44261–280. 10.1146/annurev-ecolsys-110512-135750
68
TiedeY.HomeierJ.CumbicusN.PeñaJ.AlbrechtJ.ZiegenhagenB.et al (2015). Phylogenetic niche conservatism does not explain elevational patterns of species richness, phylodiversity and family age of tree assemblages in Andean rainforest.Erdkunde7083–106. 10.3112/erdkunde.2016.01.06
69
TuckerC. M.CadotteM. W.CarvalhoS. B.DaviesT. J.FerrierS.FritzS. A.et al (2017). A guide to phylogenetic metrics for conservation, community ecology and macroecology: A guide to phylogenetic metrics for ecology.Biol. Rev.92698–715. 10.1111/brv.12252
70
VazquezJ. A.GivnishT. J. (1998). Altitudinal gradients in tropical forest composition. structure, and diversity in the sierra de manantlan.J. Ecol.86999–1020. 10.1046/j.1365-2745.1998.00325.x
71
WiensJ. J.DonoghueM. J. (2004). Historical biogeography, ecology and species richness.Trends Ecol. Evol.19639–644. 10.1016/j.tree.2004.09.011
72
YguelB.JactelH.PearseI. S.MoenD.WinterM.HortalJ.et al (2016). The evolutionary legacy of diversification predicts ecosystem function.Am. Nat.188398–410. 10.1086/687964
73
ZanneA. E.TankD. C.CornwellW. K.EastmanJ. M.SmithS. A.FitzJohnR. G.et al (2014). Three keys to the radiation of angiosperms into freezing environments.Nature50689–92. 10.1038/nature12872
74
ZimmermannM.MeirP.SilmanM. R.FeddersA.GibbonA.MalhiY.et al (2010). No differences in soil carbon stocks across the tree line in the peruvian andes.Ecosystems1362–74. 10.1007/s10021-009-9300-2
Summary
Keywords
diversity gradient, lineage diversity, lineage age, tropical montane forest, TILD, environmental crossroads
Citation
Griffiths AR, Silman MR, Farfan-Rios W, Feeley KJ, Cabrera KG, Meir P, Salinas N, Segovia RA and Dexter KG (2021) Evolutionary Diversity Peaks at Mid-Elevations Along an Amazon-to-Andes Elevation Gradient. Front. Ecol. Evol. 9:680041. doi: 10.3389/fevo.2021.680041
Received
13 March 2021
Accepted
13 July 2021
Published
24 August 2021
Volume
9 - 2021
Edited by
Danilo M. Neves, Federal University of Minas Gerais, Brazil
Reviewed by
Felix Forest, Royal Botanic Gardens, Kew, United Kingdom; Sebastian Gonzalez, National University of Colombia, Medellin, Colombia
Updates
Copyright
© 2021 Griffiths, Silman, Farfan-Rios, Feeley, Cabrera, Meir, Salinas, Segovia and Dexter.
This is an open-access article distributed under the terms of the Creative Commons Attribution License (CC BY). The use, distribution or reproduction in other forums is permitted, provided the original author(s) and the copyright owner(s) are credited and that the original publication in this journal is cited, in accordance with accepted academic practice. No use, distribution or reproduction is permitted which does not comply with these terms.
*Correspondence: Andy R. Griffiths, agriff16@hotmail.com
This article was submitted to Biogeography and Macroecology, a section of the journal Frontiers in Ecology and Evolution
Disclaimer
All claims expressed in this article are solely those of the authors and do not necessarily represent those of their affiliated organizations, or those of the publisher, the editors and the reviewers. Any product that may be evaluated in this article or claim that may be made by its manufacturer is not guaranteed or endorsed by the publisher.