
94% of researchers rate our articles as excellent or good
Learn more about the work of our research integrity team to safeguard the quality of each article we publish.
Find out more
ORIGINAL RESEARCH article
Front. Ecol. Evol., 10 August 2021
Sec. Urban Ecology
Volume 9 - 2021 | https://doi.org/10.3389/fevo.2021.676332
This article is part of the Research TopicEffects of Artificial Light at Night on Organisms: From Mechanisms to FunctionView all 13 articles
 Gopinath Mondal1,2
 Zeeshan Ahmad Khan1†‡
 Sijagurumayum Dharmajyoti Devi1†
 Rajendra Kumar Labala1,3
 Asamanja Chattoraj3*
The influence of Artificial Light at Night (ALAN) is a severe interference in the biological rhythm of organisms. Feeding dysregulation might be the main factor responsible for developing metabolic diseases. The molecular basis of these physiological dysregulations is yet to be elucidated. The effect of light on appetite-regulating signal in the brain of zebrafish is still unknown. Therefore, the present study aimed to find the daily mRNA expression profile of two significant appetite and energy-balancing peptide hormone (leptin) and enzyme (goat) in the brain in various illumination conditions, LD (12Light:12Dark), LL (24L), and DD (24D). Moreover, Ga-SI, the protein level of the two appetite-regulating peptides, and brain and serum melatonin are measured after 72 h of incubation under three different photic conditions. The immunohistochemical localization of the primary mediators of appetite regulators, leptin and goat, in the brain of zebrafish, under different photic conditions, is reported for the first time in zebrafish. The study revealed that in continuous light after 72 h of incubation, feeding (Ga-SI) is found the highest and the translational level of two appetite-related genes (leptin and goat) is the lowest compared to LD. In continuous dark, this relation becomes opposite. The daily variation of mRNA expression of leptin and goat in LD shows peak expression at the light and dark phase, respectively. This pattern was abolished in continuous conditions. Thus, our study suggests that the photoperiod (zeitgeber) may influence the expression pattern (daily variation) of appetite-regulating peptide hormone and enzyme in the brain of zebrafish.
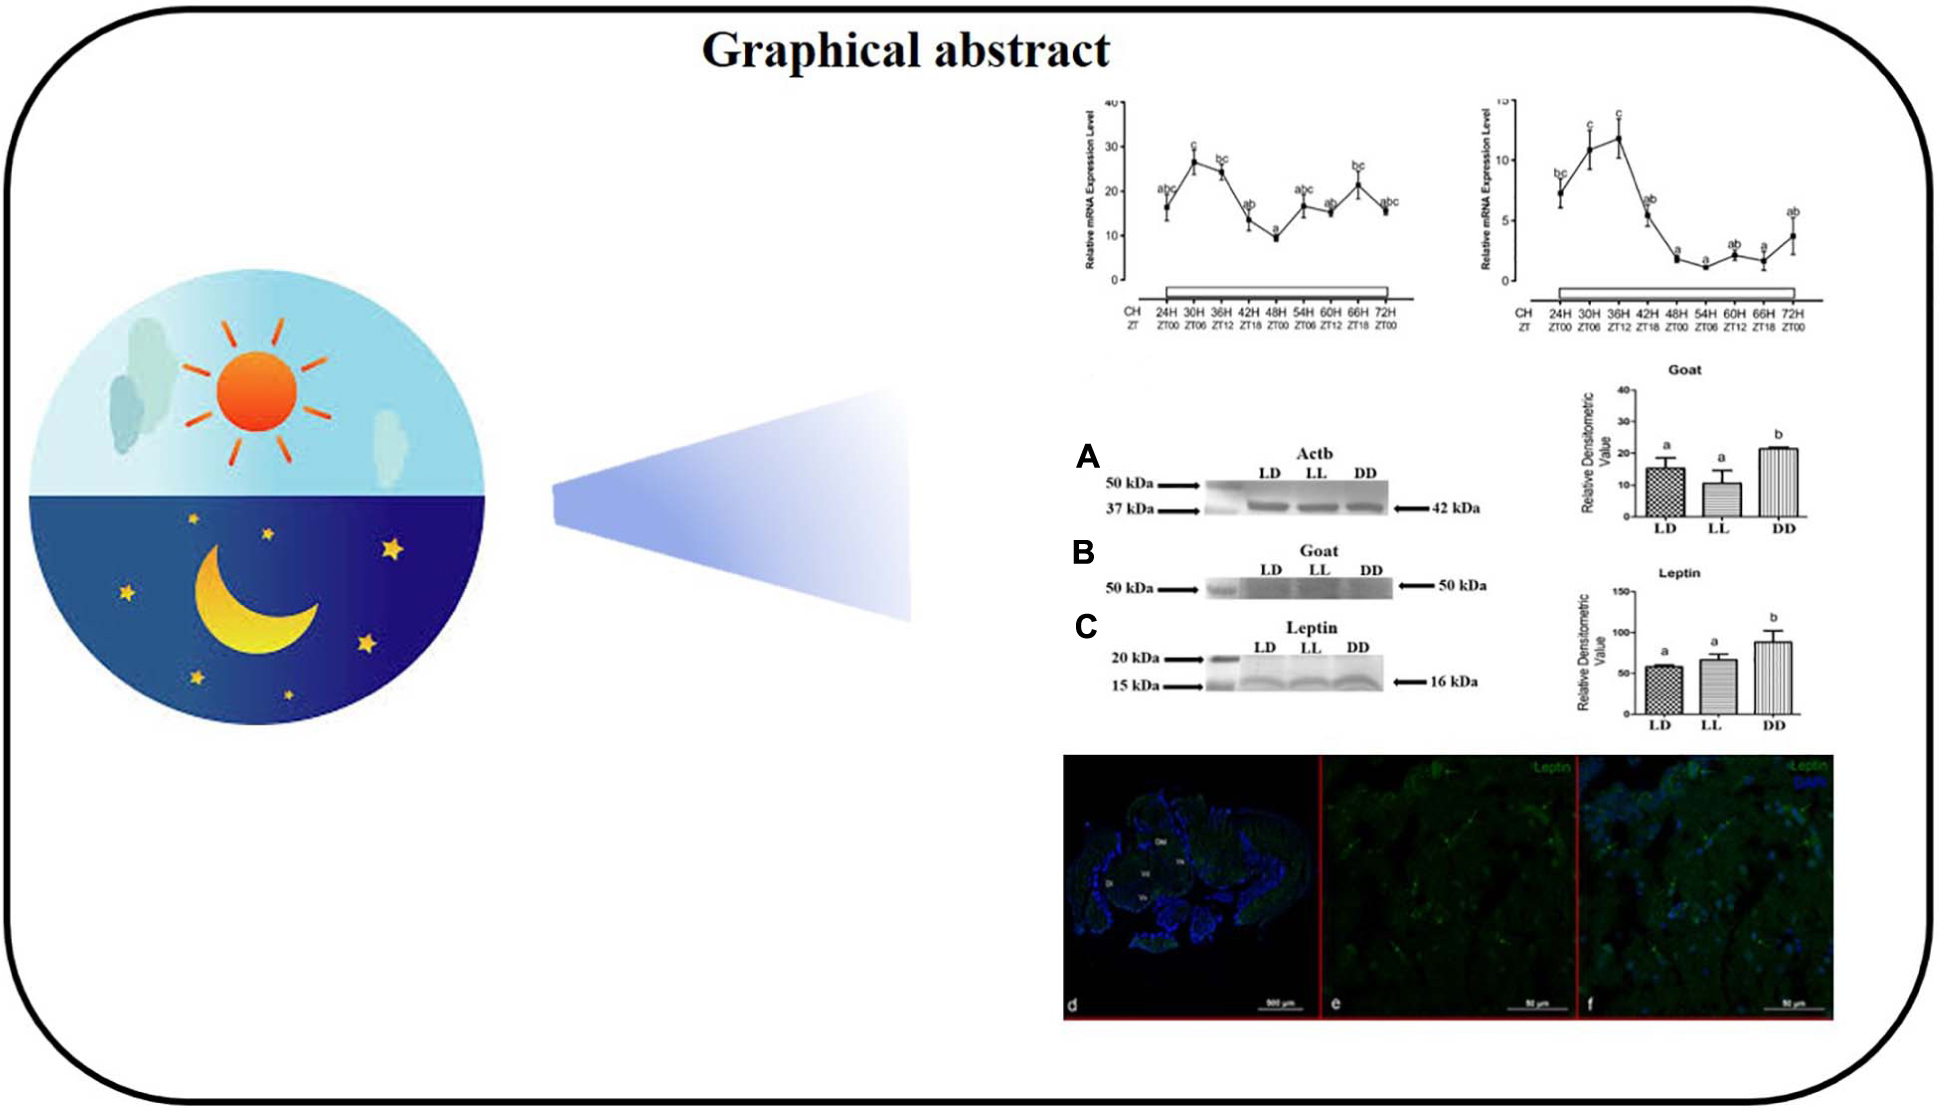
Graphical Abstract. Light dark cycle influences the levels of Leptin and Ghrelin O-Acyl Transferase (GOAT).
Energy balance is a critical process for the survival of organisms, maintained by a complex neuro-anatomical network between the central and peripheral nervous systems. Several hormones play an integral role in energy homeostasis to cope with varying external zeitgebers like food availability and environmental conditions. The energy-balancing hormone is produced by different tissues; among them, the brain plays a critical role to regulate energy homeostasis by secreting appetite-stimulating (orexigenic) and appetite-inhibiting (anorexigenic) endocrine signals according to the input of energy status from several central and peripheral neuroendocrine tissues in fish (Suzuki et al., 2010; Hoskins and Volkoff, 2012; Mondal et al., 2021a). Energy homeostasis depends on a proper balance between energy intake and expenditure involving the feeding behavior, which is regulated by various environmental conditions (light, temperature) (Volkoff et al., 2005; Valassi et al., 2008; Mondal et al., 2021a). Among different environmental signals, periodic changes in light and dark cycle are the major factors that can influence the energy-balancing system (Helwig et al., 2009). The relationship of leptin and ghrelin (major anorexigenic and orexigenic peptides, respectively) with different photic conditions is unknown.
Leptin, a peptide hormone, is mainly secreted by adipose tissue in mammals and first cloned in ob/ob mice (Zhang et al., 1994; Park and Ahima, 2015). In both mammals and fish, leptin regulates food intake and energy homeostasis (Copeland et al., 2011; Li, 2011). In fish, leptin is secreted from the liver, although it is known to express in the brain and other peripheral tissues (Huising et al., 2006; Frøiland et al., 2010; Denver et al., 2011; Tinoco et al., 2014). Leptin is reported to act as an anorectic signal or hormone; however, its regulation through overfeeding and fasting is dependent on the feeding regime, and it is species-specific (Rønnestad et al., 2010; Kobayashi et al., 2011; Tinoco et al., 2012). The daily expression pattern of leptin was described in rat and human adipose tissue (Xu et al., 1999; Gómez Abellán et al., 2011). In Atlantic salmon and goldfish, the daily changes of leptin mRNA expression were found in the brain, white muscle, belly flap, visceral adipose tissue, and liver (Moen and Finn, 2013; Tinoco et al., 2014). Daily variation in leptin expression was found under 12L:12D with scheduled feeding, but under 24L with a 12-h shift in feeding time; or fasting diminishes the rhythmic expression of leptin in goldfish (Tinoco et al., 2014). The expression of leptin in the brain and hepatic tissue is regulated differently in goldfish. The peak expression of hepatic leptin was found 9 h post-feeding (Tinoco et al., 2012). However, hypothalamic acrophase of leptin rhythm was noted before or around mealtime, and no postprandial changes were reported in goldfish (Tinoco et al., 2012).
Ghrelin is a 28-amino acid acylated peptide hormone largely produced in the gastric mucosa. Like mammals, ghrelin is found in many fish species and also increases food intake and thereby body weight (Kojima et al., 1999; Wren et al., 2001; Unniappan et al., 2002; Kaiya et al., 2008; Amole and Unniappan, 2009; Hatef et al., 2015). Ghrelin is encoded from preproghrelin mRNA, and for the functional form, it needs to be acylated at the third serine residue. Ghrelin O-acyltransferase (Goat), also known as the membrane-bound O-acyltransferase 4 (Mboat4), is mainly responsible for this acylation (Yang et al., 2008; Amole and Unniappan, 2009). In mice, the goat mRNA expression was found in ghrelin immunopositive cells (Sakata et al., 2009). Moreover, the similar expression profile of acylated ghrelin and goat or mboat4 mRNA was also revealed in mammals (Stengel et al., 2010b). The goat expression is responsible for the availability of acylated ghrelin in teleost (Hatef et al., 2015). In mammals, the reduction in plasma goat follows a decrease in plasma acylated ghrelin, whereas the goat level in gut gives a minor increase in the same time (Stengel et al., 2010a). These findings support the idea that the tissue-specific synthesis of goat is responsible for the availability/indirect assessment of local acylated ghrelin. In mammals, goat expression is tissue-specific and mainly expressed in the stomach (Yang et al., 2008; Lim et al., 2011). Similarly, in zebrafish, the goat expression was observed in various tissues but primarily in the gut (Hatef et al., 2015; Mondal et al., 2021a). The presence of goat in the brain of mammals and zebrafish indicates a facilitative role in feeding regulation by local acylation of preproghrelin, coming from central and peripheral organs (Matsuda et al., 2006; Lim et al., 2011; Tinoco et al., 2014; Hatef et al., 2015). Besides that, it was reported that an increased level of plasma acylated ghrelin coincided with an elevation of hypothalamic and pituitary goat mRNA expression in fasted mice (Gahete et al., 2010). Alteration of goat mRNA expression in the brain of zebrafish was reported in various feeding conditions (Hatef et al., 2015).
These two factors, leptin and goat, are involved in central appetite regulation and show daily rhythm in fish and mammals (Tinoco et al., 2014; Blanco et al., 2016a, 2017). However, future studies are needed regarding the role of centrally synthesized leptin and goat, and the daily pattern of expression and effect of altered photic conditions on the expression in the brain of zebrafish with unaltered scheduled feeding.
The aim of this study was to investigate whether leptin and goat mRNA expression has any daily pattern in normal photic condition and if it can be affected by altered photoperiodic conditions with scheduled feeding. We examine the brain expression of leptin and goat mRNA up to 72 h in three different photoperiodic conditions. The localization and abundance of the leptin and goat protein in zebrafish brain were assessed by fluorescence immunohistochemistry and Western blot under different photic conditions. In addition, we also measured melatonin level and Gastrosomatic Index (Ga-SI) in various photic conditions. In this study, we tried to show that the altered photoperiod can change the pattern and level of expression of leptin and goat in the zebrafish brain.
The second generation of wild-type zebrafish (Danio rerio) approximately 6–7 months old, with a body length of 4.0 ± 0.3 cm and a weight of 0.4 ± 0.15 g, was obtained from the zebrafish facility of IBSD, Imphal, Manipur, India. Fish were maintained in 50-L glass aquaria (30 fish/aquaria) under normal (12 h light:12 h dark) photic conditions (light intensity was fixed at 300 lux by a household fluorescent tube) (Khan et al., 2018). Everyday light was turned on in the morning (at 6:00 a.m.) and turned off in the evening (at 6:00 p.m.), maintained by a timer (Frontier Digital Timer, Taiwan) (Reed and Jennings, 2011). The adequate water temperature for zebrafish (28 ± 0.5°C) was maintained by using glass submersible aquarium immersion heaters (100 W, RS Electrical, India) placed in each aquarium. A biological filter (E-Jet, P.R.C) was used for aeration and recirculation of water. The pH, hardness, and other parameters of water were maintained under standard conditions (Westerfield, 2000) at our laboratory (Khan et al., 2016). Food was given thrice a day. At morning (9:00 am; ZT03) and midday (1:00 pm; ZT07) with commercial floating type small pellets (Perfect Companion Group Co. Ltd., Thailand). Live Artemia nauplii (cultured from Artemia cysts, Ocean Star International, United States) was given at the late afternoon (5:00 pm; ZT11). Fish care and study schedule were done by following international standards (Portaluppi et al., 2010). Ethical clearance was obtained from the Institutional Animals Ethical Committee as per the recommendations of the Committee for Control and Supervision of Experiments on Animals (CPCSEA), Government of India.
The male zebrafish were randomly distributed into three experimental groups (27 fish/group): (i) standard photoperiod (12L:12D, LD), lights on at 6:00 a.m. and lights off at 6:00 p.m.; (ii) continuous light (24L, LL); and (iii) continuous dark (24D, DD). The temperature was set at 28 ± 0.5°C for all these groups. Food was given in the same composition three times in a day as earlier elaborated (9:00 am; ZT03, 1:00 pm; ZT07 and 5:00 pm; ZT11). Fish were kept for 24 h in each experimental condition before the start of sampling (Khan et al., 2016). The sampling process for all the photic conditions started from Clock Hour CH 24 [Day 2 (D2); ZT0/24, through Day 3 (D3) and continued up to CH 72 Day 4 (D4); ZT0/24], with an interval of 6 h (CH24/ZT0/24; CH30/ZT06; CH36/ZT12; CH42/ZT18; CH48/ZT0/24; CH54/ZT06; CH60/ZT12; CH66/ZT18 and CH72/ZT0/24) (Amaral and Johnston, 2012). At each time point, three zebrafish were taken in 0.1% Tricaine (Sigma-Aldrich, United States) solution and kept on ice for anesthesia. The brain was taken out by removing the cranium and quickly stored in TRIzol® (Ambion, Carlsbad, CA, United States) and frozen at −80°C before the total RNA extraction (Rajiv et al., 2016). Simultaneously, in an identical condition, three experimental groups (as mentioned above) were established, and after 72 h of incubation, 15 zebrafish were taken from each lighting condition (LD, LL, and DD; total 15 × 3 = 45 fish) in 0.1% Tricaine (Sigma-Aldrich, United States) solution and kept on ice for anesthesia. The body length and weight of each fish were measured before they were euthanized. Five fish (5 × 3 = 15 fish) were used for brain and serum melatonin enzyme-linked immunosorbent assay (ELISA), five fish (5 × 3 = 15 fish) were used for the Western blot analysis, and the remaining five fish (5 × 3 = 15 fish) were used for the immunohistochemistry and quantification of intestine content as a Ga-SI. Brains for Melatonin ELISA were collected in 0.1 M PBS (pH 7.4) (Yumnamcha et al., 2017) and those for Western blot were kept in radioimmunoprecipitation assay (RIPA) buffer (Sigma–Aldrich) with protease inhibitor (Sigma–Aldrich) at a 1:100 ratio at 4°C. For the immunohistochemical study and the quantification of intestine content as a Ga-SI, the whole brain and whole gut, respectively, of all five fish from each experimental group were kept in 4% PFA (mass/vol) diluted in 0.1 M phosphate buffer saline (PBS, pH 7.4) at 4°C (Amaral and Johnston, 2012; Hatef et al., 2015). The entire intestinal content of zebrafish is considered for the quantity of feeding as they do not have any stomach (Brugman, 2016). Samplings at dark were carried out in dim red light.
Gene expression analysis was performed in a StepOnePlusTM Real-Time PCR System (Applied Biosystems®, Inc., ABI, United States) as previously described (Khan et al., 2018). Total RNA was extracted from the homogenized brain of zebrafish using the TRIzol® Reagent (Life Technologies, United States) method, and 5 μg of total RNA was treated with the DNA-freeTM Kit (Ambion®RNA by Life TechnologiesTM, United States). Then, for cDNA synthesis, 1 μg of DNase-treated total RNA was reverse transcribed, using the High-Capacity cDNA Reverse Transcription Kit (Applied BiosystemsTM, United States) in the ProFlexTM Base PCR System (Applied Biosystems®, Inc., ABI, United States) by following the manufacturer’s protocol. Quantitative reverse transcriptase-polymerase chain reaction (qRT-PCR) was performed using Jumpstart SYBR Green/ROX qPCR Master Mix (Sigma-Aldrich, United States). Amplification was performed in technical triplicates for each sample, each of which contains 10 μl reaction volume of forward and reverse primers, JUMPstart qPCR Master Mix (Sigma-Aldrich, United States), and cDNA. Primers for this study were taken from the published data (Falcinelli et al., 2016; Table 1). The reaction condition for PCR was an initial denaturation step at 95°C for 10 min, followed by 40 cycles of 95°C for 15 s, annealing at 60°C for the 30 s, and extension at 72°C for 30 s. Melting curve analysis (Tm) confirmed single gene amplification by designated primers, and the 2% agarose gel shows a single band of the endpoint PCR product. The relative expression of the gene was calculated by the 2–ΔΔCT method (Livak and Schmittgen, 2001) using rpl13a gene as a reference (Tang et al., 2007).
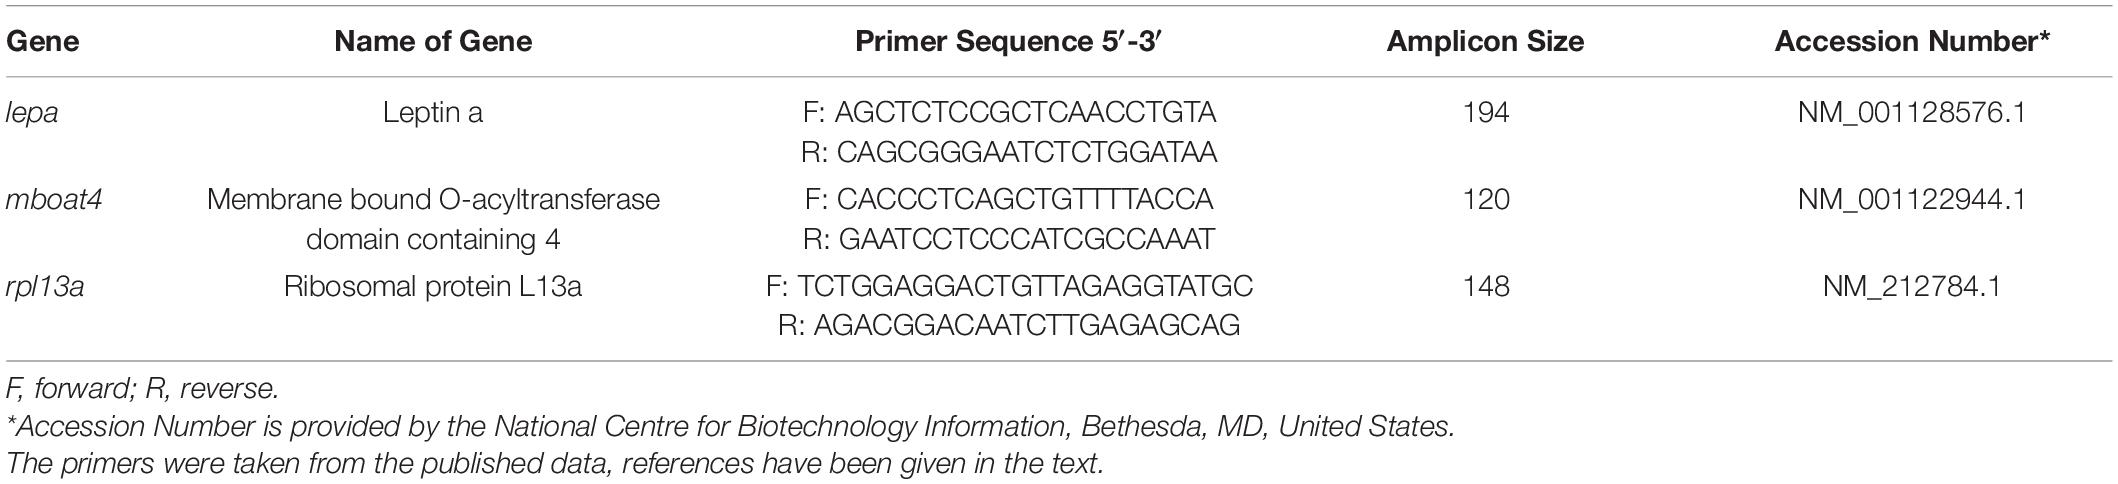
Table 1. List of Primer sequences used in Quantitative Realtime PCR (RT-PCR) analysis.
Thirty milligrams of the brain (pooled from five fish) was used to measure the melatonin level in the whole brain from each experimental condition. The brain tissue was homogenized by sonication in PBS, and then sequential centrifugations were performed at 3,000 × g at 4°C for 20 min in a microcentrifuge to obtain a clear supernatant. Melatonin level was assayed in this clear supernatant by using a Fish Melatonin (MT) ELISA Kit (Gen Asia, China) (Yumnamcha et al., 2017; Dharmajyoti Devi et al., 2021a) according to the manufacturer’s instruction. Absorbance was measured at 450 nm using a Multiskan spectrum reader (Thermo Fisher). The concentration of melatonin in the tissue was presented as pg per 100 mg (pg/100 mg) of tissue.
Blood was collected according to the published protocol (Babaei et al., 2013; Khan et al., 2018) and was centrifuged at 13,700 × g at 4°C for 15 min. The supernatant (Serum) was collected and melatonin level was assayed using a Fish Melatonin (MT) ELISA Kit (Gen Asia, China) (Khan et al., 2018), following the manufacturer’s protocol. Absorbance was taken at 450 nm in a Multiskan spectrum reader (Thermo Fisher). The concentration of melatonin in serum was presented as pg per ml of serum (pg/ml).
The expression level of leptin and goat in zebrafish brain was studied by immunohistochemical staining. The brain tissue was washed twice in 0.1 M PBS and immersed in PBS, containing 30% sucrose at 4°C overnight and then embedded in Jung TISSUE FREEZING MEDIUM (Leica Microsystems; Nussloch, Germany) as described previously (Cruz et al., 2010; Dharmajyoti Devi et al., 2021b). A frozen section (12 μm) from the telencephalon region of the brain for goat and leptin immunoreaction was prepared with a Leica CM3050S cryostat microtome (Leica Biosystems; Nussloch, Germany). An earlier report on fish confirms that the goat immunoreactive cells are present in different encephalic areas including the telencephalon (Blanco et al., 2016a, b). Immunohistochemistry was conducted with some modification as described previously (Hanna et al., 2010). After blocking with 3% BSA (dissolved in 0.1 M PBS), the tissue section was incubated with primary rabbit polyclonal anti-leptin antibody (1:100 dilution; ab16227, Abcam, United Kingdom) and primary rabbit polyclonal anti-Ghrelin O-acyltransferase antibody (1:100 dilution; ab170690, Abcam, United Kingdom) at 4°C overnight. Subsequently, sections were incubated with Donkey Anti-Rabbit IgG (H+L) secondary antibody, Alexa Fluor® 488 (1:200, Invitrogen; United States) for leptin and Goat Anti-Rabbit IgG (H+L) secondary antibody, Alexa FluorTM 594 for goat (1:200, Invitrogen; United States) for 1 h at room temperature. Then, the slides were counterstained with 4′,6-diamidino-2-phenylindole (DAPI) (Invitrogen, United States) for nuclei staining. For negative control, a separate set of tissue sections were treated with secondary antibody only. The slides were cover slipped with Vectashield (H-1000; Vector Laboratories, Inc., Burlingame, California, United States) and observed under a Nikon A1 R HD25 confocal microscope (NIKON CORPORATION, Konan, Minato-ku, Tokyo, Japan). Fifteen slides (from five fish) in each experimental condition for each antibody (each slide containing six sections) were stained using the above protocol and analyzed. Only representative images of brain staining for leptin and goat are shown here. For the quantification of immunopositive cells in each experimental condition, first, the total number of cells immunoreactive for leptin and goat in LD, LL, and DD was separately counted in all sections that were prepared. To calculate the percentage in each experiment, the total number of cells under each category (LD/LL/DD) of staining was divided by the total number of immunoreactive cells for each antibody (leptin/goat) of all three experimental conditions (LD, LL, and DD). Then, the result was multiplied by 100 to obtain the percentage of cells in every experimental condition (Hatef et al., 2015).
The pooled brain tissue was homogenized by sonication using SONICS unit (Vibra cellTM) and centrifuged at 30,000 rpm at 4°C for 20 min in a microcentrifuge. After collecting the supernatant, protein was estimated with the RC DC protein assay (Bio-Rad Laboratories) (Yumnamcha et al., 2017). Total protein was separated on 4–20% Mini-PROTEAN TGXTM Precast Protein Gels (Cat. 4561094, BIO-RAD) and then transferred into polyvinylidene fluoride (Immobilon-PSQ Transfer Membrane, Merck Millipore, United States) (Chattoraj et al., 2008; Wang et al., 2018). For blocking the membranes, 5% non-fat milk in TBST buffer (50 mM Tris, 100 mM NaCl, and 0.1% Tween 20, pH 7.4) was used (Chattoraj et al., 2005). The membranes were incubated overnight with the primary antibodies, rabbit polyclonal anti-leptin antibody (1:1,000; ab16227, Abcam, United States), rabbit polyclonal anti-Ghrelin O-acyltransferase antibody (1:500 dilution; ab170690, Abcam, United States), and mouse monoclonal anti-β-actin (1:5,000 dilution; AM4302, Invitrogen, United States) at 4°C. Then, the membranes were incubated for 1 h at room temperature with alkaline phosphatase conjugated secondary antibody (1:10,000 dilution; Goat anti-rabbit and Goat anti-mouse for goat and actb, respectively, and 1:5,000 dilution; Goat anti-rabbit for leptin) (Sigma-Aldrich, United States). Finally, the membranes were developed with BCIP/NBT (Merck Millipore, United States). The intensity of the individual band of immunoblot was quantified by densitometry using ImageJ software (National Institutes of Health, Bethesda, MD; https://imagej.nih.gov/ij/), and values were normalized to β-actin abundance (Chattoraj et al., 2009).
The collected gastrointestinal tract (in 4% PFA) was weighed (uniBloc analytical balance, Shimadzu) (Amaral and Johnston, 2012) and Ga-SI was calculated using the formula Ga-SI (%) = [Weight of gut (g)/Weight of fish (g)] × 100 (Biswas and Takeuchi, 2003).
Statistical changes in the expression of genes, quantity of brain and serum melatonin, and Ga-SI at different time points in every group were determined by one-way ANOVA (SPSS 16.0 software; Macrovision Corporation Santa Carlo, California, United States) followed by Tukey’s post-hoc test to compare the difference between the time points. p < 0.05 was considered as statistically significant.
After 72 h of incubation in three different photoperiodic conditions, the gut food content in terms of Ga-SI was significantly higher in continuous light, twice in LL, and lower by half in DD as compared to LD (Figure 1). Recently, higher activity and excitation rates after feeding in zebrafish larva were demonstrated due to exposure to continuous light (Kopp et al., 2018).
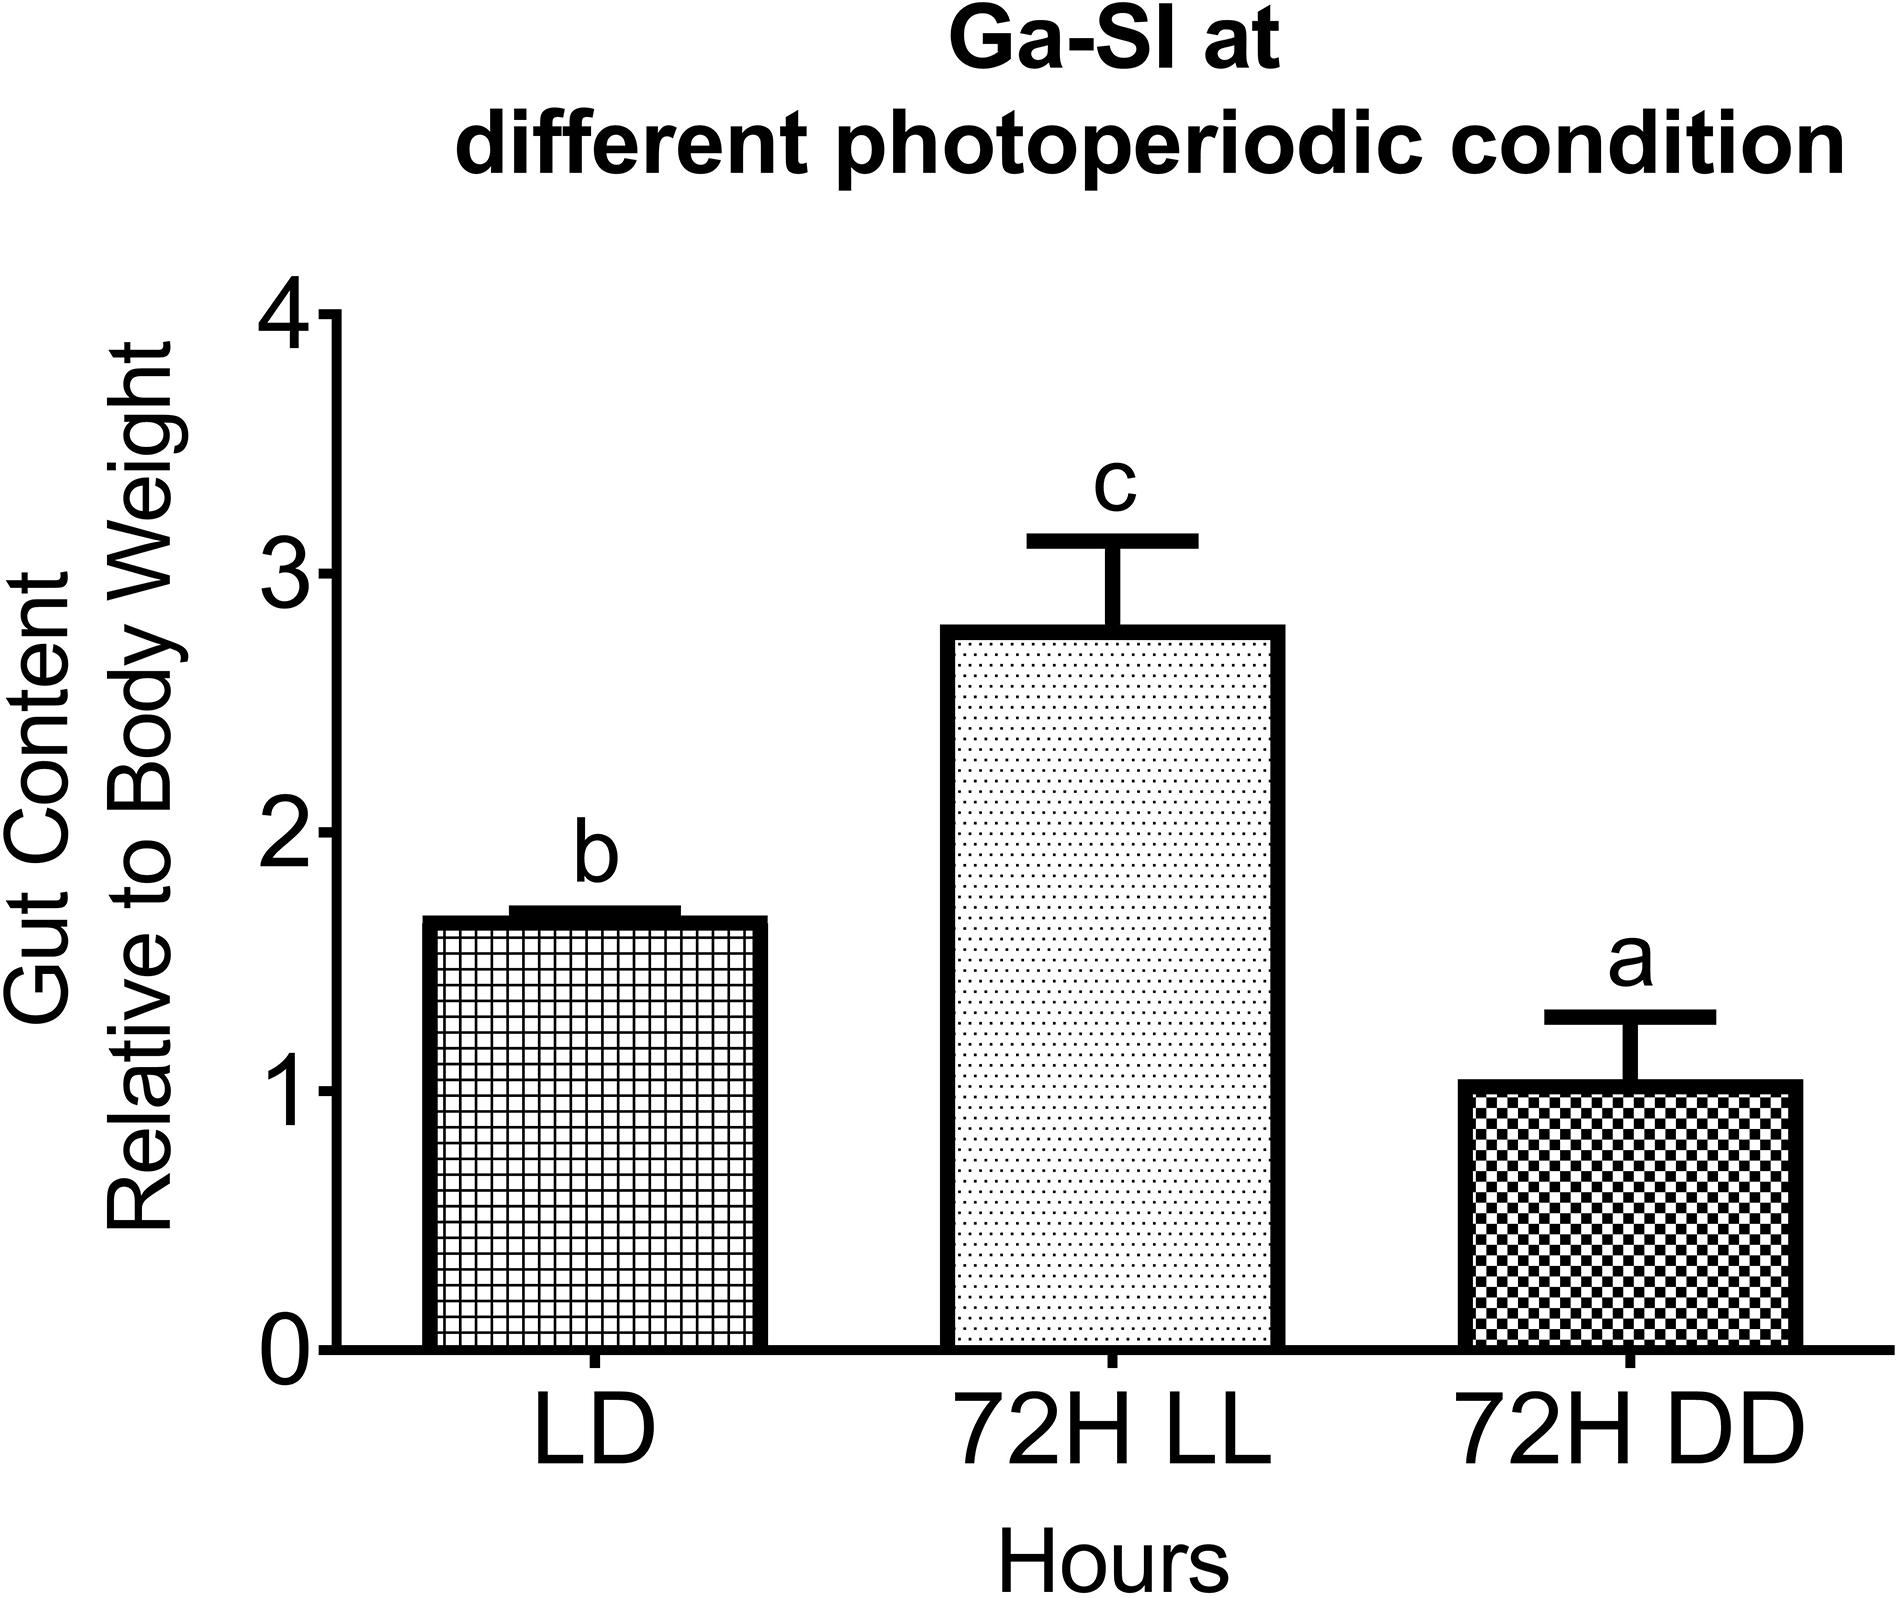
Figure 1. Ga-SI (Gastrointestinal Somatic Index) in different photic conditions (LD, LL, and DD). Food intake as a Ga-SI (intestine food content relative to body mass) at different photoperiodic conditions (LD, LL, and DD) after 72 h of incubation. Results are expressed as mean ± SEM (n = 5). Different letters indicate significant differences evaluated by one-way ANOVA [F(2,6) = 43.743, p = 0.000] with the Tukey post-hoc test (p < 0.05).
In this experiment, the mRNA expression patterns of two genes leptin and goat were studied in zebrafish brain under different illuminations.
The expression of leptin mRNA was in a particular pattern with a peak at ZT12 or the end of the light phase in LD in the brain (Figure 2A). A rhythmic pattern of leptin expression with a high level during the end of the light phase or daytime and a low level during night-time was also observed in goldfish brain and liver in normal photic conditions (Tinoco et al., 2014). In LL, the expression pattern of leptin was abolished after 2 days of exposure under continuous light as compared to LD (Figure 2B); nevertheless, in DD, the pattern was in-phase with LD (Figure 2C). Moreover, the mRNA expression was decreased up to 2.5-fold under constant conditions as compared to LD (Figure 2). The goat mRNA expression in zebrafish brain displays a night-time surge and remains constant, whereas a daytime decline was observed in normal photic condition (LD) with scheduled feeding (Figure 3A). In this regard, the daily pattern of preproghrelin expression in goldfish forebrain, hypothalamus, hindbrain, pituitary, and gastrointestinal tract during a 12L:12D photocycle shows significant rhythm with night-time acrophase (Sanchez-Bretano et al., 2015). In the continuous light condition (LL), the goat expression started to decrease from the second day (Figure 3B), whereas in the continuous dark condition (DD), the highest level of expression was observed at ZT06 D2 and then became lower, and finally a surge was detected at ZT18 D3 (Figure 3C). Moreover, under continuous photic conditions, the expression level was increased up to twofold from normal photic conditions (Figure 3).
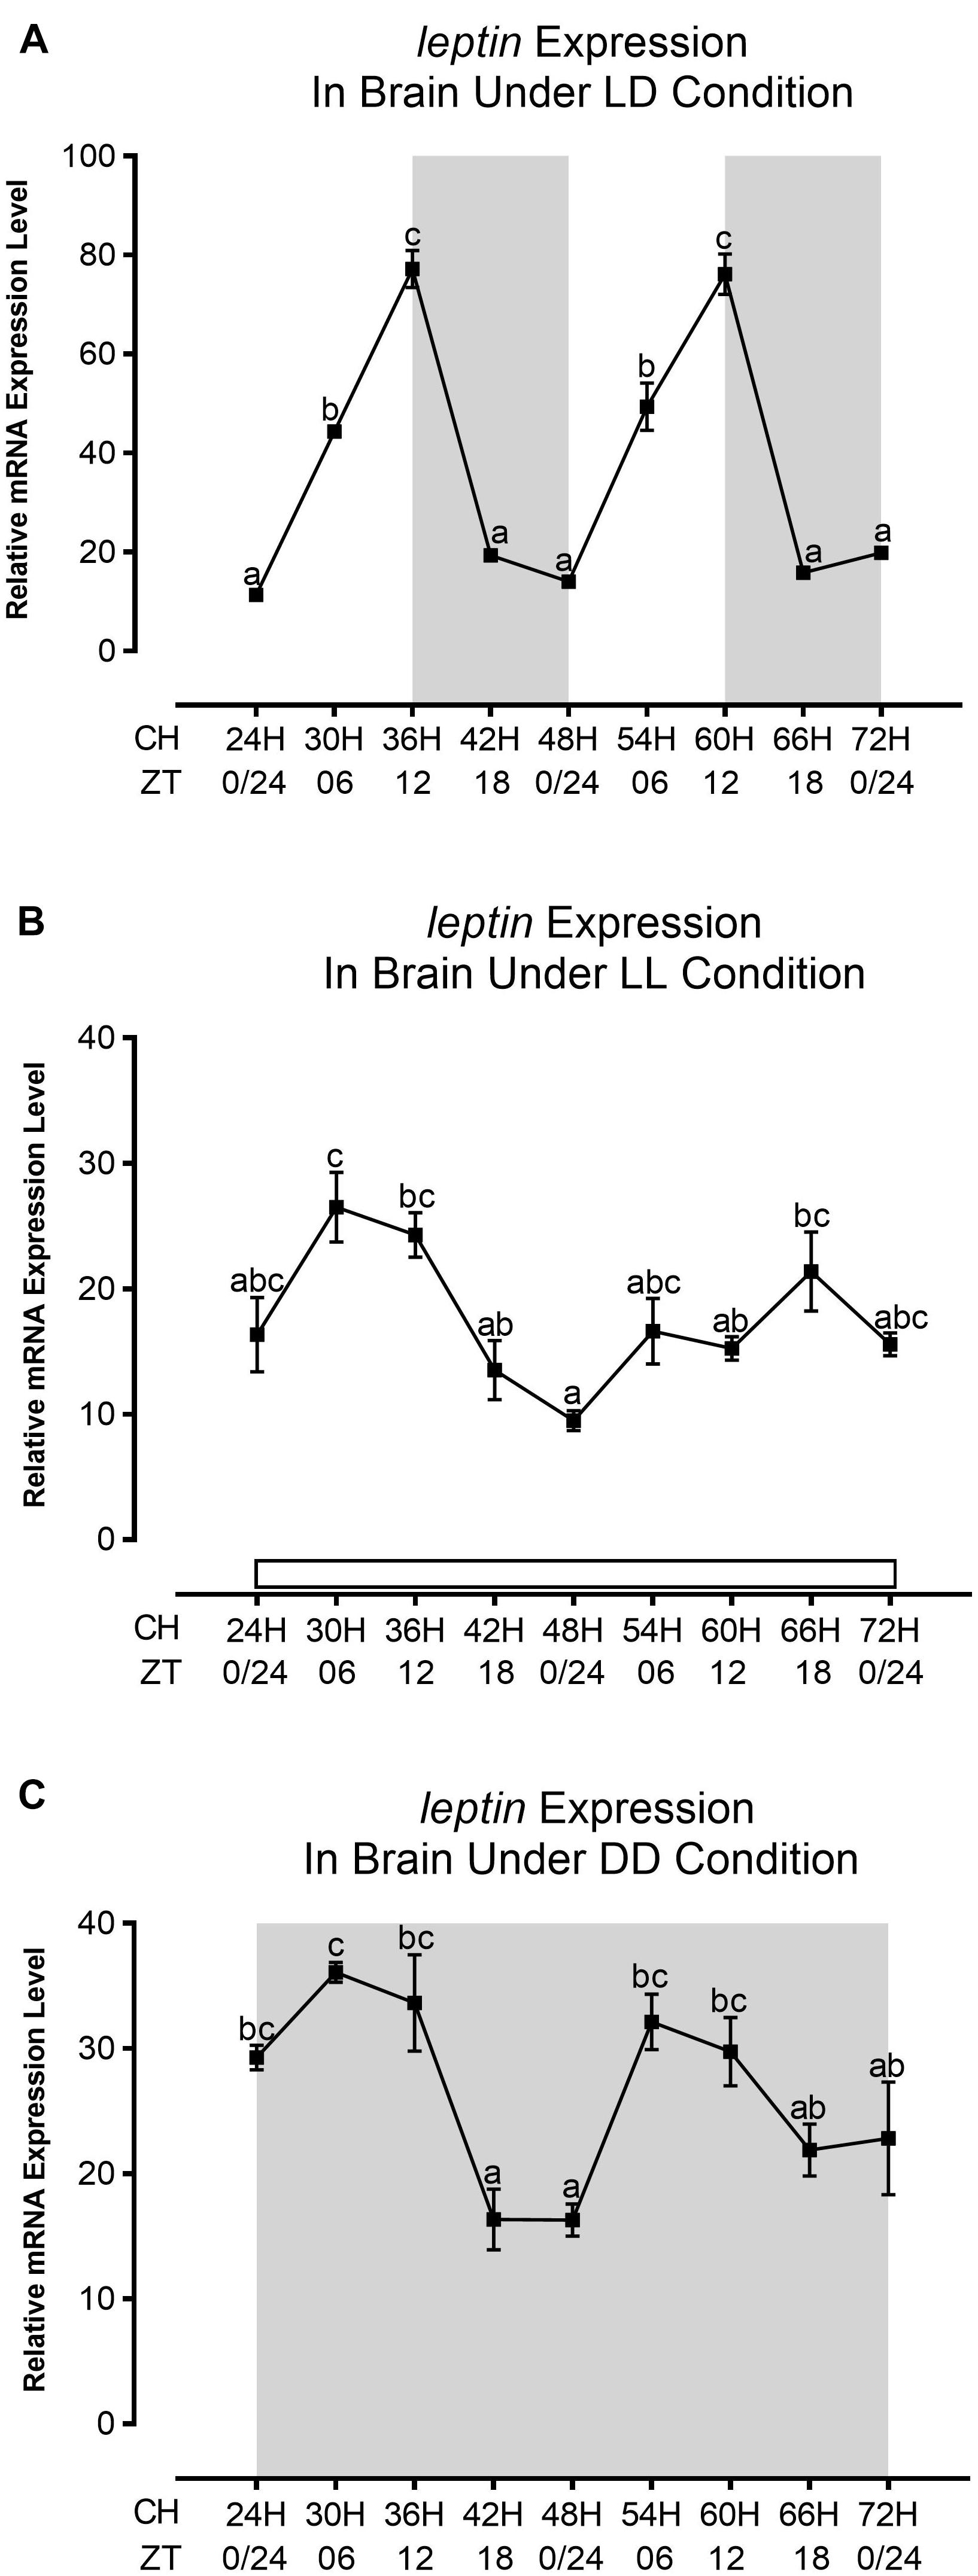
Figure 2. Daily expression profile of leptin gene under different photic conditions (LD, LL, and DD) in the brain of zebrafish. The daily expression profile of leptin mRNA at (A) LD, (B) LL, and (C) DD. The relative quantification values in the graph are shown as the mean ± SEM (n = 3). Different letters indicate significant differences evaluated by one-way ANOVA [(A) F(8,18) = 109.908, p = 0.000, (B) F(8,18) = 5.926, p = 0.001, and (C) F(8,18) = 8.012, p = 0.000] followed by post-hoc Tukey’s test (p < 0.05). The gray background resembles the dark phase and the white background is for the light phase. CH and ZT in the x-axis stand for Clock Hour and Zeitgeber Time, respectively.
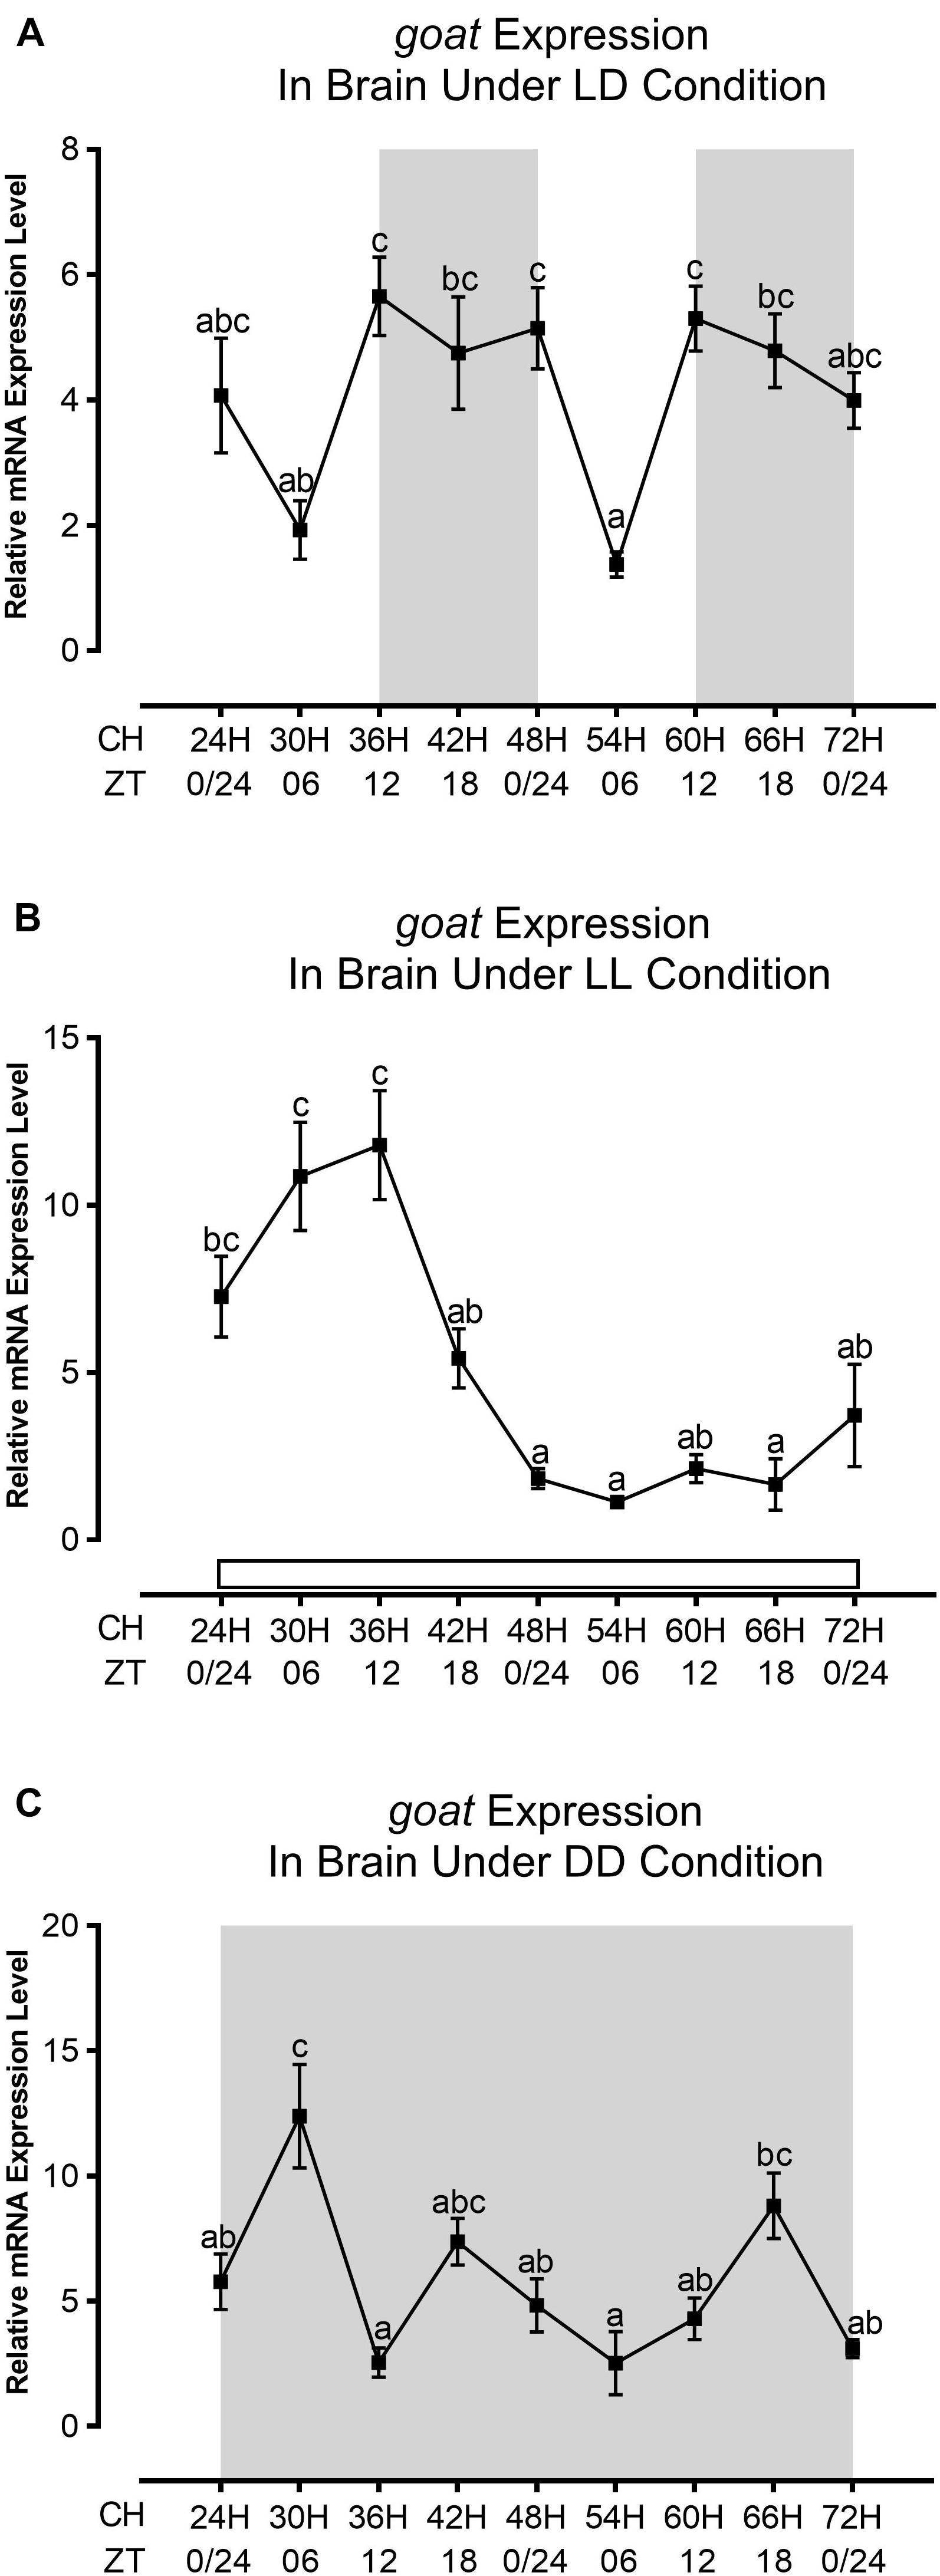
Figure 3. Daily expression profile of goat gene under different photic conditions (LD, LL, and DD) in the brain of zebrafish. The daily expression profile of goat mRNA at (A) LD, (B) LL, and (C) DD. The relative quantification values in the graph are shown as the mean ± SEM (n = 3). Different letters indicate significant differences evaluated by one-way ANOVA [(A) F(8,18) = 5.743, p = 0.001, (B) F(8,18) = 13.813, p = 0.000, and (C) F(8,18) = 8.109, p = 0.000] followed by post-hoc Tukey’s test (p < 0.05). The gray background resembles the dark phase and the white background is for the light phase. CH and ZT in the x-axis stand for Clock Hour and Zeitgeber Time, respectively.
A cross-section of the zebrafish brain through the telencephalon region identified leptin and goat immunoreactive cells. These were scattered in the lateral, medial, and lower parts of the telencephalon. No staining was found in negative controls stained with only secondary antibodies (Supplementary Figures 1A,B). Quantification of immunoreactivity cells reveals that leptin immunopositive cells were higher in DD (∼51%) and lower under LL conditions (∼15%) as compared to LD (∼34%) (Figure 4). In the case of the goat, the number of immunopositive cells was high in LD (∼41%) and DD (∼45%). On the contrary, immunoreactivity of goat decreased in LL (∼14%) (Figure 5).
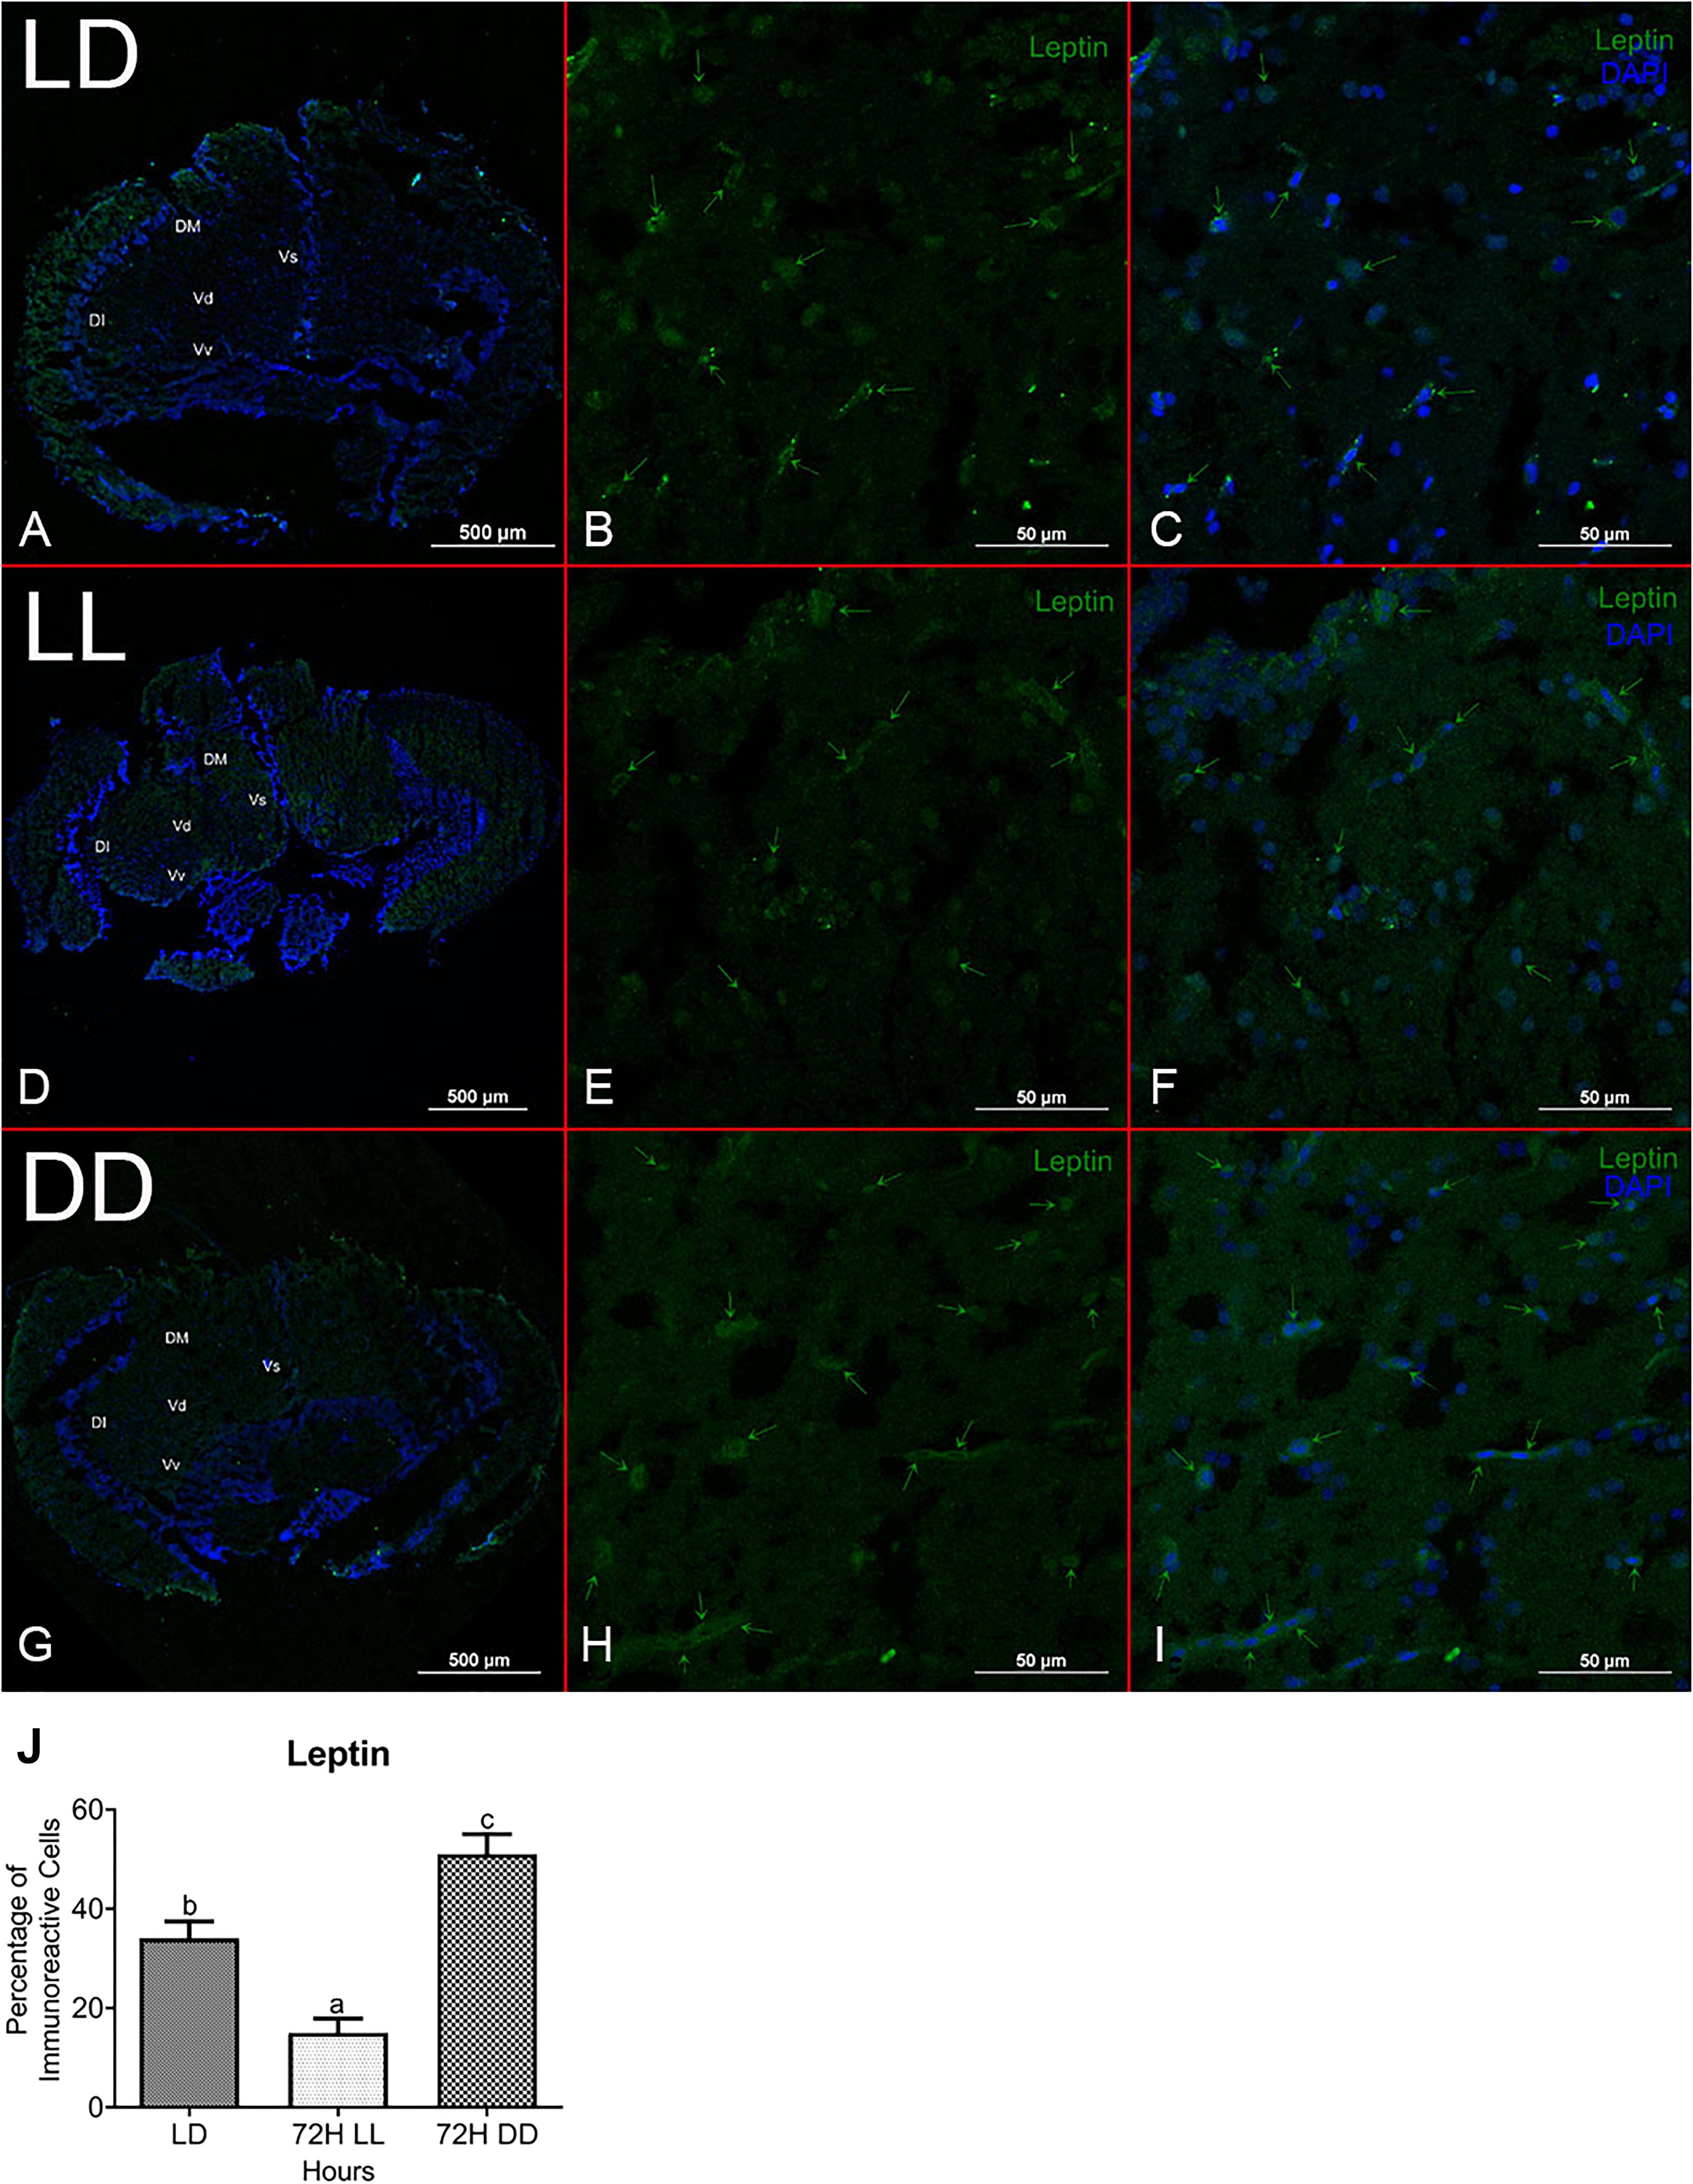
Figure 4. Localization and characterization of Leptin in zebrafish brain under different photic conditions (LD, LL, and DD). The figure shows Leptin immunoreactivity cells in LD (B), LL (E), and DD (H) in the telencephalon region of the brain in zebrafish. Immunohistochemical localization shows Leptin immunoreactive cells (green arrow) in the dorsomedial, dorsolateral, and ventromedial zone of the telencephalon in the brain. The whole section of brain through telencephalic region (A,D,G), Leptin-positive cells (green) (B,E,H), and merge imaged with nuclear stain DAPI (C,F,I). Relative abundance of Leptin immunopositive cells in the brain under different photic conditions. The relative quantification values in the graph are shown as the mean ± SEM (n = 5). Different letters indicate significant differences evaluated by one-way ANOVA [F(2,6) = 26.536, p = 0.001] followed by post-hoc Tukey’s test (p < 0.05) (J). For the percentage calculation method, please consult the section “Materials and Methods.” Representative images were taken from multiple sections of five separate zebrafish brain in each experimental condition (Vs, supracommissural nucleus; Vd, dorsal nucleus; Vv, ventral nucleus of ventromedial telencephalon).
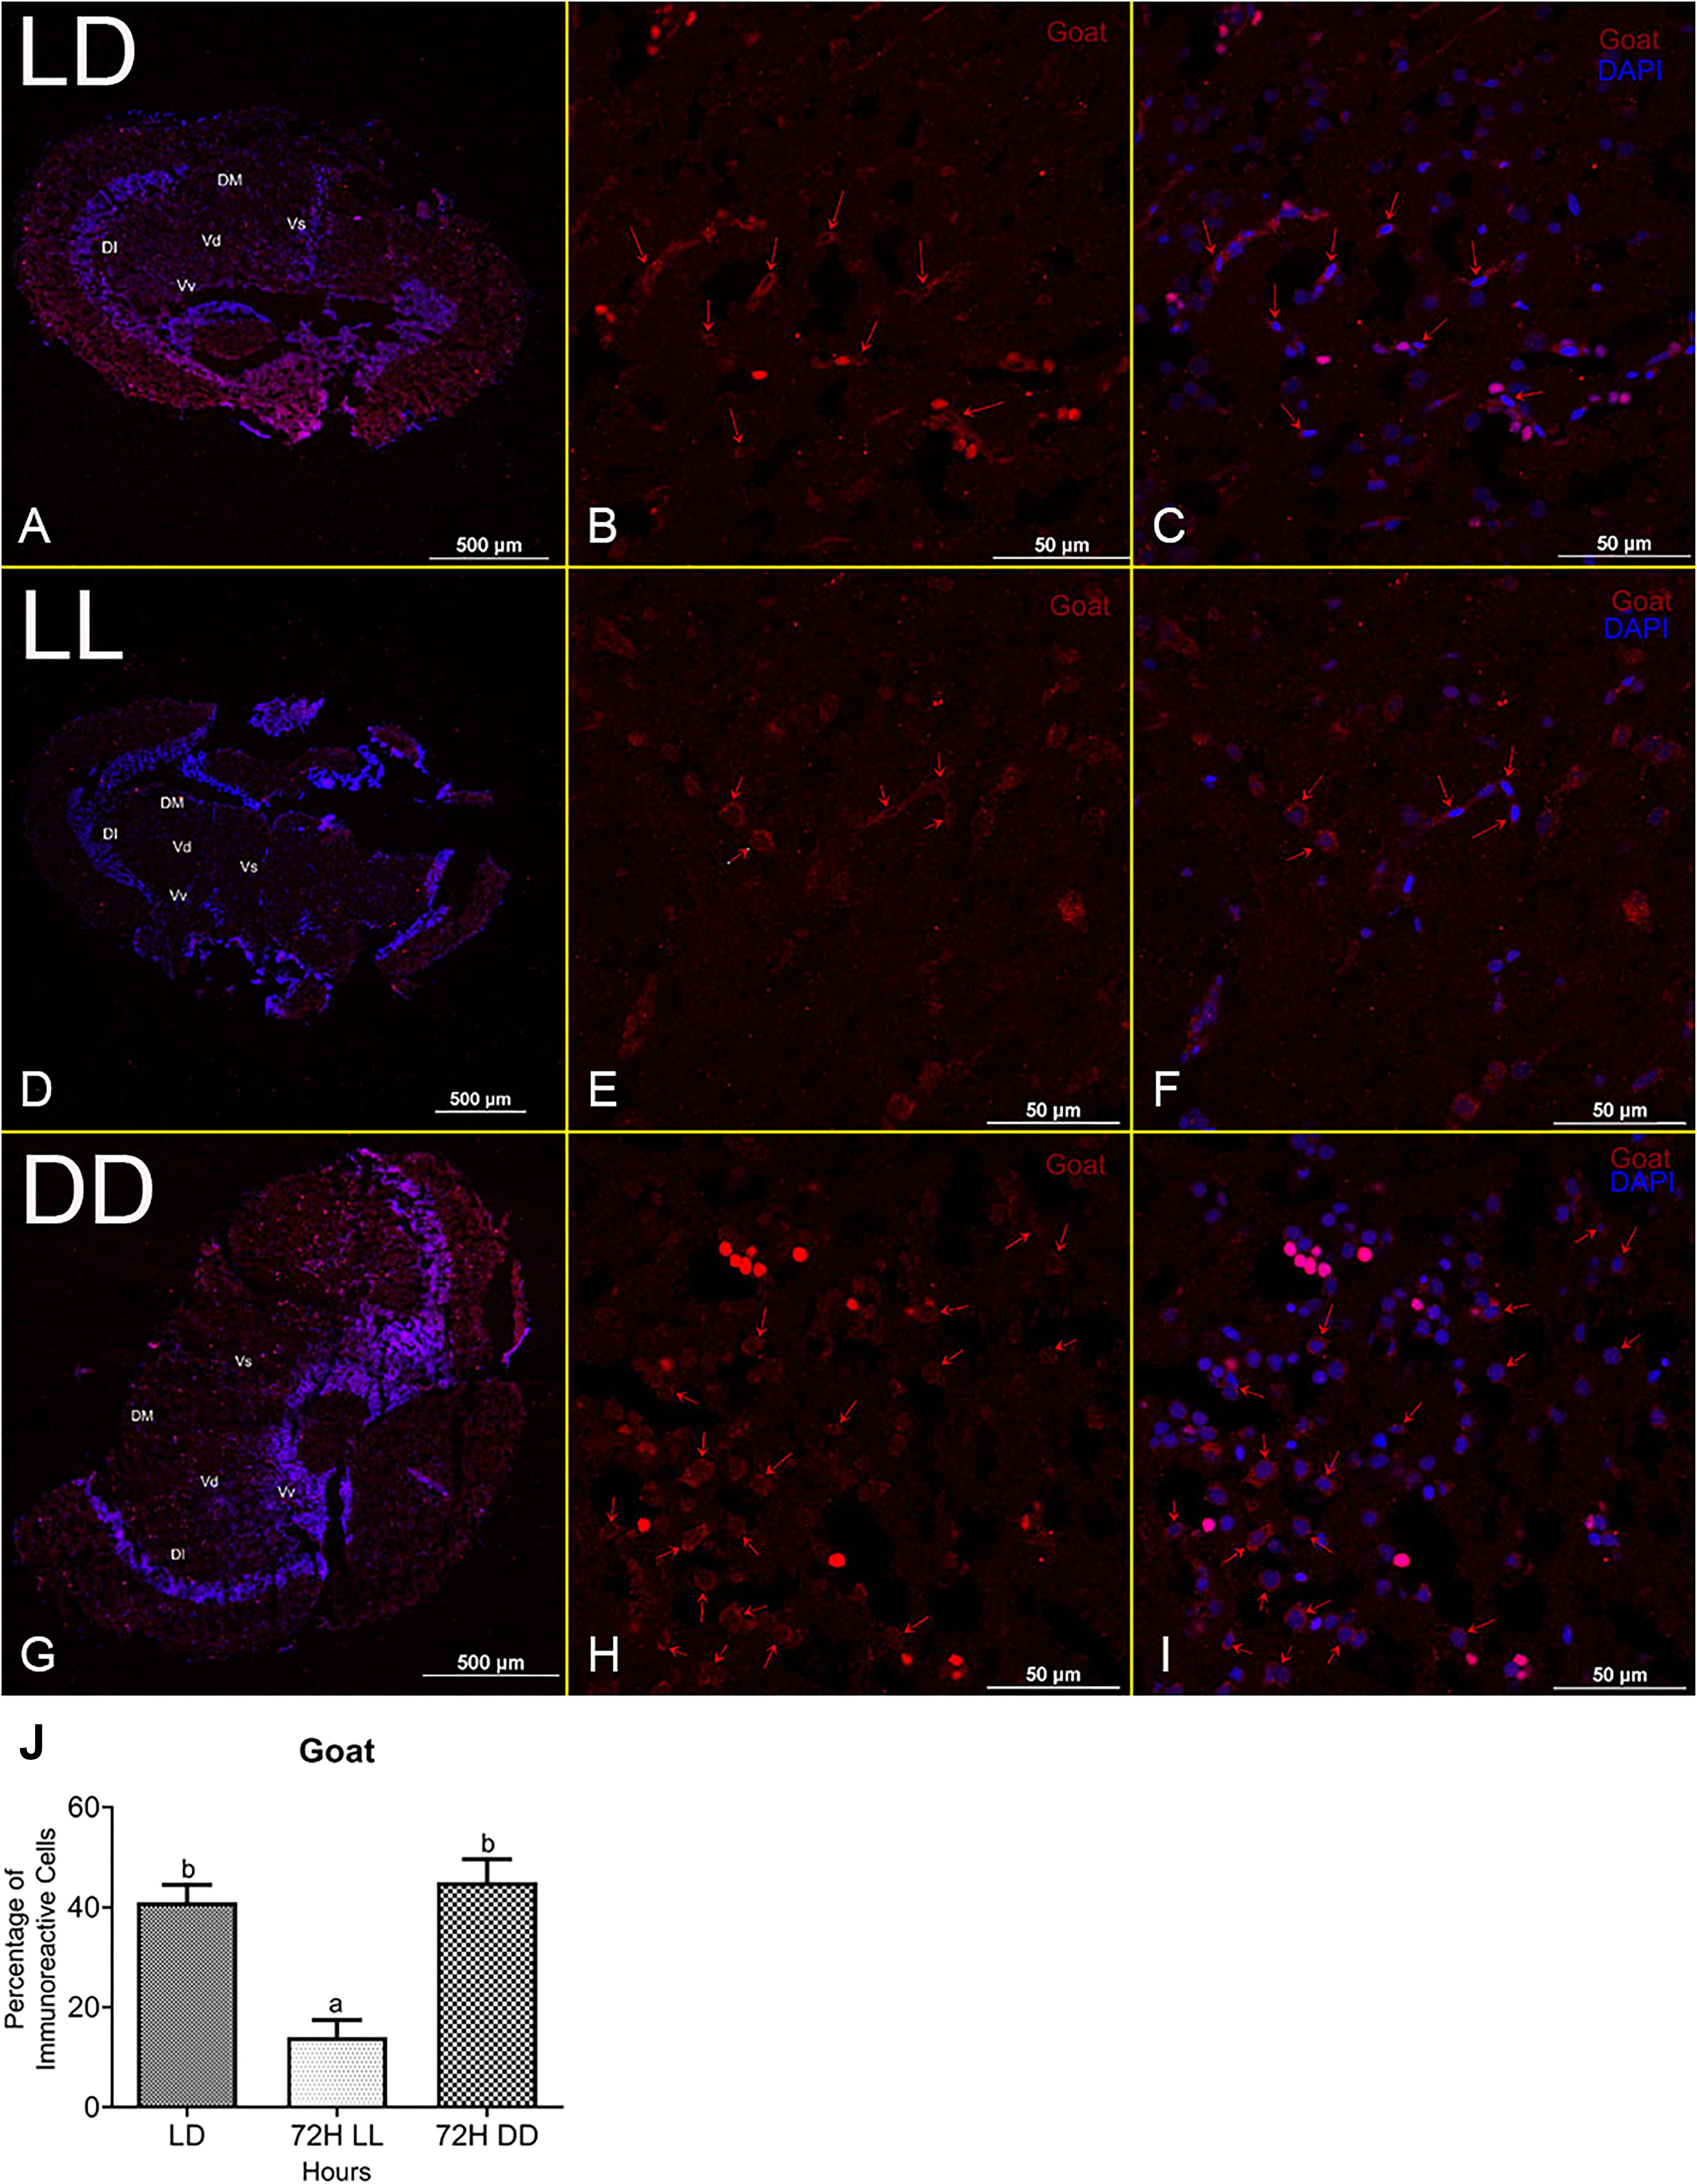
Figure 5. Localization and characterization of Goat in zebrafish brain under different photic conditions (LD, LL, and DD). The figure shows Goat immunoreactivity cells in LD (B), LL (E), and DD (H) in the telencephalon region of the brain in zebrafish. Immunohistochemical localization shows Goat immunoreactive cells (red arrow) in the dorsomedial, dorsolateral, and ventromedial zone of the telencephalon in the brain. The whole section of the brain through the telencephalic region (A,D,G), Goat-positive cells (red) (B,E,H), and merge imaged with nuclear stain DAPI (C,F,I). Relative abundance of Goat immunopositive cells in the brain under different photic conditions. The relative quantification values in the graph are shown as the mean ± SEM (n = 5). Different letters indicate significant differences evaluated by one-way ANOVA [F(2,6) = 18.816, p = 0.003] followed by post-hoc Tukey’s test (p < 0.05) (J). For the percentage calculation method, please consult the section “Materials and Methods.” Representative images were taken from multiple sections of five separate zebrafish brain in each experimental condition (Vs, supracommissural nucleus; Vd, dorsal nucleus; Vv, ventral nucleus of ventromedial telencephalon).
We have found that the mRNA expression pattern of leptin and goat was changed in continuous photoperiodic conditions. From the immunohistochemical localization study, after 72 h of incubation in different photoperiodic conditions (LD, LL, and DD), it was found that the immunoreactive cells against leptin and goat were decreased in LL and increased in DD compared to LD in the brain of zebrafish. Similarly, Western blot analysis of leptin and goat with a corresponding band of 16 and 50 kd, respectively, showed an increase in DD, whereas no significant variation was found in LL compared to LD (Figure 6). There is no such report available in fish regarding expression at the translational level of leptin and goat in the brain, although it was demonstrated that zebrafish expression was increased under unfed conditions at the transcriptional level of goat in the brain and at the transcriptional and translational level of goat in the gut (Hatef et al., 2015).
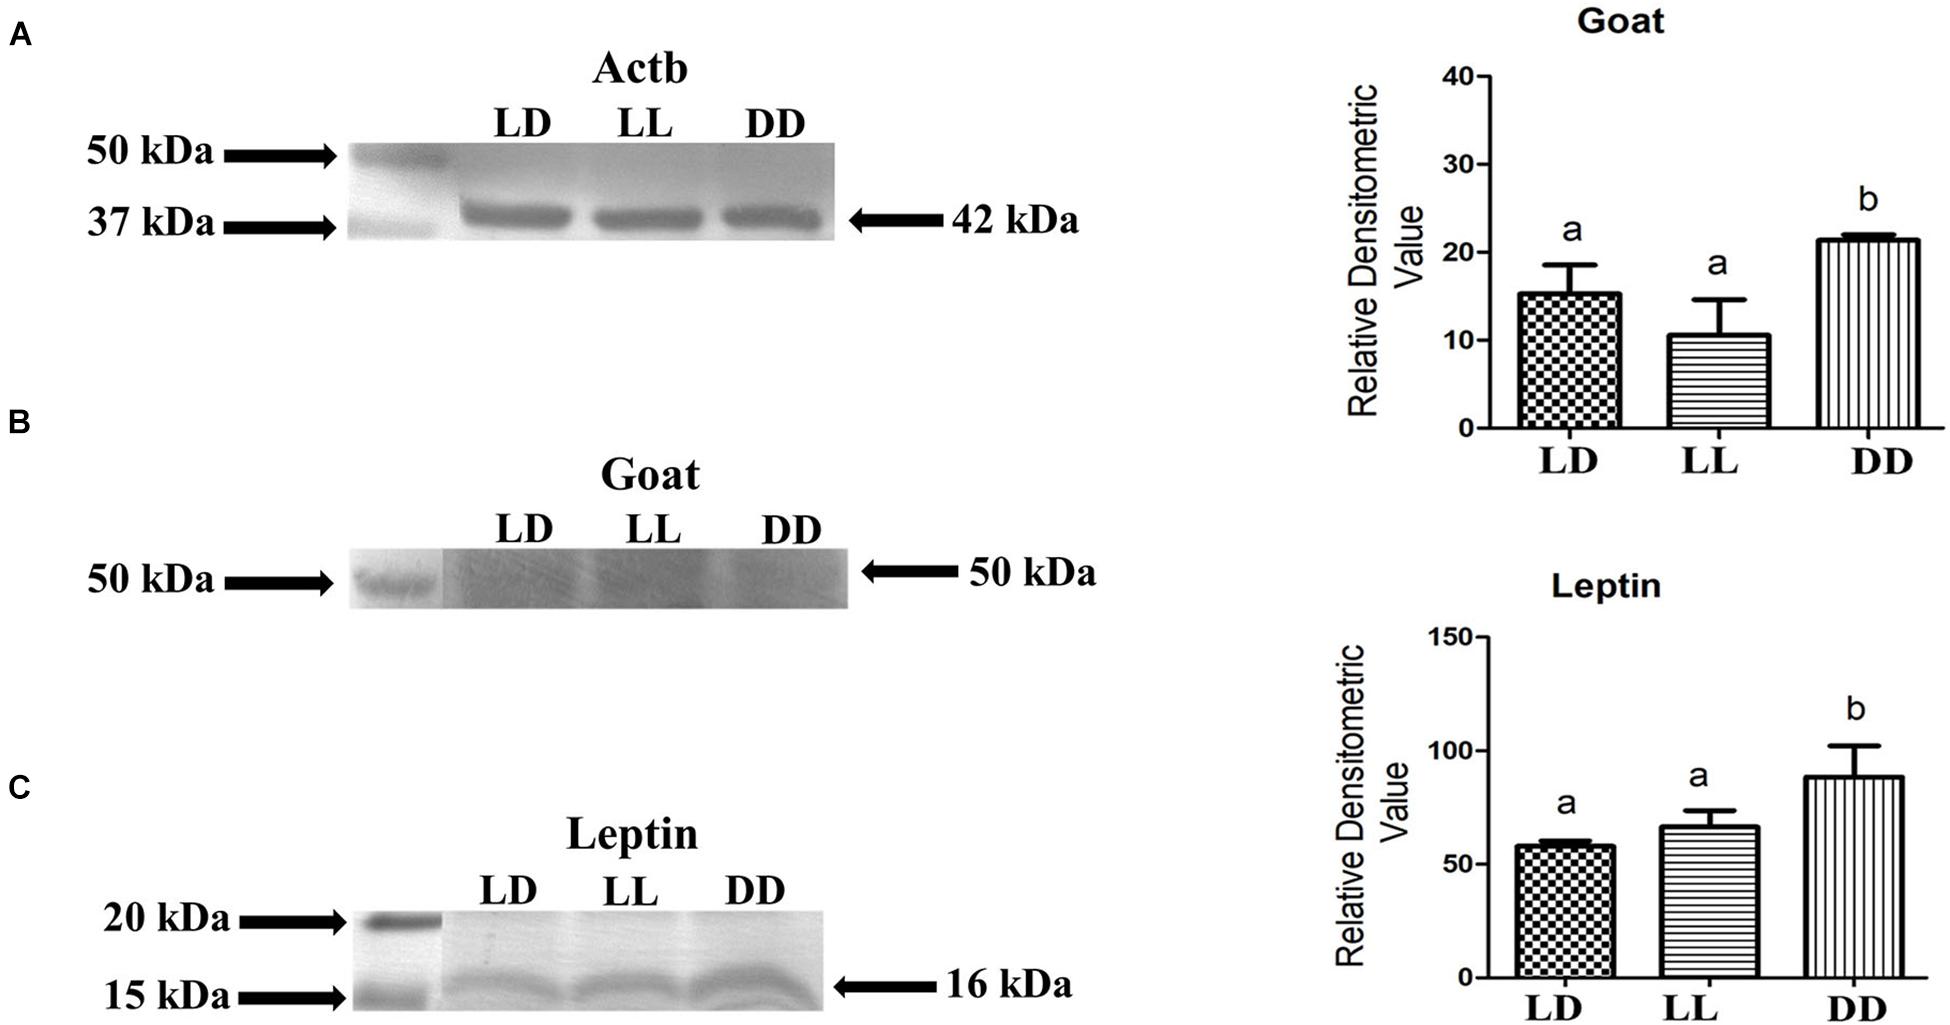
Figure 6. Leptin and Goat proteins are expressed in zebrafish brain and are affected by different photic conditions. Representative immunoblot shows bands representing Actb corresponding to 42 kDa (A), Goat corresponding to 50 kDa (B) and Leptin corresponding to 16 kDa (C). Average relative protein expression levels from five zebrafish brain from each experimental condition were analyzed by densitometry analysis. One-way ANOVA [(B) F(2,6) = 32.327, p = 0.001, (C) F(2,6) = 60.216, p = 0.000] followed by post-hoc Tukey’s test has been done for statistically significant relative quantification. Groups sharing a common letter show no significant difference (p < 0.05; n = 5 zebrafish).
Melatonin, a chronobiotic molecule, is mainly synthesized in the pineal organ and retinal. This neuroendocrine hormone is the key signal of the vertebrate circadian clock, and it is related to many processes that have a common rhythmic expression such as food intake, metabolism, and glucose uptake (Reiter, 1991; Falcon et al., 2007; Cipolla-Neto et al., 2014; Mondal et al., 2021b). In this study, we have found a significantly higher level of melatonin in continuous dark. The level of melatonin in the brain was approximately 350 pg/100 mg of tissue and 410 pg/ml in serum in constant dark (24D; DD). However, the melatonin level was reduced under LL, and it was approximately 190 pg/100 mg of tissue in the brain and 250 pg/ml in serum in comparison to LD, which was about 280 pg/100 mg and 345 pg/ml of tissue in the brain and serum, respectively (Supplementary Figure 2). A similar type of elevation in the brain and serum melatonin in continuous dark and decline in continuous light was reported in zebrafish and common dentex (Pavlidis et al., 1999).
In few fish, the different photoperiod and feeding schedules demonstrated the daily expression pattern of leptin, preproghrelin, and ghrelin in the brain, liver, and gut (Tinoco et al., 2014; Mondal et al., 2021a). However, the localization of ghrelin and goat was detected only in the gut under similar conditions (Hatef et al., 2015; Sanchez-Bretano et al., 2015; Blanco et al., 2017). However, information on the expression pattern and cellular localization of leptin and goat (third peptide involved in ghrelinergic system) in the brain of zebrafish under different photoperiods with scheduled feeding is missing. These two peptide hormones and enzymes are mainly responsible for central appetite regulation and energy balance (Shlimun and Unniappan, 2011). The present study, for the first time, demonstrates the daily expression pattern of leptin and goat under different photoperiodic conditions in the brain of zebrafish along with the level of melatonin (in both brain and serum) and Ga-SI after 72 h of incubation under different photoperiods. According to the transcriptional expression profile under different photic conditions, the immunohistochemical localization and immunoblotting of leptin and goat after 72 h of incubation conclusively demonstrate the presence and level of leptin and the ghrelinergic system in the zebrafish brain. The brain goat mRNA increased following 3 days of fasting and remained the same up to 7 days in zebrafish (Hatef et al., 2015).
In goldfish, a rhythmic pattern of expression of leptin and ghrelin in the brain has been reported in normal photoperiod and scheduled feeding (Tinoco et al., 2014; Sanchez-Bretano et al., 2015). Although feeding timing can affect the leptin and ghrelin expression in the brain, feeding itself cannot synchronize the rhythm. Moreover, the clock gene cannot control the rhythmic expression alone (Tinoco et al., 2014; Sanchez-Bretano et al., 2015; Blanco et al., 2017). So, environmental factors like light–dark cycle, feeding time, and endogenous oscillators such as clock genes, hormones, and food-derived metabolites are all involved in the daily rhythmic expression of these two important appetite-regulatory peptide hormones (Simon et al., 1998; Kalsbeek et al., 2001; Cuesta et al., 2009; Falcon et al., 2010; Tsang et al., 2014). The central appetite-controlling device is well conserved among vertebrates, which include many orexigenic (appetite-stimulating) and anorexigenic (appetite-inhibiting) neuropeptides and hormones in mammals, which are also evident in fish (Ronnestad et al., 2017). These neuropeptides and hormones are mainly controlled by leptin, insulin, and ghrelin (Page et al., 2020). The phenomenon of disruption of circadian rhythms and the development of obesity are established by many researchers proposing the possibilities of leptin-ghrelin resistance (Hernández Morante et al., 2020). The molecular mechanisms of leptin and ghrelin resistance are still under investigation. In this regard, the daily expression pattern of leptin and ghrelin was demonstrated in goldfish, but the effect of photic conditions on daily expression patterns in other fish, mammals, and other vertebrates is totally unknown. In this study, the daily mRNA expression pattern of these two-appetite regulators leptin and goat (indirect estimation for active form of ghrelin) in the brain of zebrafish (indirect estimation for active form of ghrelin) was demonstrated in different photic conditions (LD, LL, and DD) with scheduled feeding to avoid the masking effect of feeding. Leptin mRNA expression in the brain shows the highest peak at ZT12 or at the end of the light phase and lowest at the end of the dark phase (Figure 2A). Hypothalamic acrophase in leptin expression is known before or during mealtime in goldfish (Tinoco et al., 2014). Our study indicates that leptin expression peak coincides with the highest Ga-SI or at the time of the full meal. This supports the notion that an increase in leptin is not the postprandial response of the brain (Tinoco et al., 2014). As a result, an increase in circulating leptin is expected during night-time and can lower nocturnal activity. The lowest levels of circulating leptin is anticipated before the food-anticipatory activity during daytime in these animals (Vivas et al., 2011). In goldfish, the 24-h rhythm of leptin expression in hypothalamus is regained with scheduled feeding under 24 L and 24-h fasting conditions. However, in the peripheral organ, leptin does not perform similarly, establishing the different functions for central and peripheral leptin. On the other hand, under 24 L and 24-h fasting conditions with shifting feeding, leptin rhythm is abolished in both brain and peripheral organ (Tinoco et al., 2014). Unlikely, our data reveal the total depletion of leptin expression after 2 days of incubation in LL (Figure 2B), whereas in DD (Figure 2C), it was in the same phase as LD with scheduled feeding. In both continuous photic conditions, a 2.5-fold decrease in amplitude of expression of leptin in the brain was observed. Such type of results indicates the pleotropic nature of central leptin and further study is needed to determine the role of centrally synthesized leptin. The goat mRNA expression in the brain also displayed a daily variation with night-time surge in LD with the earlier said scheduled feeding (Figure 3A), and the same type of night-time peak of preproghrelin was found in the central and peripheral organ of goldfish (Sanchez-Bretano et al., 2015; Blanco et al., 2017). The amplitude in the expression level of goat in the brain was lower than that of leptin at LD, which is the same as earlier reported in zebrafish (Montalbano et al., 2018). Moreover, a twofold increase in expression level was detected under continuous photic conditions compared to normal photic conditions (Figure 3). Some studies on goldfish and mammals reported that the daily variation in expression of leptin and goat is driven by endogenous oscillations or circadian systems, which may involve clock genes, photoperiod, hormones, and different metabolites (Cuesta et al., 2009; Froy, 2010). In this regard, melatonin is a key component of the circadian system in vertebrates (Falcon et al., 2010). It was also reported that the 24-h ghrelinergic expression profile overlaps with melatonin, a key component of the circadian system in vertebrates, and melatonin and leptin act in similar intracellular signaling pathways (Falcon et al., 2010; Montalbano et al., 2018). The SCN controls melatonin synthesis in the pineal gland based on environmental photic information, the main clue for the melatonin level in both blood and cerebrospinal fluid in mammals (Simonneaux and Ribelayga, 2003). Melatonin is the hormonal mediator of photoperiodic information to the central nervous system in vertebrates, allowing the regulation of energy homeostasis through the establishment of a proper balance between energy intake and energy expenditure (Lopez-Olmeda et al., 2006; Falcon et al., 2007). This energy balance and food intake control by melatonin happens directly or indirectly due to modification of secretions of hormones involved in food intake control mainly by stimulating the anorexigenic and inhibiting the orexigenic signals (Lima-Cabello et al., 2014). In this communication, we have found an increase and a decrease in Ga-SI of zebrafish in continuous light, LL and continuous dark, DD, respectively (Figure 1), whereas brain and serum melatonin levels were observed as an indicator and show significantly low and high levels in continuous light and dark, respectively, compared to normal photoperiod (Supplementary Figure 2). Similar to mammals, melatonin is the primary neurohumoral output of the circadian system in zebrafish (Zhdanova, 2011). The involvement of melatonin in the regulation of appetite and food intake is reported by many authors (Pandi-Perumal et al., 2006; Piccinetti et al., 2010). In teleost fish, melatonin can reduce food intake and control energy balance by activating anorexigenic and inhibiting orexigenic peptides (Piccinetti et al., 2010). This finding again supports the involvement of melatonin in food intake. Melatonin may play a role as an intermediate between circadian disruption to the alteration in the transcript expression profile of appetite regulation-related genes in the brain such as leptin and goat. As a change is observed in leptin expression under altered photic conditions (Figures 2B,C) and in LL, a decline in expression of goat was observed from the second day (Figure 3B), but in DD, a high level of expression was observed throughout the experiment (Figure 3C). The present study and two previous studies from our laboratory (Yumnamcha et al., 2017; Khan et al., 2018) have indicated a significant change in melatonin level either in the central/peripheral organ or in serum under different photic conditions. From our immunohistochemistry study (Figures 4, 5), it was found that the number of leptin immunoreactive cells is lower in LL and higher in DD in comparison to LD. This finding again supports the stimulating effect of melatonin on leptin (Piccinetti et al., 2010). The goat immunoreactivity was low in LL and high in DD, which further supports the finding that the goat mRNA increases after 3 days of fasting (Hatef et al., 2015) in zebrafish. To our knowledge, immunohistochemical localization of leptin in the brain of fish was not there, although in Wistar rats, leptin receptors were localized with anorexigenic peptides (Romanova et al., 2018), whereas preproghrelin was detected in goldfish hypothalamus (Kerbel and Unniappan, 2012) and co-localization of the ghrelinergic system with the orexigenic hormone was shown in hypothalamus of goldfish (Willesen et al., 1999). So, localization of leptin and goat in the zebrafish brain for the first time confirms the role of leptin and goat in feeding. Our immunoblot study also shows a similar type of expression with an immunohistochemical study for leptin and goat in zebrafish brain (Figure 6). The measurement of orexigenic and anorexigenic molecules/peptides in the serum will clarify the issue further in the future.
The balance in energy metabolism through food intake is the primary property of life. Feeding ensures daily activities, somatic growth, immune system development, reproductive investments, and so on. It has been elaborated that environmental factors (mainly photoperiod) and signals from the brain and peripheral organs give impetus to the central feeding center (in the brain) to regulate feeding and energy homeostasis (Volkoff, 2016). It is evident that molecules like leptin, ghrelin, and melatonin, responsible for feeding and energy homeostasis, are cyclically regulated by the circadian system (Bass and Takahashi, 2010; Gimble et al., 2011).
In zebrafish, the rhythmic secretion of melatonin depends on the pineal, although the brain may take part in this mechanism in the daily light–dark cycle (Falcon et al., 2010; Moore and Whitmore, 2014; Khan et al., 2016). This synchronization is also correct for tropical carp (Sanjita Devi et al., 2016). However, to date, it is evidenced that the pineal organ is mainly responsible for the serum melatonin in fish, like other vertebrates (Reiter, 1980; Khan et al., 2016; Rajiv et al., 2016, 2017; Sanjita Devi et al., 2016).
In conclusion, the expression of leptin and goat transcript shows a daily variation with a pattern that is disrupted by continuous illumination and change in Ga-SI. Melatonin may have a role in this feeding regulation (in LD) as well as feeding alteration due to constant photic conditions (LL and DD) through the circadian system. The expression at the protein level of leptin after 72 h of incubation in different photic conditions shows that leptin is higher in DD compared to LD and LL. It may be the result of an inducing effect of melatonin on leptin as melatonin was higher in DD. Ga-SI was highest in LL and lowest in DD compared to LD, which indicates leptin-induced feeding inhibition in DD. Leptin is mainly regulated through photic cues through melatonin as its expression changed under different photoperiodic conditions.
Similarly, the level of goat was lower in LL and higher in DD as Ga-SI was highest in LL and lowest in DD, indicating feeding regulation of goat expression in zebrafish brain. The further question whether continuous photic conditions can disrupt the circadian system remains, which further changed the melatonin level results in changes in Ga-SI. These changes in Ga-SI may cause alteration of expression of leptin and goat. Desynchronization of the abovementioned unit may lead to different lifestyle diseases like diabetes and obesity, which is a grave concern in the present-day life, where the anthropogenic sources of light (mainly LED) is increasing day by day (Ouyang et al., 2018; Berge et al., 2020; Gomes, 2020; Schroer et al., 2020). The use of artificial light at night desynchronizes the circadian or endogenous rhythm, which may affect this peptide expression through melatonin and other factors. This phenomenon of change of “proper signal at the proper time” can also influence shift workers. In this scenario, zebrafish can be an excellent tool for biomedical research in this changing environment. Modulating the expression and activity of leptin and goat (affecting the biological action of ghrelin) in the brain could be an excellent target to develop chronotherapeutic approaches to regulate energy intake and body weight in higher mammals in these changing modern societies.
The raw data supporting the conclusions of this article will be made available by the authors, without undue reservation.
The animal study was reviewed and approved by Committee for the Purpose of Control and Supervision of Experiments on Animals, Govt. of India.
GM: acquisition of data, analysis/interpretation, statistical analysis, and drafting of the manuscript. ZK: critical analysis of the data, organization of figures, and preparation of the manuscript. SD, RL, and AC: concept/design, manuscript preparation, and critical review of the definitive version. All authors contributed to the article and approved the submitted version.
We would like to thank the Director, IBSD, India, and CSIR-JRF Programme to GM [09/1044(0003)/2016-EMR-I (20/12/2016)] for financial support.
The authors declare that the research was conducted in the absence of any commercial or financial relationships that could be construed as a potential conflict of interest.
The reviewer TY, declared a past co-authorship with several of the authors GM, SD, ZK, RL, and AC.
All claims expressed in this article are solely those of the authors and do not necessarily represent those of their affiliated organizations, or those of the publisher, the editors and the reviewers. Any product that may be evaluated in this article, or claim that may be made by its manufacturer, is not guaranteed or endorsed by the publisher.
We would like to thank W. Rahul for the continuous support in the collection and maintenance of fish in the IBSD Zebrafish Facility, Imphal, Manipur, India. We would also like to thank the security personnel of the Institute for their support in this long experiment during holidays. We would also like to thank the reviewers for their suggestions. We would also like to thank every Indian taxpayer for their contribution toward the funding of this research.
The Supplementary Material for this article can be found online at: https://www.frontiersin.org/articles/10.3389/fevo.2021.676332/full#supplementary-material
Amaral, I. P., and Johnston, I. A. (2012). Circadian expression of clock and putative clock-controlled genes in skeletal muscle of the zebrafish. Am. J. Physiol. Regul. Integr. Comp. Physiol. 302, R193–R206.
Amole, N., and Unniappan, S. (2009). Fasting induces preproghrelin mRNA expression in the brain and gut of zebrafish, Danio rerio. Gen. Comp. Endocrinol. 161, 133–137. doi: 10.1016/j.ygcen.2008.11.002
Babaei, F., Ramalingam, R., Tavendale, A., Liang, Y., Yan, L. S. K., Ajuh, P., et al. (2013). Novel blood collection method allows plasma proteome analysis from single zebrafish. J. Proteome Res. 12, 1580–1590. doi: 10.1021/pr3009226
Bass, J., and Takahashi, J. S. (2010). Circadian integration of metabolism and energetics. Science 330, 1349–1354. doi: 10.1126/science.1195027
Berge, J., Geoffroy, M., Daase, M., Cottier, F., Priou, P., Cohen, J. H., et al. (2020). Artificial light during the polar night disrupts Arctic fish and zooplankton behaviour down to 200 m depth. Commun. Biol. 3:102.
Biswas, A. K., and Takeuchi, T. (2003). Effects of photoperiod and feeding interval on food intake and growth rate of Nile tilapia Oreochromis niloticus L. Fish. Sci. 69, 1010–1016. doi: 10.1046/j.1444-2906.2003.00720.x
Blanco, A. M., Gómez-Boronat, M., Alonso-Gómez, ÁL., Yufa, R., Unniappan, S., Delgado, M. J., et al. (2017). Characterization of Ghrelin O-Acyltransferase (GOAT) in goldfish (Carassius auratus). PLoS One 12:e0171874. doi: 10.1371/journal.pone.0171874
Blanco, A. M., Gomez-Boronat, M., Redondo, I., Valenciano, A. I., and Delgado, M. J. (2016a). Periprandial changes and effects of short- and long-term fasting on ghrelin, GOAT, and ghrelin receptors in goldfish (Carassius auratus). J. Comp. Physiol. B 186, 727–738. doi: 10.1007/s00360-016-0986-0
Blanco, A. M., Sanchez-Bretano, A., Delgado, M. J., and Valenciano, A. I. (2016b). Brain mapping of ghrelin O-Acyltransferase in goldfish (Carassius Auratus): novel roles for the ghrelinergic system in fish? Anat. Rec. (Hoboken) 299, 748–758. doi: 10.1002/ar.23346
Brugman, S. (2016). The zebrafish as a model to study intestinal inflammation. Dev. Comp. Immunol. 64, 82–92. doi: 10.1016/j.dci.2016.02.020
Chattoraj, A., Bhattacharyya, S., Basu, D., Bhattacharya, S., Bhattacharya, S., and Maitra, S. K. (2005). Melatonin accelerates maturation inducing hormone (MIH): induced oocyte maturation in carps. Gen. Comp. Endocrinol. 140, 145–155. doi: 10.1016/j.ygcen.2004.10.013
Chattoraj, A., Seth, M., and Maitra, S. K. (2008). Influence of serotonin on the action of melatonin in MIH-induced meiotic resumption in the oocytes of carp Catla catla. Comp. Biochem. Physiol. A Mol. Integr. Physiol. 150, 301–306. doi: 10.1016/j.cbpa.2008.03.014
Chattoraj, A., Seth, M., and Maitra, S. K. (2009). Localization and dynamics of Mel(1a) melatonin receptor in the ovary of carp Catla catla in relation to serum melatonin levels. Comp. Biochem. Physiol. A Mol. Integr. Physiol. 152, 327–333. doi: 10.1016/j.cbpa.2008.11.010
Cipolla-Neto, J., Amaral, F. G., Afeche, S. C., Tan, D. X., and Reiter, R. J. (2014). Melatonin, energy metabolism, and obesity: a review. J. Pineal Res. 56, 371–381. doi: 10.1111/jpi.12137
Copeland, D. L., Duff, R. J., Liu, Q., Prokop, J., and Londraville, R. L. (2011). Leptin in teleost fishes: an argument for comparative study. Front. Physiol. 2:26. doi: 10.3389/fphys.2011.00026
Cruz, S. A., Tseng, Y. C., Kaiya, H., and Hwang, P. P. (2010). Ghrelin affects carbohydrate-glycogen metabolism via insulin inhibition and glucagon stimulation in the zebrafish (Danio rerio) brain. Comp. Biochem. Physiol. A Mol. Integr. Physiol. 156, 190–200. doi: 10.1016/j.cbpa.2010.01.019
Cuesta, M., Clesse, D., Pévet, P., and Challet, E. (2009). From daily behavior to hormonal and neurotransmitters rhythms: comparison between diurnal and nocturnal rat species. Horm. Behav. 55, 338–347. doi: 10.1016/j.yhbeh.2008.10.015
Denver, R. J., Bonett, R. M., and Boorse, G. C. (2011). Evolution of leptin structure and function. Neuroendocrinology 94, 21–38. doi: 10.1159/000328435
Dharmajyoti Devi, S., Mondal, G., Ahmad Khan, Z., Labala, R. K., Kumar Sarma, H., and Chattoraj, A. (2021a). Daily rhythmic expression patterns of melatonin bio-synthesizing genes in zebrafish (Danio rerio) testis in response to altered feeding condition. J. Endocrinol. Reprod. 24, 31–41.
Dharmajyoti Devi, S., Mondal, G., Khan, Z. A., Sarma, H. K., and Chattoraj, A. (2021b). Differential gene expression and immunohistochemical localization of the key melatonin biosynthesizing enzymes in the testis of zebrafish (Danio rerio). Biol. Rhythm Res. 1–17. doi: 10.1080/09291016.2021.1926078
Falcinelli, S., Rodiles, A., Unniappan, S., Picchietti, S., Gioacchini, G., Merrifield, D. L., et al. (2016). Probiotic treatment reduces appetite and glucose level in the zebrafish model. Sci. Rep. 6:18061.
Falcon, J., Besseau, L., Sauzet, S., and Boeuf, G. (2007). Melatonin effects on the hypothalamo-pituitary axis in fish. Trends Endocrinol. Metab. 18, 81–88. doi: 10.1016/j.tem.2007.01.002
Falcon, J., Migaud, H., Munoz-Cueto, J. A., and Carrillo, M. (2010). Current knowledge on the melatonin system in teleost fish. Gen. Comp. Endocrinol. 165, 469–482. doi: 10.1016/j.ygcen.2009.04.026
Frøiland, E., Murashita, K., Jørgensen, E. H., and Kurokawa, T. (2010). Leptin and ghrelin in anadromous Arctic charr: cloning and change in expressions during a seasonal feeding cycle. Gen. Comp. Endocrinol. 165, 136–143. doi: 10.1016/j.ygcen.2009.06.010
Froy, O. (2010). Metabolism and circadian rhythms–implications for obesity. Endocr. Rev. 31, 1–24. doi: 10.1210/er.2009-0014
Gahete, M. D., Córdoba-Chacón, J., Salvatori, R., Castaño, J. P., Kineman, R. D., and Luque, R. M. (2010). Metabolic regulation of ghrelin O-acyl transferase (GOAT) expression in the mouse hypothalamus, pituitary, and stomach. Mol. Cell Endocrinol. 317, 154–160. doi: 10.1016/j.mce.2009.12.023
Gimble, J. M., Sutton, G. M., Bunnell, B. A., Ptitsyn, A. A., and Floyd, Z. E. (2011). Prospective influences of circadian clocks in adipose tissue and metabolism. Nat. Rev. Endocrinol. 7, 98–107. doi: 10.1038/nrendo.2010.214
Gomes, D. G. E. (2020). Orb-weaving spiders are fewer but larger and catch more prey in lit bridge panels from a natural artificial light experiment. PeerJ 8:e8808. doi: 10.7717/peerj.8808
Gómez Abellán, P., Gómez Santos, C., Madrid, J. A., Milagro, F. I., Campion, J., Martínez, J. A., et al. (2011). Site-specific circadian expression of leptin and its receptor in human adipose tissue. Nutr. Hosp. 26, 1394–1401.
Hanna, R. N., Daly, S. C., Pang, Y., Anglade, I., Kah, O., Thomas, P., et al. (2010). Characterization and expression of the nuclear progestin receptor in zebrafish gonads and brain. Biol. Reprod. 82, 112–122. doi: 10.1095/biolreprod.109.078527
Hatef, A., Yufa, R., and Unniappan, S. (2015). Ghrelin O-Acyl transferase in zebrafish is an evolutionarily conserved peptide upregulated during calorie restriction. Zebrafish 12, 327–338. doi: 10.1089/zeb.2014.1062
Helwig, M., Archer, Z. A., Heldmaier, G., Tups, A., Mercer, J. G., and Klingenspor, M. (2009). Photoperiodic regulation of satiety mediating neuropeptides in the brainstem of the seasonal Siberian hamster (Phodopus sungorus). J. Comp. Physiol. A Neuroethol. Sens. Neural. Behav. Physiol. 195, 631–642. doi: 10.1007/s00359-009-0438-3
Hernández Morante, J. J., Díaz Soler, I., Muñoz, S. G. J., Sánchez, P. H., Barberá Ortega, D. M., Martínez, M. C., et al. (2020). Moderate weight loss modifies leptin and ghrelin synthesis rhythms but not the subjective sensations of appetite in obesity patients. Nutrients 12:916. doi: 10.3390/nu12040916
Hoskins, L. J., and Volkoff, H. (2012). The comparative endocrinology of feeding in fish: insights and challenges. Gen. Comp. Endocrinol. 176, 327–335. doi: 10.1016/j.ygcen.2011.12.025
Huising, M. O., Geven, E. J. W., Kruiswijk, C. P., Nabuurs, S. B., Stolte, E. H., Spanings, F. A. T., et al. (2006). Increased leptin expression in common Carp (Cyprinus carpio) after food intake but not after fasting or feeding to satiation. Endocrinology 147, 5786–5797. doi: 10.1210/en.2006-0824
Kaiya, H., Miyazato, M., Kangawa, K., Peter, R. E., and Unniappan, S. (2008). Ghrelin: a multifunctional hormone in non-mammalian vertebrates. Comp. Biochem. Physiol. A Mol. Integr. Physiol. 149, 109–128. doi: 10.1016/j.cbpa.2007.12.004
Kalsbeek, A., Fliers, E., Romijn, J. A., La Fleur, S. E., Wortel, J., Bakker, O., et al. (2001). The suprachiasmatic nucleus generates the diurnal changes in plasma leptin levels. Endocrinology 142, 2677–2685. doi: 10.1210/endo.142.6.8197
Kerbel, B., and Unniappan, S. (2012). Nesfatin-1 suppresses energy intake, co-localises ghrelin in the brain and gut, and alters ghrelin, cholecystokinin and orexin mRNA expression in goldfish. J. Neuroendocrinol. 24, 366–377. doi: 10.1111/j.1365-2826.2011.02246.x
Khan, Z. A., Labala, R. K., Yumnamcha, T., Devi, S. D., Mondal, G., Sanjita Devi, H., et al. (2018). Artificial Light at Night (ALAN), an alarm to ovarian physiology: a study of possible chronodisruption on zebrafish (Danio rerio). Sci. Total Environ. 628-629, 1407–1421. doi: 10.1016/j.scitotenv.2018.02.101
Khan, Z. A., Yumnamcha, T., Rajiv, C., Devi, H. S., Mondal, G., Devi, S. D., et al. (2016). Melatonin biosynthesizing enzyme genes and clock genes in ovary and whole brain of zebrafish (Danio rerio): Differential expression and a possible interplay. Gen. Comp. Endocrinol. 233, 16–31. doi: 10.1016/j.ygcen.2016.05.014
Kobayashi, Y., Quiniou, S., Booth, N. J., and Peterson, B. C. (2011). Expression of leptin-like peptide (LLP) mRNA in channel catfish (Ictalurus punctatus) is induced by exposure to Edwardsiella ictaluri but is independent of energy status. Gen. Comp. Endocrinol. 173, 411–418. doi: 10.1016/j.ygcen.2011.06.011
Kojima, M., Hosoda, H., Date, Y., Nakazato, M., Matsuo, H., and Kangawa, K. (1999). Ghrelin is a growth-hormone-releasing acylated peptide from stomach. Nature 402, 656–660. doi: 10.1038/45230
Kopp, R., Legler, J., and Legradi, J. (2018). Alterations in locomotor activity of feeding zebrafish larvae as a consequence of exposure to different environmental factors. Environ. Sci. Pollut. Res. Int. 25, 4085–4093. doi: 10.1007/s11356-016-6704-3
Li, M. D. (2011). Leptin and beyond: an odyssey to the central control of body weight. Yale J. Biol. Med. 84, 1–7.
Lim, C. T., Kola, B., Grossman, A., and Korbonits, M. (2011). The expression of ghrelin O-acyltransferase (GOAT) in human tissues. Endocr. J. 58, 707–710. doi: 10.1507/endocrj.k11e-117
Lima-Cabello, E., Diaz-Casado, M. E., Guerrero, J. A., Otalora, B. B., Escames, G., Lopez, L. C., et al. (2014). A review of the melatonin functions in zebrafish physiology. J. Pineal Res. 57, 1–9. doi: 10.1111/jpi.12149
Livak, K. J., and Schmittgen, T. D. (2001). Analysis of relative gene expression data using real-time quantitative PCR and the 2(-Delta Delta C(T)) method. Methods 25, 402–408. doi: 10.1006/meth.2001.1262
Lopez-Olmeda, J. F., Madrid, J. A., and Sanchez-Vazquez, F. J. (2006). Melatonin effects on food intake and activity rhythms in two fish species with different activity patterns: Diurnal (goldfish) and nocturnal (tench). Comp. Biochem. Physiol. A Mol. Integr. Physiol. 144, 180–187. doi: 10.1016/j.cbpa.2006.02.031
Matsuda, K., Miura, T., Kaiya, H., Maruyama, K., Shimakura, S., Uchiyama, M., et al. (2006). Regulation of food intake by acyl and des-acyl ghrelins in the goldfish. Peptides 27, 2321–2325. doi: 10.1016/j.peptides.2006.03.028
Moen, A. G., and Finn, R. N. (2013). Short-term, but not long-term feed restriction causes differential expression of leptins in Atlantic salmon. Gen. Comp. Endocrinol. 183, 83–88. doi: 10.1016/j.ygcen.2012.09.027
Mondal, G., Dharmajyoti Devi, S., Ahmad Khan, Z., Kumar Labala, R., and Chattoraj, A. (2021a). Light, feeding and melatonin: an interplay in the appetite regulation in the gut of zebrafish (Danio rerio). J. Endocrinol. Reprod. 23, 81–97.
Mondal, G., Dharmajyoti Devi, S., Khan, Z. A., Yumnamcha, T., Rajiv, C., Sanjita Devi, H., et al. (2021b). The influence of feeding on the daily rhythm of mRNA expression on melatonin bio-synthesizing enzyme genes and clock associated genes in the zebrafish (Danio rerio) gut. Biol. Rhythm Res. 58, 1–18. doi: 10.1080/09291016.2021.1905989
Montalbano, G., Mania, M., Abbate, F., Navarra, M., Guerrera, M. C., Laura, R., et al. (2018). Melatonin treatment suppresses appetite genes and improves adipose tissue plasticity in diet-induced obese zebrafish. Endocrine 62, 381–393. doi: 10.1007/s12020-018-1653-x
Moore, H. A., and Whitmore, D. (2014). Circadian rhythmicity and light sensitivity of the zebrafish brain. PLoS One 9:e86176. doi: 10.1371/journal.pone.0086176
Ouyang, J. Q., Davies, S., and Dominoni, D. (2018). Hormonally mediated effects of artificial light at night on behavior and fitness: linking endocrine mechanisms with function. J. Exp. Biol. 221:jeb156893.
Page, A. J., Christie, S., Symonds, E., and Li, H. (2020). Circadian regulation of appetite and time restricted feeding. Physiol. Behav. 220:112873. doi: 10.1016/j.physbeh.2020.112873
Pandi-Perumal, S. R., Srinivasan, V., Maestroni, G. J., Cardinali, D. P., Poeggeler, B., and Hardeland, R. (2006). Melatonin: Nature’s most versatile biological signal? FEBS J. 273, 2813–2838. doi: 10.1111/j.1742-4658.2006.05322.x
Park, H. K., and Ahima, R. S. (2015). Physiology of leptin: energy homeostasis, neuroendocrine function and metabolism. Metabolism 64, 24–34. doi: 10.1016/j.metabol.2014.08.004
Pavlidis, M., Greenwood, L., Paalavuo, M., Mölsä, H., and Laitinen, J. T. (1999). The effect of photoperiod on diel rhythms in serum melatonin, cortisol, glucose, and electrolytes in the common dentex, Dentex dentex. Gen. Comp. Endocrinol. 113, 240–250. doi: 10.1006/gcen.1998.7190
Piccinetti, C. C., Migliarini, B., Olivotto, I., Coletti, G., Amici, A., and Carnevali, O. (2010). Appetite regulation: the central role of melatonin in Danio rerio. Horm. Behav. 58, 780–785. doi: 10.1016/j.yhbeh.2010.07.013
Portaluppi, F., Smolensky, M. H., and Touitou, Y. (2010). Ethics and methods for biological rhythm research on animals and human beings. Chronobiol. Int. 27, 1911–1929. doi: 10.3109/07420528.2010.516381
Rajiv, C., Sanjita Devi, H., Mondal, G., Devi, S. D., Khan, Z. A., Yumnamcha, T., et al. (2016). Daily and seasonal expression profile of serum melatonin and its biosynthesizing enzyme genes (tph1, aanat1, aanat2, and hiomt) in pineal organ and retina: a study under natural environmental conditions in a tropical carp, Catla catla. J. Exp. Zool. A Ecol. Genet. Physiol. 325, 688–700. doi: 10.1002/jez.2061
Rajiv, C., Sanjita Devi, H., Mondal, G., Devi, S. D., Khan, Z. A., Yumnamcha, T., et al. (2017). Cloning, phylogenetic analysis and tissue distribution of melatonin bio-synthesizing enzyme genes (Tph1, Aanat1, Aanat2 and Hiomt) in a tropical carp, Catla catla. Biol. Rhythm Res. 48, 371–386. doi: 10.1080/09291016.2016.1263019
Reed, B., and Jennings, M. (2011). Guidance on the Housing and Care of Zebrafish, Danio Rerio. Southwater: Research Animals Department, Science Group, RSPCA.
Reiter, R. J. (1980). The pineal and its hormones in the control of reproduction in mammals. Endocr. Rev. 1, 109–131. doi: 10.1210/edrv-1-2-109
Reiter, R. J. (1991). Pineal melatonin: cell biology of its synthesis and of its physiological interactions. Endocr. Rev. 12, 151–180. doi: 10.1210/edrv-12-2-151
Romanova, I. V., Derkach, K. V., Mikhrina, A. L., Sukhov, I. B., Mikhailova, E. V., and Shpakov, A. O. (2018). The leptin, dopamine and serotonin receptors in hypothalamic POMC-neurons of normal and obese rodents. Neurochem. Res. 43, 821–837. doi: 10.1007/s11064-018-2485-z
Ronnestad, I., Gomes, A. S., Murashita, K., Angotzi, R., Jonsson, E., and Volkoff, H. (2017). Appetite-controlling endocrine systems in teleosts. Front. Endocrinol. (Lausanne) 8:73. doi: 10.3389/fendo.2017.00073
Rønnestad, I., Nilsen, T. O., Murashita, K., Angotzi, A. R., Gamst Moen, A. G., Stefansson, S. O., et al. (2010). Leptin and leptin receptor genes in Atlantic salmon: cloning, phylogeny, tissue distribution and expression correlated to long-term feeding status. Gen. Comp. Endocrinol. 168, 55–70. doi: 10.1016/j.ygcen.2010.04.010
Sakata, I., Yang, J., Lee, C. E., Osborne-Lawrence, S., Rovinsky, S. A., Elmquist, J. K., et al. (2009). Colocalization of ghrelin O-acyltransferase and ghrelin in gastric mucosal cells. Am. J. Physiol. Endocrinol. Metab. 297, E134–E141.
Sanchez-Bretano, A., Blanco, A. M., Unniappan, S., Kah, O., Gueguen, M. M., Bertucci, J. I., et al. (2015). In situ localization and rhythmic expression of ghrelin and ghs-r1 ghrelin receptor in the brain and gastrointestinal tract of goldfish (Carassius auratus). PLoS One 10:e0141043. doi: 10.1371/journal.pone.0141043
Sanjita Devi, H., Rajiv, C., Mondal, G., Khan, Z. A., Dharmajyoti Devi, S., Yumnamcha, T., et al. (2016). Melatonin bio-synthesizing enzyme genes (Tph1, Aanat1, Aanat2 and Hiomt) and their temporal pattern of expression in brain and gut of a tropical carp in natural environmental conditions. Cogent Biol. 2:1230337. doi: 10.1080/23312025.2016.1230337
Schroer, S., Huggins, B. J., Azam, C., and Hölker, F. (2020). Working with inadequate tools: legislative shortcomings in protection against ecological effects of artificial light at night. Sustainability 12:2551. doi: 10.3390/su12062551
Shlimun, A., and Unniappan, S. (2011). Ghrelin o-acyl transferase: bridging ghrelin and energy homeostasis. Int. J. Pept. 2011:217957.
Simon, C., Gronfier, C., Schlienger, J. L., and Brandenberger, G. (1998). Circadian and ultradian variations of leptin in normal man under continuous enteral nutrition: relationship to sleep and body temperature. J. Clin. Endocrinol. Metab. 83, 1893–1899. doi: 10.1210/jcem.83.6.4864
Simonneaux, V., and Ribelayga, C. (2003). Generation of the melatonin endocrine message in mammals: a review of the complex regulation of melatonin synthesis by norepinephrine, peptides, and other pineal transmitters. Pharmacol. Rev. 55, 325–395. doi: 10.1124/pr.55.2.2
Stengel, A., Goebel, M., Wang, L., Reeve, J. R. Jr., Taché, Y., and Lambrecht, N. W. (2010a). Lipopolysaccharide differentially decreases plasma acyl and desacyl ghrelin levels in rats: potential role of the circulating ghrelin-acylating enzyme GOAT. Peptides 31, 1689–1696. doi: 10.1016/j.peptides.2010.06.015
Stengel, A., Goebel, M., Wang, L., Taché, Y., Sachs, G., and Lambrecht, N. W. (2010b). Differential distribution of ghrelin-O-acyltransferase (GOAT) immunoreactive cells in the mouse and rat gastric oxyntic mucosa. Biochem. Biophys. Res. Commun. 392, 67–71. doi: 10.1016/j.bbrc.2009.12.169
Suzuki, K., Simpson, K. A., Minnion, J. S., Shillito, J. C., and Bloom, S. R. (2010). The role of gut hormones and the hypothalamus in appetite regulation. Endocr. J. 57, 359–372. doi: 10.1507/endocrj.k10e-077
Tang, R., Dodd, A., Lai, D., Mcnabb, W. C., and Love, D. R. (2007). Validation of zebrafish (Danio rerio) reference genes for quantitative real-time RT-PCR normalization. Acta Biochim. Biophys. Sin. (Shanghai) 39, 384–390. doi: 10.1111/j.1745-7270.2007.00283.x
Tinoco, A. B., Nisembaum, L. G., De Pedro, N., Delgado, M. J., and Isorna, E. (2014). Leptin expression is rhythmic in brain and liver of goldfish (Carassius auratus). Role of feeding time. Gen. Comp. Endocrinol. 204, 239–247. doi: 10.1016/j.ygcen.2014.06.006
Tinoco, A. B., Nisembaum, L. G., Isorna, E., Delgado, M. J., and De Pedro, N. (2012). Leptins and leptin receptor expression in the goldfish (Carassius auratus). Regulation by food intake and fasting/overfeeding conditions. Peptides 34, 329–335. doi: 10.1016/j.peptides.2012.02.001
Tsang, A. H., Barclay, J. L., and Oster, H. (2014). Interactions between endocrine and circadian systems. J. Mol. Endocrinol. 52, R1–R16.
Unniappan, S., Lin, X., Cervini, L., Rivier, J., Kaiya, H., Kangawa, K., et al. (2002). Goldfish ghrelin: molecular characterization of the complementary deoxyribonucleic acid, partial gene structure and evidence for its stimulatory role in food intake. Endocrinology 143, 4143–4146. doi: 10.1210/en.2002-220644
Valassi, E., Scacchi, M., and Cavagnini, F. (2008). Neuroendocrine control of food intake. Nutr. Metab. Cardiovasc. Dis. 18, 158–168.
Vivas, Y., Azpeleta, C., Feliciano, A., Velarde, E., Isorna, E., Delgado, M. J., et al. (2011). Time-dependent effects of leptin on food intake and locomotor activity in goldfish. Peptides 32, 989–995. doi: 10.1016/j.peptides.2011.01.028
Volkoff, H. (2016). The neuroendocrine regulation of food intake in fish: a review of current knowledge. Front. Neurosci. 10:540. doi: 10.3389/fnins.2016.00540
Volkoff, H., Canosa, L. F., Unniappan, S., Cerda-Reverter, J. M., Bernier, N. J., Kelly, S. P., et al. (2005). Neuropeptides and the control of food intake in fish. Gen. Comp. Endocrinol. 142, 3–19.
Wang, X., Villar, V. A., Tiu, A., Upadhyay, K. K., and Cuevas, S. (2018). Dopamine D2 receptor up-regulates leptin and IL-6 in adipocytes. J. Lipid Res. 59, 607–614. doi: 10.1194/jlr.m081000
Westerfield, M. (2000). The Zebrafish Book : A Guide for the Laboratory Use of Zebrafish (Danio rerio). Eugene, OR: University of Oregon Press.
Willesen, M. G., Kristensen, P., and Rømer, J. (1999). Co-localization of growth hormone secretagogue receptor and NPY mRNA in the arcuate nucleus of the rat. Neuroendocrinology 70, 306–316. doi: 10.1159/000054491
Wren, A. M., Seal, L. J., Cohen, M. A., Brynes, A. E., Frost, G. S., Murphy, K. G., et al. (2001). Ghrelin enhances appetite and increases food intake in humans. J. Clin. Endocrinol. Metab. 86:5992. doi: 10.1210/jcem.86.12.8111
Xu, B., Kalra, P. S., Farmerie, W. G., and Kalra, S. P. (1999). Daily changes in hypothalamic gene expression of neuropeptide Y, galanin, proopiomelanocortin, and adipocyte leptin gene expression and secretion: effects of food restriction. Endocrinology 140, 2868–2875. doi: 10.1210/endo.140.6.6789
Yang, J., Brown, M. S., Liang, G., Grishin, N. V., and Goldstein, J. L. (2008). Identification of the acyltransferase that octanoylates ghrelin, an appetite-stimulating peptide hormone. Cell 132, 387–396. doi: 10.1016/j.cell.2008.01.017
Yumnamcha, T., Khan, Z. A., Rajiv, C., Devi, S. D., Mondal, G., Sanjita Devi, H., et al. (2017). Interaction of melatonin and gonadotropin-inhibitory hormone on the zebrafish brain-pituitary-reproductive axis. Mol. Reprod. Dev. 84, 389–400. doi: 10.1002/mrd.22795
Zhang, Y., Proenca, R., Maffei, M., Barone, M., Leopold, L., and Friedman, J. M. (1994). Positional cloning of the mouse obese gene and its human homologue. Nature 372, 425–432. doi: 10.1038/372425a0
Keywords: ALAN, melatonin, circadian clock, orexigenic, anorexigenic
Citation: Mondal G, Khan ZA, Devi SD, Labala RK and Chattoraj A (2021) The Daily Pattern of Expression of Leptin and Ghrelin O-Acyl Transferase Under Various Lighting Schedules in the Whole Brain of Zebrafish (Danio rerio). Front. Ecol. Evol. 9:676332. doi: 10.3389/fevo.2021.676332
Received: 05 March 2021; Accepted: 15 July 2021;
Published: 10 August 2021.
Edited by:
Alejandro Ariel Rios-Chelen, Universidad Autonoma de Tlaxcala, MexicoReviewed by:
Thangal Yumnamcha, Wayne State University, United StatesCopyright © 2021 Mondal, Khan, Devi, Labala and Chattoraj. This is an open-access article distributed under the terms of the Creative Commons Attribution License (CC BY). The use, distribution or reproduction in other forums is permitted, provided the original author(s) and the copyright owner(s) are credited and that the original publication in this journal is cited, in accordance with accepted academic practice. No use, distribution or reproduction is permitted which does not comply with these terms.
*Correspondence: Asamanja Chattoraj, YXNhbWFuamEuY2hhdHRvcmFqQGdtYWlsLmNvbQ==; YXNhbWFuamEuY2hhdHRvcmFqQGtudS5hYy5pbg==
†These authors have contributed equally to this work
‡Present address: Zeeshan Ahmad Khan, Inje University, Gimhae, South Korea
Disclaimer: All claims expressed in this article are solely those of the authors and do not necessarily represent those of their affiliated organizations, or those of the publisher, the editors and the reviewers. Any product that may be evaluated in this article or claim that may be made by its manufacturer is not guaranteed or endorsed by the publisher.
Research integrity at Frontiers
Learn more about the work of our research integrity team to safeguard the quality of each article we publish.