 Joseph J. Luczkovich1*
 Jeffrey C. Johnson2
 Rebecca A. Deehr3
 Kevin J. Hart4
 Lisa Clough5
 David C. Griffith6
- 1Department of Biology, East Carolina University, Greenville, NC, United States
- 2Department of Anthropology, University of Florida, Gainesville, FL, United States
- 3Coastal Resources Management Program, East Carolina University, Greenville, NC, United States
- 4North Carolina Division of Coastal Management, Washington, NC, United States
- 5National Science Foundation, Arlington, VA, United States
- 6Department of Coastal Sciences, East Carolina University, Greenville, NC, United States
One goal of ecosystem-based management is studying an ecosystem and its people, the socio-ecological system, in a qualitative and quantitative modeling approach that can provide management agencies with possible outcomes of their actions using scenario forecasting. Ecosystem-based fisheries management strives to use the socio-ecological system approach, including direct and indirect impacts on multiple species including the behavioral responses of fishers after a regulatory change (a gillnet ban). Here, we link fisher behavioral networks with a mass-balanced food-web ECOPATH network model of an estuarine ecosystem and its commercial fisheries for an analysis of fishing impacts after a gillnet ban on multiple species using ECOSIM. We modeled fisher behavioral networks using reported catches of species from individual fishers along with the gear fished to create nodes in a gear/species affiliation network. Individual fishers with common gear/species use are indicative of common fishing behavior. When such fishers have high network centrality and are engaged in multiple gear/species fisheries, they can transition to other gear/species fisheries along “switching pathways” when facing a regulatory change. We used an index of joint gear participation to identify likely gear switching pathways, and we predicted changes in fishing effort after a gill net ban. We simulated the gill net ban in ECOSIM under two scenarios of fishing effort: Scenario 1, gill net fishing effort of 0%; Scenario 2, gill net fishing effort of 0% with increased effort in the alternative gear fisheries using the predicted switching pathways for the affiliation network. Scenario 1 predicted an increase in flounder (Paralichthys spp.) biomass over a decade. Under Scenario 2, fishers targeting flounders were predicted to switch from gill nets to pound nets. Scenario 2 predicted a 7% decline in flounder biomass over ten years, rather than an increase in flounders. The gillnet ban with increased effort due to switching is predicted to have the opposite effect on the conservation goal, which was to increase flounder stocks. Fishery management that incorporates a socio-ecological approach modeling both fisher behaviors and multi-species ecosystem responses can reveal single-species responses that are in the opposite direction of the anticipated management goals.
Introduction
The influence of people on ecosystem function and the dynamics of ecosystem changes on human populations is the primary focus of most socio-ecological systems research. The goal of an environmental sustainability program is to change human behaviors in a way that ecosystem function and ecological services are restored or preserved within a complex socio-ecological system, taking into account various subsystems and levels of governance (Ostrom, 2009). According to Ostrom, these subsystems include the resource systems (e.g., the ecosystem), the resource units within the ecosystem (species and abiotic subsystems), governance systems, and users of the resources. An individual resource user does not often have a major impact on an ecosystem; it is the combined behavior of many people working together to build structures, alter topography, plant crops, harvest animals, and form organizations (tribes, associations, governments, corporations, etc.) that result in these resource and ecosystem changes. People with similar behaviors, and performing similar social and ecological roles, can be revealed in analyses of the centrality of actors in social networks (Borgatti et al., 2018). Individuals working together in a related profession like fishing, when their impacts are examined cumulatively, influence ecosystem function and trophic structure dramatically (Auster et al., 1996; Torres et al., 2013; Deehr et al., 2014; Chagaris et al., 2015). Ecological services also benefit the people living in and drawing energy from an ecosystem, so there is a feedback loop from decisions made by user groups, impacts to the ecosystem, and then back to the human populations, resulting in benefits or costs to society. Sustainability and protection of ecological services will be achieved only through the understanding of both an ecosystem’s processes that produce ecological services and the social network of humans that influence and are influenced by the ecosystem processes.
In fisheries, this understanding of both the ecosystem and its people is embodied in the concept known as Ecosystem-Based Management (EBM). EBM is now a common goal for fishery policymakers (Pauly et al., 2002; Pikitch et al., 2004; Barr, 2013; Malick et al., 2017; Shabtay et al., 2018). As currently envisioned, the EBM approach involves ecological management, such as establishing marine protected areas (MPAs) (Sobel and Dahlgren, 2004; Russ and Alcala, 2011; Li et al., 2020), and considering multiple species impacts rather than managing catches on a species-by-species basis (Walters et al., 2006; Harvey et al., 2010). EBM also involves socio-economic management, including involving the social and economic goals of the fishing community and other stakeholders in each ecosystem (Fassina et al., 2020; Reid and Rout, 2020; Watson et al., 2021), engaging these stakeholders in a collaborative process to define problems and propose solutions (Perruso et al., 2017; Tuda et al., 2021), recognizing that humans are a key component in an ecosystem, understanding ecosystem processes (Harvey et al., 2020) and how humans affect these and are affected by these processes, estimating the costs and benefits of various management options and summing net benefits across all fishery sectors (Browman and Stergiou, 2004). The website Ecosystem-based Tools Network1 provides a useful synthesis of these approaches.
Although there have been numerous attempts at implementing these EBM goals in fisheries, few of these involve modeling the behavior and social networks of fishers to determine how changes in the regulatory environment, economic markets, and ecosystems are influencing fishers’ choice of methods to fish. Fisher behavior is the greatest source of uncertainty in fisheries management (Fulton et al., 2011) and social network analysis can help understand this behavior and gear choices used by fishers. Social networks of resource harvesters are theorized to have a strong influence over such decision-making, especially those with the role of brokers, who are fishers with exclusive ties to many other fisher groups, or with high levels of network betweenness or structural uniqueness (Johnson, 1986; Crona and Bodin, 2006; Bodin and Crona, 2009; Alexander et al., 2015; Bodin, 2017; Van Holt et al., 2017). These high-betweenness actors may be information brokers, not fish dealers per se, but fishers with a social role that may have a potentially large influence over others in the community, sharing information, news of regulations or fishing opportunities, and fishing innovations (Johnson, 1986). For example, “clam kicking,” a novel fishing technique that used a boat’s propeller wash to expose clams in seagrass beds and on the sides of navigation channels, was developed by key fishers that were central and structurally unique in the social network of a North Carolina (United States) estuarine fishing community (Johnson, 1986). This technique was adopted widely as a productive (but also destructive to habitat) fishing approach by most fishers within a few years. It is now banned in seagrass beds and permitted for use seasonally in restricted areas. In another more recent example, lobster potting captains in England interact in social networks about where to fish and also to share information in a network; the most successful captains have high network centrality and produce the greatest lobster harvest (Turner et al., 2014). These results demonstrated that fisheries managers who wish to understand and regulate a fishery should undertake social network analyses and include discussions with high-centrality captains if they wish to successfully manage the fishery. These high-centrality actors in the network may also be the fishers most likely to switch to a new gear type in a new environment (due to regulatory changes, environmental changes, innovations of new gear, or climate regime shifts that cause fished species to redistribute themselves). A few studies have looked at the subsequent impact of fisher switching among gear on future harvest rates, but switching between fisheries is expected to be observed only when the profitability of switching is very large, given the fact that fishers must acquire new gear and expertise to enter a new fishery (Opaluch and Bockstael, 1984; Bene and Tewfik, 2001). Recently, adaptive capacity to change among over 600 fisheries-gear types that were derived from license data shows the potential for switching between gears that target different fishes and species in the face of environmental uncertainty (Stoll et al., 2017). Furthermore, a network analysis of cross-fishery spillovers has been examined using Alaskan fishery permits, which showed the switching behavior among permits held by fishers after the implementation of an individual transferrable quota system (Addicott et al., 2019). Johnson and Griffith (2010) noted that these behavioral fisher networks, derived from license and fishery management harvest data, could not only be used to identify possible switching behaviors due to regulatory or environmental changes but also could be directly linked to ecological networks to understand the coupled impacts of how changes in fisher behavior affect ecosystems and vice versa. These studies suggest that the behavior of fishers can be revealed not only by interviewing fishers but also by examining government permits. Social network analysis is becoming a useful tool for examining the gear use and species targeted by fishers.
If fishers participate in multiple fisheries in a management area, and thus already possess the knowledge and appropriate gear, barriers to switching are likely very much reduced. Such pathways to switching among fisheries are identifiable using a network of gear/species interactions in an affiliation network model (Johnson and Griffith, 2010). In fisheries in Pamlico Sound, NC, United States the annual rounds of fishing strategies were examined by Johnson and Griffith (2010) from interviews with the fishers. Fishers naturally use multiple gears to catch different species during the year, and fishing behavioral networks were constructed, then used to examine clusters of fishing behaviors, interdependencies of fishing strategies, and likely switching pathways (Johnson and Griffith, 2010). Similarly, in the current study, we present the fisher behavioral network derived from government statistics of both the fishery participants’ gear use and their catches in Core Sound, NC (United States). The data are used to create a behavioral network of fishers vis-à-vis their gear and species interdependencies, then identify potential gear switching pathways. Finally, we link this behavioral network to an ECOPATH with ECOSIM network model of production and fishery harvests in Core Sound to simulate a proposed regulatory change, a gillnet ban, as it will likely impact both the ecosystem function and the behavioral networks. In this study, we make predictions concerning the likely switching behavior of the fishers to change gears along pathways that are already present in the current fishery and resulting in ecological network model predictions for important fisheries species biomass (paralichthyid flounder, southern flounder Paralichthys lethostigma) that are counter to the management goals of the large-mesh gill net ban. In this way, a socio-ecological prediction of the impacts of the gill net ban can be examined.
One way that has been used to model the ecosystem production and analyze fishing impacts on multiple species is with network models, e.g., ECOPATH with ECOSIM, which are mass-balanced food-web network models. We used this approach to create a network of interacting species or compartments using a common medium (carbon) as a currency to model ecosystem flows among the various species that were targeted by the fisheries and the ecosystem’s species (various producers and heterotrophic animals) organized in model compartments.
When regulatory changes in the fishery are proposed or occur, both the fishers and the ecosystem will respond. The ECOPATH/ECOSIM model can be used to simulate such regulatory changes’ impact on the ecosystem (Christensen and Walters, 2004; Christensen et al., 2008). Mandated harvest reductions by regulations of gear used will impact the fishery target species (increased abundance), but this increase in the target species can cause increases and declines in other species (natural predators and prey of the target species), so the changes to one species affect the population of many species over time; such indirect impacts can be tracked in network models using mixed trophic impact analysis (Ulanowicz and Puccia, 1990) and ECOSIM.
However, such an ecosystem network model relegates humans to act in an impacting role only, ignoring the impacts of regulatory changes on the fishers’ behavioral responses, which can result in shifts in fishing effort, thus impacting other species. So, the indirect impact of a new regulation or establishment of an MPA can be the increase of harvests elsewhere, with unintended consequences. True ecosystem-based management should include all such impacts, direct and indirect, on the ecosystem, including the behavioral changes of fishers’ harvesting; what is needed is an ecosystem-based management model that incorporates such fisher behavioral networks.
Here, we examine a case study of fisheries in Core Sound, NC, United States, with ecological and social network models to study the impact of fishing gear closures on the ecosystem and to simulate the impacts of a newly proposed gillnet ban on the ecosystem and the human responses to the ban. Our overall goal was to produce a framework for including humans in a socio-ecological approach. We used social and ecological network models to understand the impact of humans’ fishing activities on food webs and predict what will happen when these fishing activities are curtailed or eliminated.
Specific Objectives
(1) To describe the ecological role, network centrality, and impacts of gill netting and other multi-species fisheries’ network relations using an ECOPATH ecosystem model.
(2) To estimate the human adaptive responses based on fisher behavioral networks (gear-switching pathways) after a proposed regulatory change (a gill net ban in Core Sound, NC).
(3) To use a network analysis tool (Key Player) to examine quantitatively how a gill-netting ban would disrupt the fisher behavioral network.
(4) To simulate the impact of the gill-netting ban using gear-switching pathways from the fisher behavioral network to predict redistributed fishing effort in other fisheries and examine the ecosystem impacts after the gillnet ban.
Materials and Methods
Overall Data Analysis Approach
We used a combination of data mining and network analysis methods to study the three subsystems of a socio-ecological system by focusing on the multi-gear and species estuarine fisheries in Core Sound, North Carolina, United States. We provide an overview of the data analysis workflow in Figure 1. Both the Fisher Behavioral Network (social subsystem) and ECOPATH models (ecological subsystem) were created using the catches reported to the North Carolina Division of Marine Fisheries (NCDMF) as part of the required commercial fishing Trip Ticket Program. For these analyses, we merged our biological sampling of the ecosystem (Deehr, 2012) with the Trip Ticket harvest data to create an annualized ECOPATH model of Core Sound, North Carolina (Deehr et al., 2014). This ECOPATH model has been validated with stable isotope analysis correlating effective trophic levels and nitrogen δ15N isotopes and represents an area open to commercial shrimp trawling, skimmer trawling, gill netting, pound netting, haul seining, and crab potting. ECOPATH with ECOSIM scenarios were then created for both a gill net ban with and without a redistribution of effort based on fisher switching behavior from the social subsystem. A separate trawl net ban was simulated (see Luczkovich et al., 2018), but we only explore the gillnet ban here. Using the open-trawling annualized ECOPATH model (Deehr et al., 2014), we simulated with ECOSIM the impacts of two scenarios of gill net bans in Core Sound.
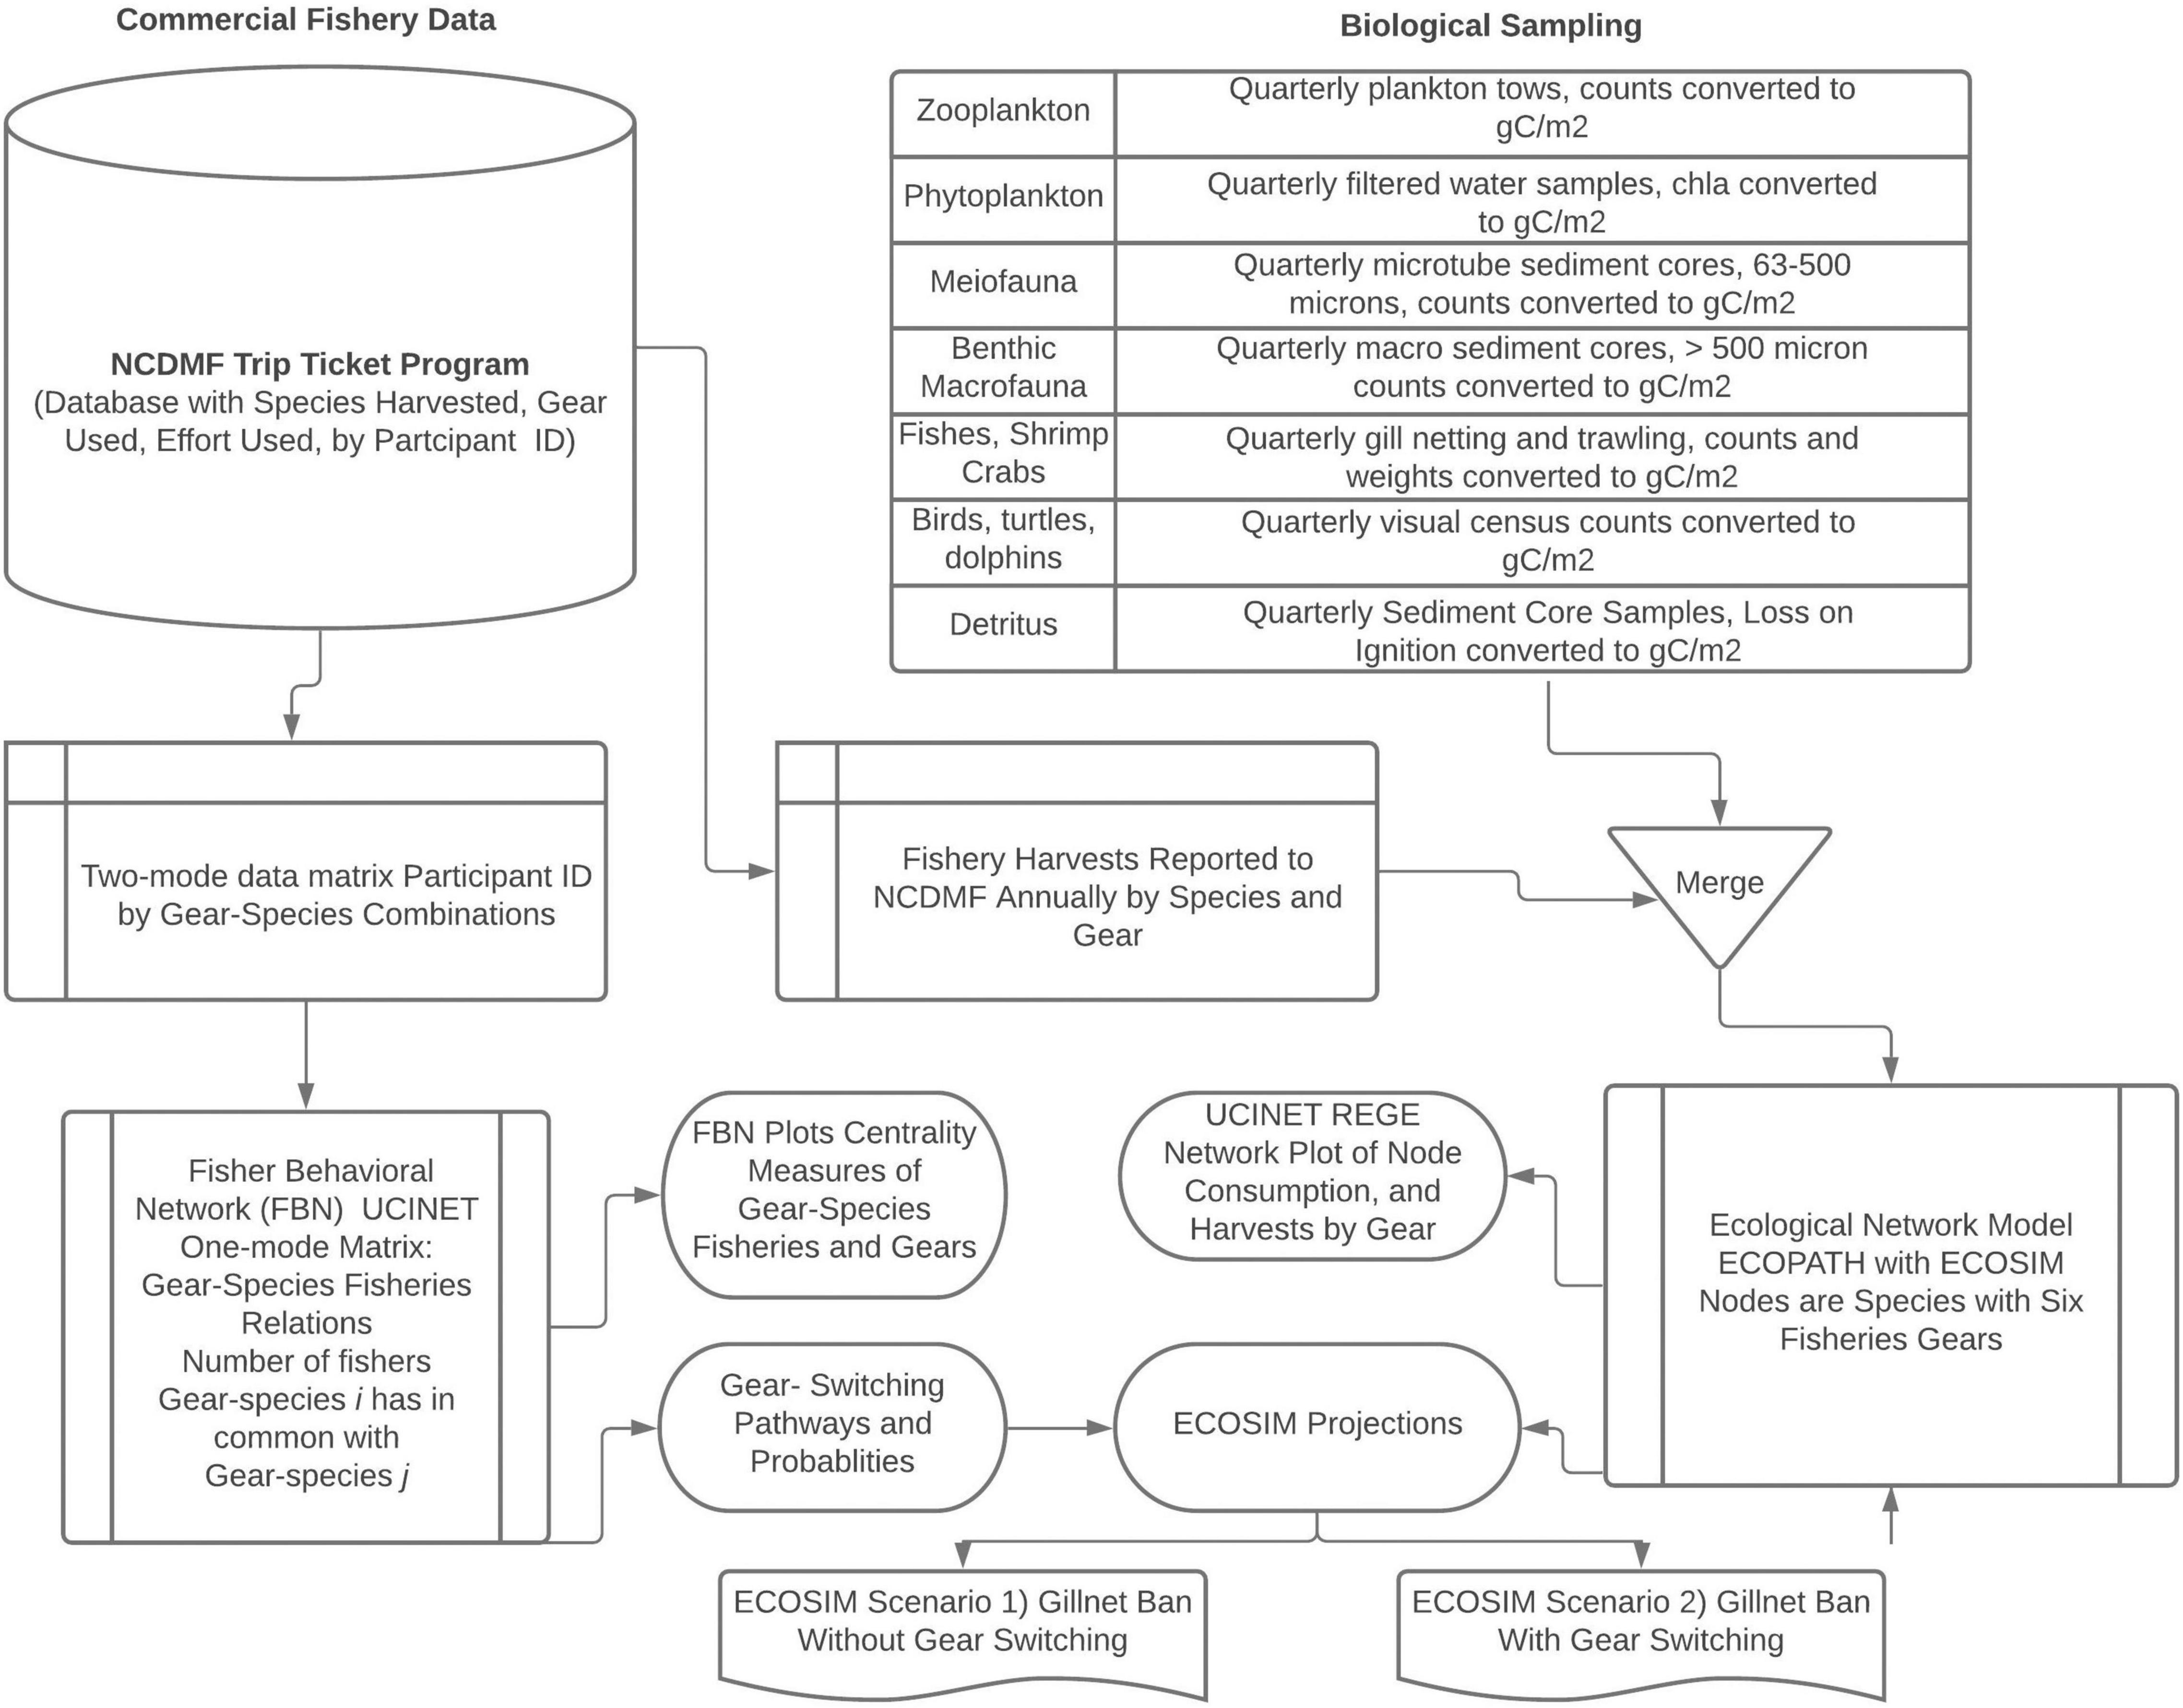
Figure 1. A diagram illustrating the data analysis workflow and manipulations for the analyses in this study. The NCDMF Trip Ticket database is used to store monthly catches reported by licensed fishers in the Core Sound management area, the gear used, the biomass landed, the effort used, the crew involved in the harvest, and the value of the catch. The participants were uniquely identified by a number without revealing their identities to the authors. In addition, according to NCDMF confidentiality protocols, individual fishers’ landings data and dollar values of their catches were not provided to us, only the species landed, and gear used, from which we created the Fisher Behavioral Network. We obtained in a separate datafile the aggregated landings biomass data and dollar values by species and gear used monthly and annually. These harvest data were merged with our own biological sampling to create an ECOPATH model. See Deehr (2012) and Deehr et al. (2014) for detailed methods on the sampling and model development. The Fisher Behavior Network and ECOPATH with ECOSIM were used together to model a gillnet ban with and without gear switching.
Study Sites
Core Sound (34°51′ N, 76°20′ W) is a narrow (5 km), relatively shallow (maximum depth of 4 m in the navigational channel) waterbody, approximately 35 km long between Shackleford Banks in the south and Cedar Island in the north in Carteret County, North Carolina (Figure 2). It is bordered to the west by several bays (Jarrett, Nelson, and Thorofare Bays), salt marshes, forests, agricultural lands, and small residential areas. Core Sound is bordered to the east by sound-side seagrass beds and the Core Banks, federally owned lands within the Cape Lookout National Seashore, which protect Core Sound from the Atlantic Ocean. There are multiple inlets (Barden, Drum, New Drum, Ophelia, and Evergreen) allowing ocean water to enter Core Sound and the adjacent bays. Since 1978, shrimp, skimmer, crab, and clam trawling have been banned in North Carolina primary and secondary nursery areas, shallow embayments which are deemed important for the protection of early life stages of shrimps, crabs, and fishes.
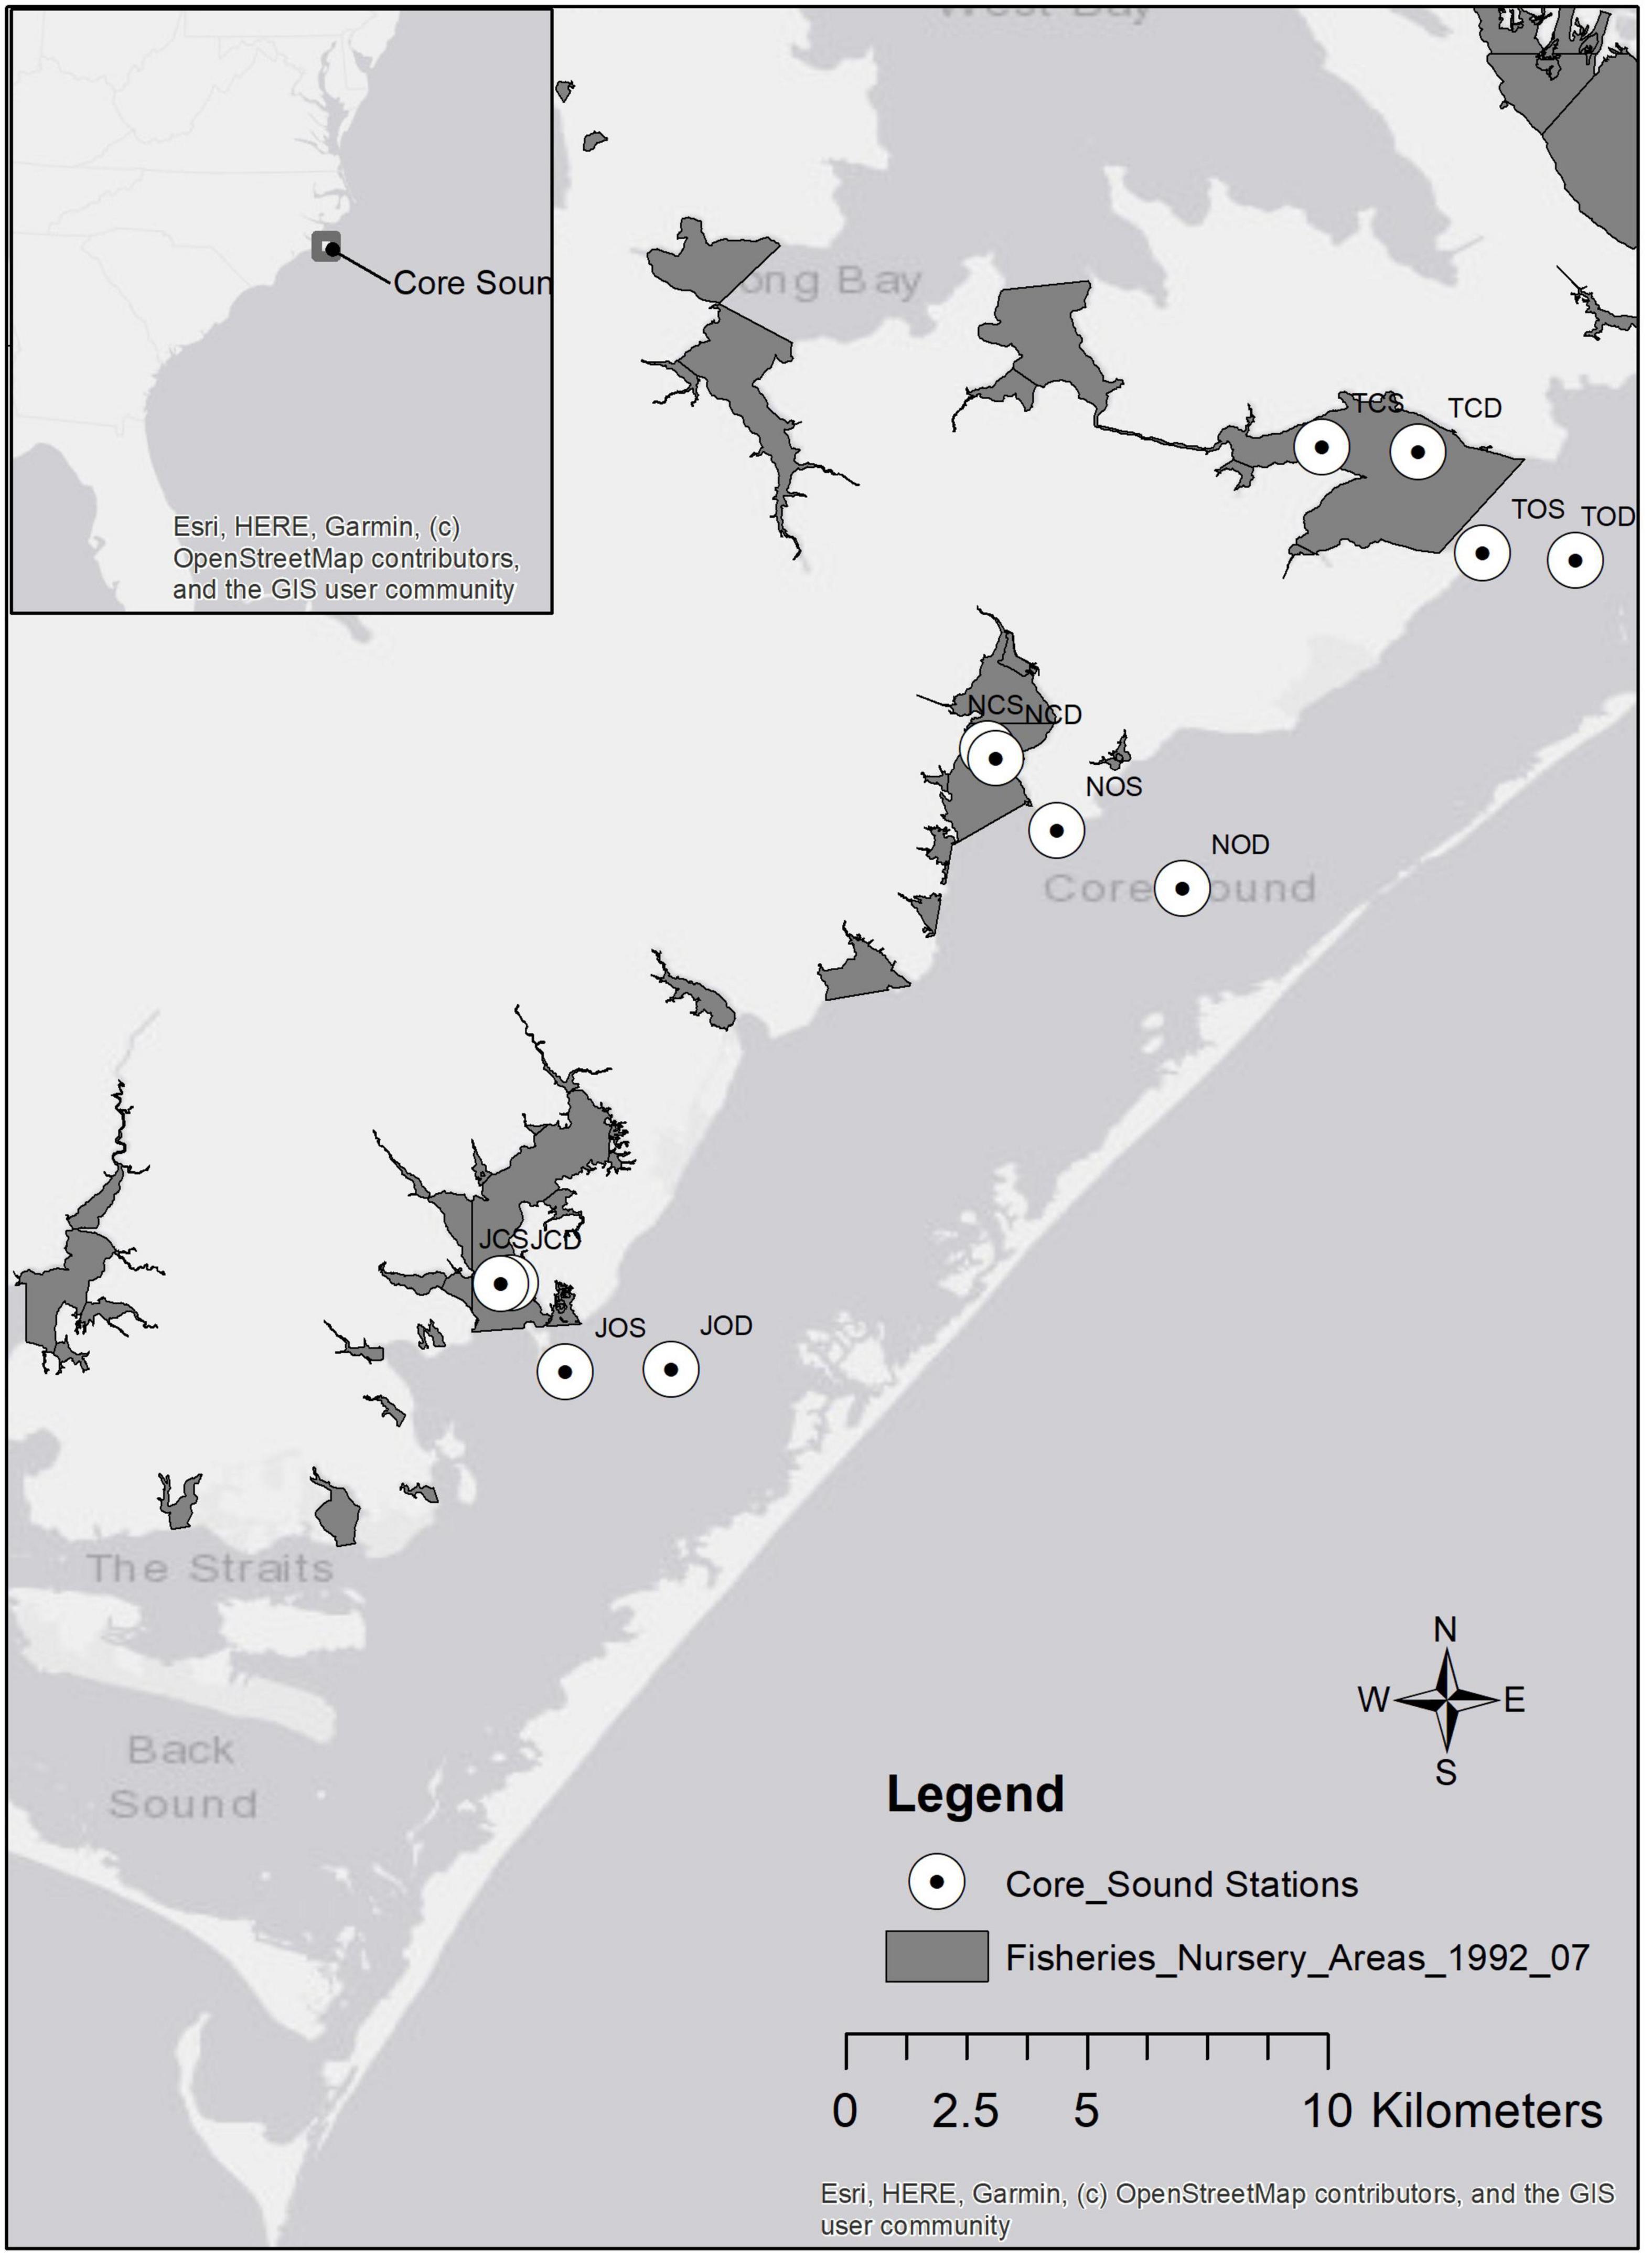
Figure 2. Map of Core Sound study area (inset shows location in North Carolina, United States). No trawling zones (Primary and Secondary Nursery Areas) established in 1978 and enforced by NCDMF are shown as dark gray areas. Sampling stations for ECOPATH model are indicated by open circles.
Case Study: Fisheries in Core Sound
Although commercial fishing in Core Sound involves a series of gears (crab pots, peeler pots, shrimp trawls, skimmer trawls, channel nets, pound nets, haul seines, gill nets > 5-inch (12.7 cm) mesh, gill nets < 5-inch mesh, gill nets run-around, swipe nets, oyster dredging, clam trawl kicking, gigs, rakes, and tongs), the main fisheries in Core Sound involve six different kinds of gear: shrimp trawling, skimmer trawling, pound netting, haul seining, gill netting, and crab potting (Taylor, 1951; Deehr, 2012; Figure 3). Shrimp trawlers target penaeid shrimps (mainly brown shrimp Penaeus aztecus). Skimmer trawlers target white shrimp Penaeus setiferus. Gill netters harvest multiple species, but southern flounder Paralichthys lethostigma is the main target. Pound netters also target this flounder and capture additional species. Haul seiners are targeting spot Leiostomous xanthurus, Atlantic croaker Micropogonias undulatus, and capture other species. Crab potters target blue crabs Callinectes sapidus.
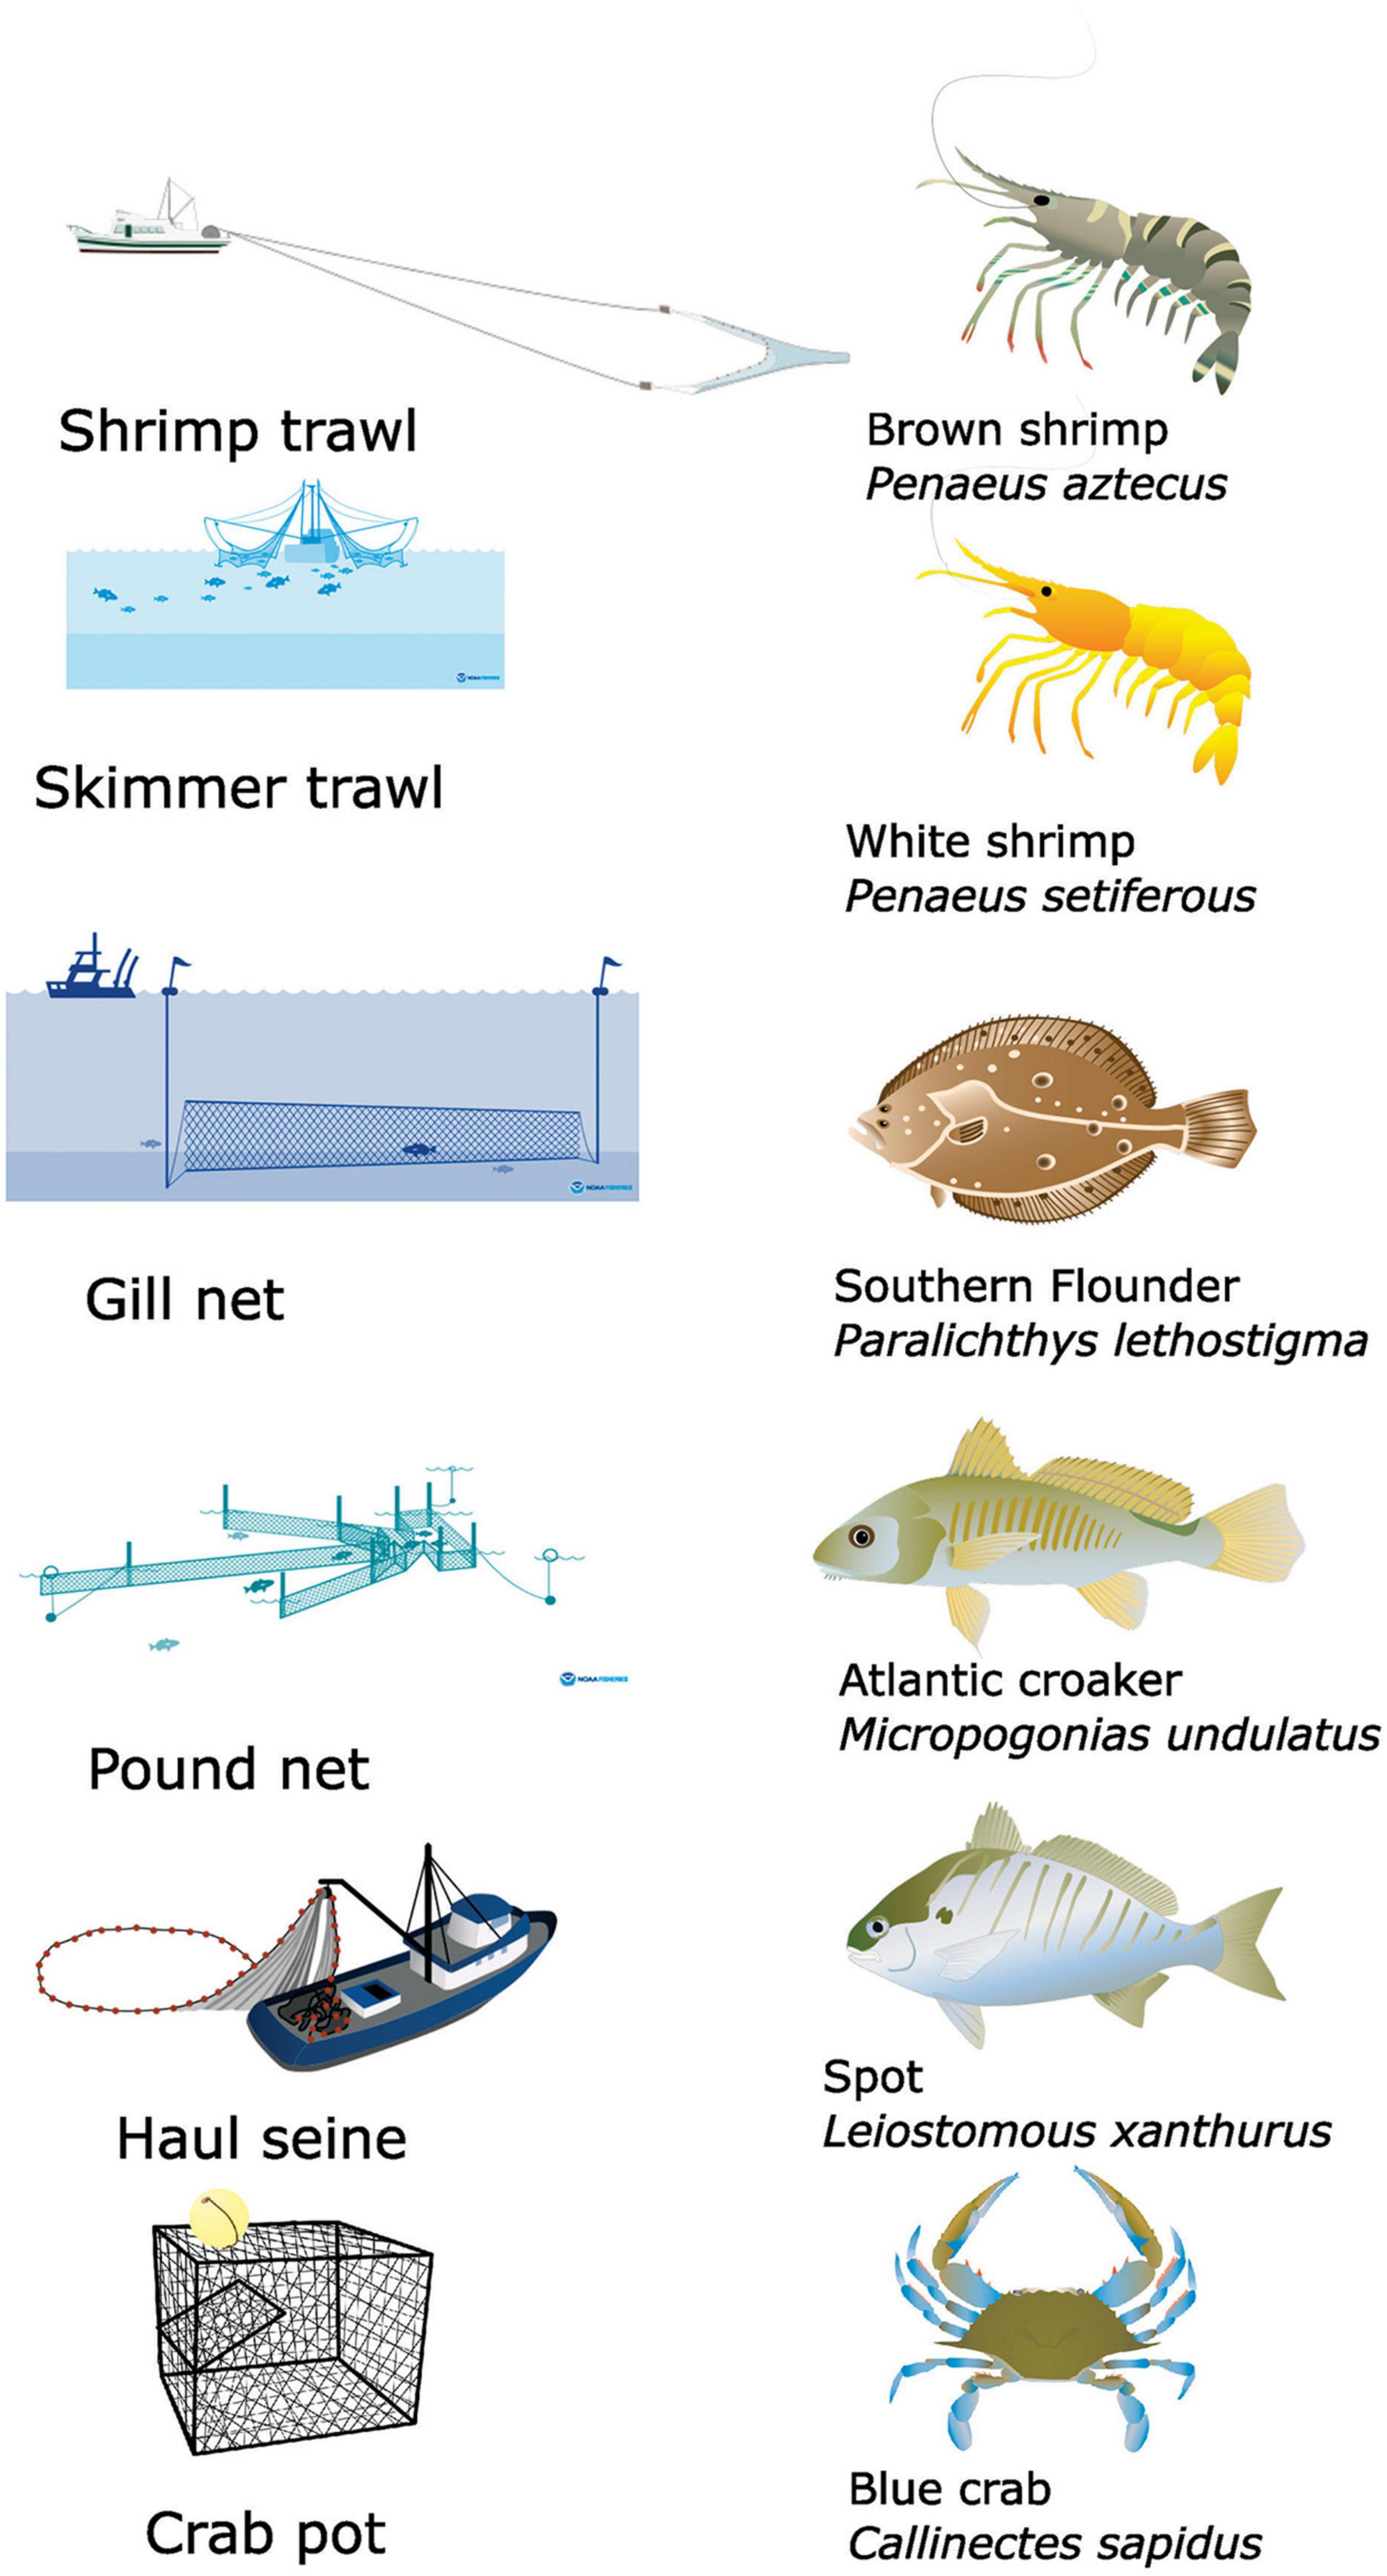
Figure 3. Illustrations of the six main gear types used and primary species harvested by each gear in commercial fisheries in Core Sound, NC (USA) that were modeled in ECOPATH. Shrimp trawling targets brown shrimp Penaeus aztecus; skimmer trawling targets white shrimp Penaeus setiferous; gillnet targets southern flounder Paralichthys lethostigma; pound net targets southern flounder Paralichthys lethostigma; haul seine targets Atlantic croaker Micropogonias undulatus and spot Leiostomous xanthurus; crab pot Callinectes sapidus. Images obtained from: Shrimp trawl, Crab pot, Haul Seine: Tracey Saxby, Integration and Application Network (https://ian.umces.edu/media-library). Skimmer trawl, gill nets, pound nets: https://www.fisheries.noaa.gov/national/bycatch/fishing-gear-skimmer-trawls; https://www.fisheries.noaa.gov/national/bycatch/fishing-gear-gillnets; and https://www.fisheries.noaa.gov/national/bycatch/fishing-gear-pound-nets.
The by-catch of these fisheries is not reflected in harvested landings, but has been estimated elsewhere (Coale et al., 1994; Johnson, 2003, 2006), and this can range up to 3–5 times more than the shrimp harvest (mass basis). Also, sea turtles are sometimes caught in trawls and gill nets, leading to demands that these gears be restricted in use. Although gill nets remove a low biomasses of fish, they do catch species like common bottlenose dolphins Tursiops truncatus, endangered loggerhead sea turtles Caretta carretta and Atlantic sturgeon Acipenser oxyrinchus. Thus, the large-mesh (>5-inch mesh) gill net fishery has been singled out for special management actions, with NOAA requiring special NCDMF permits and observer programs to note gear interactions with marine mammals like bottlenose dolphin (Risenhoover, 2012; Wieting and Daniel, 2014a,b). Core Sound has been identified as an area of high likelihood for sea turtle interactions with gill nets.
ECOPATH and ECOSIM Modeling
ECOPATH with ECOSIM is a software package2 and one of the most widely used food web modeling and network analysis tools for fisheries and aquatic ecosystems. ECOPATH is a network modeling software package for fisheries (Polovina, 1984) and has been developed in its present form (ECOPATH with ECOSIM 6.6), which combines the biomass budget approach of Polovina with network analysis theory (Ulanowicz, 1986) for analyzing flows between compartments (Christensen and Walters, 2004) and simulating fishery harvest scenarios. The ECOPATH approach is based on the balance of energy between production and consumption for each functional group (compartment) defined in the food web. The basic input requirements for each compartment include biomass (B), production-to-biomass ratio (P/B), consumption-to-biomass ratio (Q/B), and ecotrophic efficiency (EE). Ecotrophic efficiency is defined as the fraction of the total production of a group that is consumed or exported from the system. A diet matrix was constructed to account for the trophic interactions (consumption and import of food items) of all compartments in the system.
ECOPATH models were constructed from two master equations for production and consumption:
(1) Production = catch + predation + net migration + biomass accumulation + other mortality
(2) Consumption = production + respiration + unassimilated food.
A mass-balanced system sets production equal to consumption, combining the above equations into:
where,
Bi and Bj = biomasses of prey (i) and predators (j), respectively
P/Bi = production/biomass
EEi = ecotrophic efficiency
Yi = fisheries catch per unit area and time
Q/Bj = food consumption per unit biomass of j
DCji = contribution of i to the diet of j
BAi = biomass accumulation of i (positive or negative)
NMi = net migration of i (emigration less immigration).
Once a system is balanced, system-wide and compartment-specific indices are calculated and provide important information about the size, organization, development, and trophic dynamics of the ecosystem. These indices allow researchers and resource managers to make comparisons between different ecosystems or between different periods of the same ecosystem. See Table 1 for a summary of the input parameters used for this ECOPATH model.
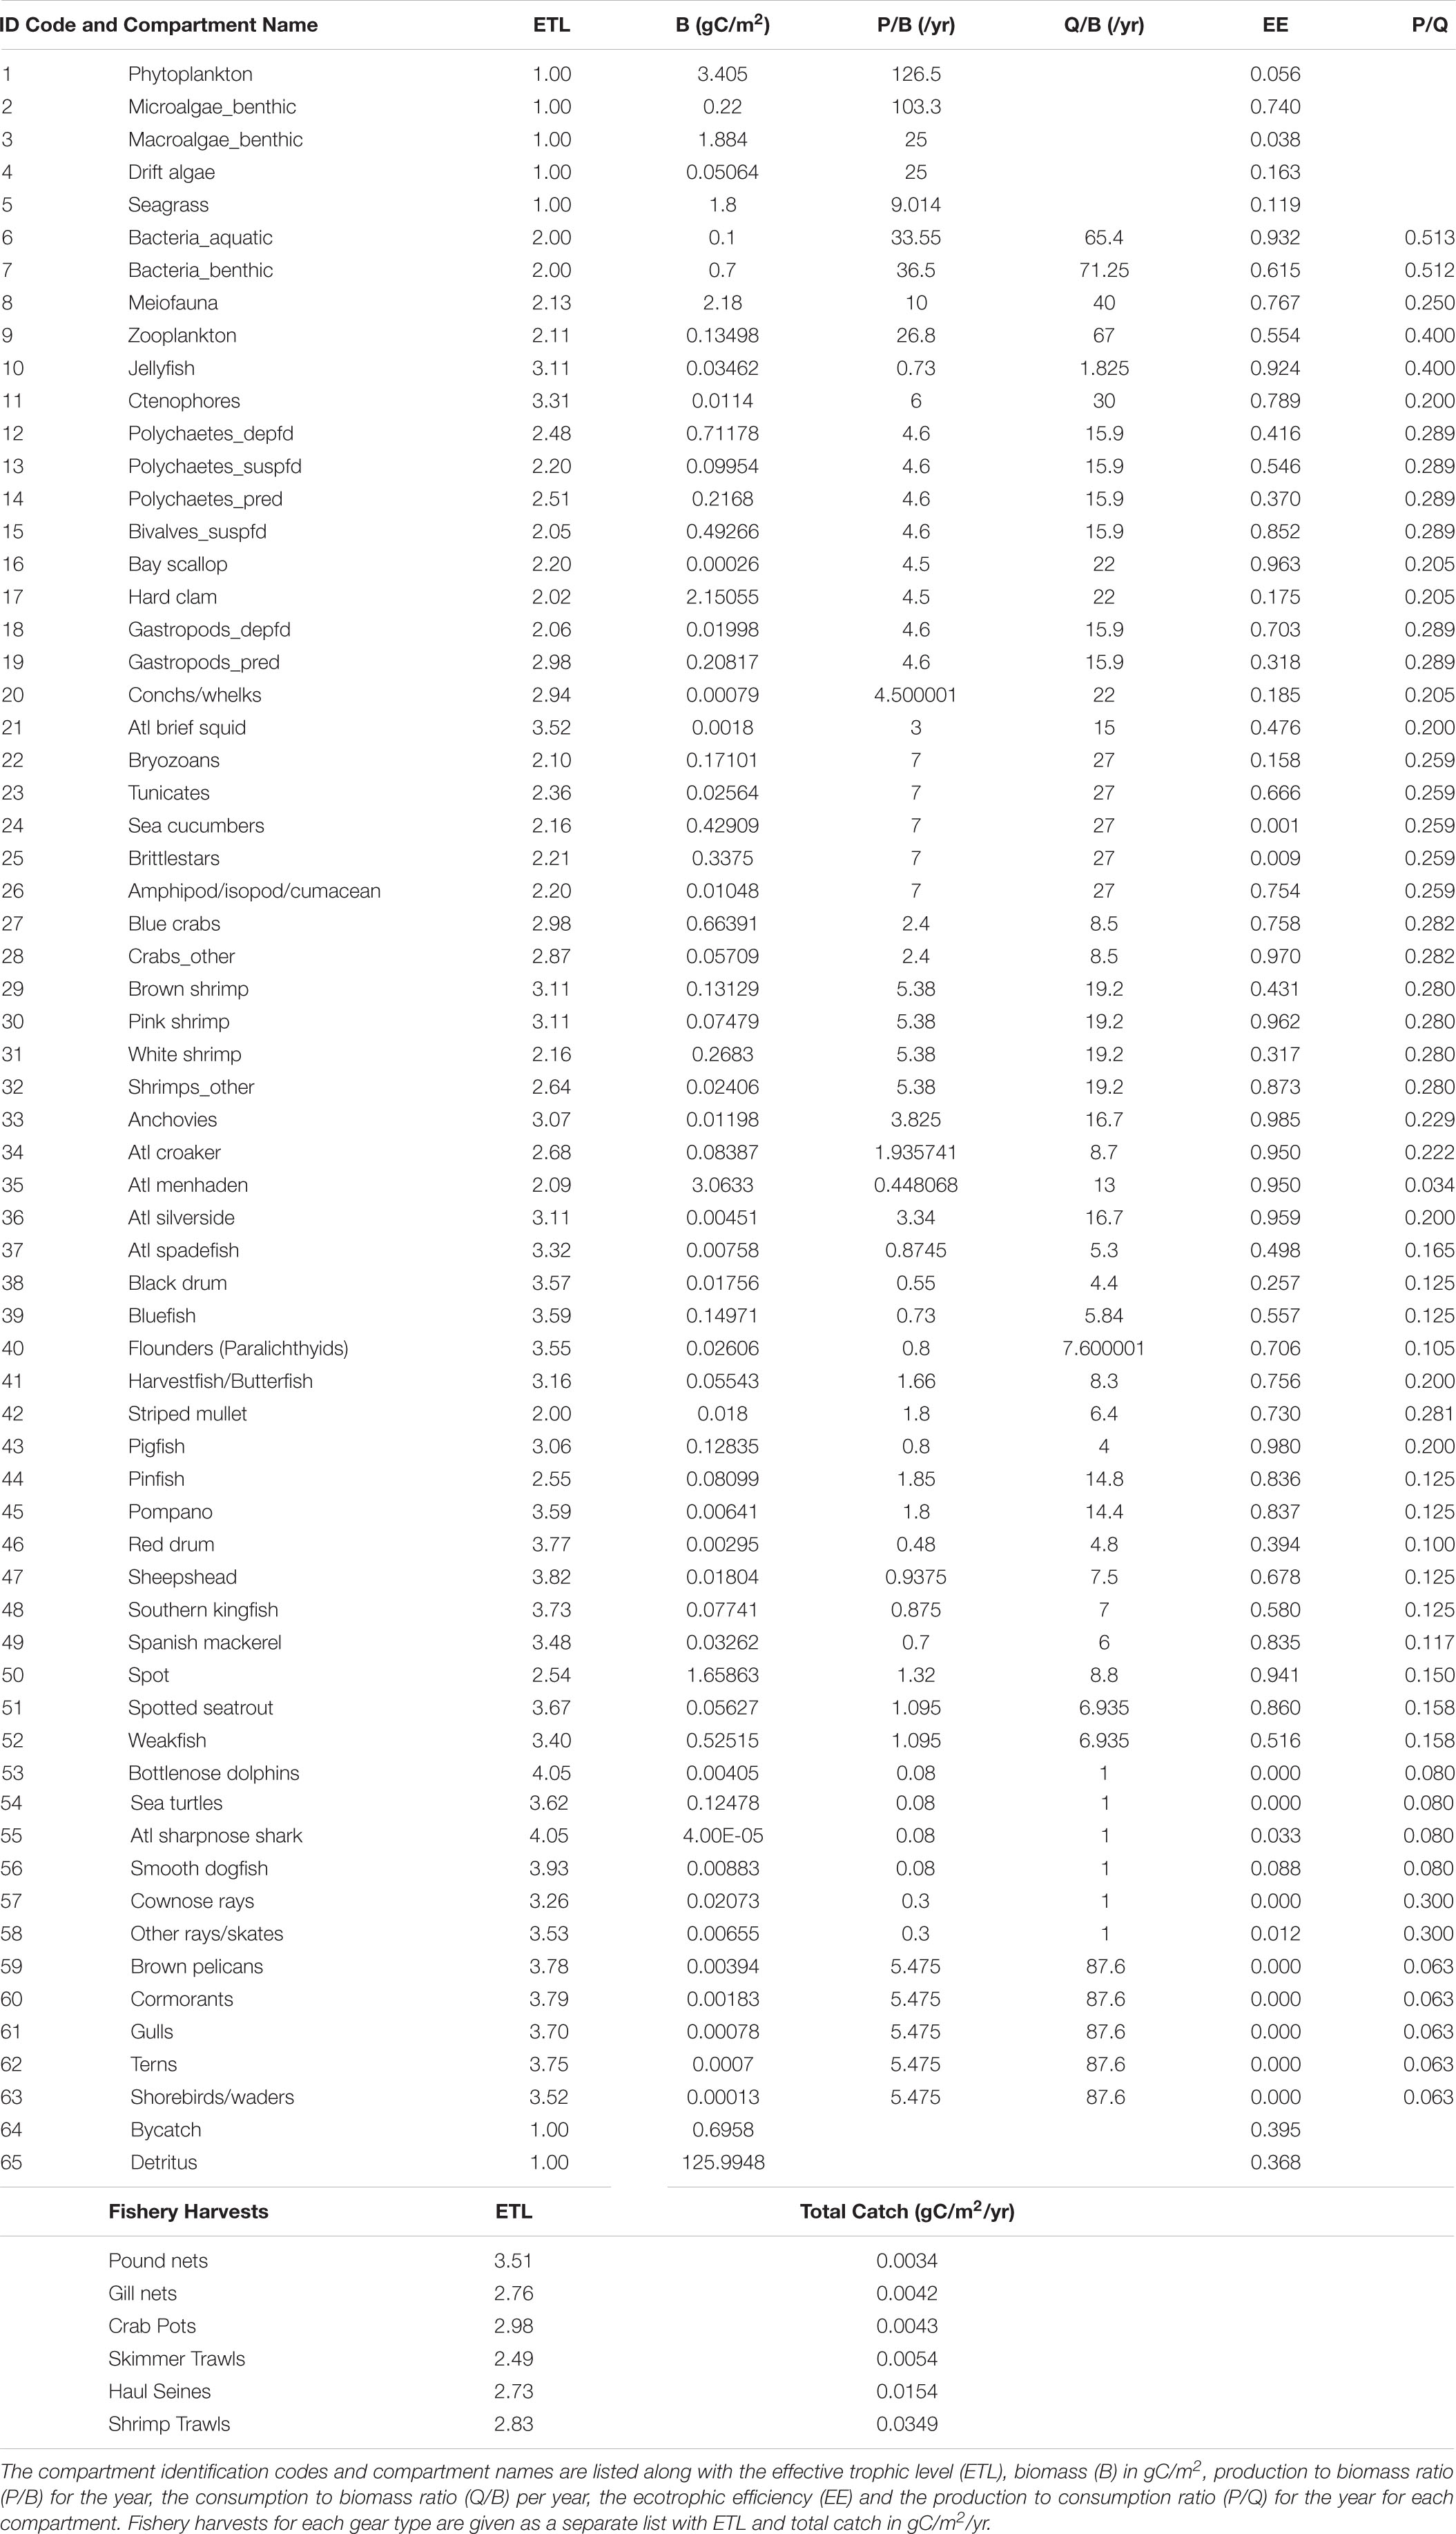
Table 1. ECOPATH basic outputs for the balanced Core Sound annualized open trawling areas.
Data Collection
Field research was conducted specifically to measure the biomass of as many organisms in the Core Sound ecosystem as possible. A variety of gears (3-m trawls, variable mesh (1”–5”) gill nets, 10-cm diameter benthic macrofauna cores, 1 cm-diameter meiofaunal cores, 90–200 μm mesh plankton nets, filtered water samples for phytoplankton) were utilized to sample these sites directly during 2006 and 2007, and observational studies were conducted to estimate the biomass of marine mammals, sea turtles, and birds. These methods are discussed in great detail elsewhere (Deehr, 2012; Deehr et al., 2014). Also, fisheries data were collected from the North Carolina Division of Marine Fisheries (NCDMF) Trip Ticket Program, which summarized the landings (in terms of pounds and dollar value) for each species caught in the Core Sound Management Area by each gear type used by the fisherman reporting the catches. Data were restricted to catches coming from the Core Sound water body. Specifically, the Core Sound models include landings from six fisheries: gill nets (all gill net types, and mesh sizes combined), pound nets, crab pots, haul seines, shrimp trawls, and skimmer trawls. Due to the lack of harvest data provided to us for certain gear types (swipe nets, crab trawls, clam trawls, channel nets, cast nets, oyster dredges, clam dredges, by hand, rod and reel, cast nets, gigs, rakes, and tongs), which was limited due to small catch sizes and fisher confidentiality reasons by NCDMF, we could not include these “other” gear types in the ECOPATH models. Likewise, certain species were too infrequently reported to NCDMF to be included in the ECOPATH models, and we limited the compartments to common fishery species that were captured by the six gears we focused on for ECOPATH. We omitted species that were reported to the NCDMF as being caught by a participant with one of these “other” gears, however, we included all species and gears used in the fisherman behavioral network. Additional information about the by-catch from the two trawl types was included from several studies on this fishery (Coale et al., 1994; Johnson, 2003, 2006) and by-catch removals were incorporated only in the open models. By-catch from gill nets, haul seines, pound nets, and crab pots were not incorporated in the ECOPATH model.
Visual Representations of the Core Sound Models: Correspondence Analysis, Regular Equivalence Clustering
One of the outputs generated by ECOPATH is a network flow model, with a graphical visualization of the species’ compartments in the model (nodes) as well as the flows of carbon (arcs) between the nodes. Although the standard output from ECOPATH provides the effective trophic levels and the Lindemann spine (food chains diagrams of trophic positions) of the trophic relations, it does not provide the user the opportunity to easily view the food web network of relations and identify compartments in the system that have similar trophic functional roles, nor does it allow visualization of the roles of the different fisheries gear types.
To visualize the food webs and network relations of carbon flows, we chose to display the output of the ECOPATH models using a network role-identifying approach called regular equivalence. We also used correspondence analysis (implemented in UCINET 6.718 and Netdraw 2.175; Borgatti, 2002; Borgatti et al., 2002) to visualize the similarity of fishery harvests of the species. In the regular equivalence approach, we created a multi-dimensional scaling of the ECOPATH node-to-node consumption outputs using a regular equivalence algorithm (REGE, implemented in UCINET), a graph-theoretical method of grouping together compartments in a food web based on their shared relations to in-neighborhoods (prey relations) and out-neighborhoods (predator relations)(Johnson et al., 2001; Luczkovich et al., 2003). This approach allows us to assign color classes to each compartment based on their similarity in terms of regular equivalence relations (REGE algorithm in UCINET). In social network analysis, this REGE algorithm has been used to uncover the social roles of people (e.g., doctors, nurses, patients in a hospital); here, we used it to explore the trophic roles (producers, herbivores, apex predators, etc.) of species and fisheries of Core Sound. Two nodes that are regularly equivalent will have an identical trophic role and the same REGE coefficient. Such nodes will plot on top of one another in a multi-dimension scaling (MDS) plot of the REGE coefficients of a network. As species (nodes) are not always identical in their trophic relationships, they will rarely have the same REGE coefficient. However, species with similar REGE coefficients can be grouped into similar trophic role (“isotropic”) classes using a clustering algorithm. Johnson’s hierarchical clustering strategy in UCINet 6 provided a measure of cluster adequacy (eta square or R2) for each possible clustering solution (cluster partitions). Group size of the cluster refers to the number of partitions of the hierarchical cluster (e.g., a group size of 2 is a two-group cluster partition at a low REGE similarity level, and a group size of 70 places each node in a separate cluster partition). When R2 is maximal, clusters are considered to be the best or most adequate at explaining the variance of the REGE coefficients when comparing the within-cluster to the between-cluster coefficients. The result is a diagram that plots all nodes (including fisheries) in two-dimensional space such that compartments that have similar ties to predators and prey will be similarly colored and clustered together as isotropic classes. Food web network graphs were plotted using the REGE similarity coefficients grouped into MDS coordinates in Netdraw.
Simulating a Gill Net Ban Using Affiliation Networks
We used the ECOPATH network model described above to model what might happen if gill nets were banned, as has occurred elsewhere in the United States. A gillnet ban has been proposed in North Carolina estuaries, but the NC estuarine gill net fishery has existing regulatory agreements in place (Risenhoover, 2012; Wieting and Daniel, 2014a,b). Gillnetting involves a greater number of fishers than does shrimp trawling, although a gillnet ban would have smaller predicted impacts on fish biomass removals than shrimp trawling might have. Importantly, a gillnet ban is intended to reduce harvests of the over-fished flounder populations (Paralichthys sp.), reduce incidental takes of protected marine mammals like bottlenose dolphins, endangered sea turtles, and endangered Atlantic sturgeon. As a result, gillnetting has received more regulatory and management attention than most other gears.
To simulate a gill net ban on the fishers, we created a fisher gear-by-species affiliation network; this network can represent fisher behavior because it shows the multiple fisheries in which each participant has reported catches to the NCDMF. From NCDMF data we created a two-mode matrix involving fishers-by-species-gear combinations we term matrix X, in which xij = 1 if fisher i engaged in species-gear combination j. The two-mode matrix X is binary, with fishers (listed in the rows) that caught the same species with the same gear type (listed in the columns). From this 2-mode matrix of fishers-by-species-gear combinations, we created a one-mode n x n affiliation matrix A such that aij = 1 if species-gear combination i has at least one fisher in common with species-gear combination j. Thus,
Fisheries are thus conceived here as people using specific gear types, which in turn catch certain species. That is, each participant in a fishery can choose to fish with any gear type-species combination. The participant-specific fisheries harvest data were not made available to us; these data are collected by the NCDMF in the Core Sound management area, but due to confidentiality rules, the data were restricted to gear used and species caught by each fisher in 2006 and 2007 (species and gear specific annual harvest data, without participant identifiers, were available by NCDMF and used to parameterize ECOPATH, however). Fisher behavioral affiliation network A was computed from the participant-specific list of gear used and species caught, producing a 229 × 229 square matrix of gear-species combinations in an affiliation network in UCINET. The affiliation network had the numbers of participants in each cell that also participated in each of the other gear-species combinations, thus, each row and column was a unique gear-and-species fishery and number of participants in common with each of the other fishery in the cells, with total participants in each fishery given along the diagonal. To assess the potential for the affiliation network to be disrupted in a gillnet ban, we computed centrality measures (Freeman degree and normalized eigenvector centrality) of the fisher behavioral networks using UCINET.
Node Removal With Key Player
We then removed gear types-species nodes using the Key Player 2 (maximum fragmentation criterion) module of UCINET (Borgatti, 2006) to determine which kind of gear, if removed, would maximally fragment the network. Key Player was developed for use understanding quantitatively of the impact of node removals in disrupting networks (KP-Neg), such as reducing the spread of an epidemic through a network by immunizations and quarantines or influencing a network positively (KP-Pos) by using information, disinformation, providing incentives, or education about innovations to change the behavior of people in a social network (Borgatti, 2006). We used Key Player here to find the gear-species nodes and gears that if removed would maximally fragment the fisher behavioral network. We could thus predict the magnitude of changes that would be expected as the fishers switched among the multiple fisheries in the wake of a gill net ban. Key Player 2 (Borgatti, 2006) was used (KP-Neg to disrupt the network, with maximum fragmentation criterion, and greedy algorithm) with required node removal group size = 87 (removed all variations on gillnet nodes and their associated species) for the complete Fisher Behavioral Network, and with node removal group size = 3 (all gill nets) for the reduced Fisher Behavioral Network. The distance-weighted maximum fragmentation criterion F was used in Key Player 2 and is defined as:
Where djk is the geodesic distance between nodes i and j after removing a node from the network, and n is the number of nodes in the network (Borgatti, 2006).
Behavioral Network Visualization
Finally, the affiliation network was plotted in Netdraw, with each of the 229 fisheries as gear-species nodes, with the affiliation network relating the number of participants in common among the fisheries as links. We color-coded our network diagrams by gear type used in each fishery. We reduced the behavioral network by collapsing the network by combining all nodes with the same gear type (reduced behavioral network with 25 gear-types); gear relative frequency (number of participants x species caught by that gear type) was computed using the collapse nodes by attribute transformation in Netdraw, then exported the reduced network to UCINET. We used a spring embedder algorithm (Fruchterman and Reingold, 1991) to arrange the nodes in space, based on the number of edges (participants in the fishery dyad) they share. A spring-embedder visualization is the default display or layout in Net Draw, which places nodes in space based on the idea that two nodes that share an edge should be drawn close to one another, but not too close. Spring-embedder algorithm (based on mechanical physics, in which the nodes are modeled as steel rings and they are connected by springs, or charged particles with varying repulsive and attractive charges, varying the positions of the nodes in space with each iteration to reach a minimum energy state for the system) uses a system of iterative equations to draw the graph, placing the nodes in space so that they have approximately equal edge lengths, minimizing edge crossings, and distributing the nodes in the drawing space. The more edges two nodes share, the closer they are drawn in graph space. Thus, in our case, the closer together any two gear-species fishery nodes are in space, the more participants they share in common.
Probability of Gear Switching
We used the probability of joint participation in the alternative gears after a gill net ban and the original frequency of participation in other fisheries to predict the likelihood of increased fishing effort in five alternative fisheries that we originally modeled using ECOPATH. The proportion of participants using an alternative gear type was computed relative to the focal gear type to be removed as an estimate of the probability of gear switching. For example, if 100 participants used gear l (focal gear to be removed) while also reporting catches using gear m (alternative gear remaining after removal), the proportion Pn of joint usage was computed:
Where Plm is the number of joint-gear-use dyads in the affiliation network, or the number of participants jointly using gear l and gear m from matrix A, and Pm is the number of participants using alternative gear m. These proportions show the potential for a switching pathway to exist between the two fisheries; the greater the proportion of participants and fishing effort done using the two linked gears in the affiliation network A, the higher the likelihood that a switching pathway exists between the two fisheries.
For fisheries that shared a switching pathway in the network (high Pn proportion of joint gear usage), new values of relative fishing effort (RFE) were computed for the ECOSIM projections under a gill net ban scenario with increased effort using pound nets, haul seines, shrimp trawls, skimmer trawls, and crab pots. The new relative fishing effort values after a gill net ban were computed:
where Pm is the participants using gear m overall. The switching behavior thus sums the effort of the joint gear use in the fishery that is being removed by regulation (Pim) plus the original effort (Pm) in the alternative fishery that remains as a proportion of the original pre-removal participation. If switching occurs, all participants using the banned Gear A (gill nets) are assumed to switch and will be included in the new fishing effort for Gear B. If no joint participants are observed, then PB does not change (no switching can occur). This index of RFE was computed for each fishery with joint gear use and was used to set the ECOSIM effort parameter for gears after a net ban.
Gill Net Ban ECOSIM Scenarios
ECOSIM Scenario 1. A Gill Net Ban was simulated by simply reducing gill net fishing effort to 0% and a 10-year projection was done for each of the various fishery species with no gill nets present. The effort was not increased in the remaining fisheries, which remained at pre-Gill Net Ban levels.
ECOSIM Scenario 2. A Gillnet Ban with fishing effort increased for alternative gears. In this scenario, RFE computation for alternative gears was used to increase relative fishing effort in Pound Nets, Haul Seines, Shrimp Trawls, Skimmer Trawls, and Crab Pot fisheries. The assumption is that fishers no longer using gill nets will re-direct their fishing efforts toward these alternative gear types, based on the joint participation probabilities for gill nets and these gears. A ten-year projection was done for each of the various species in these fisheries.
Results
Ecological Subsystem: ECOPATH Model Commercial Harvest in Core Sound
We first describe the ecological subsystem of the Core Sound socio-ecological system using ECOPATH network modeling. The balanced ECOPATH model basic estimates are given in Table 1. The effective trophic levels for each compartment were computed and it is apparent that the fisheries vary in their total harvest and effective trophic level, in ascending order of total catch: pound nets (0.0035 g/m2/yr, ETL = 3.51), gillnets (0.0042 g/m2/yr; ETL = 2.76), crab pots (0.0043 g/m2/yr; ETL = 2.98), skimmer trawling (total catch = 0.0054 g/m2/yr; ETL = 2.50), haul seining (0.0154; ETL = 2.73), and shrimp trawling (0.0349 g/m2/yr; ETL = 2.83). A plot of these harvests by compartment in the ECOAPTH model indicated that shrimp trawling, given the large total catch, had the greatest potential for biological impacts each year (Figure 4). Removals by shrimp trawl in the open areas were several orders of magnitude greater than any other gear used and caught species other than the target species of brown, pink, and white shrimp. In particular, more biomass of spot Leiostomus xanthurus and blue crabs Callinectes sapidus were removed in shrimp trawls than in haul seines that target spot or crab pots that target blue crabs (Figure 4). Skimmer trawls targeted white shrimp but also caught spot, blue crabs, pinfish Lagodon rhomboides, and Atlantic menhaden Brevoortia tyrannus (Figure 4). Gill nets targeted paralichthyid flounders, especially the flounders Paralichthys lethostigma and P. albigutta, and striped mullet Mugil cephalus, but also caught spot, spotted seatrout Cynoscion nebulosus, red drum Sciaenops ocellatus, black drum Pogonias cromis and bluefish Pomatomus saltatrix (Figure 4). Haul seines remove nearly as much spot biomass as shrimp trawls, while also taking weakfish Cynoscion regalis, Atlantic menhaden, pigfish, Spanish mackerel Scomberomorus maculatus, spotted sea trout, and bluefish (Figure 4). Crab pots are very selective for blue crabs (Figure 4). Pound Nets target paralichthyid flounders, but also catch significant amounts of harvestfish/butterfish (Peprilus paru and P. triacanthus, a combined-species NCDMF category), Florida pompano Trachinotus carolinus, sheepshead Archosargus probatocephalus, black drum, and Atlantic spadefish Chaetodipterus faber (Figure 4).
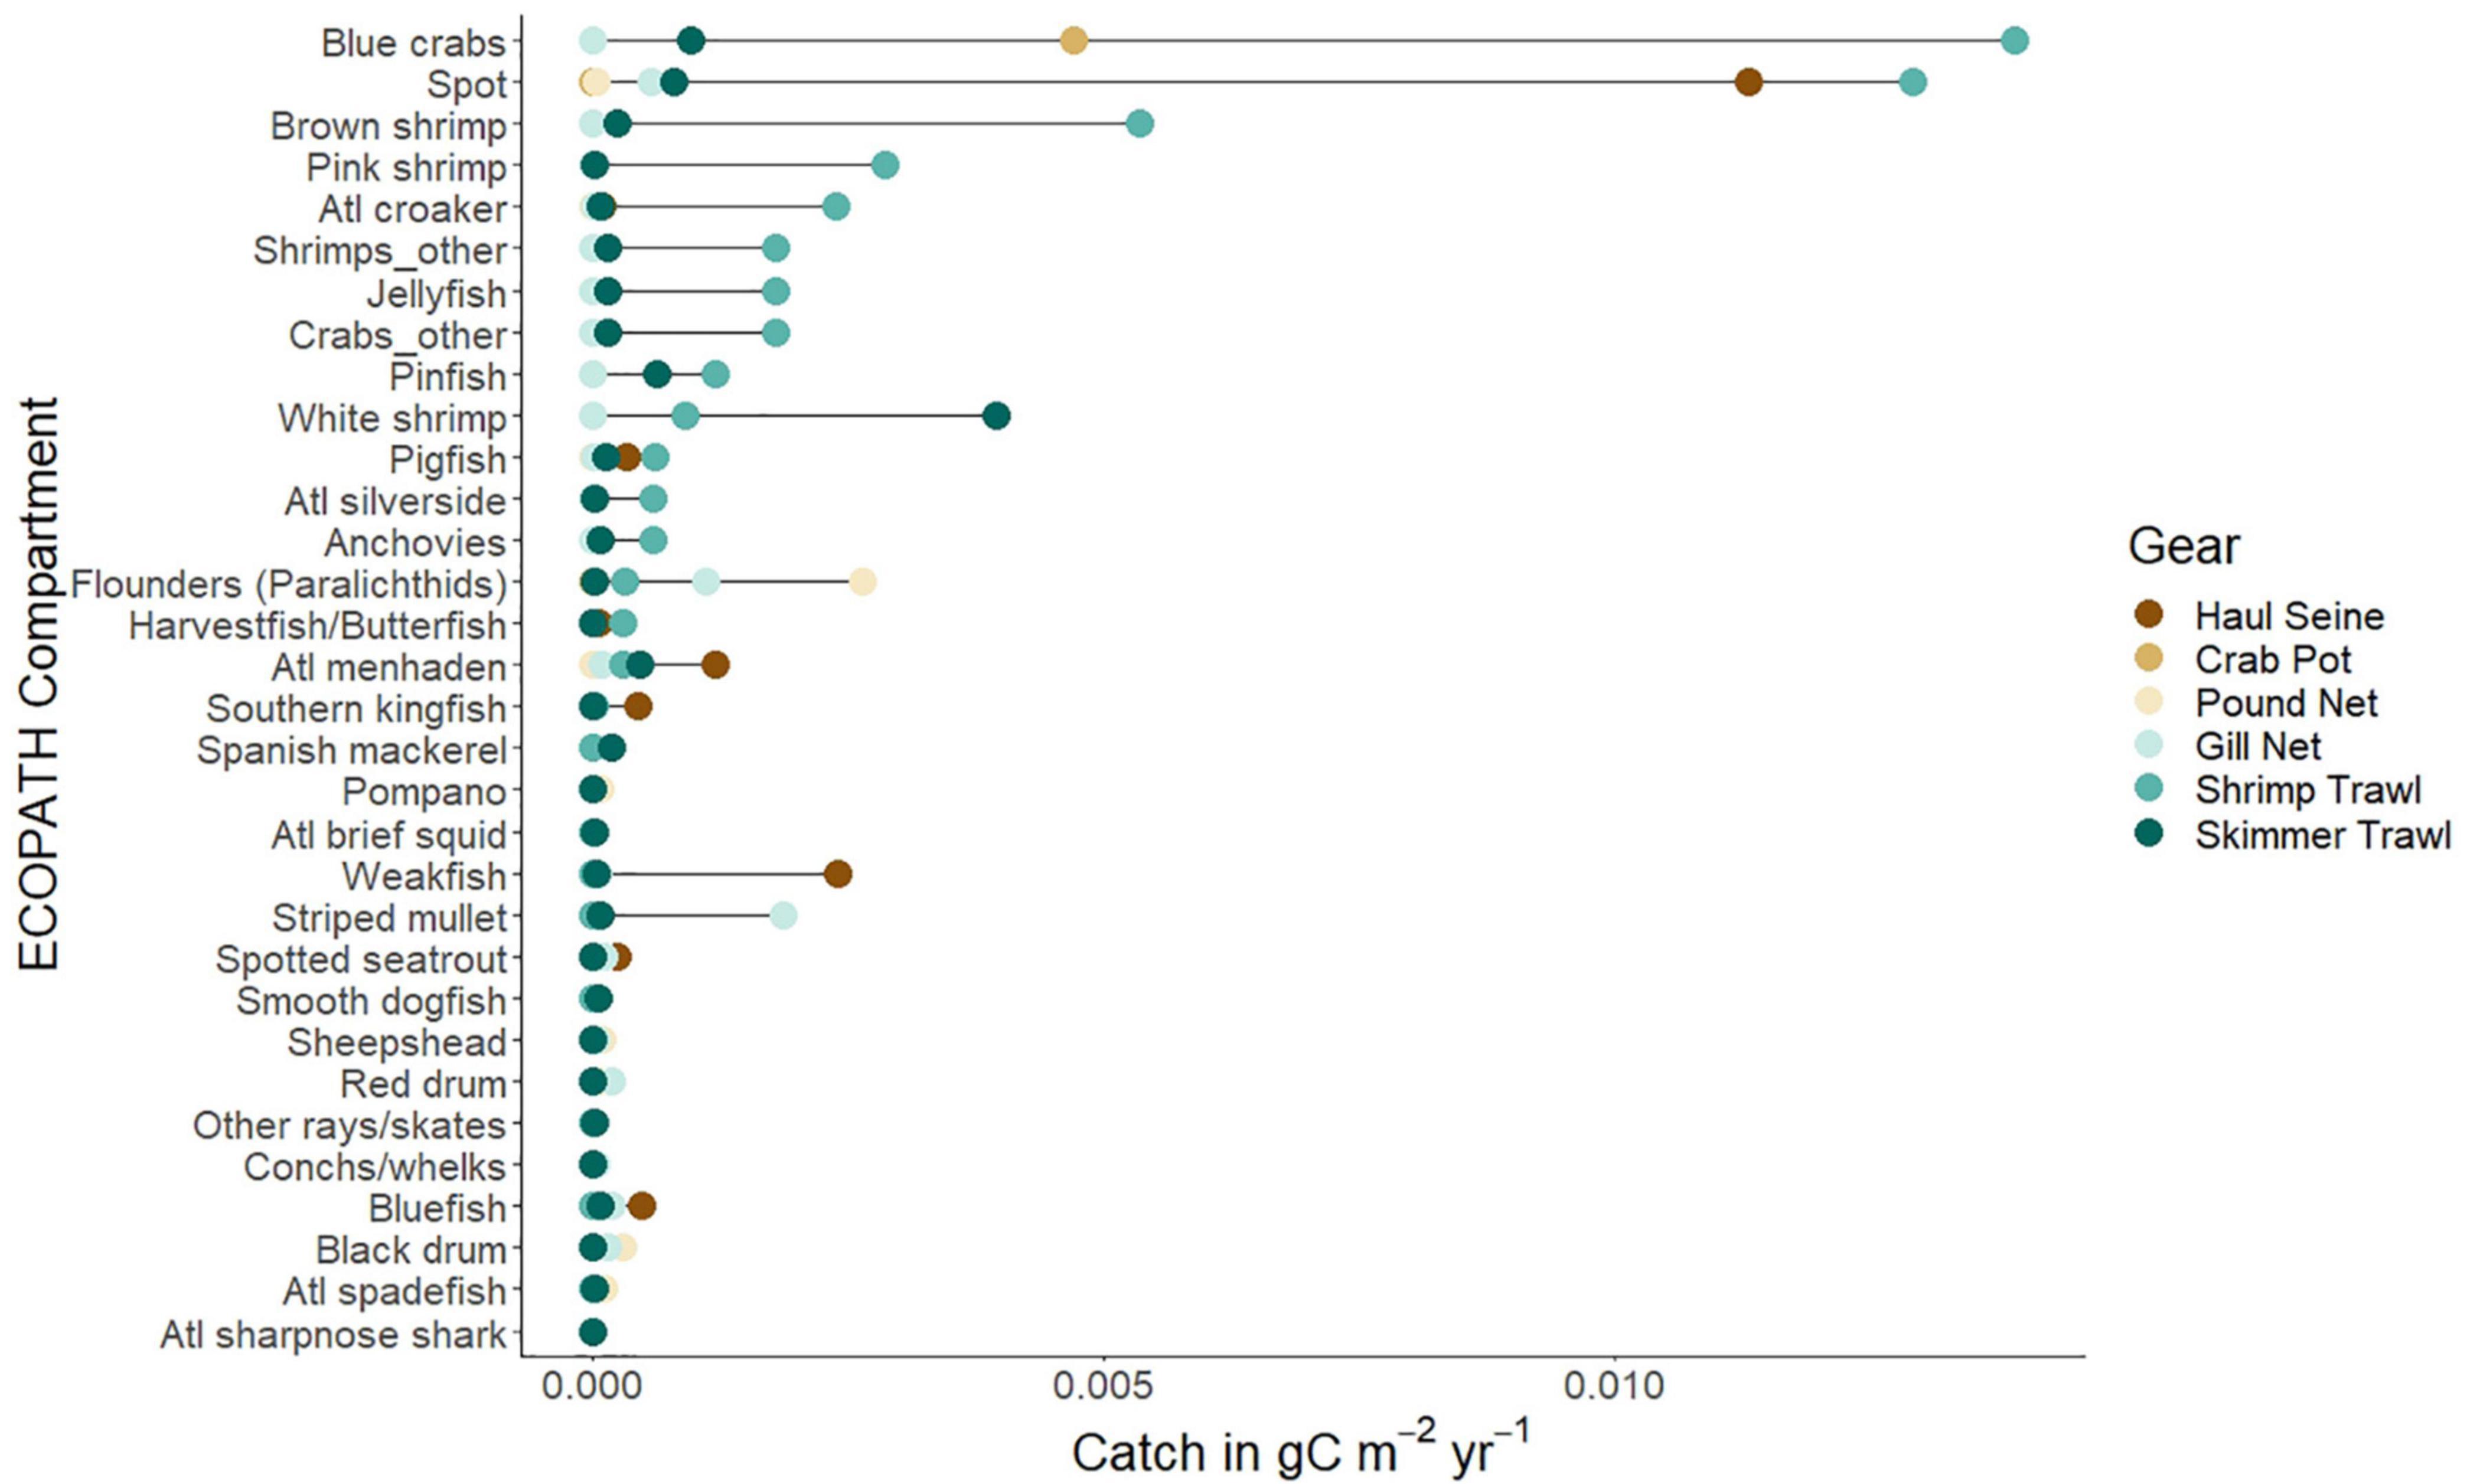
Figure 4. The harvests of most common species (as included in ECOPATH open trawling management area model) in g C/m2/yr caught by six gear types (dark brown dots: haul seines; medium brown dots: crab pots; light brown dots: pound nets; light blue dots: gill nets; medium blue dots: shrimp trawls; dark blue dots: skimmer trawls) from Core Sound, North Carolina as reported to the NCDMF in 2007. Species arrangement is rank order observed in shrimp trawls, the dominant fishing gear in terms of biomass harvest.
Trophic Role of Species and Fisheries in Open Trawling Areas
The trophic role of each species and fishery in the whole ecosystem can be visualized after exporting the consumption matrix from the ECOPATH model of annualized harvests in the open trawling area, using the regular equivalence similarity measure to measure role similarity, then visualized using a multidimensional scaling procedure (MDS; Figure 5). Species with similar trophic role relations to other species plot close to one another in the MDS two-dimensional space. In this MDS plot, we overlaid the consumption network of carbon flows from ECOPATH so that the strength of the ties can be observed as arrows of different widths, and the node size is scaled to represent the log-10 transformed biomass of carbon standing stock in each node. The vertical axis in these MDS plots represents an approximate trophic position for each node, with producers and detritus low on this axis, and apex predators near the top. The horizontal axis represents different sources of producers and detritus, with producers on the left side horizontal axis and detritus on the right side of axis. Detritus represented a large source of stored production which supplied energy to many species (high centrality node). There are clear trophic role groupings, with detritus, producers, detritivores, invertebrate consumers and fishes, sea turtles, and mammals separated into isotropic classes. The fishery gear-types also show a relation to trophic position, near the top of the MDS plot, but clustered together. The ecosystem is dominated at the base by the flows involving detritus, phytoplankton and benthic microalgae producers, meiofauna, and bacteria (largest flows are to one another at the first trophic level and the greatest biomass of nodes occur at the bottom of both plots). This REGE/MDS visualization describes the overall ecological network component of the socio-ecological system, showing sources of energy, and harvests by gear type as top-trophic level species.
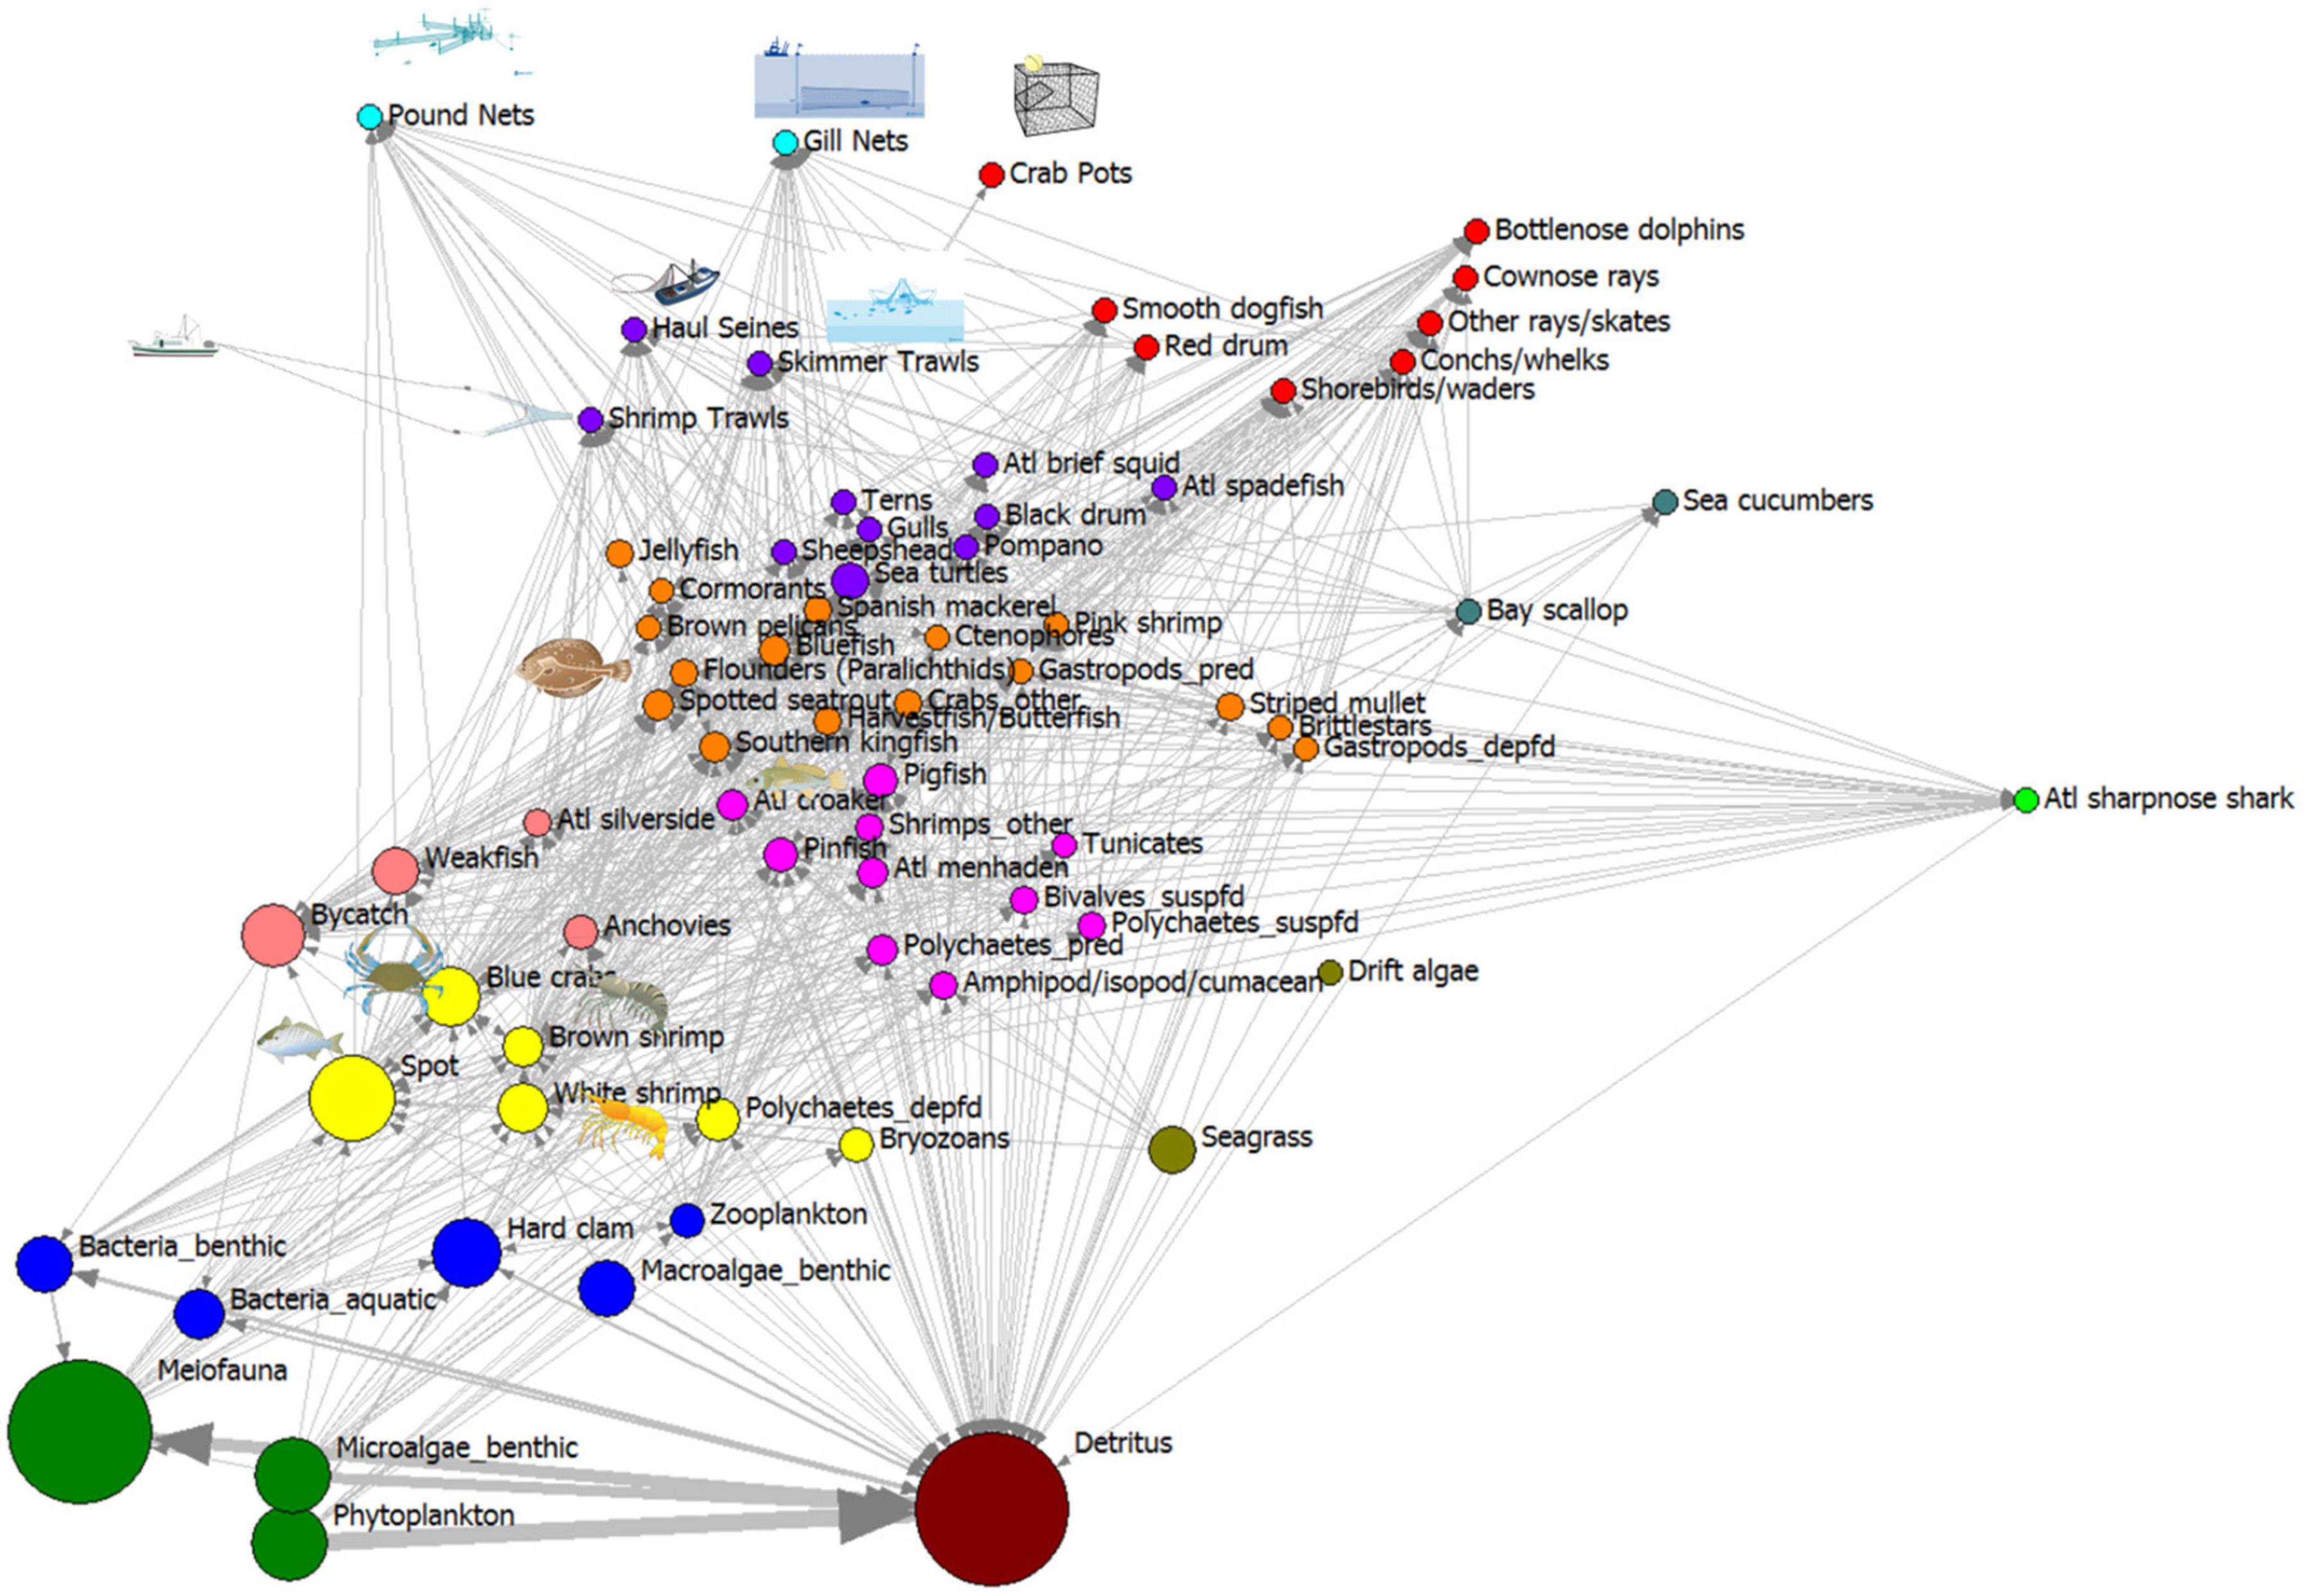
Figure 5. Trophic roles revealed using regular equivalence similarity measure non-metric MDS plot of Core Sound network model of the areas open to shrimp trawling in fall (2006–2007 NCDMF data). Node size proportional to log10 (g C biomass/m2). Color code for nodes in these isotrophic classes: (1) brown: detritus and particulate organic carbon; (2) green: phytoplankton, benthic microalgae, benthic meiofauna; (3) blue: benthic bacteria, aquatic bacterioplankton, benthic macroalgae, hard clams, zooplankton; (4) light green: seagrasses, drift algae; (5) yellow: various invertebrates that consume meiofauna and detritus (bryozoans, deposit-feeding polychaetes, white and brown shrimp, blue crabs), fish (spot); (6) magenta: invertebrates (amphipods, isopods, cumaceans, predatory and suspension-feeding polychaetes, shrimps, tunicates), fishes (Atlantic croaker, pinfish, pigfish, Atlantic menhaden); (7) pink: bycatch, anchovies; weakfish, Atlantic silversides; (8) orange: invertebrates (jellyfish, ctenophores, deposit-feeding gastropods, predatory gastropods, brittlestars, pink shrimp, crabs), fishes (striped mullet, southern kingfish, spotted seatrout, weakfish, harvestfish/butterfish, paralichthyid flounders, bluefish, Spanish mackerel and birds (cormorants, gulls, brown pelicans); (9) purple: top predators group A, invertebrates (Atlantic brief squid), fishes (sheepshead, Florida pompano, black drum, Atlantic spadefish), birds (terns, gulls), sea turtles, and fishery gears (shrimp trawls, skimmer trawls, and haul seines); (10) red: top predators group B: invertebrates (conchs and whelks), fishes (red drum, cownose rays, other rays and skates, smooth dogfish); birds (shorebirds/waders), marine mammals (bottlenose dolphins); and the fishery gear (crab pots); (11) dark blue-green (bay scallops, sea cucumbers); (12) lime green: Atlantic sharpnose sharks; (13) cyan: pound nets and gill nets.
Gear-Selective Commercial Harvest in Core Sound
It is helpful to further examine the fishery gear and their species harvested in an additional subsystem visualization. Correspondence analysis of the ECOPATH fishery harvests demonstrated that some fisheries (as defined by gear types or “fleets” in ECOPATH terms) harvested very different species than others (Figure 6); shrimp trawls caught very different species than the gill nets, haul seines and pound nets, but were similar to skimmer trawls and, surprisingly, crab pots. The similarity in catches of shrimp trawls and crab pots is due to the large number of blue crabs caught in shrimp trawls (note the thickness of the line representing carbon flow from blue crabs to shrimp trawls in Figure 6). Gill nets and pound nets caught many of the same species but also red drum, black drum, Florida pompano, sheepshead, striped mullet, Atlantic spadefish, bluefish, and spotted seatrout, so these two gear-types were grouped near one another in the correspondence analysis. Haul seines tended to catch species that were also caught by the trawlers and gillnetters, (species like spot, weakfish, Atlantic menhaden, Spanish mackerel, bluefish, spotted seatrout, and harvestfish/butterfish) so this gear type plotted in an intermediate position in the correspondence analysis. Thus, trawling captured many more short-lived invertebrate species, like the penaeid shrimps and blue crabs, but gill netting captured many more large, long-lived fishes like the drums and flounders. Because these two gear types have different prey, due to the gear selectivity, they will affect the ecosystem in different ways and have somewhat different long-term impacts. The target of shrimp trawl fishery may recover from harvest much more quickly than the target of gill nets.
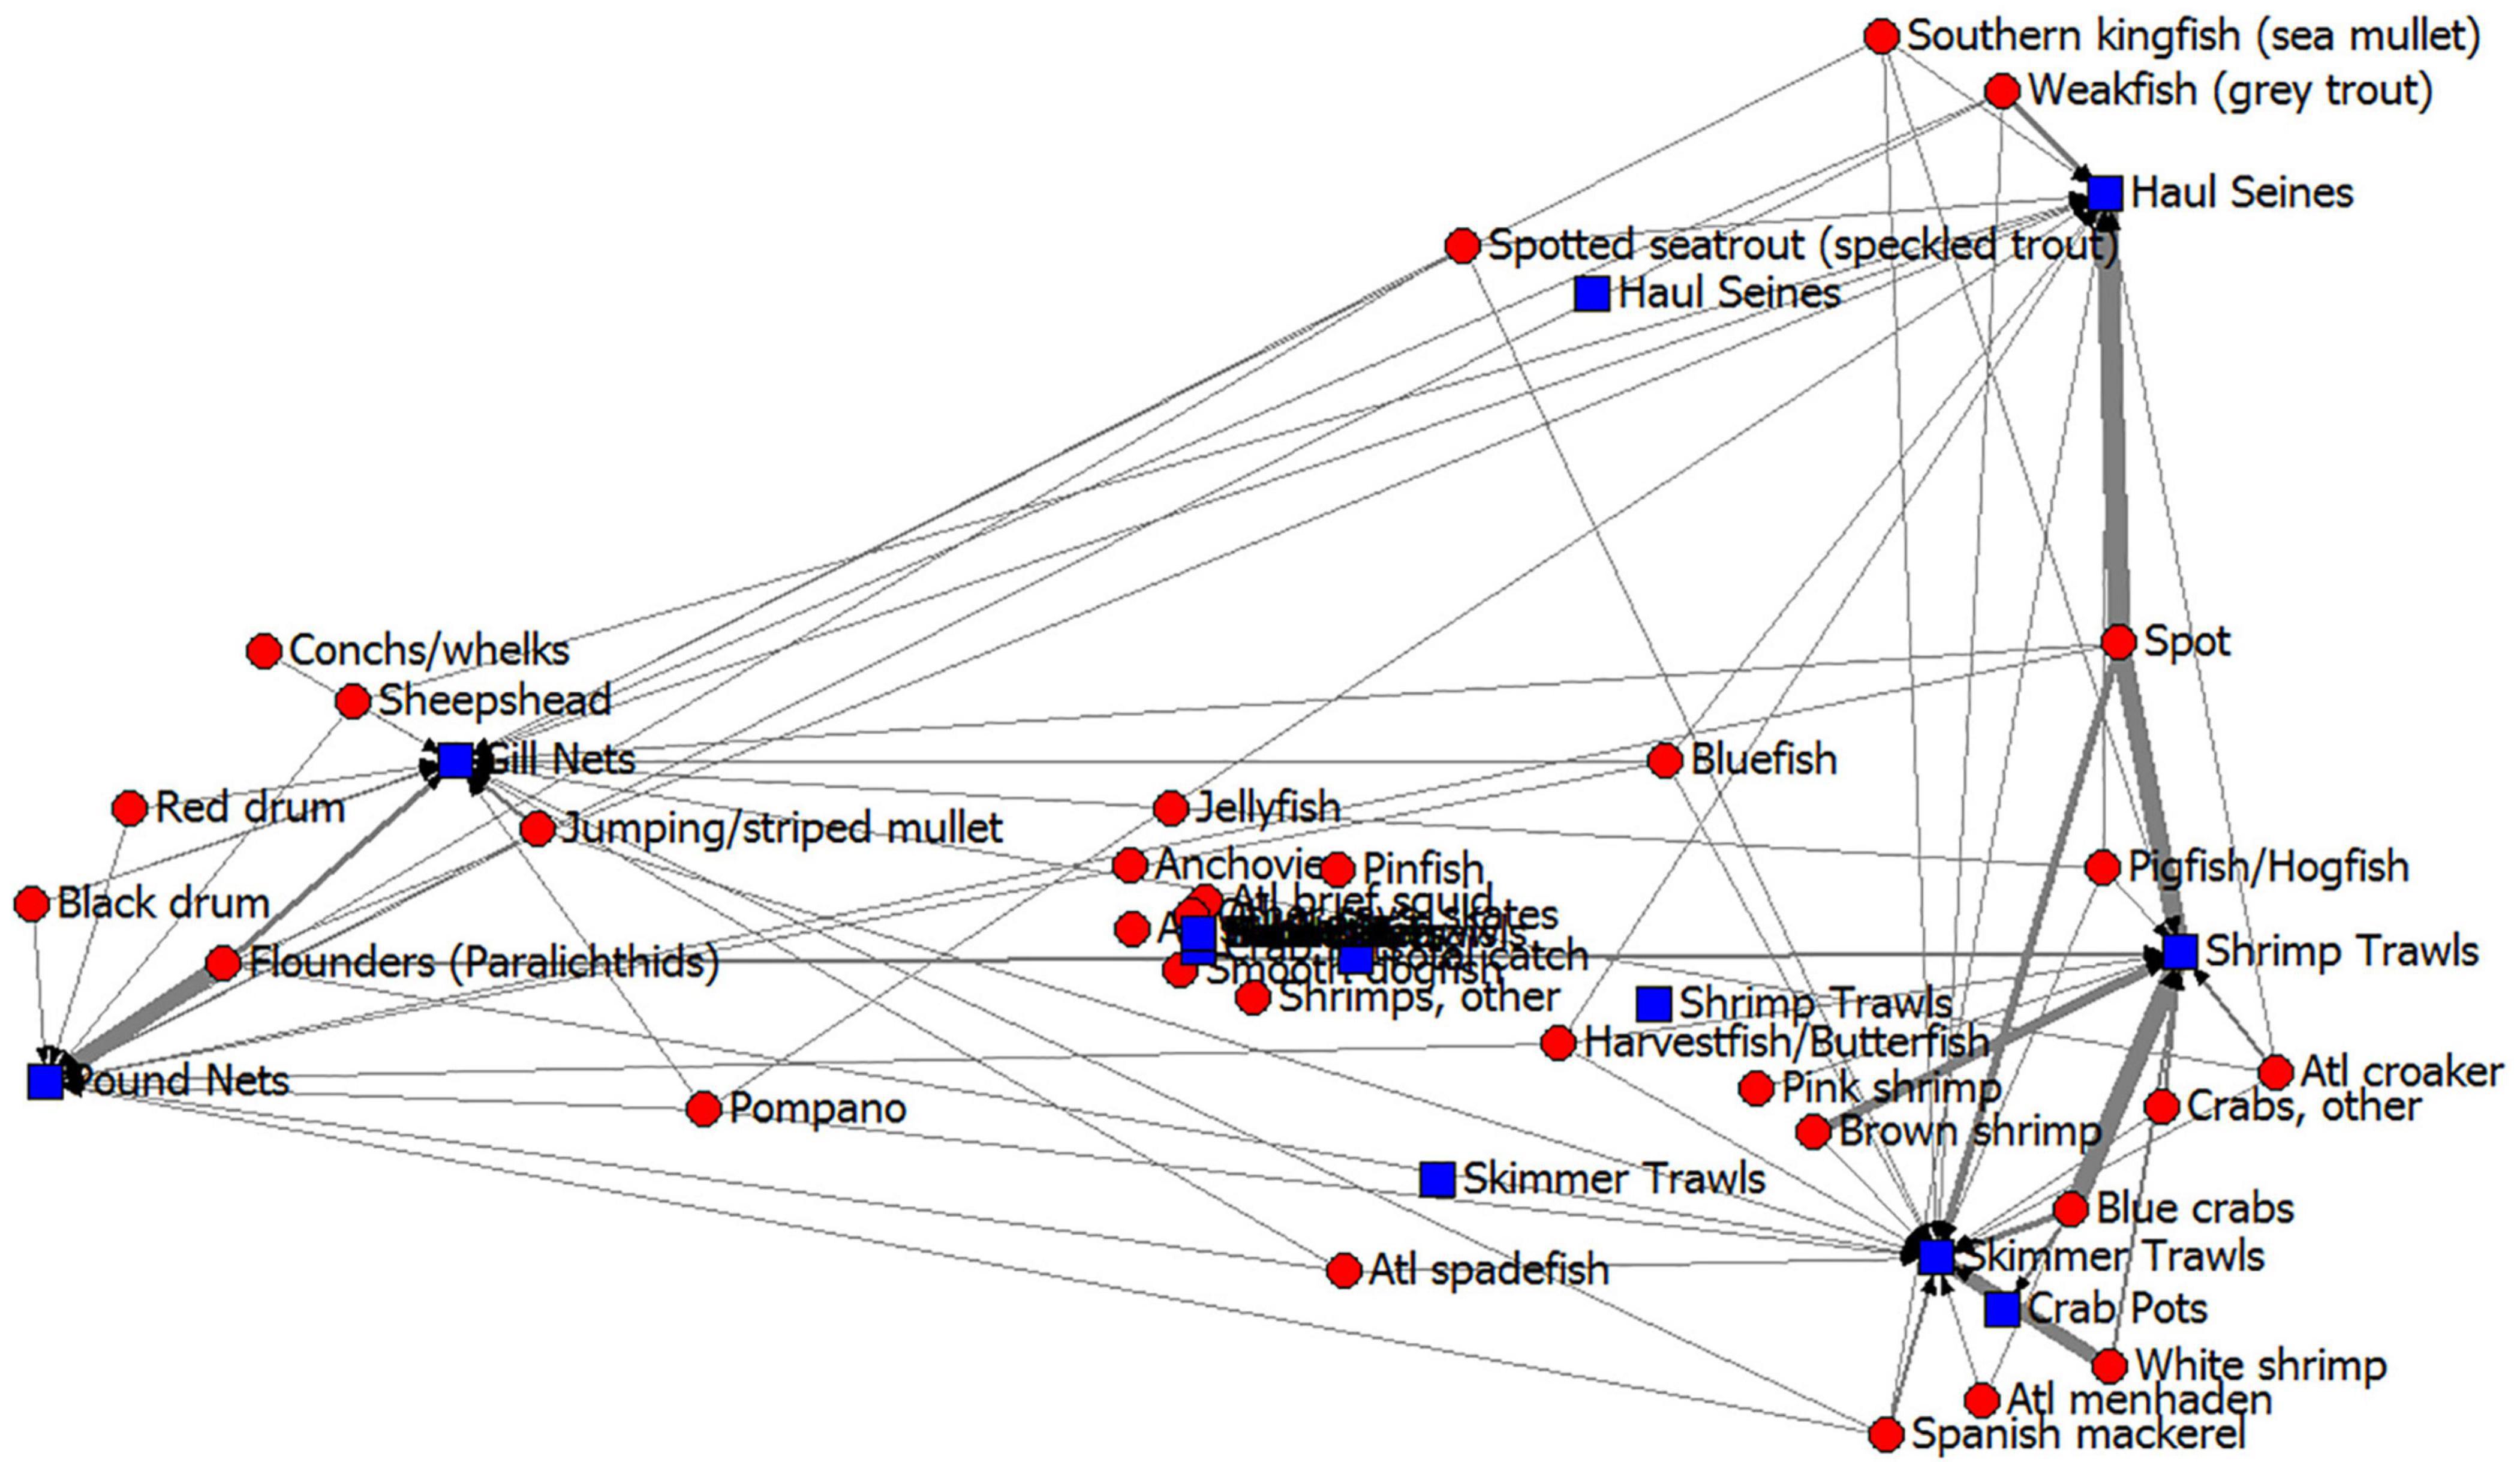
Figure 6. Core Sound, NC commercial fisheries harvests from the annualized ECOPATH model in open-trawling areas shown as a correspondence analysis of gear type (blue squares) and their commercial catches (red circles). Arrows point from species harvested to fishery gear, with line thickness showing the amount of carbon from the Ecopath model flowing along that path. Gear types that plot together have similar selectivity, and species that plot together are harvested using similar fishery gear types.
Human Subsystem: Fisher Behavioral Network
Now let us turn to the human subsystem of the Core Sound socio-ecological system. We wanted to examine the behavior of the fishers based on their gear use and species harvested obtained NCDMF data. We established an affiliation network of nodes (gear-by-species fisheries) for Core Sound fishers, with edges in the network representing individual fishers participating in multiple gear-by-species fisheries. We call this the Core Sound Fisher Behavioral Network (FBN), which is a complex subsystem of the socio-ecological system (Figure 7). For purposes of clarity in this visualization, we only show the six types of gear included in the ECOPATH model and labeled the nodes using the ECOPATH compartment IDs (Table 1) that were included in that model, although the affiliation analysis included all gear-species nodes. The full fisher behavioral model visualization, with all gears and species reported, can be found in the Supplementary Materials Figure SM-1. Based on this affiliation network, fishers could switch between two gear-species fisheries (they have had the appropriate access to gear, vessels, licenses, expenses for fuel, etc.). Some participants work in multiple such fisheries during the year, they switch between gears naturally as seasons open and close by regulation, and as species become abundant and migrate through the system. Thus, the FBN describes natural fisher behavior by identifying pathways of shared gear that can be used to switch fishing effort between gear-species fisheries. The probability of switching among fisheries is given by the number of participants jointly using the alternative gear divided by the participants using that focal gear in the FBN.
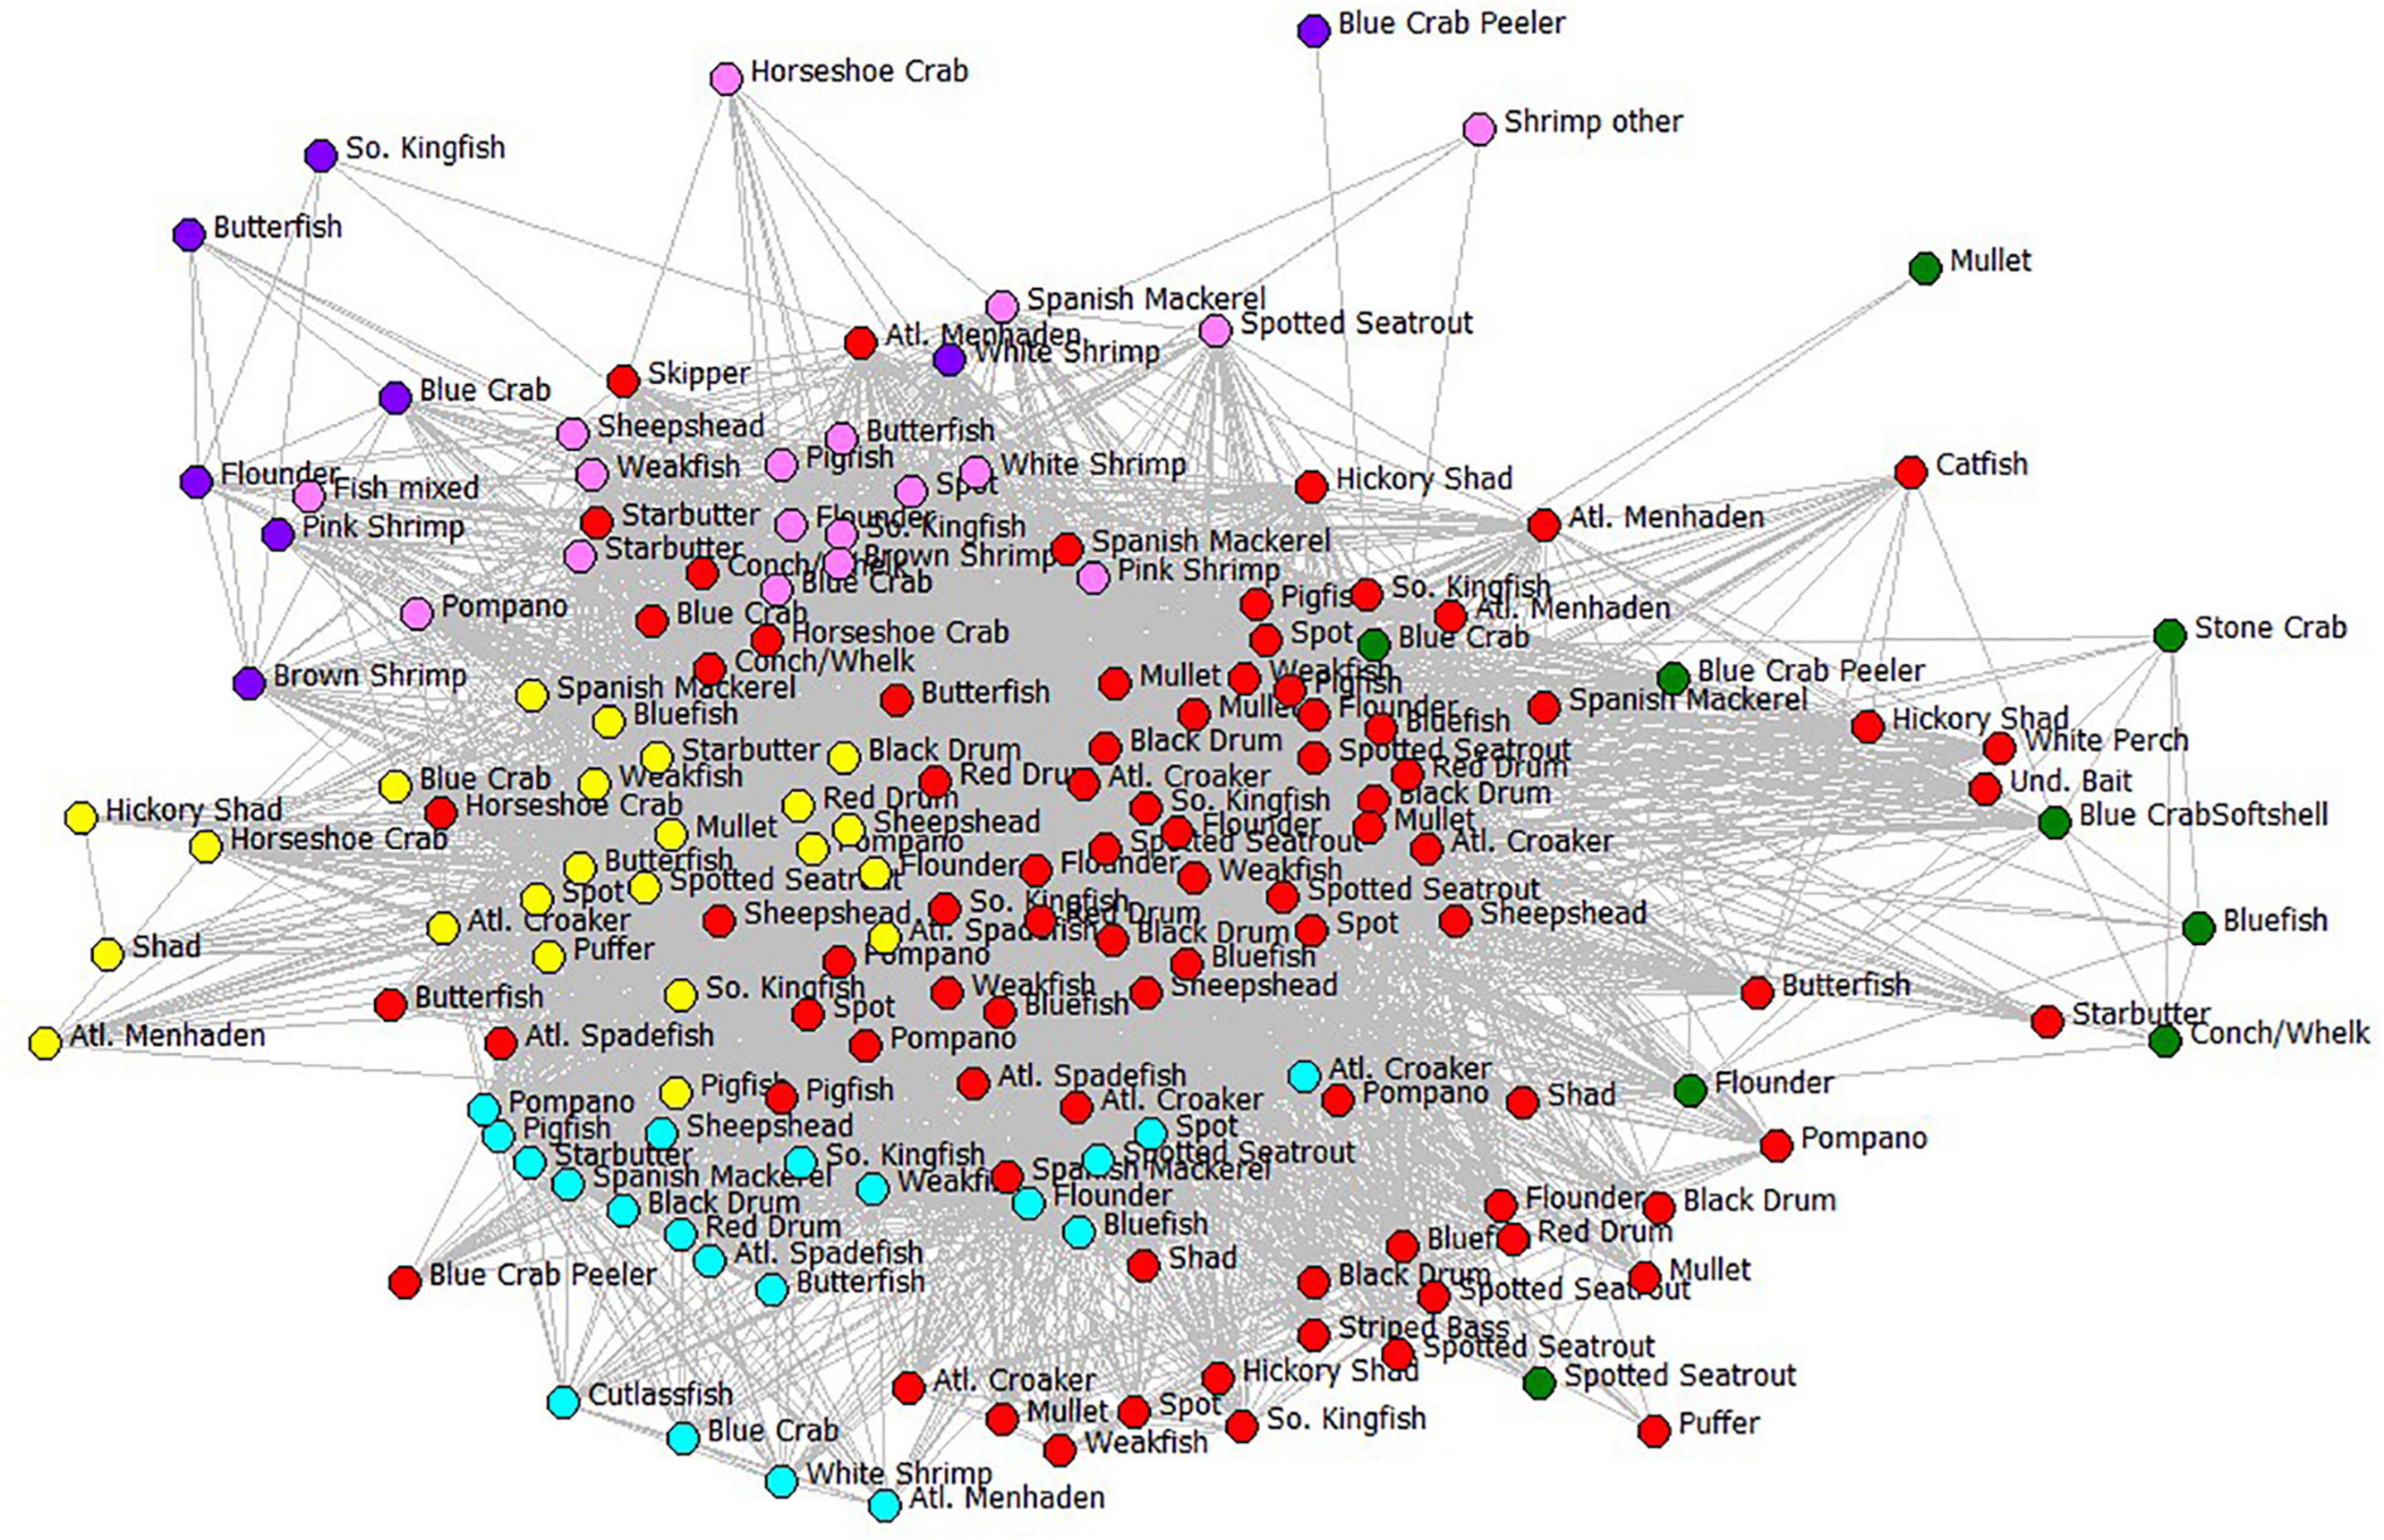
Figure 7. The fisher behavioral network of Core Sound. For clarity, only gear types and species (compartments) used in the ECOPATH model are shown. Each node is a fishery, defined as participant-reported gear type used to catch the species. Edges are switching pathways among fisheries, showing the connection between gear-species fisheries and indicating that at least one fisher was jointly involved in the two fisheries; nodes are color-coded by gear type. Gear codes: cyan = haul seines; pink = shrimp trawls; purple = skimmer trawls; yellow = pound nets; red = gill nets; green = crab pots. Links between nodes represent affiliations, that is, the number of fishers that have those two gear-species combinations in common (gear type-species nodes). The fishery nodes with greatest joint fisher participation were displayed using Fruchterman-Reingold spring-embedder algorithm (Fruchterman and Reingold, 1991). The fishery nodes with high degree centrality (greatest number of joint participants) are in the center in the plot.
More fishers were engaged in the gill-netting fisheries than all other net types and gillnets of all varieties used are highly central in the FBN (Figure 7). The red nodes in Figure 7 are all variations of gill nets combined and are central in the FBN, an indication that many fishers jointly participate in gill netting and many other fisheries. Large mesh gill net (≥5-inch stretch mesh) for flounders ranked second in terms of the number of participants reporting to NCDMF (94 fishers); participants in 22 of top 30 gear-by-species fisheries used gill nets of some kind. Only hand-raking for hard clams has more participants (Table 2). Shrimp trawling for brown shrimp (pink nodes in Figure 7), in contrast, did not involve as many participants, ranking 27 out of the top 30 fisheries in participant number (34 fishers). The centrality of the gillnet fishers in the FBN is evident in the 94 participants that reported catching paralichthyid flounders using large mesh gill nets ≥ 5-inch mesh; they are the second-highest in terms of participants and the most central group in Core Sound (normalized Freeman degree centrality = 8.97 % of all possible linkages adjacent to that node are observed, Table 2).
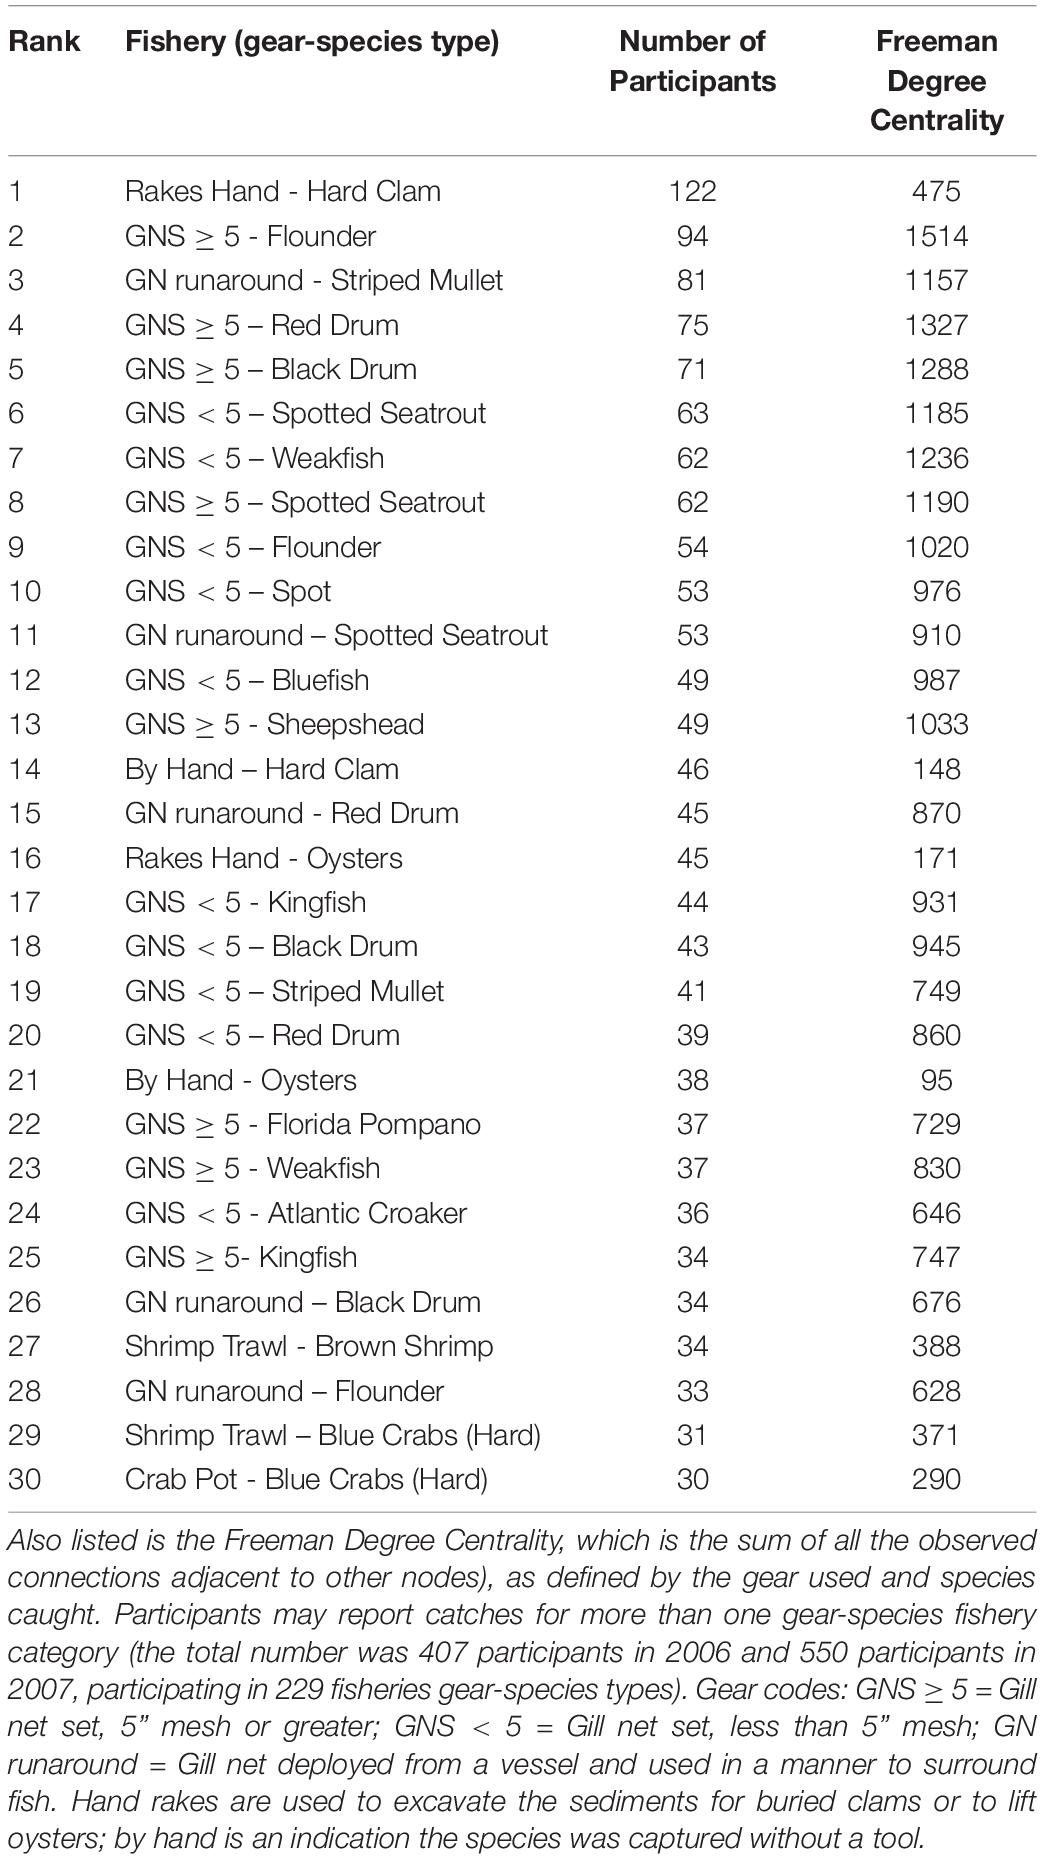
Table 2. The number of participants in each of the gear-by-species fisheries of Core Sound (top 30 shown; complete listing in Supplementary Table SM-1).
We examined the potential disruption of the complete FBN and reduced FBN using Key Player, a module of UCINET software. First, we identified the nodes in a network that, if removed, would maximally fragment the full gear-by-species FBN. Network fragmentation criterion F (increase in network disruption) indicated the percentage of participants that would be disrupted relative to a completely connected network (Supplementary Material Table SM-2). Next, we removed 87 gillnet-associated gear-species nodes (the required set for removal first in Key Player) (Figure 8). Once again for this visualization, we display only the gear types and compartments used in the ECOPATH model. These node removals in the gear-by-species FBN greatly fragmented the affiliation network, although there remain still many connected fisheries and gear-species combinations. When all gillnet types are targeted for removal, the network is disconnected by 58.1% relative to the completed connected FBN.
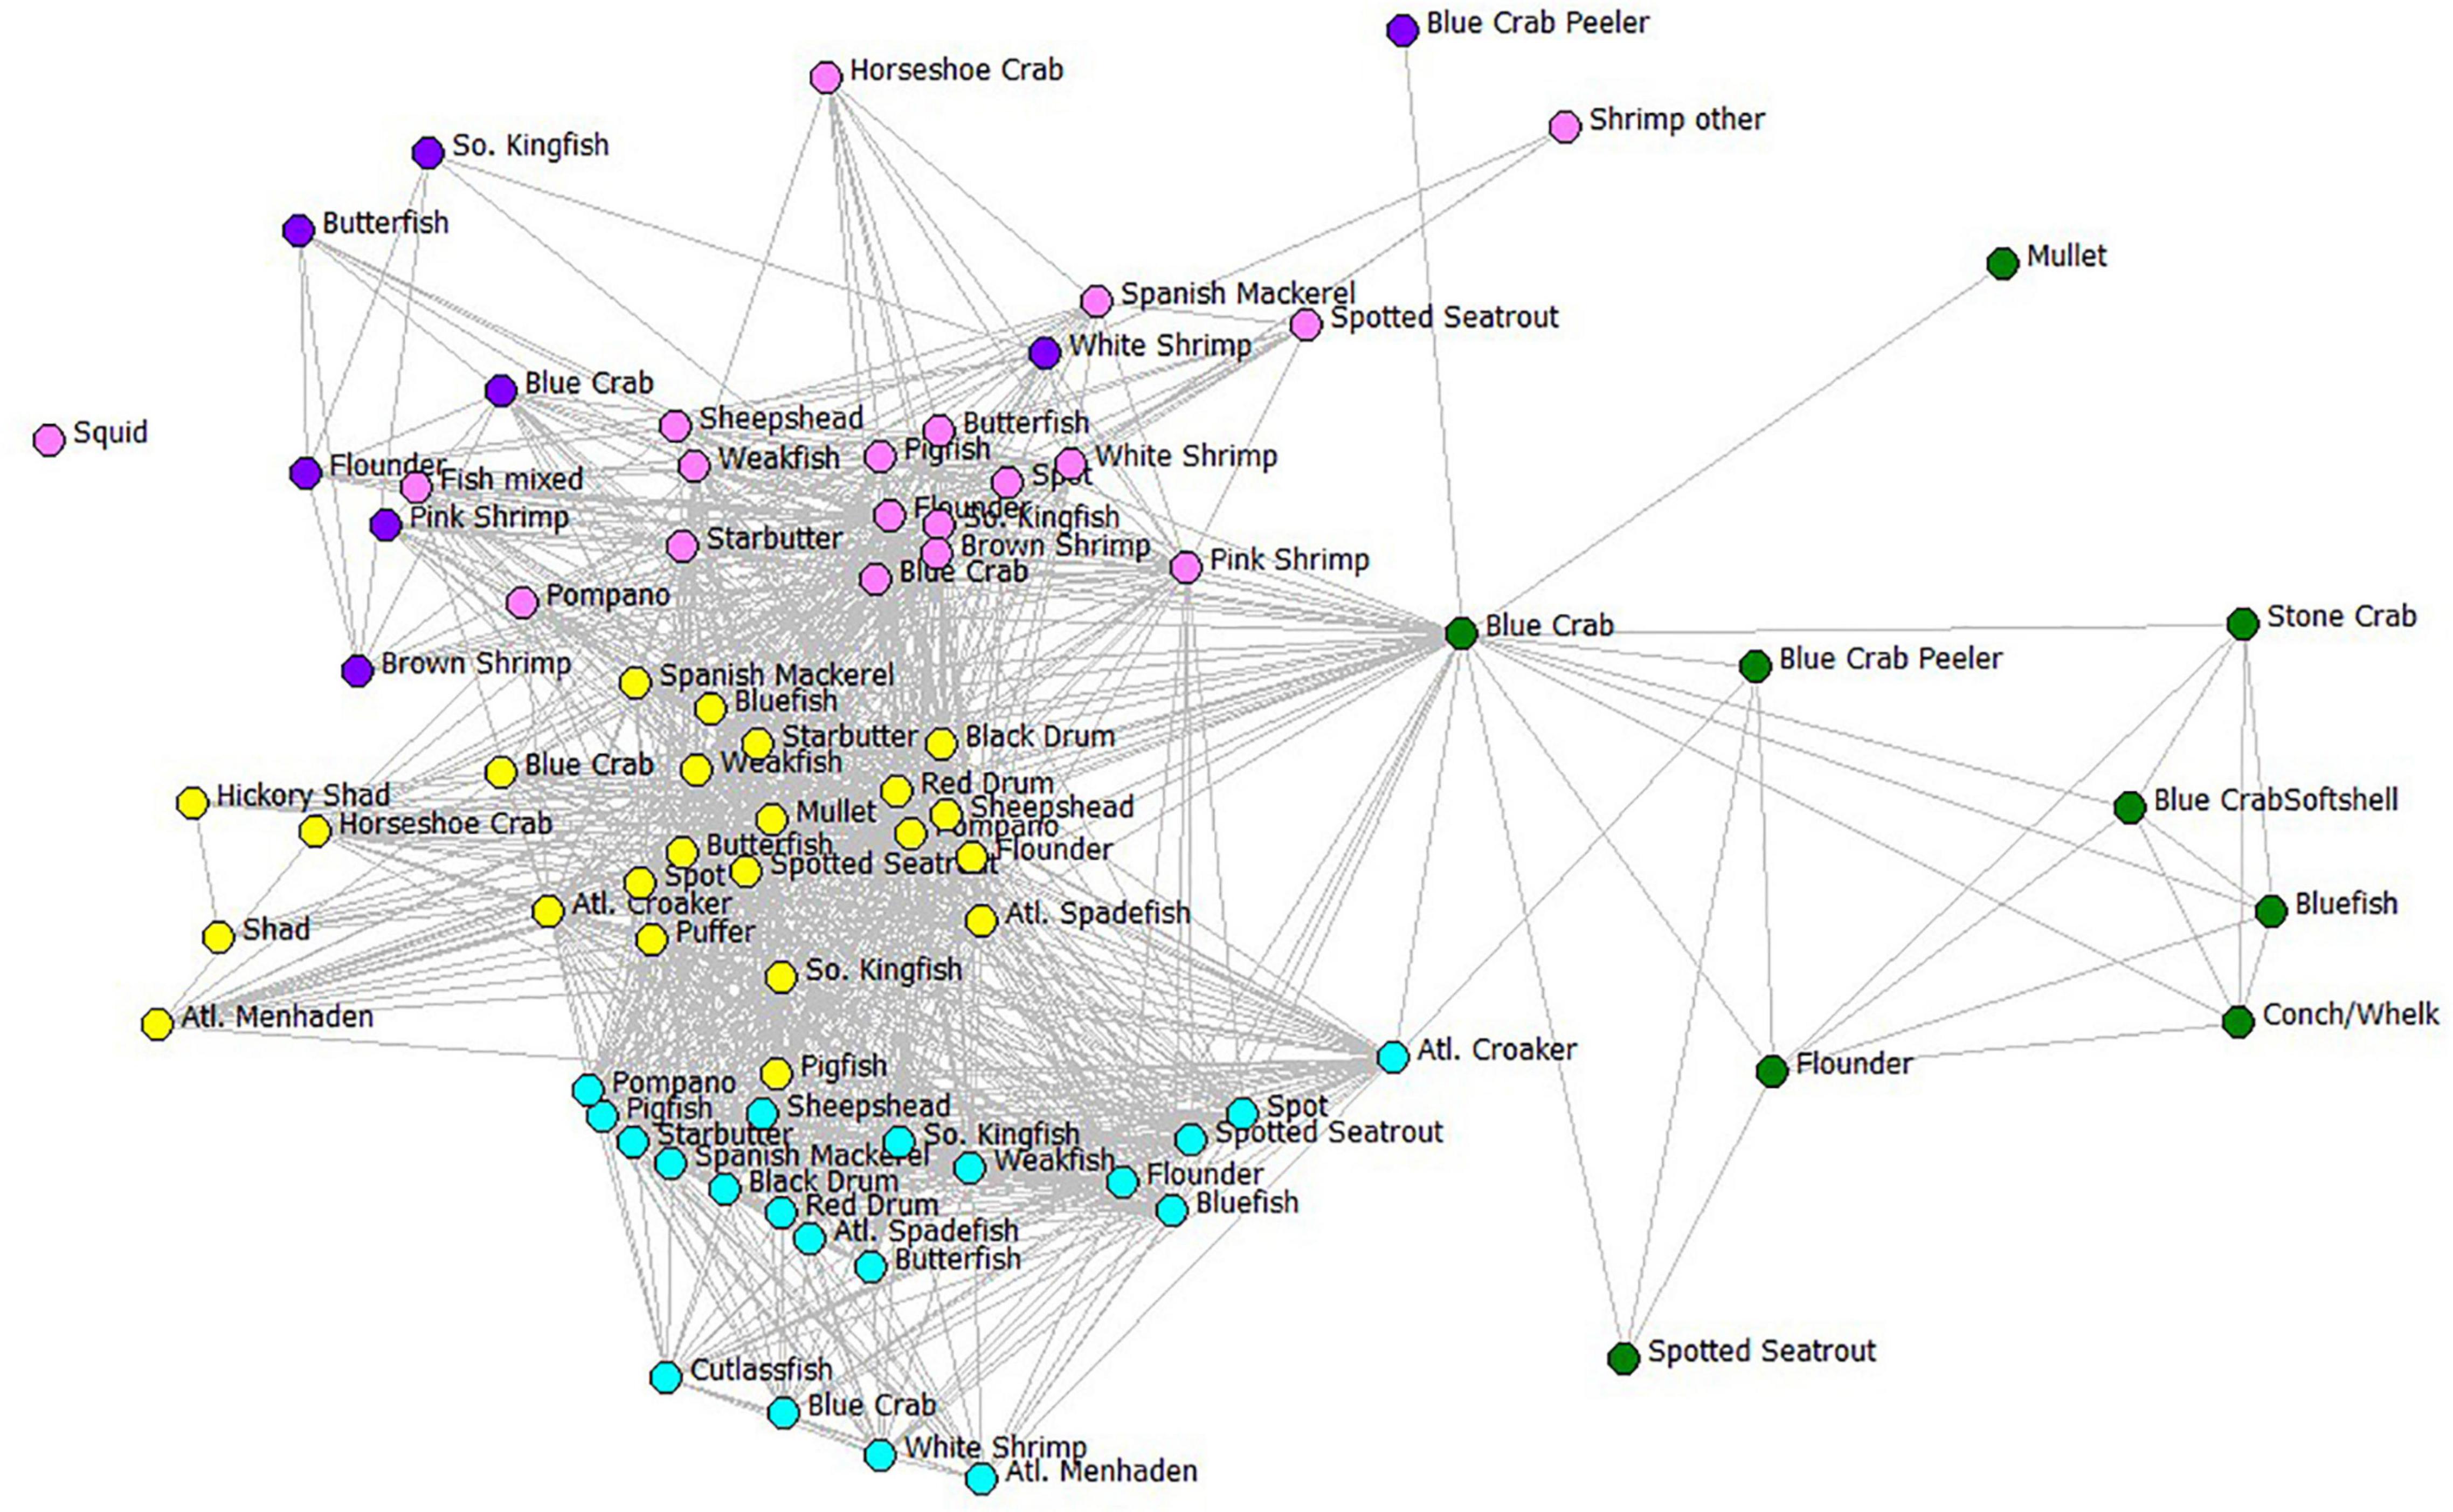
Figure 8. The fisher behavioral network showing the results of a Key Player node removal based on distance-weighted maximum fragmentation criterion. Color codes represent the six gear types used in the ECOPATH model using the same color assignments as in Figure 7 and the species names or ECOPATH compartments as given in Table 1. Edges between gear-species fisheries nodes indicate that at least one fisher was jointly involved in the two fisheries. The fishery nodes with greatest joint fisher participation were displayed using Fruchterman-Reingold spring-embedder algorithm (Fruchterman and Reingold, 1991), which places high-degree centrality nodes in the center of the plot.
After gill nets were removed with Key Player, the resulting behavioral network is shown as a fragmented network in Figure 8. Remaining gear-species fisheries to which fishers can switch are easily identified: some can switch to increase effort in haul seining (cyan nodes), crab potting (green nodes), shrimp trawling (pink nodes), skimmer trawling (purple nodes), and pound netting (yellow nodes). Each of these gears requires an organized crew of fishers, specific gear, and specialized vessels. A better way to examine the likelihood of switching to alternative gears after gillnet removal is to look at the fisher behavioral network collapsed by the fishing gear category, a reduced FBN graph of the same affiliation network, but only using the 24 gear types as nodes, and edges remaining the participants that share gears.
When we examine the FBN after the network was collapsed by gear type, gill nets are again the most central of the fisheries in the FBN (Freeman centrality for Gill Net Set < 5” = 2186; for Gill Net Set ≥ 5” = 1830; for Gill Nets Runaround = 1677; Table 3). This Freeman degree centrality is displayed as node size in Figure 9. Once again, the visualization of the network in Figure 9 only displays the six fishing gears modeled ECOPATH, but the centrality analyses included all gears in the FBN as reported to the NCDMF. The thickness of the edges in Figure 9 is proportional to the number of fishers jointly engaged in any two fisheries, and gillnets (red nodes), including the gillnets set (GNS) < 5 inches, gillnet set (GNS) > 5 inches, and gillnet runaround have many participants in common with pound nets (yellow nodes) and plot close together with them in the network. Fishers can easily switch between these gill net and pound net nodes that plot close to one another because they already participate in both linked nodes, have the gear, vessels, crew, permit, and license to do so. Gillnetters may also switch between the various gill net fisheries and haul seining (cyan node), shrimp trawling (pink node), and with lower frequency, crab potting (green node) and skimmer trawling (purple node). The dark thick lines connecting the fishery nodes thus illustrate the potential switching pathways between fisheries when modeled as gear-types when gillnets are banned.
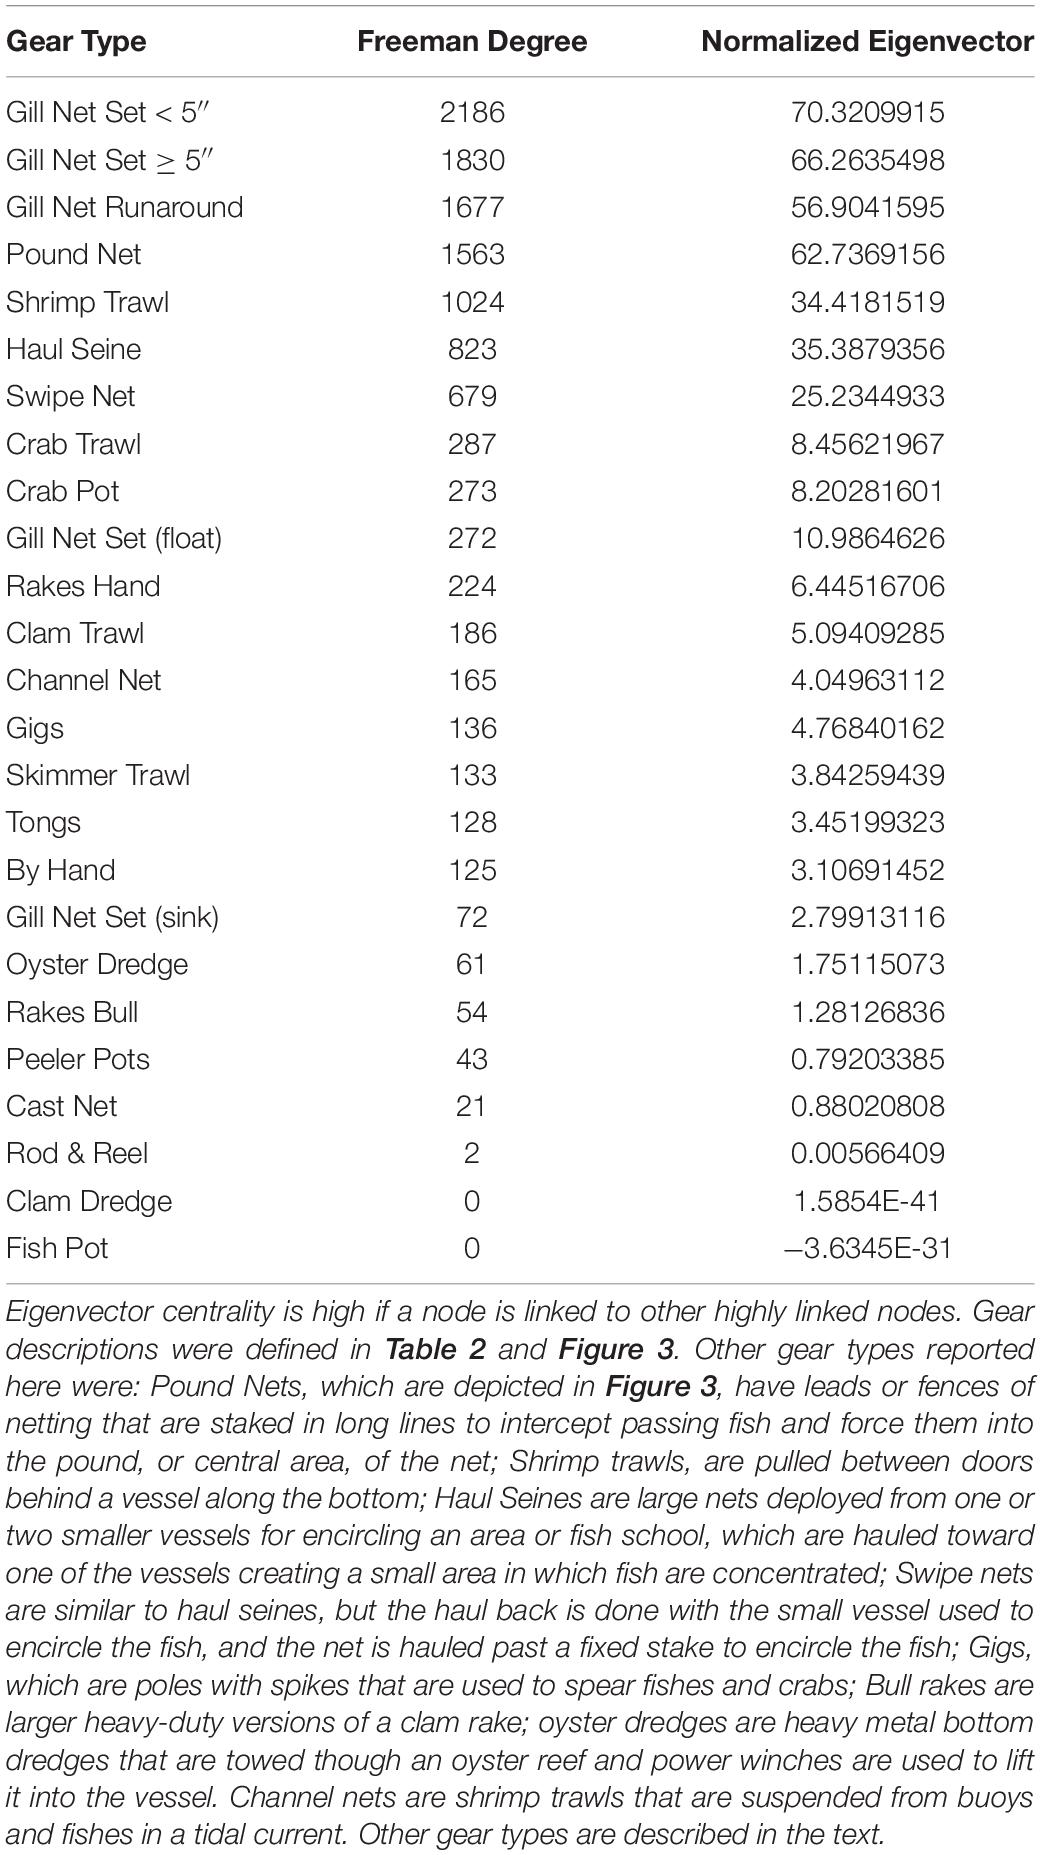
Table 3. Two centrality measures of influence (Freeman Degree Centrality and eigenvector centrality) for the reduced Core Sound Behavioral Network, collapsed by gear used.
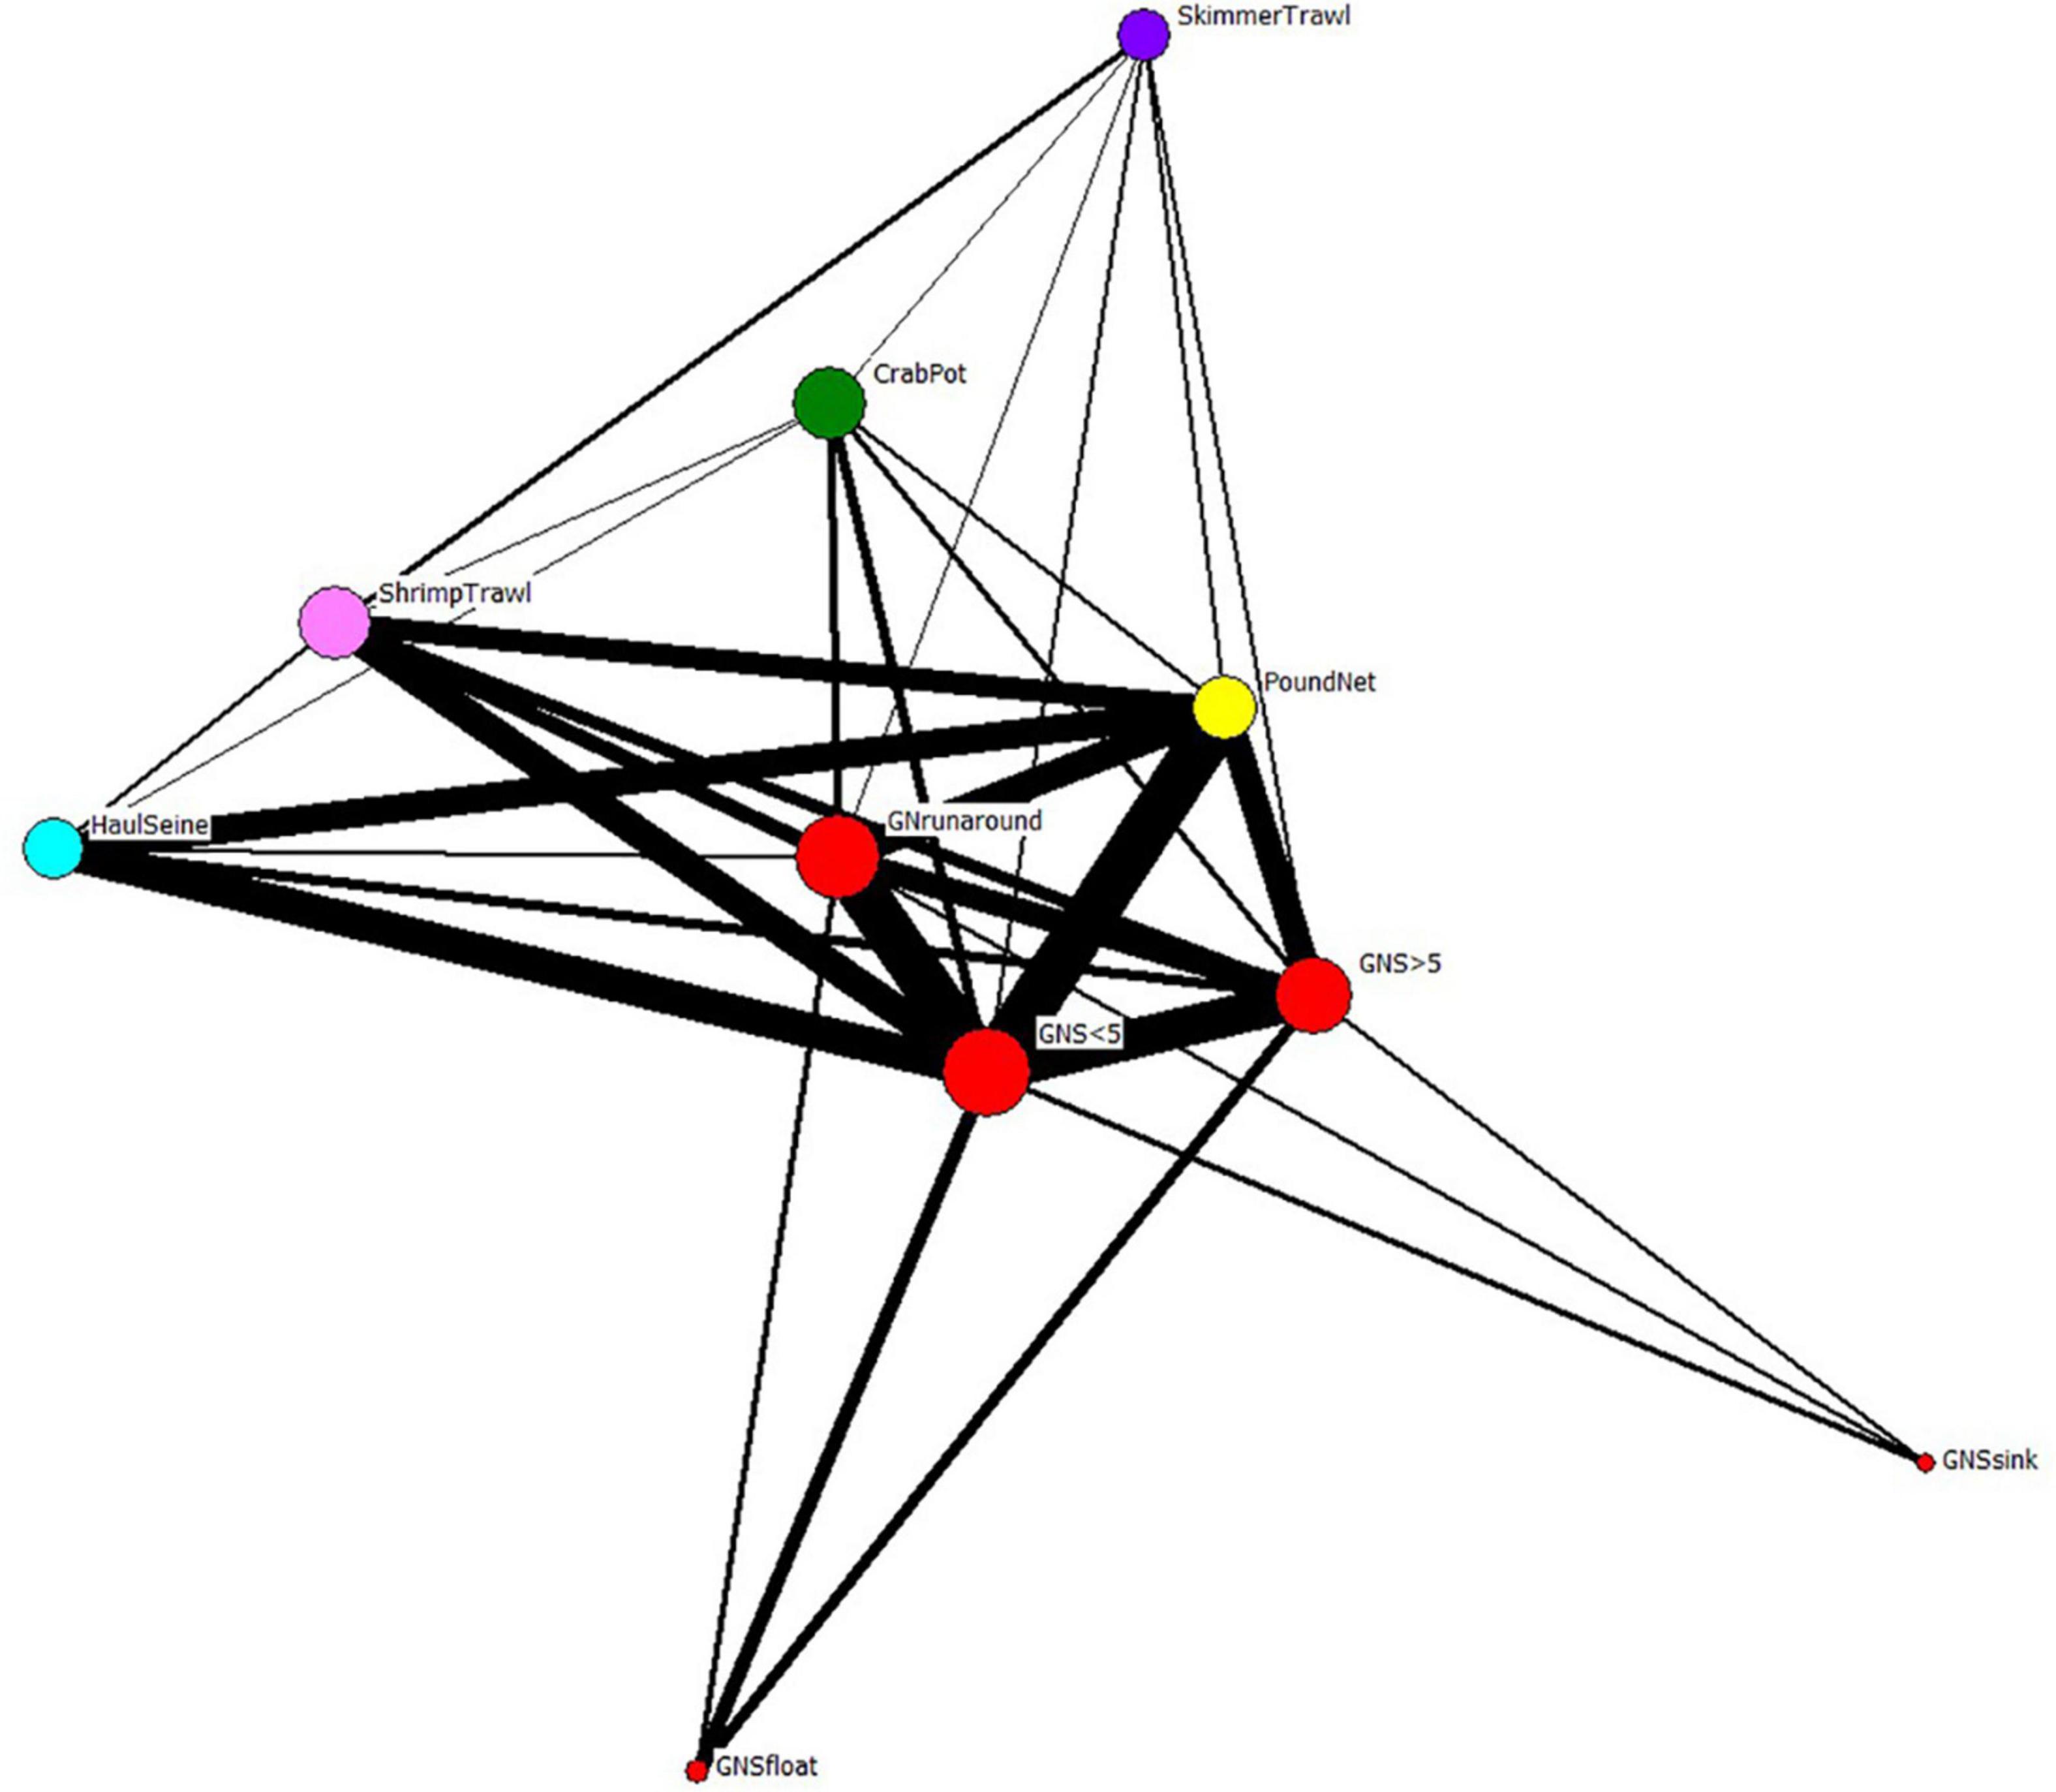
Figure 9. The reduced fisher behavioral network of Core Sound collapsed by gear type. Nodes from each species-gear fishery in Figure 7 were combined into super-nodes by the gear used to catch all species reported by participants. Edge thickness connecting the nodes represents the number of fishery participants that are engaged in the same fisheries (gear types). Node size scaled to Freeman degree centrality. The gear nodes with greatest joint fisher participation were displayed using Fruchterman-Reingold spring-embedder algorithm (Fruchterman and Reingold, 1991), which places high-degree centrality nodes in the center of the plot.
When the Key Player fractionation metric is calculated for removal for all gill nets in the reduced FBN, the distance-weighted fragmentation metric F is greatest for gillnet Gill Net Set < 5” F = 0.110, and other gill net types are in the top four gear types that would most fragment the reduced behavioral network (Table 4). They also exhibit high betweenness (connecting nodes with fishers engaged in using similar gear in other fisheries). Thus, we can see that gill nets are central in the FBN and thus act as bridges or switching pathways in the network and if they are removed, they will maximally fragment the network.
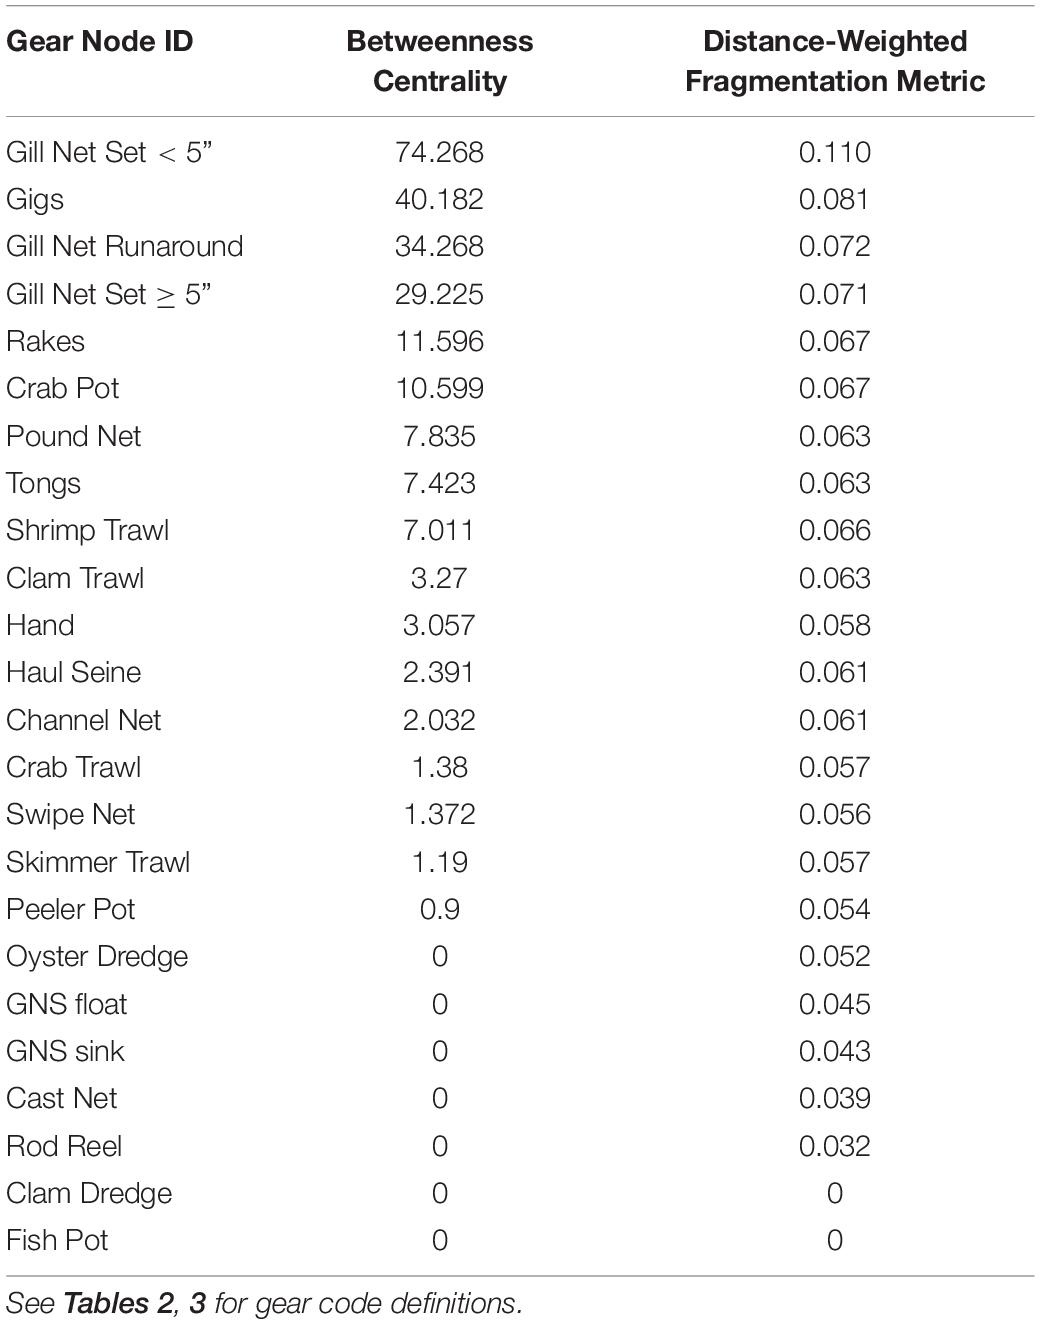
Table 4. Betweenness Centrality and Distance-weighted Fragmentation Metric F calculated in Key Player for the nodes in the reduced Fisher Behavioral Network.
Gear Switching in the Fisher Behavioral Network Due to a Proposed Gillnet Ban
Finally, we examine the role of the governance subsystem on the Core Sound socio-ecological system by examining the impact of a gillnet ban that could be imposed by the NCDMF. The reason is simple: these fishers already possess the vessels, equipment, licenses, and knowledge required to fish with these alternative gear types. Thus, a gill net ban will affect this most central group of fishers. Because there is high centrality indicated for fishers using gill nets to other fisheries, there are many gear-switching options for these fishers.
Because gill nets are among the most commonly used gear types in this ecosystem, and we have demonstrated here that they are the most central type of gear used in the behavioral network of fishers, switching to other gears will occur along the linked paths in our affiliation network model – we refer to these as gear-switching pathways. We predict that gillnetters will switch to other gears with high shared gear usage, specifically to pound netting (Pn = 0.73), shrimp trawling (Pn = 0.38), haul seining (Pn = 0.31), and crab potting (Pn = 0.13) (Table 5). If gill nets are completely banned, and fishers switch to alternative gears, fishing effort is predicted to increase in the pound net (1.8 times current effort), haul seine (1.4 times), crab potting (2.5 times), shrimp trawling (1.76 times) and skimmer trawl (1.5 times) fisheries by the calculated switching metric (Table 5).
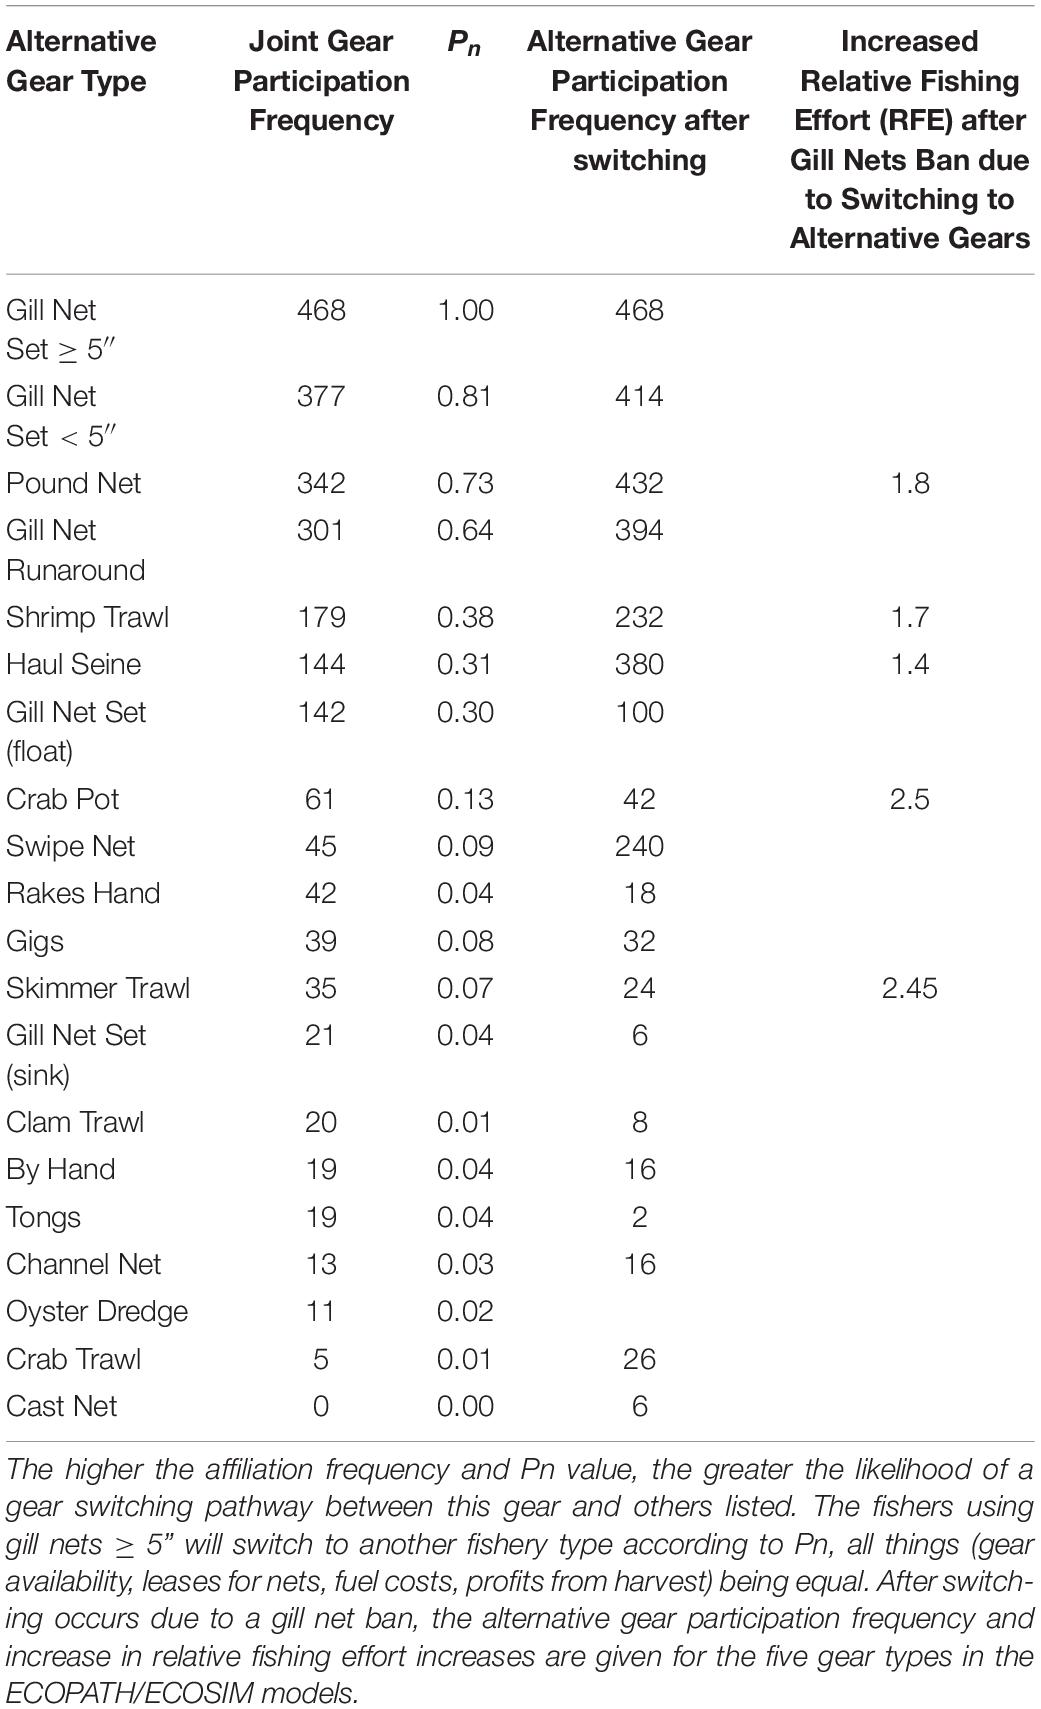
Table 5. The relative frequency and proportion of shared gear use (Pn) in the affiliation network of participants involved using gill nets ≥ 5-inch mesh that also participate in other fisheries in the Core Sound commercial fisheries.
Interaction Between Subsystems: Simulating a Gill-Net Ban on the Ecosystem
The ECOSIM simulation model showed that there are likely to be multiple predicted ecological effects of banning gill nets. Firstly, over 10 years, there would be effects on other species of fish that are caught by gill nets. The ECOSIM model scenario without considering gear-switching and redistribution of fishing effort to other gears (Scenario 1: Gill Net Ban, with no effort change in other fisheries) suggests that red drum, striped mullet, and flounders would become more abundant within 10 years of the gill net ban, increasing by 8% (striped mullet), 17% (red drum), and 7% (flounders; Figure 10A). Thus, the simulated gill net ban predicts that this management action would achieve the desired biological objectives to rebuild these fisheries. However, this scenario will have impacts on both the fishers and seafood products brought to market, reducing fishers’ incomes and market supply.
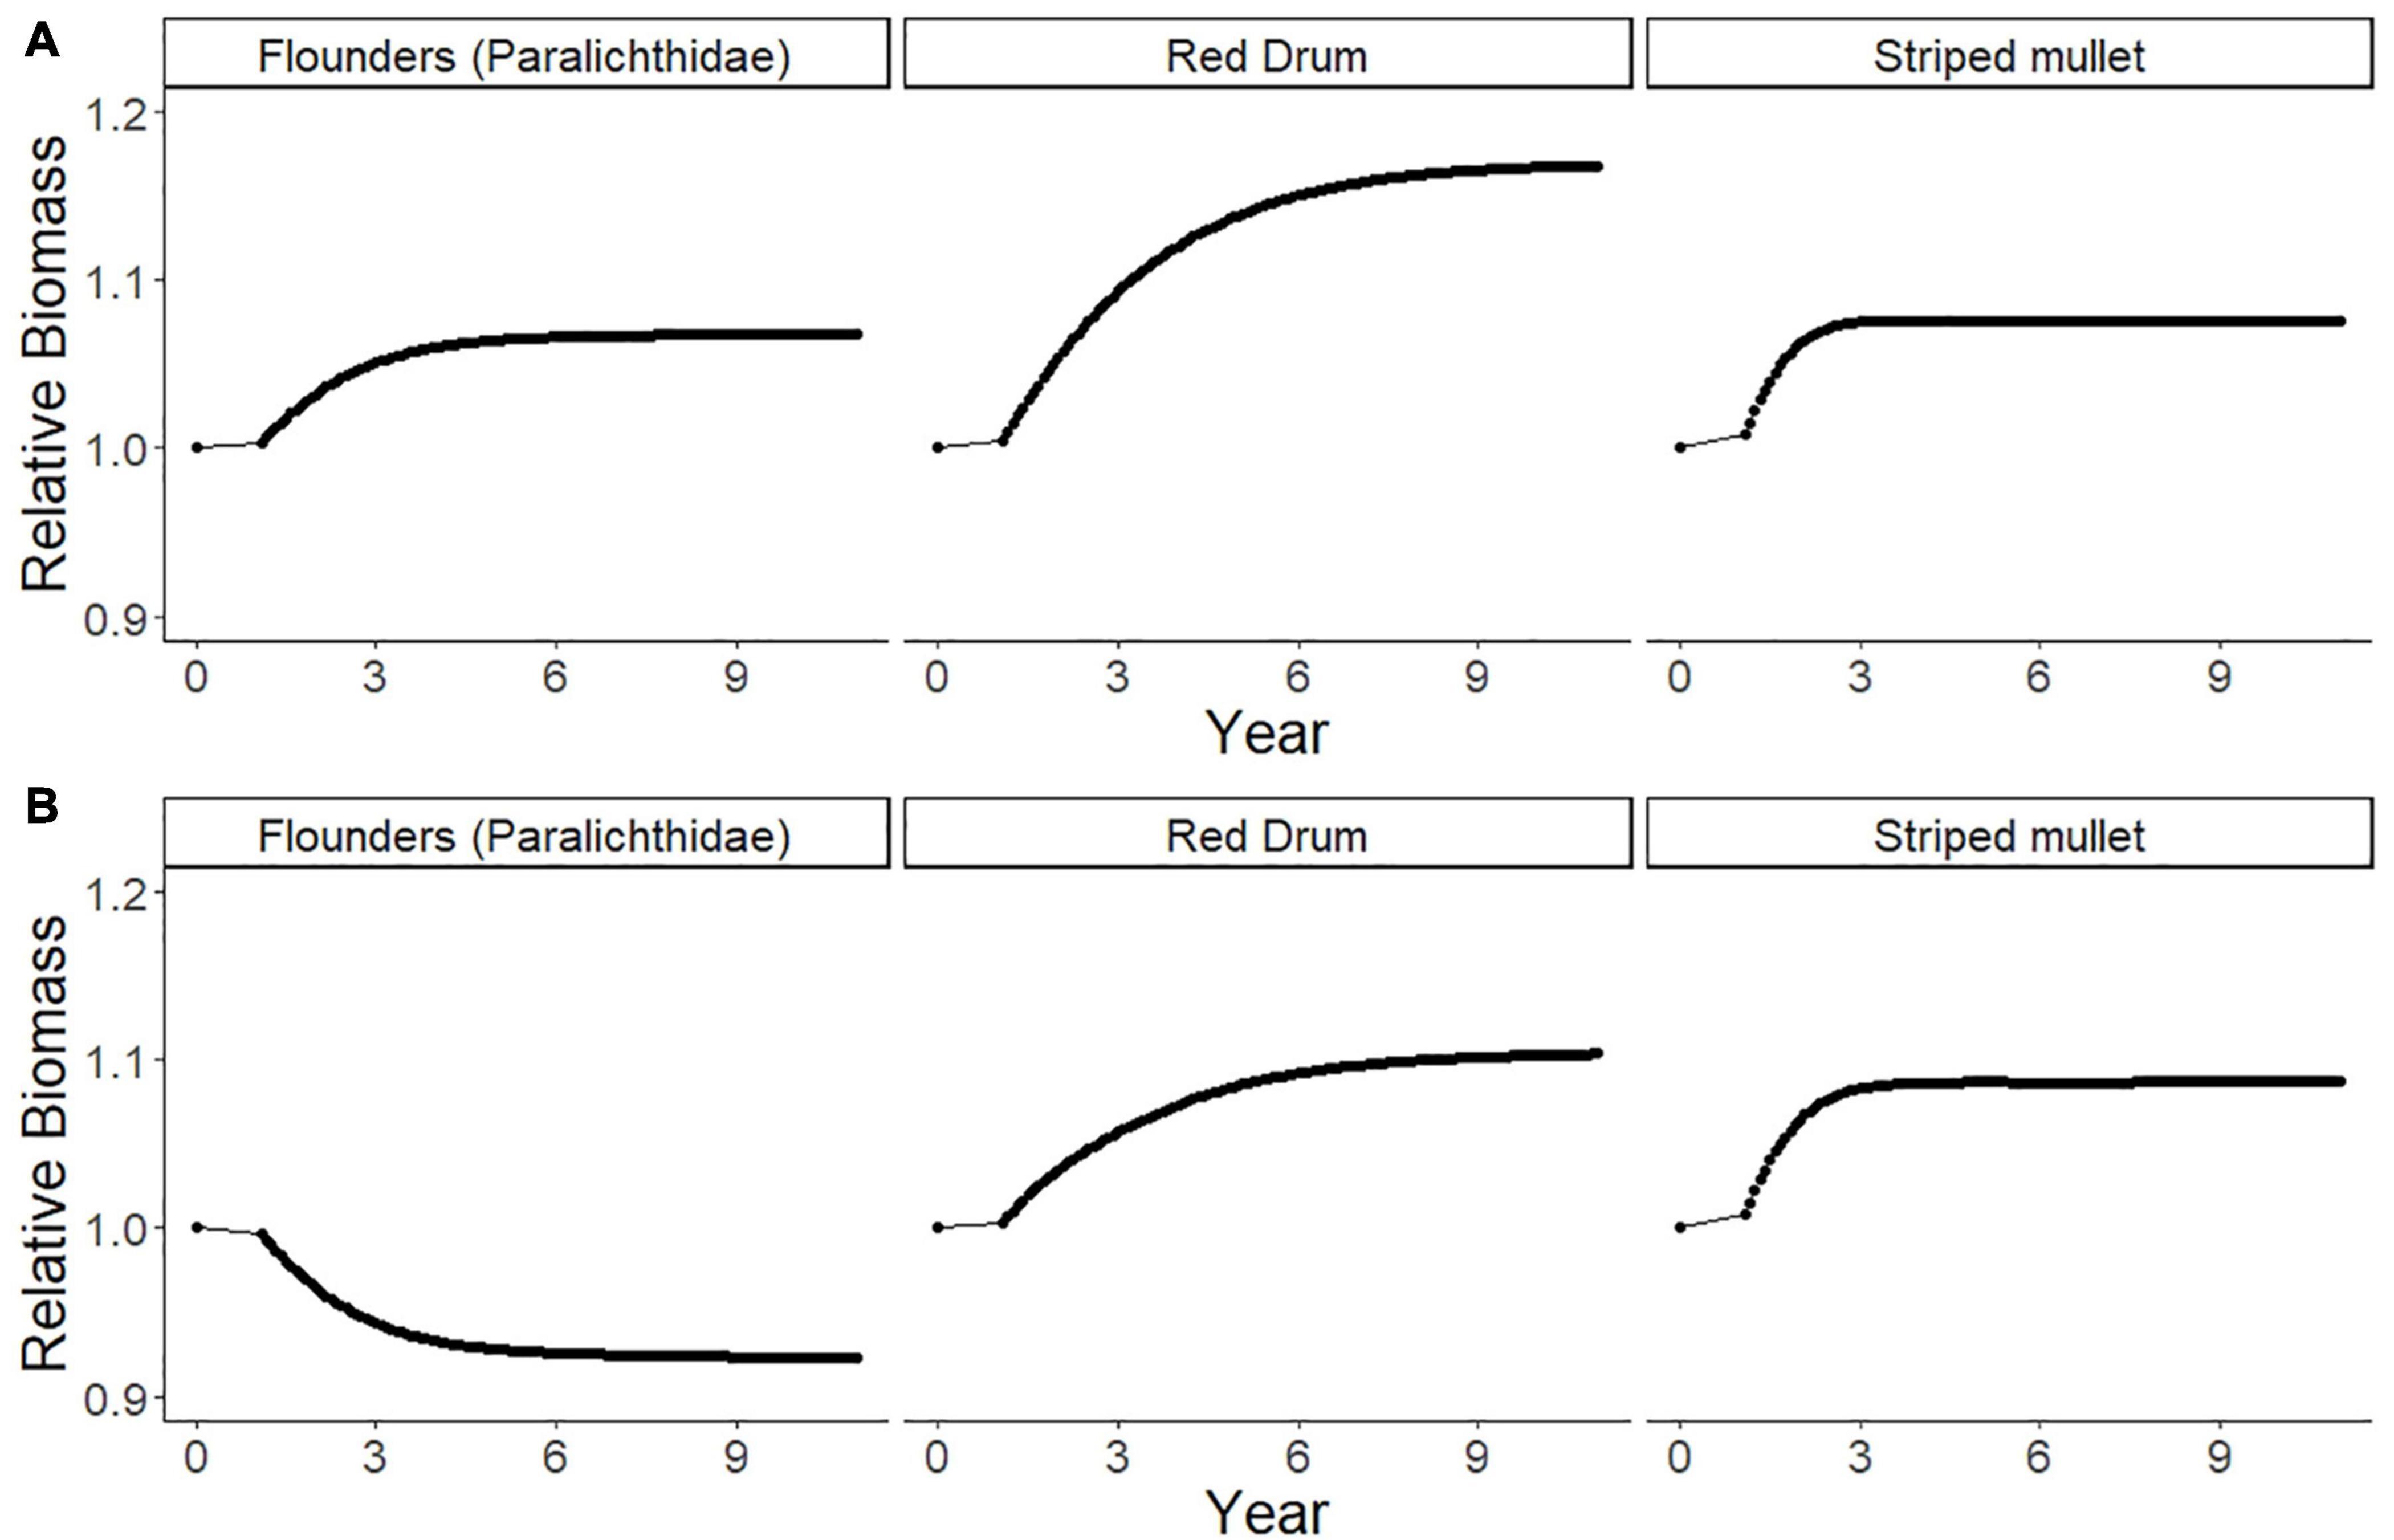
Figure 10. The predicted relative biomass values of paralichthyid flounders, red drum, and striped mullet for ten years following a gill net ban with: (A) ECOSIM model Scenario 1, no gear-switching or fishing effort re-distribution to other gears; (B) ECOSIM model Scenario 2, Gill Net Ban with Increased Effort in Alternative Fisheries (pound netting, haul seining, shrimp trawling, skimmer trawling, and crab potting) after gear-switching based on the relative fishing effort (RFE, Table 5) derived from the fisher behavioral network after gill net removal.
We also predict that a reduction in gillnet fishing effort would cause a re-distribution of the fishing effort due to fishers switching other gears and species. We explore that next scenario next with an analysis based on the switching pathways identified in the reduced FBN. The closure of Core Sound to gill nets ≥ 5-inch mesh will affect many fishers and will cause cascading impacts on fishing behavior as the fishers to switch to other gears where they can catch the same species or have another fishing opportunity that produces a similar amount of income (limited by the availability of gear, vessels, licenses, and knowledge). This is the case demonstrated in the ECOSIM modeling scenario (Scenario 2: No Gill Nets with Increased Effort in Other Fisheries) with the new relative fishing effort in the five remaining fishery gear types. Scenario 2 projected a decrease in paralichthyid flounder (Figure 10B); relative biomass would be 0.92 ten years after the gillnet ban, not an increase in relative biomass 1.07 as shown in Scenario 1 (Figure 10A). The 8% decline in flounder biomass after a ban is due largely to increased effort in the pound net fishery, because fishers have a high probability of switching from gill nets to that gear type, and pound nets selectively harvest large biomass of flounder (Figure 6). Flounder biomass showed the greatest declines in this simulation of the gill net ban, with biomass decreasing by 8%, instead of increasing by 7% as in ECOSIM Scenario 1. Red drum (1.10 relative biomass) and striped mullets (1.09 relative biomass) would be predicted to increase by 10% and 9% respectively in Scenario 2 (Figure 10B), as they are not selected by other fisheries, being primarily caught in run-around gill nets, but not other gear types to any degree (Figure 6).
Discussion
Socio-ecological systems are complex networks of interrelations among organisms and natural resources, people and resource users, and informal and formal governance systems. For example, a conceptual model of socio-ecological systems has been proposed involving interrelated subsystems of natural resources, resource users, resource co-management groups, and government agencies (Ostrom, 2009). A socio-ecological network modeling approach was developed here for Core Sound, NC, United States, in which three complex subsystems are acting as interrelated networks: 1) an ecological network model subsystem with nodes that are estuarine species of fishes and invertebrates; 2) a fisher behavioral network model subsystem with fisheries (gear-species or gear type) as nodes, that shows the number of participants in common in the fisheries, and which identified the pathways for switching between gears used to harvest species; and, 3) a governance subsystem that imposes season and area closures, gear restrictions, and other fishery management actions on the fishers to indirectly influence the abundance of species in the ecosystem network subsystem.
To develop these socio-ecological network models, we used commercial fisheries data reported to the state fisheries management agencies, and a similar approach has been used to study the fishing behavior of entire fishing fleets using gillnets in the German Baltic (Meyer and Krumme, 2021). These authors classified the interdependencies among fishers’ behaviors using sequence analysis (annual rounds and seasonality of species and gears that fishers use) to classify vessel groupings. Although the approach facilitates the classification of groupings of fisher behavior that might inform relationships between human and natural systems, it does not allow for the identification of switching pathways afforded by a network approach as described here.
As we developed these network models, we focused on the first two subsystems and used a network modeling approach for each one; we did not attempt to model the network in the governance subsystem. As shown in a recent study of fisheries management in Kenya and Tanzania, the governance subsystem is a network of actors organized in multiple levels; it has been modeled using social network analysis (Tuda et al., 2021). Similarly in North Carolina, there are multiple governance entities (e.g., the NC Division of Marine Fisheries, the NC Marine Fisheries Commission, the Atlantic Coast States Marine Fisheries Commission, and the NOAA Southeast Regional Fishery Management Council, along with non-governmental organizations, resource users, and scientists represented within each of the above agencies). Furthermore, the commercial fishing market economy can act as a fourth complex network subsystem, which has its network of interacting firms and people, each reacting to demand and supply constraints, which can ultimately act as the main driver of fisher behavior. These latter two subsystems will require further development with social network models to elucidate a complete socio-ecological system for Core Sound fisheries.
Fishing Behavior After a Regulatory Change as Revealed by Network Analysis
Socio-ecological systems and ecosystem-based management should incorporate predictions of fisher behavior after one of the subsystems change. One of the primary challenges in this vein has been linking human behavior and natural systems dynamics within an overall ecosystem-based approach, particularly in understanding feedbacks between these coupled systems (Matsuda and Katsukawa, 2002).
In the current study, we examined a proposed management action in the form of a gillnet ban intended to change the behavior of commercial fishers and thus indirectly conserve certain species in the ecological network. The behavioral change of the fishers is not often anticipated or considered in implementing management actions imposed by the governance subsystems, or it is only considered during public hearings on proposed management actions, but it can be predicted and modeled with existing data on gear and species harvested in the past, as we show here. Our results show that when gill netting is removed by regulation, we can expect an intensification of fishing effort in the remaining groups of gear types. Gillnet fishers will switch to participate in the other fishing activities during other times of the year (crab potting, pound netting for flounders and other species, shrimp trawling, skimmer trawling, or haul-seining). Since haul-seining is difficult for fishers to enter because of the knowledge, specialization of vessels, and gear required, we expect most fishers will switch to pound netting. Ironically, our simulation of banning gill nets will increase fishing effort in pound netting fishery, intensifying effort on paralichthyid flounder harvest, and in the shrimp trawl sector, which has had declining effort since 2000 but one that has the greatest potential for biological impacts and economic returns. As revealed by our socio-ecological system analysis of the gear-switching behaviors of fishers, a gillnet ban may not be most desirable from an overall fishery and ecosystem management standpoint, although it may protect threatened and endangered species such as sea turtles, bottlenose dolphin, and Atlantic sturgeon. Managers need to consider the predicted fishing and gear-use behaviors of fishers when considering management actions.
We used a network metric called degree centrality or “betweenness” in the fisher behavioral network of the various gear and species types in assessing this gear-switching pathway when fishery regulations change due to management interventions. Highly central nodes in a network are connected to many other nodes, so their disruption or removal will have far-ranging network impacts. Network centrality metrics assess the potential for fragmentation of the fisher behavioral network or the disruption due to the removal of any gear type. Disruption of the fishery network will have impacts on the fishers, who will switch to other gears to maintain profitability, and also on the ecosystem, which will have different responses depending on the behavior of the fishers and their gear use.
The profitability of the fishery trophic niche could change. Thus, if the fishery gear is banned, this has the effect of closing down that trophic niche, and participants may choose to leave the managed area, perhaps will join another fishery, or they could leave fishing altogether if other employment opportunities are available. We considered what would happen to the Core Sound fisheries if all gill nets were banned and fishers remained in other fisheries, redistributing their fishing effort in other gear types. [Note: A partial ban on gill nets < 5-inch mesh is currently in effect in this management area (Murphey, 2020a), although larger mesh gill nets for flounder are allowed on a seasonal basis according to the current NCDMF proclamation (Murphey, 2020b)]. Thus, a gill net ban will affect this most central group of fishers. Because there is high centrality indicated for fishers using gill nets to other fisheries, there are many gear-switching options for these fishers. If gill nets are completely banned, and fishers switch to alternative gears, fishing effort is predicted to increase in the pound net (1.8 times current effort), haul seine (1.4 times), crab potting (2.5 times), shrimp trawling (1.76 times) and skimmer trawl (1.5 times) fisheries by the calculated switching metric.
This switching behavior implies that the closure of Core Sound to gill nets ≥ 5-inch mesh will affect many fishers and will cause cascading impacts on fishing behavior as the fishers switch to other gears where they can catch the same species or have another fishing opportunity that produces a similar amount of income (limited by the availability of gear, vessels, licenses, and knowledge). An ECOSIM modeling scenario (Scenario 2: No Gill Nets with Increased Effort in Other Fisheries) with the new relative fishing effort in the five remaining fishery gear types projected a decrease in paralichthyid flounder harvest, not an increase as modeled earlier. The decline in flounder harvest is due largely to increased effort in the pound net fishery, because fishers have a high probability of switching from gill nets to that gear type, and pound nets selectively harvest large biomass of flounder. It is not clear that fishery managers have considered gear-switching behavior in planning to ban gill nets. A socio-ecological view as detailed here should be considered when taking such management actions.
In terms of the relative frequency of other gear-species fishery types, the gill net fishers using ≥ 5-inch mesh (the type of gear under intensive regulatory focus by NOAA and NCDMF in Core Sound to protect sea turtles, Atlantic sturgeon, and bottlenose dolphins and to further reduce flounder harvest) would be most likely to switch to the following fisheries (in descending order): gill net set < 5”, pound nets, runaround gill nets, shrimp trawls, haul seines, gill nets set (float), crab pots, swipe nets, hand rakes, gigs, skimmer trawls, gill nets set (sink), crab trawls, by hand, using tongs, rakes bull, channel nets, oyster dredges, and clam trawls. This affiliation frequency index may not exactly predict the likelihood of switching behavior, because fishers must respond to new regulations (NCDMF Proclamations about seasonal closures and gear restrictions may occur at any time), and they may not have the appropriate license (pound netting requires a special permit from NCDMF), technology (they must invest in new gear and have the appropriate vessel type), knowledge of the fishery, or all of these (for example, clam kicking requires specific knowledge of the locations where clams are found, the technology to adapt a vessel for clam kicking, plus a special license for this activity). But because this index is a function of past affiliations and fishing behavior, one can assume that the current gillnet ban will have a similar participation distribution in other fisheries. We can test this affiliation index idea with new NCDMF data as it is collected in the coming years.
Finally, the switching behavior induced by a gill net ban will have varying impacts on the species that are harvested by the gear to which the fishers switch. Switching from gill netting to pound netting will increase harvest on the species previously captured in the pound nets: flounder and black drum. Switching to shrimp trawling will increase harvests on spot, flounder, blue crabs, and brown shrimp, plus increase by-catch from trawling, possibly increasing the mortality on loggerhead sea turtles. The gear-species fisheries that have the highest economic return are shrimp trawling for hard crabs, spot, flounder, pink, white and brown shrimp, pound netting for flounders, and haul seining for spot and weakfish. These are the likeliest fisheries (gear-species nodes) to which fishers will switch using gears, vessels, and licenses they currently have access to while maintaining a similar species mix and income potential.
The establishment of the closed-trawling areas in 1978 forced fishers to fish more intensively in the open areas of Core Sound and to move elsewhere to trawl (e.g., Pamlico Sound, Atlantic Ocean) or to switch gears. After 1978, fishers moved into other gear types (haul seining, pound netting, crab potting, or trawling), increasing the harvests in those fisheries. With the closure of the gill nets < 5 inches in Core Sound, established by the Proclamation Authority of the Director of NCDMF to reduce the rake of sea turtles and other endangered species (Murphey, 2020a), fishers will have to once again adapt. However, there would be an increase in relative fishing effort in these alternative fisheries, which will result in the ecosystem changes we described in ECOSIM Scenario 2, notably, increased harvests on southern flounder and increased impacts due to shrimp trawling.
Also, if enacted, a complete gill net ban will cause a loss of income to some fishers and possible loss of seafood to the local and international markets. Some fishers using other gear types may benefit from the gillnet ban in Core Sound, i.e., those that are fishing with existing pound nets and haul seines, which catch similar species as the gillnetters, may experience higher catches because of lower competition. Fishers may switch and devote increased effort to these gear types if they already have a lease for pound netting, begin or expand haul seining, increase the number of trips in shrimp and skimmer trawling, direct more effort to crab potting, or join together to innovate and develop new methods of harvest. Other fishers will opt for individual fishing opportunities: hand raking for clams, gigging for flounder (which will bring a high dollar value), and increase their effort in small-scale shrimp trawling and channel-netting. Finally, shrimp trawling activity, which already has the greatest harvest, may increase, given some switching pathways between gill netters and the shrimp trawlers and the large potential for economic return.
Conclusion
Socio-ecological systems are complex involving coupled networks of subsystems. In our case study, these are subsystems of an ecological network, a fisher behavioral network, and a governmental regulatory subsystem that can influence indirectly both of the other two subsystems. Elinor Ostrom (2009) called these polycentric systems of management, with fishers or resource users changing their behavior and self-regulating when the ecological subsystem changes or the governance subsystem changes. In our Core Sound socio-ecological system, we predict that fishers will switch into pound netting if gill netting is banned, and will increase harvests on one managed species, paralichthyid flounders. This management action, banning gill nets, would have an unintended consequence, namely increasing the harvest of this group of fishes. If reduction of harvest is the intended conservation goal, then the result is greater harvest not less, if redistribution of fishing effort among gear types and gear-switching occurs as predicted. The ability to document and model these fisher behavioral networks can be linked to economic decision models (Addicott et al., 2019), ecosystem and ecological network models (Johnson and Griffith, 2010; Deehr et al., 2014), and regulatory and management systems models (Johnson and Parks, 1998). Fishery managers need to understand the role of the resource user subsystem and take account of this switching behavior when setting management goals. In short, fishery managers need to incorporate a more socio-ecological approach to fishery management.
Data Availability Statement
The original contributions presented in the study are included in the article/Supplementary Material, further inquiries can be directed to the corresponding author/s.
Ethics Statement
The studies involving human participants were reviewed and approved by The East Carolina University and Medical Center Institutional Review Board (UMCIRB). Written informed consent for participation was not required for this study in accordance with the national legislation and the institutional requirements. The animal study was reviewed and approved by East Carolina University Institutional Animal Care and Use Committee.
Author Contributions
JL supervised the project data collection and all network modeling analyses (ECOPATH, UCINET, NETDraw, Pajek, and Key Player), interpreted and synthesized the data, and co-wrote the manuscript. JJ supervised network modeling and analyses, performed affiliation network analysis and key player analysis, and co-wrote the manuscript. RD supervised all fieldwork for ecological data collection, processed meiofauna, macrobenthos, and zooplankton samples, ran all ECOPATH network modeling procedures/authored methods and ECOPATH output, and co-wrote the manuscript. KH collected the field data on benthos, fishes, and plankton and analyzed fish stomach contents. LC performed benthic sampling and processing, and benthos data analysis. DG conducted interviews with fishers and social networks’ interpretation. All authors contributed to the article and approved the submitted version.
Funding
This work was supported by North Carolina Sea Grant #R-BS17, with additional assistance to RAD from the Coastal Resources Management Program at East Carolina University. East Carolina University, Department of Biology, Thomas Harriot College of Arts and Sciences and the Department of Coastal Studies, Integrated Coastal Programs, East Carolina University provided additional support for the authors and publishing fees.
Conflict of Interest
The authors declare that the research was conducted in the absence of any commercial or financial relationships that could be construed as a potential conflict of interest.
Acknowledgments
The authors thank B. Chevraunt and S. McInerny for assisting with NCDMF data files from the Trip Ticket program. The authors also thank R. Christian for constructive comments regarding model development, numerous students (especially C. Krahforst and K. Regensburg) for assistance with field and lab work, the staff of the ECU Diving and Water Safety Office. S. Borgatti assisted with Key Player 2 fragmentation statistics.
Supplementary Material
The Supplementary Material for this article can be found online at: https://www.frontiersin.org/articles/10.3389/fevo.2021.662412/full#supplementary-material
Footnotes
- ^ https://www.natureserve.org/conservation-tools/ecosystem-based-management-tools-network
- ^ www.ecopath.org
References
Addicott, E. T., Kroetz, K., Reimer, M. N., Sanchirico, J. N., Lew, D. K., and Huetteman, J. (2019). Identifying the potential for cross-fishery spillovers: a network analysis of alaskan permitting patterns. Can. J. Fish. Aquat. Sci. 76, 56–68. doi: 10.1139/cjfas-2017-0550
Alexander, S. M., Armitage, D., and Charles, A. (2015). Social networks and transitions to co-management in Jamaican marine reserves and small-scale fisheries. Glob. Environ. Chang. 35, 213–225. doi: 10.1016/j.gloenvcha.2015.09.001
Auster, P. J., Malatesta, R. J., Langton, R. W., Watting, L., Valentine, P. C., Donaldson, C. L. S., et al. (1996). The impacts of mobile fishing gear on seafloor habitats in the Gulf of Maine (Northwest Atlantic): implications for conservation of fish populations. Rev. Fish. Sci. 4, 185–202. doi: 10.1080/10641269609388584
Barr, B. W. (2013). Understanding and managing marine protected areas through integrating ecosystem based management within maritime cultural landscapes: moving from theory to practice. Ocean Coast. Manag. 84, 184–192. doi: 10.1016/j.ocecoaman.2013.08.011
Bene, C., and Tewfik, A. (2001). Fishing effort allocation and fishermen’s decision making process in a multi-species small-scale fishery: analysis of the conch and lobster fishery in Turks and Caicos Islands. Hum. Ecol. 29, 157–186.
Bodin, Ö (2017). Collaborative environmental governance: achieving collective action in social-ecological systems. Science 357:eaan1114. doi: 10.1126/science.aan1114
Bodin, Ö, and Crona, B. I. (2009). The role of social networks in natural resource governance: what relational patterns make a difference? Glob. Environ. Chang. 19, 366–374. doi: 10.1016/j.gloenvcha.2009.05.002
Borgatti, S. P. (2002). NetDraw: Graph Visualization Software. Available online at: http://www.analytictech.com/ (accessed February 05, 2020).
Borgatti, S. P. (2006). Identifying sets of key players in a social network. Comput. Math. Organ. Theory 12, 21–34. doi: 10.1007/s10588-006-7084-x
Borgatti, S. P., Everett, M. G., and Freeman, L. C. (2002). Ucinet for Windows: Software for social network analysis. Available online at: http://www.analytictech.com/
Borgatti, S. P., Everett, M. G., and Johnson, J. C. (2018). Analyzing Social Networks. London: Sage.
Browman, H. I., and Stergiou, K. I. (2004). Perspectives on ecosystem-based approaches to the management of marine resources. Mar. Ecol. Prog. Ser. 274, 269–303. doi: 10.3354/meps274269
Chagaris, D. D., Mahmoudi, B., Walters, C. J., and Allen, M. S. (2015). Simulating the trophic impacts of fishery policy options on the West Florida shelf using ecopath with ecosim. Mar. Coast. Fish. 7, 44–58. doi: 10.1080/19425120.2014.966216
Christensen, V., and Walters, C. J. (2004). Ecopath with ecosim: methods, capabilities and limitations. Ecol. Modell. 172, 109–139. doi: 10.1016/j.ecolmodel.2003.09.003
Christensen, V., Walters, C. J., Pauly, D., and Forrest, R. (2008). Ecopath with Ecosim Version 6 User Guide. (Lenfest Ocean Futures Project). Vancouver, BC: University of British Columbia Fisheries Centre.
Coale, J. S., Rulifson, R. A., Murray, J. D., and Hines, R. (1994). Comparisons of shrimp catch and bycatch between a skimmer trawl and an otter trawl in the North Carolina inshore shrimp fishery. North Am. J. Fish. Manag. 14, 751–768. doi: 10.1577/1548-8675(1994)014<0751:coscab>2.3.co;2
Crona, B., and Bodin, Ö (2006). What you know is who you know? Communication patterns among resource users as a prerequisite for co-management. Ecol. Soc. 11:7. doi: 10.5751/es-01793-110207
Deehr, R. A. (2012). Measuring the ecosystem impacts of commercial shrimp trawling and other fishing gear in Core Sound, North Carolina, using ecological network analysis. Diss. Coast. Resour. Manag. Ph. D thesis. Greenville, NC: East Carolina University.
Deehr, R. A., Luczkovich, J. J., Hart, K. J., Clough, L. M., Johnson, B. J., and Johnson, J. C. (2014). Using stable isotope analysis to validate effective trophic levels from ecopath models of areas closed and open to shrimp trawling in Core Sound, NC, USA. Ecol. Modell. 282, 1–17. doi: 10.1016/j.ecolmodel.2014.03.005
Fassina, C. M., Telles, D. H. Q., and Mazzuco, A. C. A. (2020). Governance challenges for the newest Brazilian marine protected areas: preliminary considerations for stakeholder participation. Ocean Coast. Manag. 185:105067. doi: 10.1016/j.ocecoaman.2019.105067
Fruchterman, T. M. J., and Reingold, E. M. (1991). Graph drawing by force−directed placement. Softw. Pract. Exp. 21, 1129–1164. doi: 10.1002/spe.4380211102
Fulton, E. A., Smith, A. D. M., Smith, D. C., and Van Putten, I. E. (2011). Human behaviour: the key source of uncertainty in fisheries management. Fish Fish. 12, 2–17. doi: 10.1111/j.1467-2979.2010.00371.x
Harvey, C. J., Bartz, K. K., Davies, J., and Francis, T. B. (2010). Mass-Balance Model for Evaluating Food Web Structure and Community-Scale Indicators in the Central Basin of Puget Sound. Seattle, Wash: U.S. Dept. of Commerce, National Oceanic and Atmospheric Administration, National Marine Fisheries Service.
Harvey, C. J., Fisher, J. L., Samhouri, J. F., Williams, G. D., Francis, T. B., Jacobson, K. C., et al. (2020). The importance of long-term ecological time series for integrated ecosystem assessment and ecosystem-based management. Prog. Oceanogr. 188:102418. doi: 10.1016/j.pocean.2020.102418
Johnson, G. A. (2003). The role of trawl discards in sustaining blue crab populations. Raliegh, NC. Available online at: https://ncseagrant.ncsu.edu/funding-opps/past-programs/n-c-fishery-resource-grant-program/ (accessed May 21, 2013).
Johnson, G. A. (2006). Multispecies Interactions in a Fishery Ecosystem and Implications for Fisheries Management: The Impacts of the Estuarine Shrimp Trawl Fishery in North Carolina. Ph. D. thesis. Chapel Hill: University of North Carolina.
Johnson, J., and Parks, D. (1998). Communication roles, perceived effectiveness, and satisfaction in an environmental management program. Comput. Math. Organ. Theory 4, 223–239. doi: 10.1023/A:1009644511252
Johnson, J. C. (1986). Social networks and innovation adoption: a look at burt’s use of structural equivalence. Soc. Networks 8, 343–364. doi: 10.1016/0378-8733(86)90002-X
Johnson, J. C., Borgatti, S. P., Luczkovich, J. J., and Everett, M. G. (2001). Network role analysis in the study of food webs: an application of regular role coloration. J. Soc. Struct. 2, 1–15.
Johnson, J. C., and Griffith, D. C. (2010). “Linking human and natural systems: social networks, environment, and ecology,” in Environmental Social Sciences: Methods and Resaearch Design, eds I. Vaccaro, E. A. Smith, and S. Aswani (Cambridge: Cambridge University Press), 212–237. doi: 10.1017/cbo9780511760242.012
Li, Y., Sun, M., Ren, Y., and Chen, Y. (2020). Impact of pre-closure fishing effort on marine protected area performance in social-ecological dimensions: implications for developing marine conservation plans. Sci. Total Environ. 729:138936. doi: 10.1016/j.scitotenv.2020.138936
Luczkovich, J. J., Borgatti, S. P., Johnson, J. C., and Everett, M. G. (2003). Defining and measuring trophic role similarity in food webs using regular equivalence. J. Theor. Biol. 220, 303–321. doi: 10.1006/jtbi.2003.3147
Luczkovich, J. J., Deehr, R. A., Hart, K. J., Clough, L. A., and Johnson, J. C. (2018). Cascading effects of shrimp trawling: increased benthic biomass and increase in net primary production. bioRxiv [Preprint] bioRxiv: 298323,
Malick, M. J., Rutherford, M. B., and Cox, S. P. (2017). Confronting challenges to integrating Pacific salmon into ecosystem-based management policies. Mar. Policy 85, 123–132. doi: 10.1016/j.marpol.2017.08.028
Matsuda, H., and Katsukawa, T. (2002). Fisheries management based on ecosystem dynamics and feedback control. Fish. Oceanogr. 11, 366–370. doi: 10.1046/j.1365-2419.2002.00214.x
Meyer, S., and Krumme, U. (2021). Disentangling complexity of fishing fleets: using sequence analysis to classify distinguishable groups of vessels based on commercial landings. Fish. Manag. Ecol. 28, 268–282. doi: 10.1111/fme.12472
Murphey, S. W. (2020a). Proclamation Length Less Than 4 Inches And Attendance Requirements For Gill NetsWith A Stretched mesh length less than 5 inches - Yardage Limit Decrease in Management Unit B. 4-7. Morehead City, NC: North Carolina Division of Marine Fisheries. Available online at: http://portal.ncdenr.org/web/mf/2020-proclamations (accessed May 24, 2021).
Murphey, S. W. (2020b). PROCLAMATION RE: Flounder - Commercial Purposes-Internal Coastal Water and Atlantic Ocean Waters (Gear specific) - Season Dates, Size and Gear Restrictions FF-25-2020. 1–2. Available online at: http://portal.ncdenr.org/web/mf/2020-proclamations (accessed May 24, 2021).
Opaluch, J. J., and Bockstael, N. E. (1984). Behavioral modeling and fisheries management. Mar. Resour. Econ. 1, 105–115. doi: 10.1086/mre.1.1.42628847
Ostrom, E. (2009). Special Section?: Special Section?: Science, Vol. 325. 419–422. Washington, DC: American Association for the Advancement of Science.
Pauly, D., Christensen, V., Guénette, S., Pitcher, T. J., Sumaila, U. R., Walters, C. J., et al. (2002). Towards sustainability in world fisheries. Nature 418, 689–695. doi: 10.1038/nature01017
Perruso, L., Johnson, J. C., Baertlein, P., and Johnson, D. H. (2017). A socioeconomic evaluation of a network of deepwater marine protected areas. Mar. Fish. Rev. 77, 73–83. doi: 10.7755/mfr.77.3.6
Pikitch, E. K., Santora, C., Babcock, E. A., Bakun, A., Bonfil, R., Conover, D. O., et al. (2004). Ecosystem-based fishery management. Science 305, 346–347. doi: 10.1126/science.1098222
Polovina, J. J. (1984). Coral reefs model of a coral reef ecosystem. Coral Reefs 3, 1–11. doi: 10.1007/bf00306135
Reid, J., and Rout, M. (2020). The implementation of ecosystem-based management in New Zealand–a Māori perspective. Mar. Policy 117:103889. doi: 10.1016/j.marpol.2020.103889
Risenhoover, A. D. (2012). Taking of Marine Mammals Incidental to Commercial Fishing Operations; Bottlenose Dolphin Take Reduction Plan. Available online at: https://www.govinfo.gov/content/pkg/FR-2012-07-31/pdf/2012-18667.pdf (accessed May 24, 2021).
Russ, G. R., and Alcala, A. C. (2011). Enhanced biodiversity beyond marine reserve boundaries: the cup spillith over. Ecol. Appl. 21, 241–250. doi: 10.1890/09-1197.1
Shabtay, A., Portman, M. E., Ofir, E., Carmel, Y., and Gal, G. (2018). Using ecological modelling in marine spatial planning to enhance ecosystem-based management. Mar. Policy 95, 14–23. doi: 10.1016/j.marpol.2018.06.018
Sobel, J., and Dahlgren, C. (2004). Marine Reserves: A Guide To Science, Design, And Use. Washington, DC: Island Press.
Stoll, J. S., Fuller, E., and Crona, B. I. (2017). Uneven adaptive capacity among fishers in a sea of change. PLoS One 12:e0178266. doi: 10.1371/journal.pone.0178266
Taylor, H. F. (1951). Survey of Marine fisheries of North Carolina. Chapel Hill: University of North Carolina Press, 555.
Torres, M. Á, Coll, M., Heymans, J. J., Christensen, V., and Sobrino, I. (2013). Food-web structure of and fishing impacts on the Gulf of Cadiz ecosystem (South-western Spain). Ecol. Modell. 265, 26–44. doi: 10.1016/j.ecolmodel.2013.05.019
Tuda, A. O., Kark, S., and Newton, A. (2021). Polycentricity and adaptive governance of transboundary marine socio-ecological systems. Ocean Coast. Manag. 200:105412. doi: 10.1016/j.ocecoaman.2020.105412
Turner, R. A., Polunin, N. V. C., and Stead, S. M. (2014). Social networks and fishers’ behavior: exploring the links between information flow and fishing success in the Northumberland lobster fishery. Ecol. Soc. 19:38. doi: 10.5751/ES-06456-190238
Ulanowicz, R. E. (1986). Growth and Development: Ecosystems Phenomenology. New York, NY: Springer Science & Business Media.
Van Holt, T., Crona, B., Johnson, J. C., and Gelcich, S. (2017). The consequences of landscape change on fishing strategies. Sci. Total Environ. 579, 930–939. doi: 10.1016/j.scitotenv.2016.10.052
Walters, C., Martell, S. J., and Mahmoudi, B. (2006). Ecosim model for exploring ecosystem management options for the Gulf of Mexico: implications of including multistanza life history models for policy predictions. Bull. Mar. Sci. 83, 251–271.
Watson, M. S., Jackson, A. M., Lloyd-Smith, G., and Hepburn, C. D. (2021). Comparing the marine protected area network planning process in British Columbia, Canada and New Zealand–planning for cooperative partnerships with Indigenous communities. Mar. Policy 125:104386. doi: 10.1016/j.marpol.2020.104386
Wieting, D. S., and Daniel, L. B. (2014a). Implementing Agreement to Establish a Program for Endangered and Threatened Atlantic Sturgeon Distinct population Segements (DPSs) Impacted by the North Carolina Department of Environment and Natural resources, Division of Marine Fisheries, Anchored Gilln. 17. Available online at: http://portal.ncdenr.org/c/document_library/get_file?uuid=0125e89c-1c6d-4d59-a430-1206754517c5&groupId=38337 (accessed May 24, 2021).
Wieting, D. S., and Daniel, L. B. (2014b). Permit to Incidentally Take Endangered/Threatened Species 2642_001. Available online at: http://portal.ncdenr.org/c/document_library/get_file?uuid=0125e89c-1c6d-4d59-a430-1206754517c5&groupId=38337 (accessed May 24, 2021).
Keywords: shrimp trawling, ecological networks, trophic role, affiliation network, degree centrality, regular equivalence, key player analysis
Citation: Luczkovich JJ, Johnson JC, Deehr RA, Hart KJ, Clough L and Griffith DC (2021) Linking Fishing Behavior and Ecosystem Dynamics Using Social and Ecological Network Models. Front. Ecol. Evol. 9:662412. doi: 10.3389/fevo.2021.662412
Received: 01 February 2021; Accepted: 11 May 2021;
Published: 09 June 2021.
Edited by:
Antonio Bodini, University of Parma, ItalyReviewed by:
Sophie Gourguet, UMR 6308 Aménagement des Usages des Ressources et des Espaces Marins et Littoraux (AMURE), FranceRonaldo Angelini, Federal University of Rio Grande do Norte, Brazil
Copyright © 2021 Luczkovich, Johnson, Deehr, Hart, Clough and Griffith. This is an open-access article distributed under the terms of the Creative Commons Attribution License (CC BY). The use, distribution or reproduction in other forums is permitted, provided the original author(s) and the copyright owner(s) are credited and that the original publication in this journal is cited, in accordance with accepted academic practice. No use, distribution or reproduction is permitted which does not comply with these terms.
*Correspondence: Joseph J. Luczkovich, bHVjemtvdmljaGpAZWN1LmVkdQ==