- 1Department of Ecology and Evolutionary Biology, Princeton University, Princeton, NJ, United States
- 2Camelot Animal Hospital, Belleview, FL, United States
The horses of Shackleford Banks, NC, United States are harassed by many species of biting flies. Apart from being a nuisance, their bites can lead to blood loss and transmit disease. As a result, these horses tend to avoid areas where fly abundances are high. Like other free-ranging horse populations, environmental factors such as low wind speeds and high temperatures increase fly loads per horse. Similarly, coat color matters since darker horses attract more flies than lighter ones, especially on hot sunny days. Many horse populations reduce per capita fly loads by living in large groups or by bunching tightly together. Shackleford horses do so, too, but also use wind speed differences among habitats to modulate fly numbers. By adopting a systematic pattern of moving between habitats such that they only visit a habitat when wind speed is high enough to keep fly harassment to a tolerable level, they can avoid being bitten while continuing to forage. Typically, they begin the day foraging on the salt marshes where fly abundance is inherently low and are lowered further by faint early morning breezes. Later in the morning, horses move to grassy patches (swales) when increasing wind speed reduces fly landings there to levels found on the marshes. Later still, when wind speeds peak, horses begin foraging among the sand dunes. At this point wind speeds are high enough so that horses using any habitat will be minimally harassed by flies, thus enabling them to freely choose where to feed based on which habitat meets particular dietary needs for protein, energy and nutrients on any particular day. Hence, Shackleford horses follow the breeze to solve a challenging dilemma of maintaining a high nutritional plane without succumbing to fly harassment. Other free-ranging horses populations appear to have a more limited “either-or” choice of “bite or be bitten,” thus limiting their decision-making options.
Introduction
Biting files are not just a nuisance to horses and other large-bodied mammals. When flies alight, they can bite, lead to blood loss, transmit disease, and generally disrupt behavior (Askew, 1971). To make matters worse, flies have evolved finely tuned mechanisms that use high body temperatures and CO2 levels as well as dark pelage to find and plague their prey (King and Gurnell, 2010). As a result, an evolutionary arms race has developed among pesky flies and horses and their close evolutionary kin. While zebras have evolved stripes as a way of reducing fly detections (Caro et al., 2014; Larison et al., 2015; Caro, 2016), less distinctively marked horses once detected have evolved behaviors that reduce fly nuisance by swishing tails (Mooring and Hart, 1992), or moving to areas where files are less prevalent (Duncan and Vigne, 1979; Zervanos and Keiper, 1979). But behaviors like these are likely to have opportunity costs. Avoiding fly infested areas when they provide high quality forage (Duncan and Vigne, 1979; Zervanos and Keiper, 1979; King and Gurnell, 2010), for example, create dilemmas that are hard to balance. Sometimes areas are avoided for almost entire seasons (Powell et al., 2006).
Many species in the horse family (Equidae) are not without some means for managing these types of tradeoffs without having to move or avoid habitats. As Rubenstein and Hohmann (1989) have shown, horses (Equus caballus) can increase the rate at which they swish their tails and shake their manes as fly abundance increases. While investing in comfort behavior may reduce overall time spent feeding or lower bite rate, these reductions are likely to be minimal, especially for those living in large groups where time spent on other time-consuming activities such as vigilance can be reduced by inducing other group members to pick up the slack by lifting their heads. And, as Duncan and Vigne (1979) have shown, banding together in large groups can also directly lower fly nuisance by spreading flies among group mates, thus reducing the per capita number alighting on any particular individual. As Rutberg (1987) notes, however, horses live in closed membership groups, so unlike their close evolutionary kin – the wild asses (Equus africanus and Equus hemionus) and Grevy’s zebras (Equus grevyi) – whose societies fission and fuse (Rubenstein, 2011), thus enabling them to easily change group size, horses are unable to quickly change the size of their groups. Instead, when fly numbers are high, horses tend to bunch together to distribute the flies among group members, thus diluting the nuisance for each horse. In fact, once bunched together, rates of tail swishing often increase, further enhancing the per capita benefits of grouping tightly (Mooring and Hart, 1992; Powell et al., 2006). Despite the benefits that such active mutualisms can produce, they are not always shared equally within the group since dominants tend to jostle for places in the center where dilution is most assured and where mutual tail swishing is maximized.
Behavior such as these can indeed lower the impact of biting flies when grazing. But when fly burdens are high, as is often the case during warm spring and summer months when horses are under intense pressure to eat and maintain high body condition in preparation for winter or to rebuild body condition after reproducing, horses in many populations often abandon good grazing areas, seeking refuge on bare ground (Zervanos and Keiper, 1979; Duncan, 2012), elevated sites (King and Gurnell, 2010), or human modified landscapes (Powell et al., 2006). Such chronic reductions in feeding, however, are likely to induce real costs (Mayes and Duncan, 1986). This will be especially true if high quality foraging areas have to be abandoned (King and Gurnell, 2010) for long periods and only visited when fly numbers are low (Berger, 1986; Powell et al., 2006).
Is there anything that horses can do to avoid this challenging choice? Is it possible to reduce the risk of being bitten while still maintaining access to high-quality feeding sites on a regular basis? Insights on how horses could solve this dilemma emerge from how their close kin – zebras – adjust their behavior and activity patterns to simultaneously reduce the risks of being killed by lions without reducing feeding opportunities (Fischhoff et al., 2007). We know from studies on plains zebras (Equus quagga), that when a lion makes a kill, or when a zebra detects a lion in a particular habitat, the first response is often for the herd to abandon the area. But by abandoning a chosen grazing site after every such sighting or attack, opportunities to forage there would be lost. To avoid paying such costs, zebras instead alter their “daily round” by varying when they visit essential habits that would enable them to meet their dietary needs. In fact, they vary their visits to these habitats depending on both the expected likelihood of lions occupying particular habitats at particular times of day and by adopting habitat and time specific anti-predator behavior if lions are encountered. Thus, most zebras forage during the day on open grasslands when lions are usually shading in woodlands and they do so by moving deliberately, slowly, and quietly. But during the night or crepuscular periods when lions typically move to the plains to hunt, most zebras move into the woodlands. And when they do, they continue to move deliberately, slowly and quietly presumably letting stripes and leaves co-mingle to provide camouflage (Caro, 2016), thus reducing the risk of being detected and attacked. For those remaining on the open plains, however, their movements change dramatically, becoming more protean, more unpredictable. At night on the plains, zebras move more quickly and turn more frequently and erratically than when grazing there during the daytime (Fischhoff et al., 2007). Like the zebras solving the life-dinner tradeoff (Dawkins and Krebs, 1979), might Shackleford horses adjust their temporal patterns of habitat use to avoid high fly densities without having to forgo feeding in particular regions of the island?
Materials and Methods
To answer this question, we observed the free-ranging feral horses of Shackleford Banks, NC, United States during late spring and early summer (June–July) of 1994. These horses have inhabited the island since the mid-1500s and have roamed freely without human interference since the end of the 19th century when people abandoned the island (Rubenstein, 1981). In the mid-1990s the National Park Service began managing the island as a wilderness area and at the time of the study, approximately 220 horses inhabited the island dividing themselves into 20–25 family groups, each consisting of one or more breeding stallions, females and their young, or all male bachelor groups. Shackleford Banks is a barrier island that is 15 km long and 2 km wide at its widest point and consists of five major habitat types – beach, dunes, grassy swales, forests, and salt marshes–that generally range linearly along the long-axis of the island with the salt marshes and forests lying along the sound, with the dunes and swales occupying the middle of the island between beach and sound (Rubenstein, 1981). Only the latter four habitats are used for grazing.
During daily censuses, we gathered six types of data. First, we observed where and when horses grazed in each habitat. Since the island is open and the horses spend virtually all their time on the salt marshes, swales, and sand dunes, they are easy to spot when traversing the island on foot. Foot surveys of each habitat at different times of day were used to find horses and ensure that their habitat choices spanned all daylight hours. Between a third to half of the island can be walked per day while stopping and undertaking hour-long scan samples, so each group was followed for long periods at least 3–4 times per week. If a group was followed continuously for 1–2 h, each habitat it occupied during that interval was recorded. If a group was watched for less than an hour, it was typically sighted and re-sighted multiple times per day in a variety of habitats and tens, if not hundreds, of times during the summer. Each time a group was opportunistically spotted, the habitat it was occupying was noted. Accumulating many sightings of each group helped ensure that habitat occupancy was representative of each group’s preferences. In addition to recording habitat occupancy, time of day when a group entered or left a particular habitat was recorded and used to compute proportionate time of occupancy for each habitat. This allowed us to determine habitat selectivity, or preferences, using Ivlev’s Electivity Index (Ivlev, 1975) which compares the proportion of the island covered by each habitat to the proportion of time horses were recorded in each habitat.
where PHabitat Use is the proportion of time horses were sighted using a particular habitat and PHabitat Available is the proportion of the island consisting of that habitat.
Second, we recorded behavioral time budgets using scan samples (Altmann, 1974) of each individual’s actions (grazing, standing, or walking) at 5-min intervals for a period of 60 min throughout the day from 7.00 to 18.00 h. Since the horses are habituated to island visitors, behavioral data and fly counts were routinely gathered at distances of 5–10 m. A total of 13 groups, ranging in size from 3 to 15 individuals, were regularly sighted and re-sighted over the summer generating 146 h of scan samples. On average, each group was followed for approximately 11 h. Short opportunistic sightings were also used to record habitat use and associated environmental states at that time and place along with observations of additional social interactions. Third, we gathered data on available vegetation in each habitat to assess diet quality and quantity. Where horses were seen grazing, we directly measured vegetation abundance at that site by walking 25 m transects using “pin drops” (Crawford et al., 2019) to count the number of leaves, stems or seed heads of each grass species touching a 1 mm wide welding rod. Each habitat was sampled where the horses were seen grazing at least 10 times during the spring and summer. By measuring habitat electivity and species frequency, we could estimate the relative abundance of the various vegetation species available to horses as they moved among habitats [salt marsh, swale (grassy patches), dunes, and forest edges] on their “daily rounds.” For one, or at most two, of the numerically dominant species making up >10% of the area of a particular habitat, the crude protein, digestible energy, ash free detergent fiber (ADF) and key micronutrients nutrients (Ca, K, P, Cu, and Zn) were determined so that the relative importance of each habitat in helping meet daily dietary needs could be compared (Supplementary Table 1). The nutrient content and % crude protein of each of these key species was extracted from Balbo (1985) and Pratt-Phillips et al. (2011) and various USDA websites.
Fourth, during gaps between scan sampling intervals we also counted from head and to tail the number of biting flies of four species– Green headed horseflies (Tabanus nigrovittatus) and Tabanus lineola, deer flies (Chrysops fuliginosus) and (Chrysops atlanticus), as well as stable flies (Stomoxys calcitrans) (Rubenstein and Hohmann, 1989) – alighting on or hovering over (within 5 cm of the body), horses at different times of day. These fly species were all large enough to count individually from 5 m away or by binoculars when more distant, but they were not identifiable to species at these distances. They were also the species that visibly annoyed the horses, inducing head shakes, muscle twitches or tail swishes. Since neither non-biting flies nor mosquitoes evoked these behaviors, neither were recorded. We also measured general weather conditions by recording daily temperature (average and maximum) and sky cover (clear, overcast, or partly overcast).
Fifth, whenever males interacted aggressively, which ranged from displays, to calls, to sniffs to physical contacts, we recorded the identity of the contestants and recorded who won and who lost. Fights typically terminated when losers “head bobbed” and walked away. These pairwise won-loss outcomes populated the cells of a winner-loser matrix from which pairwise dominance was determined. By moving the rows up or down to minimize the number of values in the matrix’s bottom triangle a linear rank ordering was determined. The top 50% were designated as dominants while the bottom 50% were designated as subordinates (Rubenstein, 1994). This hierarchy helped determine the role that rank could play in shaping movements among habitats on the island.
And sixth, wind speed in each habitat was recorded with and without horses present using a handheld wind gauge to compute average wind speed (km/h) in each of the habitats throughout the day to determine if and when, wind speed might enable horses to enter particular habitats since biting fly numbers typically decrease as wind speed increases (Rubenstein and Hohmann, 1989; King and Gurnell, 2010).
Statistical analyses involved standard analyses of variance, t-tests and regressions since the data were normally distributed. Data consisting of counts were analyzed via Chi-squared contingency tables. For clarity, the figures generally present the central tendencies of the main effects or their interactions. The full statistical analyses are based on hundreds of measurements of individuals or habitat features and are presented along with significance levels in the text or figure legends.
Results
Are Shackleford Horses Harassed by Flies?
The answer is “Yes” with the degree of harassment depending on environmental conditions, phenotype, and behavior. Overall, on Shackleford Banks per capita fly loads decrease with increasing wind speed (Figure 1A) (F2,750 = 12.2; p < 0.0001) and increase with increasing temperature (Figure 1B) (F9,229 = 11.78; p < 0.0001). In addition, coat color makes a difference. Generally, darker colored horses attract more flies per capita than lighter colored horses, especially on sunny days (Figure 2) (F9,229 = 11.78; p < 0.0005).
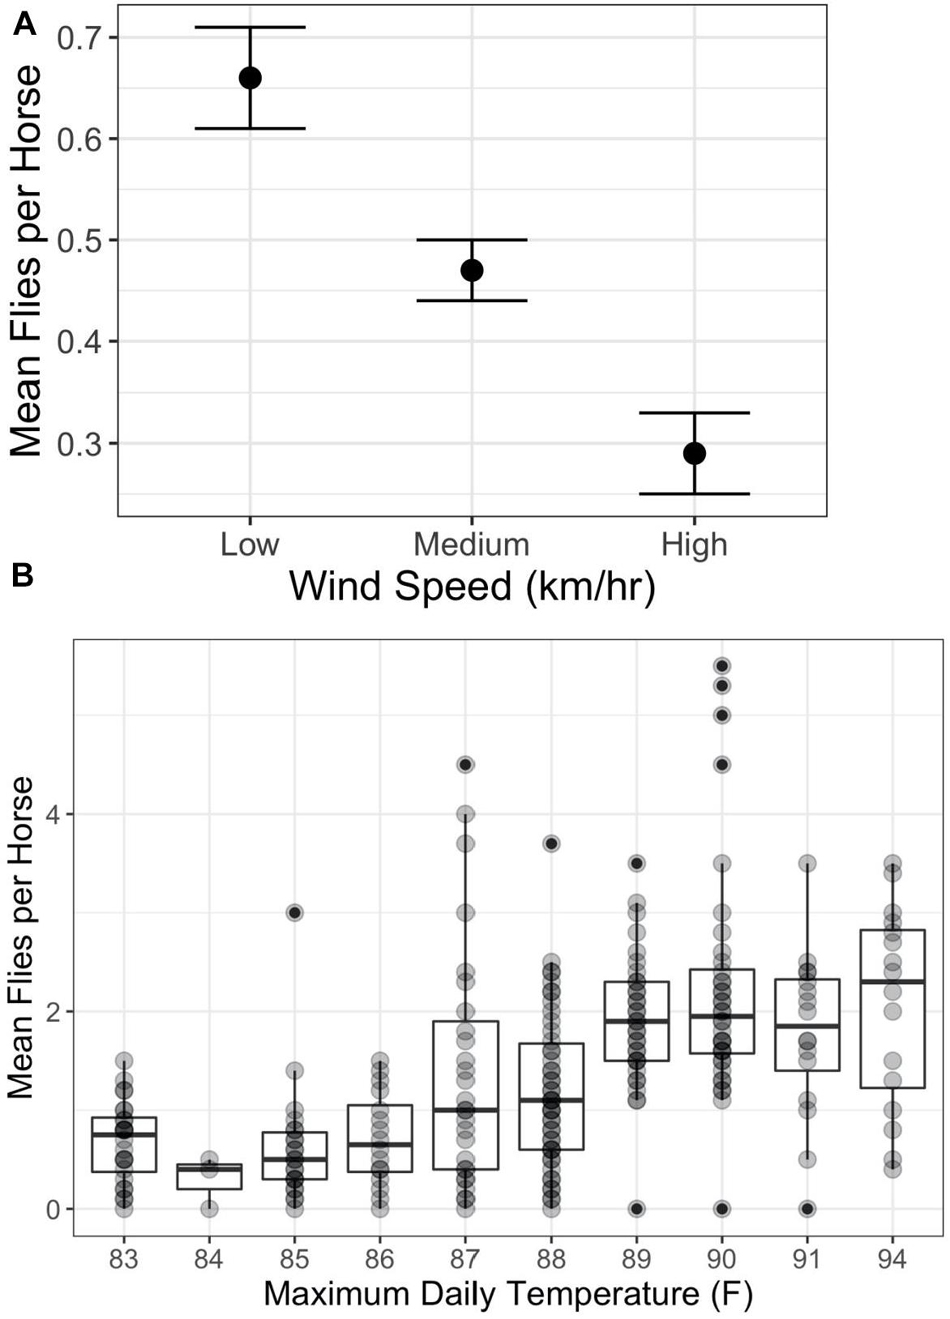
Figure 1. Relationship between per capita fly numbers and environmental factors. (A) Impact of wind speed on per capita numbers (mean and standard error) and wind speed category (Low = 0–5 km/h; Medium = 6–15 km/h; and High >15 km/h) (F2,750 = 12.2; p < 0.0001). (B) Impact of daily maximum temperatures on per capita numbers (mean and standard error) (F9,229 = 11.78; p < 0.0001; R2 = 0.32). Correlations between maximum temperature and mean daily fly numbers are positive and significant from 83°F to 89°F (F1,169 = 42.17; p < 0.0001; R2 = 0.20), but level off showing no statistically significant correlation above 89°F (F1,99 = 0.01; p < 1; R2 = 0). Darker points represent multiple occurrences.
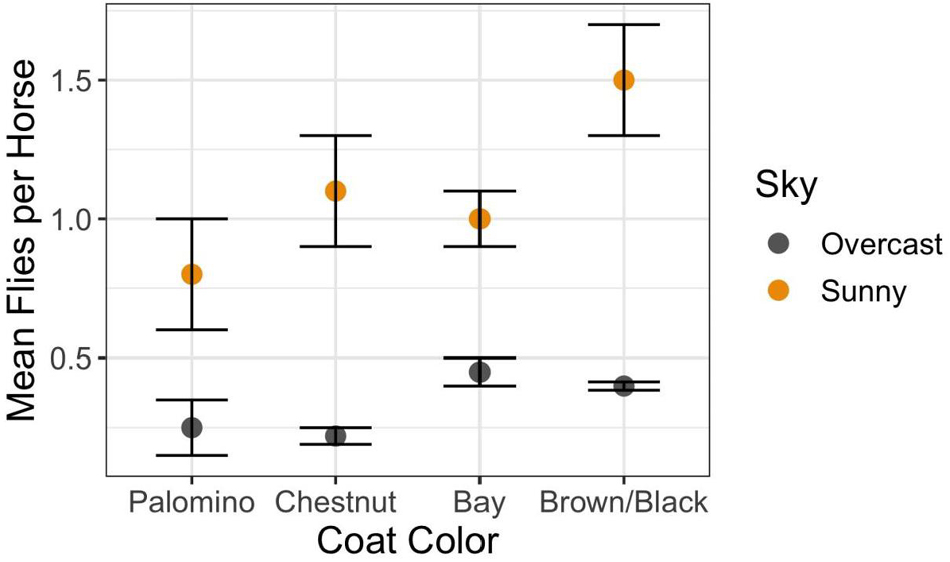
Figure 2. Relationship between the morphological trait of coat color under different sky conditions on per capita fly loads (mean and standard error: Interaction Sky Condition × Coat Color = F3,622 = 5.94; p < 0.0005). Coat colors range from the light golden Palominos with cream-colored manes to reddish-brown bodies and manes of Chestnuts, and to the brown bodies of the Bays highlighted with blackish manes, to those with solid dark brown or black bodies with matching manes.
Social factors also play significant roles in determining per capita fly loads. As in other free-ranging populations of feral (Duncan and Vigne, 1979; Rutberg, 1987) and wild (King and Gurnell, 2010) horses, those on Shackleford Banks living in larger groups are bothered by fewer flies than those living in smaller groups (Figure 3A) (F2,935 = 64.9; p < 0.0001). Even though the absolute number of flies landing or hovering close to the horses are inherently low (fewer than five at most instances), their determined attempts to alight and bite can be very disruptive. Accordingly, when disturbed, Shackleford horses bunch tightly together at any group size to further reduce per capita fly loads (Figure 3B) (F1,761 = 37.61; p < 0.0001).
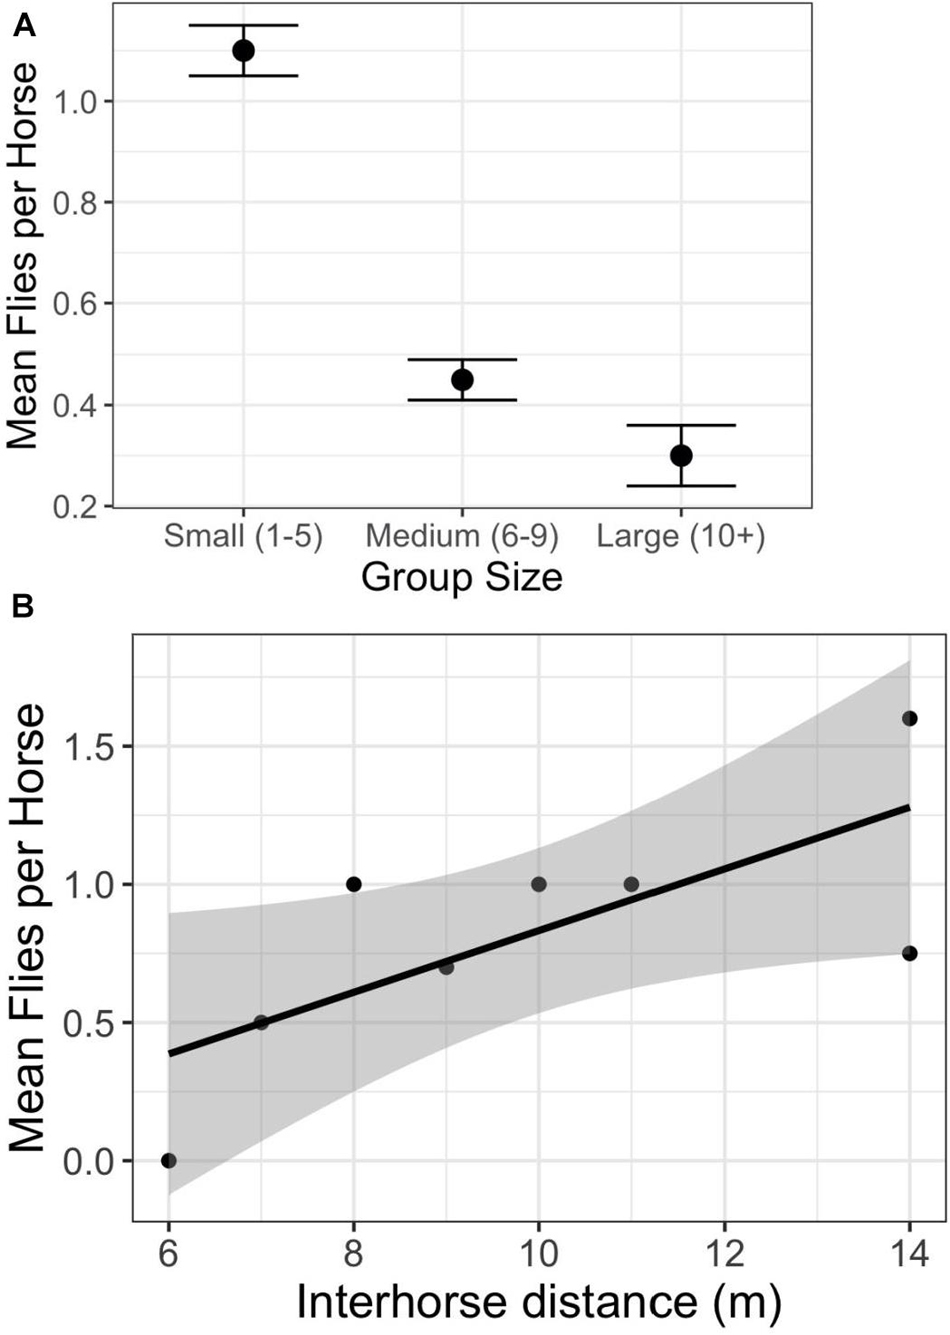
Figure 3. Relationship between per capita fly numbers and social factors. (A) The relationship between group size and the average number of flies hovering over, or landing on, individual horses (F2,935 = 64.9; p < 0.0001). (B) The relationship between the average number of flies hovering over, or landing on, individual horses as a function of the average distance between two horses within groups (y = 0.53 + 0.12*X; F1,761 = 37.61; p < 0.0001).
Does Fly Harassment Create Non-disease Foraging Costs?
Clearly, Shackleford horses are disturbed by biting flies much like other free-ranging horse populations. In those studies, when fly numbers are high, horses seek refuge in habitats where fly numbers are low. But in those studies, taking refuge is not without costs. In Mongolia, Przewalski horses seek high ground where forage has been denuded, only returning to preferred feeding habitats when fly numbers decline in those habitats (King and Gurnell, 2010). The same occurs in the Camargue (Duncan and Vigne, 1979) where horses seek bare ground to escape harassment. And even on Assateague Island, a neighboring barrier island north of Shackleford Banks, the horses there move out into the water to reduce harassment (Rutberg, 1987), or to areas with human built structures during seasons when fly numbers are high (Powell et al., 2006). Each of these strategies, however, results in lost feeding opportunities. Do the Shackleford horses suffer the same fate? The answer is “No.”
How Then, Do Shackleford Horses Manage to Avoid Incurring Foraging Costs Without Being Harassed by Flies?
To show how they solve this challenging dilemma, we first need to characterize the quality of foraging opportunities offered by each habitat on Shackleford Banks. Using our vegetation data, we determined: (1) the identity and quality of the dominant grasses in each habitat; (2) the degree to which horses use each of the four habitats for grazing; (3) the relative nutritive value horses could derive by feeding in each habitat; and finally, (4) the degree to which habitat use correlates with fly abundance, specifically the degree to which the underuse of one or more habitats correlates with high fly burdens. Supplementary Table 1 provides the data necessary to address the first three points.
First, each habitat is dominated by at least one unique grass species (those whose % ground cover exceeded 10%; Supplementary Table 1). Second, horses do not exploit the habitats equally, nor do they even frequent them in proportion to their relative abundance. As Ivlev’s Electivity Index in Supplementary Table 1 shows, horses on average elect (positive values >0.1) to feed mostly in the relatively less common marsh (+0.44) and swale (+0.49) habitats, while mostly avoiding (negative values <−0.1) the relatively most common dune (−0.77) and forest habitats (−0.89). Third, in all but the forest habitat, one or more of these numerically dominant species provides a high level of crude protein (>20%). Thus, at least in terms of providing essential nitrogen, the habitats are all generally good, although the swale habitat provides more nitrogen rich plant species for grazing than any of the other habitats. Yet in terms of digestible energy [low levels of Acid Detergent Fiber (ADF)], the habitats differ markedly with the swales and dunes offering the most digestible species–pennywort (Hydrocotyle bonariensis)–and the forest edges offering highly digestible panic grasses.
The largest differences among habitats, however, emerges from the micronutrients that the habitat specific grasses have to offer. The salt marsh and swale habitats are highest in % phosphorous because Spartina sp. are abundant, whereas the dunes and the swales are highest in % calcium because pennywort (Hydrocotyle bonariensis) is common. High levels of copper can be found in all but the dunes and for acquiring zinc, foraging in either the forest or swales is necessary. Overall, the habitat that comes closest to offering most of what horses need (NRC, 2007) is the swale habitat, but its most abundant grass, Spartina patens, is not easy to digest and provides relatively low levels of digestible energy. Thus, grazing in each habitat offers something nutritively unique since no habitat provides vegetation that is high in energy, protein and all essential micronutrients. In fact, according to the National Resource Council (NRC, 2007), virtually all vegetation on Shackleford during spring and summer provides a micronutrient deficient diet (Pratt-Phillips et al., 2011). To minimize these deficiencies, horses should choose habitats where forage species offering the highest nutrient levels are most abundant. To do this, horses should spend time in the dunes to maximize phosphorus intake, time in the swales to maximize copper intake, time in the marshes to maximize calcium intake and time in both the forest and swales to maximize zinc intake. Clearly, visiting all four habitats is essential if the horses on Shackleford Banks are going to maintain as high a level of bodily condition as is possible.
Is Differential Habitat Use Related to Habitat Differences in Fly Abundance?
The answer is “Yes.” When in preferred habitats – salt marsh and grassy swale – horses are harassed by flies on a per capita basis significantly less than when in less preferred habitats – dunes and forests (Figure 4) (F3,663 = 25.3; p < 0.0001). Why might this be so? Flies have a difficult time coping with strong winds, as illustrated in Figure 1A; they find it more and more difficult to detect and land on horses when wind speeds are high. However, on average, wind speeds vary by less than 2.5 km/h among marsh (13.3 km/h), swale (12.4 km/h), and dune (14.9 km/h) habitats. Only the forests show significantly lower average wind speeds (1.5 km/h). If horses were to access habitats solely with respect to the impact that wind speed has on fly landings, then horses should avoid the forests and favor the salt marsh, swale, and dune habitats more or less equally. But the horses do not do this (Supplementary Table 1). Forests are indeed the least preferred habitat (E = −0.89) and are used the least (Figure 5). But the dune habitat, despite being windswept for much of the day, is not favored either (E = −0.77), at least until the end of the day. And given that horses do occasionally enter forests, but only when wind speeds are way above the habitat’s average (∼ 20 km/h), something more subtle appears to be operating.
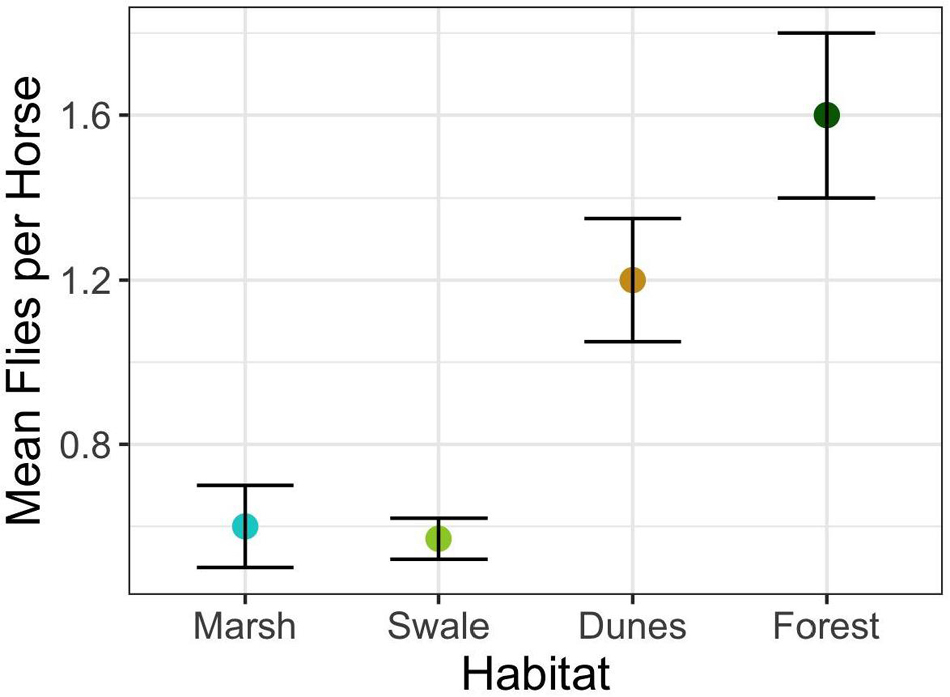
Figure 4. Mean and standard error of average fly landings per horse during the summer for the four major Shackleford Banks habitats (F3,663 = 25.3; p < 0.0001).
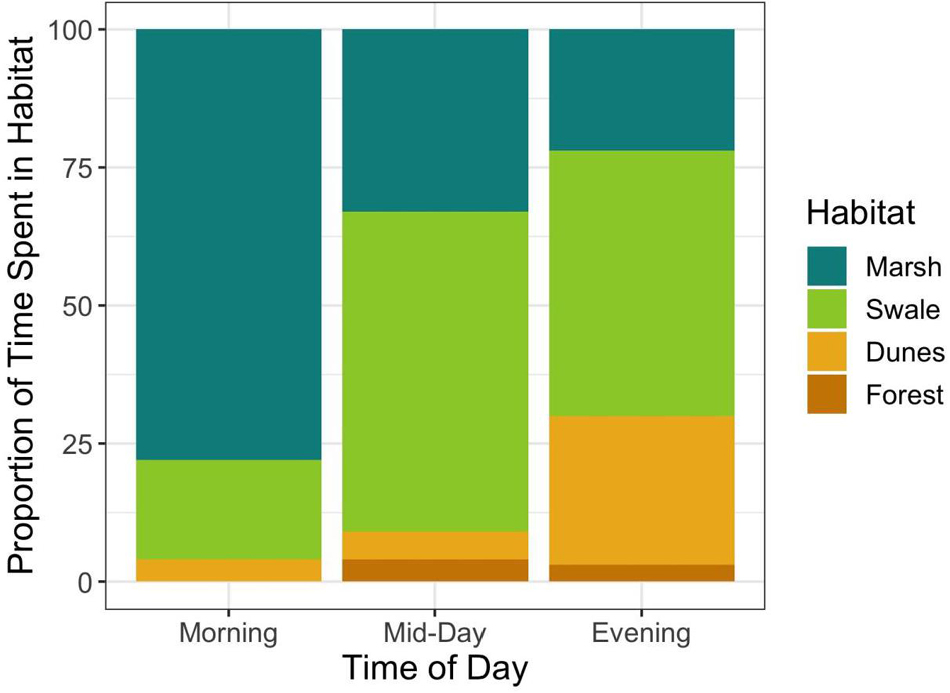
Figure 5. Relationship between the proportion of horses sighted in each habitat during different periods of the day. The Shannon Diversity index increases as the day progresses, showing that horses are using habitats more evenly as wind speed increases (Morning = 0.27; Mid-Day = 0.42; and Evening = 0.50).
How Might Horses Use Habitat Specific Wind Speeds to Limit Fly Harassment While Enhancing Overall Foraging Success?
As Figure 6 shows, averages do not reveal the full story. Wind speed increases everywhere throughout the day, but differently in each habitat (Interaction between habitat × time of day: F6,710 = 47.5; p < 0.0001). Early in the morning wind speeds are generally low in all habitats compared to later in the day. Yet in the early morning, wind speeds are markedly higher in the marsh than in any other habitat. And although they increase in all habitats from early morning onward, they tend to level off in the marshes, swales, and forest by mid-day. Only in the dunes do they continue to rise well into the evening.
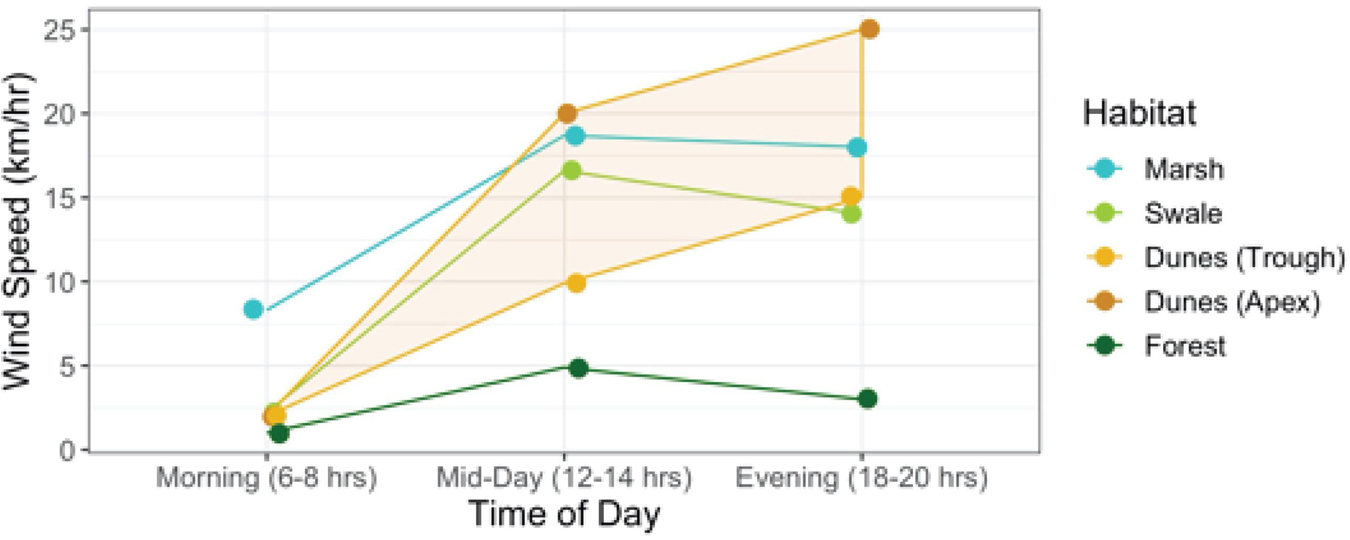
Figure 6. Relationship between wind speeds per habitat at varying times of the day (morning, mid-day, and evening) (Interaction Habitat × Time of Day: F6,710 = 47.5; p < 0.0001). The shaded band highlights the areas in the dunes between the apex and trough where wind speeds are at their highest and lowest, respectively.
If horses could adjust the timing of when they enter and leave habitats to match the times when fly abundances in those habitats are low, then perhaps they could reduce fly harassment without having to forgo the unique and beneficial foraging opportunities that each habitat has to offer. To evaluate this proposition, some simple calculations derived from Figure 7 are instructive. Figure 7 illustrates the relationship between wind speed and the average number of fly landings per horse when in each habitat. Increases in wind speed decrease per capita fly landings non-linearly, converging to approximately 0.33 flies per horse in all habitats at high wind speeds, those greater than 25 km/h. But at low wind speeds harassment levels vary by habitat, being highest in the forest, then declining first in the dunes, then the swales and finally the marshes, respectively. Hypothetically, if horses were trying to maintain a steady state of “hosting” only one fly at all times, then they could do so by entering the salt marshes when wind speed were greater than ∼1 km/h and swales when they reached ∼3 km/h. But to enter dune or forest habitats while keeping fly landings to one per horse, horses could only do so if wind speeds exceeded 10 km/h and 20 km/h, respectively. Since such high wind speeds are almost never reached daily in the forests, it is not surprising that horses rarely enter them (Figure 5). When they do, it is either during storms when wind gusts are strong and frequent, or after mid-day and into the evening when wind speeds in general, are at their highest levels. For the other three habitats, Shackleford horses appear to utilize habitats when the critical thresholds depicted in Figure 7 are crossed. In the early morning, horses spend more than 75% of their time in the marshes when wind speeds are low. And although they are well below what the average will be in the salt marsh later in the day (13.3 km/h), they are well above the level necessary to minimize fly landings. As wind speeds increase by mid-morning (Figure 6), horses start spending most of their time in the swales (∼55%). Still, they spend ∼30% of their time in the marshes since continuing high wind speeds there maintain fly loads at levels found on swales. From mid-day through evening, when the highest wind speeds occur in the dunes, fly loads in the dunes finally decline to levels matching those in the marshes and swales. At this point, horses are essentially free to forage in the dunes – or any of the habitats apart from the forests–without incurring any increased harm from biting flies. And as Figure 5 shows, by evening, the horses spend ∼25% of their time in the dune habitat. In general, habitats are used more evenly as wind speed increases throughout the day (Shannon Diversity Indices by time of day: morning = 0.27; mid-day = 0.42; and evening = 0.50).
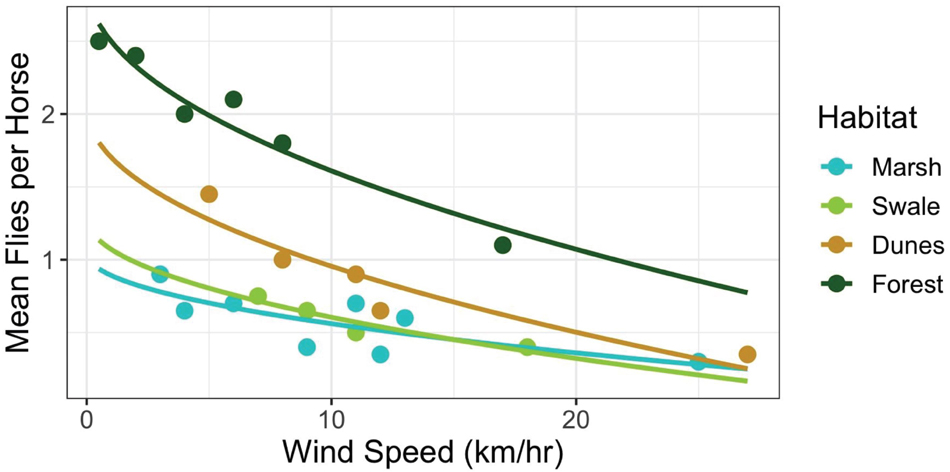
Figure 7. Relationship between wind speeds (km/h) and the average number of fly landings per horse when in each habitat [Marsh: y = 1.15 – 0.63*log(x), R2 = 0.72; Swale: y = 1.45 – 0.84*log(x), R2 = 0.96; Dunes: y = 1.46 – 0.84*log(x), R2 = 0.94; Forest: y = 2.47 – 0.85*log(x), R2 = 0.79]. Note, that fly landings decline non-linearly as wind speed (km/h) increases in all habitats. Apart from the forest habitat, however, the decline approaches an asymptote of around 0.33 flies per horse at 25 km/h.
Do All Horse Groups Use Wind Speed to Move Among Habitats in the Same Way?
The answer is “No.” In the other horse populations described above, horses in different sized groups suffer different degrees of fly harassment and even adopt behaviors such as clustering tightly and increasing mutual tail swishing to try and ameliorate high fly loads (see Figures 3A,B; Duncan and Vigne, 1979; Mooring and Hart, 1992; Powell et al., 2006). Typically, horse groups are of closed membership, containing one male and many females along with their associated young. During the spring and summer breeding seasons, harem stallions fight among themselves to prevent being cuckolded and to secure mating opportunities with females not of their own groups (Rubenstein, 1986). Such contests establish a strong dominance hierarchy among males (Rubenstein, 1994). If the consorted female favors such a dominant male or one rising quickly in rank, she typically joins his group because over time dominant stallions are best able to increase female foraging success by keeping cuckolding males away (Rubenstein, 1986). As a result, the groups of favored, dominant males grow.
Because dominance enables males of high rank to move freely about the island, they should be more able than subordinates to occupy habitats of their choosing when they want. With their enhanced fighting ability, their groups should be the ones most free to use wind speed to access particular habitats at optimum times of day. And this is what occurs on Shackleford Banks. The relatively rare salt marsh and grassy swale habitats should be preferred by competitive dominants during early morning when wind speeds are low (<10 km/h) if foraging gains are to be maximized while fly loads are to be minimized (Figure 7). Of the horses sighted during the early morning hours, 100% of horse groups using salt marsh habitats are associated with dominant males–those in the top half of the hierarchy (Figure 8). For groups associating with low-ranking males, however, only 40% are sighted in these habitats. 60% of the sightings of groups with subordinate males are seen in the dunes or forest where fly loads at these times of day are much higher than in the marshes or swales (Fisher Exact: p < 0.0001). When wind speeds exceed 10 km/h, however, dominance-dependent habitat use patterns essentially disappear. By the time wind speeds reach high levels, fly landings in most habitats are reduced to very few. At this point, dominant male groups forage in the marsh and swales 88% of the time which does not differ significantly from use patterns displayed by subordinate male groups which are seen grazing in them 81% of the time. Similarly, while groups associated with subordinate males were found in the dune and forest habitats 19% of the time when wind speeds exceeded 10 km/h, those with dominant males were seen there 12% of the time (Fisher Exact: p = 0.523). Thus, male status and its impact on group size, influences the ability of their females and their offspring to use habitats differently during the day to modulate fly harassment thus maximizing foraging rate. While dominant males and their larger groups are free to enter habitats at optimal times, subordinate males and their smaller groups are not.
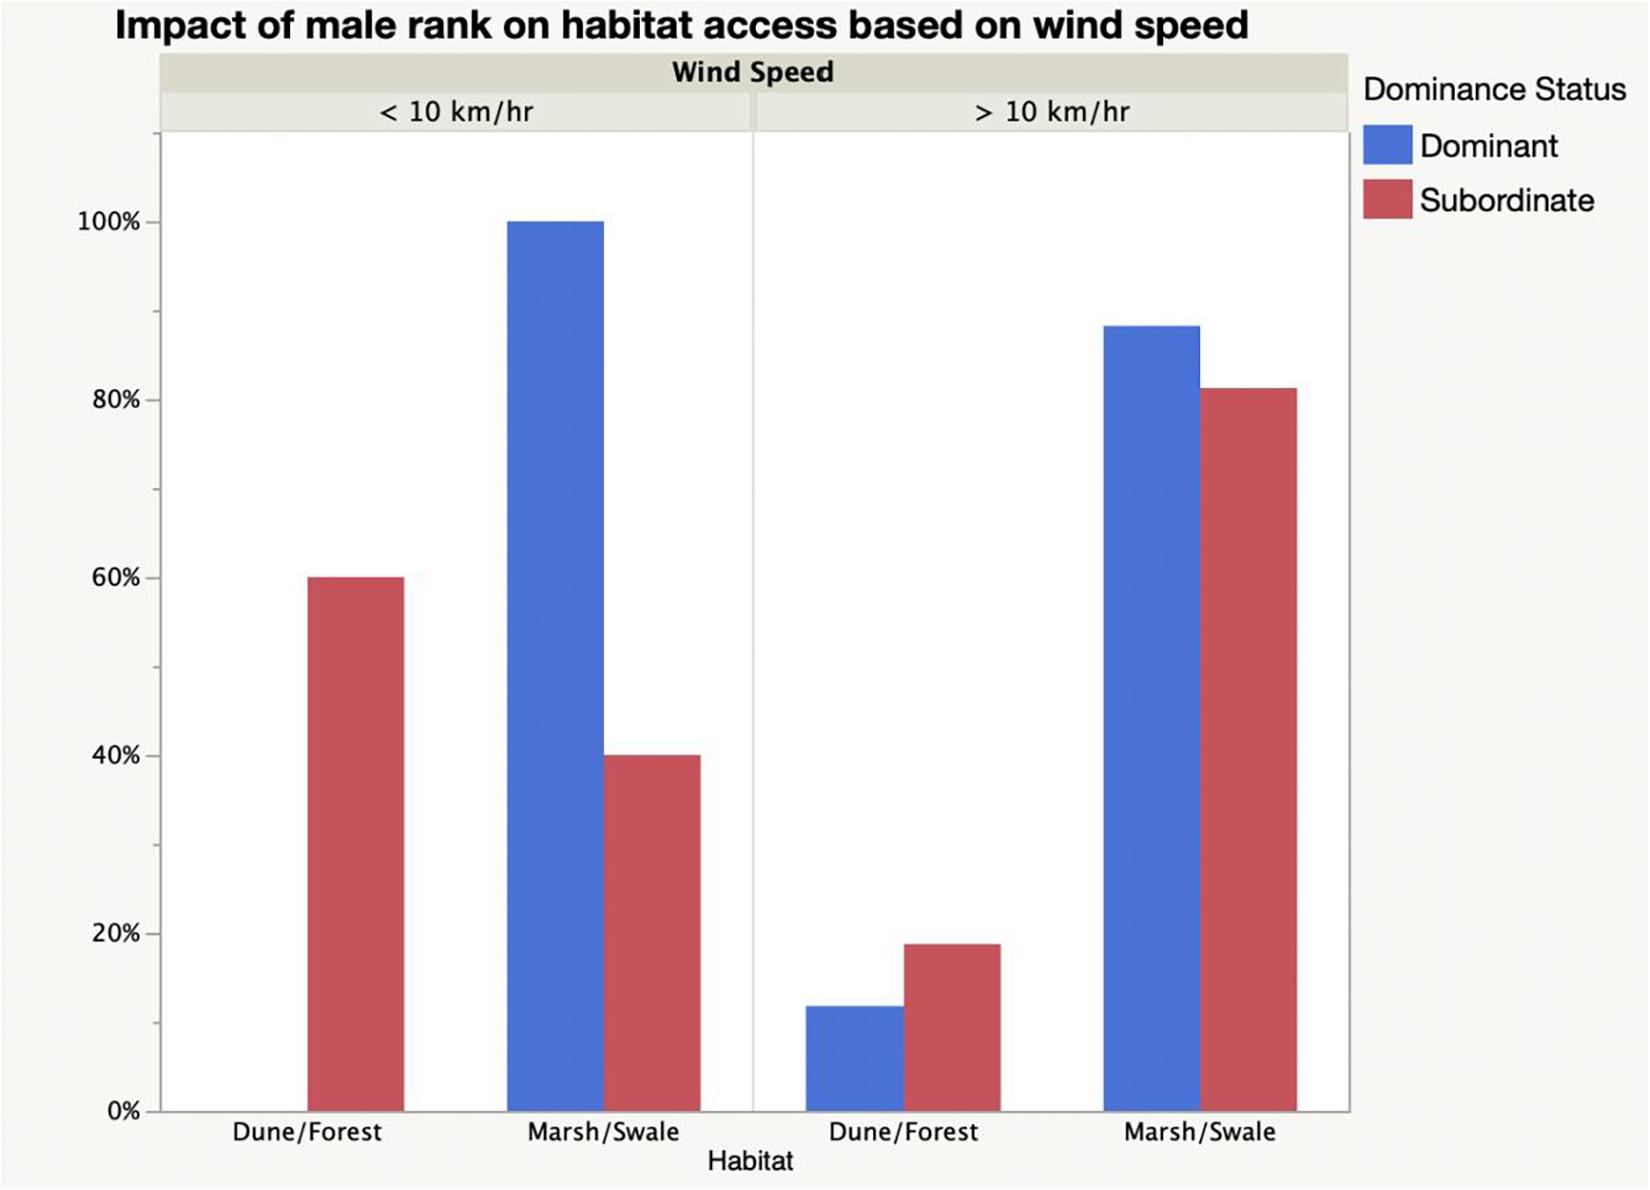
Figure 8. Relationship between male dominance status and the use of relatively rare habitats (marsh and swale) and relatively abundant habitats (dune and forest) as a function of low (<10 km/h) and high (>10 km/h) wind speeds. At low wind speeds groups associated with dominant males exclusively used marsh and swale habitats (Fisher exact: p < 0.0001), but at higher wind speeds habitat access was independent of male status (Fisher exact: p = 0.5229).
Thus, Shackleford horses solve the challenging dilemma by using habitats at different times of day to modulate fly loads. In general, this leads to a very predictable “daily round” (Figure 9). Horses begin the day in the salt marsh where fly loads are normally low and even a mild breeze will keep them low enough so that fly modulating behavior does not impede efficient foraging. Then many groups move to the swale where modest increases in wind speed depress fly activity to levels no different from those found in the marsh. There they remain until mid-day when stronger winds sweep across the island, finally enabling the horses to forage in the dunes. By adopting this predictable pattern of movement, horses can access their food and be free of fly harassment to eat it.
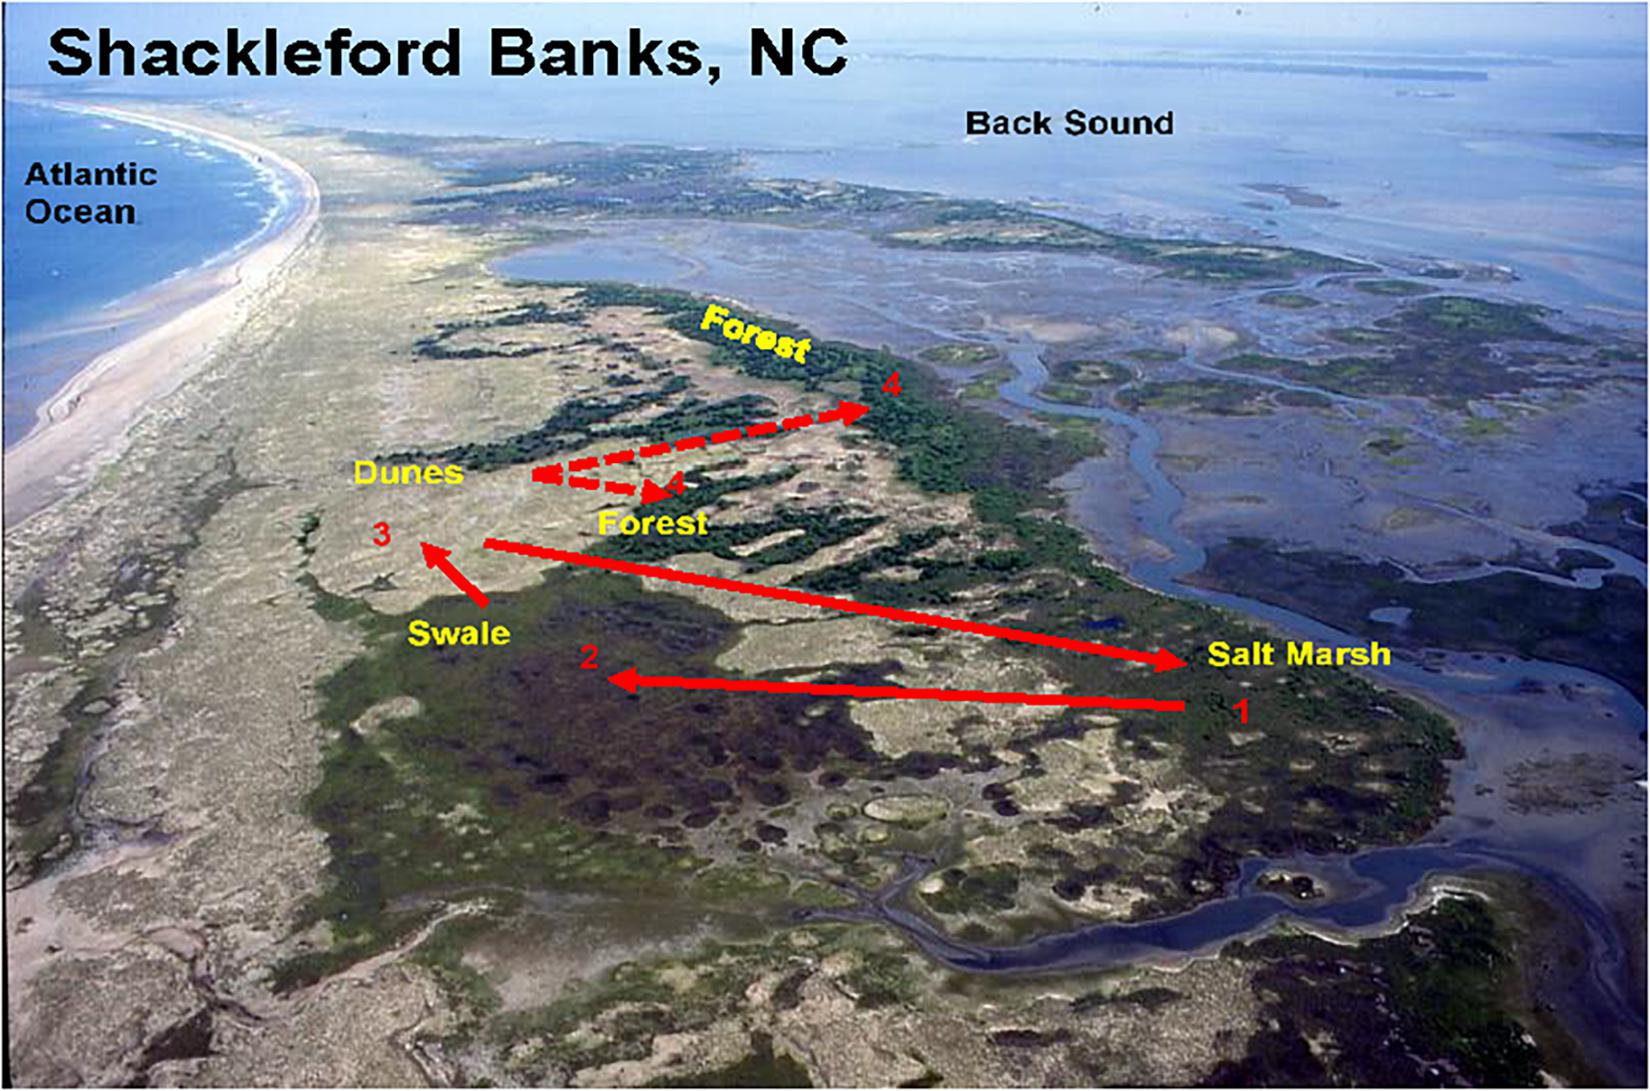
Figure 9. Aerial view of the island showing that the major habitat types are distributed along the long axis of the island. The numbers connected by arrows depicts a typical “daily round” – the numbers depict the order in which the horses move among habitats: from the salt marshes (1) to the swales (2), to the dunes (3), and the forests (4). Solid lines show the normal movement order among habitats on days when wind speeds range from 1 to 15 km/h. Dotted lines represent occasional movements to forest habitats when wind speeds exceed 20 km/h.
Discussion
The calculations presented above concerning how horses can adjust their behavior to have their forage and eat it without harassment from flies illustrate three key points about the relationship between biting flies and how they affect the behavior of free-ranging Shackleford horses with respect to habitat use. The first point is that the horses inhabiting this barrier island are affected by flies in ways very similar to those of other horses living in different locales and occupying different landscapes. Like wild horses in Hustai National Park, Mongolia King and Gurnell (2010), or on Assateague Island National Park in the United States (Zervanos and Keiper, 1979; Rutberg, 1987; Powell et al., 2006) or in the Camargue region of southern France (Duncan and Vigne, 1979) individuals with dark coats or living in large groups, especially experiencing high temperatures or low wind speeds, are pestered by high numbers of biting flies. And just as those horses attempt to reduce such harassment by increasing tail swishing and bunching together to share the burden and reduce per capital fly loads, so do the Shackleford horses.
The second point is that although the Shackleford horses change habitats as fly numbers increase just as do the horses on Assateague or in the Camargue and Mongolia, the horses on Shackleford do so in more nuanced ways. In the other populations, when temperatures reach their peak, horses abandon prime grazing areas, seeking refuges where they rest bunched together swishing their tails. Within seasons, in both the Mongolia and Camargue, horses leave valleys to climb to high ground or move to bare areas where fly numbers are lower. The same occurs between seasons on Assateague Island. There, horses rarely frequent the scrub habitat during the summer, instead spending a disproportionate amount of time in the dunes and in human modified habitats. And while wind speed directly mediates fly numbers in the Camargue, in Mongolia and on Assateague, wind speed modulates tail swishing which indirectly likely reduces fly harassment. Thus, in both populations a “daily” or even a “seasonal” round is established, but it is a simple one, involving either back and forth movements on a daily basis between heavily infested foraging areas and fly free refuges, or by avoiding habitats during seasons when they are heavily infested with flies, returning to them in future seasons after fly loads decline.
Shackleford horses also adopt a “daily round,” but it is more nuanced and diverse, fostering behavioral flexibility. By adopting a “daily round” that takes advantage of predictable time-of-day, habitat specific, wind speed changes, Shackleford horses avoid an “either-or” “eat or be bitten” situation. Their daily round is structured around generally predictable graded changes in wind speed, enabling sustained grazing throughout the day by letting the wind modulate fly numbers. Since increases in wind speed occur predictably at different times of day in different habitats, some horses – those associating with dominant males–can time their movements to maintain almost constant fly loads, thus potentiating optimal patterns of daily access to three of the four habitats. The “daily round” begins with morning grazing on salt marshes because only on such marshes can horses consume vegetation rich in protein and calcium and of moderate energy value (Spartina alterniflora) without being harassed by flies. On the marsh, even the slightest breeze reduces inherently low fly numbers to levels that make grazing essentially hassle free. As the day progresses, wind speeds increase everywhere on the island, so horses could remain in the marshes to graze because fly landings would continue to decline. Or they could take advantage of higher wind speeds and move to the swales as the morning progresses. Here they would also experience low fly numbers matching levels horses would be experiencing on the marshes. But for those that can temporarily defend the small and patchy swales – again, groups associating with dominant males – they are able to forage on a mixture of foods (Spartina patens and Hydrocotyle bonariensis) that meet many of the horses’ essential nutrient needs. After mid-day and into the early evening wind speeds peak. And even though wind speeds are lower in dune valleys than on dune apices, by the time they reach 10 km/h fly landings on horses using the dunes drop on average to levels matching those for horses using the swales and marshes (Figure 7). Thus, by evening all horses are free to graze in the dunes without suffering from increasing fly burdens. In fact, by the end of the day, if winds are blowing at 10 km/h or greater, all habitats, apart from the forest, are available for grazing because per capita fly levels are uniformly low. And because the dune habitat is the island’s most common habitat, all horse groups irrespective of the dominance rank of their males can easily gain access.
Because forests are only accessible when wind speeds are very high, they will be off limits on most days and thus do not factor into the “daily round.” But when stormy conditions arise, fly levels drop and the forest then can be, and is, utilized. While forests provide forage high in copper and especially zinc, they may also be sought out for protection when winds become extremely strong. Further still, while forest habitats are often used by horses in other populations to shade on extremely hot days despite high fly numbers King and Gurnell (2010), Shackleford horses do not seek shade even on the hottest days. Again, on Shackleford Banks increases in wind speed throughout the day mirror increases in temperature, apparently preventing overheating while at the same time reducing fly landings. In addition, since the wind is often on shore from the ocean late in the day, walking on the beach on extremely hot days as horses move between habitats can further reduce both fly numbers and heat loads. Figure 9 shows an idealized, yet typical, round of daily movements of a typical horse family or bachelor group. The solid arrows connect the sequence of moves and show the movement trajectory among the three most commonly used foraging habitats. The dashed line depicts excursions into the forest when wind speeds become extremely high.
The third point is that habitat entry decisions arising using wind speed to modulate fly loads represents a novel example of an “Ideal Free Distribution” (Fretwell, 2020). Typically, animals adopting an “Ideal Free Distribution,” respond directly to habitat adjusted payoffs associated with seeking “bottom-up” resources, usually food or mates. Milinski’s (1987) stickleback fish distributed themselves in aquaria “freely” (without any aggressive interference) such that the fish distributed themselves at each feeding station to equalize per capita rewards. On grasslands, if hypothetical groups of horses distributed themselves in accordance with an “Ideal Free Distribution,” they would initially avoid habitats where feeding rates were lower than those of the habitats they were occupying. But as food levels declined and feeding rates increased to match those of previously avoided habitats, horses would begin utilizing those habitats, too. What is striking about the Shackleford horses, is that they too, mostly appear to be moving between habitats in an “Ideal Free” fashion. For those that can, they appear to be doing so by equalizing a “top-down” ecological force–fly harassment levels – rather than equalizing a “bottom-up” resource level force. Thus, by following an “Ideal Free” movement rule, most horses – at least those associating with dominant males – can access the unique high quality foraging opportunities that each habitat has to offer. And this benefit provides another selective force enabling dominant males to benefit from living in larger groups. And for the females living in the large groups of dominant males, not only can they use wind speed to move freely among habitats, the large size of the groups also enables them to dilute whatever level of fly harassment they experience by sharing them with the group mates (see Figure 1A).
In general, most groups tend to follow a “daily round” moving from salt marshes to swales to dunes because increases in habitat specific wind speeds follow the same sequence (Figure 6). Only horses associating with subordinate males are constrained from moving freely among habitats in ways that solve the challenging choice of optimizing foraging gains while reducing fly loads. But this constraint only occurs during early morning. If it is a windy day (speeds more than 10 km/h), by the end of the day, even groups associated with subordinate males are free to move among habitats to satisfy dietary needs because average wind speeds remain high, thus reducing, and equalizing fly landings in the three most used habitats (Figure 7). This freedom to choose among habitats at the end of a windy day should help individuals to make up for any nutritional deficiencies accrued throughout the day without being constrained by biting flies. This flexibility of habitat choice helps explain why habitats are used more evenly at the end of the day and shows how Shackleford horses solve the challenging dilemma of being able to eat what they need without excessively being bitten in the process of doing so.
Data Availability Statement
The raw data supporting the conclusions of this article will be made available by the authors, without undue reservation.
Ethics Statement
The animal study was reviewed and approved by the Princeton University IACUC.
Author Contributions
DR and LF designed the investigation and gathered and analyzed data. DR wrote the manuscript. LF contributed to edits. Both authors contributed to the article and approved the submitted version.
Funding
This work was supported by Princeton University and an NSF Presidential Young Investigator Award.
Conflict of Interest
The authors declare that the research was conducted in the absence of any commercial or financial relationships that could be construed as a potential conflict of interest.
Publisher’s Note
All claims expressed in this article are solely those of the authors and do not necessarily represent those of their affiliated organizations, or those of the publisher, the editors and the reviewers. Any product that may be evaluated in this article, or claim that may be made by its manufacturer, is not guaranteed or endorsed by the publisher.
Supplementary Material
The Supplementary Material for this article can be found online at: https://www.frontiersin.org/articles/10.3389/fevo.2021.659570/full#supplementary-material
References
Altmann, J. (1974). Observational study of behavior: sampling methods. Behaviour 49, 227–266. doi: 10.1163/156853974x00534
Askew, R. R. (1971). Parasitic insects. Parasitic insects. London: Heinemann Educational Books, 316.
Balbo, J. (1985). Vegetation analysis and implications for habitat selection and territoriality in feral horses (Equus caballus). Unpublished Thesis. Princeton, NJ: Princeton University.
Berger, J. (1986). Wild horses of the Great Basin: Social Competition and Population Size. Chicago, IL: University of Chicago Press.
Caro, T., Izzo, A., Reiner, R. C., Walker, H., and Stankowich, T. (2014). The function of zebra stripes. Nat. Commun. 5, 1–10.
Crawford, C. L., Volenec, Z. M., Sisanya, M., Kibet, R., and Rubenstein, D. I. (2019). Behavioral and ecological implications of bunched, rotational cattle grazing in East African Savanna ecosystem. Rangeland Ecol. Manag. 72, 204–209. doi: 10.1016/j.rama.2018.07.016
Dawkins, R., and Krebs, J. R. (1979). Arms races between and within species. Proc. R. Soc. Lond. B. Biol. Sci. 205, 489–511. doi: 10.1098/rspb.1979.0081
Duncan, P. (2012). Horses and grasses: the nutritional ecology of equids and their impact on the Camargue, Vol. 87. Berlin: Springer Science & Business Media.
Duncan, P., and Vigne, N. (1979). The effect of group size in horses on the rate of attacks by blood-sucking flies. Anim. Behav. 27, 623–625. doi: 10.1016/0003-3472(79)90201-x
Fischhoff, I., Sundaresan, S., Cordingley, J., and Rubenstein, D. I. (2007). Habitat use and movements of plains zebra (Equus burchelli) in response to predation danger from lions. Behav. Ecol. 18, 725–729. doi: 10.1093/beheco/arm036
Fretwell, S. D. (2020). Populations in a Seasonal Environment. (MPB-5), Vol. 106. Princeton, NJ: Princeton University Press.
Ivlev, V. S. (1975). Experimental ecology of the feeding of fishes. New Haven, CT: Yale University Press.
King, S. R., and Gurnell, J. (2010). Effects of fly disturbance on the behaviour of a population of reintroduced Przewalski horses (Equus ferus przewalskii) in Mongolia. Appl. Anim. Behav. Sci. 125, 22–29. doi: 10.1016/j.applanim.2010.03.006
Larison, B., Harrigan, R. J., Thomassen, H. A., Rubenstein, D. I., Chan-Golston, A. M., Li, E., et al. (2015). How the zebra got its stripes: a problem with too many solutions. R. Soc. Open Sci. 2:140452. doi: 10.1098/rsos.140452
Mayes, E., and Duncan, P. (1986). Temporal patterns of feeding behaviour in free-ranging horses. Behaviour 96, 105–129. doi: 10.1163/156853986x00243
Milinski, M. (1987). “Competition for non-depleting resources: The ideal free distribution in sticklebacks,” in Foraging behavior, eds A. C. Kamil, J. R. Krebs, and H. R. Pulliam (Boston, MA: Springer), 363–388. doi: 10.1007/978-1-4613-1839-2_11
Mooring, M. S., and Hart, B. L. (1992). Animal grouping for protection from parasites: selfish herd and encounter-dilution effects. Behaviour 123, 173–193. doi: 10.1163/156853992x00011
NRC. 2007. The Nutrient Requirements of Horses, 6th revised edn. Washington, DC: National Academy Press.
Powell, D. M., Danze, D. E., and Gwinn, M. A. (2006). Predictors of biting fly harassment and its impact on habitat use by feral horses (Equus caballus) on a barrier island. J. Ethol. 24, 147–154. doi: 10.1007/s10164-005-0174-2
Pratt-Phillips, S. E., Stuska, S., Beveridge, H. L., and Yoder, M. (2011). Nutritional quality of forages consumed by feral horses: The horses of Shackleford Banks. J. Equine Vet. Sci. 31, 640–644. doi: 10.1016/j.jevs.2011.05.012
Rubenstein, D. I. (1981). Behavioural ecology of island feral horses. Equine Vet. J. 13, 27–34. doi: 10.1111/j.2042-3306.1981.tb03443.x
Rubenstein, D. I. (1986). “Ecology and sociality in horses and zebras,” in Ecological Aspects of Social Evolution, eds D. I. Rubenstein and R. W. Wrangham (Princeton, NJ: Princeton University Press), 282–302. doi: 10.2307/j.ctt7zvwgq.17
Rubenstein, D. I. (1994). “The ecology of female social behavior in horses, zebras, and asses,” in Animal Societies: Individuals, Interactions, and Organization, eds P. Jarman and A. Rossiter (Kyoto: Kyoto University Press), 13–28.
Rubenstein, D. I., and Hohmann, M. E. (1989). Parasites and social behavior of island feral horses. Oikos 55, 312–320. doi: 10.2307/3565589
Rutberg, A. T. (1987). Horse fly harassment and the social behavior of feral ponies. Ethology 75, 145–154. doi: 10.1111/j.1439-0310.1987.tb00648.x
Keywords: horses, foraging behavior, avoidance of biting flies, movements, balancing tradeoffs
Citation: Rubenstein DI and Feinstein LH (2021) Bothersome Flies: How Free-Ranging Horses Reduce Harm While Maintaining Nutrition. Front. Ecol. Evol. 9:659570. doi: 10.3389/fevo.2021.659570
Received: 27 January 2021; Accepted: 27 August 2021;
Published: 24 September 2021.
Edited by:
Janet Koprivnikar, Ryerson University, CanadaReviewed by:
Sarah King, Colorado State University, United StatesSara B. Weinstein, The University of Utah, United States
Copyright © 2021 Rubenstein and Feinstein. This is an open-access article distributed under the terms of the Creative Commons Attribution License (CC BY). The use, distribution or reproduction in other forums is permitted, provided the original author(s) and the copyright owner(s) are credited and that the original publication in this journal is cited, in accordance with accepted academic practice. No use, distribution or reproduction is permitted which does not comply with these terms.
*Correspondence: Daniel I. Rubenstein, ZGlyQHByaW5jZXRvbi5lZHU=
 Daniel I. Rubenstein
 Lisa H. Feinstein