 Mohsen Sharafatmandrad
 Azam Khosravi Mashizi*
- Department of Ecological Engineering, Faculty of Natural Resources, University of Jiroft, Jiroft, Iran
Land degradation usually leads to the loss of ecosystem services, which may threaten social well-being. There is no approach to identify and manage all ecosystem services based on their importance in degradation processes and social systems. This study aimed to link ecosystem services to social well-being in order to assess rangeland degradation. Eleven ecosystem services (forage production, water yield, edible plants, fuel, medicinal plants, pollination, gas regulation, soil resistivity to erosion, soil fertility, scenic beauty, and recreation) were assessed in a semiarid rangeland near Bardsir city, Kerman Province, southeast Iran. There were significant differences between the rangeland types in providing ecosystem services (p < 0.05). Four criteria and 17 indices of social well-being were weighed according to their importance for local stakeholders. Rangeland degradation was estimated using the weight of the indices for social well-being and ecosystem services. Discriminant analysis indicated that supporting services (soil fertility) and provisioning services (water yield and forage production) had the greatest impact on rangeland degradation, which is related to food security in social well-being. Ecosystem services and social well-being declined in medium and severe degradation due to plant composition change and overgrazing based on principal component analysis (PCA). More than 70% of the watershed has been highly and severely degraded. There was a trade-off relationship between ecosystem services and social well-being in very severe degraded areas because of social well-being promotion due to agriculture expansion. Based on our approach, the loss rate of the ecosystem services and social well-being indices in each degradation category is a good guide for management programs and decision-makers to meet both the needs of the people and the preservation of ecosystems.
Introduction
Land degradation is a widespread phenomenon especially in arid to semiarid ecosystems that means reduction of land productivity. It has also affected the livelihood of many people in these areas. Rangelands, as one of the largest and most diverse land resources on the globe (Liebig et al., 2012) on which the livelihood of many people directly and indirectly depends (Maczko et al., 2011), are degraded due to different factors (Chen et al., 2020). Poor rangeland management and overgrazing (Kooch et al., 2020), land use change (Schallner et al., 2020), and cutting down woody plants for fuel (Davies et al., 2010) are the main causes of rangeland degradation, which has reduced plant diversity in rangeland ecosystems. Locals who govern the use of rangelands always suffer from poverty and lack of food security in degraded lands (Bedunah and Angerer, 2012; Chen et al., 2020). Therefore, rangeland degradation often leads to conflicts between local users, making the situation difficult for rangeland managers (Bedunah and Angerer, 2012).
The lack of a specific policy for sustainable rangeland management is one of the main reasons of rangeland degradation (Fotopoulos et al., 2000). In rangeland management, it is necessary to design an effective assessment method that acts as a degradation warning system (Reed and Dougill, 2010). The obtained information from the assessment helps to identify existing problems and provides the ability to make better decisions for sustainable rangeland use in the future (Khiralla, 2013). Various methods are used to assess the conditions of rangelands. Initial approaches were based on the ecosystem structure (Dyksterhuis, 1949; Goebel and Cook, 1960). Then, approaches based on the ecosystem function were introduced, such as landscape function analysis (Tongway and Hindley, 2004) and rangeland health assessment (Payke et al., 2002).
Recently, ecosystem services are used in ecosystem assessment (Himes et al., 2020; Kusi et al., 2020). Ecosystem services are a means to help humans see the importance of all of nature’s elements and also of themselves as an integral part of nature’s functioning (Summers et al., 2012). When ecosystems are degraded, their capacity to provide services decreases (Favretto et al., 2016). Ecosystem services are a central issue in sustainable management. Spatial evaluation of ecosystem services is crucial for management decision making (Alcamo et al., 2005).
Linking ecosystem services to social well-being minimizes the unintended consequences of managerial decisions (Summers et al., 2012). This approach helps to identify and manage all ecosystem services based on their importance in degradation processes and social systems. Many studies have mapped ecosystem services (e.g., Santarém et al., 2020) and identified the priority areas in management using spatial distribution of services, but ecosystem services have the same weights in all of these studies, while different ecosystem services are not equally important to meet people’s needs (Zhang et al., 2020). The new approach introduced in this study, which links the importance of ecosystem services to social well-being, can provide more complete information about ecosystem degradation and can lead to more participation of people in rangeland assessment methods. Therefore, the objectives of this study were to: (1) determine degraded areas through combining ecosystem services and social well-being, (2) determine the most important ecosystem services and social well-being criteria in rangeland degradation assessment, and (3) compare the loss rate of ecosystem services and social well-being under degradation and find its main drivers.
Materials and Methods
Research Site
A historic semiarid basin was selected for this study, located near Bardsir city, Kerman Province, southeast Iran (56°04′12″ to 57°00′07″ E and 29°23′26″ to 30°09′11″ N), which covers an area of about 3,941 km2. The region is characterized by 210 mm mean annual precipitation, which mostly occurs in winter. The southern part of the basin is mountainous, with elevation ranging from 2,300 to 4,264 m.a.s.l. The northern part is plains, with elevation ranging from 1,862 to 2,300 m.a.s.l. The basin consists of several rangeland types (Figure 1). There are 220 villages and 286 km2 agricultural lands in the region (Figure 2). The main livelihoods of the rural people in the highlands and lowlands are ranching and farming, respectively. Bardsir city, with 25,152 inhabitants, is located in the lowlands (National Statistics Center of Iran, 2017).
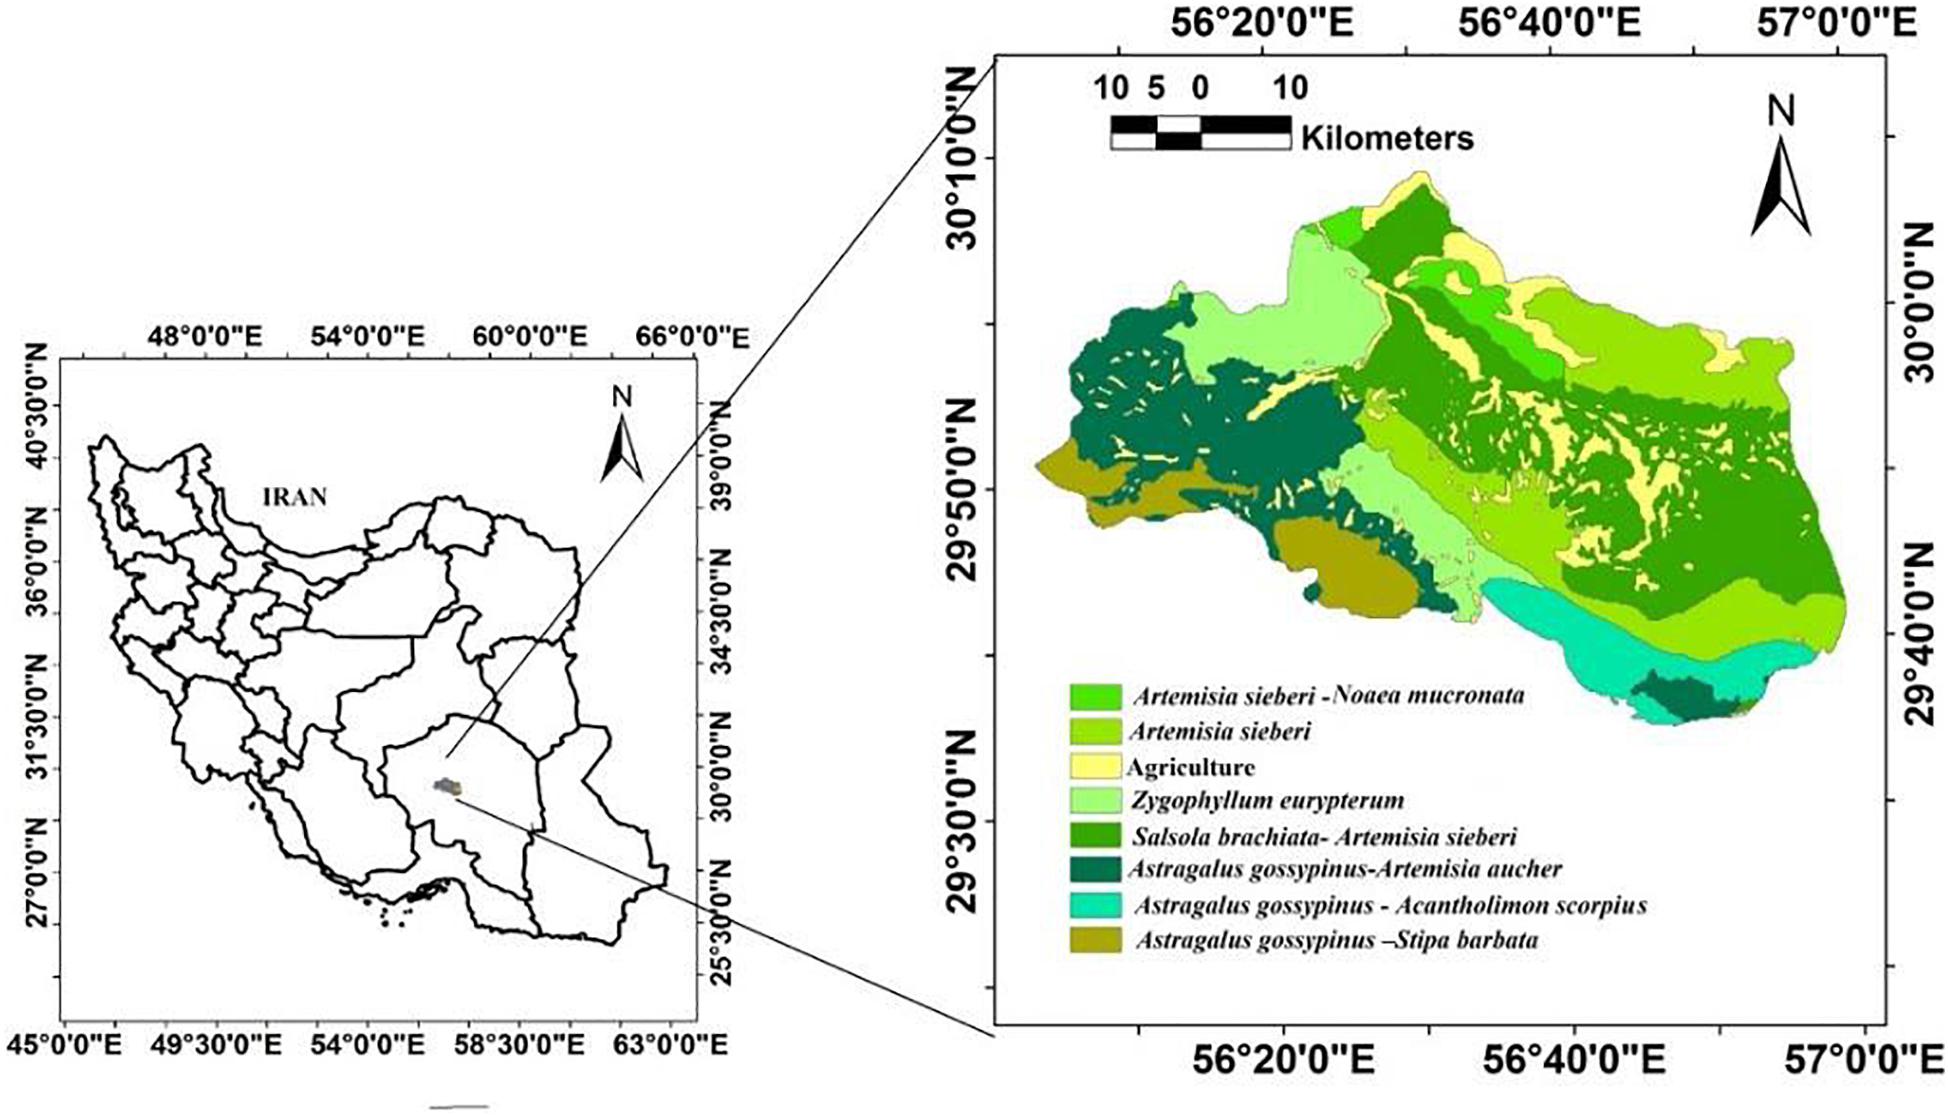
Figure 1. Location map of the study area and its different rangeland types.
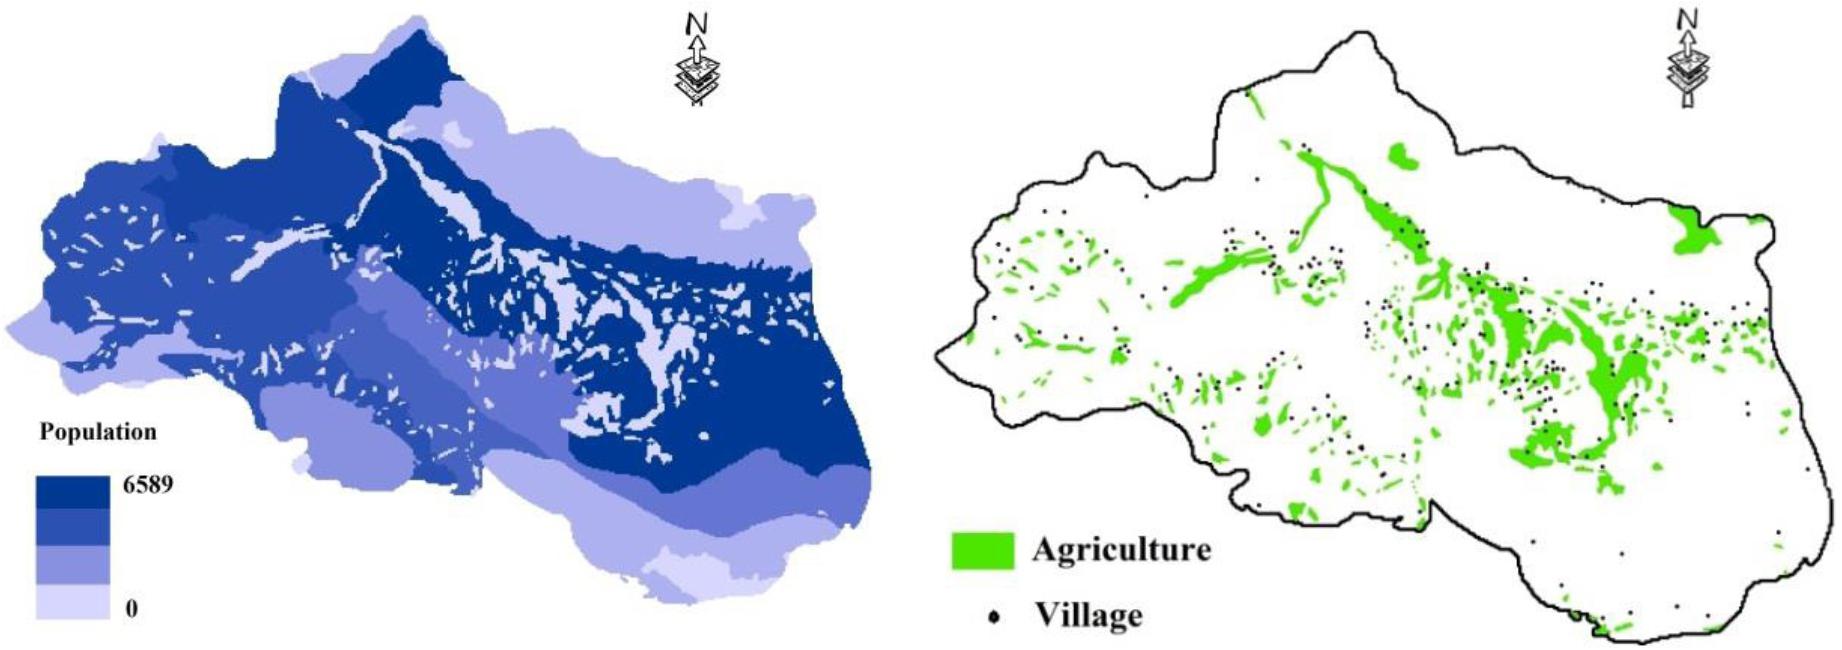
Figure 2. Distribution of population, villages, and agricultural lands across the basin.
Data Collection
To gain a deeper understanding of the supply, demand, and use of ecosystem services, ecosystem services were examined instead of their categories (i.e., provisioning, regulating, supporting, and cultural services). Ecosystem services were selected for this study based on their importance in semiarid ecosystems and their relevance to indigenous well-being. Therefore, 19 ecosystem services were distinguished and their supply, demand, and use were assessed using public participation geographic information system (PPGIS; Table 1).
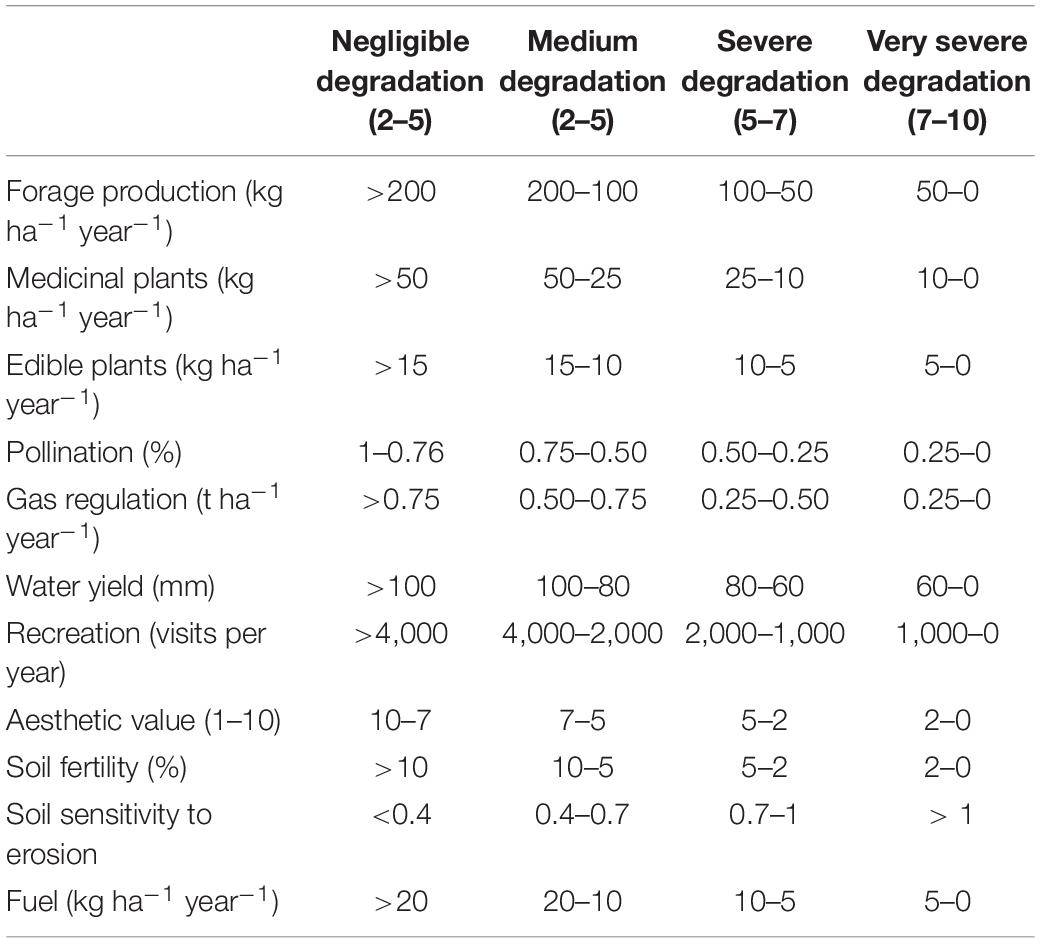
Table 1. Potential of the four degradation classes in providing different ecosystem services.
Mapping and Classifying Ecosystem Services
In this study, forage production, water yield, edible plants, and medicinal plants as provisioning services; pollination, gas regulation, and soil resistivity to erosion as regulating services; soil fertility as supporting service; and scenic beauty and recreation as cultural services were chosen for mapping. Opinions of 11 different local and regional researchers with ecological expertise were then elicited for determining the degradation classes (negligible, medium, high, and severe degradation) for each ecosystem service (Table 1).
Water Yield
Water yield was mapped using the Integrated Valuation of Ecosystem Service and Tradeoff (InVEST) model from the Natural Capital Project. The InVEST water yield model is based on the Budyko curve (Budyko, 1974). In the InVEST model, the annual water yield (Yjx) for each pixel on the landscape (x = 1, 2, 3,…X) is determined as follows:
AETxj is the annual actual evapotranspiration on pixel x with land use/land cover (LU/LC) j. Px is the annual precipitation on pixel x. The evapotranspiration partition of the water balance was calculated with Eq. 2.
Rxj is the Budyko dryness index on pixel x with land use and cover j.
AWCx is the plant-available water content (in millimeters) and Z is the Zhang coefficient (Zhang et al., 2001).
The model inputs are: the sub-basin maps prepared using digital elevation model (DEM), the ET0 map prepared using the Penman–Monteith equation, and the plant water availability (PWA) map prepared using soil type. Soil depth was mapped based on the methodologies of Tsai et al. (2001), Tesfa et al. (2009), and Liu et al. (2013). Leaf area index was estimated using the gravimetric method (Jonckheere et al., 2004), which was then used to estimate the evapotranspiration index (Kc). The maximum rooting depth for the plant species in each LU–LC was estimated with the methodologies of Canadell et al. (1996) and Schenk and Jackson (2002).
Forage Production
Thirty 2 m × 1 m random quadrats were used to estimate the forage production of plant species with the clip-and-weigh method. Sample size was determined based on Mitchell and Carson (1989). In this study, the current year’s growth was considered as forage production that is the aboveground biomass produced during the previous 12 months. All samples were then oven dried at 60°C until a constant weight is obtained and then the samples were finally weighed (Moghaddam, 1977).
Edible and Medicinal Plants
Edible and medicinal plants were identified by interviewing locals. Thirty 2 m × 1 m plots were then used to measure these plants’ production using the clip-and-weigh method.
Gas Regulation
Gas regulation function was estimated based on the amount of oxygen released during photosynthesis. During photosynthesis, plants receive energy from a solar source and convert inorganic compounds such as water and gas into carbon dioxide. The amount of oxygen produced was calculated by estimating the net production and using the following photosynthesis formula (Guo et al., 2001; Li et al., 2006):
About 108 g of water and 264 g of carbon dioxide are needed to produce 162 g of dry matter and 193 g of plant oxygen by the rangeland ecosystem. For Iranian conditions, the amount of oxygen released is about 191 g (Yakhshaki, 1977). Therefore, the annual biomass growth of plant species was estimated using thirty 2 m × 1 m plots in each rangeland type, which was then used to estimate ecosystem efficiency in oxygen production.
Pollination
The potential of the ecosystem in providing pollination service was assessed using the InVEST model, in which the frequency of pollinators is estimated in each LU–LC based on the presence of flowering plants as the main source of food for pollinators and nesting conditions as follows:
where Pxβ is the frequency index of pollinator β in LU–LC x, Nj is the suitability of nesting of LU–LC type j, Fj is the relative amount of floral resources produced by LU–LC type j, Dmx is the Euclidean distance between cells m and x, and α is the expected foraging distance for the pollinator (Greenleaf et al., 2007).
As honeybees are the most important pollinator in Iranian rangelands (Ghassemi-Khademi, 2014), only this species is considered in this study. The foraging distance and the suitability of nesting for honeybees were assessed according to Lonsdorf et al. (2009). Plant composition was determined through establishing thirty 1 m × 2 m plots in each LU–LC. The potential of plant species for bee feeding was then estimated according to Toopchi-Khosroshahi and Lotfalizadeh (2011) and Ariapour et al. (2014).
Soil Sensitivity to Erosion
The erosion potential method (EPM) was used for qualifying the erosion severity (z) in the basin with following equation:
where Y is the coefficient of rock and soil resistance to erosion, Xa is a land use coefficient, Ø is the coefficient value for the observed erosion processes, and I is the average land slope (Gavrilovic, 1988).
Xa was estimated using a land use map and the table provided by Gavrilovic (1988), which ranges from 0.1 to 1. The rock physical properties play an important role in resistance against climatic and biological factors in estimating the coefficient Y. Firstly, the area lithology was mapped. The coefficient Y was then estimated based on Feyznia’s (1995) method, which ranges from 0.2 to 2. The apparent erosion of the area is indicated by Ø, which is estimated through a field survey and the table provided by Gavrilovic (1988). This coefficient varies between 0.1 and 1.
Soil Fertility
Soil samples were taken from 0- to 30-cm depths in 70 plots across the basin. Particle size distribution (sand, silt, and clay contents) was determined using the hydrometer method (Soil Survey Staff, 1994), and the soil organic matter (SOM) content of the samples was estimated using the Walkley–Black method (Nelson and Sommers, 1983).
Scenic Beauty
The potential of ecosystems to provide landscape beauty was estimated using people’s preferences based on color landscape photographs (Dramstad et al., 2006; Van den Berg and Koole, 2006; Schirpke et al., 2013, 2016). Therefore, color photographs of different landscapes were chosen in consultation with local experts, and visitors’ opinions about their beauty were asked across the studied basin. We surveyed 87 visitors using non-proportional quota sampling (Tashakkori and Teddlie, 2010). People were asked whether these landscapes provide a scenic beauty and were then asked to rank their beauty in a scale of 10, with values ranging from 1 = not at all important to 10 = very much important.
Recreation
The visiting rate was used to estimate recreation potential, which estimates the ecosystem’s potential for recreation using regression and environmental characteristics (Schägner et al., 2020).
In each LU–LC, 20 visitors were randomly selected and were asked to score (from 0 to 10) the attributes of the place visited (distance from the city, distance from the river, distance from the road, canopy distance, and dominant species) according to their contribution to recreation potential.
Weighing of the Criteria and Indices of Well-Being Based on Their Importance on Well-Being and Related Ecosystem Services
One hundred twenty stockholders were surveyed based on non-proportional quota sampling in the studied region (Tashakkori and Teddlie, 2010). The participants comprised 40 pastorals, 30 farmers, 30 pastoral farmers, and 20 urban residents.
In the first step, the participants were asked to rank ecosystem services based on their importance in well-being. In the second step, four criteria were selected to assess social well-being, including basic materials for good life, personal security, health, experience of freedom and choice, and good social relations (MA, 2005). Several indices were selected for each criterion. The analytic hierarchy process (AHP) was used to determine the weights of the criteria and indices for social well-being. In this method, people weigh the indices and criteria according to their importance to the problem (Kangas, 1992). The importance of the social well-being criteria for ecosystem services was determined in the same way. Therefore, the participants were asked to compare the parameters in pairs and to rank them on a 1–9 scale. The results of pairwise comparisons quantitatively show how important an entity is over another (Saaty, 1980).
Data Analysis
The social well-being indices were weighed using their weights in criteria (Wic) and the weights of the criteria (Wc) were determined by AHP.
where Wi is the weight of criterion i in a stockholder’s well-being.
The degradation score in each cell of ecosystem service j (Dj) was defined based on its position in the degradation classes in each cell. The weighted degradation (WDj) of ecosystem service
j in the basin was determined using Dj, Wi, and the weight of ecosystem services in each well-being index (Wji).
The total degradation (TD) of the basin was determined with the following equation:
where N is the number of ecosystem services.
One-way analysis of variance (ANOVA) followed by the least significant difference (LSD) test was performed to compare the rangeland types based on providing ecosystem services. Pearson’s correlation test was used to examine the relationship between the well-being criteria based on their importance on ecosystem services. Discriminant analysis was used to determine the importance of the 11 ecosystem services and the 17 well-being indices related to the degradation classes in the basin.
In this method, Wilks’ lambda was used for mean comparisons of the variables in the four degradation classes. A close to 0 value of Wilks’ lambda means that there is no difference between the variable means in the classes. Therefore, these variables are removed from the differentiation analysis. The structure coefficient was used to determine the significance of the remaining independent variables in the degradation classes. Non-metric multidimensional scaling (NMDS) was used to investigate the relationships of the degradation classes with vegetation composition and the climatic, topographic, and managerial (livestock grazing and agriculture) factors.
Results
Ecosystem services were differently distributed across the basin (Figure 3). The Artemisia sieberi–Salsola brachiata plant community had the lowest potential to provide forage production (21.67 ± 5.92), medicinal (9.34 ± 2.13), and edible plants (1.12 ± 0.07), water yield (42.67 ± 2.56), soil fertility (0.67 ± 0.23), fuel (1.78 ± 0.95), and gas regulation (0.18 ± 0.06) and the highest potential to provide soil erosion sensitivity (1.01 ± 0.01) (Table 2). The A. sieberi–Noaea mucronata plant community had the least potential for pollination (0.21 ± 0.15), aesthetic value (1.22 ± 0.48), and recreation (256 ± 156). There were no significant differences between Astragalus gossypinus–Artemisia aucheri, A. gossypinus–Stipa barbata, and A. gossypinus–Acantholimon scorpius plant communities in terms of ecosystem services. These three plant communities had the highest potential in providing ecosystem services.
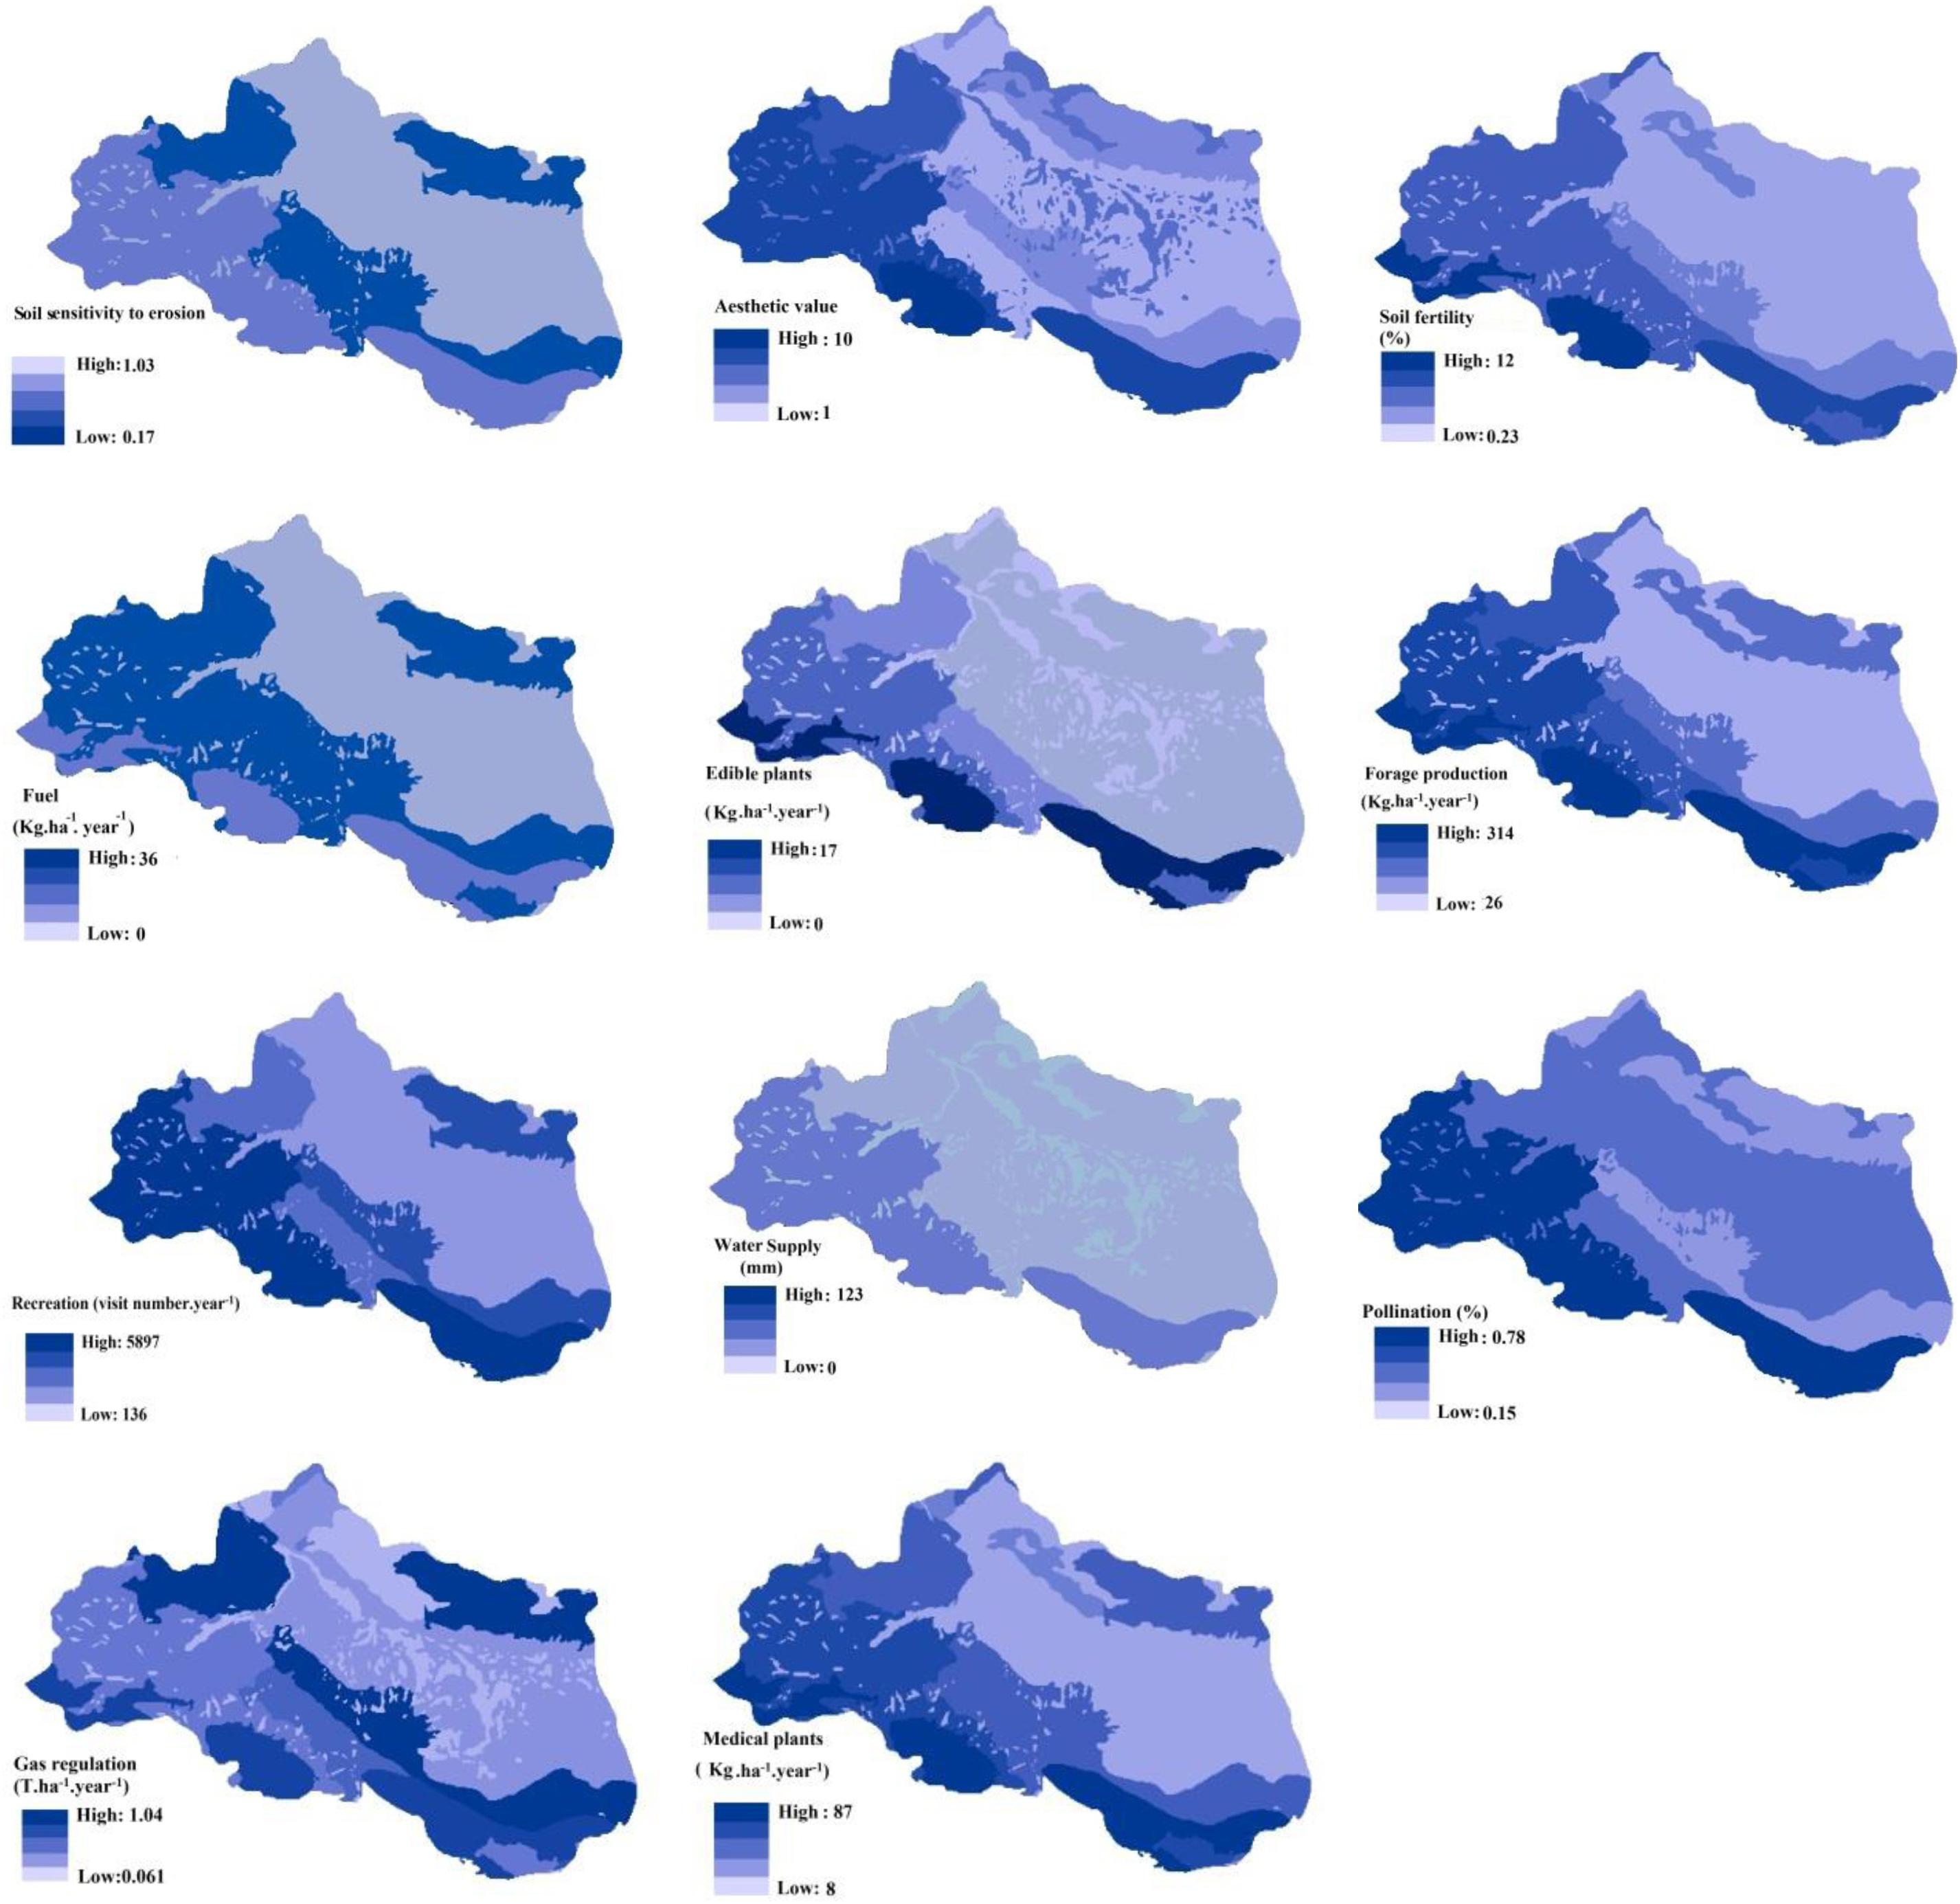
Figure 3. Spatial distribution of the ecosystem services (soil sensitivity to erosion, soil fertility, aesthetic value, fuel, edible plants, forage production, recreation, water yield, pollination, gas regulation, and medicinal plants) along the basin.
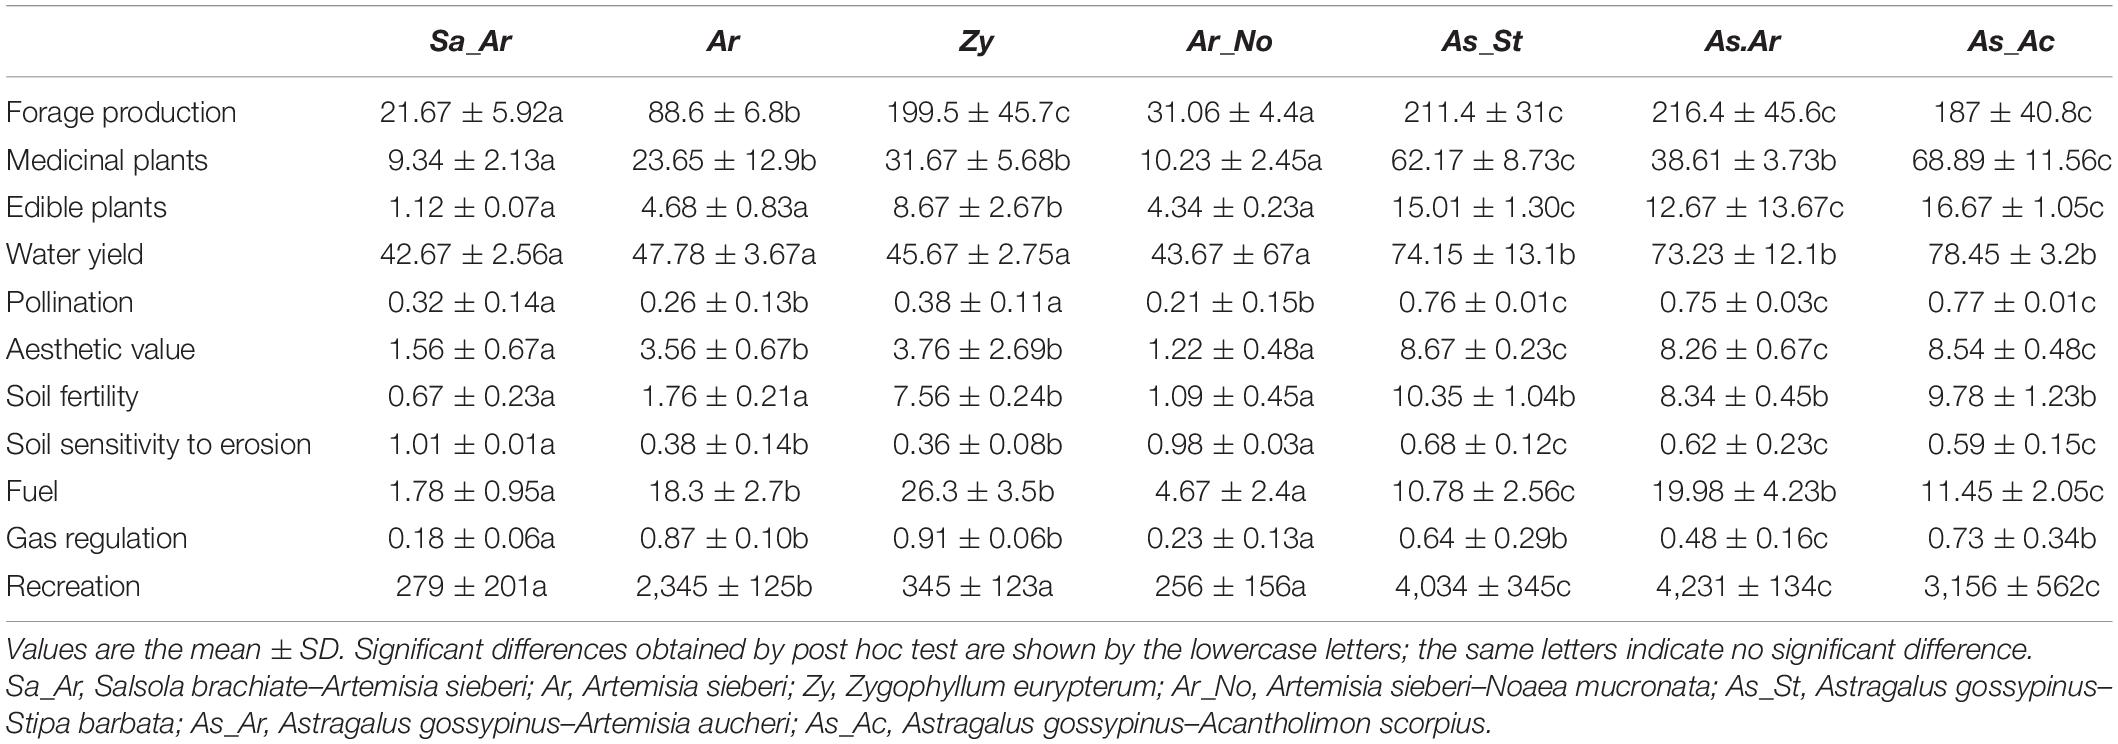
Table 2. Potential of different plant communities in providing ecosystem services.
The social well-being criteria were weighed using the AHP (Figure 4). The basic material for a good life had the most weight (0.486). Experience of freedom (0.217), personal security (0.168), health (0.110), and good social relations (0.018) were in the next ranks, respectively. Fresh water (0.313) and food (0.119) were the most important indices for social well-being.
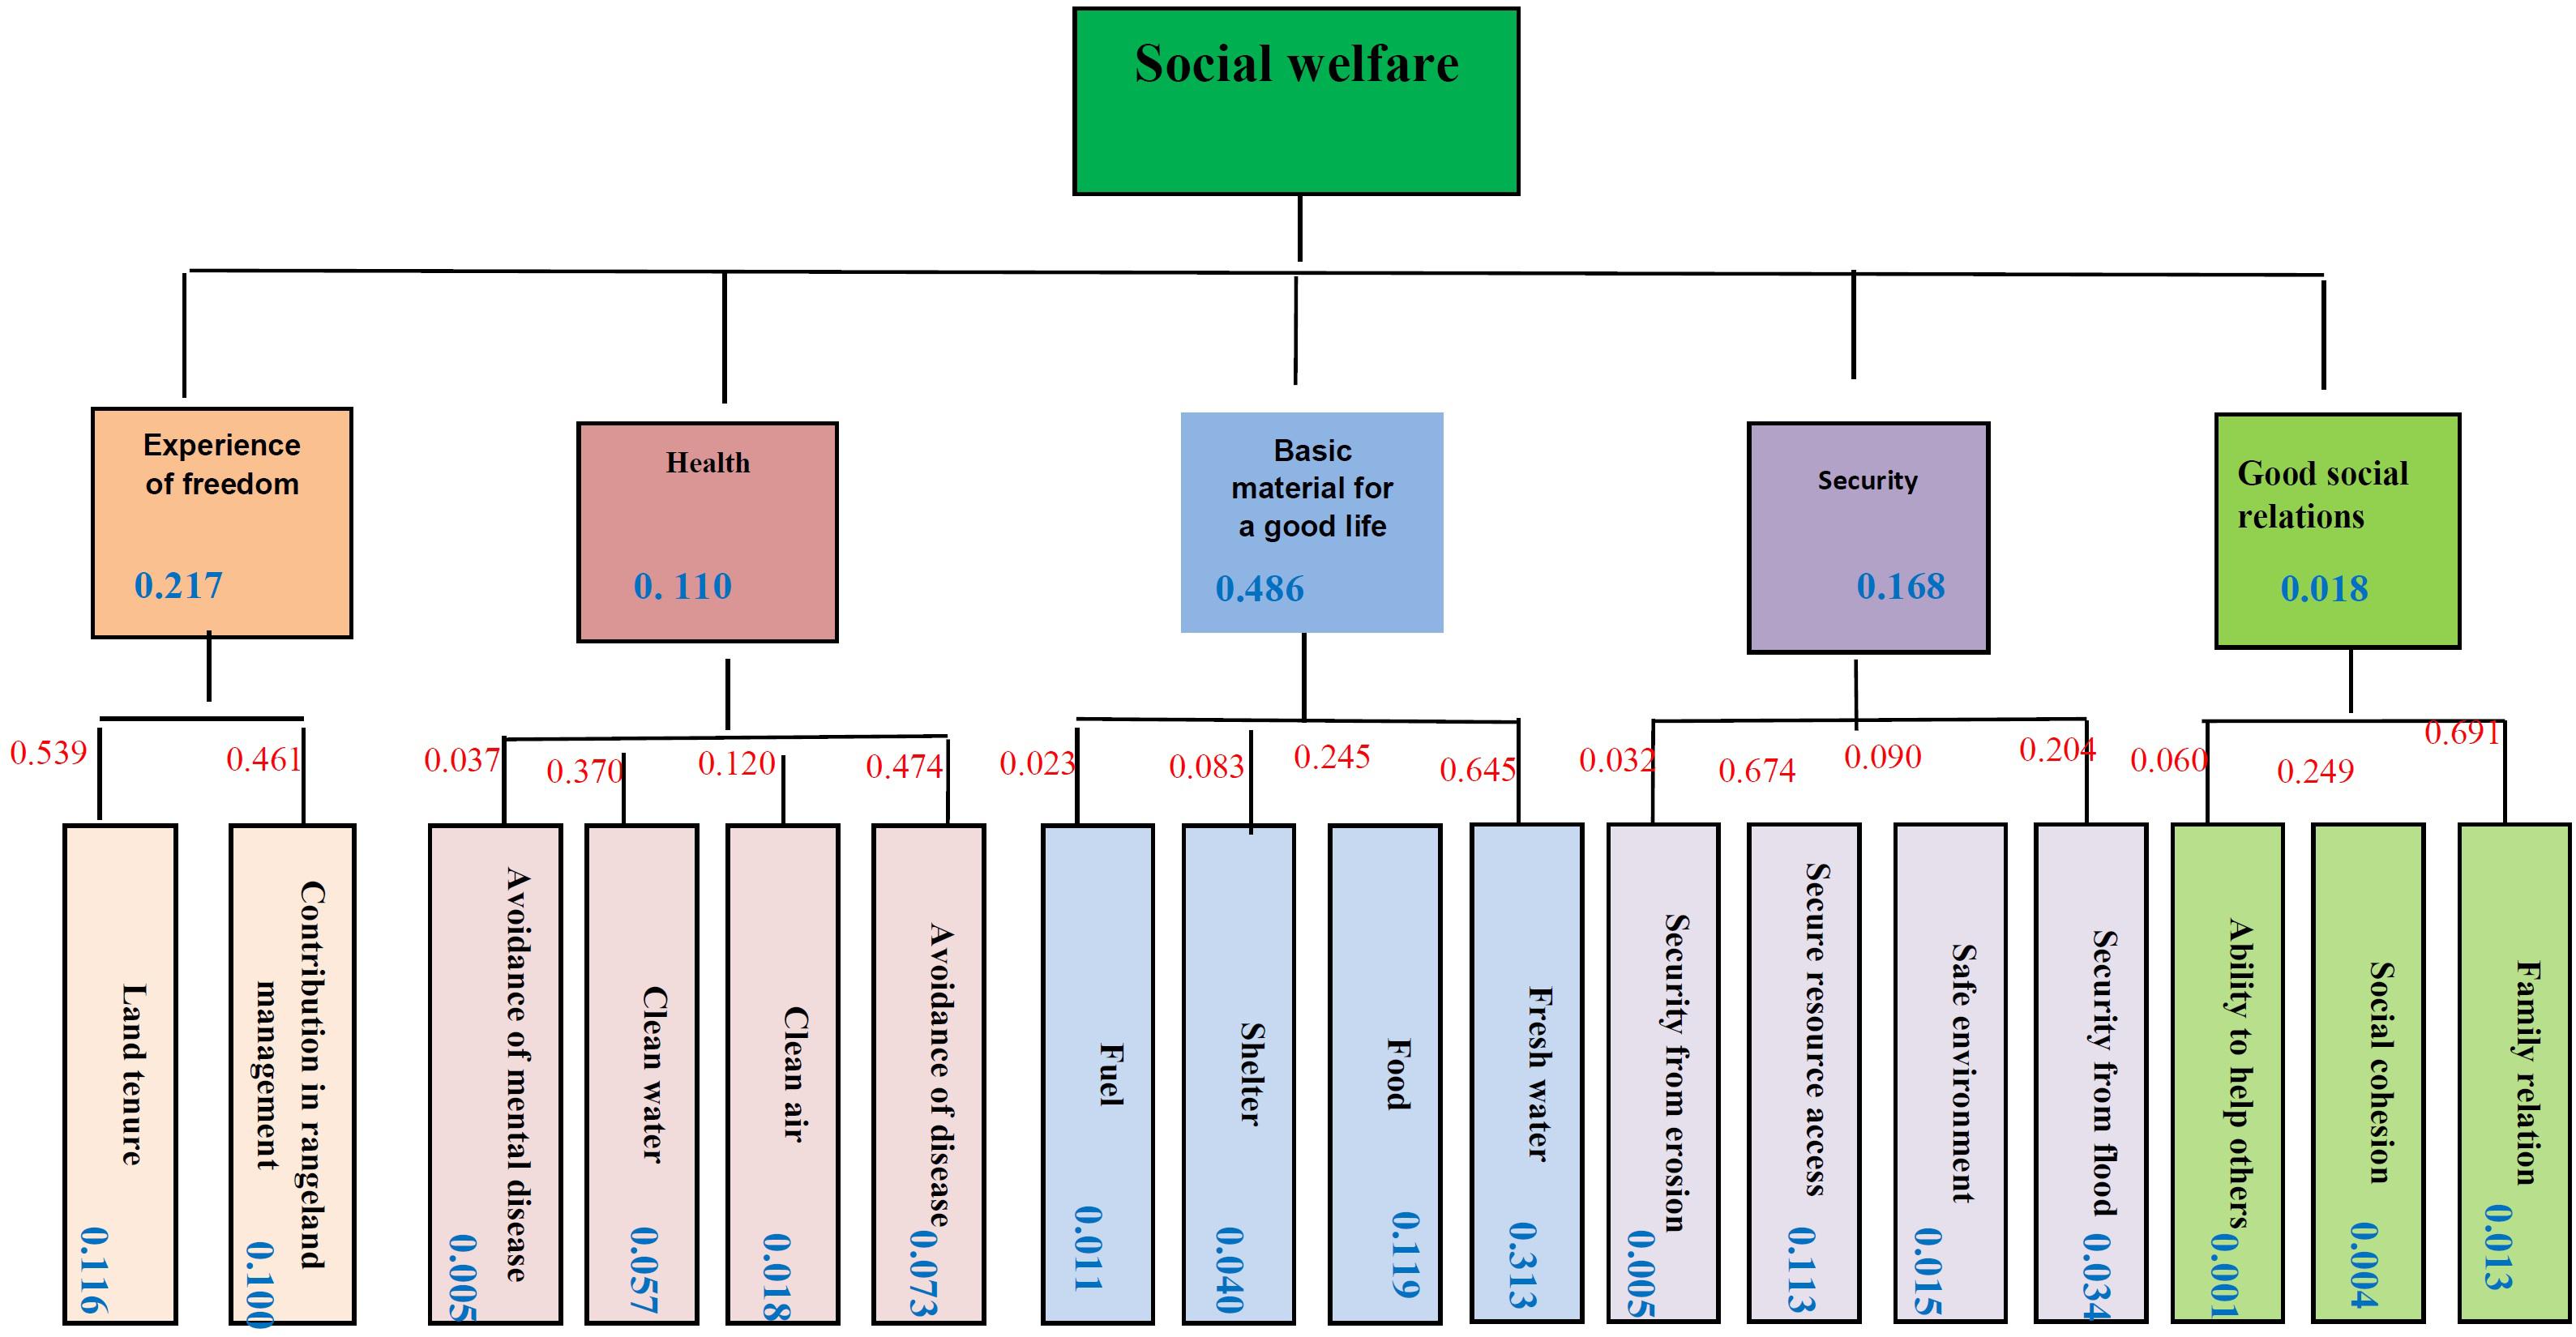
Figure 4. Well-being indicators and indices in the decision tree of the analytic hierarchy process (AHP). Blue numbers are the weights of the indicators and indices for well-being; red numbers are the weights of the indices for each criterion.
The social well-being indices had different weights for each ecosystem service (Table 3). Food (0.190) was the most important index of social well-being for forage, edible production, soil fertility, and pollination. Disease avoidance (0.247) was the most important index of social well-being for medicinal plants. Clean air (0.204) and clean water (0.189) were the most important indices for gas regulation service and water yield, respectively. For recreation and aesthetic value, mental disease avoidance was the most important index of social well-being, with 0.361 and 0.323 weights, respectively. Security from erosion (0.260) was also the most important index for soil sensitivity to erosion. Pearson’s correlation revealed a relationship between the social well-being indices in terms of their importance for ecosystem services (Table 4). The spatial distribution of the degradation classes in the basin is shown in Figure 5. About 58% of the area had severe degradation (8.67 ± 1.04; Table 5). The severe degradation class covers 11.5% of the basin (6.23 ± 0.34). Twenty-four percent of the basin had medium degradation (3.56 ± 0.86). Only 6.5% of the basin had negligible degradation (1.67 ± 0.75).
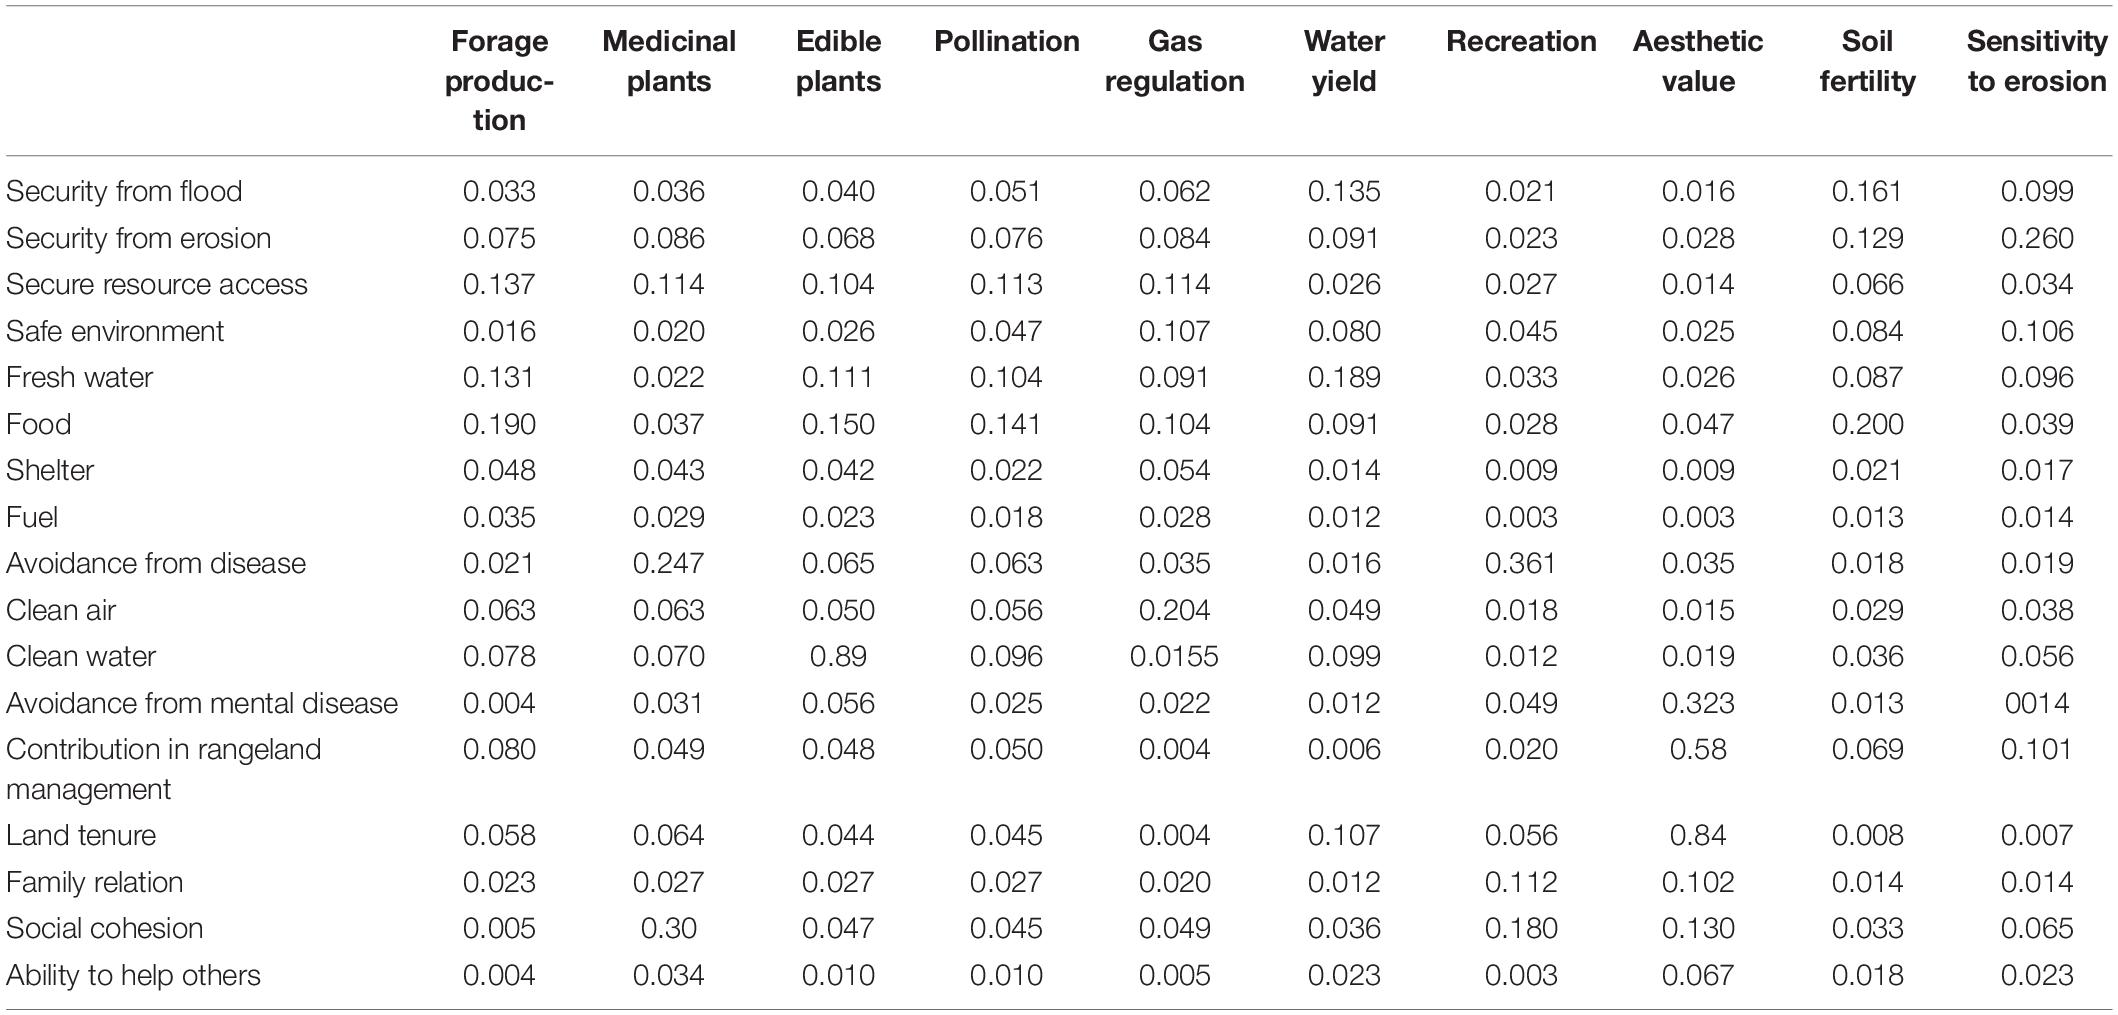
Table 3. Relative weights of the well-being indices for each ecosystem service.
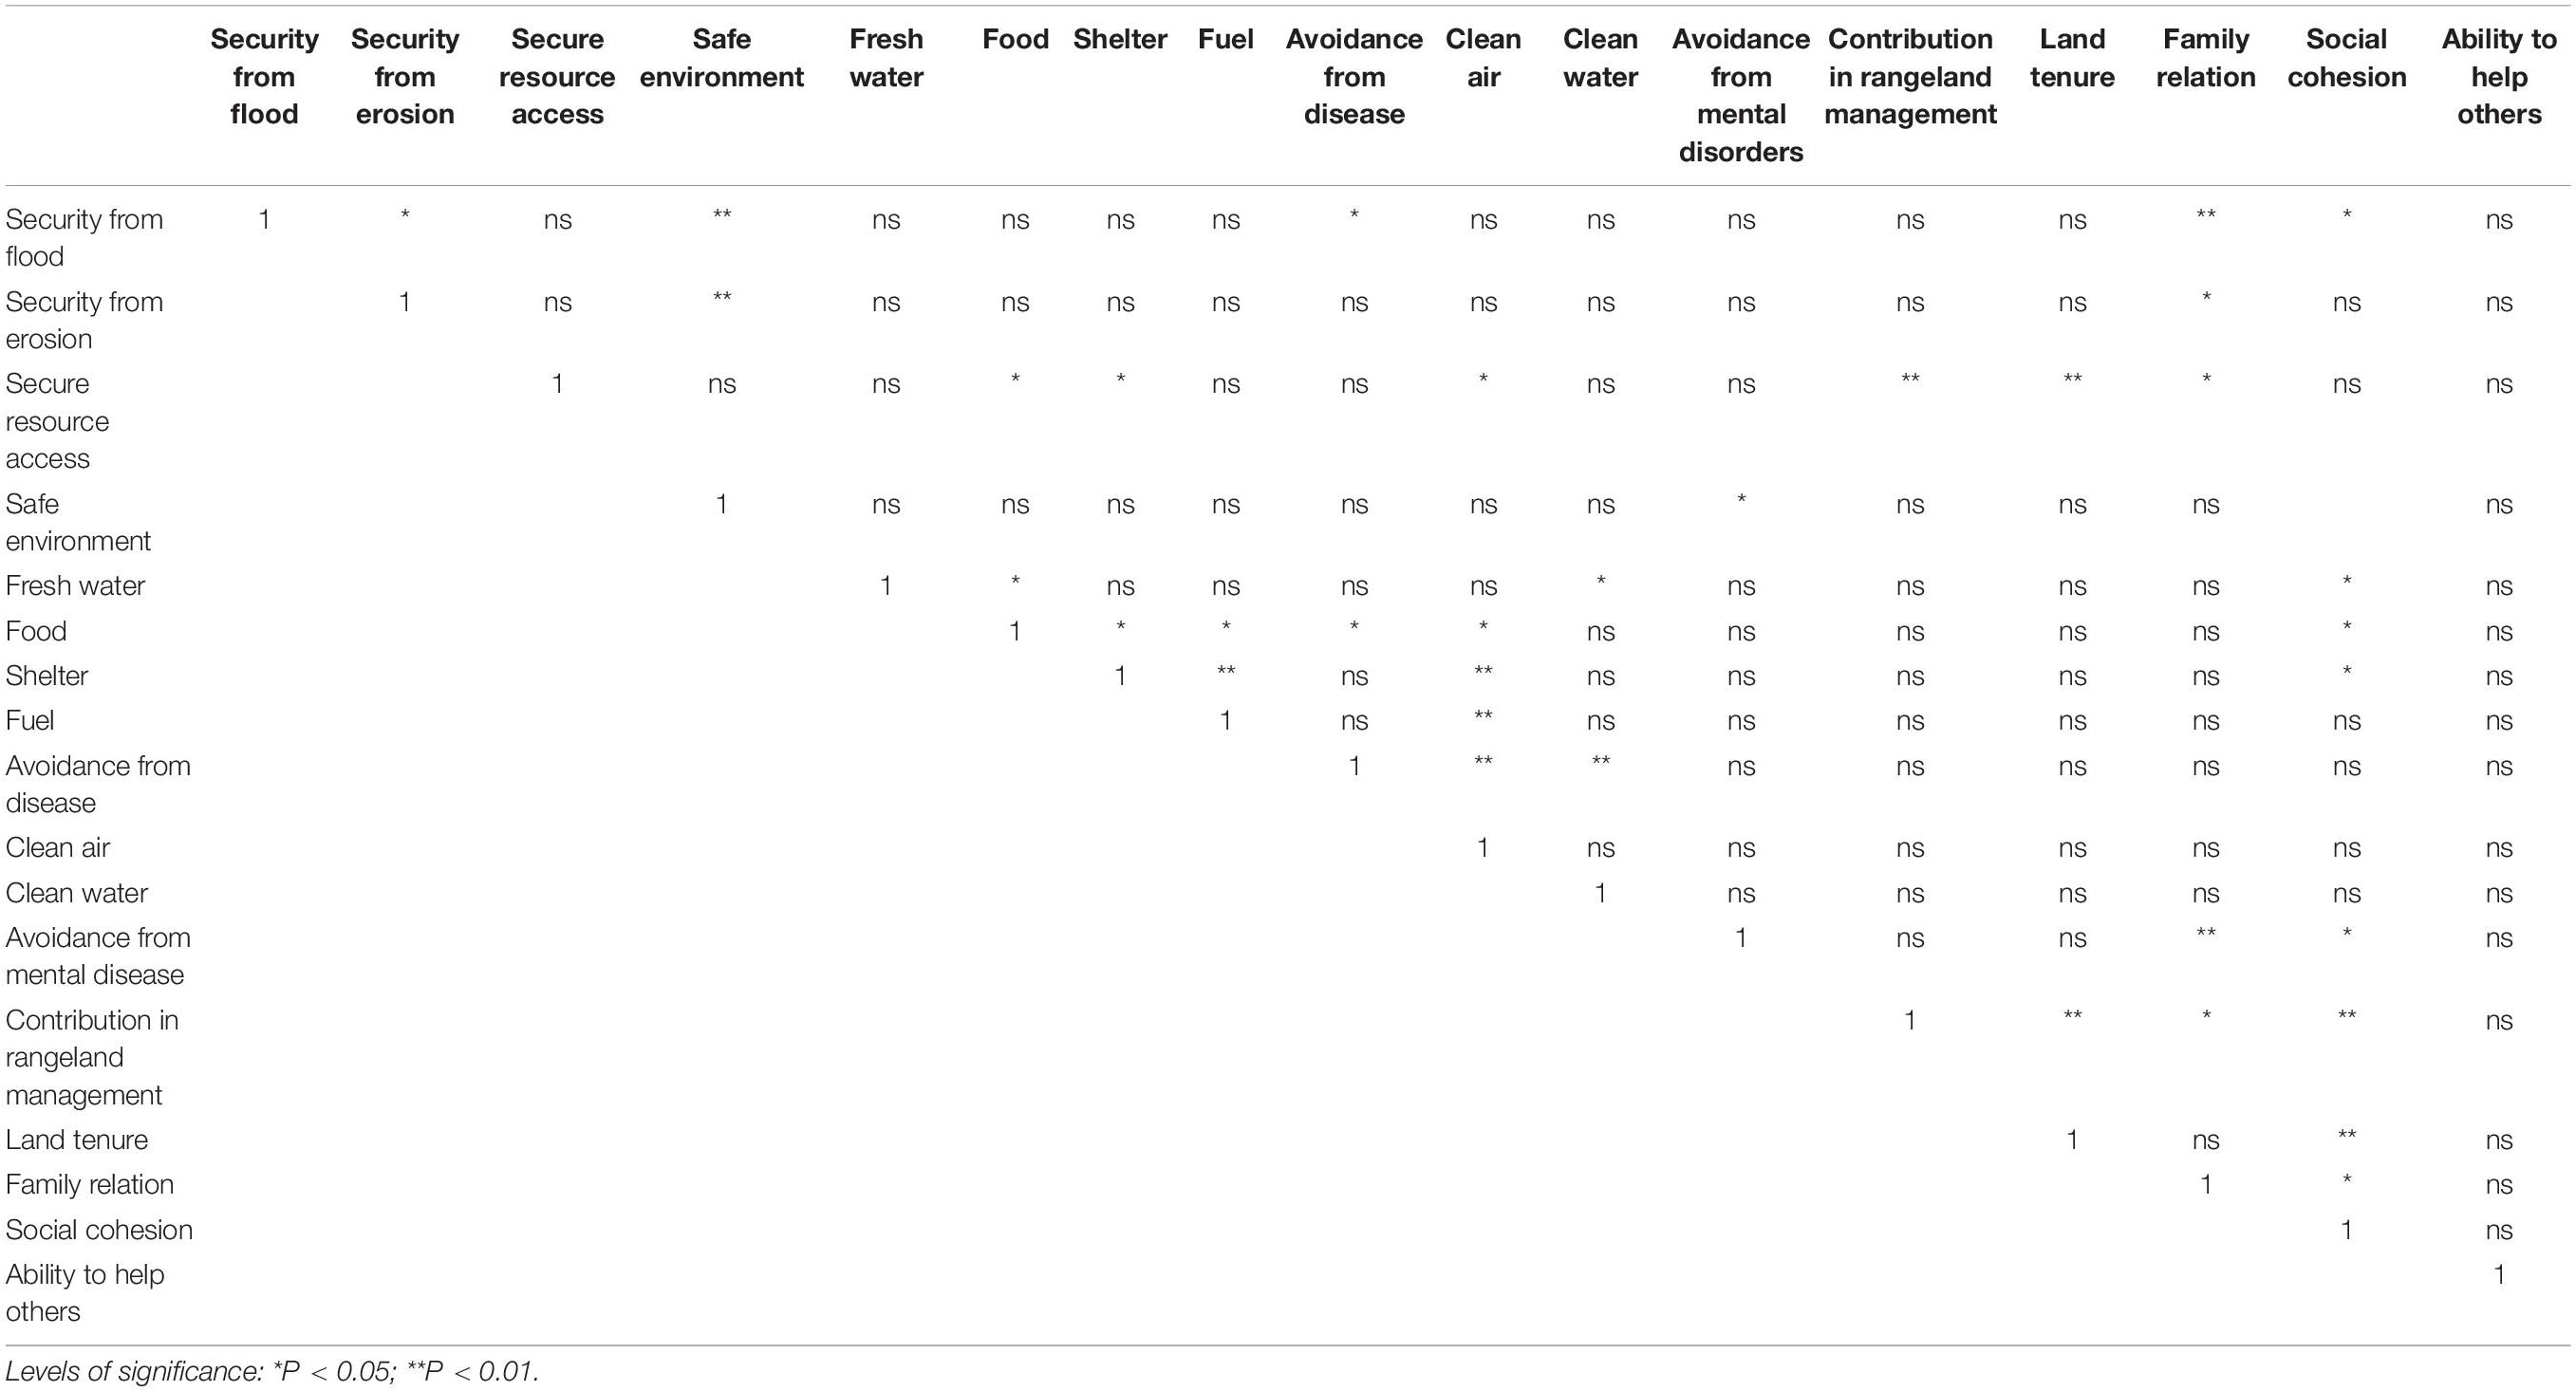
Table 4. Correlations between the well-being indices based on their importance for ecosystem services.
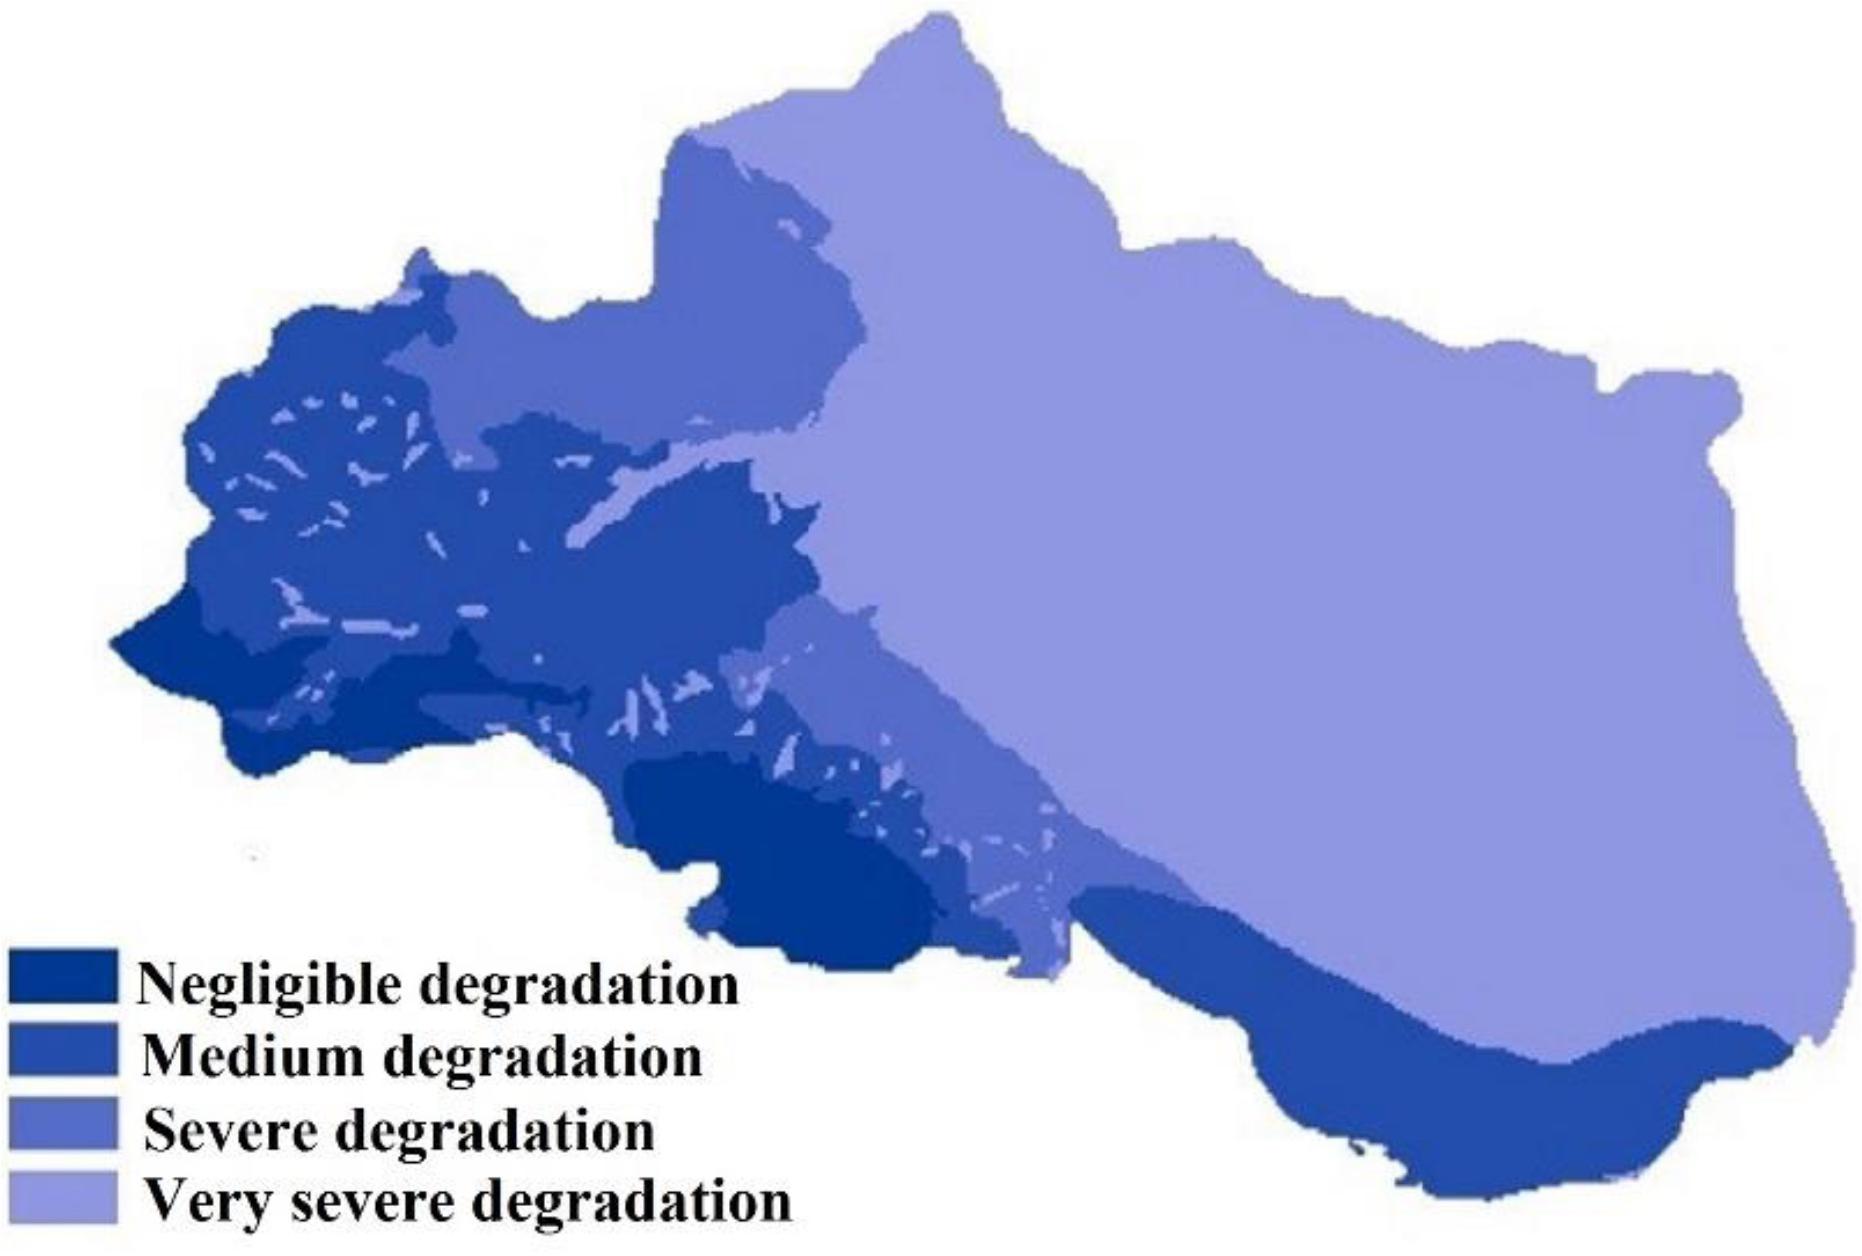
Figure 5. Spatial distribution of the degradation classes across the basin.
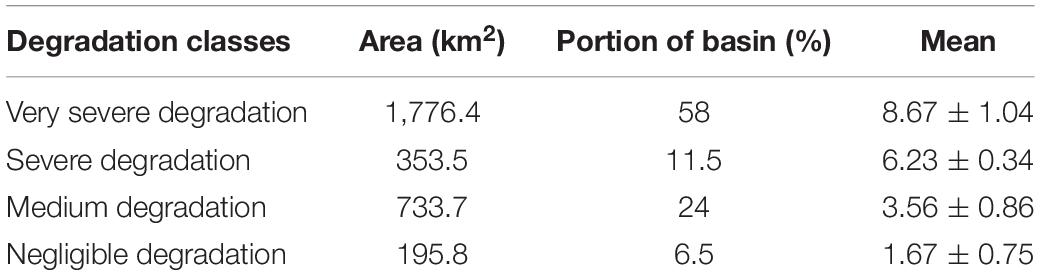
Table 5. Area and mean degradation scores of the different degradation classes.
Ecosystem services had a different importance in stakeholders’ well-being (Table 6). Forage production was the most important service for pastorals’ well-being, edible plants (crops) were the most important service for pastoral farmers’ and farmers’ well-being, and recreation had the highest value for urban residents’ well-being. The spatial relationship between ecosystem services and social well-being showed that everywhere, regulating, supporting, and cultural services were more important for social welfare and that the potential of ecosystems to supply these services had decreased (Figure 6). This also applies for water and medicinal plants in provisioning services. The supply of forage and edible plants was positively related to their importance in social welfare.
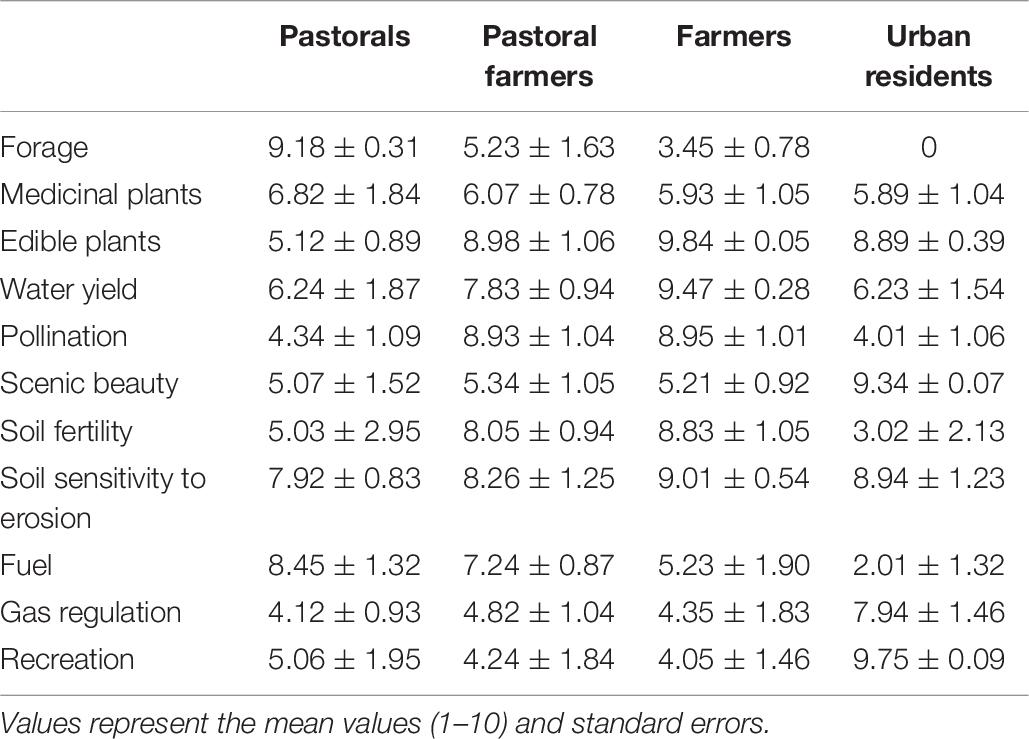
Table 6. Participants’ opinions on the importance of the different ecosystem services to their social well-being.
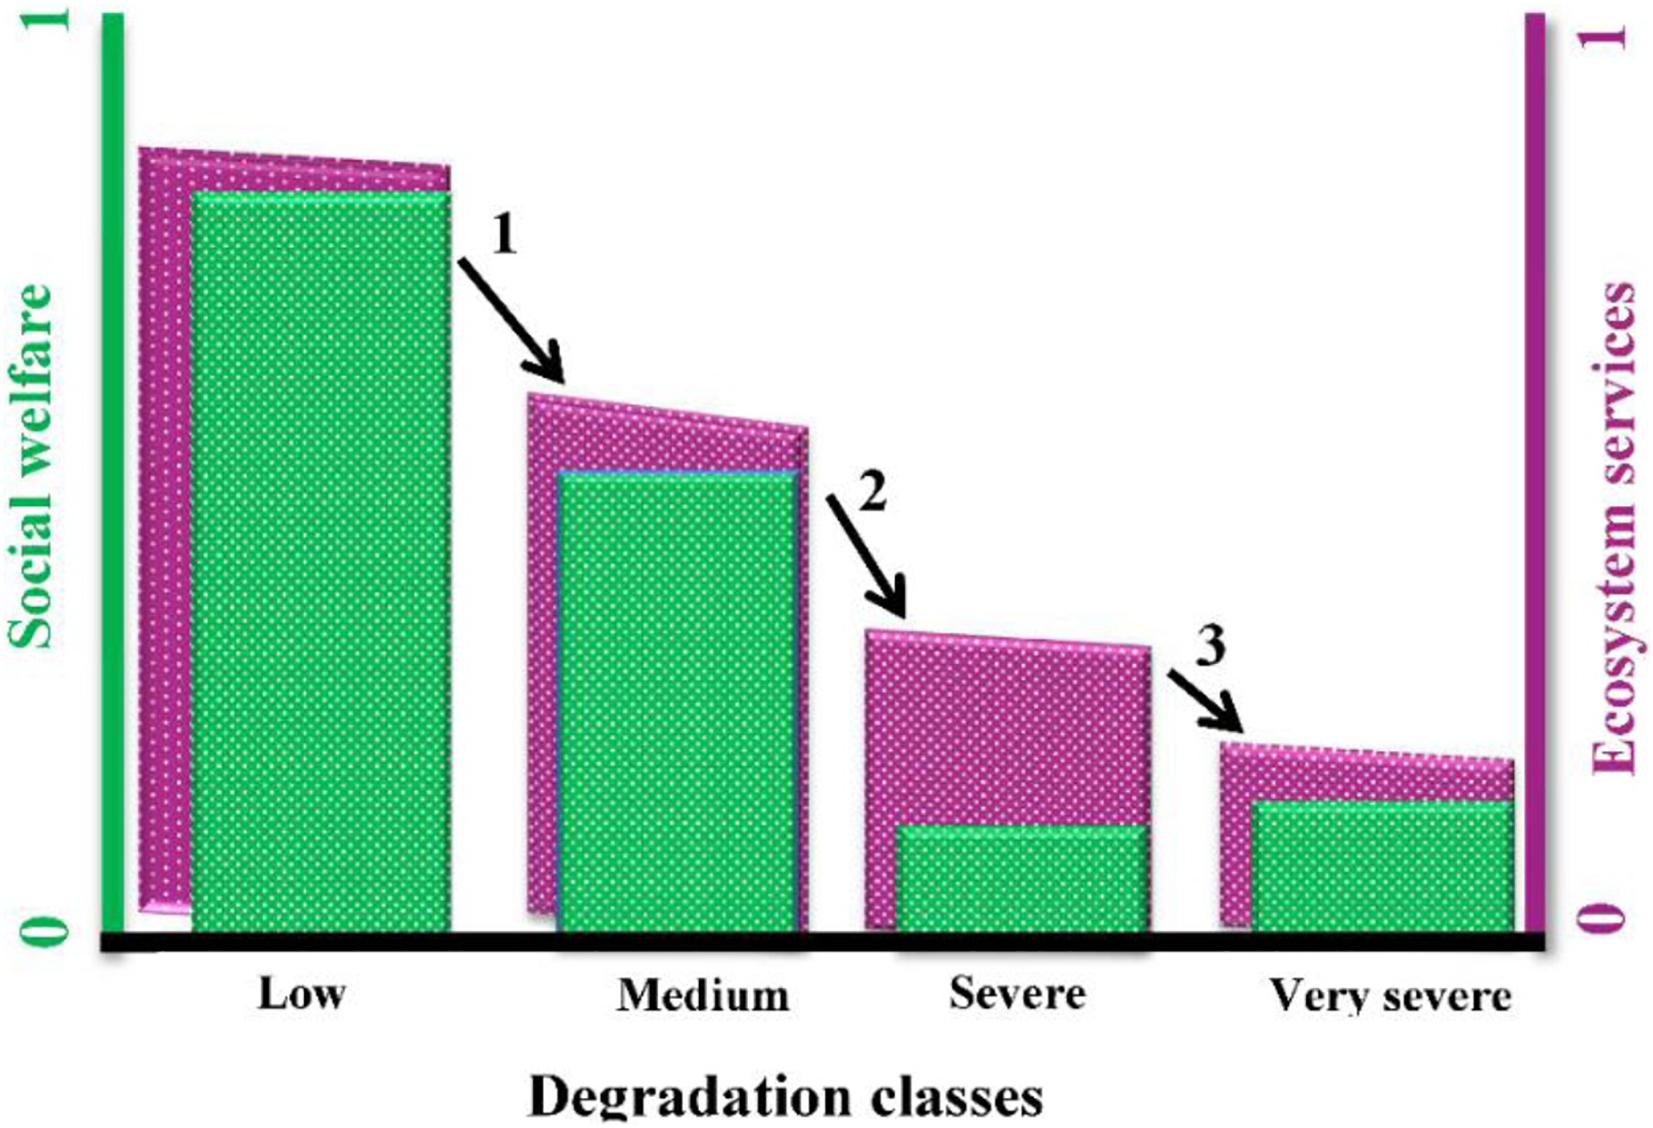
Figure 6. Relative loss of ecosystem services and social well-being under the degradation classes.
The result showed that Wilks’ lambda was not significant for 60% of the independent variables so that they were removed from the distinction analysis (Table 7). Soil fertility, water yield, food, forage, land tenure, and scenic beauty were important variables to discriminate the degradation classes based on the structure coefficient (Table 8). The relative amounts of ecosystem services and social well-being in each of the degradation classes are shown in Figure 6. However, the ecosystem and social system declined 25 and 31% under pathway 1 and 18 and 31% under pathway 2. The social system (5%) declined less than the ecosystem (15%) under pathway 3.
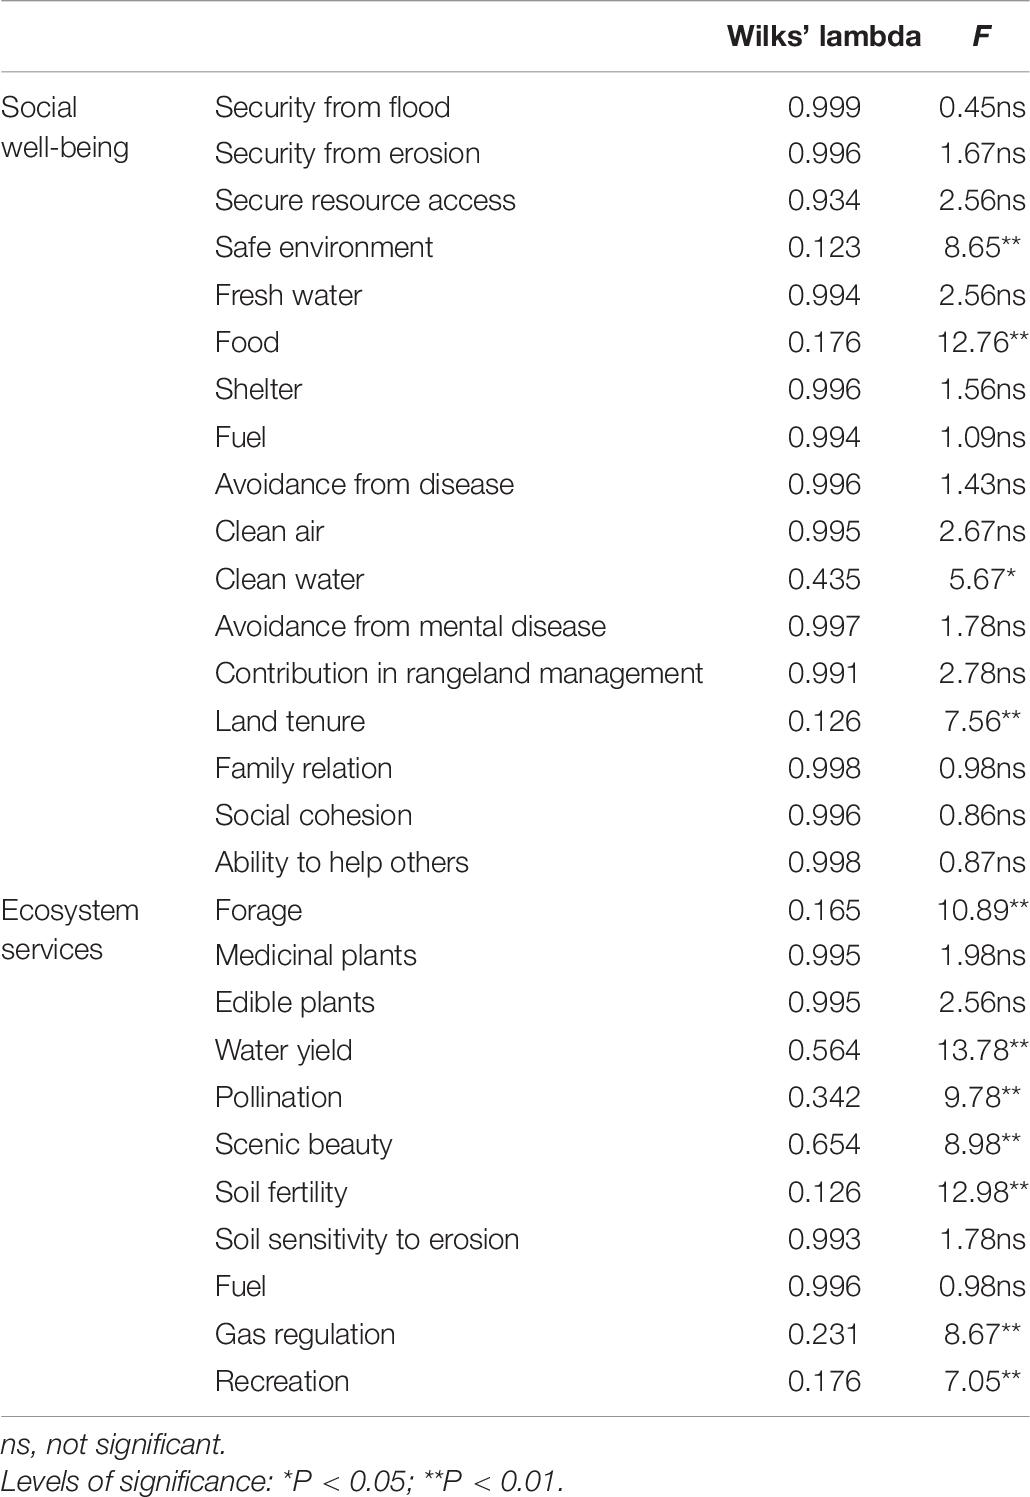
Table 7. Wilks’ lambda test for the mean of the social well-being index and ecosystem services in the degradation classes.
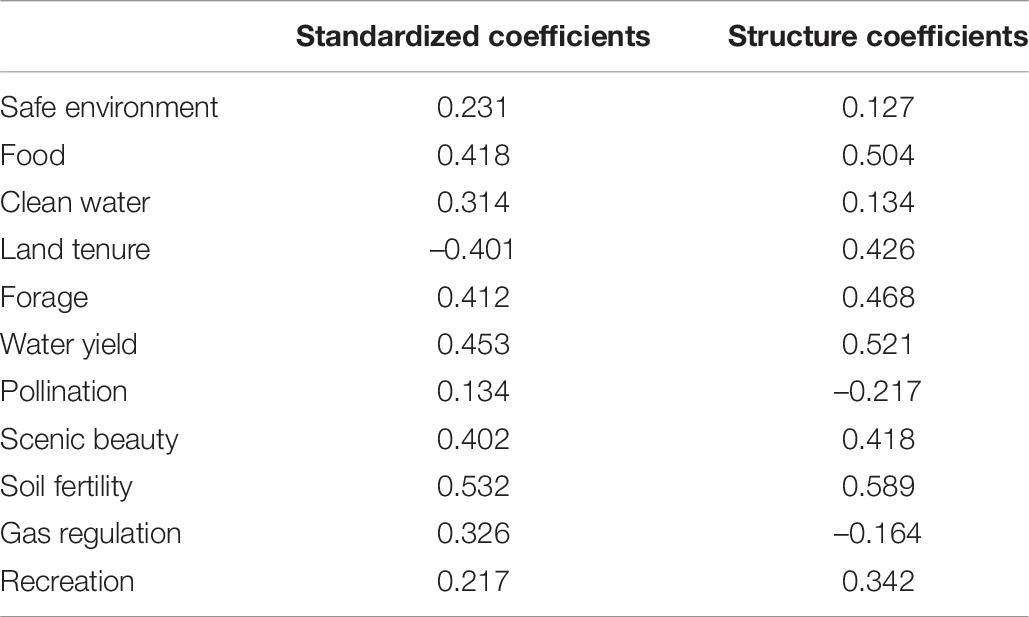
Table 8. Standardized and structure coefficients of the independent variables.
Non-metric multidimensional scaling indicated that negligible degradation is related to climatic and topographical factors. There was a relation between medium degradation with plant composition, severe degradation with loss of ecosystem services, and very severe degradation with agriculture (Figure 7).
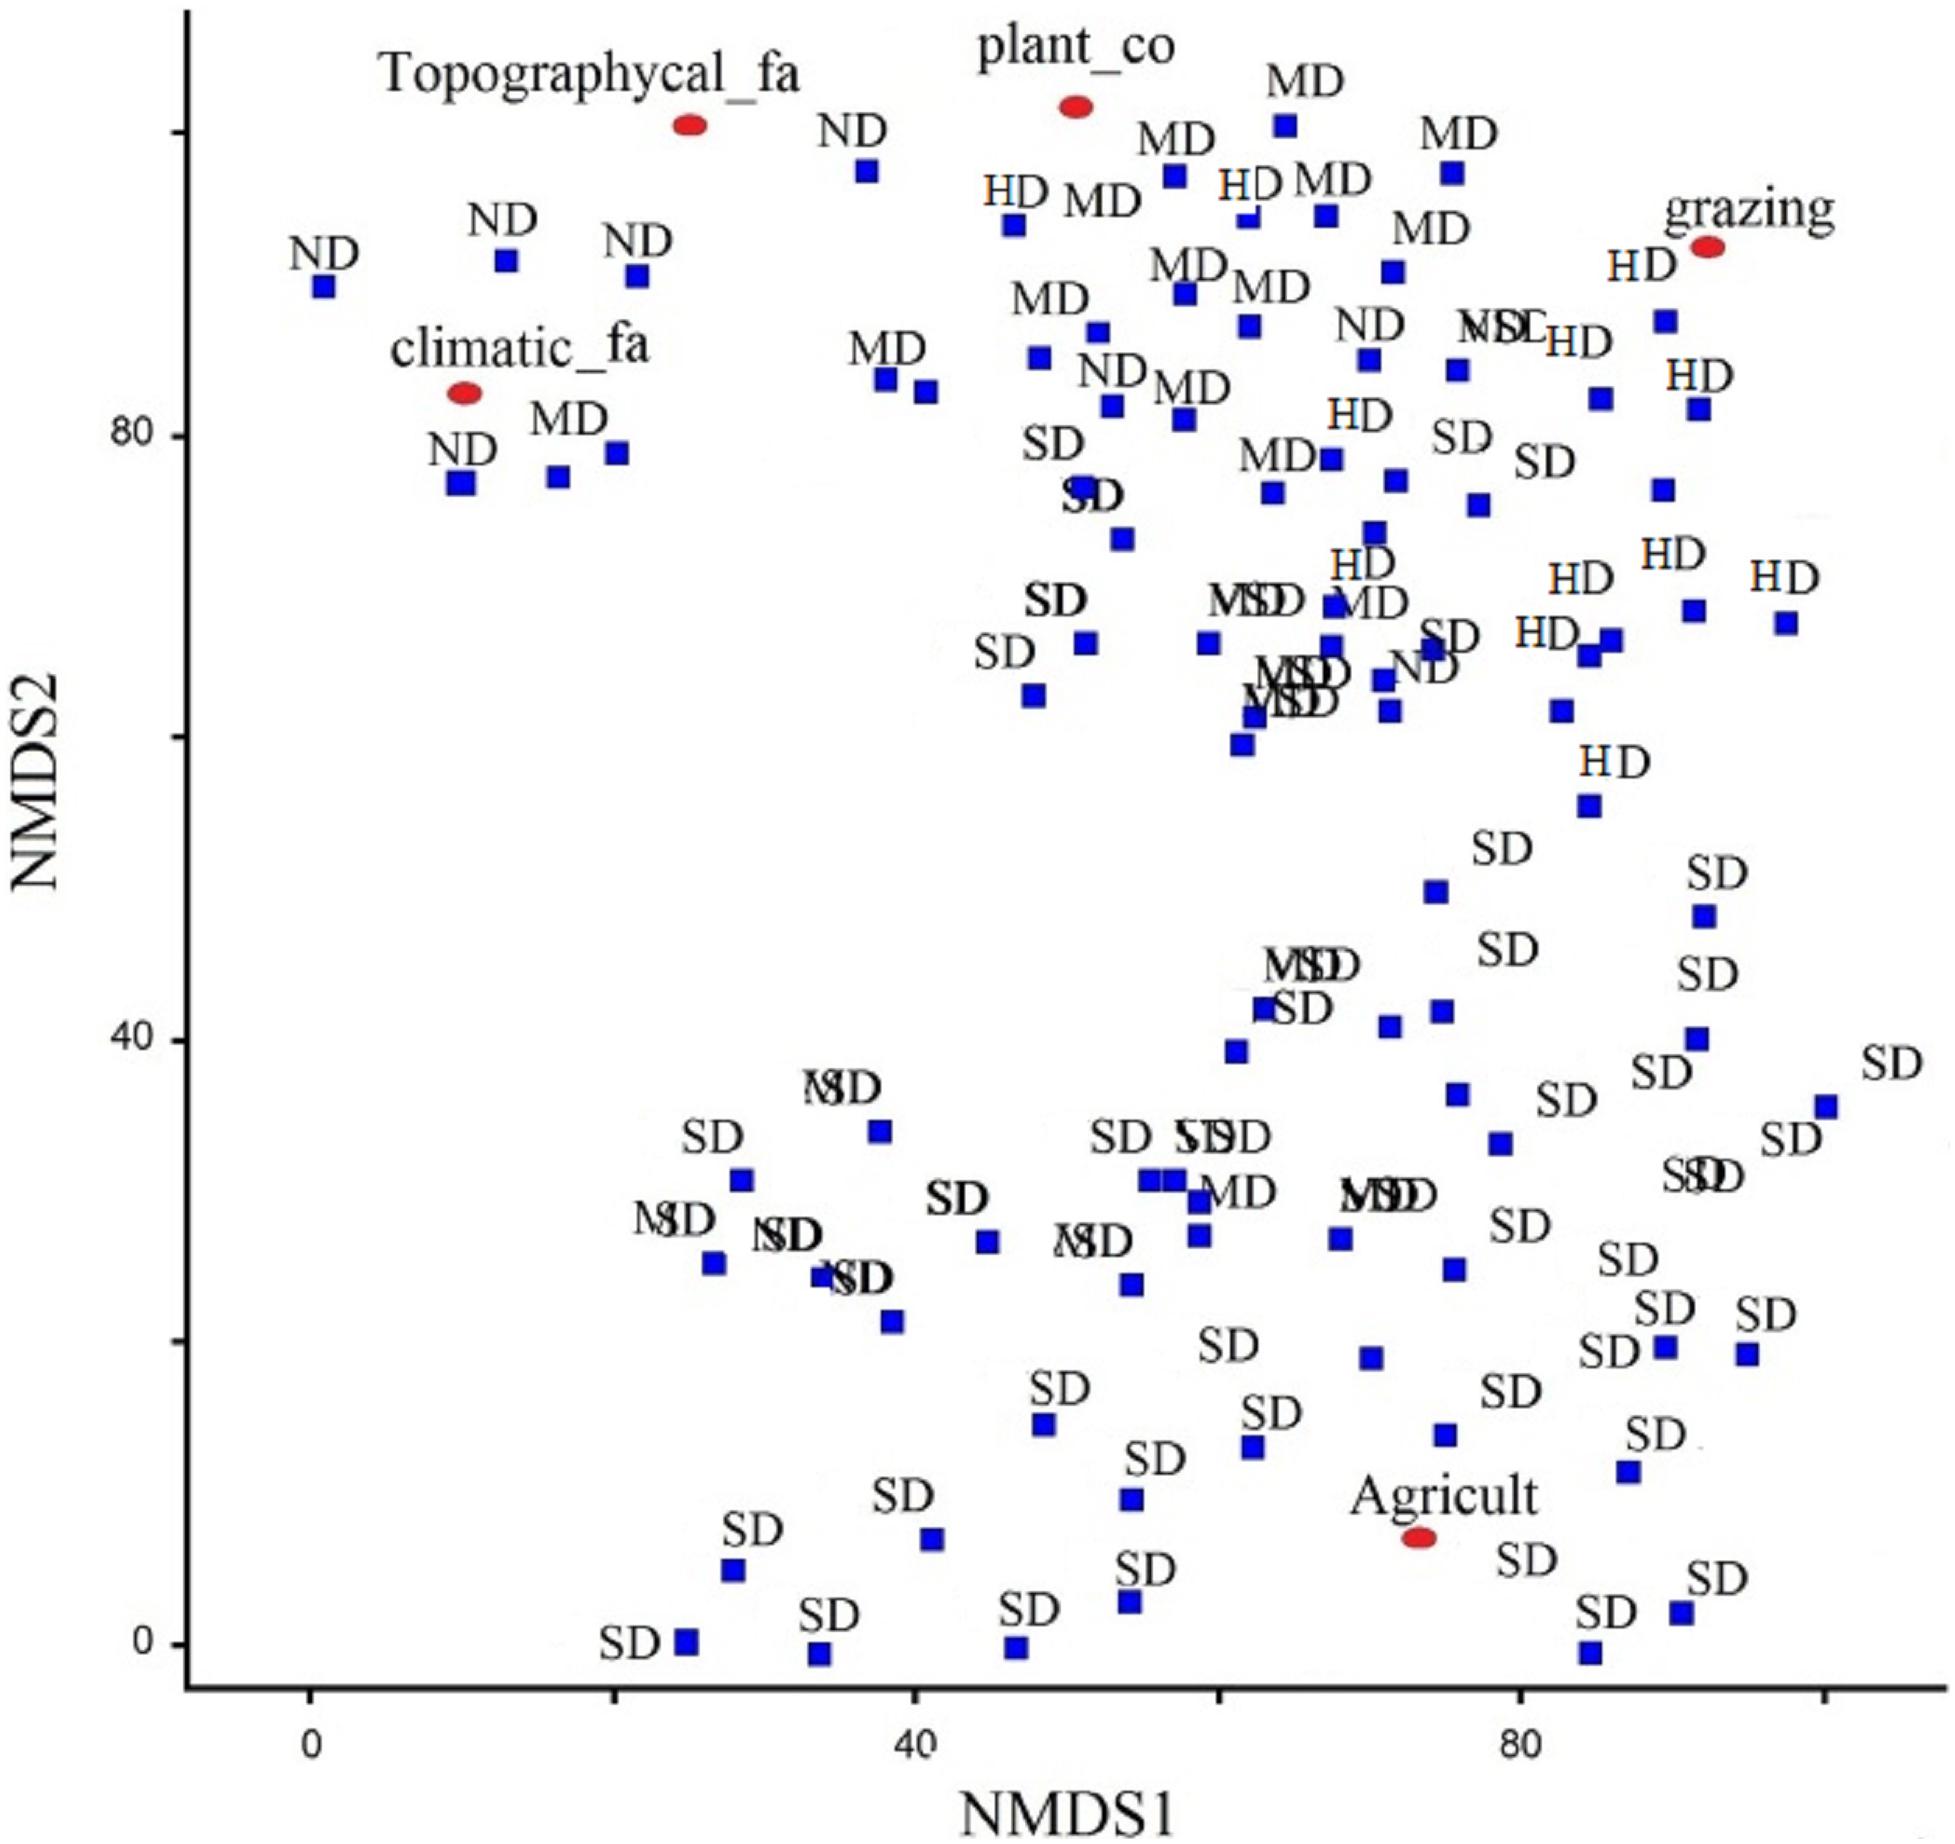
Figure 7. Non-metric multi-dimensional scaling (NMDS) ordination for relating degradation classes [negligible (ND), medium (MD), high (SD), and severe (SD)] with plant composition, grazing, agriculture, topographical and climatic factors.
Discussion
Changes of Ecosystem Services and Social Well-Being Under Degradation
In highland ecosystems, where degradation is negligible, ecosystem had the highest potential to provide most services under the influence of climatic factors such as rainfall. Past studies have also emphasized the importance of rainfall in providing ecosystem services (Fang et al., 2018). Less access of people to use resources may be the main reason for the negligible degradation in highlands. Where degradation was negligible, the supply of the most important ecosystem services (water yield, soil fertility, forage, and beauty) was in the highest amounts, providing well-being for pastorals.
Plant composition change resulted from human exploration, and grazing was the main driver of medium and severe degradation. Ecosystem structure change is a response to light exploitation (Jamsranjav et al., 2018). However, plant composition change declined some ecosystem services such as forage and medicinal plants through altering ecosystem processes (Zerga, 2015) and subsequently can decline pastorals’ and pastoral farmers’ well-being. Since food, as the main social well-being index, is extremely threatened with the loss ecosystem services, management should be focused on improving ecosystem services related to food in restoration plans in moderate and severe degradations.
Agriculture was the main driver of the very severe degradation zones located in lowlands of the studied region. Land use change is introduced as a main threat of ecosystems in a former study (e.g., Kusi et al., 2020). Agricultural ecosystems have services for providing edible plants as food and disservices that can be threats to other ecosystems (Shah et al., 2019). Agriculture fragments natural ecosystems and declines species richness (Ribeiro et al., 2019). Fragments can significantly alter the nutrient cycle (Gessner et al., 2010), plant production (Aguilar et al., 2006), decomposition process (Lewis, 2009), and pollination (Aguilar et al., 2006). Inorganic fertilizers and pesticides used in agriculture are also harmful to surrounding ecosystems (Shah et al., 2019). Social well-being was improved with developing agriculture in very severe degradation zones because agriculture has been historically important for increased food security in Iran (Khorami and Pierof, 2013). Hence, management will be faced with a conflict between restoring this zone where ecosystem services highly declined due to developed agriculture and the importance for social system with providing edible plants. There is a difference in people’s perception of agriculture expansion and ecosystem conservation (Wilhelm et al., 2020). Ecosystem services provided by natural ecosystems are greater than those from agriculture (Brown and MacLeod, 2011). Combining ecosystems and farmlands as agro-ecosystem can improve all ecosystem services (Kusi et al., 2020). Goh and Yanosky (2016) concluded that payment for retention ecosystem services may have some mitigation impacts on agriculture expansion.
The Most Important Social Well-Being Indices and Ecosystem Services Under Degradation Impact
Soil fertility, water yield, forage production, and aesthetic value are the most associated with degraded areas. Providing services had the most important role in determining land degradation compared to the other services because these services have a direct and more important impact on social well-being (MA, 2005). Water yield is one of the most important processes in semiarid and arid regions that changes under the influence of topography, geomorphology, and vegetation of the basin (Pan et al., 2013). Water yield had increased upstream due to elevation and rainfall increase, but anthropogenic activities were important drivers of the declining water yield downstream. Thus, the conversion of natural ecosystems to agricultural lands downstream has reduced the water yield through increasing evapotranspiration. Overgrazing is another factor reducing the water yield of rangeland ecosystems. Grazing intensity is also higher downstream due to the higher density of villages. Soil has been compacted due to livestock trampling, reducing soil permeability (Kutiel et al., 1999). Decreased vegetation and increased bare ground, as well as reduced microtopographies between vegetation patches, cause rainfall–runoff connections and increased water loss from the ecosystem (Stavi et al., 2008). Considering the role of water in providing other ecosystem services such as biodiversity (MA, 2005), reduction of the water yield can be introduced as the most important factor of ecosystem degradation.
Based on the results, soil organic matter was also a good factor to show the severity of degradation in the region. Soil organic matter facilitates the soil formation process by increasing soil porosity. It also increases soil productivity by increasing the infiltration rate (Langdale et al., 1992). Organic-rich soils are more resilient than soils with less organic matter. Vegetation cover is the main driver of soil organic matter (Zehe et al., 2005). The soil under the plant canopy has twice as much organic matter as bare soils (Vásquez-Méndez et al., 2010). Rangeland degradation, reduction of vegetation, and litter production reduce soil organic matter (Neary et al., 2009).
Forage production is another ecosystem service that is highly sensitive to land degradation. Habitat degradation causes species loss in the ecosystem through reduced environmental adaptation for plant growth, decreased production, and increased mortality (Mortelliti et al., 2010). Frequent grazing of palatable plants reduces their carbohydrate storage capacity and competitiveness in the ecosystem (Dormaar et al., 1989). Downstream, the dominant perennial species A. sieberi has declined due to ecosystem degradation, and the invasive species Salsola brachiate has become dominant. Changing plant composition and increasing invasive species are the major threats to ecosystem services (Wan et al., 2015). The dominance of annual plants has drastically reduced the quantity and the quality of forage in the ecosystem so that forage production is 10 times lower than that of upstream plant communities, where degradation is low due to less accessibility.
Aesthetic value was also one of the most important services in determining degraded areas. Aesthetic landscapes form a significant part of a community’s cultural heritage (Jessel, 2006). An ecosystem with a high aesthetic value has a significant impact on social well-being (Kurdoglu and Kurdoglu, 2010). When people have a positive experience of an ecosystem aesthetic, they are more inclined to protect it against degradation (Gobster et al., 2007). Land use change also strongly affects the ecosystem aesthetic value. Agricultural lands generally have a reduced biodiversity (flora and fauna) compared to natural landscapes (Wrbka et al., 2008). Although agricultural landscapes have a high texture harmony, they have reduced attractiveness compared to natural landscapes due to reduced patch diversity, especially in advanced agriculture due to the reduced complexity and mystery (Schirpke et al., 2013). Improper management such as severe grazing, logging, and burning leads to reduced vegetation and increased fragmentation in natural ecosystems. As open spaces increase within ecosystems, understanding their complexity and mystery decreases. These disturbances make the landscape to be perceived as chaotic. If the environmental setting is not orderly and easy to understand for people, they may feel insecure (Lee-Hsueh, 2018).
Food is the most important social well-being index related to the degradation zones. Forage production is the key ecosystem service in rangelands and plays an important role in the livelihood of the local pastorals in arid and semiarid rangelands (Easdale and Aguiar, 2012). The livestock industry costs about 1.4 trillion in the global economy (Thornton, 2010). Livestock grazing has a historical background in Iran, which accounts for 20% of the total non-oil GDP of the country (FAO, 2008) and is the only source of income for approximately 3 million pastorals. The decline in livestock income due to the reduction in the number of livestock in degraded rangelands must be offset by new management practices. Thornton (2010) concluded that the demand for livestock could be moderated with changing social–cultural values and increasing industrialization of livestock production.
The experience of freedom is the second most important criterion of social well-being, of which land ownership was the most important index based on locals’ viewpoints. Change of rangeland ownership and their management has caused many structural and social problems and hindered the development of rangelands with historical grazing in Asia and Africa (Bedunah and Angerer, 2012). In Iran, people owned rangelands before their nationalization in 1963. Rangelands were leased to other people by their owners (pastorals) who cared about their degradation (FAO, 2008). With the nationalization of rangelands, pastorals lost their ownership and there are no strict controls on rangelands. Participation is also important in locals’ views because they seek to improve their own livelihood, income, personal development, and self-confidence through impressing the managers in the implementation of development plans (Paul, 1987). Participation provides equal conditions for individuals to access resources (Cohen and Uphoff, 1980) and empowers local people (Baum et al., 2000). As a result, better and more acceptable decisions can be made. Pastoralists have developed very sophisticated methods for rangeland assessment and management that should be considered in rangeland management planning (Oba and Kotile, 2001). They have very valuable knowledge about rangelands gained through years of observation, experience, and herding (Mapinduzi et al., 2003). Pastorals are well aware of the rangeland degradation indicators and can assess the conditions of rangelands (Behmanesh et al., 2016).
Conclusion
The integrated socio-ecological method presented in this study is useful for land degradation assessment and the sustainable management of these areas. Ecosystems and social systems differently change in response to land degradation. In degraded areas where both ecosystems and social systems are damaged, management should focus on improving services that play a more important role in social well-being because ecosystem restoration will be more successful when people are willing to participate in the restoration programs. In contrast, where there is a trade-off between social well-being and ecosystem services, managers face great challenges. In these areas, a balance must be struck between meeting people’s food demands and providing other ecosystem services. In degraded areas, understanding the state of the social systems and ecosystem services helps planners to sustainably manage ecosystems in order to promote social well-being. The approach provided in this study can be recommended to managers and decision-makers to meet both the needs of the people and the preservation of ecosystems.
Data Availability Statement
The original contributions presented in the study are included in the article/supplementary materials, further inquiries can be directed to the corresponding author/s.
Author Contributions
MS contributed to the conceptualization, methodology, software, writing the original draft preparation, reviewing, and editing. AKM helped with the conceptualization, data collection, data analyses, writing the original draft preparation, reviewing, and editing. Both authors contributed to the article and approved the submitted version.
Conflict of Interest
The authors declare that the research was conducted in the absence of any commercial or financial relationships that could be construed as a potential conflict of interest.
References
Aguilar, R., Ashworth, L., Galetto, L., and Aizen, M. A. (2006). Plant reproductive susceptibility to habitat fragmentation: review and synthesis through a meta-analysis. Ecol. Lett. 9, 968–980. doi: 10.1111/j.1461-0248.2006.00927.x
Alcamo, J., Ash, N. J., Butler, C. D., Barid Calicott, J., Capistrano, D., Carpenter, S. R., et al. (2005). Ecosystems and Human Well Being: A Framework for Assessment. Millennium Ecosystem Assessment Series. Washington, DC: Island Press.
Ariapour, A., Karami, K., and Sadr, A. (2014). Assessment of water resource potential for common use of cow and goat by GIS (Case study: Boroujerd Rangeland, Sarab Sefid, Iran). IOP Conf. Ser. Earth Environ. Sci. 20:12001. doi: 10.1088/1755-1315/20/1/012001
Baum, F. E., Bush, R. A., Modra, C. C., Murray, C. J., Cox, E. M., Alexander, K. M., et al. (2000). Epidemiology of participation: an Australian community study. J. Epidemiol. Commun. Health 54, 414–423. doi: 10.1136/jech.54.6.414
Bedunah, D. J., and Angerer, J. P. (2012). Rangeland Degradation, Poverty, and Conflict: How Can Rangeland Scientists Contribute to Effective Responses and Solutions? Rangel. Ecol. Manag. 65, 606–612. doi: 10.2111/rem-d-11-00155.1
Behmanesh, B., Barani, H., Abedi Sarvestani, A., Reza Shahraki, M., and Sharafatmandrad, M. (2016). Rangeland degradation assessment: A new strategy based on the ecological knowledge of indigenous pastoralists. Solid Earth 7:611. doi: 10.5194/se-7-611-2016
Brown, J., and MacLeod, N. (2011). A site-based approach to delivering rangeland ecosystem services. Rangel. J. 33:99. doi: 10.1071/rj11006
Canadell, J., Jackson, R. B., Ehleringer, J. B., Mooney, H. A., Sala, O. E., and Schulze, E.-D. (1996). Maximum rooting depth of vegetation types at the global scale. Oecologia 108, 583–595. doi: 10.1007/bf00329030
Chen, Y., Wang, W., Guan, Y., Liu, F., Zhang, Y., Du, J., et al. (2020). An integrated approach for risk assessment of rangeland degradation: A case study in Burqin County, Xinjiang, China. Ecol. Indic. 113:106203. doi: 10.1016/j.ecolind.2020.106203
Cohen, J. M., and Uphoff, N. T. (1980). Participation’s place in rural development: Seeking clarity through specificity. World Dev. 8, 213–235. doi: 10.1016/0305-750x(80)90011-x
Davies, K. W., Bates, J. D., Svejcar, T. J., and Boyd, C. S. (2010). Effects of Long-Term Livestock Grazing on Fuel Characteristics in Rangelands: An Example From the Sagebrush Steppe. Rangel. Ecol. Manag. 63, 662–669. doi: 10.2111/rem-d-10-00006.1
Dormaar, J. F., Smoliak, S., and Willms, W. D. (1989). Vegetation and Soil Responses to Short-Duration Grazing on Fescue Grasslands. J. Range Manag. 42:252. doi: 10.2307/3899484
Dramstad, W. E., Tveit, M. S., Fjellstad, W. J., and Fry, G. L. A. (2006). Relationships between visual landscape preferences and map-based indicators of landscape structure. Landsc. Urban Plan. 78, 465–474. doi: 10.1016/j.landurbplan.2005.12.006
Dyksterhuis, E. J. (1949). Condition and Management of Range Land Based on Quantitative Ecology. J. Range Manag. 2:104. doi: 10.2307/3893680
Easdale, M. H., and Aguiar, M. R. (2012). Regional forage production assessment in arid and semi-arid rangelands – A step towards social–ecological analysis. J. Arid Environ. 83, 35–44. doi: 10.1016/j.jaridenv.2012.03.002
Fang, J., Song, H., Zhang, Y., Li, Y., and Liu, J. (2018). Climate-dependence of ecosystem services in a nature reserve in northern China. PLoS One 13:e0192727. doi: 10.1371/journal.pone.0192727
FAO (2008). AQUASTAT Country Profile – Iran (Islamic Republic of). Rome: Food and Agriculture Organization of the United Nations (FAO).
Favretto, N., Stringer, L. C., Dougill, A. J., Dallimer, M., Perkins, J. S., Reed, M. S., et al. (2016). Multi-Criteria Decision Analysis to identify dryland ecosystem service trade-offs under different rangeland land uses. Ecosyst. Serv. 17, 142–151. doi: 10.1016/j.ecoser.2015.12.005
Feyznia, S. (1995). Rocks strength against erosion factors in different climates of Iran. J. Nat. Resour. Iran 47, 95–116.
Fotopoulos, C., Tzouvelekas, V., and Papanagiotou, E. (2000). The Livestock Sector in Greece: Structural Problems, Policy Measures and Farm Productivity. Athens, GR: Stamoulis Publications.
Gavrilovic, Z. (1988). The use of an empirical method (erosion potential method) for calculating sediment production and transportation in unstudied or torrential streams, International Conference of RiverRegime, 18–20 May, Wallingford, England, Wallingford, 411–422.
Gessner, M. O., Swan, C. M., Dang, C. K., McKie, B. G., Bardgett, R. D., Wall, D. H., et al. (2010). Diversity meets decomposition. Trends Ecol. Evol. 25, 372–380. doi: 10.1016/j.tree.2010.01.010
Ghassemi-Khademi, T. (2014). A review of the biological status of Iranian dwarf honey bees (Apis florea). J. Middle East Appl. Sci. Technol. 13, 508–513.
Gobster, P. H., Nassauer, J. I., Daniel, T. C., and Fry, G. (2007). The shared landscape: what does aesthetics have to do with ecology? Landsc. Ecol. 22, 959–972. doi: 10.1007/s10980-007-9110-x
Goebel, C. J., and Cook, C. W. (1960). Effect of Range Condition on Plant Vigor, Production, and Nutritive Value of Forage. J. Range Manag. 13:307. doi: 10.2307/3894786
Goh, T. Y., and Yanosky, A. (2016). Payment for Ecosystem Services works, but not exactly in the way it was designed. Glob. Ecol. Conserv. 5, 71–87. doi: 10.1016/j.gecco.2015.11.005
Greenleaf, S. S., Williams, N. M., Winfree, R., and Kremen, C. (2007). Bee foraging ranges and their relationship to body size. Oecologia 153, 589–596. doi: 10.1007/s00442-007-0752-9
Guo, Z., Xiao, X., Gan, Y., and Zheng, Y. (2001). Ecosystem functions, services and their values – a case study in Xingshan County of China. Ecol. Econ. 38, 141–154. doi: 10.1016/s0921-8009(01)00154-9
Himes, A., Puettmann, K., and Muraca, B. (2020). Trade-offs between ecosystem services along gradients of tree species diversity and values. Ecosyst. Serv. 44:101133. doi: 10.1016/j.ecoser.2020.101133
Jamsranjav, C., Reid, R. S., Fernández-Giménez, M. E., Tsevlee, A., Yadamsuren, B., and Heiner, M. (2018). Applying a dryland degradation framework for rangelands: the case of Mongolia. Ecol. Appl. 28, 622–642. doi: 10.1002/eap.1684
Jessel, B. (2006). Elements, characteristics and character – Information functions of landscapes in terms of indicators. Ecol. Indic. 6, 153–167. doi: 10.1016/j.ecolind.2005.08.009
Jonckheere, I., Fleck, S., Nackaerts, K., Muys, B., Coppin, P., Weiss, M., et al. (2004). Review of methods for in situ leaf area index determination. Agric. For. Meteorol. 121, 19–35. doi: 10.1016/j.agrformet.2003.08.027
Kangas, J. (1992). Multiple−use planning of forest resources by using the analytic hierarchy process. Scand. J. For. Res. 7, 259–268. doi: 10.1080/02827589209382718
Khiralla, N. I. A. (2013). Monitoring and Assessment of Rangeland in Semi Arid Areas of Sudan Using Remote Sensing Techniques North Kordofan State. Ph.D. theses. Forestry and Range Science Sudan University of Science and Technology, Mile.
Khorami, A. R., and Pierof, D. S. (2013). The Role of Agriculture in Iran’s Economic Development. Res. J. Appl. Sci. Eng. Technol. 6, 1928–1939. doi: 10.19026/rjaset.6.3806
Kooch, Y., Moghimian, N., Wirth, S., and Noghre, N. (2020). Effects of grazing management on leaf litter decomposition and soil microbial activities in northern Iranian rangeland. Geoderma 361:114100. doi: 10.1016/j.geoderma.2019.114100
Kurdoglu, O., and Kurdoglu, B. C. (2010). Determining recreational, scenic, and historical–cultural potentials of landscape features along a segment of the ancient Silk Road using factor analyzing. Environ. Monit. Assess. 170, 99–116. doi: 10.1007/s10661-009-1219-8
Kusi, K. K., Khattabi, A., Mhammdi, N., and Lahssini, S. (2020). Prospective evaluation of the impact of land use change on ecosystem services in the Ourika watershed, Morocco. Land Use Policy 97:104796. doi: 10.1016/j.landusepol.2020.104796
Kutiel, P., Zhevelev, H., and Harrison, R. (1999). The effect of recreational impacts on soil and vegetation of stabilised Coastal Dunes in the Sharon Park, Israel. Ocean Coast. Manag. 42, 1041–1060. doi: 10.1016/s0964-5691(99)00060-5
Langdale, G. W., West, L. T., Bruce, R. R., Miller, W. P., and Thomas, A. W. (1992). Restoration of eroded soil with conservation tillage. Soil Technol. 5, 81–90. doi: 10.1016/0933-3630(92)90009-p
Lee-Hsueh, L. (2018). Ecological Aesthetics: Design Thinking to Landscape Beauty with Healthy Ecology. Landsc. Archit. Sense Places Model. Appl. 2018:73615. doi: 10.5772/intechopen.73615
Lewis, O. T. (2009). Biodiversity change and ecosystem function in tropical forests. Basic Appl. Ecol. 10, 97–102. doi: 10.1016/j.baae.2008.08.010
Li, J., Ren, Z., and Zhou, Z. (2006). Ecosystem services and their values: a case study in the Qinba mountains of China. Ecol. Res. 21, 597–604. doi: 10.1007/s11284-006-0148-z
Liebig, M. A., Dong, X., McLain, J. E. T., and Dell, C. J. (2012). Greenhouse Gas Flux from Managed Grasslands in the U.S. Manag. Agric. Greenh. Gases 2012:183–202. doi: 10.1016/b978-0-12-386897-8.00011-5
Liu, J., Chen, X., Lin, H., Liu, H., and Song, H. (2013). A simple geomorphic-based analytical model for predicting the spatial distribution of soil thickness in headwater hillslopes and catchments. Water Resour. Res. 49, 7733–7746. doi: 10.1002/2013wr013834
Lonsdorf, E., Kremen, C., Ricketts, T., Winfree, R., Williams, N., and Greenleaf, S. (2009). Modelling pollination services across agricultural landscapes. Ann. Bot. 103, 1589–1600. doi: 10.1093/aob/mcp069
Maczko, K., Tanaka, J. A., Breckenridge, R., Hidinger, L., Heintz, H. T., Fox, W. E., et al. (2011). Rangeland Ecosystem Goods and Services: Values and Evaluation of Opportunities for Ranchers and Land Managers. Rangelands 33, 30–36. doi: 10.2111/1551-501x-33.5.30
Mapinduzi, A. L., Oba, G., Weladji, R. B., and Colman, J. E. (2003). Use of indigenous ecological knowledge of the Maasai pastoralists for assessing rangeland biodiversity in Tanzania. Afr. J. Ecol. 41, 329–336. doi: 10.1111/j.1365-2028.2003.00479.x
Mitchell, R. C., and Carson, R. T. (1989). Using Surveys to Value Public Goods: The Contingent Valuation Method. Washington, DC: Resources for the Future, 488.
Moghaddam, M. R. (1977). Reseda lutea: A Multipurpose Plant for Arid and Semiarid Lands. J. Range Manag. 30:71. doi: 10.2307/3897343
Mortelliti, A., Amori, G., and Boitani, L. (2010). The role of habitat quality in fragmented landscapes: a conceptual overview and prospectus for future research. Oecologia 163, 535–547. doi: 10.1007/s00442-010-1623-3
National Statistics Center of Iran (2017). General population and housing census of Bardsir city. Tehran: National Statistics Center of Iran.
Neary, D. G., Ice, G. G., and Jackson, C. R. (2009). Linkages between forest soils and water quality and quantity. For. Ecol. Manage. 258, 2269–2281. doi: 10.1016/j.foreco.2009.05.027
Nelson, D. W., and Sommers, L. E. (1983). Total Carbon, Organic Carbon, and Organic Matter. SSSA B. Ser. 961–1010. doi: 10.2136/sssabookser5.3.c34
Oba, G., and Kotile, D. G. (2001). Assessments of landscape level degradation in southern Ethiopia: pastoralists versus ecologists. L. Degrad. Dev. 12, 461–475. doi: 10.1002/ldr.463
Pan, Y., Xu, Z., and Wu, J. (2013). Spatial differences of the supply of multiple ecosystem services and the environmental and land use factors affecting them. Ecosyst. Serv. 5, 4–10. doi: 10.1016/j.ecoser.2013.06.002
Payke, D. A., Herrick, J. E., Shaver, P., and Pellant, M. (2002). Rangeland health attributes and indicators for qualitative assessment. J. Range Manag. 55, 584–597. doi: 10.2458/azu_jrm_v55i6_pyke
Reed, M. S., and Dougill, A. J. (2010). Linking degradation assessment to sustainable land management: A decision support system for Kalahari pastoralists. J. Arid Environ. 74, 149–155. doi: 10.1016/j.jaridenv.2009.06.016
Ribeiro, J. C. T., Nunes-Freitas, A. F., Fidalgo, E. C. C., and Uzêda, M. C. (2019). Forest fragmentation and impacts of intensive agriculture: Responses from different tree functional groups. PLoS One 14:e0212725. doi: 10.1371/journal.pone.0212725
Saaty, T. L. (1980). The Analytical Hierarchy Process: Planning Priority Setting Resource Allocation. New York, NY: Hill Book Co.
Santarém, F., Saarinen, J., and Brito, J. C. (2020). Mapping and analysing cultural ecosystem services in conflict areas. Ecol. Indic. 110:105943. doi: 10.1016/j.ecolind.2019.105943
Schägner, J. W., Ganguli, A. C. M., Jeffrey, S. S., and Herrick, E. (2020). Measuring land potential and human impacts in rangelands. Encycl. Worlds Biomes 2020, 99–106. doi: 10.1016/B978-0-12-409548-9.12421-2
Schallner, J. W., Ganguli, A. C., Stovall, M. S., and Herrick, J. E. (2020). Measuring Land Potential and Human Impacts in Rangelands. Encycl. World Biomes 2020, 99–106. doi: 10.1016/b978-0-12-409548-9.12421-2
Schenk, H. J., and Jackson, R. B. (2002). Rooting depths, lateral root spreads and below−ground/above−ground allometries of plants in water−limited ecosystems. J. Ecol. 90, 480–494. doi: 10.1046/j.1365-2745.2002.00682.x
Schirpke, U., Tasser, E., and Tappeiner, U. (2013). Predicting scenic beauty of mountain regions. Landsc. Urban Plan. 111, 1–12. doi: 10.1016/j.landurbplan.2012.11.010
Schirpke, U., Timmermann, F., Tappeiner, U., and Tasser, E. (2016). Cultural ecosystem services of mountain regions: Modelling the aesthetic value. Ecol. Indic. 69, 78–90. doi: 10.1016/j.ecolind.2016.04.001
Shah, S. M., Liu, G., Yang, Q., Wang, X., Casazza, M., Agostinho, F., et al. (2019). Emergy-based valuation of agriculture ecosystem services and dis-services. J. Clean. Prod. 239:118019. doi: 10.1016/j.jclepro.2019.118019
Soil Survey Staff (1994). Keys to Soil Taxonomy, 6th Edn, Washington, DC: United States Department of Agriculture, Soil Conservation Service.
Stavi, I., Ungar, E. D., Lavee, H., and Sarah, P. (2008). Surface microtopography and soil penetration resistance associated with shrub patches in a semiarid rangeland. Geomorphology 94, 69–78. doi: 10.1016/j.geomorph.2007.05.008
Summers, J. K., Smith, L. M., Case, J. L., and Linthurst, R. A. (2012). A review of the elements of human well-being with an emphasis on the contribution of ecosystem services. Ambio 41, 327–340. doi: 10.1007/s13280-012-0256-7
Tashakkori, A., and Teddlie, C. (2010). SAGE Handbook of Mixed Methods in. Soc. Behav. Res. 2010, 431–468. doi: 10.4135/9781506335193
Tesfa, T. K., Tarboton, D. G., Chandler, D. G., and McNamara, J. P. (2009). Modeling soil depth from topographic and land cover attributes. Water Resour. Res. 45:7474. doi: 10.1029/2008wr007474
Thornton, P. K. (2010). Livestock production: recent trends, future prospects. Philos. Trans. R. Soc. Lond. B. Biol. Sci. 365, 2853–2867. doi: 10.1098/rstb.2010.0134
Tongway, D., and Hindley, N. (2004). Landscape function analysis: a system for monitoring rangeland function. Afr. J. Range Forage Sci. 21, 109–113. doi: 10.2989/10220110409485841
Toopchi-Khosroshahi, Zh., and Lotfalizadeh, H. A. (2011). Identification of honey plants and their attractiveness to honey bee in Kandovan, Northwest of Iran. Bihar. Biol. 5, 36–41.
Tsai, C. C., Chen, Z. S., Duh, C. T., and Horng, F. W. (2001). Prediction of soil depth using a soil-landscape regression model: a case study on forest soils in southern Taiwan. Proc. Natl. Sci. Counc. Repub. China Part B Life Sci. 25, 34–39.
Van den Berg, A. E., and Koole, S. L. (2006). New wilderness in the Netherlands: An investigation of visual preferences for nature development landscapes. Landsc Urban Plan. 78, 362–372. doi: 10.1016/j.landurbplan.2005.11.006
Vásquez-Méndez, R., Ventura-Ramos, E., Oleschko, K., Hernández-Sandoval, L., Parrot, J.-F., and Nearing, M. A. (2010). Soil erosion and runoff in different vegetation patches from semiarid Central Mexico. CATENA 80, 162–169. doi: 10.1016/j.catena.2009.11.003
Wan, L., Ye, X., Lee, J., Lu, X., Zheng, L., and Wu, K. (2015). Effects of urbanization on ecosystem service values in a mineral resource-based city. Habitat Int. 46, 54–63. doi: 10.1016/j.habitatint.2014.10.020
Wilhelm, J. A., Smith, R. G., Jolejole-Foreman, M. C., and Hurley, S. (2020). Resident and stakeholder perceptions of ecosystem services associated with agricultural landscapes in New Hampshire. Ecosyst. Serv. 45:101153. doi: 10.1016/j.ecoser.2020.101153
Wrbka, T., Schindler, S., Pollheimer, M., Schmitzberger, I., and Peterseil, J. (2008). Impact of the Austrian Agri-environmental scheme on diversity of landscapes, plants and birds. Commun. Ecol. 9, 217–227. doi: 10.1556/comec.9.2008.2.11
Yakhshaki, A. (1977). An Introduction on National and Forest Parks of Iran. Tehran: Tehran University Press, 148.
Zehe, E., Becker, R., Bárdossy, A., and Plate, E. (2005). Uncertainty of simulated catchment runoff response in the presence of threshold processes: Role of initial soil moisture and precipitation. J. Hydrol. 315, 183–202. doi: 10.1016/j.jhydrol.2005.03.038
Zerga, B. (2015). Rangeland degradation and restoration: a global perspective. Point J. Agric. Biotechnol. Res. 1, 037–054.
Zhang, L., Dawes, W. R., and Walker, G. R. (2001). Response of mean annual evapotranspiration to vegetation changes at catchment scale. Water Resour. Res. 37, 701–708. doi: 10.1029/2000wr900325
Keywords: ecosystem, degradation, rangeland, social well-being, vegetation
Citation: Sharafatmandrad M and Khosravi Mashizi A (2021) Linking Ecosystem Services to Social Well-Being: An Approach to Assess Land Degradation. Front. Ecol. Evol. 9:654560. doi: 10.3389/fevo.2021.654560
Received: 16 January 2021; Accepted: 25 March 2021;
Published: 21 May 2021.
Edited by:
Nadia S. Santini, National Autonomous University of Mexico, MexicoReviewed by:
Stephen M. Mureithi, University of Nairobi, KenyaRoberto Lindig-Cisneros, Universidad Nacional Autonoma de México, IIES, Campus Morelia, Mexico
Copyright © 2021 Sharafatmandrad and Khosravi Mashizi. This is an open-access article distributed under the terms of the Creative Commons Attribution License (CC BY). The use, distribution or reproduction in other forums is permitted, provided the original author(s) and the copyright owner(s) are credited and that the original publication in this journal is cited, in accordance with accepted academic practice. No use, distribution or reproduction is permitted which does not comply with these terms.
*Correspondence: Mohsen Sharafatmandrad, bW9oc2VuLnNoYXJhZmF0bWFuZHJhZEB1amlyb2Z0LmFjLmly