 Jorge E. Rabinovich
94% of researchers rate our articles as excellent or good
Learn more about the work of our research integrity team to safeguard the quality of each article we publish.
Find out more
ORIGINAL RESEARCH article
Front. Ecol. Evol., 23 February 2021
Sec. Models in Ecology and Evolution
Volume 9 - 2021 | https://doi.org/10.3389/fevo.2021.651683
This article is part of the Research TopicApplications of Machine Learning to Evolutionary Ecology DataView all 5 articles
Populations are permanently evolving and their evolution will influence their survival and reproduction, which will then alter demographic parameters. Several phenotypic, life history and environmental variables are known to be related to fitness measures. The goal of this article was to look into the possible types of those relationships in insects of the subfamily Triatominae, vectors of Trypanosoma cruzi, the causative agent of Chagas disease. After an exhaustive literature review of 7,207 records of publications referring exclusively to all possible features of the triatomines, using 15 keywords those records were reduced to 2,968 publications, that were analyzed individually; after deleting those publications that did not have the data in quantitative form as needed for the objective of this article, I found that 171 papers were adequate for the present analysis. From them I compiled a dataset of 11 variables and 90 cases from 36 triatomine species. Those variables included four environmental, two life cycle, and four morphological variables, and one demographic parameter: a fitness measure (the population intrinsic rate of natural increase, r0), used as dependent variable. However, the relationship between T. cruzi and its vector host was not included in this analysis despite triatomine-T. cruzi interactions constitute an important factor in the evolution of triatomine’s life history. I resorted to the Random Forest method as a machine learning approach for the analysis of this dataset, and found that –in addition to the triatomine species themselves– only the two life cycle variables (mean development time from egg to adult, and mean fecundity, expressed as the average number of female eggs laid per female per day) were statistically significant in determining fitness (r0). The machine learning approach used in the analysis provided a similar but deeper insight into these relationships than classical regression. Except for an analysis on senescence, this is the first study in triatomines addressing these questions. These results will be useful for other theoretical optimization approaches (frequency-dependence, density-dependence, evolutionary game theory, and adaptive dynamics), thus contributing to the theoretical framework for interpreting the succession of stages in insect adaptations, a framework yet to be constructed.
Populations of different species are permanently evolving and their evolution will influence the survival and reproduction of its members, ultimately influencing demographic parameters (Hendry, 2015). Morphological features (particularly body size in ectotherms), life cycle traits, demographic parameters, and characteristics of the environment, are intricately related, and the evolution of such a relationship is extremely complex. For decades the heritability of life history traits has been investigated, particularly those more directly related to demographic parameters such as fitness. Mousseau and Roff (1987) found that, in wild and outbred animal populations, life history traits generally possess lower heritabilities than morphological traits, while behavioral and physiological traits have a heritability intermediate between life history and morphological traits; thus, high heritabilities seem to be maintained within natural populations even for life history traits, believed to be under strong selection. Importantly, phenotypic selection seems to work differently between wild and captive conditions (Kingsolver et al., 2001), while a significant part of the data available relating morphology, demography, life cycle, and environmental conditions comes from laboratory-reared animals.
The Triatominae (Hemiptera: Reduviidae), commonly known as kissing bugs, are vectors of the parasite Trypanosoma cruzi (Chagas, 1909), the causative agent of Chagas disease. This group of insects feeds primarily on vertebrate blood after evolving from predatory reduviid bugs, most likely in the New World; triatomines diversified extensively across the Americas and in parts of Asia and Oceania, being now represented by over 130 species (Araujo Monteiro et al., 2018). In part for this reason (triatomines are the main mode of transmission of T. cruzi), they have been studied for over a century, and there is a wealth of information about this insect group. It is reasonable to expect that in triatomines, as in most other animal groups, there is a relationship between some life cycle and demographic parameters and environmental factors. Below I summarize some strongly suggestive evidence of these relationships in triatomines (without intending to make a complete review of the topic). The analysis of these relationships would not only contribute to the theoretical framework of life history evolution, but also provide knowledge useful for the control of Chagas disease transmission: triatomine species have shown to be in permanent adaptation to environmental modifications, evidenced by changes in phenotype, life history, and population dynamics. Thus, I think that a literature review of the plasticity of those features in triatomines is necessary, followed by an inquiry into their possible relationships. This inquiry, because of data availability, was restricted to the adult stages of the triatomines. Despite important relationships between morphometry and demographic parameters exist along the ontogenic process. E.g., Bello-Bedoy et al. (2019), in the triatomine Dipetalogaster maximus, measured and compared among nymphal stages and adults and, between sexes phenotypic traits linked to some functions: the proboscis length and width in feeding; the head length and width in vision; the pronotum width and length in mobility, and the abdomen length in feeding capacity and fecundity. These authors found sometimes a steady increase and sometimes an abrupt increase in some of those measurements, with some important effects on the functions evaluated. However, as in this analysis the measurements were limited to the adult stage of triatomines, we could not include the element of ontogeny.
I have organized the structure of this article as follows: (a) I review the triatomine bibliography where phenotype, life history, and environmental factors are related; (b) I describe a comprehensive database of life-history traits from that literature review to investigate possible relationships among them; and (c) I apply a Machine Learning approach to search for those relationships.
There is a complex relationship between T. cruzi and its vector host that results in mutually induced changes in both the insect and the parasite (demographic, behavioral, physiological, genetic, etc.), that affect virulence and transmission; a true “arms-race” (Pelosse and Kribs-Zaleta, 2012; Pelosse et al., 2013; Cordero-Montoya et al., 2019; Ramírez-González et al., 2019; Córdoba-Aguilar, 2020), and constitute an important factor affecting the evolution of triatomine’s life history. However, because of that same complexity it was not possible to include it a factor in the present analysis (it would have resulted in many more variables, and a proportionately smaller number of case studies).
Overall, this is the first study of triatomines with this comprehensive goal; a previous and similar effort in that direction was the one of Medone et al. (2012), that analyzed the life history traits of 27 triatomine species, but was restricted only to the analysis of mortality and fecundity through several death and reproductive parameters. However, the analysis here presented should not be confused with a meta-analysis; the latter, although combines results of multiple scientific studies as I have done here, usually address the same question, and try to reconcile individual studies reporting different results, each with some degree of error. On the contrary, here we will handle different studies, frequently estimating new variables (as the population growth rate) that were not present in the original studies. Below I present the results of (a), organized in three main aspects: the response of triatomines to temperature, feeding frequency, and food source effects.
There has been a growing body of literature showing the effects of temperature on many aspects of the biology of triatomines, particularly from the physiological point of view (molting process, diuresis, protein synthesis, hormone secretion, respiration rate, orientation to radiant heat, shelter selection, performance of flight muscles and flight initiation, electrophysiology of the maxillary stylets, preferred temperatures, rate of weight loss, dispersal, feeding behavior, metabolism, water loss, biting rate, gas exchange patterns and spiracular control, spermiogenesis, heart rate, effects on insecticidal activity, reproductive efficiency, and many others). So below I only review some of the most relevant effects of temperature exclusively related to the triatomines’ life cycle and demographic parameters.
The development time and survival of triatomines eggs as function of temperature began to be studied as early as 1935/36: Clark (1935) showed that the hatching rate of the eggs of Rhodnius prolixus (Stål, 1859) increased with constant temperatures from 15 to 27°C, but that this increase was strongly dependent on relative humidity (hatching rate was higher at higher humidity but the slope of the increase of hatching rate with temperature decreased with humidity); Galliard (1936) determined that exposing triatomines eggs to an increasing and constant temperature from 10 to 35°C, the egg development time (time to hatch) increased by a factor of ≈ 3 in Triatoma vitticeps (Stål, 1859) and Triatoma dimidiata (Latreille, 1811), and by a factor of ≈ 1.4 in R. prolixus; Galliard (1936), applying the Réaumur law, also determined the thermal constant for each species (necessary energy to hatch) as a linear relationship (degree-days). However, the relationship between temperature and development time (a non-linear relationship depending upon complex enzymatic processes), was estimated for the first time for the triatomine eggs of Triatoma guasayana (Wygodzinsky and Abalos, 1941) by Rabinovich et al. (2006) (see below the effects of fluctuating temperatures). In Rhodnius neivai (Lent, 1953) Cabello (1999) found that egg to adult development times were 118.0, 86.7, and 68.9 days at 22, 27, and 32°C of constant temperatures. Villegas García and Santillán Alarcón (2004) obtained a very small difference in the hatching time of Meccus pallidipennis (Stål, 1872) at two constant temperatures: 17 days a 25°C and 15 days at 30°C.
Studies on the effects of temperature on the survival and development times of nymphal stages and longevity of adults of triatomines, are more abundant. There is always a decrease in development time with an increase of a constant temperature: the developmental cycle (egg to adult) lasted 602 days at 25°C and 186 days at 30°C in Triatoma jurbergi (Carcavallo, Galvão & Lent, 1998) (Gomes and da Silva, 2002); the developmental cycle of D. maximus (Uhler, 1894) was 271 and 177 days at constant temperatures of 25 and 30°C, respectively (Da Silva, 1990), a difference of 53.1%; however, for Triatoma infestans (Klug, 1834) the difference was smaller (35.9%), also between 25 (271 days) and 30°C (177 days) (Da Silva and Da Silva, 1988). Cabello (1999) rearing R. neivai at three constant temperatures (22, 27, and 32°C), found a non-linear relationship of total adult mean longevity (24.6, 36.6, and 16.7 days) and life expectancy when entering adult stage (21, 34, and 20.7 days) as a function of those constant temperatures of 22, 27, and 32°C, respectively. In the triatomine M. pallidipennis Villegas García and Santillán Alarcón (2004) found that the average development time from first instar nymph to adult was 171 days at 25°C and 154 days at 30°C (11% reduction), and an adult female longevity of 301 and 379 days (26% reduction) at 25 and 30°C, respectively. Martínez-Ibarra et al. (2008) evaluated the life-cycle of Triatoma mexicana (Del Ponte, 1930) with cohorts under constant temperatures of 25°C/50% RH, 25°C/75% RH, and 30°C/75% RH. Development time from egg to adult was 286, 283, and 256 days, respectively, while no difference was found in nymphal mortality (57, 60, and 64%), respectively.
Reproduction is also affected by temperature in triatomines, although Da Silva (1990) found only a small difference (11.4%) in the total number of eggs laid by females of D. maximus in their first 30 days of adult life: 29.1 and 26.1 eggs at 25 and 30°C, respectively; however, under the same conditions, Da Silva and Da Silva (1988) found that in T. infestans this difference was twice as large (22.5%). In R. neivai Cabello (1999) found that the average number eggs/female/week were 11.1, 14.5, and 17.7, and the average number of eggs per female per lifetime were 264, 724, and 603, for three constant temperatures (22, 27, and 32°C), respectively. In the triatomines M. pallidipennis Villegas García and Santillán Alarcón (2004) found that the average number of eggs laid in a 6-month period were 826 at 25°C and 934 at 30°C, both as constant temperatures.
It is well known that there are important physiological effects between regimes of constant and fluctuating temperatures, even with the same mean values; these effects are represented by the so-called Jensen’s inequality, that states that for non-lineal processes, such as most biological phenomena dependent upon temperature, the effects of fluctuations in environmental temperature cannot be predicted from the mean of an equivalent constant temperature (Ruel and Ayres, 1999). This has been established in the triatomines by experiments carried out by Luz et al. (1999); Damborsky et al. (2005), Rabinovich et al. (2006), and Rolandi and Schilman (2018).
Luz et al. (1999) compared the development time of R. prolixus from hatching to the adult stage at constant (15, 20, 25, 28, 35°C) and alternating (16/8 h: 15/28, 20/25, 25/28, and 25/35°C) temperatures. Nymphs of this species reached the adult stage most rapidly (86.7 days) at a constant temperature of 28°C; under alternating temperatures development time was completed within 100 days or less at 25/28 and 25/35°C, while development time was slowest at fluctuating 15/28 and 20/25°C (>185 days), and at constant 20°C (>300 days). Damborsky et al. (2005) compared the life cycle of Triatoma rubrovaria (Blanchard, 1843) in a climatic chamber under constant temperature, and under the natural fluctuating temperature of the laboratory; under controlled temperature the average hatching time was 15.6 days and the average egg to adult development time was 10 months, while under the natural fluctuating temperature hatching time was 19.1 days and egg to adult development time was 14 months; no difference was found in the egg hatching rate nor in the total nymphal mortality, but a small difference was found in reproduction, with a mean number of eggs/female per life of 817.6 eggs under controlled conditions and of 837.1 eggs under fluctuating conditions (2.4%). Rabinovich et al. (2006) analyzed the effects of fluctuating temperatures on the development time of the eggs of the triatomine T. guasayana using three nonlinear models (Devar, Lactin, and Rueda); these authors found a lower egg development threshold between 15 and 17.5°C, and a thermal death point of eggs at 34.4°C; using a generalized development rate response of T. guasayana eggs to increasing temperature was proposed, with three ranges: between 10 and 14.8°C development rate increases in an accelerating way; between 14.8 and 29.2°C development rate increases more or less linearly, and between 29.2 and 34°C development rate decreases. Rolandi and Schilman (2018) studied the effect of daily temperature fluctuation (DTF) of 17–32°C (mean = 24°C) on R. prolixus, and found that development time and fertility were not affected by DTF, but that fecundity was lower in females reared at DTF than at constant temperature; considering Jensen’s inequality and the species’ tropical distribution these authors predicted that living in a variable thermal environment would have associated higher energetic costs.
Cabello (1999) is one of the few authors to construct a complete life table of a triatomine (in R. neivai), and to evaluate the demographic parameters at three constant temperatures (22, 27, and 32°C). The estimation of the demographic parameters showed a non-linear trend: the net reproduction rate (R0) was 114.6, 374.4, and 142.4, while the intrinsic rate of natural increase (r0) was 0.14, 0.25, and 0.22, for constant temperatures of 22, 27, and 32°C, respectively.
It has been known in general that the feeding frequency in triatomines affects some life cycle and demographic parameters, although there is not much quantitative data available on these effects. Braga and Lima (2001) manipulated in the laboratory the feeding frequency of Panstrongylus megistus (Burmeister, 1835) by creating six groups (GI to GVI) of 15 couples each, with the following feeding schedule: GI, on days 5 and 25; GII, on days 5 and 35; GIII, on days 5 and 45; GIV, on day 20; GV, on day 30; and GVI, on day 40 after the imaginal ecdysis (an additional group of 15 couples, fed on day 5 after the imaginal ecdysis and subsequently fortnightly, were used as a control group). The results indicated a clear reduction in longevity and fecundity: GI produced more eggs, mating and fertile eggs; GII had longer life spans, higher fecundity and hatching rate; GIII had a shorter life span, low fecundity, fertility, and hatching rate; GVI presented the least favorable results for all parameters.
Cabello et al. (1988) got contradictory results in the longevity and life expectancy of adults of the triatomine R. neivai, when reared at two feeding frequencies (every 7 and 15 days) depending upon the animal species used as blood source: longevity and life expectancy became longer when fed every 7 days (as compared to being fed every to 15 days) when fed on rabbit, but became shorter from 7 to 15 days when fed on chicken. However, several demographic parameters (the intrinsic rate of natural increase, r0, among them) were consistently higher at 7 days feeding interval than at 15 days feeding interval, independently of the animal species used as blood source.
Sant’Anna et al. (2001) claimed that the triatomine R. prolixus achieves high values of total blood ingestion rate (depending on the host used) due to its high mechanical and salivary efficiency, and that this leads to higher nutritional status, allowing (through shorter development times and higher fecundity) to have a higher population growth rate and reach higher densities.
Being triatomines almost exclusively hematophagous, they are affected not only by the frequency of feeding as shown above, but also by the source of the animal blood ingested. Nattero et al. (2013b) tested the effects of the blood of guinea pigs and pigeons on the fecundity of Triatoma patagonica (del Ponte, 1929); although these authors found that females fed on pigeons ingested more blood and needed a higher amount of blood to produce an egg than females fed on guinea pigs, there were no differences in the number of eggs laid and hatched between insects fed on each feeding source. The higher amount of blood ingested and consumed by T. patagonica fed on pigeons did not translate into higher fecundity or fertility, and Nattero et al. (2013b) concluded that the lower amount of guinea pig blood ingested was offset by its high nutritional quality.
Even morphological traits are being affected by blood source. Although Nattero et al. (2013a) found that in T. infestans females exhibited significantly greater head size than males for both food sources (mammals and birds), they also found that the greater head size of T. infestans adults fed on guinea pigs is not consistent with variation of body size; these authors claim that although body size seems to respond to food source, phenotypic plasticity in head size was not a simple consequence of allometric plasticity between body and head size, and hypothesized that the diet-induced phenotypic plasticity in head size for bugs fed on guinea pigs might be due to changes in developmental allocation to tissue growth that maintain growth of head size while reducing growth of body size, and that this, in turn, was probably due to the reduced amount of blood ingested when fed on guinea pigs relative to those fed on pigeon. There are other several indications that we should expect a relationship between body measures and feeding in triatomines. Zeledón et al. (1970) found that body length in adult T. dimidiata were larger when collected in the field than those reared in the laboratory, and suggested that this was the result of a more frequent feeding rate of those insects caught in the field. Gürtler et al. (2017) investigated the links among individual bug bloodmeal contents in T. infestans and body length as well as host blood sources and habitats; body length correlated positively with other body-size surrogates and was modified by habitat type, bug stage, and recent feeding (e.g., bugs from chicken coops were significantly larger than pig-corral and kitchen bugs).
Lunardi et al. (2017) did not find variations in the head centroid size in Triatoma williami (Galvão & Col., 1965) related to the blood source, while in T. infestans Nattero et al. (2013a) found that the head was greater when fed on mammals, but the body was greater when fed on birds. Furthermore, Nattero et al. (2013a) demonstrated experimentally that adult T. infestans showed evidences of phenotypic plasticity in head size.
Guarneri et al. (2000) showed in four triatomines species of the genus Triatoma [T. infestans, Triatoma brasiliensis (Neiva, 1911), Triatoma sordida (Stål, 1859), and Triatoma pseudomaculata (Erichson, 1848)] that the development time was on average almost twice as long when fed on pigeons (279 days) than when fed on mice (159 days). Similarly, total nymphal mortality (as %) was 1.6 times larger when fed on pigeons (24.2%) than when fed on mice (14.6%). However, the average total body length, for both sexes together, did not differ when fed on pigeons (2.25 cm) than when fed on mice (2.16 cm) for the pool of all four species.
Martínez-Ibarra et al. (2003) tested the response of development time of the triatomine Triatoma picturata (Usinger, 1939) to being fed on hens and rabbits and, assuming normality, I carried out a sample t-test of their results (mean = 196.8 days; SD = 15.8; n1 = 69 for hens, and mean = 189.6 days; SD = 22.88; n2 = 68, for rabbits) showing that there was a statistically significant effect of the blood source used for feeding (t = 2.1459, df = 135, p-value = 0.03367). These differences, coupled with survival differences between feeding types led to Martínez-Ibarra et al. (2003) to show that there was also an effect on demographic parameters: the net reproductive rate (R0, estimated as the number of females produced by cohort × mean eggs laid per female divided by the number of eggs that started the cohort) was larger for rabbits (R0 = 148.5) than for hens (R0 = 114.7).
Cortico Correa Rodrigues et al. (2007) developed a life table of the triatomines species Triatoma tibiamaculata (Pinto, 1926), and estimated the longevity of adults and oviposition of females, and found that although there was no difference in the survival from the egg to the adult stage for insects fed on pigeon or on cocks, there was a large difference in the life-time fecundity: 7,832 eggs were laid by the cohort fed on cocks, and about half that number (3,633 eggs) was laid when the cohort was fed on pigeons.
In summary, considering the richness and variety of information on triatomines, I set as a goal for this article the compilation of the quantitative data available to investigate the possible effects of morphology, life cycle, and environment factors on the population fitness in triatomines, through a Machine Learning approach.
I carried out an exhaustive review of the literature on triatomines using the BibTri bibliographic database1, hosted by the Centre for the Study of Parasitology and Vectors of the National University of La Plata, Argentina. This access-free database has 14,164 bibliographic records on Chagas disease, of which 7,207 refer exclusively to all possible features of the triatomines. Those records were then narrowed down by filtering them with the following 15 keywords available as a special field in the database: life cycle, population growth, demography, density effects, diet and foraging, physiology, age, fecundity, longevity, mortality, population parameters, survival, life tables, temperature, and development time. By this procedure I obtained 2,968 records complying with one or more of those 15 fields of interest (see Supplementary Material 1 for the complete list of those 2,968 publications); I analyzed them individually, and the publications that did not have the data in quantitative form as needed for the objective of this article were discarded, and 171 papers remained as adequate for the present analysis (see Supplementary Material 2 for a list of those 171 publications). I would like to highlight that all these publications provided results of laboratory experiments (see section “Discussion” about the importance of this feature).
From the final selection of 171 papers a total of 71 triatomine species were found, representing 539 different case studies (many papers had more than one triatomine species under study, and frequently for any given species more than one experiment under different laboratory conditions were carried out, resulting in many more cases than papers). The full information of those 539 study cases were transcribed to an Excel sheet that had 60 headers (see Supplementary Material 3 for the complete list of those headers), that represented the following seven types of information (N refers to “nymph”):
1. Metadata: case number, publication code, species, genus (text), species (text), genus (code), species (code), geographical origin, observations.
2. Environmental variables: mean temperature (°C), temperature regime (constant/fluctuating), relative humidity (%), food source (animal blood used), frequency of feeding (in days).
3. Demographic variables: population intrinsic rate of natural increase (r0), net replacement rate (R0), and generation time (T).
4. Life cycle variables (in days): mean development time of eggs, NI, NII, NIII, NIV, and NV, total of egg to adult, total of N1 to adult, and mean and standard deviation of female longevity.
5. Reproductive variables: sex ratio, preoviposition period, reproductive period, mean and standard deviation of eggs/female/life, and mean and standard deviation of female eggs/female/day.
6. Survival variables: egg, NI, NII, NII, NIV, and NV mortality, mean and standard deviation of total nymphal mortality, mean and standard deviation of mortality from egg to adult, female mortality, and male mortality.
7. Morphological variables (all measurement variables in mm): total length, pronotum length, abdomen width, anteocular-postocular ratio, eye dorsal width/synthlipsis ratio, 2nd to 1st antennal segment ratio, 3rd to 1st antennal segment ratio, 4th to 1st antennal segment ratio, 2nd to 1st rostrum segment ratio, 3rd to 1st rostrum segment ratio, length head/pronotum ratio, length/width of head ratio, ellipsoid short axis of eggs, ellipsoid long axis of eggs, and egg volume (calculated as an ellipsoid). These morphological variables have a unique value for each species, representing the value of the type from the original description (as summarized in Lent et al., 1998); so, they differ from the demographic, life cycle, reproductive, and survival variables in that they have no variability.
A relatively important variable effecting life history traits and fitness is infection of triatomines by T. cruzi (Cordero-Montoya et al., 2016), who found that insect hosts infection affects size, number of eggs laid, egg hatching rate, hatching success, and survival. However, despite this study is one of the most relevant to fitness estimation, some life history traits were not in the form adequate to estimate demographic parameters, and additionally development time was not estimated (all experiments were carried out with adult individuals). So, the T. cruzi infection factor could not be included in this analysis.
As I was interested in finding a possible association between life cycle, morphological and environmental variables with some fitness parameter among the triatomine species, I selected the population growth rate as demographic parameter (r0 and/or R0, the population intrinsic rate of natural increase, and the net reproductive value, respectively) that are usually considered good indicators of population fitness (Engen and Saether, 2016), and that have been used as such in other triatomine studies (e.g., Pelosse et al., 2013). So, I had to filter again the dataset for those cases that provided some of the demographic parameters directly, or that at least provided enough life cycle information to calculate them. Whenever the demographic parameters were not available and I had to calculate r0 and/or R0 from the original data in a publication, I used the Lotka equation () (Southwood, 1978), which requires the survival (lx) and fecundity (mx) schedules (a quantitative information rarely published); here x is the age (or stage) of the insect, and w is the last reproductive age. Lotka’s equation cannot be solved explicitly so the iterative method used by Rabinovich (1980) was applied, implemented in an Excel spreadsheet using the Solver tool. Both growth rate parameters are related by the formula (Bengstron, 1969), where T is the cohort generation time (mean age of the females in the cohort at the birth of the female offspring). As both demographic parameters are directly related, I decided to use only one of them: the intrinsic rate of natural increase, r0. This new requirement of the r0 parameter (or lx and mx for its calculation), reduced the original 539 case studies and 71 triatomine species to 90 cases and 36 species.
Several of the 60 variables of the original dataset (see Supplementary Material 3) were redundant or unnecessary because they were included indirectly in other variables (e.g., total of egg to adult development time included the development time of each of the egg, NI, NII, NIII, NIV, and NV stages). Using a parsimonious criterium I selected (in addition to the name of each triatomine species) a subset of the variables available; e.g., the head width and pronotum length were the morphological variables that best differentiated species (Nattero et al., 2017); as a result, the following 11 variables remained in the final dataset to be used in the present analysis:
(I) Four environmental variables: (1) “Temp_Reg” (temperature regime: a categorical variable representing a constant or fluctuating temperature), (2) “Mean_Temp” (average rearing temperature, °C), (3) “Food_source” (a categorical variable representing the blood source fed to the triatomines, with six categories: mouse, pigeon, chicken, rabbit, other mammal, and other birds, and (4) “Freq_feeding_d” (frequency of feeding, in days).
(II) Two life cycle variables: (5) “MEADT_d” (mean egg to adult development time, in days), and (6) “MFEF_d” (mean female eggs/female/day).
(III) Four morphological variables (these are standard morphological traits used routinely in the taxonomy of triatomines; Lent and Wygodzinsky, 1979): (7) “Total_length” (body length, in mm), (8) “Pronotum_length” (also in mm), (9) “Ant_postoc_ratio” (the anteocular-postocular ratio), and (10) “X4th_1st_ant_seg_ratio” (the 4th to 1st antennal segment ratio).
(IV) One demographic parameter (used as dependent variable): (11) “r0” (the intrinsic rate of natural increase, in days).
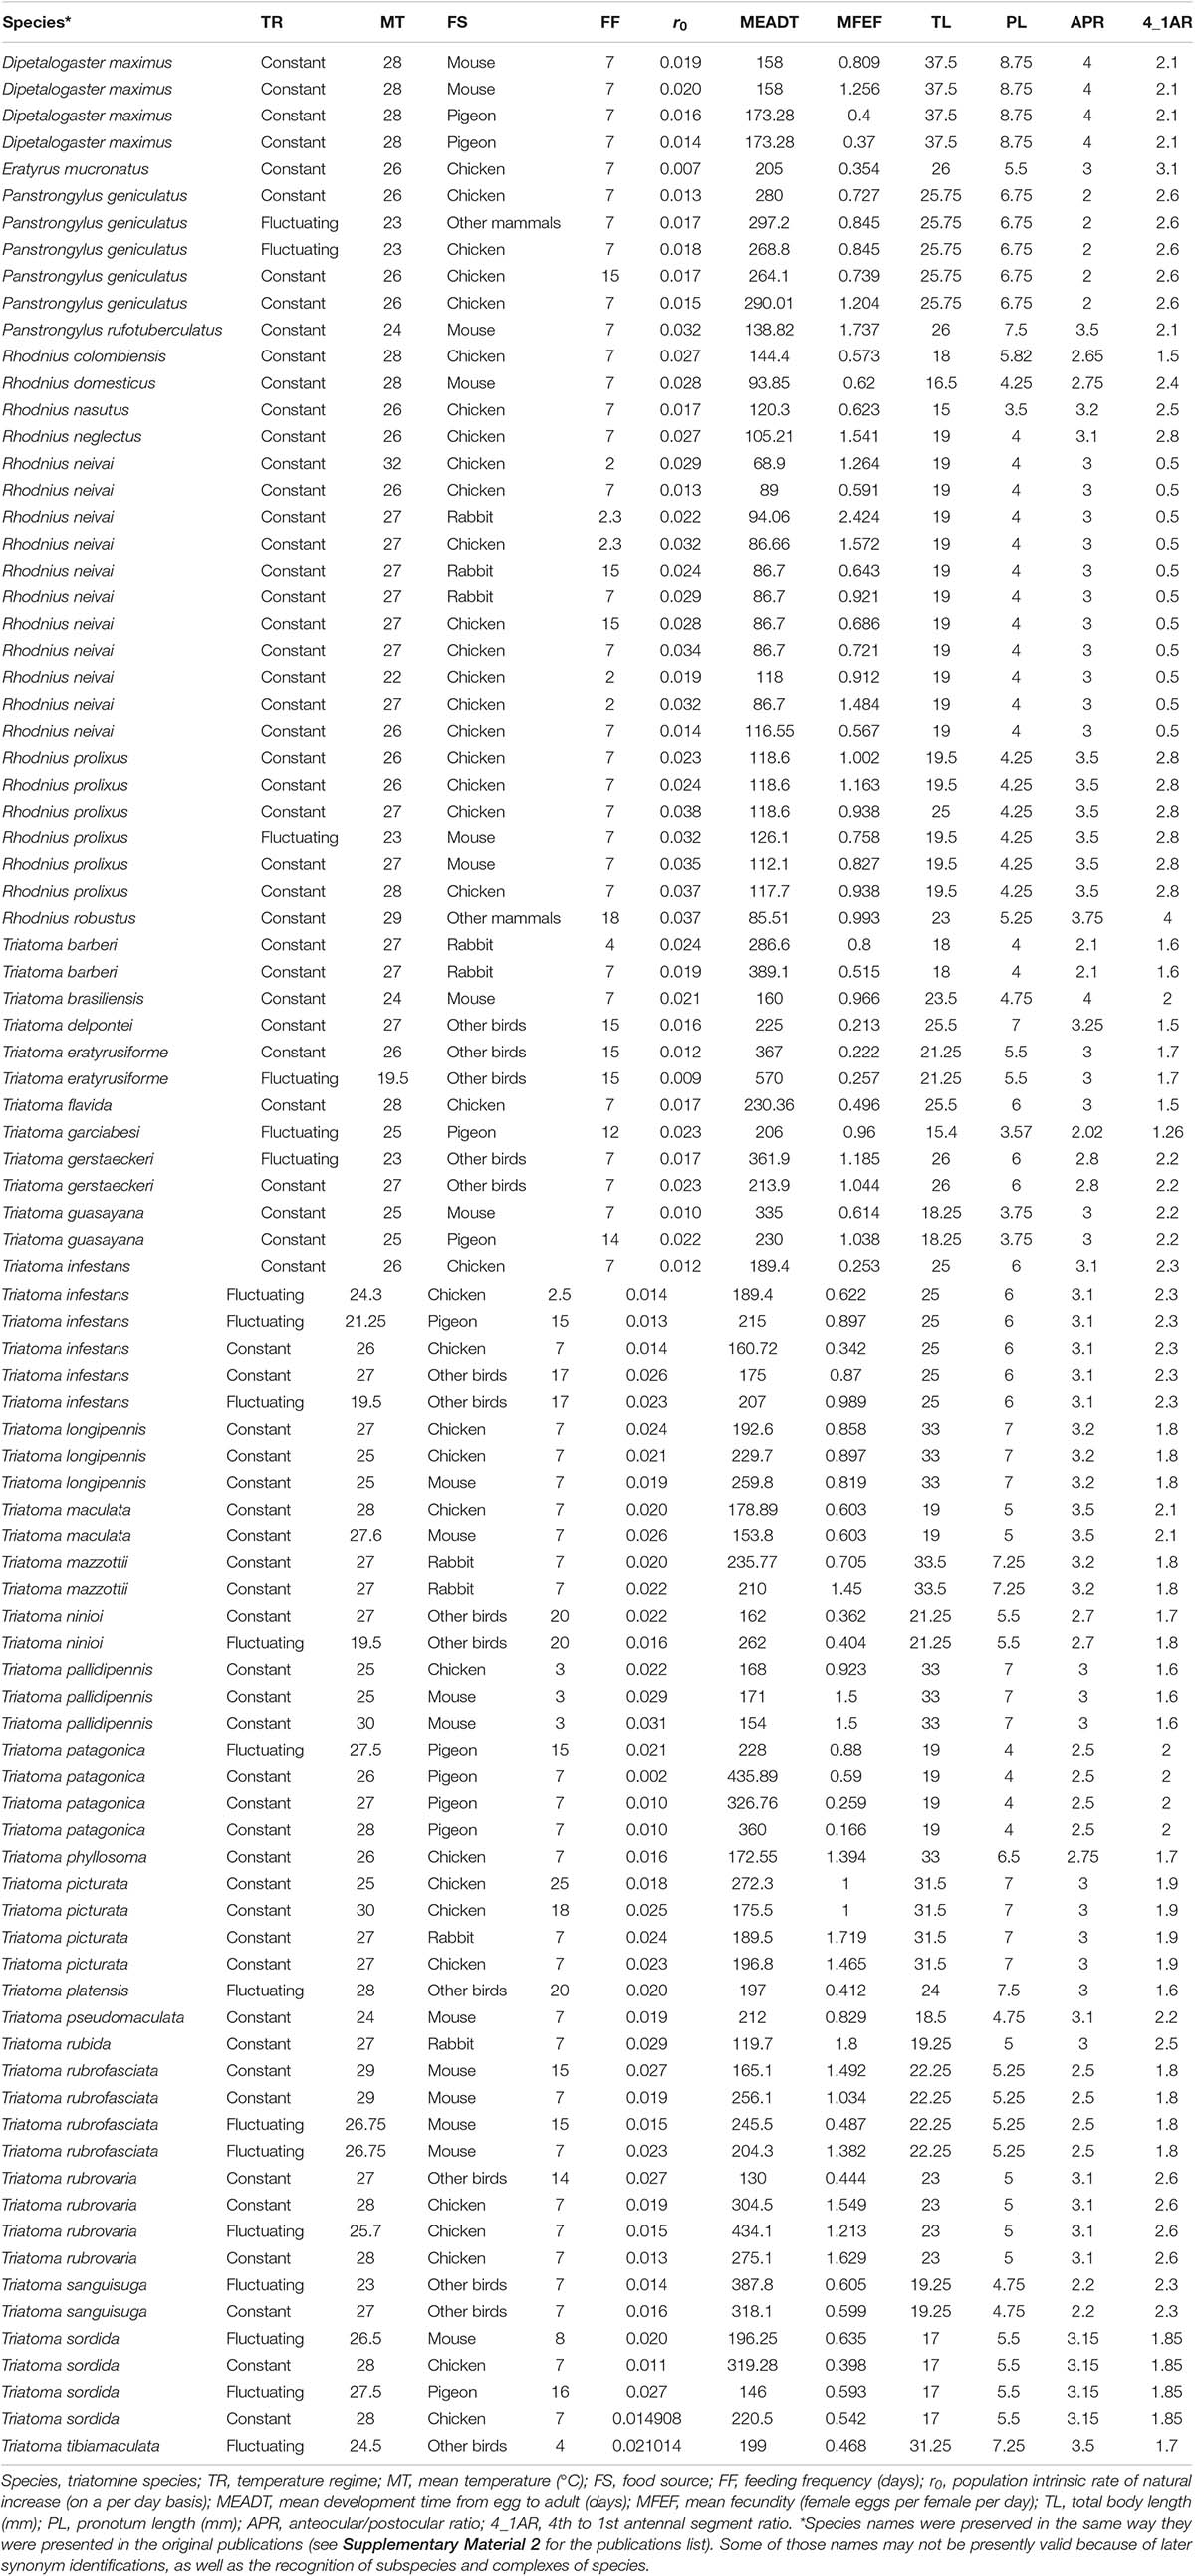
Although it is well known that population growth rate is affected by fecundity, survival, and development time (Southwood, 1978), both fecundity and development time were included in the analysis (unfortunately not enough data on survival was available) because it would be very informative to learn about the relative importance of those two variables under the variety of species and environmental conditions of the dataset here used. The complete dataset used in the present analysis, plus the triatomine species names, is given in the Appendix.
First an exploratory analysis was carried out, using classical box-plot graphics and normal fitting procedures, using the ggplot2 package of R software (Wickham, 2016). Then I selected the Random Forest analysis, using the randomForest (Breiman and Cutler, 2018) and the randomForestExplainer (Paluszynska et al., 2020) packages of the R library (R Core Team, 2019); these packages work by aggregating the predictions made by multiple decision trees of varying depth, with every decision tree in the forest being trained on a subset of the dataset (the bootstrapped dataset). Finally, to verify if the insights gained from the machine learning approach were robust, I compared those results with an ordinary least square (OLS) regression. All analyses were carried out with different packages of the R program (R Core Team, 2019). The R code used for the analyses is given in Supplementary Material 4.
Supplementary Figure 1 shows the distribution of the dependent variable used in this analysis (r0, the intrinsic rate of natural increase). The distribution fits well a normal distribution (the Shapiro test resulted in a p-value = 0.659, so there is no evidence on which to reject the null hypothesis that the variable r0 is normally distributed). As some species had several estimates of r0 (sometimes under different environmental conditions), it was also of interest to visualize the distribution of this parameter among species (Supplementary Figure 2).
Similar box-plot graphs were prepared with the two numerical environmental variables: mean temperature and feeding frequency (Supplementary Figure 3); both variables show an important and useful degree of variation: the range of the mean temperature was 19.5–32°C, and that of the feeding frequency was 2–25 days (see black dots in Supplementary Figure 3, that represent the extreme values).
The two life cycle variables used in this analysis (egg to adult development time in days, and fecundity, expressed as average female eggs produced per female per day) show similar variability to the numerical environmental variables (Supplementary Figure 4); the range of the egg to adult development time was 69–570 days, and that of the fecundity was 0.17–2.42 female eggs/female/day (the black dots in Supplementary Figure 4, represent the extreme values).
Finally, the four morphological variables were also graphed (Supplementary Figure 5) in the form of box-plots in a single figure (with morphological traits in the x-axis), because each species has only one measurement for each morphological trait; so, in Supplementary Figure 5 the values of the morphological traits represent the variability among and not within species.
Why did I select Random Forest for analysis? Regression and classification trees have a very different flavor from the more classical approaches for regression and classification but, unfortunately, trees generally do not have the same level of predictive accuracy as some of the other regression and classification approaches (Gareth et al., 2014). However, methods such as Bagging, Random Forests, and Boosting use trees as building blocks to construct more powerful prediction models. Random forests provide some improvements over bagged trees by a random “de-correlation” of trees: when building the decision trees, each time a split in a tree is considered, a random sample of m predictors is chosen as split candidates from the full set of p predictors; then that split is allowed to use only one of those m predictors, and a fresh sample of m predictors is taken at each split (technically, the usual procedure is to choose , that is, the number of predictors considered at each split is approximately equal to the square root of the total number of predictors; Gareth et al., 2014). In other words, in building a Random Forest, at each split in the tree, the algorithm is not even allowed to consider a majority of the available predictors.
Before running the Random Forest analysis, I checked for possible collinearity among some of the independent variables, to avoid any degree of strong redundancy. Using the classical criterium of r > | 0.7|, the only significantly correlated variables were Total length and Pronotum length (r = 0.846); I decided to delete Total length from the dataset because the Pronotum length, being a completely chitinized structure, is more reliable.
To run the standard Random Forest method with the dataset (see Appendix for the full dataset), I used 1,000 regression trees (the number of bootstrap samples), and r0 (population intrinsic rate of natural increase) as the dependent variable; I first tried with several values of the parameter mtry (the number of predictors that are randomly sampled as candidates for each split), and selected the mtry value that maximized the percent of the explained variance; as a result I obtained a mean of squared residual of 1.6378e–05, and a variance explained of 67.6% with mtry = 6. I believe that a variance explained of 67.6% is a sensible prediction accuracy.
Figure 1 shows the minimal depth among the trees of the Random Forest applied to the triatomine dataset; the visualization of minimal depth among trees provides an estimate of the important of each of the variables in the model. There are three “dominant” variables: Species, mean egg to adult development time, and mean female eggs per female per day; these three variables are the significant predictors given by the “importance measure” function of the Random Forest package. It is illustrative to look not only at the mean but also at the whole distribution of the minimal depths as given in Figure 1, that suggests more insights into the role that a predictor plays in a forest.
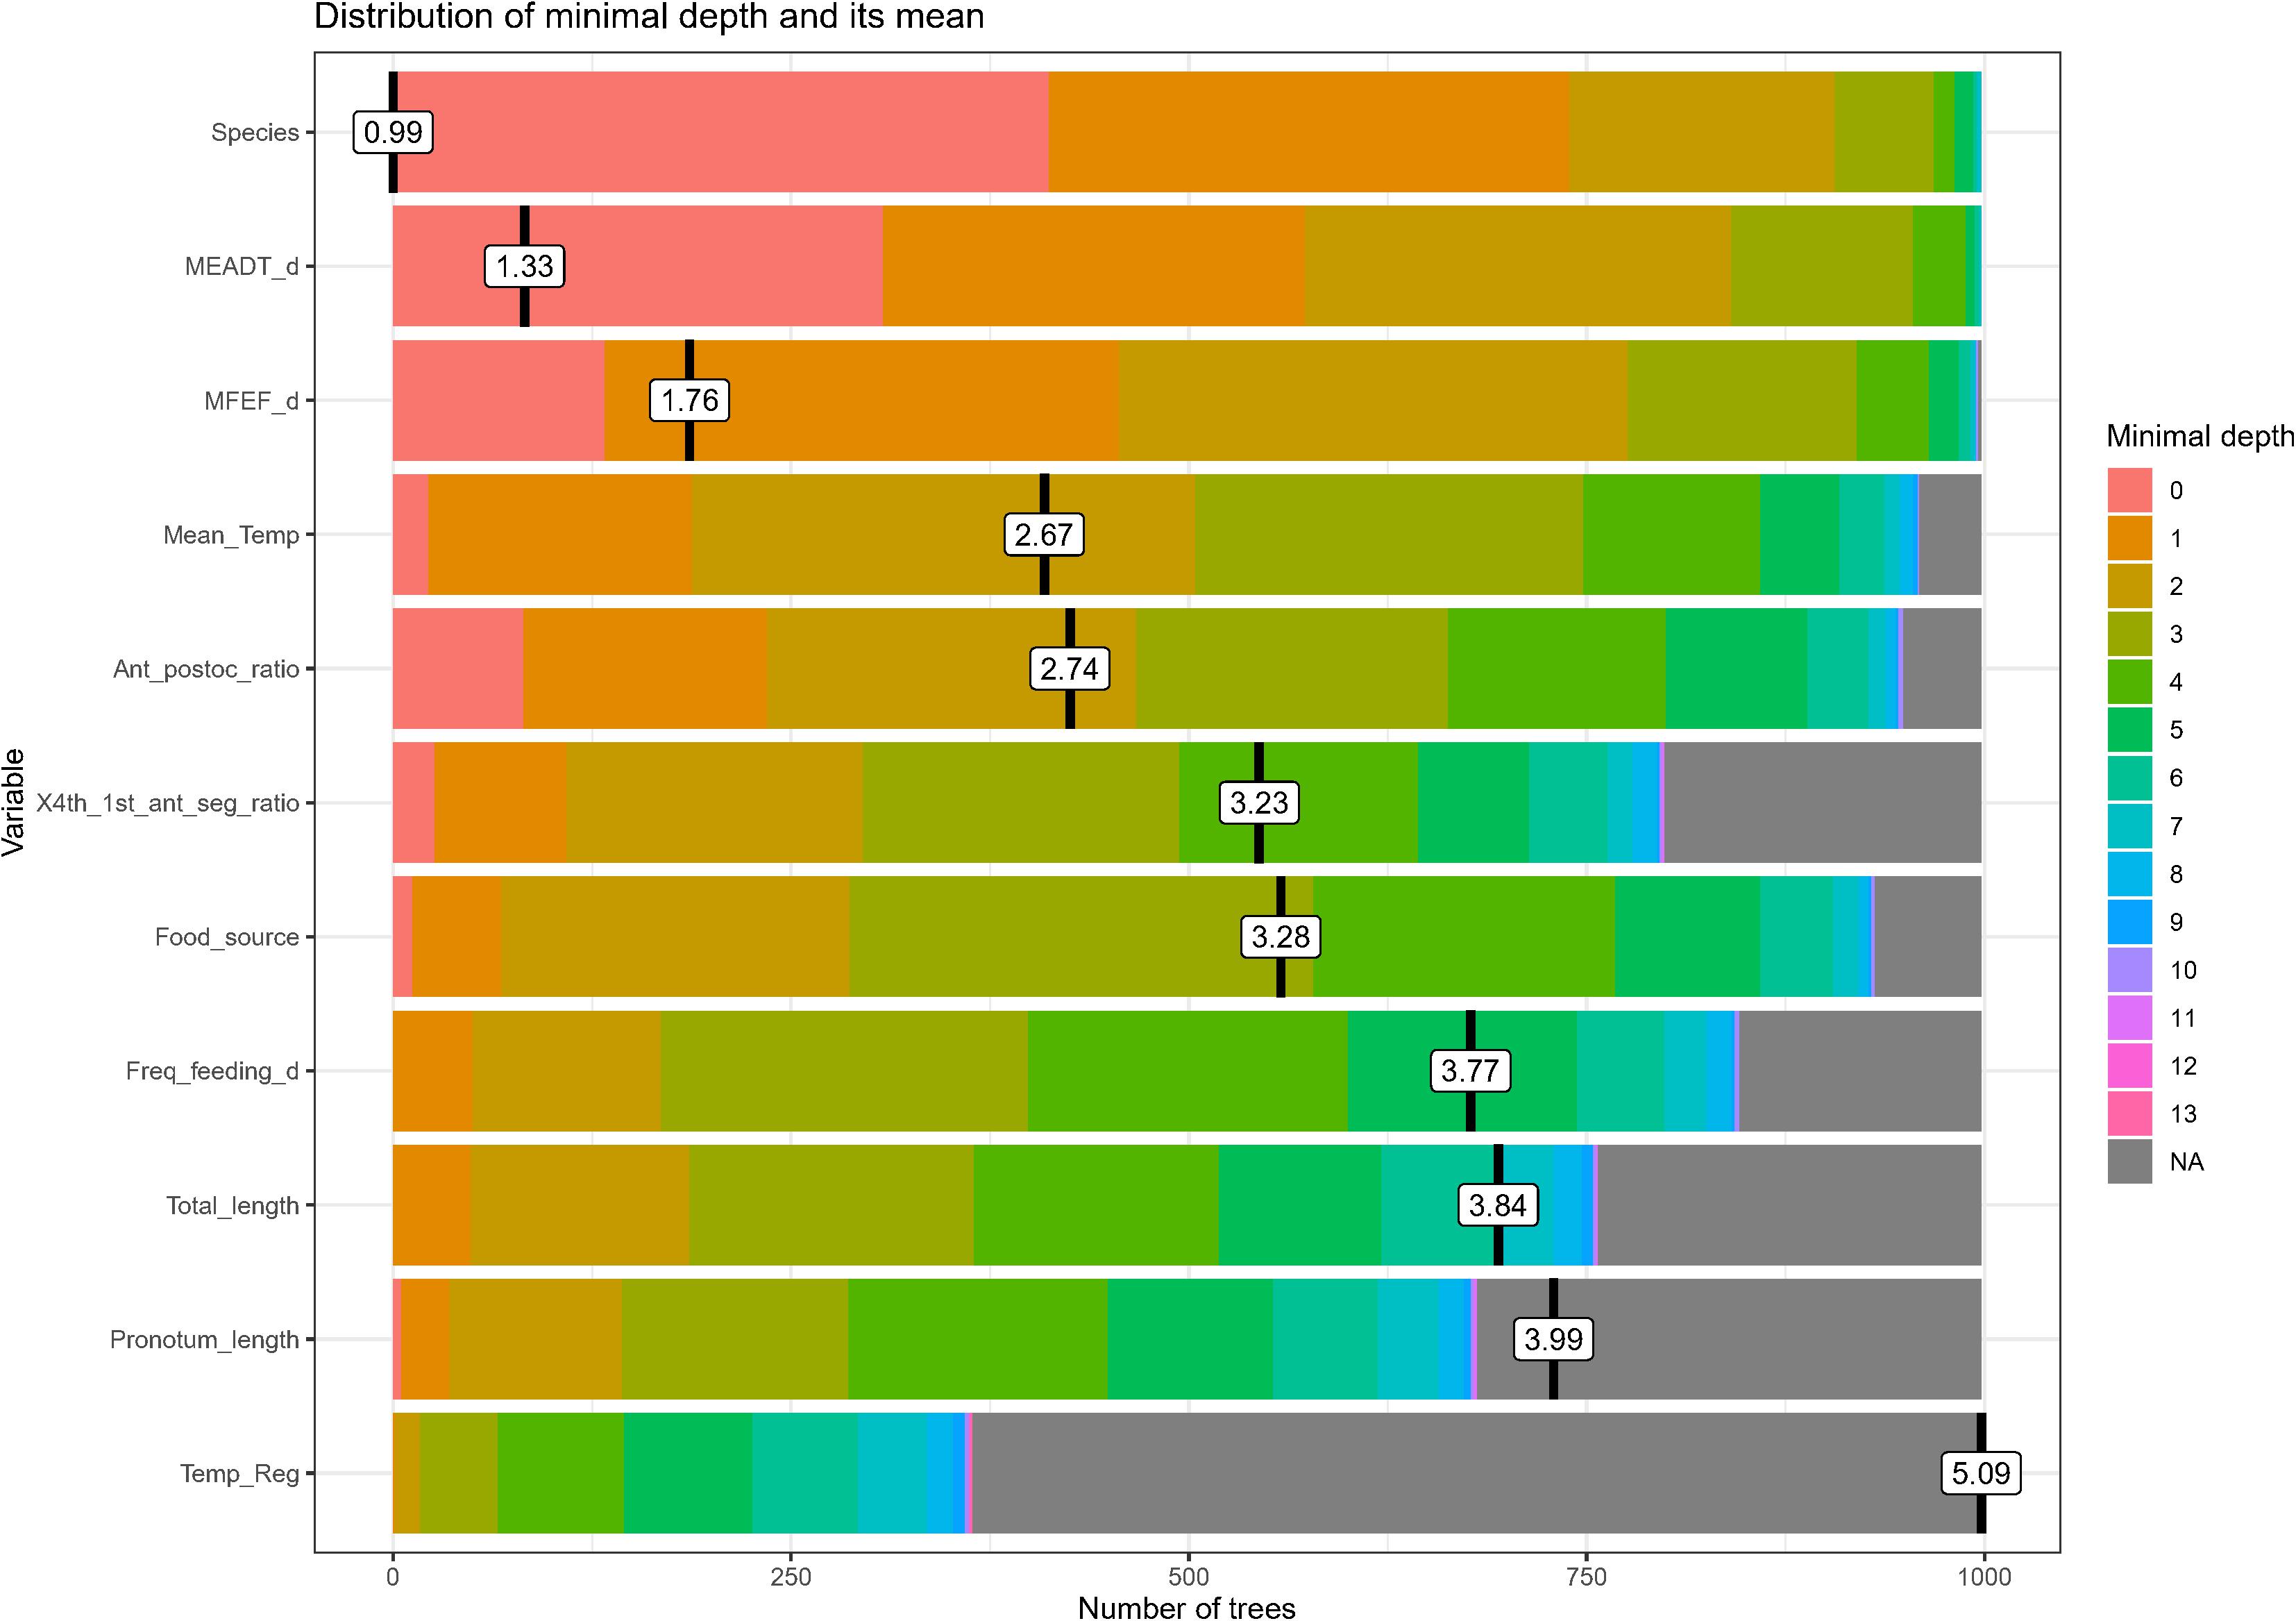
Figure 1. Distribution of minimal depth among the trees of the “forest” applied to the triatomine dataset. The black vertical bars (and their value labels) are the mean of the distribution, and the scale of the x-axis goes from zero to the maximum number of trees in which any variable was used for splitting.
Two additional common measures of variable importance are given by the indices IncNodePurity (the total decrease in node impurities from splitting on the variable, averaged over all trees; i.e., it indicate that a node contains predominantly observations from a single class), and %IncMSE (the increase in the mean square error of predictions as a result of the variables being permuted, i.e., it indicates the extent to which the predicted response value for a given observation is close to the true response value for that observation). mse_increase is measured by the well-kwon Gini index; as mse_increase is the most robust and informative measure of importance in Random Forest (Gareth et al., 2014), while IncNodePurity is a biased measure, I preferred to present the results of variable importance as mse_increase (Figure 2); the higher the value of mse_increase associated with a predictor, the more important the role of the predictor in its effect on r0.

Figure 2. Variable importance of the predictors in determining the population intrinsic rate of natural increase (r0), based upon the percent increase of the mean square error of each predictor (%IncMSE).
Table 1 provides the statistical information resulting from the Random Forest analysis, and it is presented with the p-values in ascending order, confirming that only Species, mean egg to adult development time, and mean female eggs per female per day are the only significant predictors determining the population intrinsic rate of natural increase (r0). It was relatively surprising that none of the environmental variables seem to play any role in determining r0 (see section “Discussion”).
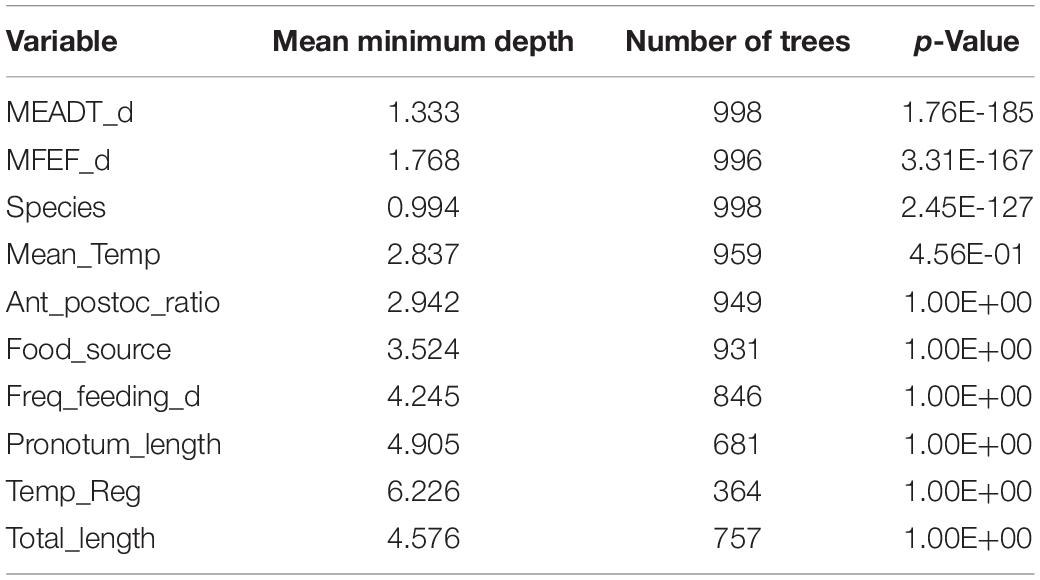
Table 1. Statistics of the dataset variables from the randomForest analysis, with the p-values in ascending order.
I have also produced the so-called a multi-way importance plot (see Supplementary Figure 6) using the mse_increase (in the x-axis), and the IncNodePurity (in the y-axis), and their location on the graph confirms that Species, mean egg to adult development time, and mean female eggs per female per day are the only significant variables.
The Random Forest package also allows for an estimation of interaction among the predictor variables, by graphing the mean minimal depth (MMD) of the main interactions (Supplementary Figure 7); from the MMD among the main six possible interactions the three interactions between Species and the two life cycle variables (mean egg to adult development time, and mean female eggs per female per day) are the dominant ones, although the interaction of those variables with the mean rearing temperature was also important; however, as mean rearing temperature was not statistically significant in its effect on r0, that means that it is only important as a conditional effect on other variables.
As, in addition to species, the two life cycle variables keep showing to be the ones with the most significant influence on r0, it was of interest to look at the empirical response of r0 as a function of the simultaneous change of the mean egg to adult development time, and the mean female eggs per female per day; this is shown as a contour graph in Figure 3. It is clear that the former (mean egg to adult development time) has a stronger effect on r0 than the mean female eggs per female per day.
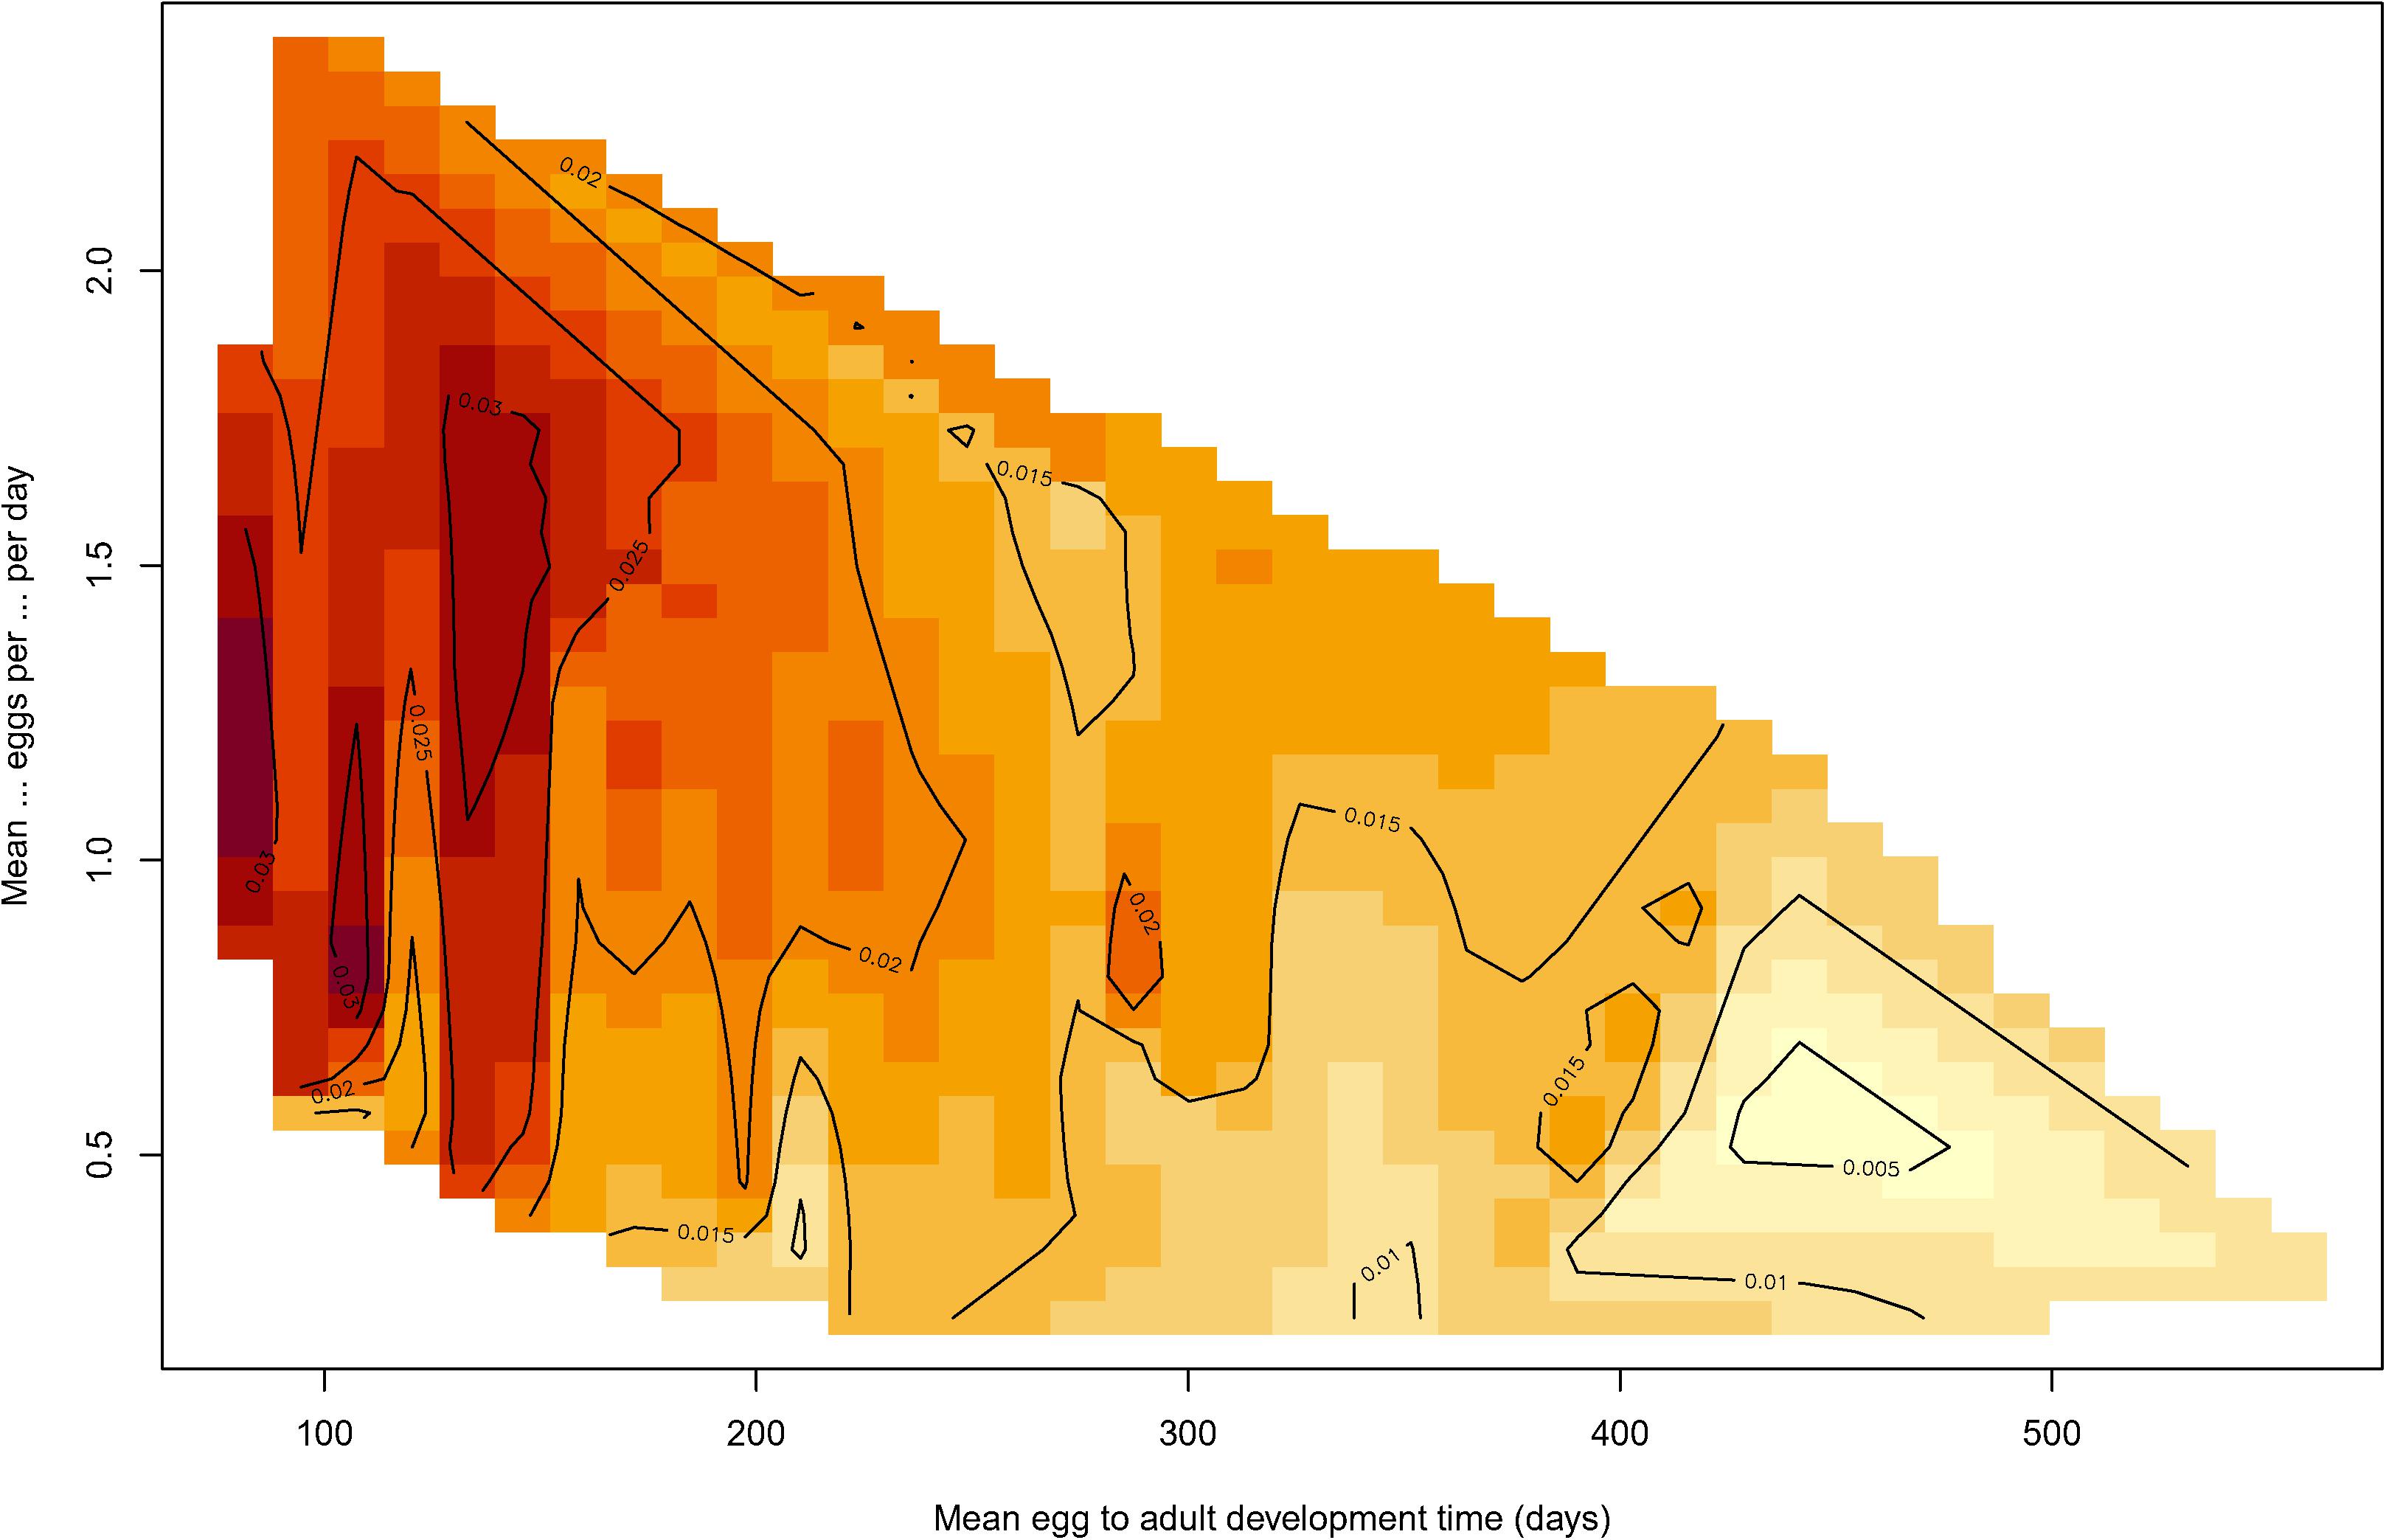
Figure 3. Contour graph of the response of r0 (population intrinsic rate of natural increase) as a function of the change in the mean egg to adult development time, and the mean female eggs per female per day. Lighter colors indicate lower values of r0 and darker colors indicate higher values of r0.
As a final step, it was of interest to compare the results produced by the Random Forest method with the ones produced by a regular parametric analysis. I resorted to a simple OLS regression, and Table 2 shows the results of the regression analysis with the same dataset used for the Random Forest analysis, for all species pooled; it was confirmed that only the mean egg to adult development time, and fecundity (mean female eggs per female per day), are the only significant independent variables. However, when the linear regression was carried out with interactions among the independent variables, no effect was statistically significant (results not shown), an important difference with the Random Forest analysis (Supplementary Figure 7) and the observed data (Figure 3).
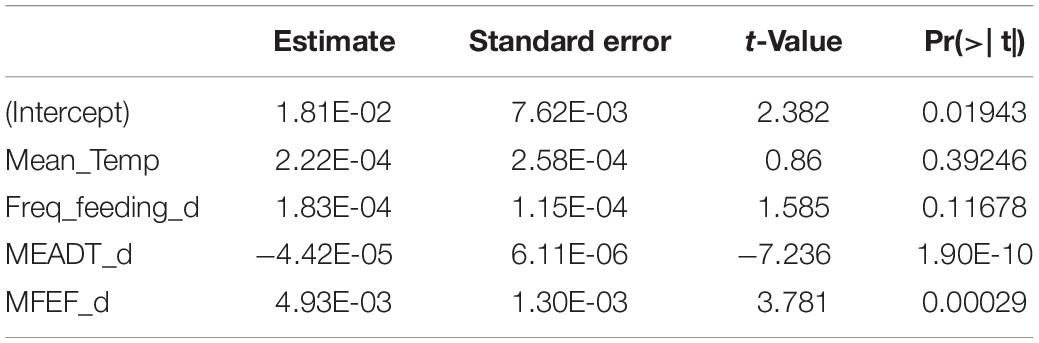
Table 2. Statistics of the linear regression analysis.
Historically, there have been two schools of thought in the study of the development of organisms: the “old school” covering mainly the juvenile forms in what is usually called “life cycles,” and a relatively “new school” (developed over the last 50–60 years) concerned largely with adults and their quantitative schedule of reproduction, and usually called “life histories”; the latter was developed in a very different fashion, being highly theoretical from the outset (Bell, 2011). Much of this “life history” theory was based on the principle of optimality, and founded on what has been called “trade-offs,” e.g., the apparent negative association between the rate of reproduction and the probability of survival. Despite some outstanding initial successes, as many exceptions were found as cases following this rule, and it was soon even seen that the correlations between fitness components are usually positive rather than negative; this fact was attributed to environmental variance of productivity among sites when comparisons are made in the field, or to genetic variance of overall fitness among strains when comparisons are made in the laboratory (Bell, 2011).
Within this context, my analysis produced several unexpected results. Despite the evidence of the importance of the source of blood meals and their frequency (see section “Introduction”) neither of these factors seemed to influence fitness (as measured by r0). Similarly, neither temperature nor body size affected r0, a surprising result because those factors are considered as the two most important variables affecting nearly all biological rates and times (Gillooly et al., 2002). One possible explanation could be related to the fact that the pool of 36 different triatomine species here analyzed (and identified as significant on its effect on r0), originated from data coming from quite different environmental conditions. When carrying out the linear regression analysis, I also applied it for each species separately to test if another independent variable would appear as significant, but with no avail (results not shown). However, this lack of results is of little value because when narrowing down the regressions to each species, the number of replicates per species was extremely low (the species with the largest number of observations was R. neivai, with N = 11, followed by R. prolixus, with N = 6).
On the other hand, my results that development time and fecundity were the only significant variables (in addition to the species themselves) impinging on fitness are consistent with the known fact that development time (as the time to reach reproductive maturity) is probably one of the life-history variables with the strongest impact on the population growth rates (Cole, 1954). The results are also congruent with the claim of Mousseau and Roff (1987) that in laboratory outbred animal populations traits closely associated with fitness will generally possess higher heritabilities than traits more loosely connected with fitness.
However, the results have also to be considered within the context of a certain weakness inherent to the dataset used: the data I analyzed are all derived from laboratory experiments; although it is true that no data of the type needed for this kind of analysis has been obtained in nature (not only in triatomines but in general; Hendry, 2015), some caveats are in order. In a stable environment, evolution maximizes growth rates in populations that are not density regulated, while in a naturally fluctuating environment, evolution maximizes a function of growth rate, carrying capacity, and environmental variance, tending to r-selection and K-selection under large and small environmental noise, respectively (Engen and Saether, 2016). The only analysis made on triatomines related to r- and K-selection (Rabinovich, 1974) showed that the triatomines species R. prolixus and T. infestans were “intermediate” r-strategists, with T. infestans being slightly more r-strategist than R. prolixus. This coincides with the high r0 value of these two species as shown in Supplementary Figure 2.
But some caveats still remain associated to another fact: many of the experiments compiled in this review were carried out with specimens of colonies that had been maintained in the laboratory for many generations (sometimes for several hundreds of generations). Kingsolver et al. (2009) have explored, using the tobacco hornworm, Manduca sexta (Linnaeus, 1763), the question of the evolution in a constant temperature as altering the adaptation to fluctuating temperature conditions; these authors compared a field population that routinely experiences fluctuating temperatures, and a laboratory population maintained at a constant temperature for more than 250 generations, and showed that diurnal fluctuations significantly alter body size and development time in both populations, and confirmed that these populations differ in their responses to a mean temperature. As a consequence, we could suspect that the results of this analysis might have been different if the experiments would have been carried out in the laboratory with first generation individuals from the field.
Another caveat of the data I used is that there is no variability in the morphological traits; the ideal situation would have been to have the actual body measurements and ratios of the phenotype from same specimens used in the experiments. In triatomines it has been shown that phenotypic traits (including morphological measurements) may differ for the same species when their geographical origin (reflecting modified environmental conditions) is different. E.g., Carmona-Galindo et al. (2020) found that the variation in the size, shape, and coloration of the triatomines species T. dimidiata in El Salvador varied in relation to elevation, Holdridge life zone, soil type, and land use, and were able to characterize the local morphological adaptations of T. dimidiata with respect to the local ecological, biological, and geographical conditions. The issue of phenotypic plasticity in triatomines is sometimes so serious that leads to the successive splitting or lumping of species. E.g., Nattero et al. (2017) found that the cryptic triatomine species T. sordida from Argentina, differed from T. sordida from Brazil and Bolivia in all measured shape traits, suggesting that the putative new species may not be cryptic; and recently Dorn et al. (2018), based upon characters found on the pronotum, legs, and abdomen of a population of the triatomine T. dimidiata from a cave in Belize, considered those specimens as a new species, Triatoma mopan. However, unfortunately no such measurements were ever present in the dataset of the laboratory experiments used in the data I compiled.
Some of the results of my analysis (e.g., that source of blood meals and their frequency did not influence fitness) might seem to invalidate the studies from where the data was obtained. However, this is not the case, for this analysis was carried out using data of 36 species and, as such, the results represent the overall effects among species and do not really invalidate any of the specific studies used as data source, where the opposite effects could be true.
My analysis can be considered as a modest probe in trying to relate life history and evolution in triatomines; I was specifically looking into a very general types of questions: to see if triatomines follow the evolutionary designs of organisms to achieve reproductive success by some measurement of fitness. Whatever design the triatomines show it will be a solution to the ecological problems posed by the environment and subjected to constraints intrinsic to their “bauplan” (Stearns, 2000). In other words, some specific questions addressed by these analyses were of the following type: Why do some triatomines species have a small body size and others a large one? Why do triatomines complete their pre-adult development in a short or in a long time under the same conditions? Why do some triatomines show high fecundity, and others an extremely low one? These types of questions have received here only a very partial answer. Modern methods to answer them resort to non-equilibrium approaches, involving frequency-dependence, density-dependence, evolutionary game theory, adaptive dynamics, and explicit population dynamics that are common in optimization approaches (Stearns, 2000). A more recent methodological approach resorts to genetic mechanisms dealing with challenges such as the genetic correlations between genes or alleles and trade-offs, and how genes interact with the environment to determine life history phenotypes (Flatt and Heyland, 2011). However, these approaches and methods are still being developed, and I hope that the analysis I have presented will contribute to a theoretical framework capable of interpreting the succession of stages in the development of triatomines in terms of morphology, fitness, and environmental factors, a framework that has yet to be constructed.
The original contributions presented in the study are included in the article/Supplementary Material, further inquiries can be directed to the corresponding author.
JR designed and reviewed the literature, collected the data, analyzed the data, and wrote the manuscript.
The author declares that the research was conducted in the absence of any commercial or financial relationships that could be construed as a potential conflict of interest.
I am grateful for the help provided by Eliana Nieves for the transcription of the bibliographic data to a spreadsheet, and to Juliano Morimoto for some useful suggestions on a preliminary version of this article.
The Supplementary Material for this article can be found online at: https://www.frontiersin.org/articles/10.3389/fevo.2021.651683/full#supplementary-material
Araujo Monteiro, F., Weirauch, C., Felix, M., Lazoski, C., and Abad-Franch, F. (2018). Evolution, systematics, and biogeography of the triatominae, vectors of chagas disease. Adv. Parasitol. 99, 265–344. doi: 10.1016/bs.apar.2017.12.002
Bell, H. (2011). “Foreword: harvey’s legacy,” in Mechanisms of Life History Evolution. The Genetics and Physiology of Life History Traits and Trade-Offs, eds T. Flatt and A. Heyland (Oxford: Oxford University Press), vi–viii.
Bello-Bedoy, R., Peiro-Nuño, H., Córdoba-Aguilar, A., Flores-López, C. A., Romero-Figueroa, G., Arteaga, M. C., et al. (2019). Ontogenetic changes in wild chagasic bugs (Dipetalogaster maximus): exploring morphological adaptations in pre-adult and adult stages. Rev. Mex. Biodivers. 90:e902664. doi: 10.22201/ib.20078706e.2019.90.2664
Bengstron, M. (1969). Estimating provisional values for intrinsic rate of natural increase in population growth studies. Aust. J. Sci. 32, 24–30.
Braga, M. V., and Lima, M. M. (2001). Efeitos de níveis de privação alimentar sobre a oogênese de Panstrongylus megistus. [Effects of food deprivation levels on the oogenesis of Panstrongylus megistus]. Rev. Saúde Pública 35, 312–314. doi: 10.1590/s0034-89102001000300015
Breiman, L., and Cutler, A. (2018). Package ‘Randomforest’. Random Forests for Classification and Regression. Version 4.6-14. Available online at: https://www.stat.berkeley.edu/~breiman/RandomForests/ (accessed December 25, 2020).
Cabello, D. R. (1999). Effects of environmental temperature on life tables of Rhodnius neivai lent, 1953 (Hemiptera: Reduviidae) under experimental conditions. Mem. Inst. Oswaldo Cruz 94, 709–714. doi: 10.1590/s0074-02761999000500028
Cabello, D. R., Lizano, E., and Valderrama, A. (1988). Efecto de la frecuencia alimentaria sobre algunos parámetros poblacionales de Rhodnius neivai. Mem. Inst. Oswaldo Cruz 83, 441–446. doi: 10.1590/s0074-02761988000400008
Carmona-Galindo, V. D., Marín Recinos, M. F., Gámez Hidalgo, S. A., Recinos Paredes, G., Posada Vaquerano, E. E., Romero-Magaña, A. L., et al. (2020). Morphological variability and ecological characterization of the Chagas disease vector Triatoma dimidiata (Hemiptera: Reduviidae) in El Salvador. Acta Trop. 205:105392. doi: 10.1016/j.actatropica.2020.105392
Chagas, C. (1909). Nova tripanozomiaze humana: estudos sobre a morfolojia e o ciclo evolutivo do Schizotrypanum cruzi n. gen., n. sp., ajente etiolojico de nova entidade morbida do homem. Mem. Inst. Oswaldo Cruz 1, 159–218. doi: 10.1590/S0074-02761909000200008
Clark, N. (1935). The Effect of temperature and humidity upon the eggs of the bug, Rhodnius prolixus (Heteroptera, Reduviidae). J. Anim. Ecol. 4, 82–87. doi: 10.2307/1215
Cole, L. C. (1954). The population consequences of life history phenomena. Q. Rev. Biol. 29, 103–137. doi: 10.1086/400074
Cordero-Montoya, G., Flores-Villegas, A. L., Salazar-Schettino, P. M., Vences-Blanco, M. O., Rocha-Ortega, M., Gutiérrez-Cabrera, A. E., et al. (2019). The cost of being a killers accomplice: Trypanosoma cruzi impairs the fitness of kissing bugs. Parasitol. Res. 118, 2523–2529. doi: 10.1007/s00436-019-06413-8
Córdoba-Aguilar, A. (2020). Chagas bugs and Trypanosoma cruzi: puppets and puppeteer? Acta Trop. 211:105600. doi: 10.1016/j.actatropica.2020.105600
Cortico Correa Rodrigues, V. L., Ferraz Filho, A. N., Olavo, da Rocha, and Silva, E. (2007). Triatoma tibiamaculata (Pinto, 1926): life table for nymphs, duration of adult forms and oviposition of females. Rev. Soc. Bras. Med. Trop. 40, 443–446. doi: 10.1590/s0037-86822007000400014
Da Silva, I. G. (1990). The influence of temperature on the biology of triatominae. Xiii. Dipetalogaster maximus (Uhler, 1894) (Hemiptera, Reduviidae). Anais Soc. Entomol. Bras. 19, 111–119. doi: 10.1590/s0074-02761987000100018
Da Silva, I. G., and Da Silva, H. H. G. (1988). The influence of temperature on the biology of triatominae. IV. Triatoma infestans (Klug, 1834) (Hemiptera, Reduviidae). Anais Soc. Entomol. Bras. 17, 443–454.
Damborsky, M. P., Bar, M. E., and Gorla, D. (2005). Life cycle and reproductive patterns of Triatoma rubrovaria (Blanchard, 1843) (Hemiptera: Reduviidae) under constant and fluctuating conditions of temperature and humidity. Rev. Soc. Bras. Med. Trop. 38, 433–437. doi: 10.1590/s0037-86822005000500014
Dorn, P. L., Justi, S. A., Dale, C., Stevens, L., Galvao, C., Lima-Cordón, R., et al. (2018). Description of Triatoma mopan sp. n. from a cave in Belize (Hemiptera. Reduviidae, Triatominae). Zookeys 775, 69–95. doi: 10.3897/zookeys.775.22553
Engen, S., and Saether, B. E. (2016). r-and K-selection in fluctuating populations is determined by the evolutionary trade-off between two fitness measures: growth rate and lifetime reproductive success. Evolution 71, 167–173. doi: 10.1111/evo.13104
Flatt, T., and Heyland, A. (eds) (2011). Mechanisms of Life History Evolution: The Genetics and Physiology of Life History Traits and Trade-Offs. Oxford: Oxford University Press.
Galliard, H. (1936). Récherches sur les réduvidés hématophages Rhodnius et Triatoma. VIII. le developpement de l’eoeuf des triatomes a température constante. Ann. Parasitol. Hum. Compa. 14, 97–112.
Gareth, J., Witten, D., Hastie, T., and Tibshirani, R. (2014). An Introduction to Statistical Learning with Applications in R. New York, NY: Springer.
Gillooly, J. F., Charnov, E. L., West, G. B., Savage, V. M., and Brown, J. H. (2002). Effects of size and temperature on developmental time. Nature 417, 70–73. doi: 10.1038/417070a
Gomes, A. B., and da Silva, I. G. (2002). Influence of temperature on the biology of Triatominae. XXI. Triatoma jurbergi Carcavallo, Galvao & Lent, 1998, (Hemiptera, Reduviidae). Med. Vet. Entomol. 90:248.
Guarneri, A. A., Pereira, M. H., and Diotaiuti, L. (2000). Influence of the blood meal source on the development of Triatoma infestans, Triatoma brasiliensis, Triatoma sordida, and Triatoma pseudomaculata (Heteroptera, Reduviidae). J. Med. Entomol. 37, 373–379. doi: 10.1603/0022-2585(2000)037[0373:iotbms]2.0.co;2
Gürtler, R. E., Fernández, M., del, P., Cecere, M. C., and Cohen, J. E. (2017). Body size and hosts of Triatoma infestans populations affect the size of bloodmeal contents and female fecundity in rural northwestern Argentina. PLoS Negl. Trop. Dis. 11:e0006097. doi: 10.1371/journal.pntd.0006097
Hendry, A. P. (2015). Key questions on the role of phenotypic plasticity in eco-evolutionary dynamics. J. Hered. 107, 25–41. doi: 10.1093/jhered/esv060
Kingsolver, J. G., Hoekstra, H. E., Hoekstra, J. M., Berrigan, D., Vignieri, S. N., Hill, C. E., et al. (2001). The strength of phenotypic selection in natural populations. Am. Nat. 157, 245–261. doi: 10.2307/3079189
Kingsolver, J. G., Ragland, G. J., and Diamond, S. E. (2009). Evolution in a constant environment: thermal fluctuations and thermal sensitivity of laboratory and field populations of Manduca sexta. Evolution 63, 537–541. doi: 10.1111/j.1558-5646.2008.00568.x
Lent, H., Carcavallo, R. U., Martínez, A., Galíndez Girón, I., Jurberg, J., Galvao, C., et al. (1998). “Anatomic relationships and characterization of the species,” in Atlas of Chagas’ Disease Vectors in the Americas, Vol. I, eds R. U. Carcavallo, I. Galíndez Girón, J. Jurberg, and H. Lent (Rio de Janeiro: Editorial FioCruz), 245–264.
Lent, H., and Wygodzinsky, P. (1979). Revision of the triatominae (Hemiptera, Reduviidae), and their significance as vectors of chagas’ disease. Bull. Am. Mus. Nat. Hist. 163, 123–520.
Lunardi, R. R., Benítez, H. A., Peres Camara, T., Pinho Gomes, L., and Arrais-Silva, W. W. (2017). Head shape variation in response to diet in Triatoma williami (Hemiptera, Reduviidae, Triatominae), a possible Chagas disease vector of legal Amazonia. Zool. Anz. 267, 187–193. doi: 10.1016/j.jcz.2017.04.001
Luz, C., Fargues, J., and Grunewald, J. (1999). Development of Rhodnius prolixus (Hemiptera: Reduviidae) under constant and cyclic conditions of temperature and humidity. Mem. Inst. Oswaldo Cruz 94, 403–409. doi: 10.1590/s0074-02761999000300022
Martínez-Ibarra, J. A., Novelo López, M., Hernández Robles, M. R., and Grant Guillén, Y. (2003). Influence of the blood meal source on the biology of Meccus picturatus Usinger 1939 (Hemiptera: Reduviidae: Triatominae) under Laboratory Conditions. Mem. Inst. Oswaldo Cruz 98, 227–232. doi: 10.1590/s0074-02762003000200011
Martínez-Ibarra, J. A., Salazar-Schettino, P. M., Solorio-Cibrián, M., Cabrera Bravo, M., Novelo-López, M., Vences, M. O., et al. (2008). Influence of temperature and humidity on the biology of Triatoma mexicana (Hemiptera: Reduviidae: Triatominae) under laboratory conditions. Mem. Inst. Oswaldo Cruz 103, 719–723. doi: 10.1590/s0074-02762008000700015
Medone, P., Rabinovich, J. E., Nieves, E., Ceccarelli, S., Canale, D., Stariolo, R. L., et al. (2012). “The quest for immortality in triatomines: a meta-analysis of the senescence process in hemimetabolous hematophagous insects,” in Senescence, ed. T. Nagata (Rijeka: INTECH), 225–250.
Mousseau, T. A., and Roff, D. A. (1987). Natural selection and the heritability of fitness components. Heredity 59, 181–197. doi: 10.1038/hdy.1987.113
Nattero, J., Malerba, R., Rodríguez, C. S., and Crocco, L. (2013a). Phenotypic plasticity in response to food source in Triatoma infestans (Klug, 1834) (Hemiptera, Reduviidae: Triatominae). Infect.Genet. Evol. 19, 38–44. doi: 10.1016/j.meegid.2013.06.014
Nattero, J., Piccinali, R. V., Lopes, C. M., Hernández, M. L., Abrahan, L., Lobbia, P. A., et al. (2017). Morphometric variability among the species of the Sordida subcomplex (Hemiptera: Reduviidae: Triatominae): evidence for differentiation across the distribution range of Triatoma sordida. Parasites Vectors 10:412.
Nattero, J., Rodríguez, C. S., and Crocco, L. (2013b). Effects of blood meal source on food resource use and reproduction in Triatoma patagonica del ponte (Hemiptera, Reduviidae). J. Vector Ecol. 38, 127–133. doi: 10.1111/j.1948-7134.2013.12018.x
Paluszynska, A., Biecek, P., and Jiang, Y. (2020). Package ‘Random Forest Explainer’. Explaining and Visualizing Random Forests in Terms of Variable Importance. Version 0.10.1. Available online at: https://github.com/ModelOriented/randomForestExplainer (accessed November 15, 2020).
Pelosse, P., and Kribs-Zaleta, C. M. (2012). The role of the ratio of vector and host densities in the evolution of transmission modes in vector-borne diseases. The example of sylvatic Trypanosoma cruzi. J. Theor. Biol. 312, 133–142. doi: 10.1016/j.jtbi.2012.07.028
Pelosse, P., Kribs-Zaleta, C. M., Ginoux, M., Rabinovich, J. E., Gourbière, S., and Menu, F. (2013). Influence of vectors’ risk-spreading strategies and environmental stochasticity on the epidemiology and evolution of vector-borne diseases: the example of Chagas disease. PLoS One 8:e70830. doi: 10.1371/journal.pone.0070830
R Core Team (2019). R: A Language and Environment for Statistical Computing. Available online at: https://www.r-project.org/ (accessed December 25, 2020).
Rabinovich, J. (1974). “Demographic strategies in animal populations: a regression analysis,” in Tropical Ecological Systems, eds F. B. Golley and E. Medina (New York, NY: Springer Verlag), 19–40. doi: 10.1007/978-3-642-88533-4_3
Rabinovich, J. E., Pietrokovsky, S., and Wisnivesky-Colli, C. (2006). Temperature and Development Rate of Triatoma guasayana (Hemiptera: Reduviidae) eggs under laboratory conditions: physiological and adaptive aspects. Physiol. Entomol. 31, 361–370. doi: 10.1111/j.1365-3032.2006.00529.x
Rabinovich, J. R. (1980). Introducción a la Ecología de Poblaciones Animales. Mexico: Compañía Editorial Continental (CECSA).
Ramírez-González, M. G., Flores-Villegas, A. L., Salazar-Schettino, P. M., Gutiérrez-Cabrera, A. E., Rojas-Ortega, E., and Córdoba-Aguilar, A. (2019). Zombie bugs? Manipulation of kissing bug behavior by the parasite Trypanosoma cruzi. Acta Tropica 200:105177. doi: 10.1016/j.actatropica.2019.105177
Rolandi, C., and Schilman, P. E. (2018). The costs of living in a thermal fluctuating environment for the tropical haematophagous bug, Rhodnius prolixus. J. Therm. Biol. 74, 92–99. doi: 10.1016/j.jtherbio.2018.03.022
Ruel, J. J., and Ayres, M. P. (1999). Jensen’s inequality predicts effects of environmental variation. Trends Ecol. Evol. 14, 361–366. doi: 10.1016/s0169-5347(99)01664-x
Sant’Anna, V. M. R., Diotaiuti, L., de Figueiredo Gontijo, A., de Figueiredo Gontijo, N., and Pereira, M. H. (2001). Feeding behavior of morphologically similar Rhodnius species: influence of mechanical characteristics and salivary function. J. Insect Physiol. 47, 1459–1465. doi: 10.1016/s0022-1910(01)00136-6
Southwood, T. R. E. (1978). Ecological Methods, with Particular Reference to the Study of Insect Populations. London: The English Language Book Society (ELBS) and Chapman-Hall.
Stearns, S. C. (2000). Life history evolution: successes, limitations, and prospects. Naturwissenschaften 87, 476–486. doi: 10.1007/s001140050763
Villegas García, J. C., and Santillán Alarcón, S. (2004). The Influence of two Different Temperatures on Meccus pallidipennis Stal, 1872 (Hemiptera: Reduviidae: Triatominae) in Laboratory. Entomol. Vectores 11, 445–456.
Zeledón, R., Guardia, V., Zúñiga, A., and Swartzwelder, J. C. (1970). Biology and ethology of triatoma dimidiata (Latreille, 1811). I. life cycle, amount of blood ingested, resistance to starvation, and size of adults. Journal of Medical Entomology 7, 313–319. doi: 10.1093/jmedent/7.3.313
Keywords: kissing bugs, fitness, phenotype, Chagas disease, triatominae, life history, temperature, development time
Citation: Rabinovich JE (2021) Morphology, Life Cycle, Environmental Factors and Fitness – a Machine Learning Analysis in Kissing Bugs (Hemiptera, Reduviidae, Triatominae). Front. Ecol. Evol. 9:651683. doi: 10.3389/fevo.2021.651683
Received: 10 January 2021; Accepted: 04 February 2021;
Published: 23 February 2021.
Edited by:
Aurore Ponchon, University of Aberdeen, United KingdomReviewed by:
Jader Oliveira, University of São Paulo, BrazilCopyright © 2021 Rabinovich. This is an open-access article distributed under the terms of the Creative Commons Attribution License (CC BY). The use, distribution or reproduction in other forums is permitted, provided the original author(s) and the copyright owner(s) are credited and that the original publication in this journal is cited, in accordance with accepted academic practice. No use, distribution or reproduction is permitted which does not comply with these terms.
*Correspondence: Jorge E. Rabinovich, am9yZ2UucmFiaW5vdmljaEBnbWFpbC5jb20=
Disclaimer: All claims expressed in this article are solely those of the authors and do not necessarily represent those of their affiliated organizations, or those of the publisher, the editors and the reviewers. Any product that may be evaluated in this article or claim that may be made by its manufacturer is not guaranteed or endorsed by the publisher.
Research integrity at Frontiers
Learn more about the work of our research integrity team to safeguard the quality of each article we publish.