
94% of researchers rate our articles as excellent or good
Learn more about the work of our research integrity team to safeguard the quality of each article we publish.
Find out more
ORIGINAL RESEARCH article
Front. Ecol. Evol., 24 June 2021
Sec. Biogeography and Macroecology
Volume 9 - 2021 | https://doi.org/10.3389/fevo.2021.645396
This article is part of the Research TopicRoles and Implications of Functional Traits and Phylogenies to Characterize Refugia Under Increasing Climate VariabilityView all 8 articles
 Sebastian Acevedo
 Brody Sandel*
Human activities have dramatically altered the distribution and abundance of species, and our impacts are likely to increase in the near future. Conservation efforts are typically faced with scarce resources, forcing us to prioritize areas based in part on estimates of their conservation value. Two major factors in conservation value are a species uniqueness and its extinction risk. Though these ideas are multidimensional, one important component of uniqueness is evolutionary distinctness, while risk is strongly related to geographic range size. These components are combined in an assemblage-level measure called phylogenetic endemism (PE), which measures the degree to which the species in an assemblage are small-ranged and phylogenetically distinct. Broad-scale patterns and correlates of PE are becoming better known for a variety of groups, and have been shown to depend on current climate, geographic isolation and long-term climate stability. Human impacts (e.g., land cover changes), are likely to shape PE as well, though the coarse resolution of most previous studies may make this difficult to detect. Overall, PE patterns at fine spatial and temporal resolutions are not well understood. Here, we fill this gap using data from the North American Breeding Bird Survey. These data comprise a long-term annual record with fine spatial resolution and a near-continental extent. We assess geographic patterns and trends in PE, and relate these to a range of putative predictor variables including measures of current climate, land cover, long-term and recent climate change. Bird PE is concentrated in three main hotspots: the west coast, the southeast and south-central Canada east of the Rockies. High PE values tended to occur in regions with high temperatures and stability in temperature, both in the long (21,000 year) and short (35 year) time scales. PE patterns are driven more strongly by patterns of range size than phylogenetic distinctiveness, and are trending gradually upward, driven by increasingly frequent sightings of small-ranged species. These results indicate the importance of climate stability on multiple time scales in influencing endemism patterns and suggest a surprisingly minor influence of direct human land use. The increase in PE through time may reflect successful conservation efforts that have led to population recoveries of some small-ranged species.
Ongoing global anthropogenic change threatens many species’ survival and has accelerated extinction rates beyond typical background rates (Ceballos et al., 2010, 2015; Barnosky et al., 2011). The loss of biodiversity brings a loss of ecosystem functions and services (Naeem et al., 1994; Cardinale et al., 2012), making the conservation of remaining biodiversity a high priority. A growing body of literature works toward identifying those lineages most at risk due to high levels of endemism and most valuable due to their evolutionary distinctness (Jetz et al., 2007, 2014; Rosauer et al., 2009). This biogeographical research can help prioritize conservation work by highlighting regions and populations under threat. The finite resources available to conservation programs require this prioritization. As such, research into regional hotspots where anthropogenic change presently threatens or will threaten the greatest loss of biodiversity can inform environmental policy and combat the loss of evolutionary history (Margules et al., 2002).
Various metrics have been developed for assessing the conservation significance of a region in comparison to surrounding areas, whether these occur at the country, continental, or global spatial extent (Belmaker and Jetz, 2011; Daru et al., 2020). Past studies have used species richness alongside factors of potential biodiversity loss to evaluate whether or not a particular region represents a conservation priority hotspot (Fleishman et al., 2006; Tucker et al., 2012). Yet, these analyses which focus on taxonomic diversity alone do not consider the distinct evolutionary histories among different species (Redding and Mooers, 2006). Phylogenetic endemism (PE), on the contrary, incorporates phylogenetic information with species range sizes to measure the extent to which an assemblage contains phylogenetically distinct and geographically restricted clades (Rosauer et al., 2009; Sandel et al., 2020). Areas with high PE represent conservation priority hotspots as losses in that area could lead to a disproportionate loss of phylogenetic diversity (Tucker et al., 2012; Rosauer and Jetz, 2015).
Ecological and anthropogenic effects alike drive patterns of PE, as both impact species distributions and relative abundance within a region. Often, endemism is concentrated in climate refugia (Keppel et al., 2012)—sites that contain relatively stable climates during periods of change (Sandel et al., 2011, 2020). Refugia may contain both more small-ranged species and more phylogenetic diversity. Species ranges contract into refugia and then expand back out at different rates, with the result that small-ranged species are likely to be concentrated around a refuge, while large-ranged species will be less so (Svenning and Skov, 2004; Normand et al., 2011). In addition, by acting as “museums” of biodiversity with relatively low extinction rates (Nekola, 1999), refugia may also contain more phylogenetically unique species (Costion et al., 2015). Both processes should tend to produce high values of PE in and around refugia.
Other factors beyond climate stability can also influence endemism. Geographic isolation, for instance, contributes to high levels of endemism on islands (Kier et al., 2009) and mountain peaks (Noroozi et al., 2018), which would lead to an increase in the PE of these regions. At a global scale, high PE is associated with high temperatures and precipitation (Rosauer and Jetz, 2015; Sandel et al., 2020), suggesting that anthropogenic climate change may lead to changes in the distribution of PE. Changing landscape patterns in anthropogenic environments may also favor generalist over specialist species and threaten small-ranged endemics, tending to reduce PE (Ferrer-Sánchez and Rodríguez-Estrella, 2015; González-Orozco et al., 2015; Mimet et al., 2019). However, most studies of PE patterns lack the temporal or spatial resolution to assess changes through time in local assemblages.
Several studies have examined the phylogenetic endemism of various taxa of terrestrial vertebrates and plants (e.g., Mishler et al., 2014, 2020; Thornhill et al., 2016, 2017). For mammals, high PE has been found among island, tropical, and mountainous regions in the Southern Hemisphere (Rosauer and Jetz, 2015; Daru et al., 2019), correlating with energy availability, high elevation, low climate velocity, and geographic isolation (Rosauer and Jetz, 2015). Similar trends in PE appear among trees, with declines in PE in the north and geographic isolation or environmental heterogeneity promoting increased PE overall (Sandel et al., 2020). For amphibians, evolutionarily distinct populations are disproportionately affected by human land-use (Greenberg et al., 2018). Bird PE, the focus of this paper, has been found to be highest in tropical regions (Daru et al., 2019). As is the case with amphibians, areas with low climate velocities have been associated with bird endemism, though to a weaker extent than has been found among amphibian populations as a result of birds’ greater dispersal abilities (Sandel et al., 2011).
Of critical importance for PE analyses is the spatial grain size that is applied (Laffan, 2018; Daru et al., 2020). Environmental correlates of PE can be lost by partitioning a large region into fine-grained cells (e.g., 50 × 50 km) vs. into coarse-grained cells (e.g., 800 × 800 km), and vice versa (Daru et al., 2020), a general problem known as the modifiable areal unit problem (Openshaw, 1984; Sandel, 2015). Similarly, grain size has also been documented to influence the observed effects of environmental variables on patterns of species richness, with climatic variables such as temperature being less effective at predicting patterns of richness at finer scales (Belmaker and Jetz, 2011). While a fairly clear picture of coarse-grained PE patterns is beginning to appear for a variety of groups, drivers of PE patterns at a local scale are still poorly understood. Here, we address this gap using North American Breeding Bird Survey data with high spatial and temporal resolution.
We evaluate 35 years of BBS data for the US and Canada alongside environmental variables to explore the patterns and drivers of fine-scale bird PE. In particular, we ask: (i) where and in what environmental conditions is phylogenetic endemism high? (ii) to what extent are PE patterns driven by phylogenetic distinctness vs. small geographic range sizes? (iii) where and in what conditions is PE increasing/decreasing? (iv) how much of this change is attributable to change in phylogenetic diversity or weighted endemism? (v) how consistent are environment-PE relationships through time?
Bird observation data were gathered from North American Breeding Bird Survey (BBS) records for the United States and Canada (Pardieck et al., 2020). The BBS is an ongoing initiative of trained volunteer bird counters coordinated by the United States Geological Survey, the Canadian Wildlife Service, and the Mexican National Commission for the Knowledge and Use of Biodiversity. Volunteers follow predetermined roadside survey routes identifying bird species by sound and sight. Each route consists of 50 independent stops each separated by 800 m where the trained observer records a count of all birds seen and heard within a 400 m radius (Sauer et al., 2013). The same routes and stops are surveyed annually, save for when the occasional route or stop is adjusted for safety or access reasons (Sauer et al., 2013).
Our subset of BBS data consists of 5519 routes across the United States and Canada covering the 35-year period from 1979 to 2013. This excludes early years of the BBS, during which there were fewer routes and sampling was more spatially biased. Due to inconsistent data collection, routes often differ in the number of years of data that have accumulated. Despite this, each survey route often contains many years of bird abundance data (median = 21 years of the 35 possible) useful for analyzing trends among bird communities.
We used the bird phylogeny produced by Jetz et al. (2012), focusing on the Ericson et al. (2006) backbone. This tree includes the 9,993 extant bird species of the world classified at that time. However, taxonomic changes since the time of its publication caused discrepancies between BBS and Jetz et al. (2012) classifications of species. This required synonymizing species names between the two datasets. In the case of a genus change made by the American Ornithologists Union post 2012 for a bird species, the species from the BBS was treated as if it still belonged to the previous genus as was used by Jetz et al. (2012). For instances where the AOU split a species into two new species post 2012, the two species from the BBS were considered the same species to reflect the phylogenetic classification used by Jetz et al. These changes (Supplementary Table 1) allowed the naming convention used by the BBS to be matched with Jetz et al. (2012) at the cost of the ability to include the most current AOU taxonomic changes. Following the name matching, only 0.66% of observations in the BBS could not be placed on the phylogeny; these names reflect hybrids or unspecific observations (e.g., Empidonax sp.).
Jetz et al. (2012) also provide phylogenies based on a Hackett et al. (2008) backbone. Computing PE or PD based on this phylogeny produced estimates that are highly correlated with those from the Erickson backbone phylogenies (r > 0.99), so we consider only results for the Ericson backbone here.
We used the R package ape (Paradis et al., 2004) to read and manipulate the phylogenetic trees.
PE depends on a measure of each taxon’s range size, and is typically obtained by counting the number of occurrences in the taxon-by-site matrix for each taxon. However, our focus on the United States and Canada means that we have not captured the full global distribution of many species, with those near the borders of our region being most likely to have their ranges truncated. To avoid underestimating these species’ range sizes, we used the size of each species’ global distribution, as mapped by BirdLife International (BirdLife International and Handbook of the Birds of the World., 2017)1. Further synonymy work was required to match this dataset with Jetz et al. (2012) and, by extension, that of the BBS. This was accomplished by reversing certain AOU taxonomic changes made after 2017, the publication date of the BirdLife International range maps, in much the same way as was performed between the BBS and Jetz et al. (2012) datasets. Note that this did not alter the tree topology, but simply allowed matching of names between datasets. Supplementary Table 1 details all synonomy changes made for the purposes of our analyses.
Global range maps were projected onto a Behrmann equal area projection and rasterized at a resolution of 25 × 25 km. To characterize the range size of a clade, we calculated the area of the union of the range maps of all species in that clade. These operations used the R packages maptools (Bivand and Lewin-Koh, 2017) and raster (Hijmans, 2016).
For each BBS route in each year, we computed several measures of the bird assemblage. These were the phylogenetic endemism (PE), phylogenetic diversity (PD) and weighted endemism (WE, Crisp et al., 2001). Conceptually, PE combines information on PD with WE, so we also explored these metrics to understand their contribution to measured PE patterns. PD is also typically correlated with species richness, so we also computed species richness (S) for each route in each year.
PD (Faith 1992) is measured as the total branch length of the subtree containing all the species in an assemblage. Here, we use the unrooted PD, which does not include the branch to the root in the case that the root node is not in this subtree (unrooted and rooted PD values are nearly identical in this case, r = 0.9999).
Though they can be formulated more generally (Laffan et al., 2016), the equations for WE and PE simplify when one focuses on single cell assemblages, as we do here. WE was calculated as the sum of the inverse range sizes of all species in an assemblage. Therefore, each species counts toward the WE, but small-ranged species contribute much more to WE than do large-ranged species. For this purpose, we used the global range size for each species as measured by the BirdLife range maps.
PE incorporates elements from both of these concepts (Rosauer et al., 2009; Sandel et al., 2020). It was calculated in the same manner as PD, but using a phylogenetic tree with rescaled branch lengths. In this tree, each branch’s length was divided by the range area of the descendent clade. Thus, branches leading to widespread clades were relatively shorter than in the original phylogeny, while those leading to narrowly distributed clades were relatively longer. On this rescaled tree branch lengths are expressed as millions of years per km2. Following this rescaling of the phylogeny, we then simply calculate the PD for each assemblage. We used the R package PhyloMeasures 2.1 (Tsirogiannis and Sandel, 2016) to compute PD (and by extension, PE).
In this way, we obtained an estimate of PE, PD, WE and S for each route in each year. For each route, we then computed the mean of each of these variables across all years in which it was sampled. For routes with at least 15 years of data, we also computed the linear trend in each of these variables by fitting a linear model to describe the increase or decrease in each metric over time. We used the slope of this line to describe the trend.
To integrate our calculated metrics of PE, PD, WE and S with predictor variables, we chose a set of environmental correlates that have potential to influence patterns of bird endemism or evolution. These included: Mean annual temperature, annual precipitation, land cover, climate-change velocity, surface roughness, and human influence. Each was measured at either the centroid of a BBS route, or if specified below, within a 20 km buffer around it.
Mean annual temperature (Temp) and annual precipitation (Prec) records were acquired from the CHELSA (Climatologies at high resolution for the earth’s land surface areas) dataset (Karger et al., 2017), which improves on previous estimates by incorporating some process-based downscaling rather than a simple statistical interpolation. We used annual estimates of Temp and Prec from 1979 to 2013 and also computed the mean of these for each BBS route. We also computed the linear trend Temp and Prec (Temp_trend and Prec_trend) for each route by taking the slope of the linear regression of annual values over time. Across all routes, the trends in temperature and precipitation through time were approximately linear, though some routes have somewhat non-linear trends. There trends were generally fairly minor compared to inter-annual variability, explaining 17% of the variation for temperature and 8% for precipitation.
For climate-change velocity (Velocity), we used the map from Sandel et al. (2011). This analysis of climate-change velocity from the Last Glacial Maximum (LGM) to the present was applied at a resolution of 0.25 degree. It combines estimates of MAT 21,000 years ago during the LGM with contemporary MAT and spatial MAT patterns to calculate climate-change velocity in m/yr for the entire globe.
Land cover data were collected from the ESA GlobCover 2009 Project processed by the European Space Agency and by the Université catholique de Louvain (Bontemps et al., 2011). Their 300-m land cover map categorizes the world into 22 classifications of land cover type. We simplified their classifications into 8 different land cover types and retained six that had sufficient representation in the data: Crop, Forest, Grassland, Shrubland, Wetland and Urban. For each land cover type, we calculated the proportion of land within 20 km of each route centroid that contained that type. This buffer radius was selected because each survey route is approximately 40 km long. The buffer was computed in the standard USGS Albers Equal Area projection which produces relatively minor distortion over the continental US, and then projected into the geographic coordinate system to extract values from the GlobCover raster.
WorldClim DEM elevation data from Fick and Hijmans (2017) were used to estimate surface roughness (Roughness). This was done by computing the slope at each grid cell, then computing the standard deviations of these slopes within the 20 km buffer around each data point.
Lastly, we used the Human Influence Index (HII) developed by Sanderson et al. (2002) as a final predictor variable. This metric combines population density, land transformation, land accessibility, and electrical power infrastructure to assign a human influence score ranging from 0 to 72 for grid cells at a resolution of 1 km2.
We used random forests to ascribe spatial variation in each response variable to the predictor variables across all BBS routes. Random forests have several advantages in this context: They are robust to overfitting, naturally model complex interactions if they exist and readily fit non-linear response curves (Cutler et al., 2007). For each response variable (PE, PD, and WE), we fit a random forest model using all the above predictor variables: HII, Roughness, Velocity, Temp, Prec, Temp_trend, Prec_trend, and the percent cover of the major land cover types. We used the randomForest package in R, and fit models using the randomForest function with default settings (Liaw and Wiener, 2002). To measure the importance of each variable, we computed the mean decrease in the residual sum of squares when including that variable. Response curves for each predictor variable were visualized by holding each other variable constant at its mean and plotting the predicted values as a function of the focal variable as it varied across its range.
We were interested in understanding what changes in species distributions could explain any large-scale shifts in PE, PD and WE. To that end, we computed, for each species, its occupancy trend. This was calculated by first taking the proportion of sites in a year where the species was seen, then fitting a linear model with respect to the sample year and taking the slope of this model. To account for widely varying overall abundances, we standardized each species’ occupancy proportions to a mean of 0 and standard deviation of 1 before the regression, yielding standardized regression coefficients. Species that are present in an increasing proportion of BBS routes through time thus get positive trends, while those in a decreasing proportion have negative trends.
Trends in PE could be driven by different occupancy trends for large- vs. small-ranged species, or phylogenetically unique vs. redundant species. To describe range size, we simply used the global range size for each species. To describe phylogenetic uniqueness for each species, we randomly drew 100 bird assemblages with an expected richness of 50 species (there was variation around this value due to sampling variation), and computed the PD of the assemblage both without the focal species and with the focal species added to the assemblage. The difference between the mean of these two PD values gives an estimate of a species’ typical contribution to the PD of an assemblage, and thus a measure of its phylogenetic uniqueness. We then fit a linear model to predict variation in species’ occupancy trends from their range size, mean occupancy in BBS routes and phylogenetic uniqueness, and all of their two-way interactions.
Finally, we examined temporal changes in the relationships between PE, PD, or WE and the predictor variables. For each year, we fit a linear model to predict each response variable from all the predictor variables and retained the standardized coefficients from these models. Then, for each response variable, we examined how these regression coefficients changed through time.
Phylogenetic endemism of bird communities tended to be highest across the southern United States and along the east and west coasts (Figure 1A). PE was also elevated in southwestern Canada and in isolated hotspots across the montane western states. Considering the two components of PE: PD and WE (Figures 1B,C), WE and PE are strongly associated, while PE and PD are only weakly so. PD was highly correlated with species richness (Supplementary Figure 1) and was highest in the east and upper midwest.
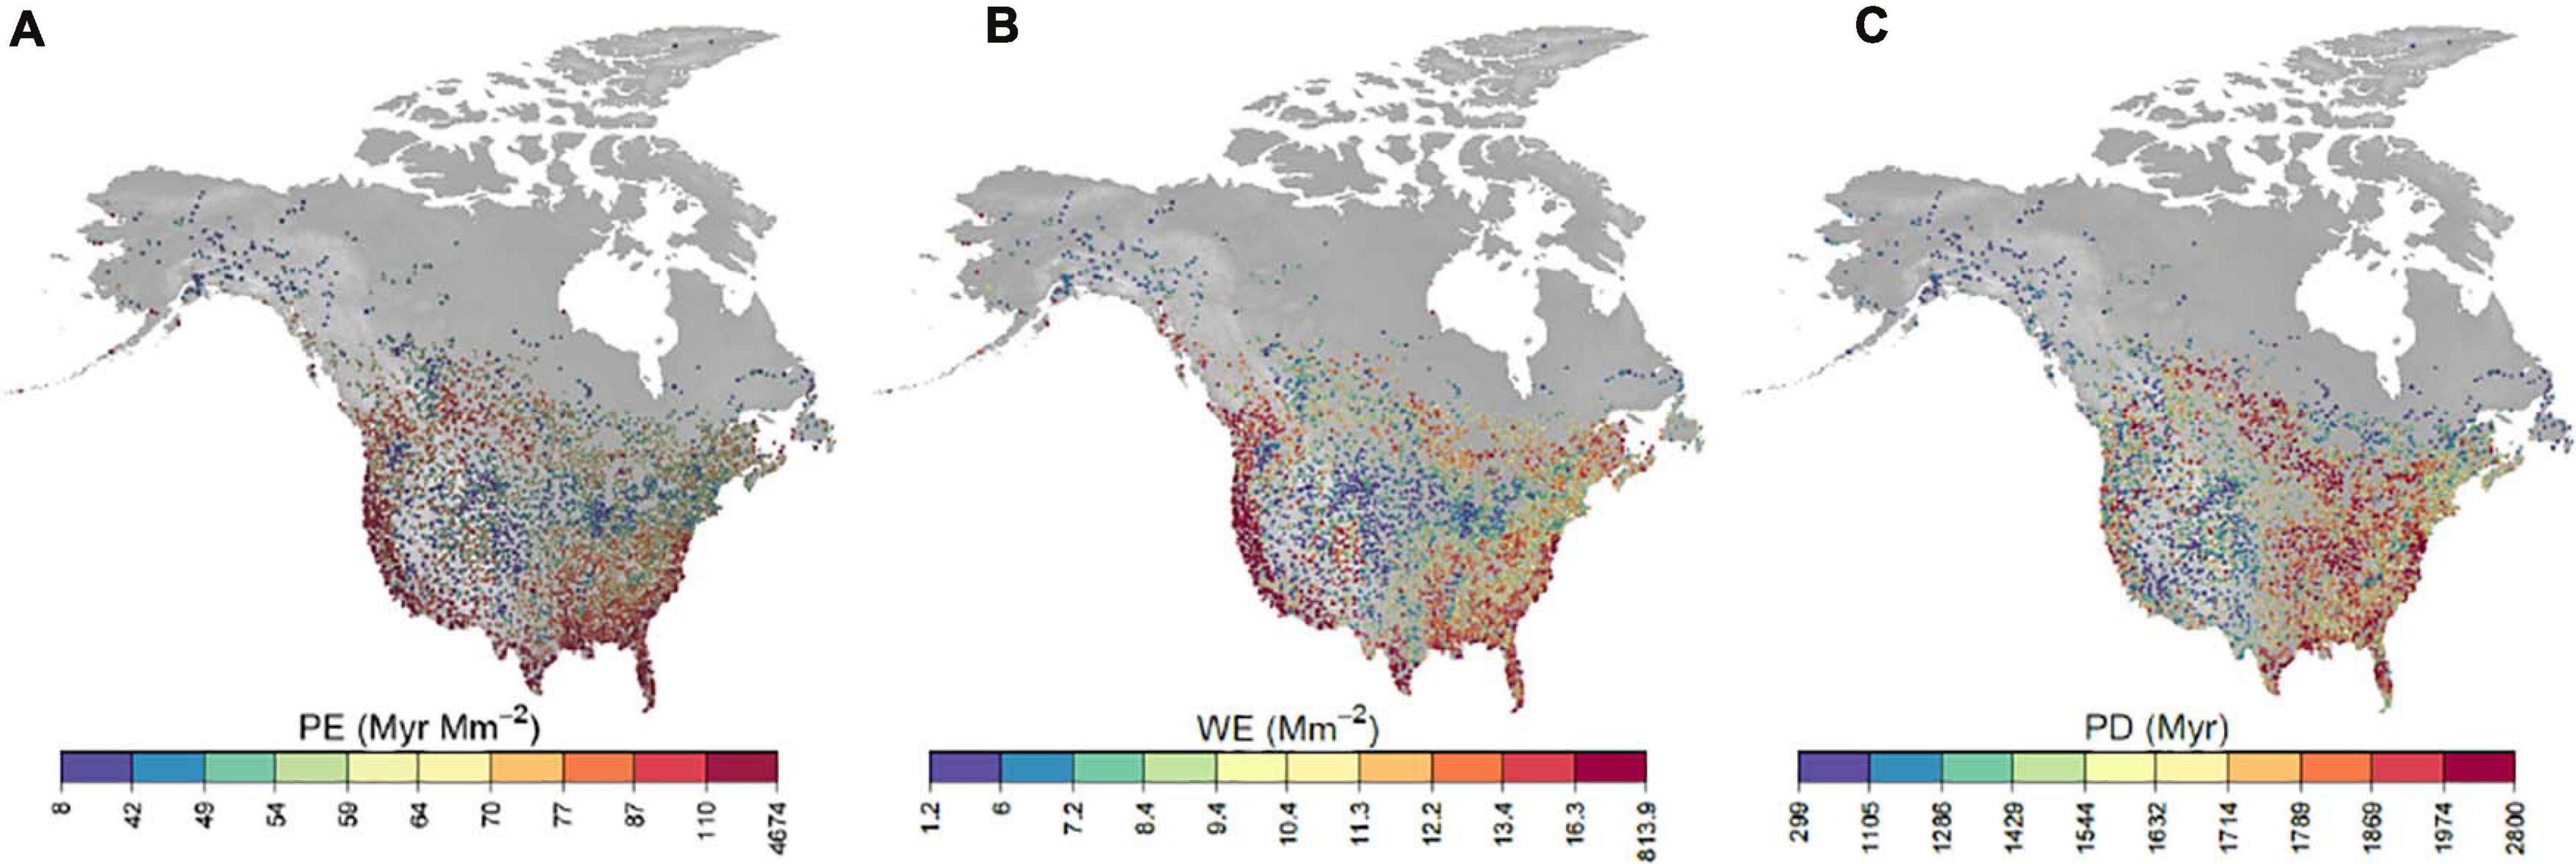
Figure 1. Maps of long-term averages of phylogenetic endemism (A), weighted endemism (B) and phylogenetic diversity (C). Each dot represents a BBS route sampled in at least 1 year. Coloring is based on a percentile coloring scale. Range areas for computing PE and WE were estimated on a 25 × 25 km grid.
We used random forests to fit response curves relating these patterns to environmental variables. Pseudo-R2 values for these fits (squared correlations between observed and predicted values) were generally fairly high, ranging from 0.593 for PD to 0.677 for WE.
High PE was most strongly associated with high mean annual temperatures, recent drying trends, relative stability in recent temperatures, low long-term climate change velocity and wet climates (Figure 2). Environmental correlates of WE were very similar (Supplementary Figure 2), but PD was different, showing the highest values at medium to high values of HII, high temperatures and low surface roughness (Supplementary Figure 3).
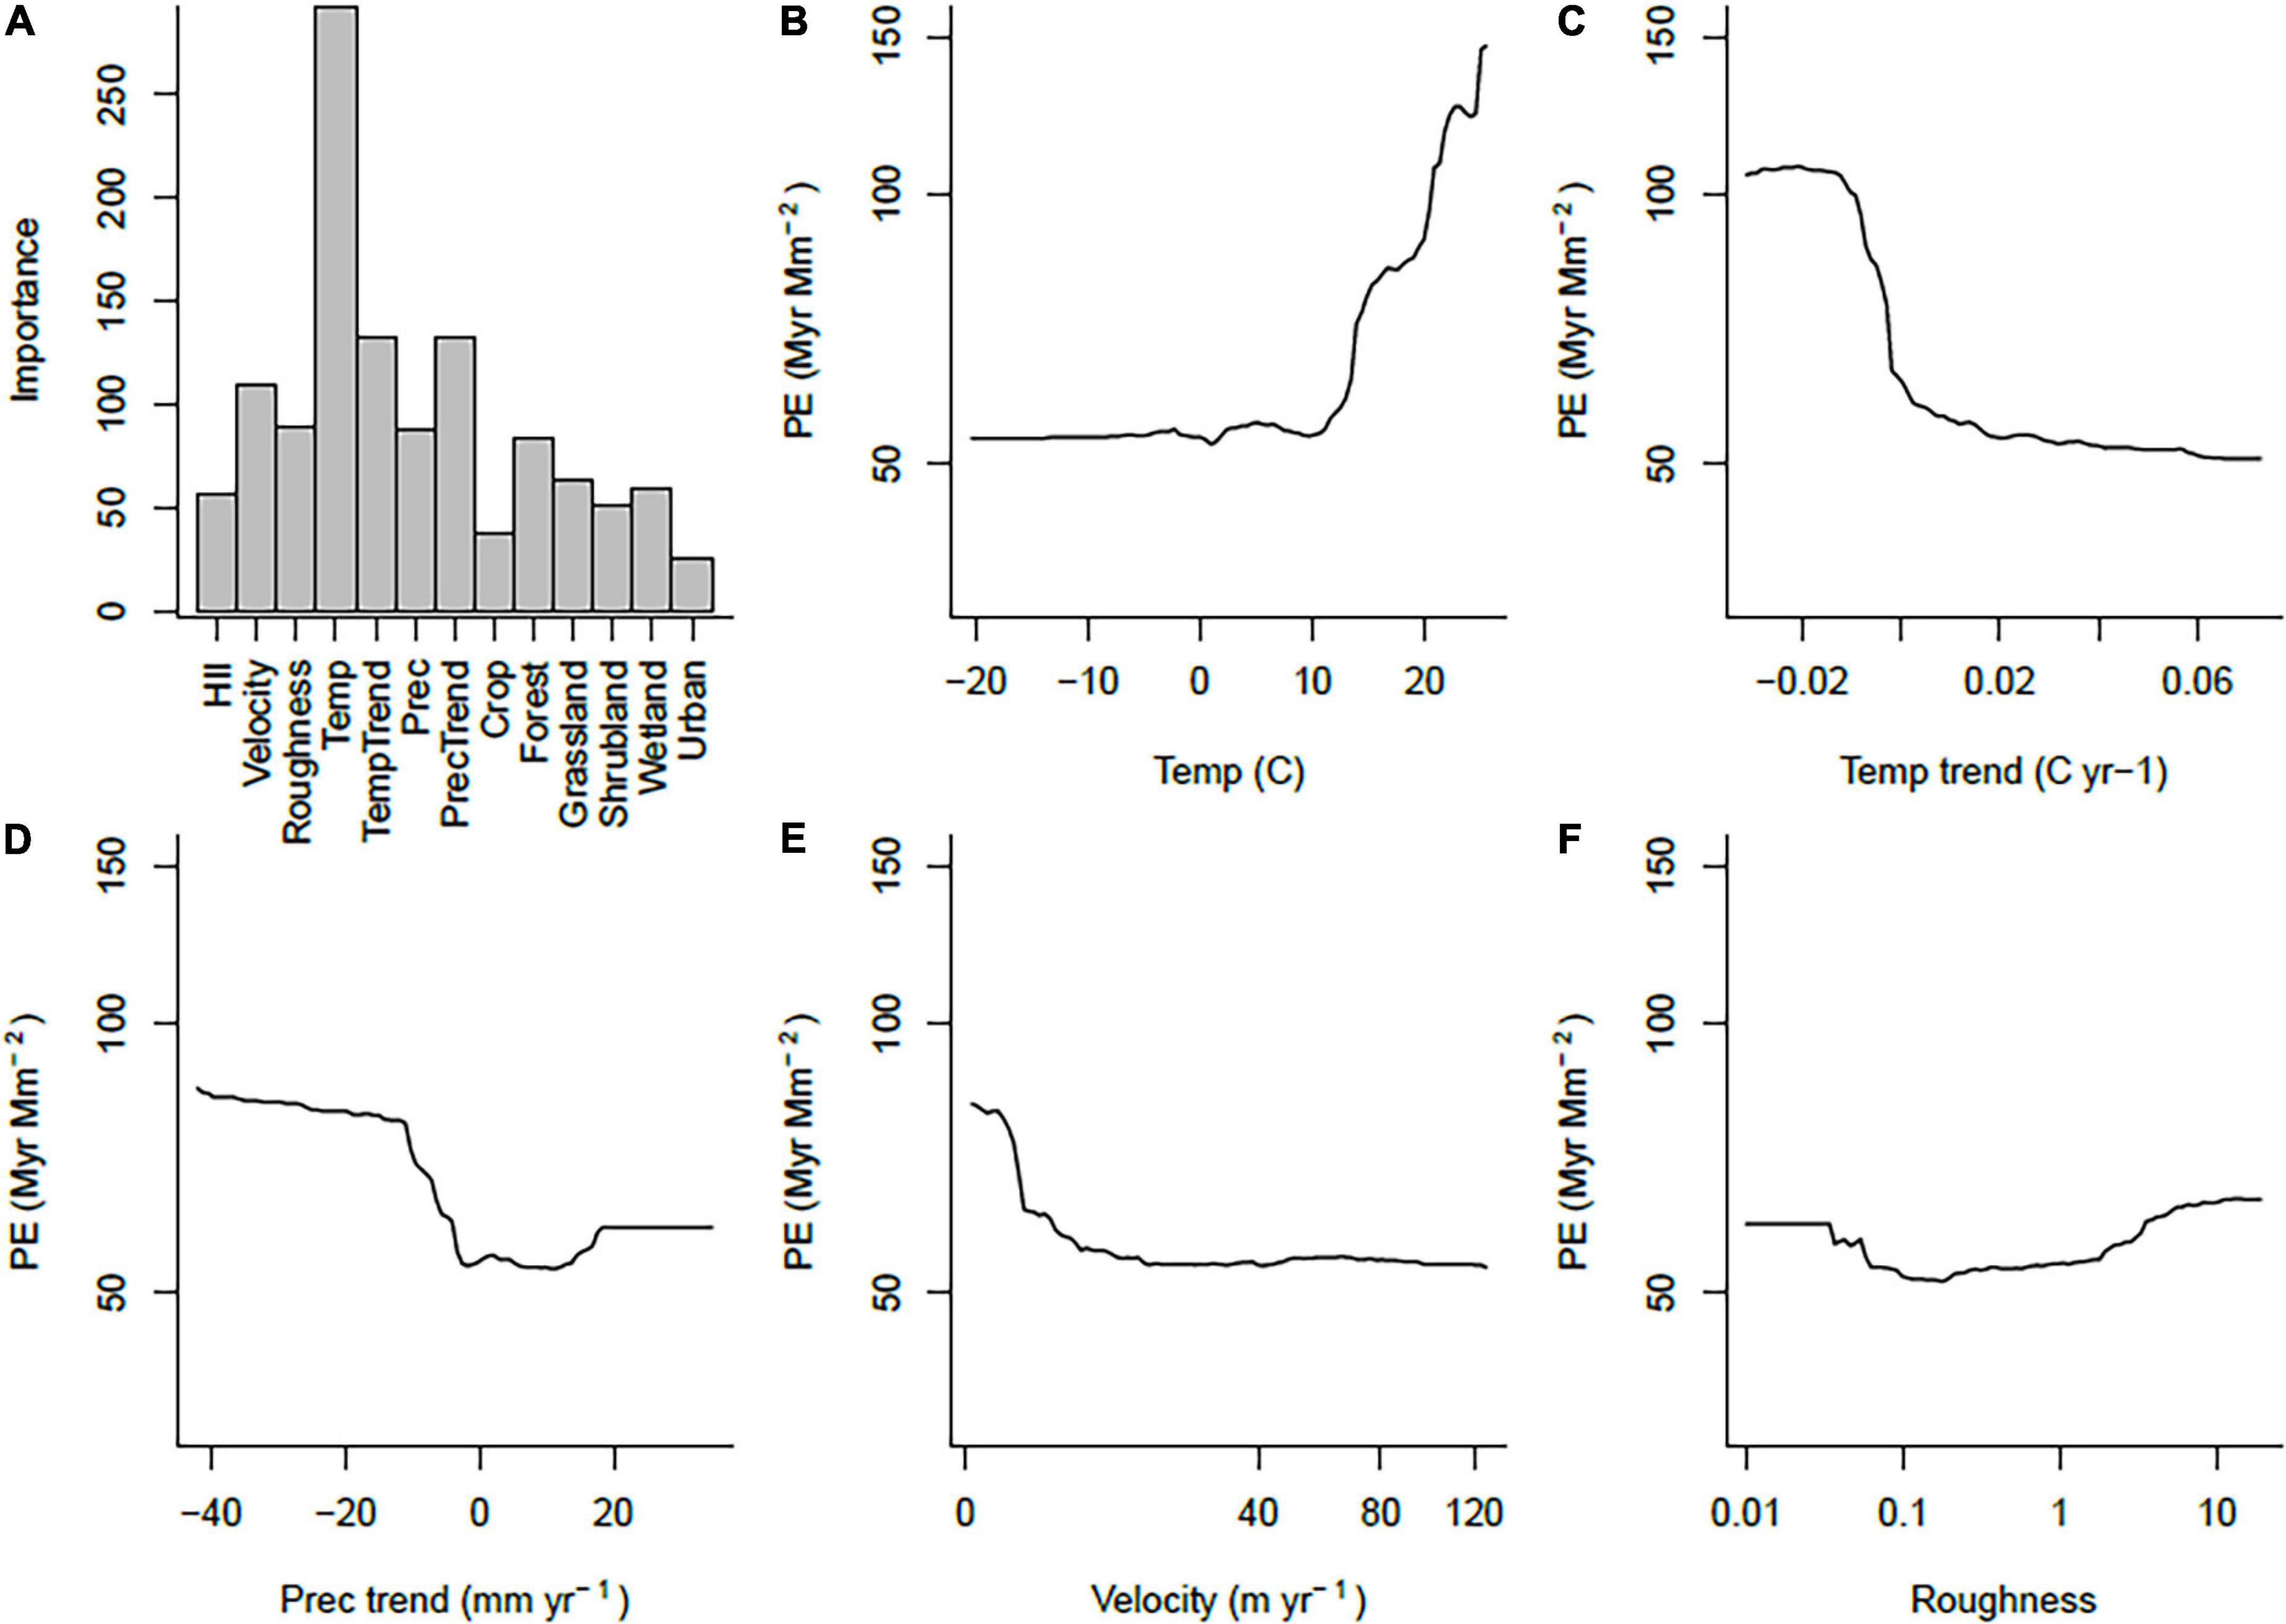
Figure 2. Summary of random forest fits for PE. (A) Importance of each variable, (B–F) response curves for the five most important predictor variables, with all other variables held at their means.
The overall average PE in a year increased through time, mirroring an increase in WE through time (Figure 3). In contrast, PD was relatively stable, with a hint of a downward trend. However, these patterns are potentially complicated by changing spatial coverage of BBS through time. Conceivably, the increase in PE could be due to an increased representation of areas with high PE, rather than a true increase through time. We checked this possibility in two ways: First by computing the annual trend in PE, PD and WE at each route with at least 15 years of data, and second by estimating the trend in each variable that is due to changes in spatial sampling intensity. Trends within routes suggest an overall increase in PE, PD and WE. Medians and means of these trends were all positive, and one-sample t tests comparing to μ = 0 were all significant (P < 0.0001). Changes in the spatial representation of BBS caused very weak changes in PE and WE through time (Supplementary Figure 4), but did contribute to a decrease in mean PD. Thus, the temporal pattern in PD appears to be due to moderate increases in PD within routes coupled with increasing representation of relatively low PD areas. On the other hand, trends in PE and WE appear to be due primarily to a tendency toward increased local PE and WE values.
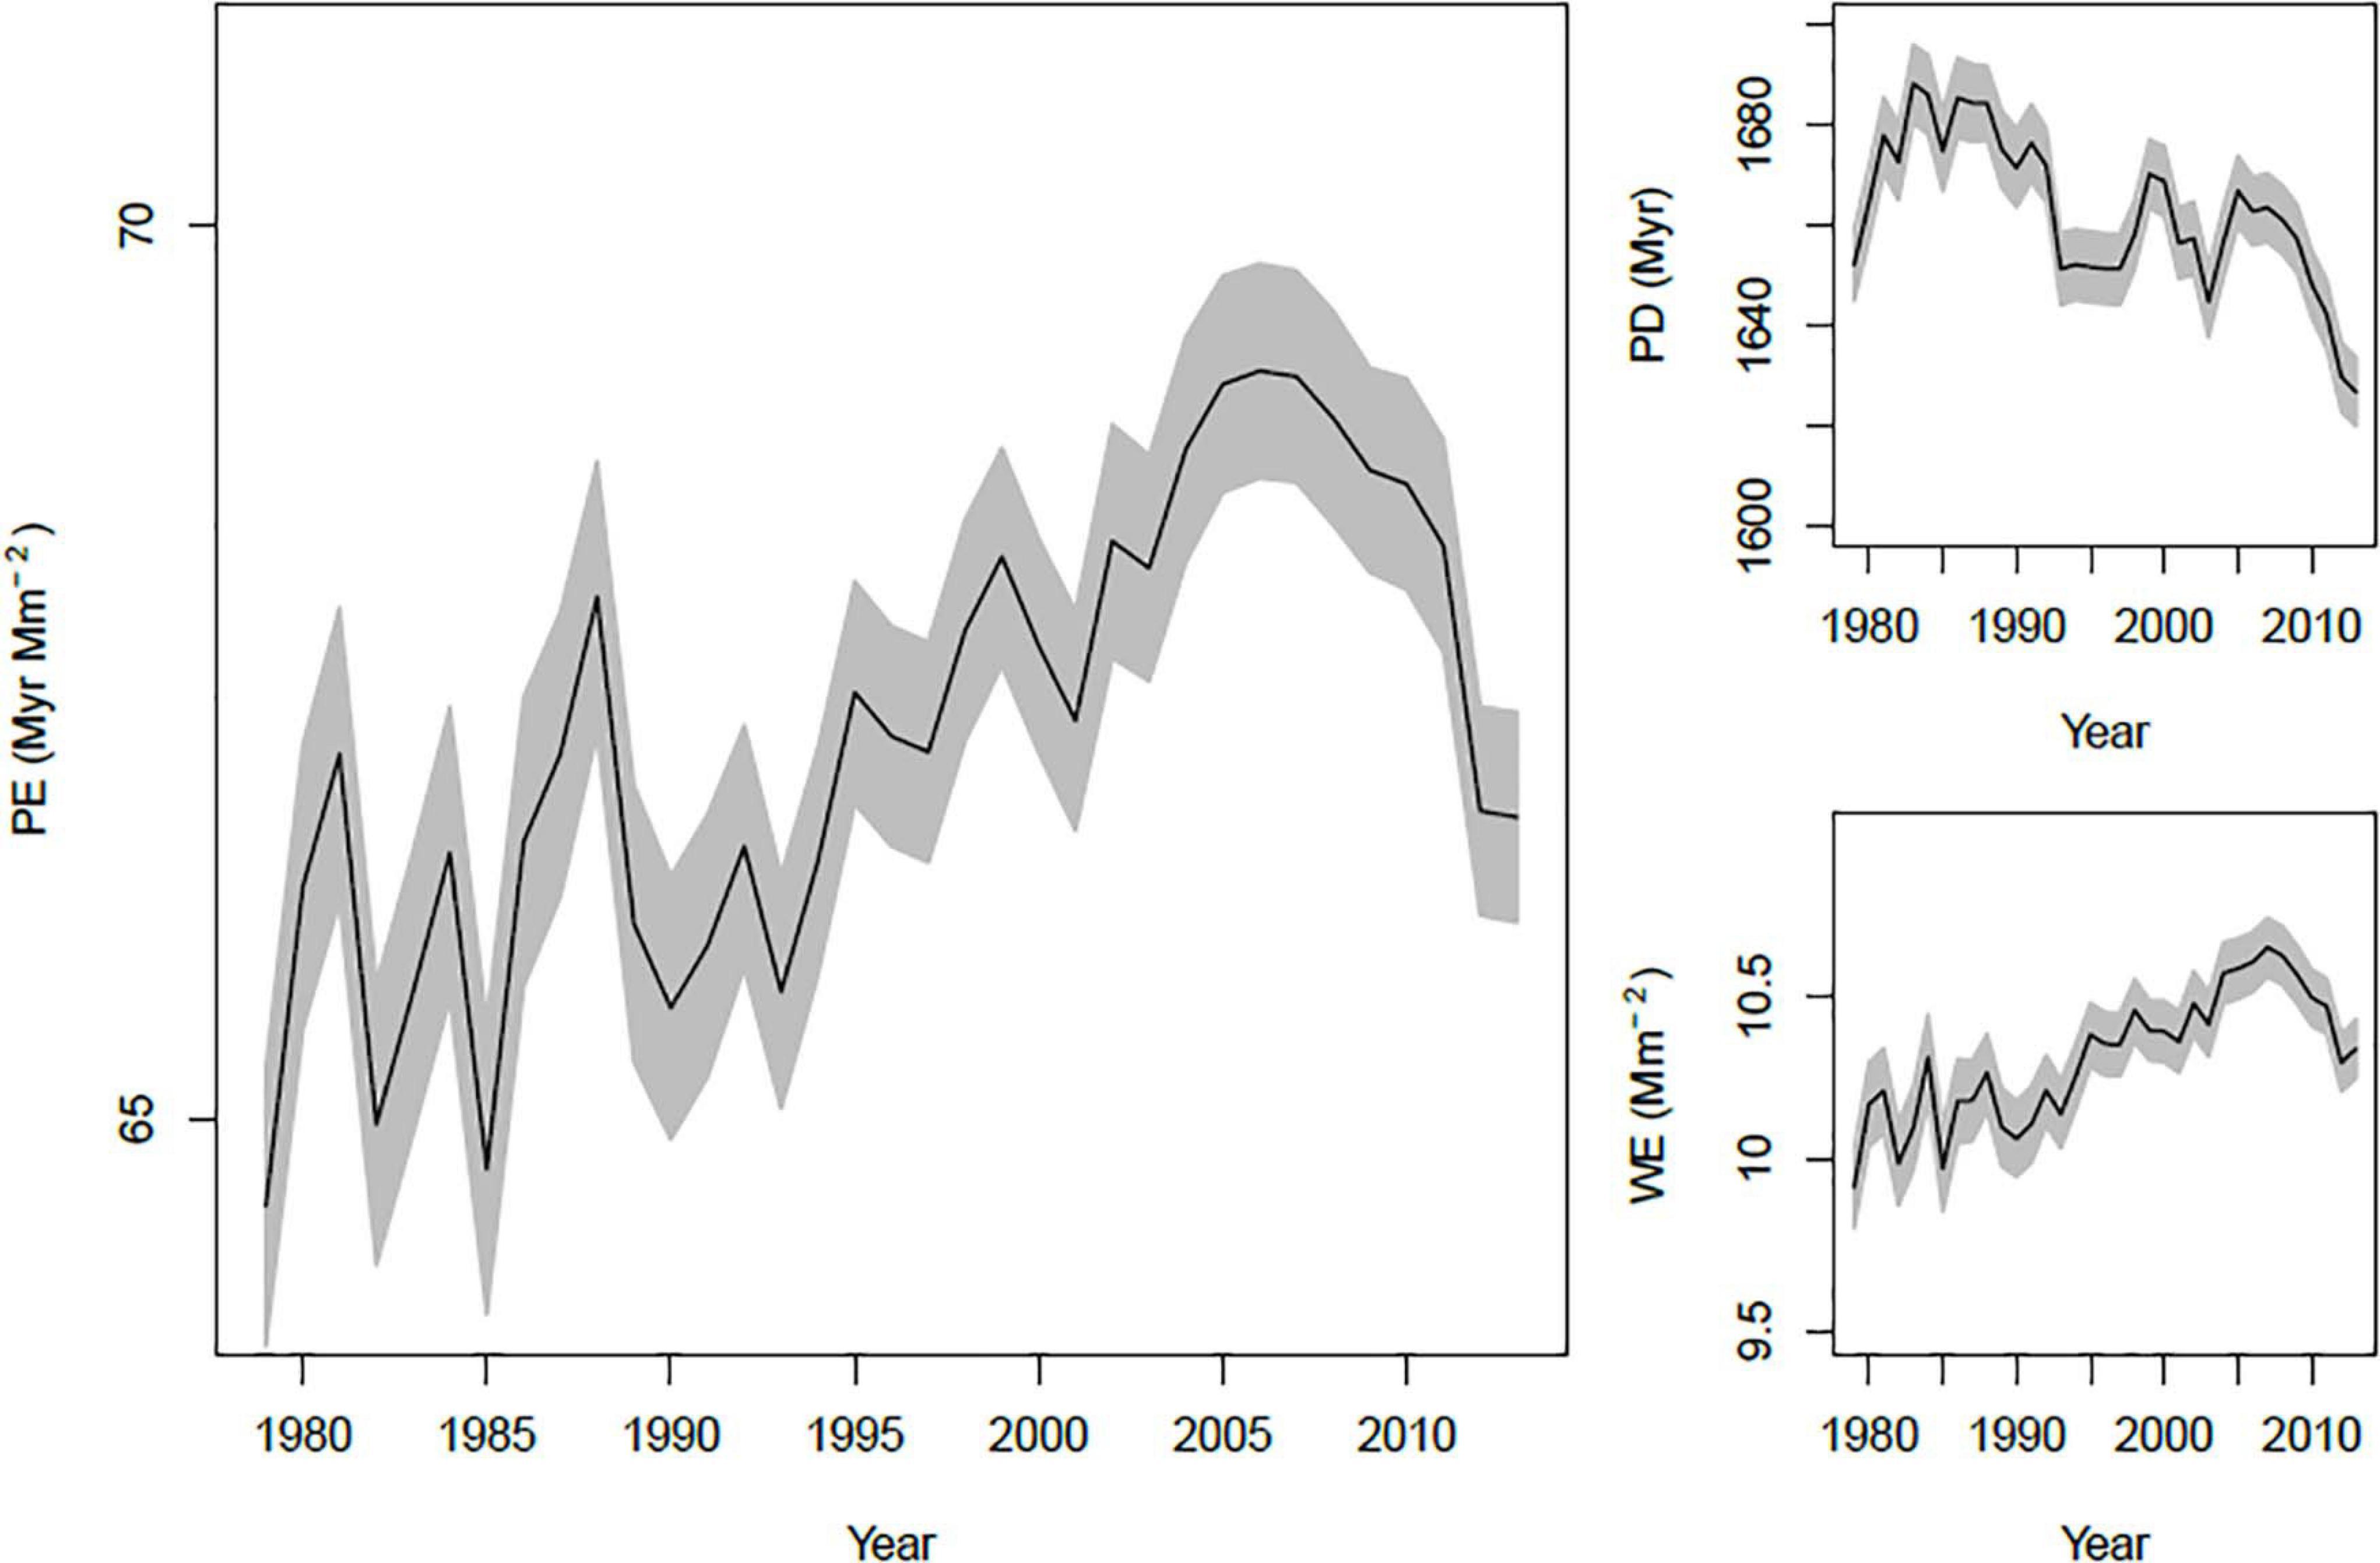
Figure 3. Trends in annual mean PE, PD, and WE. Each line shows the mean of the variable across all routes measured in a year, along with its standard error (gray region).
Though there is a great deal of variation among species, there was a tendency for small-ranged species to become more frequent over the study period. Of species in the lower 20% of global range sizes, 42 experienced strong positive occurrence trends (trend > 0.4) while 20 experienced strong negative trends. Similarly, species that contribute the most to phylogenetic diversity (those in the top 20%) included 56 species that showed strong positive occurrence trends and only 22 that showed strong negative trends. Increased occurrences in these narrow-ranging and phylogenetically unique species, seem to be driving the increase in PE through time (Figure 4). Some examples include small-ranged species that are increasingly widely occurring such as the brown pelican (Pelecanus occidentalis) and whooping crane (Grus americana), both of which have made conspicuous population recoveries since becoming the subject of protections and conservation measures. They also include phylogenetically distinct species such as the greater roadrunner (Geococcyx californianus) and mangrove cuckoo (Coccyzus minor).
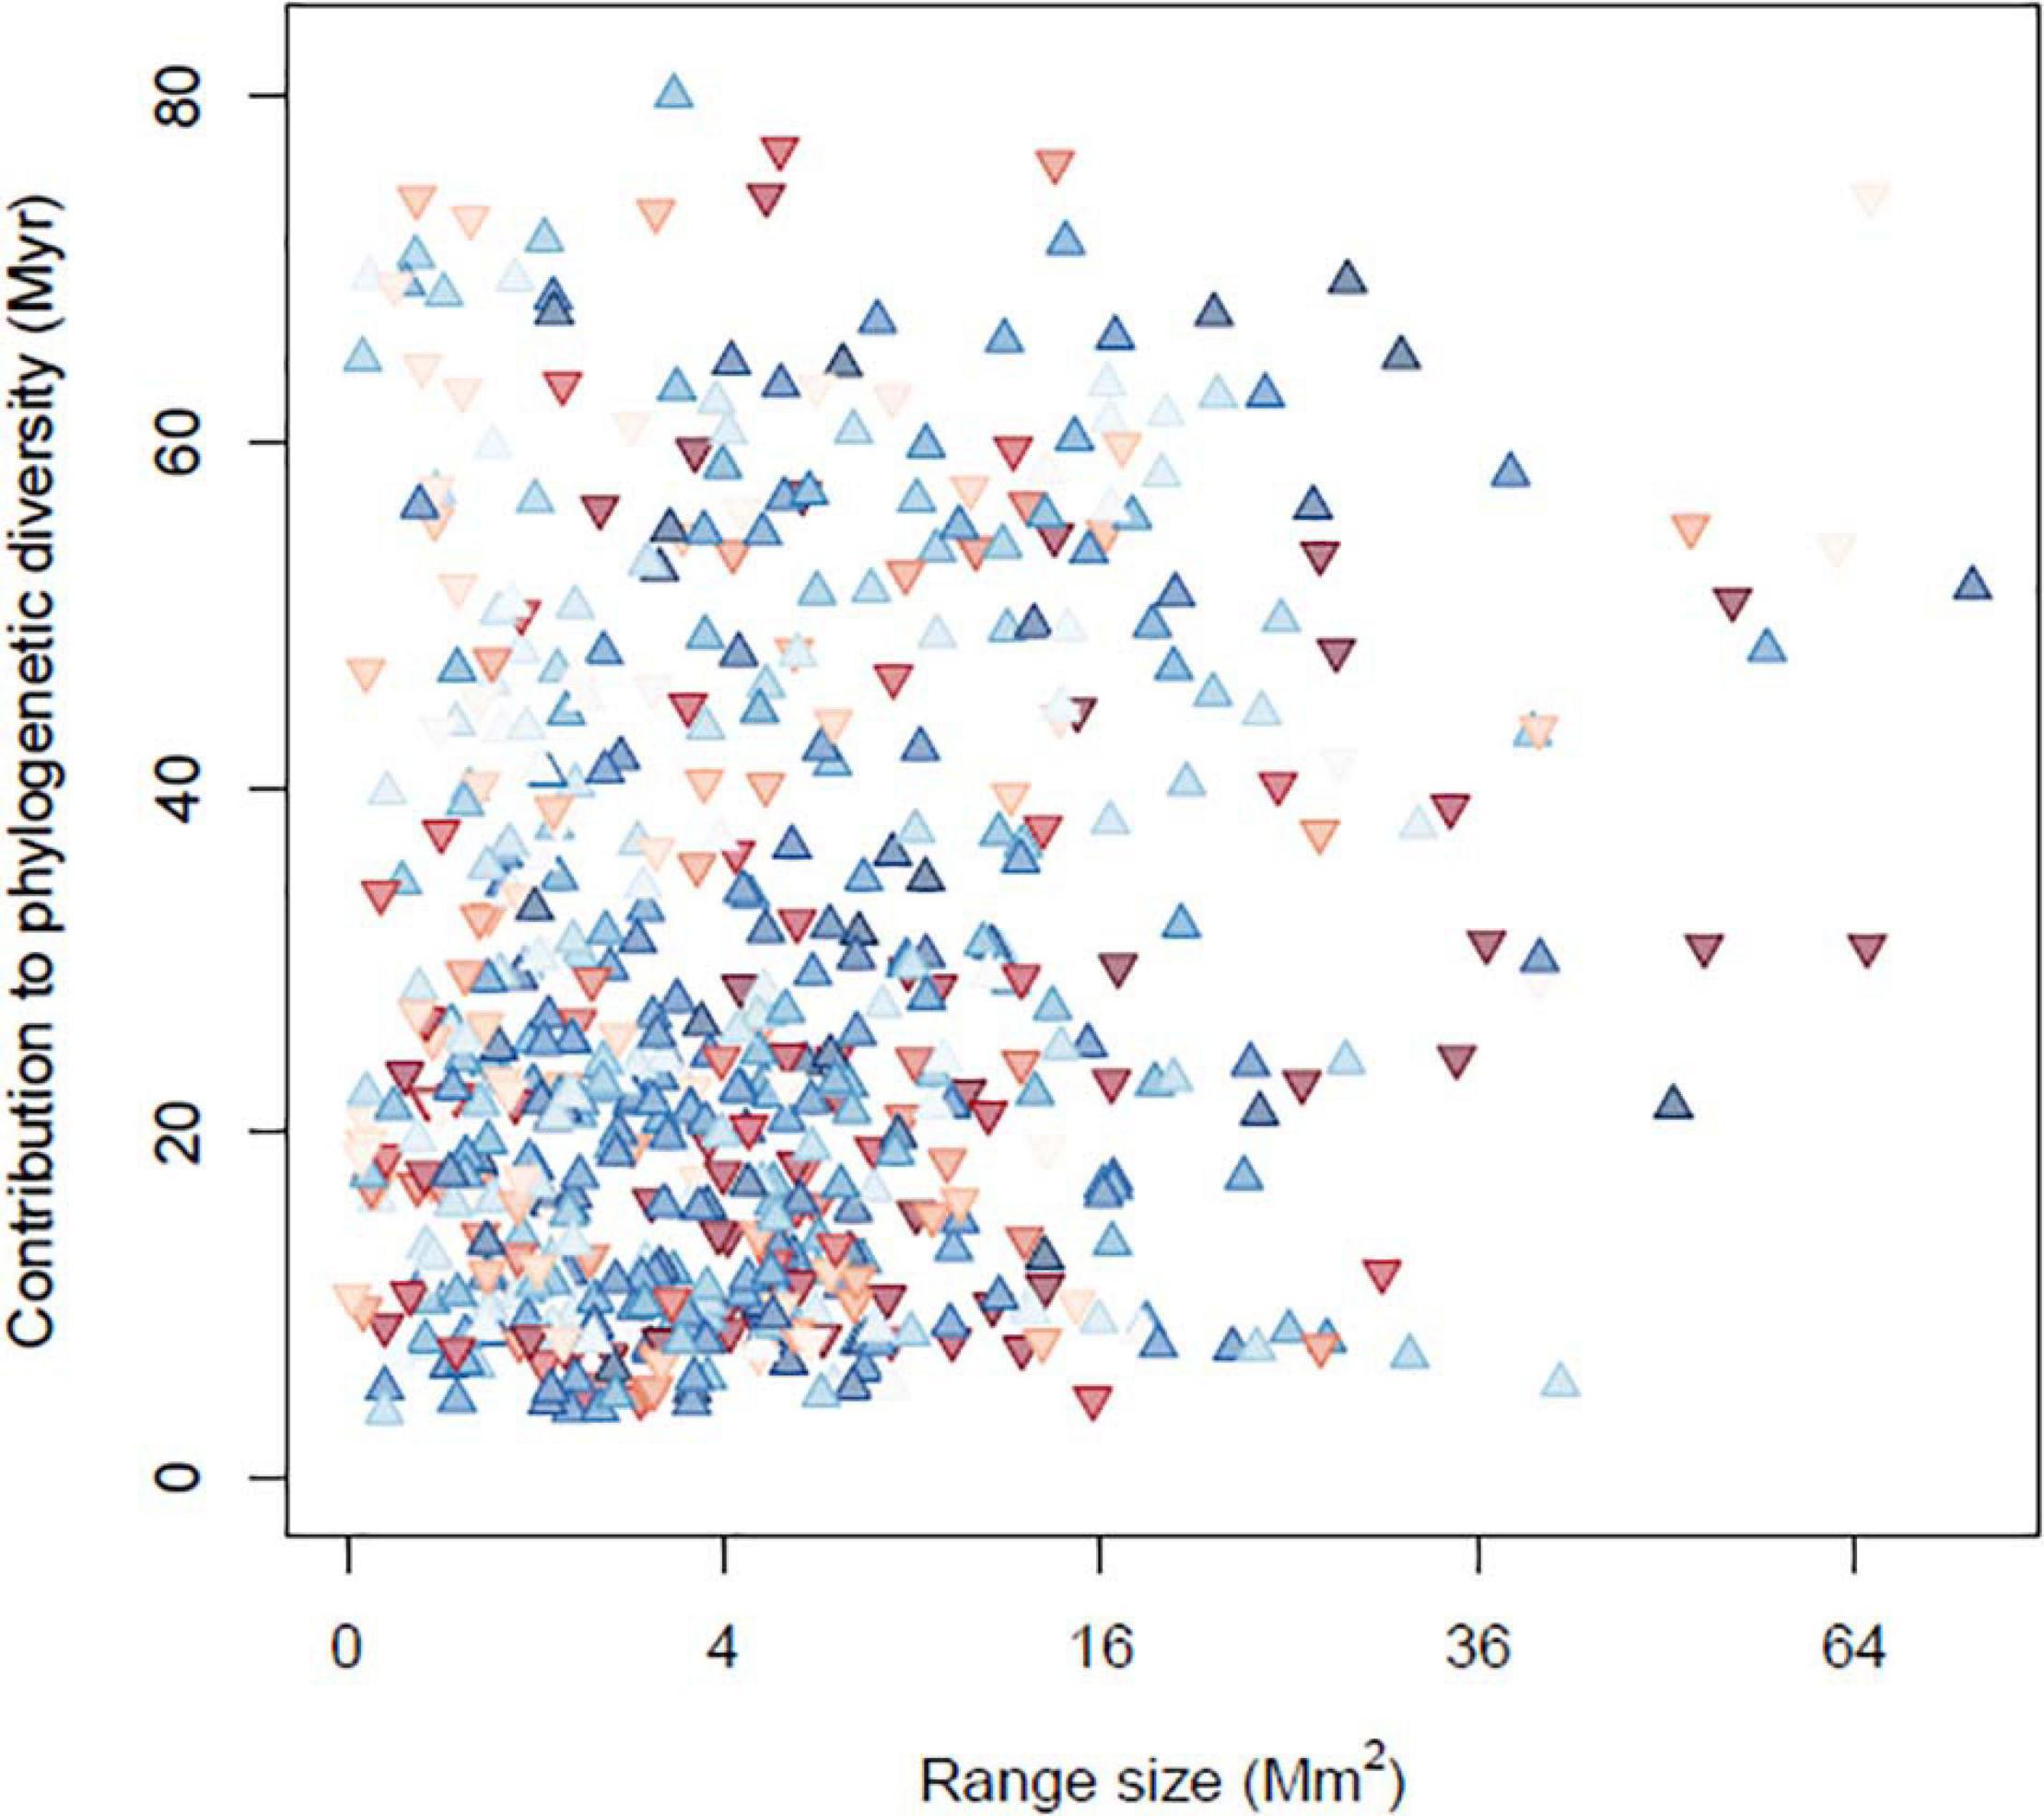
Figure 4. Occupancy trends for each bird species, plotted as a function of its geographic range size and phylogenetic distinctness. Blue upward-pointing triangles indicate species that are occurring at more sites through time, while red downward-pointing triangles indicate declining species, with the darkness indicating the strength of the change.
This is supported by the linear model predicting a species’ occurrence trend from its phylogenetic uniqueness, range size and occurrence frequency in the BBS data. Geographic range size had a negative influence on the occurrence trend (P = 0.008), and a negative interaction with mean occurrence frequency (P < 0.001), indicating that smaller-ranged species, especially those that are least frequent in the BBS data, tended to become more frequent. Phylogenetic uniqueness had a non-significant positive main effect on occurrence frequency (P = 0.12), but a significant positive interaction with mean occurrence frequency (P = 0.04), indicating that phylogenetically unique and widely distributed species most tended to increase.
The trends in PE, PD, WE and Richness showed very scattered spatial patterns (Supplementary Figure 5) and random forest fits did not produce high pseudo-R2 values (ranging from 0.024 for PD to 0.038 for Richness). Thus, none of the environmental correlates appear to be capable of explaining much of the variation in the observed trends through time.
Linear models fitted to predict PE from all predictor variables in each year produced very consistent R2-values (Figure 5). In addition, most model coefficients stayed fairly consistent through time. However, some model coefficients did show trends. For example, long-term climate change velocity was negatively related to PE at all-time points, but the relationship weakened somewhat over time. Annual mean temperature, on the other hand, was positively related to PE and became increasingly so through time.
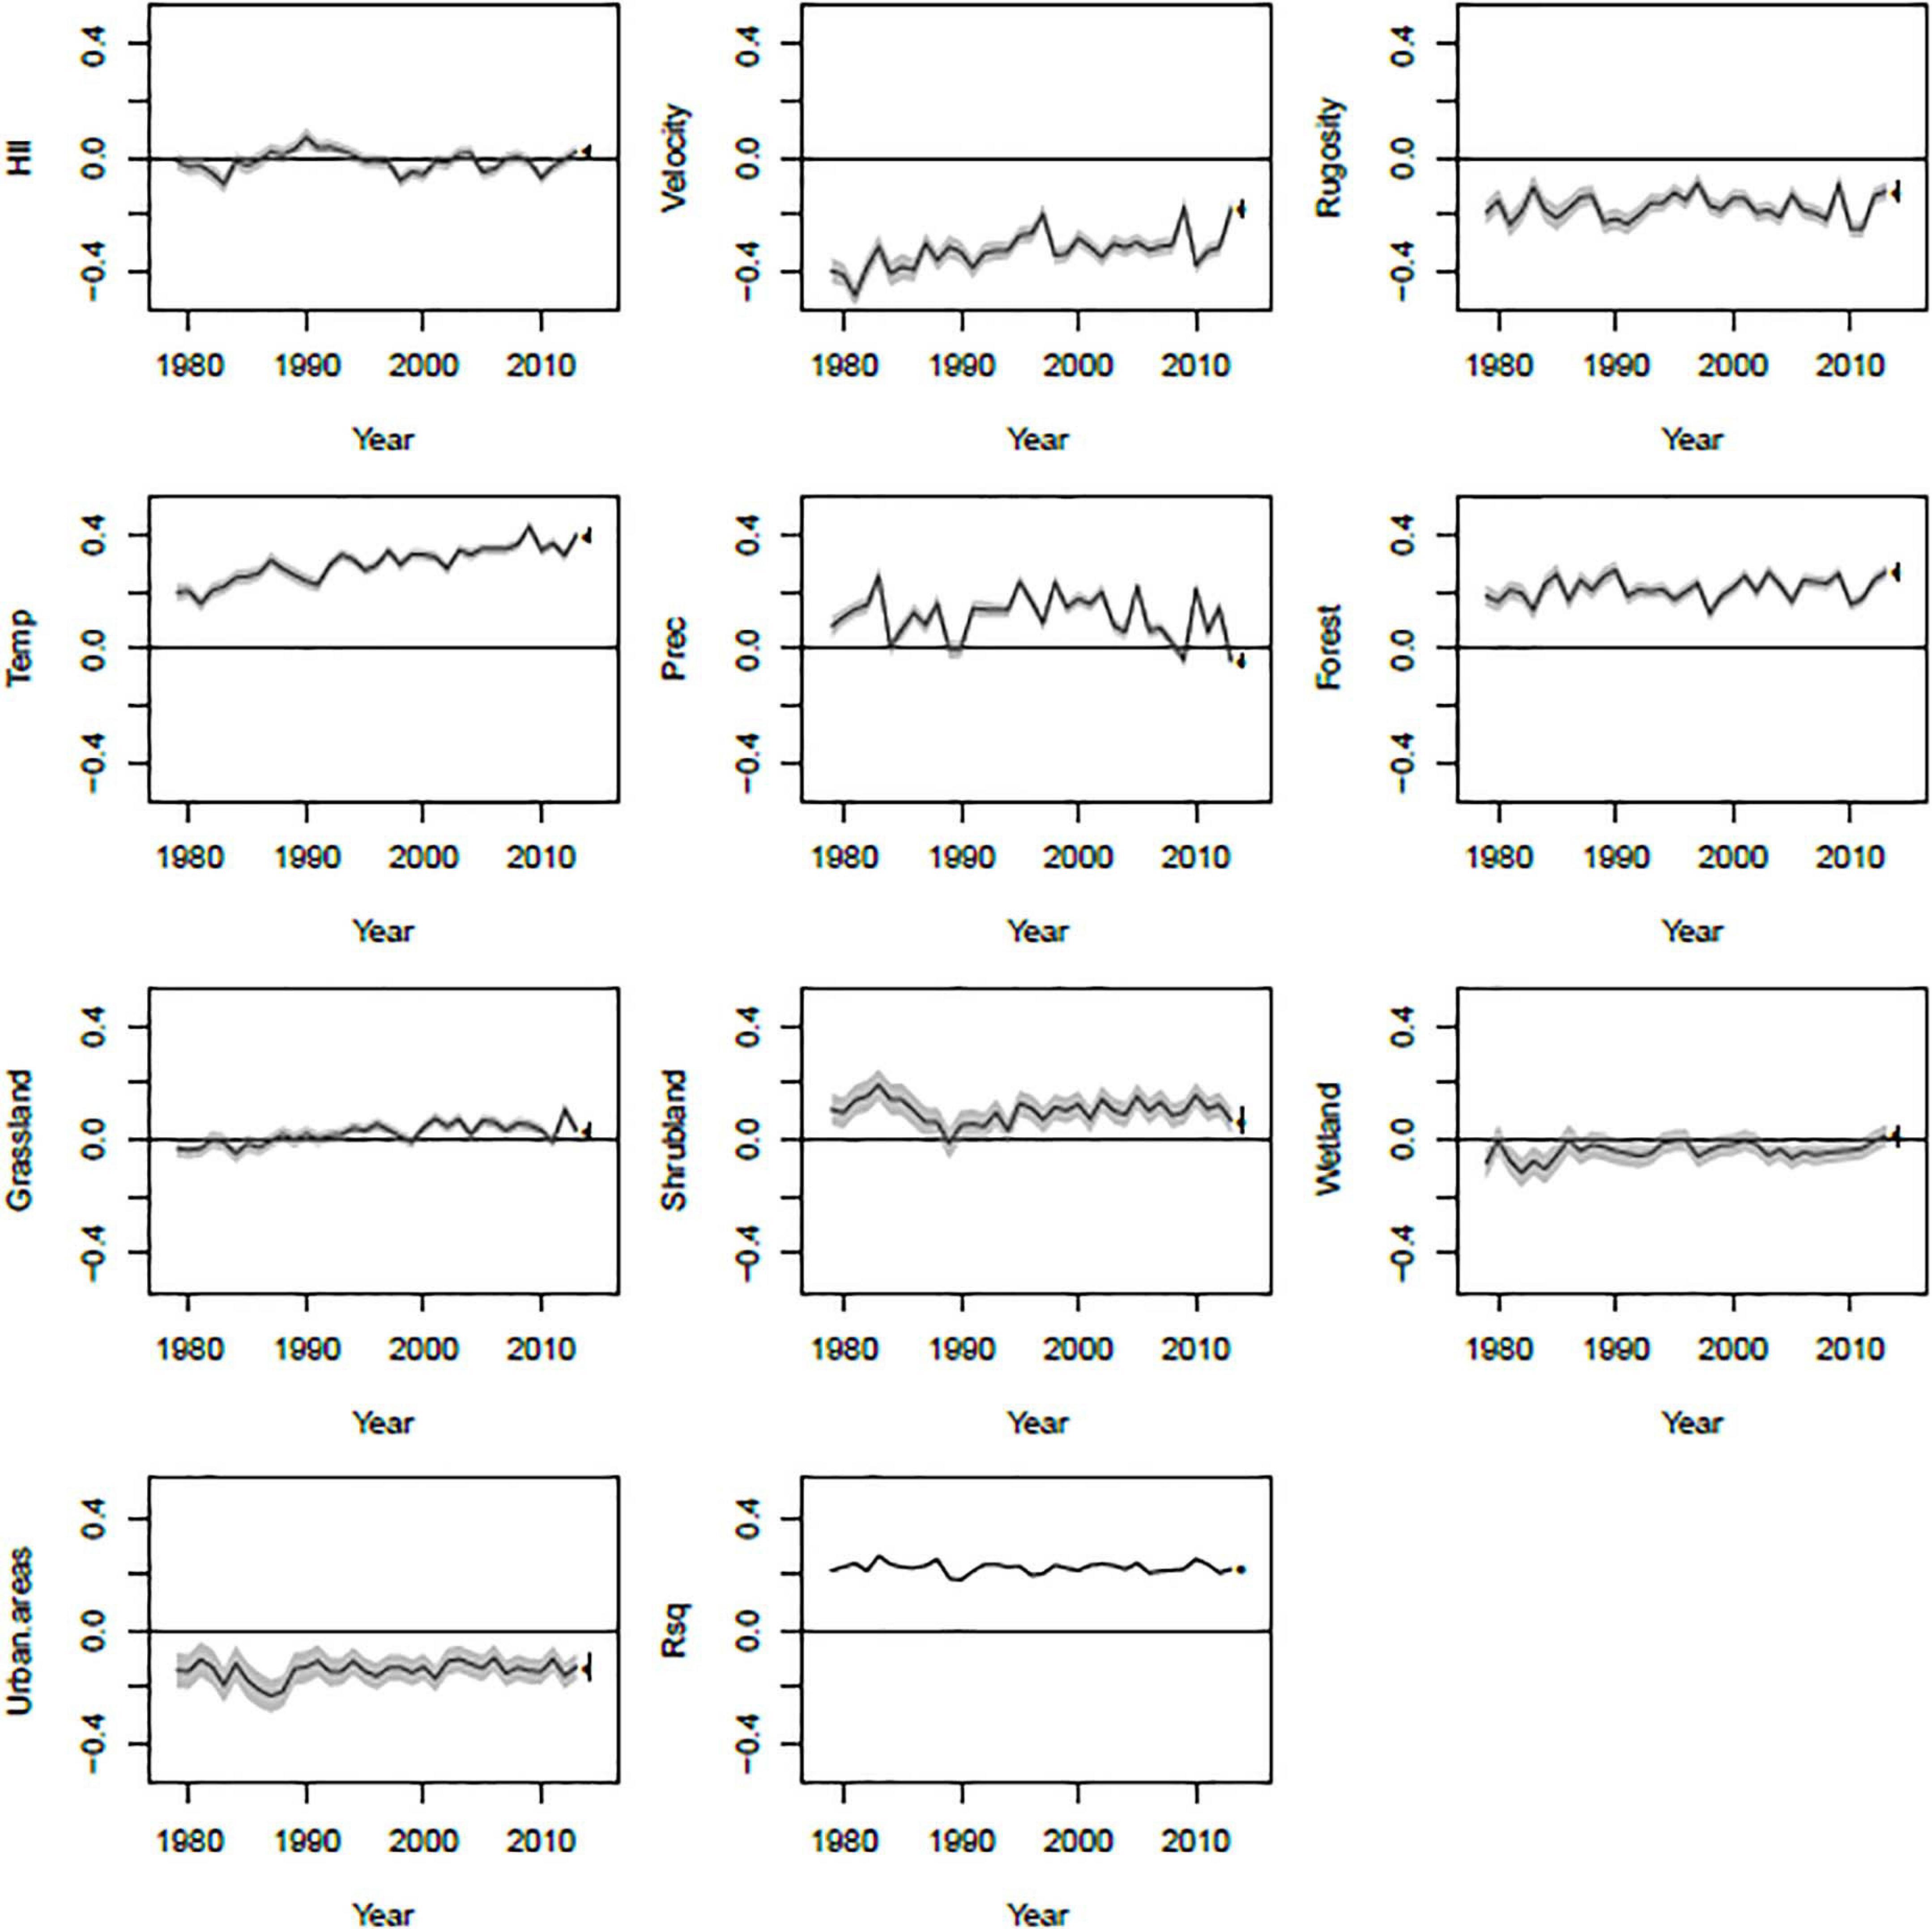
Figure 5. Temporal dynamics of coefficients from linear models fit for each year of the study period. For each model coefficient, the black line shows the coefficient estimate and the gray region shows one standard error above and below the estimate. The dot and error bar indicates the coefficient obtained from a model using long-term averages for each variable instead of annual data.
Hotspots of bird phylogenetic endemism were primarily driven by concentrations of small-ranged (rather than phylogenetically distinct) species, which in turn were concentrated in warm climates with relatively stable temperatures over both short and long time scales. Overall, phylogenetic endemism has increased modestly through time. Trends through time at each sampling route were idiosyncratic and not well associated with any of the potential predictor variables. Variables describing human influence and land use had relatively minor influences on phylogenetic endemism, even in this relatively high-resolution analysis.
There were three marked hotspots of phylogenetic endemism: The west coast, the southeast and south-central Canada east of the Rockies. The west coast hotspot is characterized by high concentrations of small-ranged species, but low to moderate species richness and phylogenetic diversity. This region is climatically heterogeneous, and includes high concentrations of other endemic species, including plants (Baldwin et al., 2017) and animals (Harrison, 2013). Thus, this region is a phylogenetic endemism hotspot largely by virtue of containing many small-ranged species, likely due to its relative long-term climatic stability and varied habitats. In contrast, the southeastern hotspot contains both many small-ranged species and high phylogenetic diversity. This region has also experienced relative long-term climate stability and was likely an important refuge for trees during the Last Glacial Maximum (Ma et al., 2016; Bemmels et al., 2019). Finally, the northern hotspot was characterized by relatively large ranges but high phylogenetic diversity. Thus, this region contains an unusually phylogenetically diverse assemblage of relatively widely distributed species.
The east and west coasts of the US had some of the highest weighted endemism and phylogenetic diversity values among all BBS survey routes. These results are not a consequence of truncating the true range sizes of species at the borders of the US and Canada since we used species’ global ranges to avoid this bias. Rather, these results may be attributed to restricted terrestrial ranges among coastal specialist species. Species specifically suited to coastal habitats occupy smaller terrestrial ranges compared to inland generalist populations. An aggregation of these types of species (e.g., oystercatchers, some cormorants, or pelagic species) could increase endemism along the coasts. It is also possible that increased endemism along the coasts simply results from reduced land availability among lineages commonly found within these regions, the oceans providing a natural barrier to further range expansion (Sandel, 2009).
Geographical correlations of phylogenetic endemism and its components of weighted endemism and phylogenetic diversity reveal similar relationships to previous coarse-grain studies. Firstly, our analysis demonstrates a strong association between phylogenetic endemism and weighted endemism while phylogenetic endemism and phylogenetic diversity are only weakly correlated. This is similar to the global pattern for trees (Sandel et al., 2020) and plants more generally (Mishler et al., 2020). Secondly, montane regions in the Pacific Northwest had elevated levels of PE, corresponding to increased endemism among geographically isolated areas. High PE is also found in the southern United States for sites relatively near the US-Mexico border and in Florida. This phenomenon is most likely a consequence of high phylogenetic endemism scores among tropical lineages spilling into the southernmost regions of the US. As has been found by Daru et al. (2019), the tropics contain some of the highest phylogenetic endemism scores among birds.
Long-term climate stability has been hypothesized to be an important driver of endemism patterns, and empirical patterns have generally supported that idea (Dynesius and Jansson, 2000; Jansson, 2003; Sandel et al., 2011, 2017). There are several possible mechanisms underlying this, including increased lineage extinction rates (both above and below the species level) and decreased speciation rates due to increased gene flow outside of climate refugia. Together, these effects are likely to produce fewer small-ranged species in areas with unstable climates. The Late Quaternary temperature oscillations represent the largest temperature shifts in recent history (Ruddiman, 2001), and have had marked influences on species distributions (Davis and Shaw, 2001). Consistent with these expectations, the rate of climate warming from the Last Glacial Maximum to the present is a strong negative predictor of weighted endemism and therefore phylogenetic endemism in birds.
The dependence of endemism on long-term climate stability has suggested that increasing rates of climate change may threaten endemism (Jansson, 2003; Sandel et al., 2011). Indeed, recent and near-future climate changes have been shown to threaten endemic bird species (Coetzee et al., 2009; Jackson et al., 2015; Hoffmann et al., 2020). However, this suggests that phylogenetic endemism should be declining overall across the study period. This is not the case; phylogenetic endemism is actually increasing modestly. This is not due to an overall increase in bird population sizes or richness. Bird populations are in decline across North America (Rosenberg et al., 2019), especially in the east and among grassland birds (Peterjohn and Sauer, 1999). These declines are occurring in both widespread and endemic species, translating to decreases in species richness over the study period; overall species richness per route is decreasing at a rate of 0.019 species per year. Thus, an overall increase in phylogenetic endemism is not an indication of a generally positive conservation status for birds.
Rather, the increase in phylogenetic endemism appears to reflect the improved conservation status of certain formerly heavily threatened species. For example, whooping cranes (Grus americana) have recovered from a population size of just 15 birds in 1941 to a present population size of several hundred (Gil-Weir et al., 2012) and occurred at none of the routes in this study until 2006. Another example is the red-shouldered hawk (Buteo lineatus) whose population declined due to logging but has since partially recovered as some forests have regrown across its range. Targeted conservation efforts, DDT restrictions and vegetation regrowth (particularly reforestation in the east) have likely helped some species, particularly those with small ranges, recover from low population sizes and increased PE.
Most previous work on broad-scale phylogenetic endemism patterns have a coarse spatial grain, often using range map overlaps in large (e.g., 100 km × 100 km) grid cells. Further, these studies lack any temporal resolution of phylogenetic endemism patterns. We hypothesized that different drivers of phylogenetic endemism and its components might appear in the relatively fine-grained BBS data and that there might be strong spatial patterns in phylogenetic endemism trends. In particular, factors like anthropogenic land cover change might not influence range maps, but could certainly influence the birds detected in a BBS survey. In general, however, the major drivers of phylogenetic endemism and its components were fairly similar to more coarse-grained studies. Trends in overall phylogenetic endemism did appear, but we could not explain any of the spatial patterns underlying these trends.
In general, assemblage surveys like the BBS are likely more strongly affected by sampling error than are coarse range maps. This may explain the apparently noisy year-to-year patterns in many routes. In addition, it is important to note that BBS routes are not randomly laid out, but generally follow roads or trails. Thus, a BBS route is likely to be a somewhat biased representation of the species occurring in a region, though the repeated sampling of the same locations means that at least that bias is likely to be consistent through time.
Previous work has suggested that endemic birds often struggle in human-dominated landscapes (Jetz et al., 2007; Chen et al., 2019). Surprisingly, neither the Human Influence Index nor the occurrence of human-dominated land cover types were strongly associated with phylogenetic endemism. However, the human influence index (HII) was the single most important predictor of phylogenetic diveristy, and was also strongly associated with species richness. In both cases, the relationship was approximately hump-shaped, suggesting highest richness and phylogenetic diversity for intermediate levels of human influence. This could reflect an effect of habitat heterogeneity, in which moderate levels of influence produce a mosaic of habitat types (for example, both agricultural and natural land covers), thereby supporting higher overall richness (Pellissier et al., 2017). Alternatively, it may reflect a spurious association with human influence, which may covary with other explanatory factors such as topography or distance from a coastline (Seabloom et al., 2002).
Using long-term and high-resolution data we were able to map patterns of phylogenetic endemism and its change with more detail than had previously been possible. Our analysis revealed that phylogenetic endemism was primarily driven by concentrations of small-ranged species occurring in warm regions with relatively stable climates. Though we had anticipated that human influence might play a strong role in driving fine-scale phylogenetic endemism patterns, its importance was minor compared to climatic factors.
The original contributions presented in the study are included in the article/Supplementary Material, further inquiries can be directed to the corresponding author/s.
Ethical review and approval was not required for the animal study because we are using existing datasets.
BS led the analysis, while SA led writing the manuscript. Both authors developed the study concept and contributed to the analysis and writing of the manuscript.
SA was supported by the Santa Clara University undergraduate research grant.
The authors declare that the research was conducted in the absence of any commercial or financial relationships that could be construed as a potential conflict of interest.
We are grateful to the thousands of volunteers who collect the BBS data, and the coordinators who manage it and make it available.
The Supplementary Material for this article can be found online at: https://www.frontiersin.org/articles/10.3389/fevo.2021.645396/full#supplementary-material
Baldwin, B. G., Thornhill, A. H., Freyman, W. A., Ackerly, D. D., Kling, M. M., Morueta-Holme, N., et al. (2017). Species richness and endemism in the native flora of California. Am. J. Bot. 104, 487–501. doi: 10.3732/ajb.1600326
Barnosky, A. D., Matzke, N., Tomiya, S., Wogan, G. O., Swartz, B., Quental, T. B., et al. (2011). Has the Earth’s sixth mass extinction already arrived? Nature 471, 51–57. doi: 10.1038/nature09678
Belmaker, J., and Jetz, W. (2011). Cross-scale variation in species richness–environment associations. Glob. Ecol. Biogeogr. 20, 464–474. doi: 10.1111/j.1466-8238.2010.00615.x
Bemmels, J. B., Knowles, L. L., and Dick, C. W. (2019). Genomic evidence of survival near ice sheet margins for some, but not all, North American trees. Proc. Natl. Acad. Sci.U. S. A. 116, 8431–8436. doi: 10.1073/pnas.1901656116
BirdLife International and Handbook of the Birds of the World. (2017). Bird Species Distribution Maps of the World. Version 7.0. Available Online at http://datazone.birdlife.org/species/requestdis (accessed July 27, 2018).
Bivand, R., and Lewin-Koh, N. (2017). Maptools: Tools for Handling Spatial Objects Version 1.1-1. https://CRAN.R-project.org/package=maptools
Bontemps, S., Defourny, P., Van Bogaert, E., Arino, O., Kalogirou, V., and Perez, J. R. (2011). GLOBCOVER 2009 Products Description and Validation Report. Available Online at: http://ionia1.esrin. esa. int/docs/GLOBCOVER2009_Validation_Report_2, 2 (accessed June 25, 2020).
Cardinale, B. J., Duffy, J. E., Gonzalez, A., Hooper, D. U., Perrings, C., Venail, P., et al. (2012). Biodiversity loss and its impact on humanity. Nature 486, 59–67. doi: 10.1038/nature11148
Ceballos, G., Ehrlich, P. R., Barnosky, A. D., García, A., Pringle, R. M., and Palmer, T. M. (2015). Accelerated modern human–induced species losses: entering the sixth mass extinction. Sci. Adv. 1:e1400253. doi: 10.1126/sciadv.1400253
Ceballos, G., García, A., and Ehrlich, P. R. (2010). The sixth extinction crisis: loss of animal populations and species. J. Cosmol. 8, 821–1831.
Chen, C., Zeng, D., Zhao, Y., Wu, Y., Xu, J., and Wang, Y. (2019). Correlates of extinction risk in Chinese endemic birds. Avian Res. 10:8.
Coetzee, B. W., Robertson, M. P., Erasmus, B. F., Van Rensburg, B. J., and Thuiller, W. (2009). Ensemble models predict Important Bird Areas in southern Africa will become less effective for conserving endemic birds under climate change. Glob. Ecol. Biogeogr. 18, 701–710. doi: 10.1111/j.1466-8238.2009.00485.x
Costion, C. M., Edwards, W., Ford, A. J., Metcalfe, D. J., Cross, H. B., Harrington, M. G., et al. (2015). Using phylogenetic diversity to identify ancient rain forest refugia and diversification zones in a biodiversity hotspot. Divers. Distrib. 21, 279–289. doi: 10.1111/ddi.12266
Crisp, M. D., Laffan, S., Linder, H. P., and Monro, A. N. N. A. (2001). Endemism in the Australian flora. J. Biogeogr. 28, 183–198. doi: 10.1046/j.1365-2699.2001.00524.x
Cutler, D. R., Edwards, T. C. Jr., Beard, K. H., Cutler, A., Hess, K. T., Gibson, J., et al. (2007). Random forests for classification in ecology. Ecology 88, 2783–2792. doi: 10.1890/07-0539.1
Daru, B. H., Farooq, H., Antonelli, A., and Faurby, S. (2020). Endemism patterns are scale dependent. Nat. Commun. 11:2115.
Daru, B. H., le Roux, P. C., Gopalraj, J., Park, D. S., Holt, B. G., and Greve, M. (2019). Spatial overlaps between the global protected areas network and terrestrial hotspots of evolutionary diversity. Glob. Ecol. Biogeogr. 28, 757–766. doi: 10.1111/geb.12888
Davis, M. B., and Shaw, R. G. (2001). Range shifts and adaptive responses to Quaternary climate change. Science 292, 673–679. doi: 10.1126/science.292.5517.673
Dynesius, M., and Jansson, R. (2000). Evolutionary consequences of changes in species’ geographical distributions driven by Milankovitch climate oscillations. Proc. Natl. Acad. Sci. U. S. A. 97, 9115–9120. doi: 10.1073/pnas.97.16.9115
Ericson, P. G., Anderson, C. L., Britton, T., Elzanowski, A., Johansson, U. S., Källersjö, M., et al. (2006). Diversification of Neoaves: integration of molecular sequence data and fossils. Biol. Lett. 2, 543–547. doi: 10.1098/rsbl.2006.0523
Ferrer-Sánchez, Y., and Rodríguez-Estrella, R. (2015). Man-made environments relationships with island raptors: endemics do not cope with habitat changes, the case of the island of Cuba. Biodivers. Conserv. 24, 407–425. doi: 10.1007/s10531-014-0819-y
Fick, S. E., and Hijmans, R. J. (2017). WorldClim 2: new 1-km spatial resolution climate surfaces for global land areas. Int. J. Climatol. 37, 4302–4315. doi: 10.1002/joc.5086
Fleishman, E., Noss, R. F., and Noon, B. R. (2006). Utility and limitations of species richness metrics for conservation planning. Ecol. Indic. 6, 543–553. doi: 10.1016/j.ecolind.2005.07.005
Gil-Weir, K. C., Grant, W. E., Slack, R. D., Wang, H. H., and Fujiwara, M. (2012). Demography and population trends of Whooping Cranes. J. Field Ornithol. 83, 1–10. doi: 10.1111/j.1557-9263.2011.00349.x
González-Orozco, C. E., Mishler, B. D., Miller, J. T., Laffan, S. W., Knerr, N., Unmack, P., et al. (2015). Assessing biodiversity and endemism using phylogenetic methods across multiple taxonomic groups. Ecol. Evol. 5, 5177–5192. doi: 10.1002/ece3.1747
Greenberg, D. A., Palen, W. J., Chan, K. C., Jetz, W., and Mohoers, A. Ø (2018). Evolutionarily distinct amphibians are disproportionately lost from human-modified ecosystems. Ecol. Lett. 21, 1530–1540. doi: 10.1111/ele.13133
Hackett, S. J., Kimball, R. T., Reddy, S., Bowie, R. C., Braun, E. L., Braun, M. J., et al. (2008). A phylogenomic study of birds reveals their evolutionary history. Science 320, 1763–1768. doi: 10.1126/science.1157704
Hijmans, R. J. (2016). Raster: Geographic Data Analysis and Modeling. R package version 2.5-8. Available Online at: https://CRAN.R-project.org/package=raster.
Hoffmann, D., de Vasconcelos, M. F., and Fernandes, G. W. (2020). The fate of endemic birds of eastern Brazilian mountaintops in the face of climate change. Perspect. Ecol. Conserv. 18, 257–266. doi: 10.1016/j.pecon.2020.10.005
Jackson, M. M., Gergel, S. E., and Martin, K. (2015). Effects of climate change on habitat availability and configuration for an endemic coastal alpine bird. PLoS One 10:e0142110. doi: 10.1371/journal.pone.0142110
Jansson, R. (2003). Global patterns in endemism explained by past climatic change. Proc. R. Soc. Lond. B Biol. Sci. 270, 583–590. doi: 10.1098/rspb.2002.2283
Jetz, W., Thomas, G. H., Joy, J. B., Hartmann, K., and Mooers, A. O. (2012). The global diversity of birds in space and time. Nature 491, 444–448. doi: 10.1038/nature11631
Jetz, W., Thomas, G. H., Joy, J. B., Redding, D. W., Hartmann, K., and Mooers, A. O. (2014). Global distribution and conservation of evolutionary distinctness in birds. Curr. Biol. 24, 919–930. doi: 10.1016/j.cub.2014.03.011
Jetz, W., Wilcove, D. S., and Dobson, A. P. (2007). Projected impacts of climate and land-use change on the global diversity of birds. PLoS Biol. 5:e157. doi: 10.1371/journal.pbio.0050157
Karger, D. N., Conrad, O., Böhner, J., Kawohl, T., Kreft, H., Soria-Auza, R. W., et al. (2017). Climatologies at high resolution for the earth’s land surface areas. Sci. Data 4:170122.
Keppel, G., Van Niel, K. P., Wardell-Johnson, G. W., Yates, C. J., Byrne, M., Mucina, L., et al. (2012). Refugia: identifying and understanding safe havens for biodiversity under climate change. Glob. Ecol. Biogeogr. 21, 393–404. doi: 10.1111/j.1466-8238.2011.00686.x
Kier, G., Kreft, H., Lee, T. M., Jetz, W., Ibisch, P. L., Nowicki, C., et al. (2009). A global assessment of endemism and species richness across island and mainland regions. Proc. Natl. Acad. Sci.U. S. A. 106, 9322–9327. doi: 10.1073/pnas.0810306106
Laffan, S. W. (2018). “Phylogeny-based measurements at global and regional scales,” in Phylogenetic Diversity: Applications and Challenges in Biodiversity Science, eds R. Scherson and D. Faith, (Berlin: Springer), 111–129. doi: 10.1007/978-3-319-93145-6_6
Laffan, S. W., Rosauer, D. F., Di Virgilio, G., Miller, J. T., González-Orozco, C. E., Knerr, N., et al. (2016). Range-weighted metrics of species and phylogenetic turnover can better resolve biogeographic transition zones. Methods Ecol. Evol. 7, 580–588. doi: 10.1111/2041-210x.12513
Ma, Z., Sandel, B., and Svenning, J. C. (2016). Phylogenetic assemblage structure of N orth A merican trees is more strongly shaped by glacial–interglacial climate variability in gymnosperms than in angiosperms. Ecol. Evol. 6, 3092–3106. doi: 10.1002/ece3.2100
Margules, C. R., Pressey, R. L., and Williams, P. H. (2002). Representing biodiversity: data and procedures for identifying priority areas for conservation. J. Biosci. 27, 309–326. doi: 10.1007/bf02704962
Mimet, A., Buitenwerf, R., Sandel, B., Svenning, J. C., and Normand, S. (2019). Recent global changes have decoupled species richness from specialization patterns in North American birds. Glob. Ecol. Biogeogr. 28, 1621–1635. doi: 10.1111/geb.12978
Mishler, B. D., Guralnick, R., Soltis, P. S., Smith, S. A., Soltis, D. E., Barve, N., et al. (2020). Spatial phylogenetics of the North American flora. J. Syst. Evol. 58, 393–405. doi: 10.1111/jse.12590
Mishler, B. D., Knerr, N., González-Orozco, C. E., Thornhill, A. H., Laffan, S. W., and Miller, J. T. (2014). Phylogenetic measures of biodiversity and neo-and paleo-endemism in Australian Acacia. Nat. Commun. 5:4473.
Naeem, S., Thompson, L. J., Lawler, S. P., Lawton, J. H., and Woodfin, R. M. (1994). Declining biodiversity can alter the performance of ecosystems. Nature 368, 734–737. doi: 10.1038/368734a0
Nekola, J. C. (1999). Paleorefugia and neorefugia: the influence of colonization history on community pattern and process. Ecology 80, 2459–2473. doi: 10.1890/0012-9658(1999)080[2459:pantio]2.0.co;2
Normand, S., Ricklefs, R. E., Skov, F., Bladt, J., Tackenberg, O., and Svenning, J. C. (2011). Postglacial migration supplements climate in determining plant species ranges in Europe. Proc. R. Soc. B Biol. Sci. 278, 3644–3653. doi: 10.1098/rspb.2010.2769
Noroozi, J., Talebi, A., Doostmohammadi, M., Rumpf, S. B., Linder, H. P., and Schneeweiss, G. M. (2018). Hotspots within a global biodiversity hotspot-areas of endemism are associated with high mountain ranges. Sci. Rep. 8, 1–10.
Paradis, E., Claude, J., and Strimmer, K. (2004). APE: analyses of phylogenetics and evolution in R language. Bioinformatics 20, 289–290. doi: 10.1093/bioinformatics/btg412
Pardieck, K. L., Ziolkowski, D. J. Jr., Lutmerding, M., Aponte, V. I., and Hudson, M.-A. R. (2020). North American Breeding Bird Survey Dataset 1966 - 2019. Laurel, MD: U.S. Geological Survey data release, doi: 10.5066/P9J6QUF6
Pellissier, V., Mimet, A., Fontaine, C., Svenning, J. C., and Couvet, D. (2017). Relative importance of the land-use composition and intensity for the bird community composition in anthropogenic landscapes. Ecol. Evol. 7, 10513–10535. doi: 10.1002/ece3.3534
Peterjohn, B. G., and Sauer, J. R. (1999). Population status of North American grassland birds from the North American breeding bird survey. Stud. Avian Biol. 19, 27–44.
Redding, D. W., and Mooers, A. Ø (2006). Incorporating evolutionary measures into conservation prioritization. Conserv. Biol. 20, 1670–1678. doi: 10.1111/j.1523-1739.2006.00555.x
Rosauer, D. A. N., Laffan, S. W., Crisp, M. D., Donnellan, S. C., and Cook, L. G. (2009). Phylogenetic endemism: a new approach for identifying geographical concentrations of evolutionary history. Mol. Ecol. 18, 4061–4072. doi: 10.1111/j.1365-294x.2009.04311.x
Rosauer, D. F., and Jetz, W. (2015). Phylogenetic endemism in terrestrial mammals. Glob. Ecol. Biogeogr. 24, 168–179. doi: 10.1111/geb.12237
Rosenberg, K. V., Dokter, A. M., Blancher, P. J., Sauer, J. R., Smith, A. C., Smith, P. A., et al. (2019). Decline of the North American avifauna. Science 366, 120–124. doi: 10.1126/science.aaw1313
Sandel, B. (2009). Geometric constraint model selection–an example with New World birds and mammals. Ecography 32, 1001–1010. doi: 10.1111/j.1600-0587.2009.05840.x
Sandel, B. (2015). Towards a taxonomy of spatial scale-dependence. Ecography 38, 358–369. doi: 10.1111/ecog.01034
Sandel, B., Arge, L., Dalsgaard, B., Davies, R. G., Gaston, K. J., Sutherland, W. J., et al. (2011). The influence of Late Quaternary climate-change velocity on species endemism. Science 334, 660–664. doi: 10.1126/science.1210173
Sandel, B., Monnet, A. C., Govaerts, R., and Vorontsova, M. (2017). Late Quaternary climate stability and the origins and future of global grass endemism. Ann. Bot. 119, 279–288. doi: 10.1093/aob/mcw178
Sandel, B., Weigelt, P., Kreft, H., Keppel, G., van der Sande, M. T., Levin, S., et al. (2020). Current climate, isolation and history drive global patterns of tree phylogenetic endemism. Glob. Ecol. Biogeogr. 29, 4–15. doi: 10.1111/geb.13001
Sanderson, E. W., Jaiteh, M., Levy, M. A., Redford, K. H., Wannebo, A. V., and Woolmer, G. (2002). The human footprint and the last of the wild: the human footprint is a global map of human influence on the land surface, which suggests that human beings are stewards of nature, whether we like it or not. BioScience 52, 891–904.
Sauer, J. R., Link, W. A., Fallon, J. E., Pardieck, K. L., and Ziolkowski, D. J. Jr. (2013). The North American Breeding Bird Survey 1966–2011: summary Analysis And Species Accounts. North Am. Fauna. 79, 1–32 doi: 10.3996/nafa.79.0001
Seabloom, E. W., Dobson, A. P., and Stoms, D. M. (2002). Extinction rates under nonrandom patterns of habitat loss. Proc. Natl. Acad. Sci. U. S. A. 99, 11229–11234. doi: 10.1073/pnas.162064899
Svenning, J. C., and Skov, F. (2004). Limited filling of the potential range in European tree species. Ecol. Lett. 7, 565–573. doi: 10.1111/j.1461-0248.2004.00614.x
Thornhill, A. H., Baldwin, B. G., Freyman, W. A., Nosratinia, S., Kling, M. M., Morueta-Holme, N., et al. (2017). Spatial phylogenetics of the native California flora. BMC Biol. 15:96. doi: 10.1186/s12915-017-0435-x
Thornhill, A. H., Mishler, B. D., Knerr, N. J., González-Orozco, C. E., Costion, C. M., Crayn, D. M., et al. (2016). Continental-scale spatial phylogenetics of Australian angiosperms provides insights into ecology, evolution and conservation. J. Biogeogr. 43, 2085–2098. doi: 10.1111/jbi.12797
Tsirogiannis, C., and Sandel, B. (2016). PhyloMeasures: a package for computing phylogenetic biodiversity measures and their statistical moments. Ecography 39, 709–714. doi: 10.1111/ecog.01814
Keywords: phylogenetic endemism, climate stability, birds, land use—land cover change, endemism, climate refuge
Citation: Acevedo S and Sandel B (2021) Phylogenetic Endemism Hotspots of North American Birds Are Associated With Warm Temperatures and Long- and Short-Term Climate Stability. Front. Ecol. Evol. 9:645396. doi: 10.3389/fevo.2021.645396
Received: 23 December 2020; Accepted: 03 June 2021;
Published: 24 June 2021.
Edited by:
Matteo Marcantonio, University of California, Davis, United StatesReviewed by:
Shawn Laffan, University of New South Wales, AustraliaCopyright © 2021 Acevedo and Sandel. This is an open-access article distributed under the terms of the Creative Commons Attribution License (CC BY). The use, distribution or reproduction in other forums is permitted, provided the original author(s) and the copyright owner(s) are credited and that the original publication in this journal is cited, in accordance with accepted academic practice. No use, distribution or reproduction is permitted which does not comply with these terms.
*Correspondence: Brody Sandel, YnNhbmRlbEBzY3UuZWR1
Disclaimer: All claims expressed in this article are solely those of the authors and do not necessarily represent those of their affiliated organizations, or those of the publisher, the editors and the reviewers. Any product that may be evaluated in this article or claim that may be made by its manufacturer is not guaranteed or endorsed by the publisher.
Research integrity at Frontiers
Learn more about the work of our research integrity team to safeguard the quality of each article we publish.