 Hongying Xie
 Mengran Li2
- 1Key Laboratory of Superior Forage Germplasm in the Qinghai-Tibetan Plateau, Qinghai Academy of Animal Science and Veterinary Medicine, Qinghai University, Xining, China
- 2Institute of the Qinghai-Tibetan Plateau, Southwest Minzu University, Chengdu, China
As temperatures rise and water availability decreases, the water decit is gaining attention regarding future agricultural production. Drought stress is a global issue and adversely affects the productivity of different crops. In this study, drought-tolerant varieties of oats were screened to determine drought-tolerant varieties that may be employed in drought-prone areas to achieve sustainable development and mitigate the impact of climate change. To do so, the growth and stress adaptive mechanism of 15 domestic and overseas oat cultivars at the seedling stage were analyzed. Water stress was simulated using 20% polyethylene glycol (PEG-6000). The results showed that the soluble protein content and superoxide dismutase activity of variety DY2 significantly increased under drought stress, whereas the photochemical efficiency and relative water content decreased slightly. The relative electrical conductivity (REC) and drought damage index of the QH444 and DY2 varieties increased the least. The peroxidase content of Q1 and DY2 significantly increased, and the catalase activity of Q1, QH444, and DY2 also substantially increased. Principal component analysis revealed that nine physiological and biochemical parameters were transformed into three independent comprehensive indexes. The comprehensive evaluation results showed that DY2, LN, and Q1 exhibited a strong drought resistance capacity and could be used as a reference material for a drought-resistant oat breeding program. The gray correlation analysis also indicated that Fv/Fm, chlorophyll, REC, and malondialdehyde could be used as key indexes for evaluating the drought resistance of oat.
Introduction
The Qinghai–Tibetan Plateau is known as the earth’s third pole with an average altitude of more than 4,000 m and an area of 2.5 million km2 (Yang et al., 2015). The ecological environment in the Qinghai–Tibetan Plateau is relatively fragile, and the distribution of precipitation among the four seasons is extremely irregular. A dry climate in early spring adversely affects plants’ growth performance (Pan et al., 2014; Meng et al., 2017; Wang et al., 2020). It is projected that the intensity of drought may increase by 1% to 30% by 2100, as a result of global warming (Parry et al., 2007). Because of the increasing global population, human activities are intensifying, thereby leading to a rise in agricultural water consumption. Water shortage is now a worldwide problem and one of the most important environmental stresses limiting crop yields globally (Tuberosa and Salvi, 2006; Lobell et al., 2008).
Plants operate various physiological mechanisms to cope with harsh environmental conditions (Passioura, 1998). Drought seriously affects plant growth, which leads to stunting, wilted leaves, chlorosis, and yellowing. Moreover, drought stress could result in damage to photosynthetic organs, changes in cell structure and function, hindered metabolic function, decreased nutrient absorption and transportation rate, increased plant energy consumption, inhibited plant growth, a shortened lifespan, reduced plant quality, and even death (Zhao et al., 2014; Zhu, 2016; Nan et al., 2018). Furthermore, drought stress causes the accumulation of osmotic regulatory substances, including soluble sugar (SSC) and soluble protein (SP), in cells to maintain cellular swelling and pressure. Reactive oxygen free radicals produced under drought stress will be scavenged by promoting the activities of enzymes in the antioxidant system, including superoxide dismutase (SOD), peroxidase (POD), and catalase (CAT) (Ge et al., 2014). Additionally, drought stress results in an increase in malondialdehyde (MDA) and relative electrical conductivity (REC) contents, as well as a decrease in chlorophyll (Chl) content (Mukherjee and Choudhuri, 1983; Dencic et al., 2000; Maqbool et al., 2017). Factors that regulate growth and development, including stomatal movement, metabolism, hormone synthesis, and signal transmission, may affect the drought resistance of plants and should be used to comprehensively evaluate drought resistance (Levitt, 1982).
Oat (Avena) is an annual crop and suitable to grow in frigid and high-altitude areas for both grain and forage production due to the strong drought resistance, short growth cycle, high forage yield, and nutrient value (Zhang et al., 2010; Singh et al., 2013; Zhou et al., 2018). It is a superior species to solve the problem of foraging during the cold season, ensuring the sustainable development of alpine grassland animal husbandry (Xu, 2012; Zhang et al., 2015). As mentioned previously, in most Qinghai–Tibetan Plateau areas, drought is the main factor limiting oat growth and production (Stevens et al., 2004). Zhang et al. (2013) found that proline (Pro), MDA, and REC could be used to evaluate the drought resistance of oats. Under drought stress, the SSC, REC, Pro, and MDA contents of 19 wild high oat grass leaves were positively correlated with drought stress, whereas the leaf relative water content (RWC) was negatively correlated with drought stress (Yang et al., 2011). The seedling stage is the key period for oat growth and development. Therefore, it is of great significance to study the effects of early spring drought on oat growth and the adaptive mechanism of oats to drought for the selection of drought-resistant varieties in alpine regions.
In this study, 15 oat varieties were used as experimental materials to assess their performance under drought stress. It explored the effects of drought stress (20% PEG-6000) on the content of SSC, SP, MDA, drought damage index (DDI), RWC, and Chl; the activities of SOD, POD, and CAT; the REC; and the maximum Fv/Fm. The comprehensive evaluation of drought resistance was carried out using principal component analysis, the gray correlation degree, and the membership function analysis.
Materials and Methods
Test Materials
Fifteen oat varieties were provided by the Key Laboratory for the Development of Forage Cultivars in the Qinghai–Tibetan Plateau of the Qinghai province (Table 1).
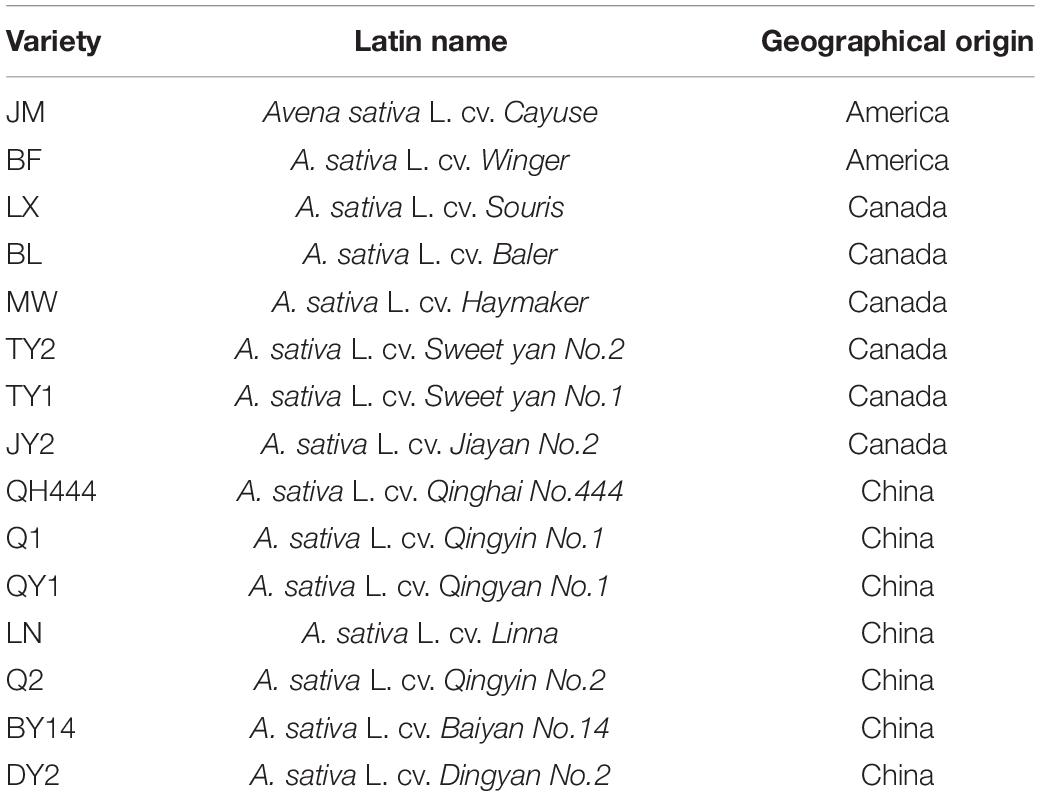
Table 1. Names and sources of tested varieties.
Experimental Design
This experiment was carried out at the Engineering Laboratory of Resistant Pasture Cultivars Innovation and Ecological Restoration in Sichuan Province, Southwest Minzu University, from September to December 2019.
This study utilized the sand culture method, and the substrate was a 3:1 mixture of fine sand and vermiculite. Full, consistent, and disease-free oat seeds were selected, sterilized with 1% sodium hypochlorite for 10 min, rinsed with distilled water five times, and evenly sowed in a basin with a diameter of 10 cm and height of 15 cm. The basins were sufficiently watered every day. After sowing, the seeds were randomly placed in a light incubator. The day and night temperatures of the light incubator were 23°C and 16°C, respectively. The light intensity was 600 mmol ⋅ m–2 ⋅ s–1 for 16 h per day, and the average relative humidity was 65%.
After seed emergence, 500 mL of Hoagland solution was poured over the seedlings every 2 days. When the seedlings grew to the stage with two true leaves, drought stress treatments were performed over 7 days. The control (CL, well-watered) and the drought stress (DL, drought stress) treatments were established. The CL was cultured with Hoagland solution, whereas the DL was treated with 20% PEG-6000 and nutrient solution. After 7 days of treatments, the penultimate leaf of the seedling was selected to determine the Fv/Fm; content of REC, RWC, Chl, SSC, and MDA; and activities of SOD, POD, CAT, and SP.
Determination and Measurement
Determination of Phenotypic Traits
To systematically count and compare the differences in changes among the different oat varieties under the same drought treatment, the phenotypic traits were quantitatively evaluated. DDI refers to the DDI of each variety under drought stress. The greater the DDI, the greater the phenotypic characteristics of the oats damaged by drought stress. The average score of each group of three pots of plants was taken as a repeat; using the formula DDI = Σ score per plant/number of plants per treatment, the DDI of each variety was obtained. Based on the effect of drought stress on the phenotypic characteristics of oats, the evaluation system was divided into five grades to study the effects of soil drought stress on the physiological and biochemical responses of oats (Table 2).
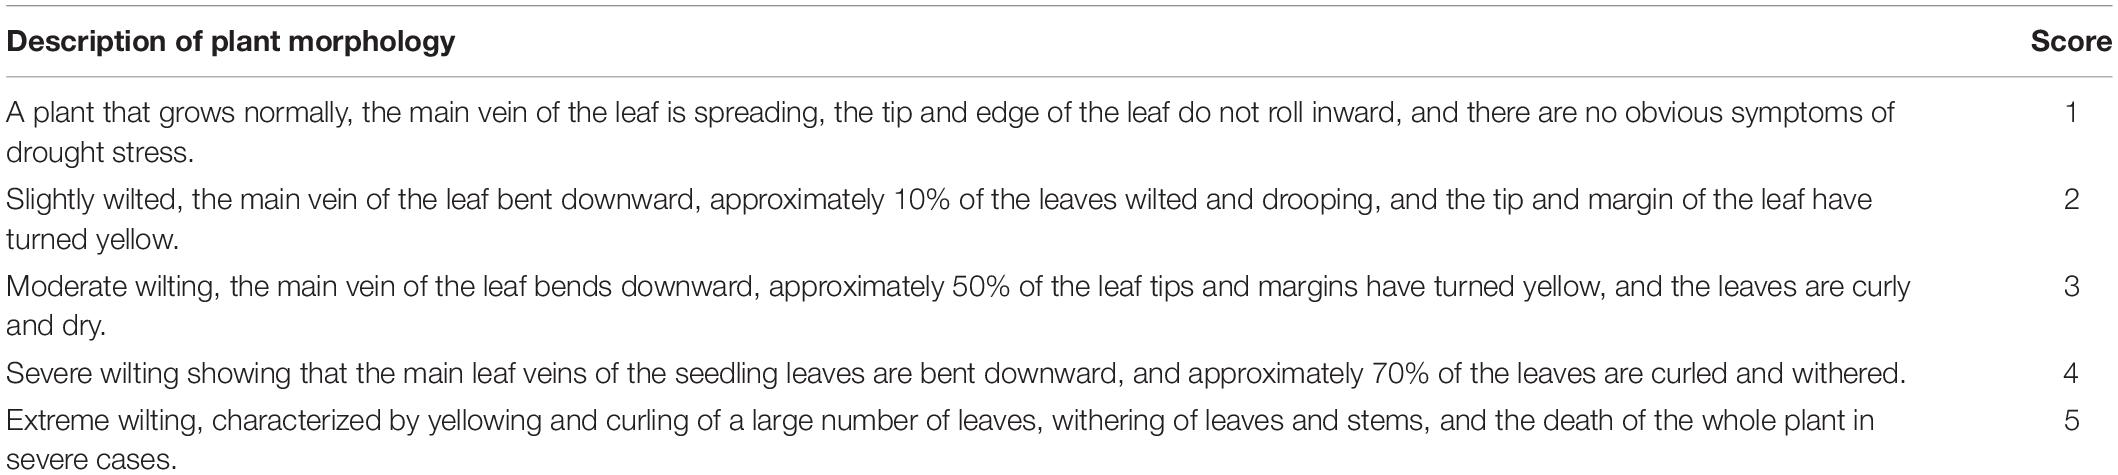
Table 2. Evaluation of oat phenotypic traits under water stress.
Determination of the RWC
The RWC of leaves was determined using the drying and weighing method (Barrs, 1962). It was calculated according to the formula RWC (%) = (FW – DW)/(TW – DW) × 100%, where FW is the fresh weight (FW), DW is the dry weight, and TW is the saturated FW (TW). The oat leaves weighed approximately 0.2 g, and the FW; wrapped with clean gauze, the sample was immersed in a 50 mL centrifuge tube containing the same amount of distilled water and placed in a refrigerator at 4°C for 24 h. After the leaves were fully absorbed, the surface moisture was gently dried with absorbent paper and weighed as TW, and then the sample was put into a Kraft paper sample bag and dried at 75°C to constant weight, weighing its DW.
Determination of SSC Content
The SSC content was determined using the sulfuric acid–anthrone color method (Gao, 2006). A sample that contained 0.025 g of dried oat leaves was used. Ethanol was added to the sample, which was then placed in a water bath. Centrifugation and decolorization were performed to collect the sugar extract. Then, we added anthrone to the sugar extract, boiled the mixture, and measured the absorbance with a spectrophotometer (Cary 60 UV-Vis; Agilent Technologies, Santa Clara, CA, United States) at a wavelength of 625 nm, which was used to calculate the SSC content. The SSC content (μg/g) = the sugar content corresponding to the OD values × the total volume of the extract/the total weight of the dry sample.
Determination of SP Content, Antioxidase Activity, and MDA Content
MDA, SP, SOD, POD, and CAT activities were measured using a kit following the manufacturer’s instructions (Suzhou Keming Biotechnology Co., Ltd., Suzhou, China) (Zhang et al., 2017).
Determination of REC
We collected 0.1 g of fresh leaves from the oats, rinsed it with deionized water, dried it with filter paper, placed it in a test tube containing 20 mL of deionized water, and then incubated it at 25°C for 24 h. After shaking and mixing, the initial conductivity, S1, was measured using a conductivity meter (DDS-307A). The samples were boiled in a water bath until all the tissue cells were killed. Then, the final conductivity, S2, was measured. REC (%) = S1/S2 × 100%.
Determination of Chl Fluorescence Parameters
The plants of all 15 tested varieties were dark-adapted for 30 min, and the maximum Fv/Fm was measured using an LI-6800 portable photosynthetic instrument (LI-COR Biosciences, Lincoln, NE, United States), starting at 9:00 AM.
Determination of Chl Content
The Chl content was assessed using the acetone–ethanol mixture extraction method reported by Gao (2006). Fresh oat leaves were collected, cut into small pieces, and put into a graduated test tube with a stopper. We added 5 mL of 80% acetone and 5 mL of 95% ethanol and mixed; the samples were then stored in the dark. When the leaves were completely white, the extract was at a constant volume. Finally, the absorbance of the Chl extract was measured at 663 and 645 nm with a spectrophotometer, and then the total Chl content was calculated using the Arnon formula: Chl total content (mg ⋅ g–1) = (20.2 OD645 + 8.02 OD663) × extract total volume of liquid/(1,000 × FW of material).
Data Analysis
Calculation of Drought Resistance Metrics
To eliminate differences attributed to the basic traits of all the varieties, the drought resistance coefficient (DC) was used for comprehensive analysis. DC = average value of indicators under drought stress/average value of control indicators (Abraham and Wayne, 1985).
The formula for this comprehensive index value is:
where Zi is the comprehensive index of the ith index, ai is the eigenvector of the relative value of the ith index (Guo et al., 2018), and Xi is the normalized value of the relative value of the ith index.
Membership function value:
We calculated the membership function value [U(Zi)] of each comprehensive index according to formulas (2) and (3) (He et al., 2009), where Zimin represents the minimum value of the ith comprehensive index, and Zimax represents the maximum value of the ith comprehensive index.
The weight formula is:
We calculated the weight factor coefficient (Wi) according to formula (4) (Zhang et al., 2017), where Pi is the contribution rate of the ith comprehensive index.
Drought resistance measurement value:
According to the weight factor, Wi, and the membership function value U(Zi), the drought resistance measure D (Guo et al., 2018) was calculated according to formula (5).
Gray Correlation Analysis
Correlation coefficient:
In the formula, Xi (k) is the relative value of variety k on the identification index i, X0(k) represents the D value of variety k, ξi(k) represents the correlation coefficient between Xi(k) and the D value, and ρ is the resolution coefficient, ρ∈[0,1]. In this test, ρ is taken as 0.5 (Chen et al., 2014).
Equal weight correlation degree:
In the formula, γi represents the degree of equal weight correlation, and n is the number of samples analyzed for each index, n = 15 (Chen et al., 2014).
In this study, based on the principal component analysis method, the membership function was used to calculate the comprehensive drought resistance measure (D value) of each variety. Using the gray correlation analysis method, the D value was taken as the reference series (X0), and the nine individual index DC values of the 15 varieties were used as the comparison series (Xi). The formulas (6) and (7) were used to find the correlation degree (γi) between each index and the D values. Excel 2019 and OriginPro 8.5 were used to organize and plot the data. SPSS 23.0 was employed for single-factor analysis of variance and principal component analysis, and Duncan multiple-range method was used for multiple comparisons at the 0.05 level.
Results
Effects of Drought Stress on Phenotypic Traits and RWC Content
The DDI increased significantly after drought stress (P < 0.05). Among the tested varieties, the DDI of QH444, LN, and DY2 increased slightly after being affected by drought stress, while that of JM, BL, MW and QY1 increased the most, which was 4.33 times of the control (Figure 1A). After drought stress, the RWC of all the tested materials was significantly reduced (P < 0.05). Compared with that of the control, the RWC of LX, QH444, and DY2 slightly decreased under drought stress. However, JM, MW, and QY1 exhibited the largest decreases in RWC, which were 0.41, 0.39, and 0.43 times those of their corresponding controls, respectively (Figure 1B).
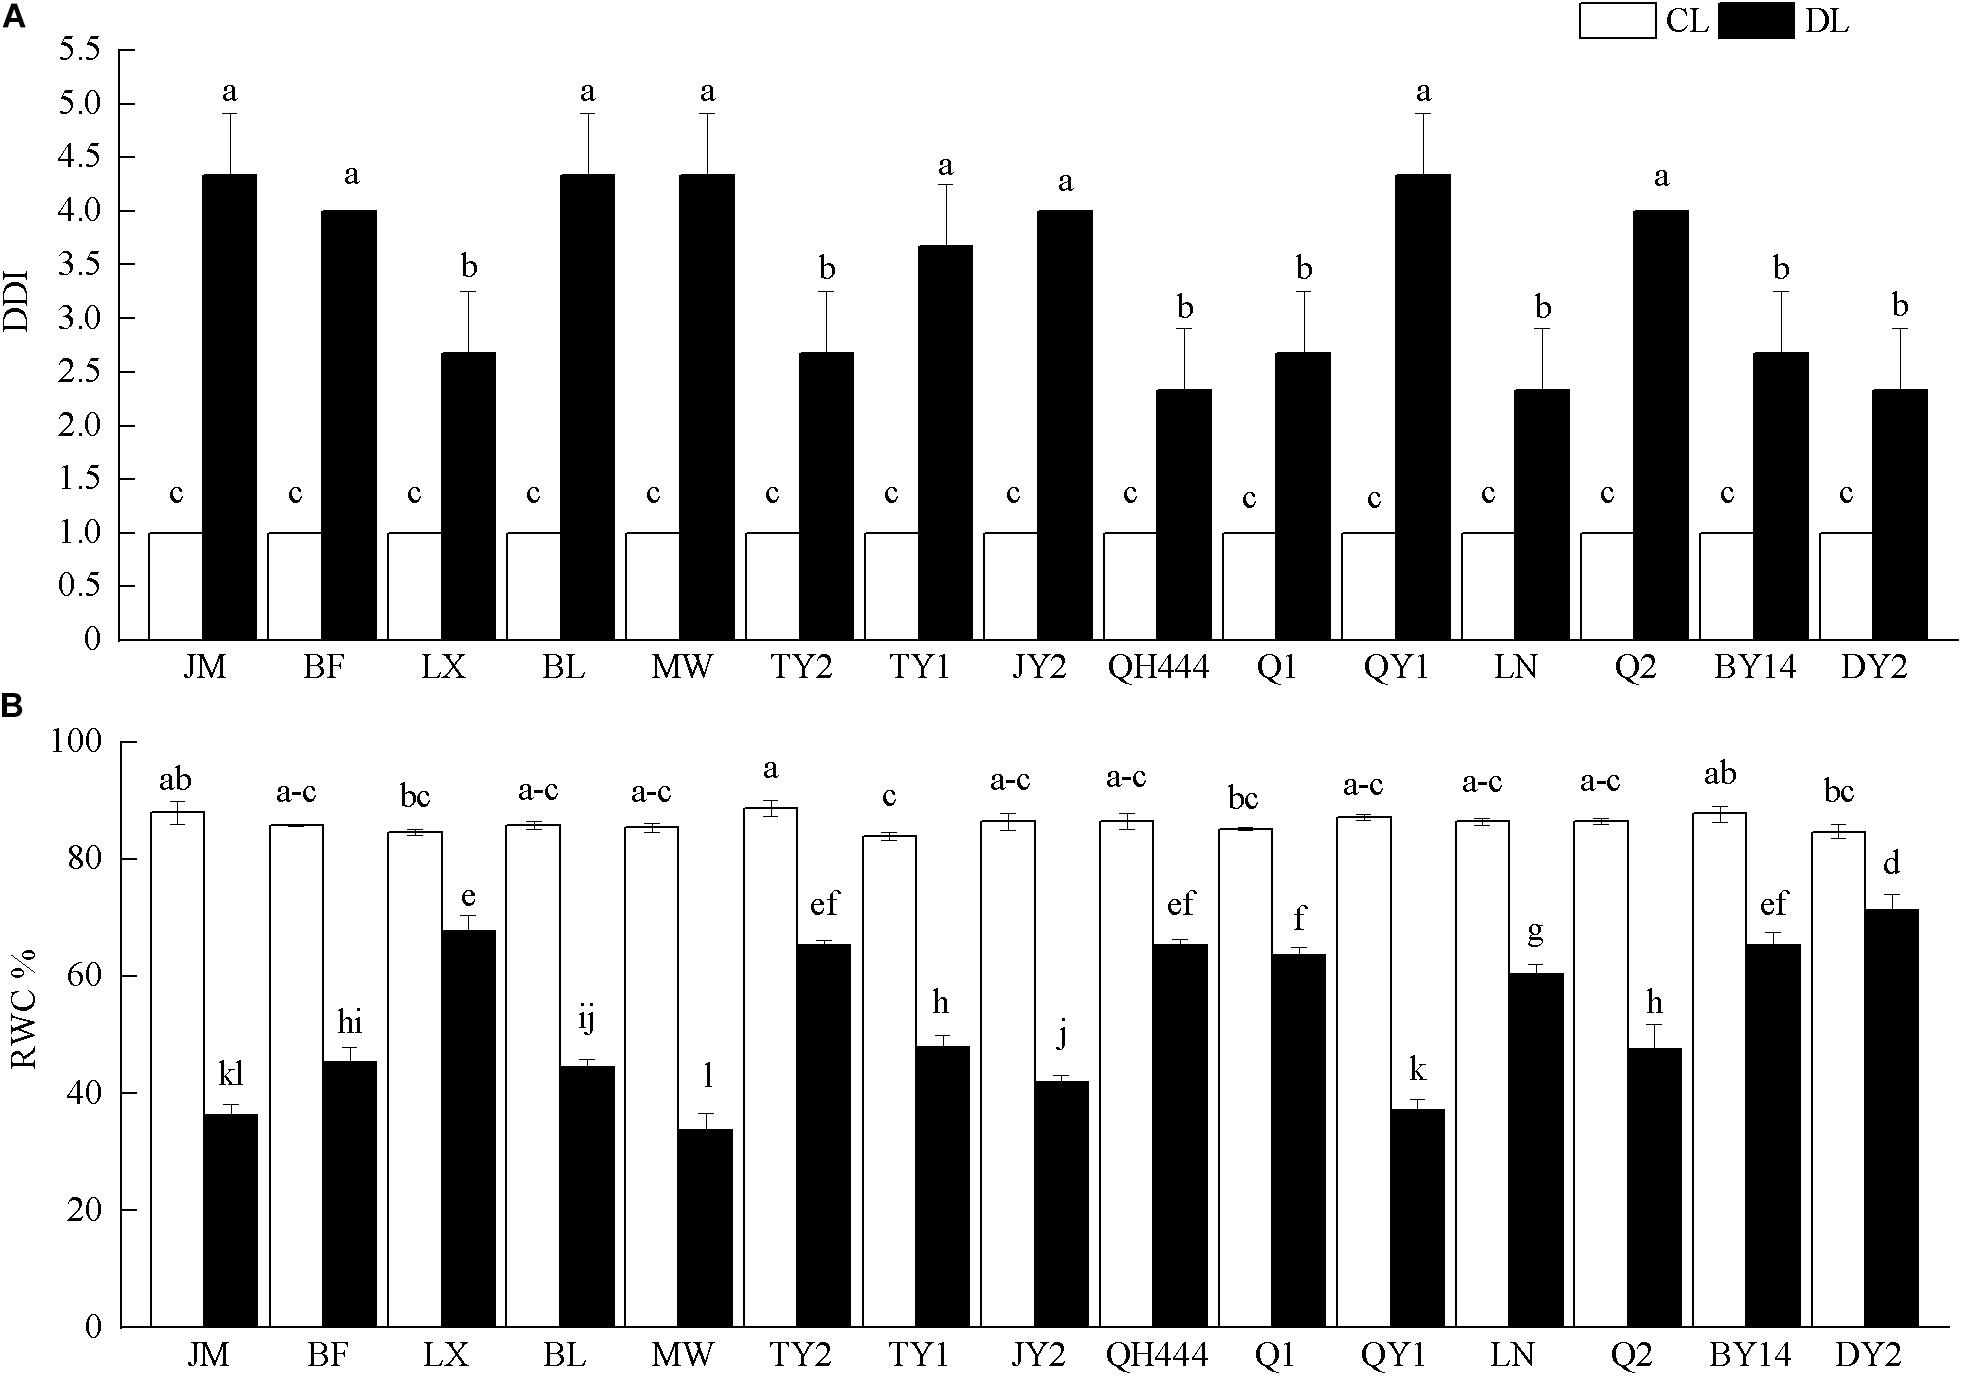
Figure 1. Effects of drought stress on the drought damage index (DDI) (A) and relative water content (RWC%) content (B) in leaves of different oat varieties. Each value represents the mean ± SD. Each experiment was repeated three times. An analysis of variance test followed by a Tukey test was performed. CL, control; DL, drought stress. Different letters indicate that the differences between treatments were significant (P < 0.05).
Effects of Drought Stress on the Content of SP and SSC
The SP content of BF, BL, MW, and Q1 (P > 0.05), and the SP content of the other varieties increased significantly after drought stress (P < 0.05). Of these, the SP content of DY2 increased the most after drought stress, which was 1.47 times that of the control (Figure 2A). Drought stress also increased the SSC content of the tested cultivars. The SSC content increased significantly after drought stress (P < 0.05). The SSC content of QY1, BY14, BL, and DY2 increased substantially, specifically by 1.53, 1.41, 1.38, and 1.32 times that of their corresponding controls, respectively (Figure 2B).
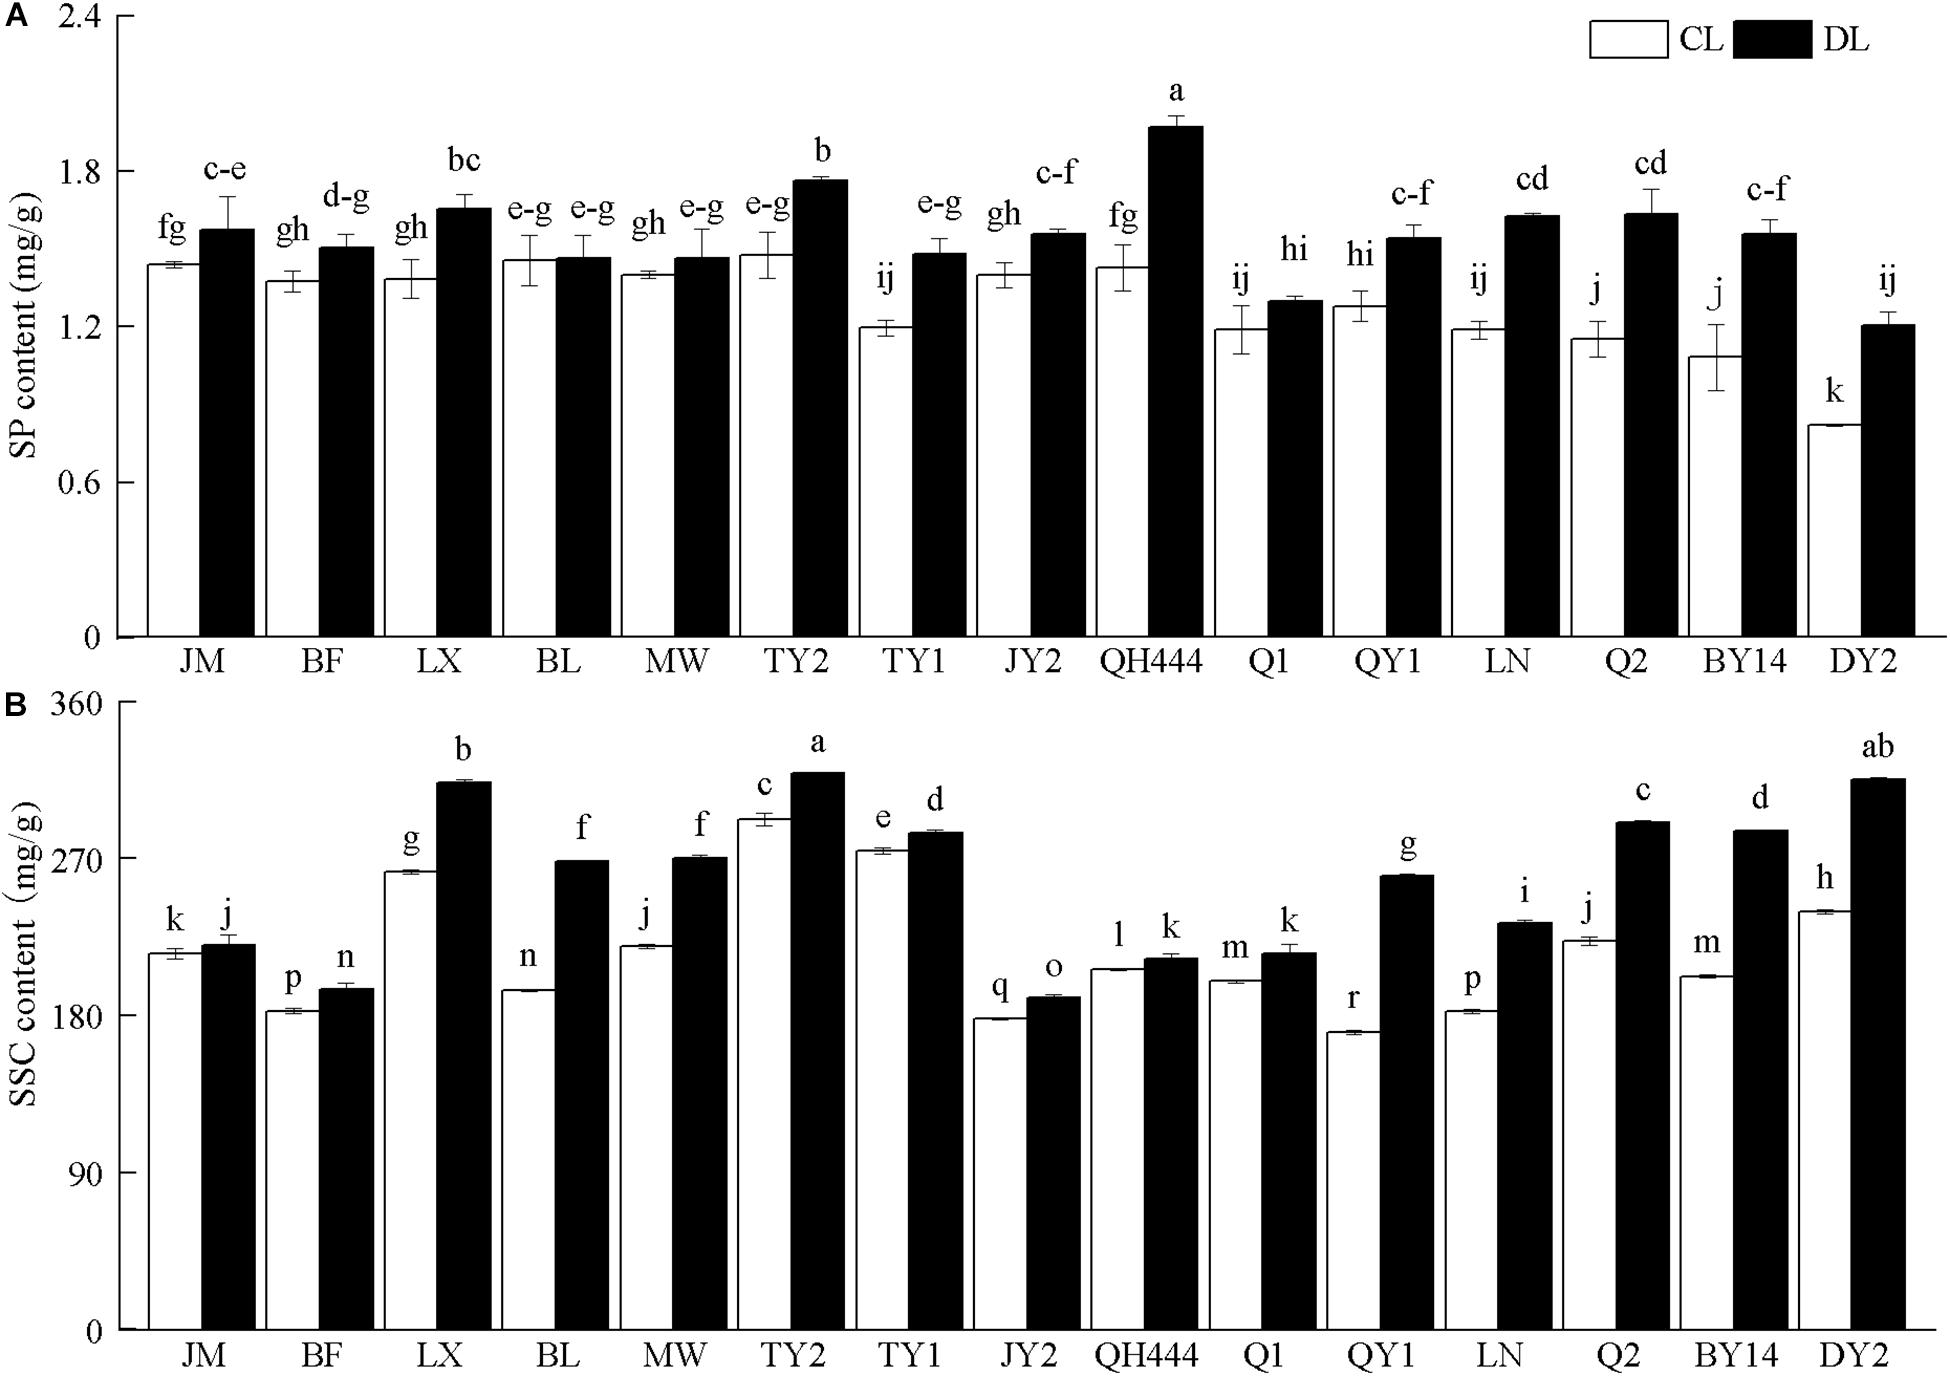
Figure 2. Effects of soluble protein (SP) (A) and soluble sugar (SSC) content (B) in leaves of different oat varieties under drought stress. Each value represents the mean ± standard deviation. Each experiment was repeated three times. An analysis of variance test was performed, followed by Tukey test. CL, untreated control; DL, drought stress. Different letters indicate that the differences between treatments were significant (P < 0.05).
Effects of Drought Stress on Enzyme Activities in the Antioxidant System
The SOD, POD, and CAT activities of the various tested varieties increased under drought stress. Among them, the SOD activity of MW was slightly increased, whereas the SOD activity of DY2 was significantly higher than that of the control. In particular, the SOD activity of DY2 was 2.12 times that of the control (Figure 3A). JM and Q2 exhibited a slight increase in POD activity. Q1, DY2, and QH444 displayed the largest increases in activity under drought stress, which were 1.93, 1.81, and 1.73 times that of their corresponding controls, respectively (Figure 3B). Compared with the control, the CAT activities of JM and MW slightly increased under drought stress. However, QH444, Q1, and DY2 exhibited the largest increases, which were 1.63, 1.74, and 1.53 times that of their corresponding controls, respectively (Figure 3C).
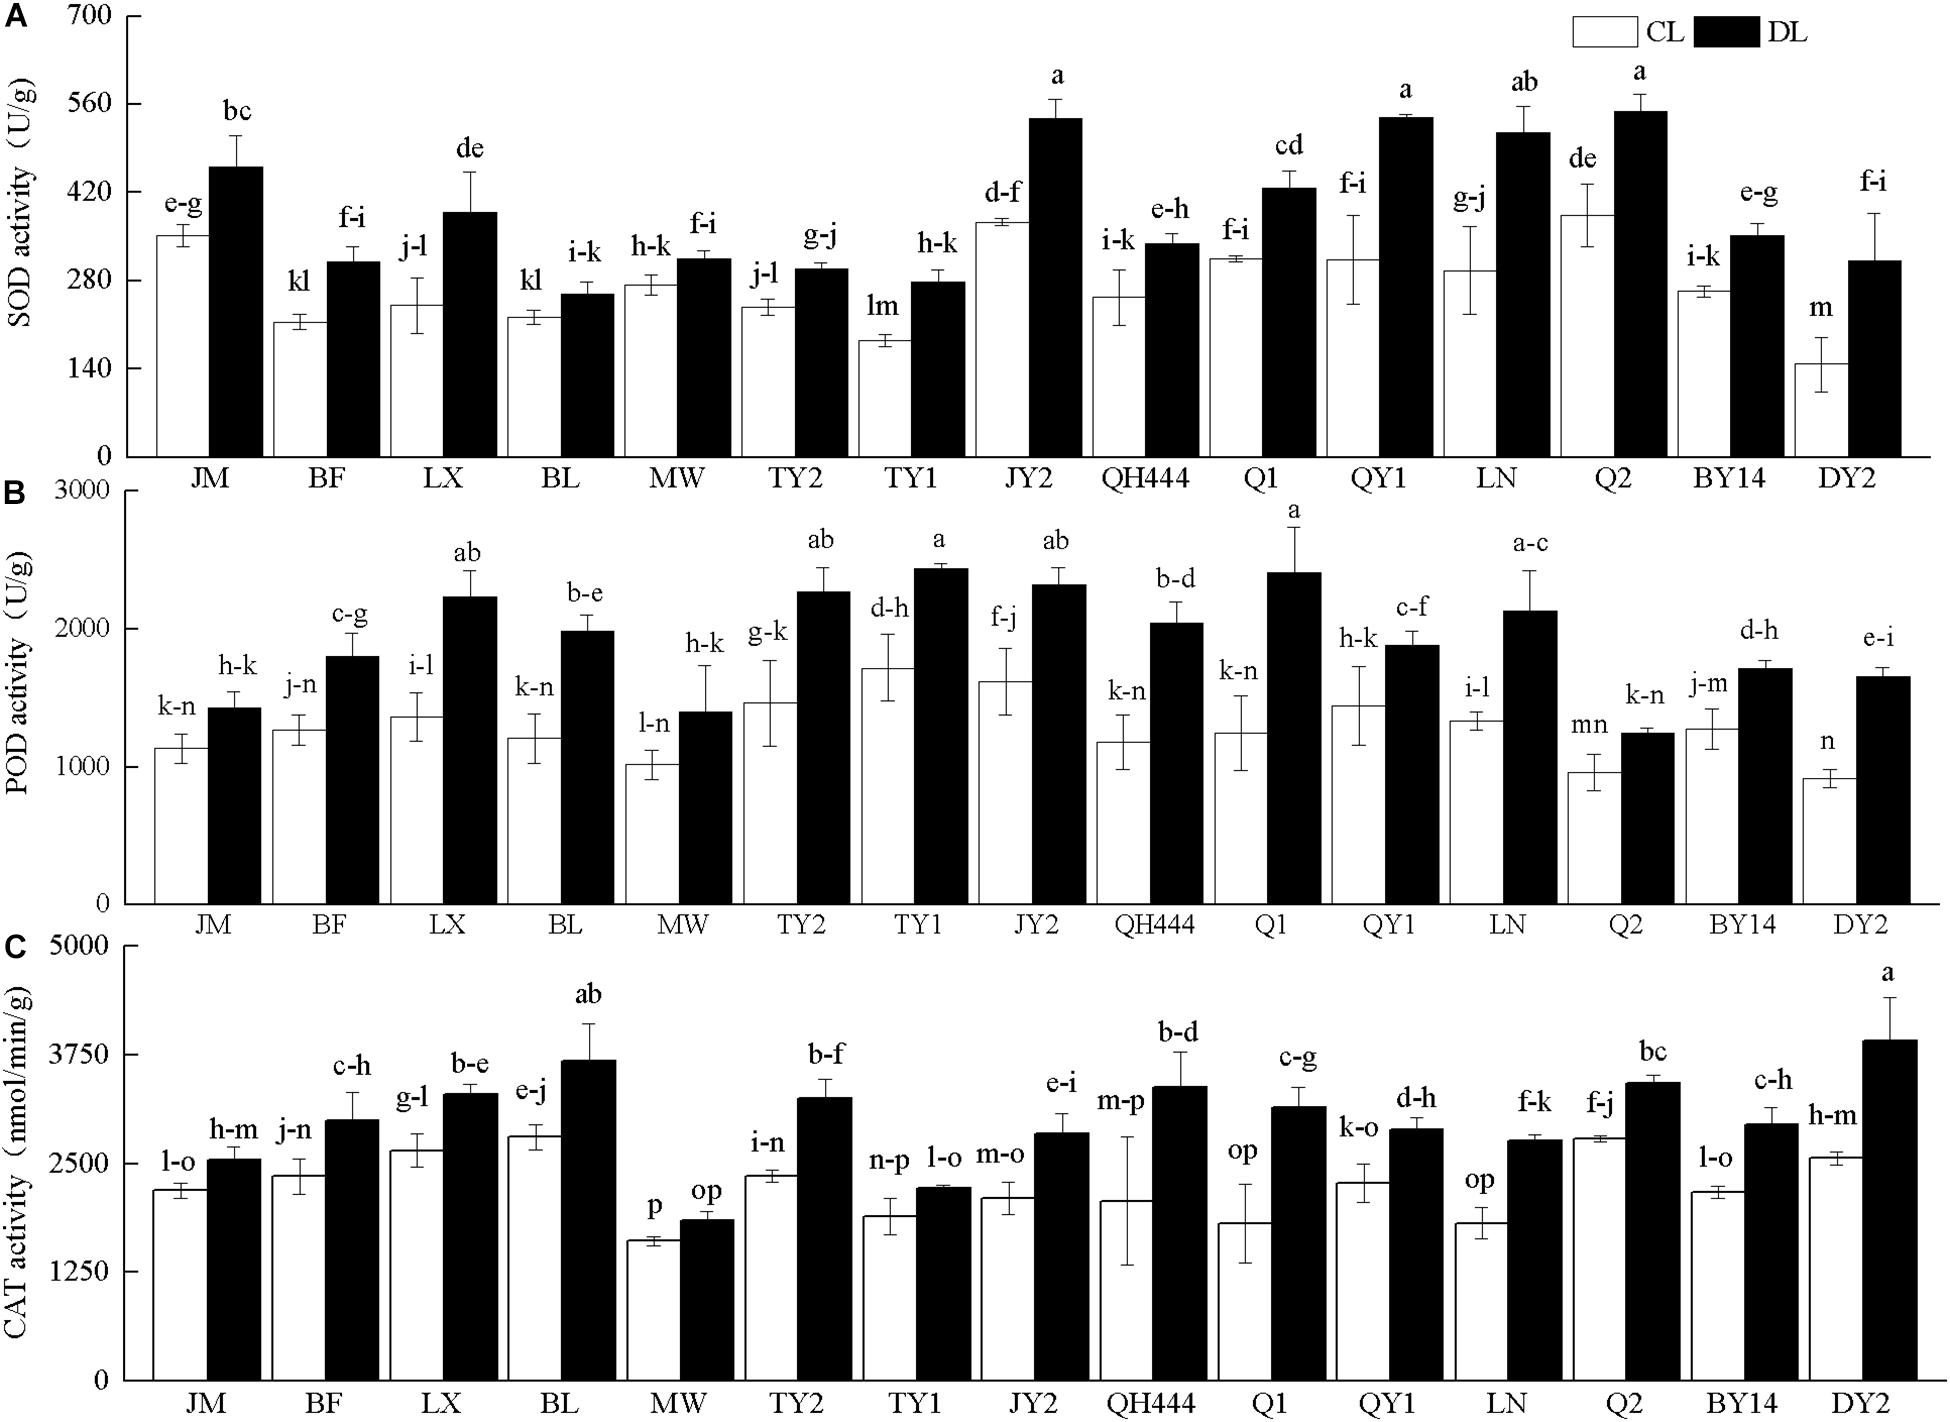
Figure 3. Superoxide dismutase (SOD) (A), peroxidase (POD) activity (B), and catalase (CAT) activity (C) in oat varieties under drought stress. Each value represents the mean ± standard deviation. Each experiment was repeated three times. An analysis of variance test was performed, followed by Tukey test. CL, untreated control; DL, drought stress. Different letters indicate that the differences between treatments were significant (P < 0.05).
Effects of Drought Stress on REC and MDA Content
After drought stress, the REC and MDA contents of the tested cultivars increased. The REC significantly increased after drought stress (P < 0.05). Among the cultivars tested, the REC of MW and JM increased the most, specifically by 8.39 and 11.53 times that of their controls, respectively. QH444 and DY2 displayed only slight increases, which were 2.19 and 2.82 times those of their controls, respectively (Figure 4A). The MDA contents of TY2 and DY2 were not significantly increased after drought stress (P > 0.05), but increased slightly, specifically by 1.08 and 1.05 times that of their controls, respectively. Additionally, the MDA content of the other varieties was significantly higher than that of the control (P < 0.05). Among them, the content of Q1 and MW increased the most, specifically by 2.49 and 2.92 times that of their controls, respectively (Figure 4B).
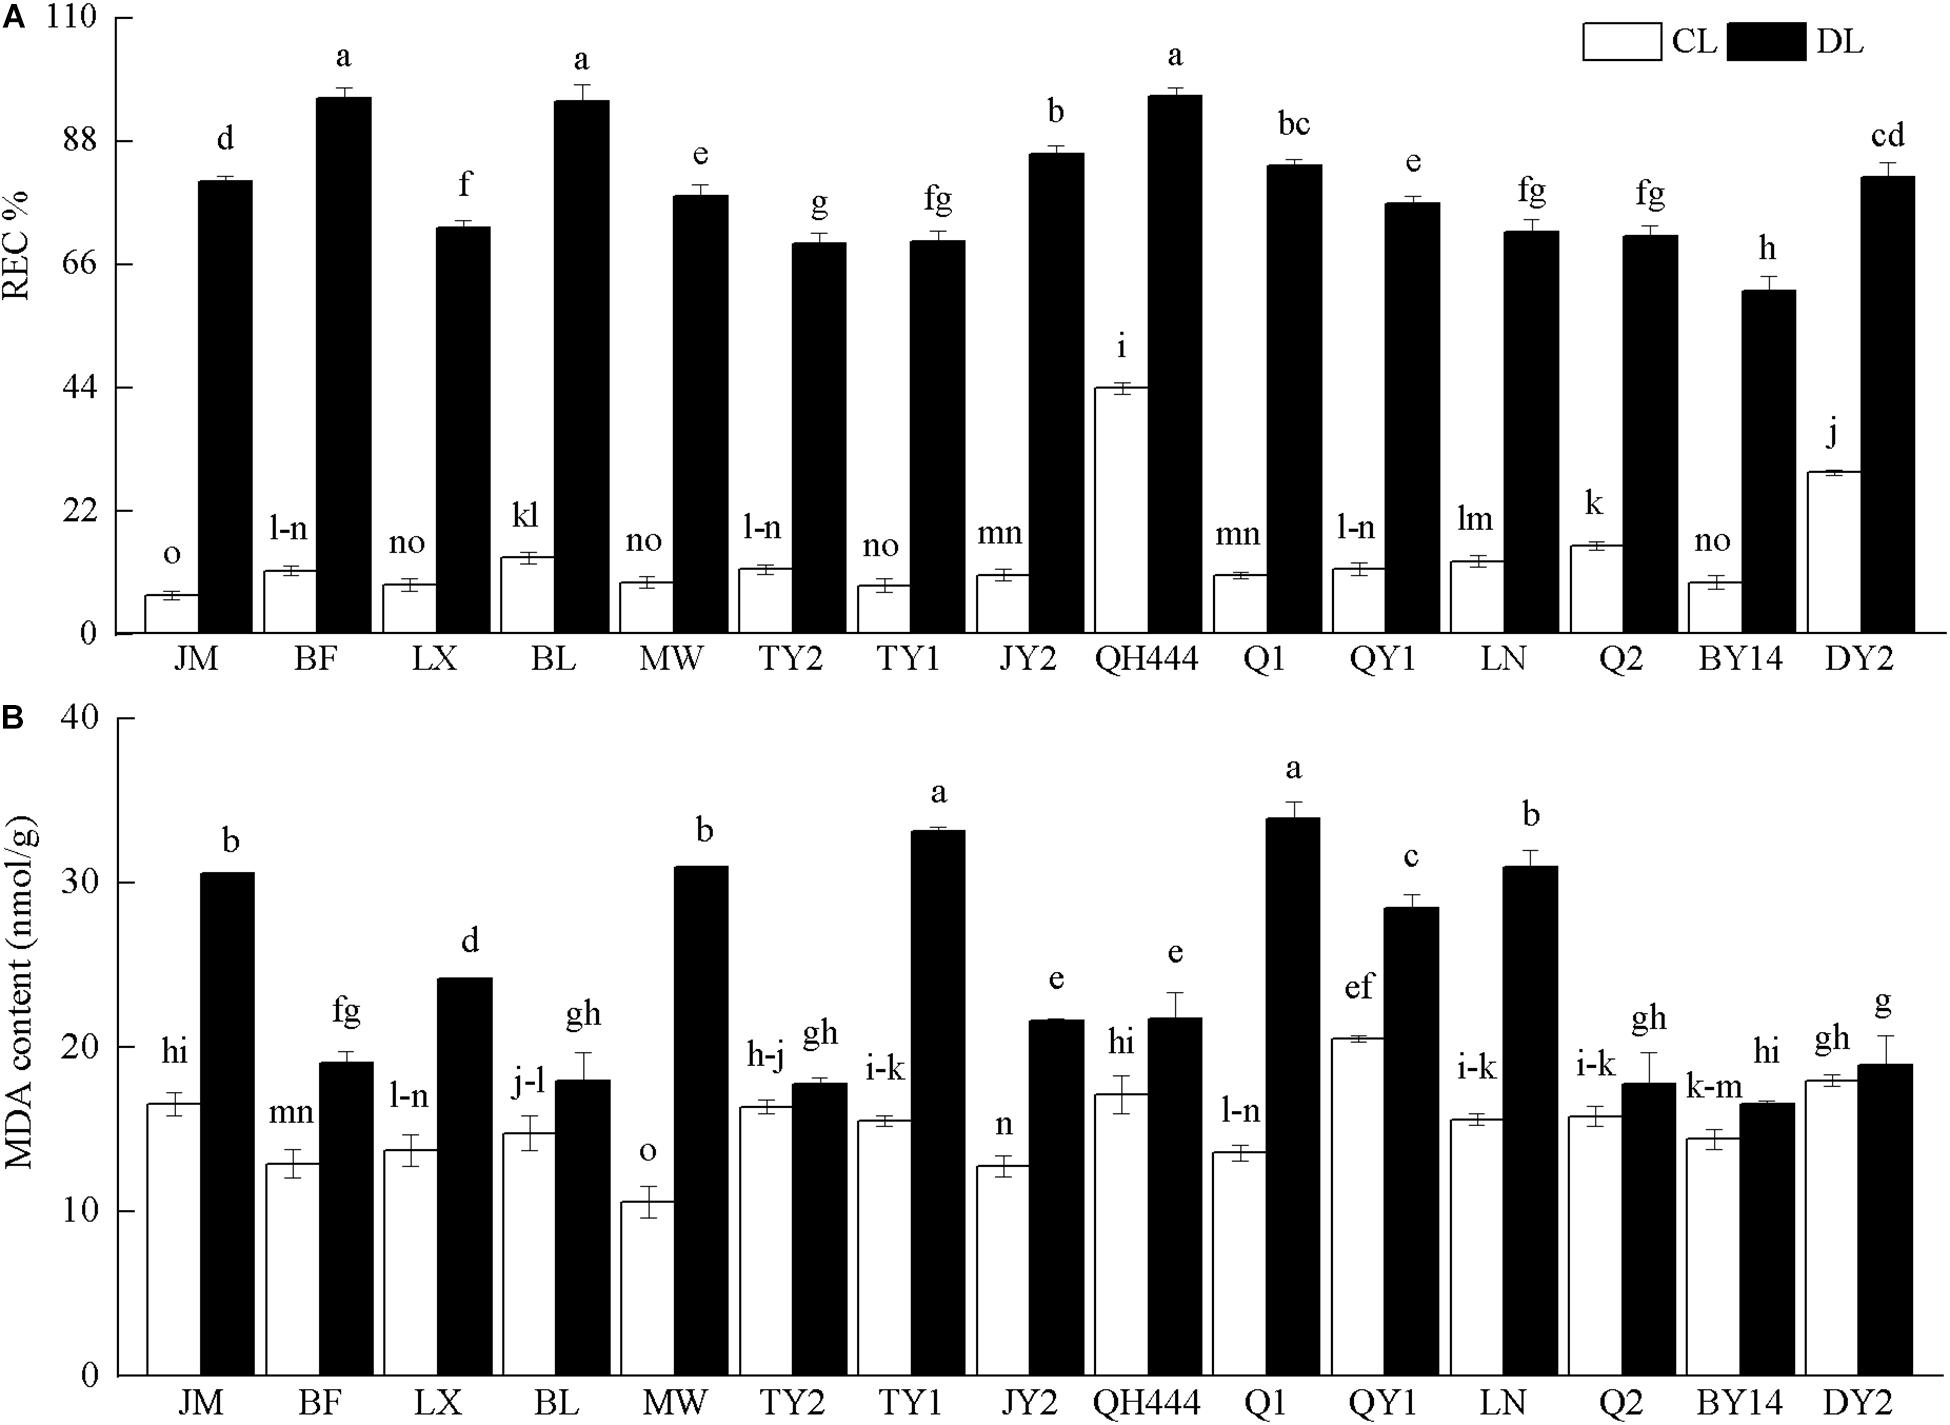
Figure 4. Relative electrical conductivity (REC%) (A) and malondialdehyde (MDA) content (B) in oat varieties under drought stress. Each value represents the mean ± standard deviation. Each experiment was repeated three times. An analysis of variance test was performed, followed by Tukey test. CL, untreated control; DL, drought stress. Different letters indicate that the differences between treatments were significant (P < 0.05).
Effects of Drought Stress on Fv/Fm and the Chl Content
The Chl content and Fv/Fm of all the materials decreased. The Fv/Fm of LX, TY2, BY14, and DY2 was not significantly different after drought stress (P > 0.05), but decreased slightly, specifically by 0.97, 0.97, 0.97, and 0.98 times that of their controls, respectively. However, the Fv/Fm of the other tested varieties displayed a larger decline and was significantly lower than that of the control (P < 0.05) (Figure 5A). The Chl content of QY1 was not significantly different after drought stress (P > 0.05) and was 0.96 times that of the control. In contrast, the Chl content of the other varieties was significantly reduced (P < 0.05). Of these, the Chl content in MW declined the most, specifically by 0.55 times that of the control (Figure 5B).
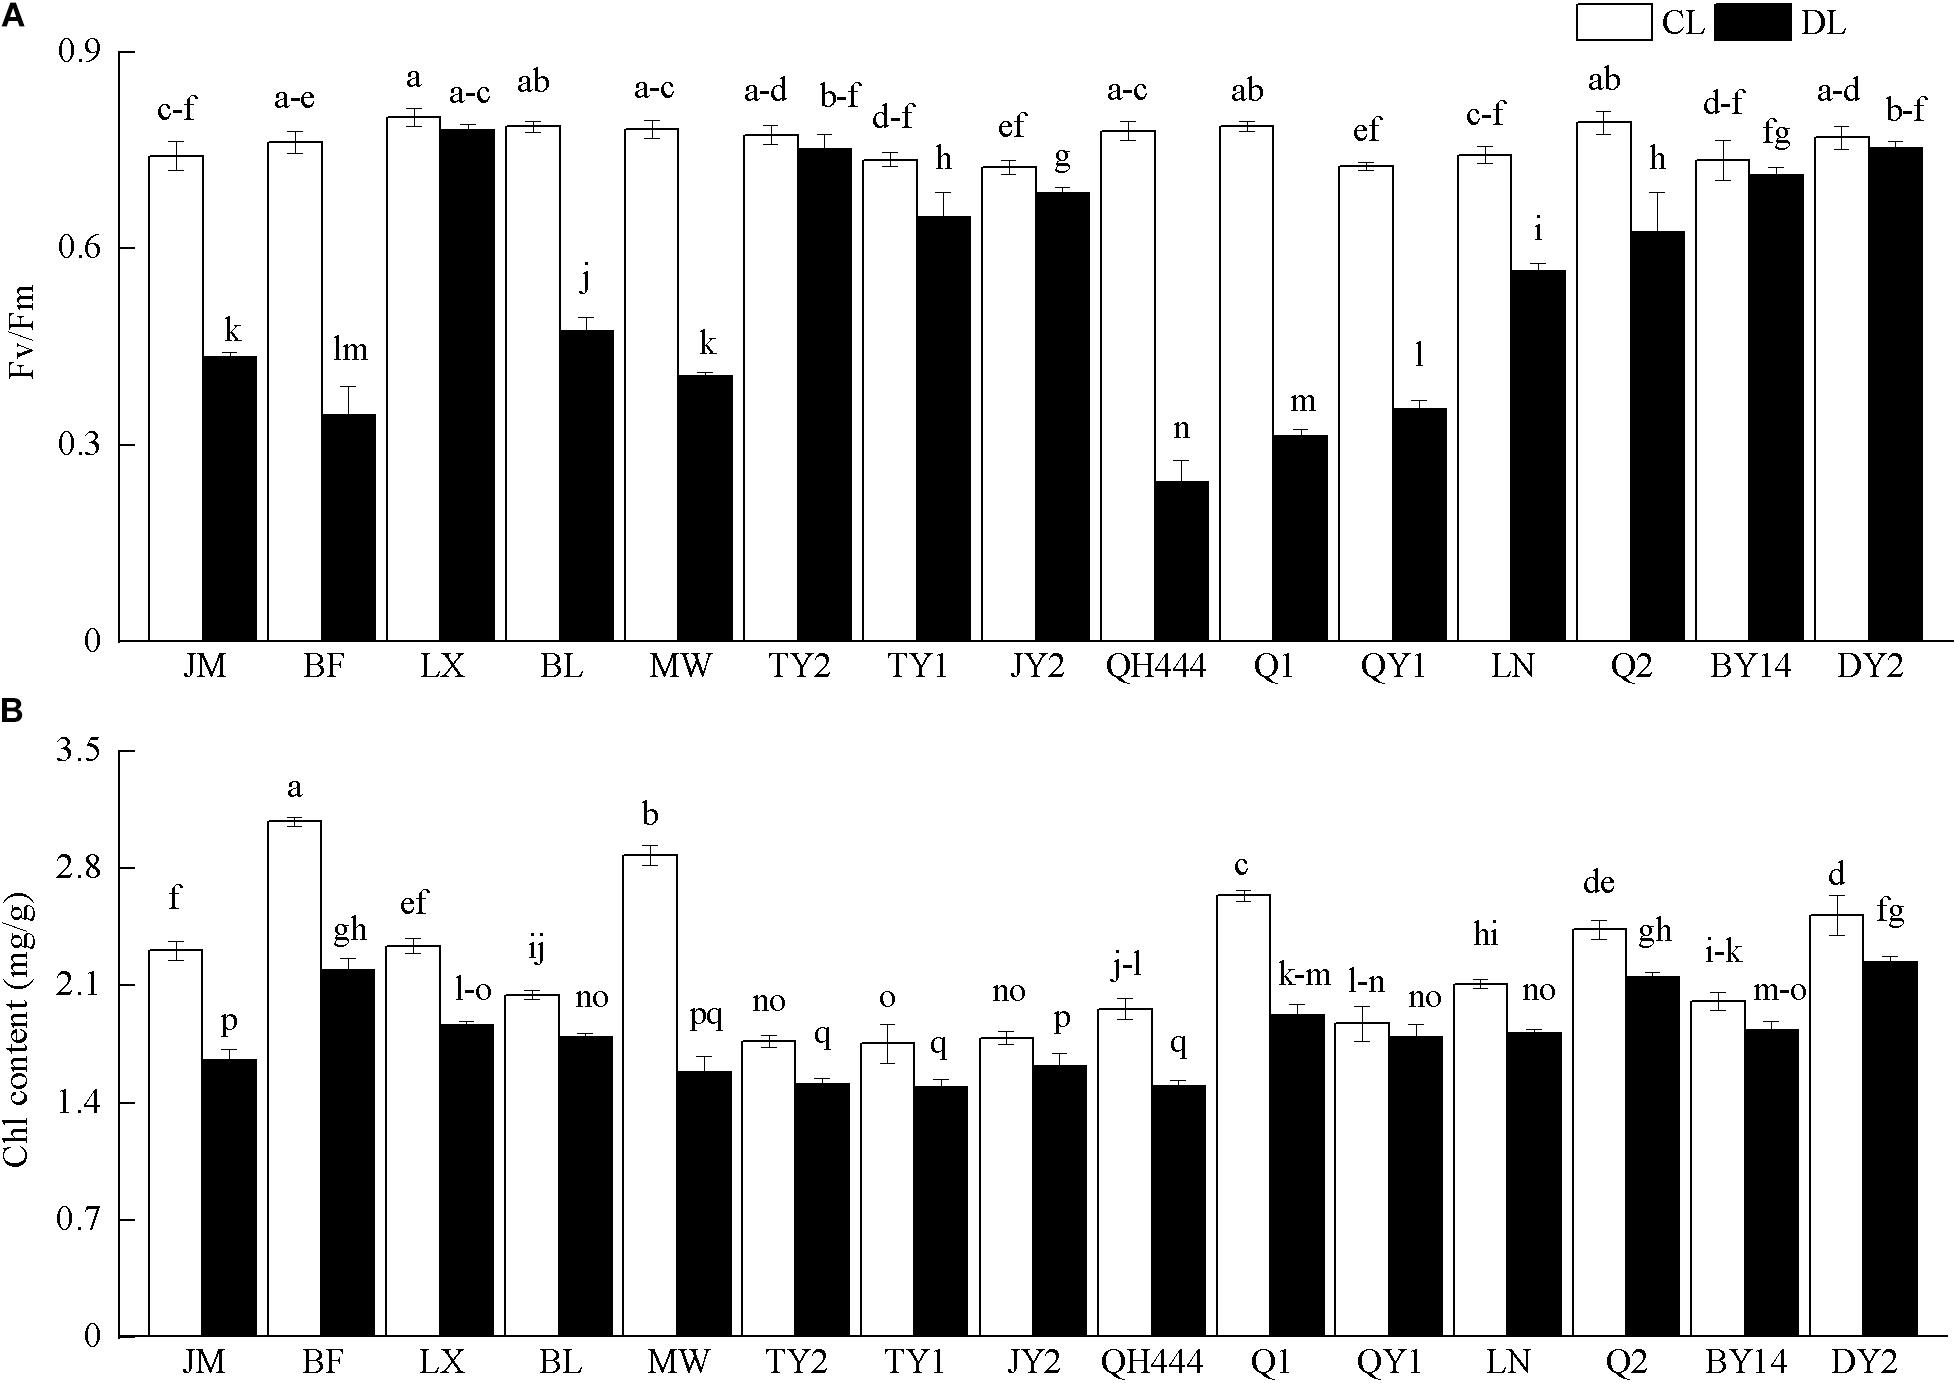
Figure 5. Photochemical efficiency (Fv/Fm) (A) and chlorophyll content (B) in oat varieties under drought stress. Each value represents the mean ± SD. Each experiment was repeated three times. An analysis of variance test was performed, followed by Tukey test. CL, untreated control; DL, drought stress. Different letters indicate that the differences between treatments were significant (P < 0.05).
Classification of Physiological Indexes for Drought Resistance of Oat Seedlings Under PEG Stress
A principal component analysis was performed on the drought resistance coefficients of the 11 indicators. The first three principal components were extracted as the main factors for drought resistance evaluation based on the principle that the characteristic value of the principal component was greater than 1 (Table 3). The results showed that the characteristic root of the first principal component was 4.720, and the contribution rate was 42.912%. Among the indicators, the RWC and REC had the largest loads. This principal component reflects the water status, water-holding capacity, membrane stability, and other information of the varieties. The characteristic root of the second principal component was 2.566, and the cumulative contribution rate was 66.239%. Of these, POD and CAT had a strong load, indicating that the principal component mainly reflected the relevant information regarding the protective enzymes. The characteristic root of the third principal component and cumulative contribution rate were 1.125% and 76.463%, respectively. Among them, Fv/Fm had a strong load, indicating that the principal component mainly reflected the relevant information regarding leaf photosynthesis.
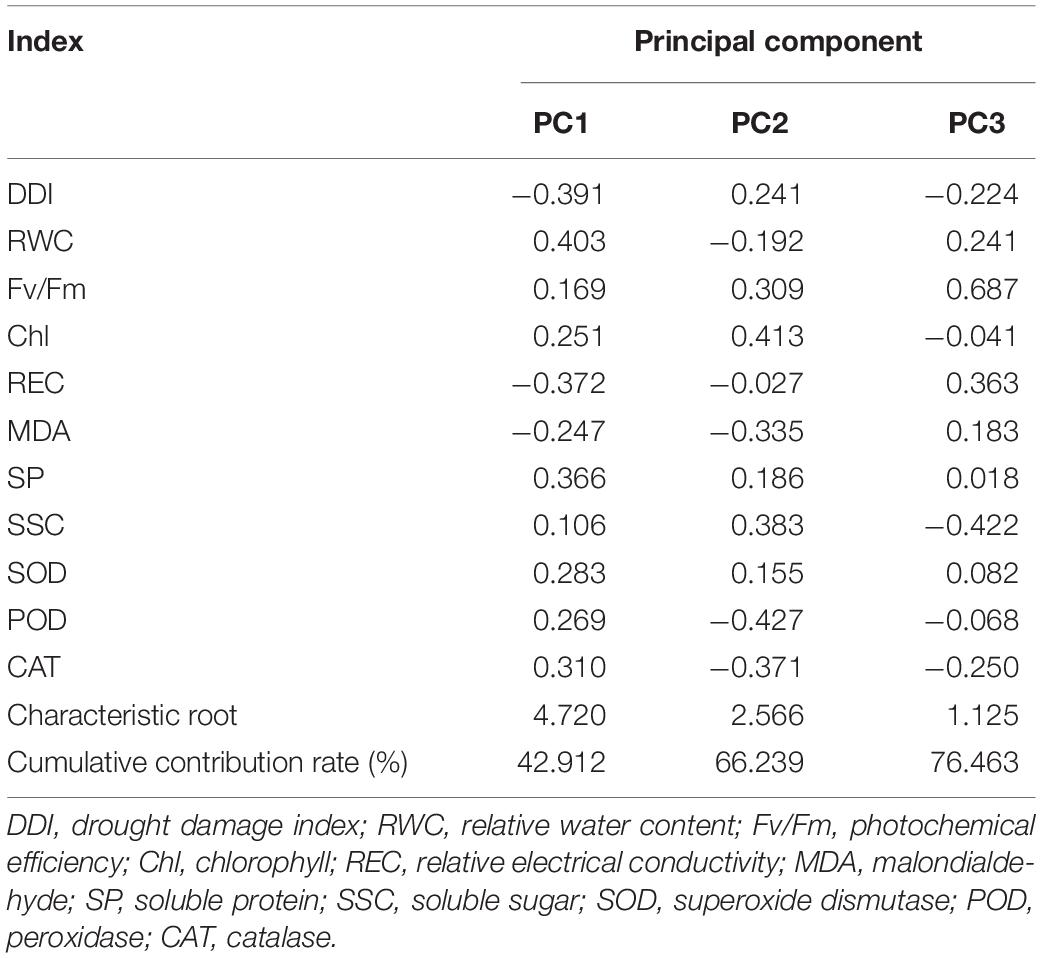
Table 3. Results of principal component analysis of indexes.
As shown in Figure 6, DY2 and BY14 were mainly distributed in group A, whereas MW and JM were mainly distributed in group C. The other eight varieties were mainly distributed in group B, indicating that the responses of these eight varieties to drought stress were similar.
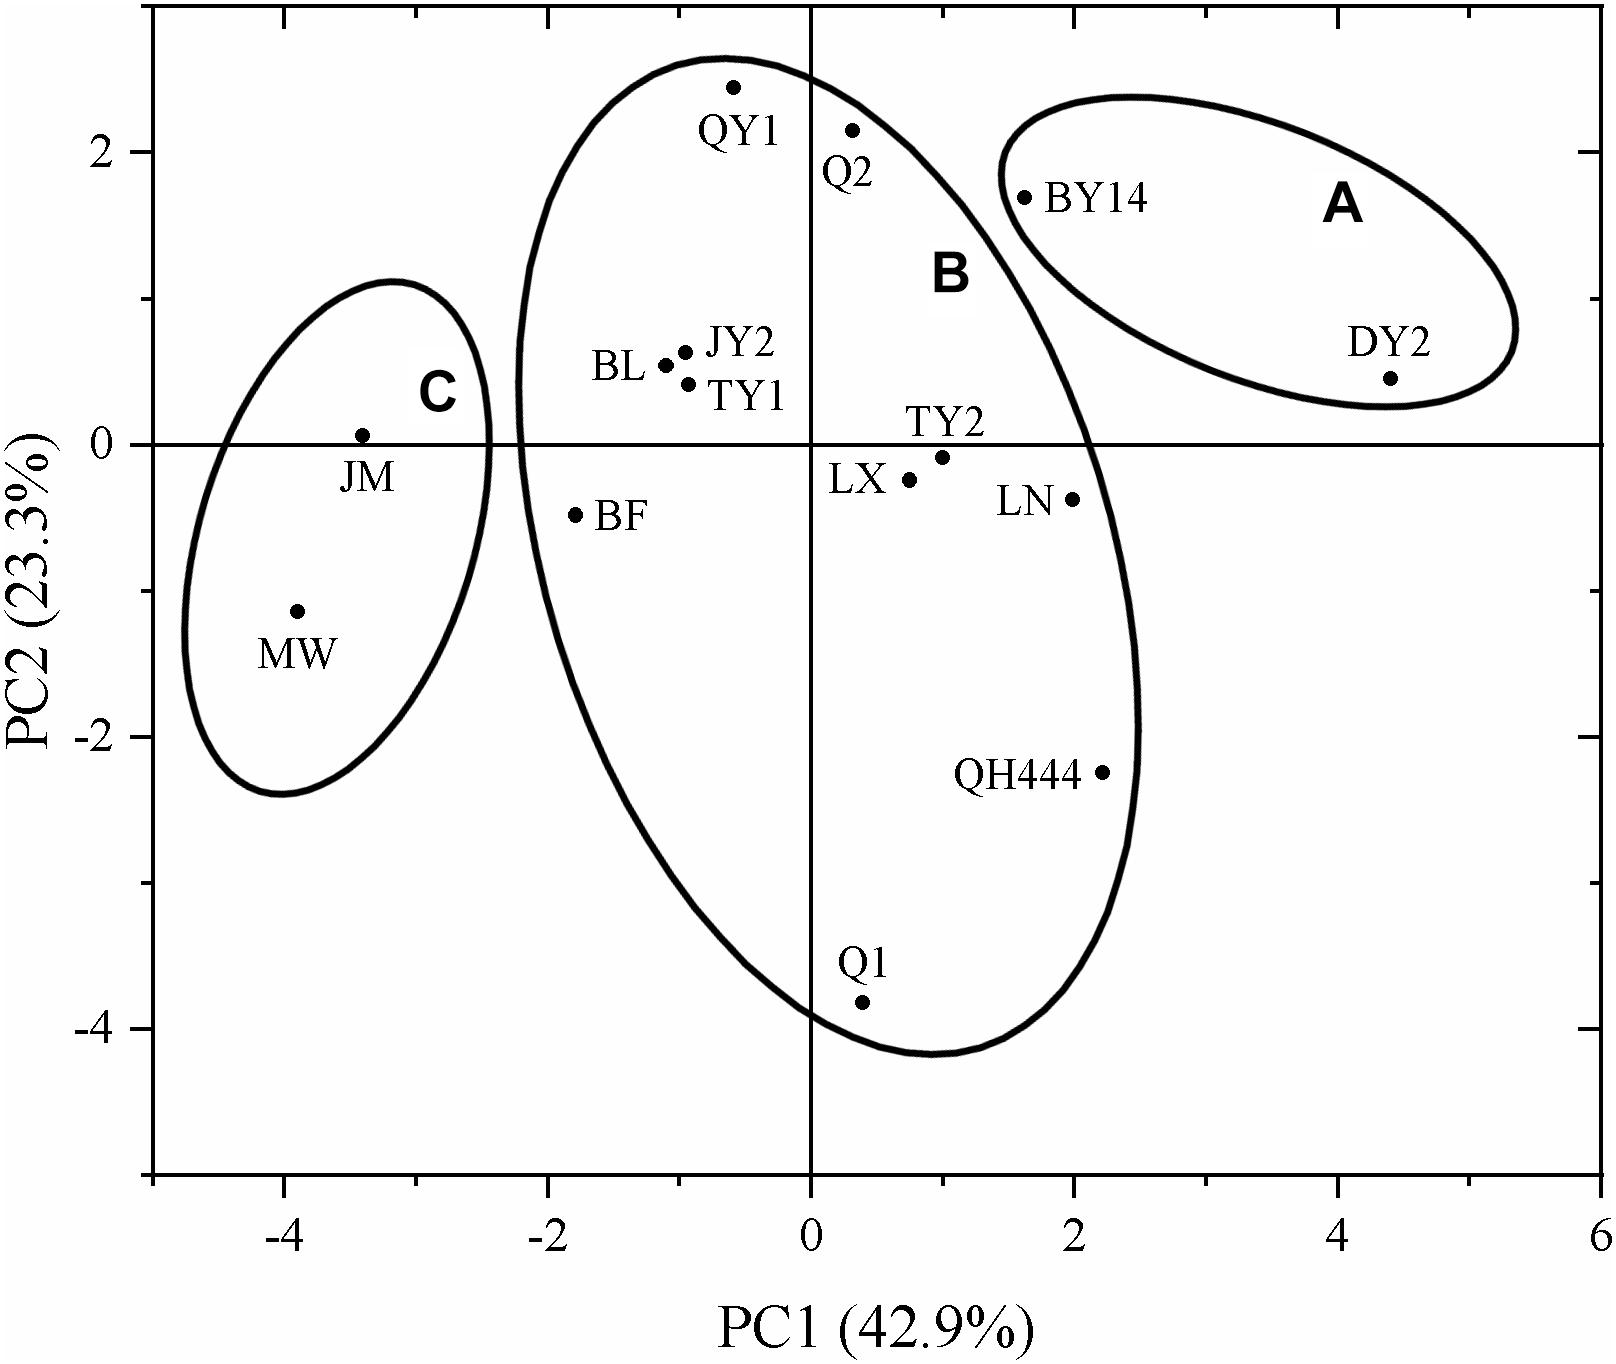
Figure 6. Principal component analysis of different oat varieties.
As for indicators, SOD activity; SP, Chl, and SSC content; and Fv/Fm were distributed in group A; the RWC and POD and CAT activity were distributed in group B, whereas the DDI, MDA content, and REC were distributed in group C. The indexes distributed in the same group had a strong correlation. Of these, the responses of SOD activity; SP, Chl, and SSC content; and Fv/Fm to drought stress were similar. The RWC, POD and CAT activity, DDI, MDA content, and REC exhibited similar responses to drought stress. The DDI, MDA content, and REC were negatively correlated with plant drought resistance lines (Figure 7).
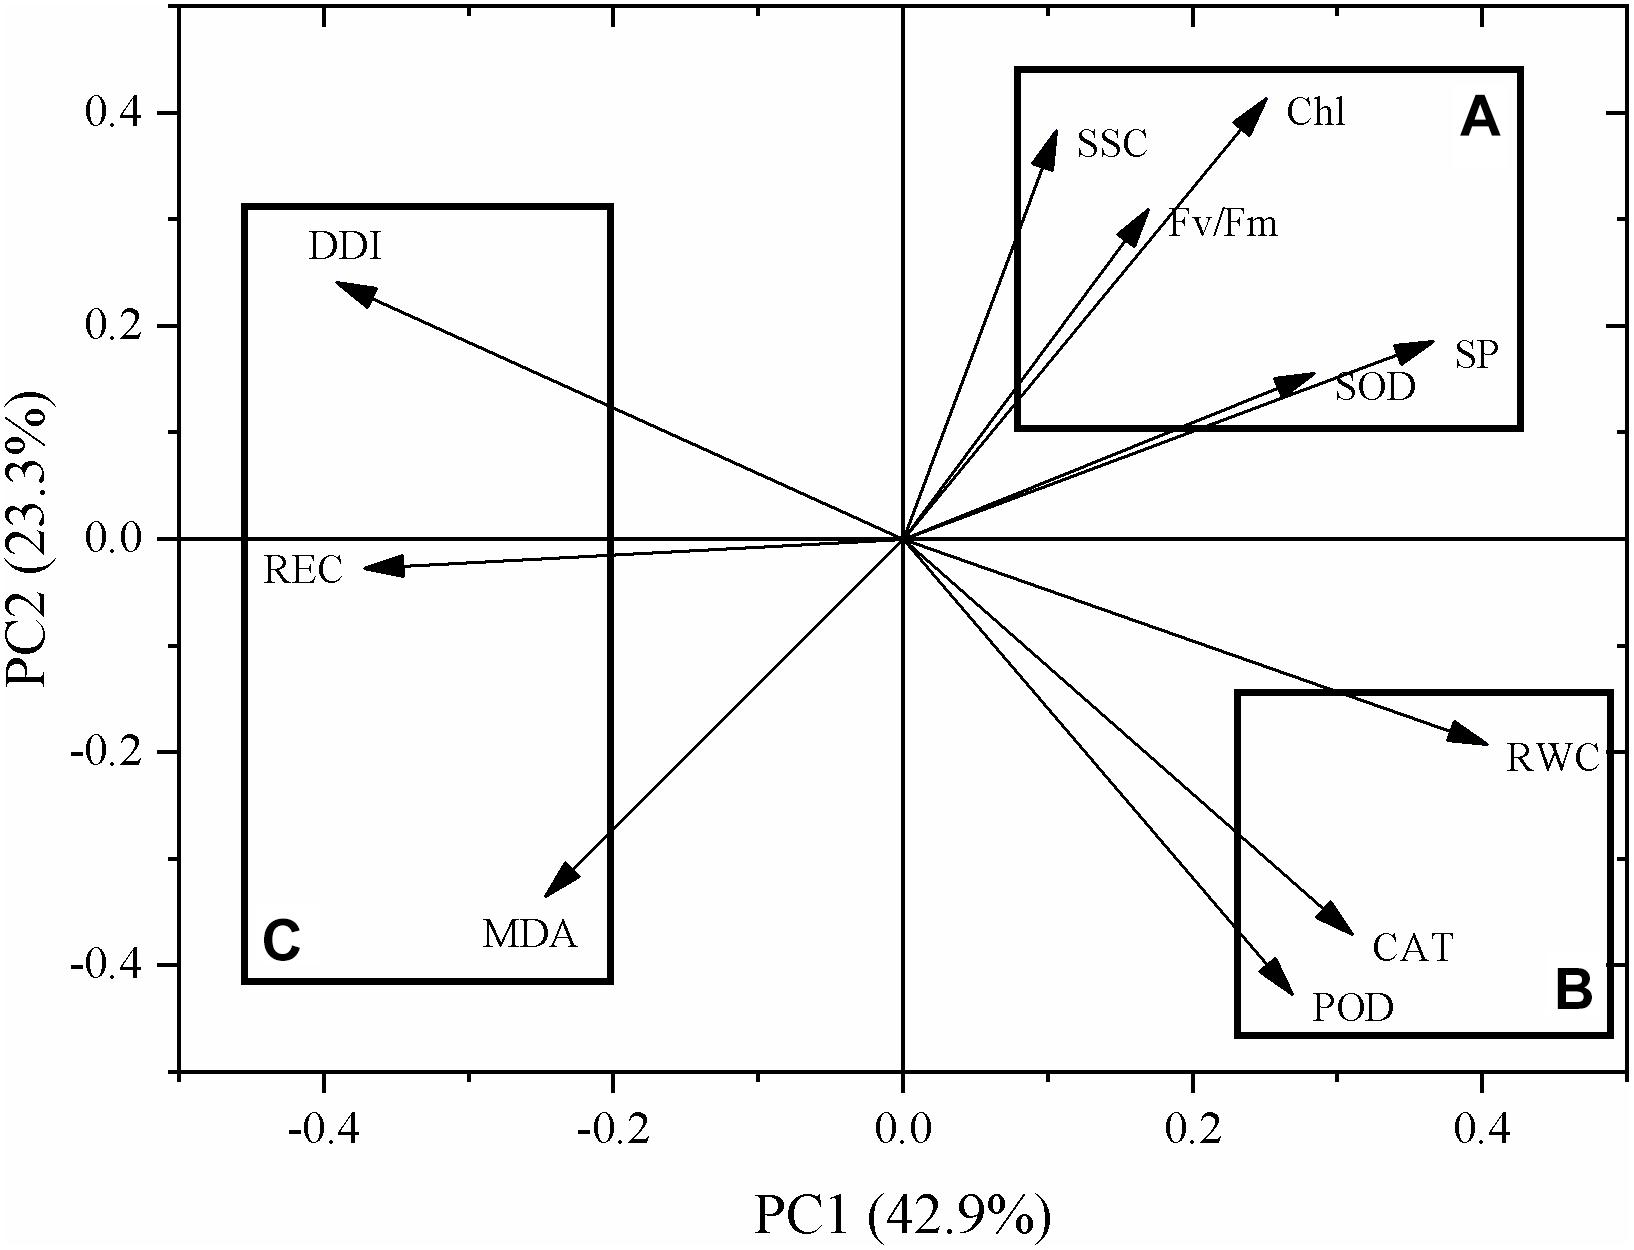
Figure 7. Principal component analysis of different indicators.
Comprehensive Evaluation of Drought Resistance of Oat Varieties
The first three factors were used to analyze the membership function. The weight of each factor was calculated according to formula (4), and then the average weighted membership function value (D value) was obtained. Based on the D values, the drought resistance of each material was comprehensively evaluated. The higher the D value, the stronger the drought resistance. As shown in Table 4, the drought resistance of the 15 oat varieties was ranked from strong to weak according to the D values: DY2 > BY14 > LN > Q2 > LX > TY2 > TY1 > QY1 > JY2 > QH444 > BL > BF > Q1 > JM > MW.
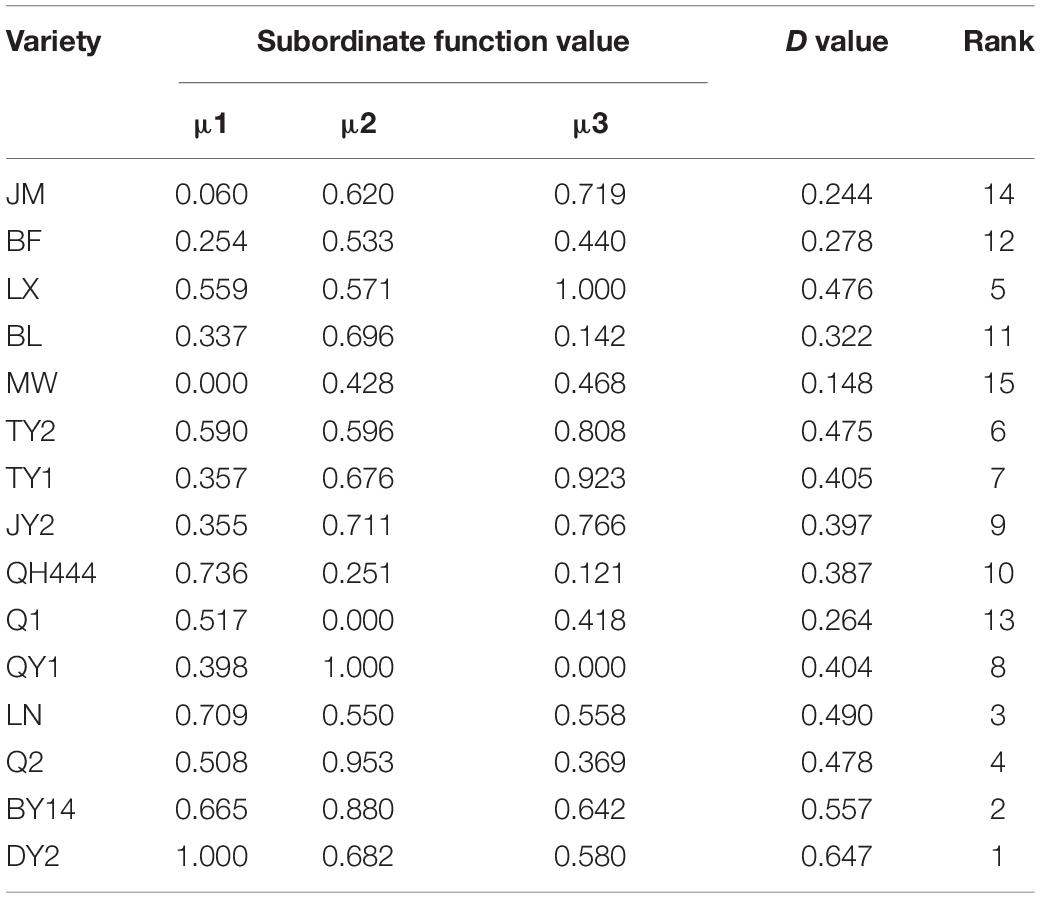
Table 4. Subordinate function and D value of the drought resistance evaluation.
Furthermore, according to the gray correlation theory, the closer to the D value, the greater the correlation. The series X1, X2, X3, and X6 had the largest correlations with the D value, thereby showing that the DDI, RWC, Fv/Fm, and MDA content were closely related to the drought resistance of the oat seedlings (Table 5). However, the correlation degree between X9, X10, and X11 and the D value were the smallest, indicating that the SOD, POD, and CAT activities were less affected by drought stress.
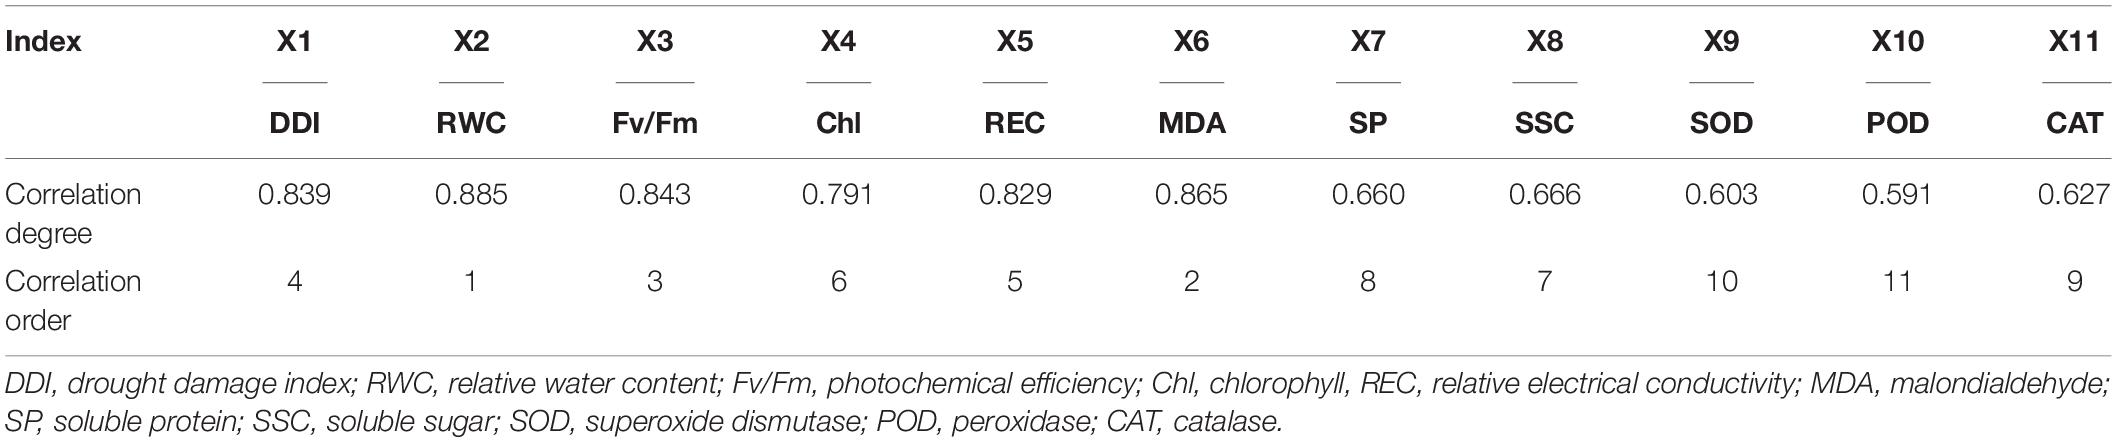
Table 5. Gray correlation analysis between the identification indices and D values.
Discussion
Changes in the Phenotypic Characters and RWC of Oat Leaves Under Drought Stress
When a plant is in a state of drought stress, the cells in the plant body respond in a timely manner, and finally, changes are mainly observed in the appearance of the plant (Farooq et al., 2009); hence, we can directly judge the degree of damage caused by drought by observing the phenotypic characteristics of plants. The external morphology, such as the withering degree and color of the leaves, can reflect physiological changes in the plants. Kabay et al. (2017) scored the phenotypes of kidney beans under drought stress and determined drought-tolerant and drought-sensitive bean varieties through significantly different phenotypic scores and leaf RWC. In this study, under normal watering conditions, the leaves of oat seedlings were normally green. Under drought stress, there were significant differences in the phenotypic characteristics of the different oat varieties, which showed differences in their drought resistance. Varieties QH444, LN, and DY2 with lower DDI values showed late symptoms of drought injury and mild drought damage, with only a few leaves showing curling symptoms and leaf margin yellowing, indicating these had a strong ability to adapt to drought. In contrast, varieties JM, MW, and QY1 showed severe drought symptoms, with more than 60% of plants showing moderate wilting, which gradually advanced to the whole stem in some plants, along with leaf curling and yellowing. The results showed that these were more sensitive to drought stress and had poor drought tolerance. The RWC indicates the degree of water deficit in plants under stress and reflects the physiological state of water in the plant leaf cells (Zegaoui et al., 2017). Therefore, the RWC is often regarded as a comprehensive and effective index for identifying plant drought resistance (Zheng et al., 2009). In this study, the RWC of the sensitive varieties JM, MW, and QY1 decreased significantly, whereas it decreased only slightly in the drought-resistant varieties (LX, QH444, and DY2), which was consistent with the trend observed in Sorghum sudanense (Zhu et al., 2019).
Responses of Physiological Indicators to Drought Stress at the Seedling Stage in Oat
Evaluation and screening of cultivars under drought stress according to physiological parameters are the premise of crop improvement (Talebi et al., 2013). Plants increase cell fluid concentration by changing their content of SSC and SP and decrease their osmotic potential to promote water absorption, maintain cell swelling, and ensure cell growth and metabolism (Morgan, 1984; Deligoz and Gur, 2015; Fang and Xiong, 2015). The increase of SSC content could promote the viscosity, elasticity, and cell sap concentration of protoplasts, thereby improving the water absorption and water retention capacity of crops (Wang et al., 2016). Osmotic regulation contributes to cell development and promotes plant growth under drought stress (Keshavarz et al., 2016). In this study, after drought stress, the accumulation of SSC content in TY2 and DY2 was significantly increased. This was consistent with previous results in wheat (Wang et al., 2011). In addition, the SP content of the tested oat varieties increased under drought stress, which was consistent with the changing trend of forages (Jin et al., 2015). Under drought stress, the SP content of DY2 was significantly increased by 1.47 times that of the control. The SSC content of TY2 accumulated, indicating that the osmotic regulation ability of DY2 and TY2 was stronger than that of the other materials. Therefore, it was inferred that under drought stress, oat could reduce damage by increasing the content of SP to increase the osmotic potential (Zhang, 2018).
Plant cells can also utilize the protective enzyme system (Gill and Tuteja, 2010) including SOD, POD, and CAT to defend against the poison of active oxygen ions and to prevent plant cells from being damaged and losing physiological functions (Keshavarz and Moghadam, 2017). SOD is considered the first line of defense against reactive oxygen species (Sayfzadeh et al., 2011). POD can reduce the accumulation of H2O2 and maintain the integrity of the cell membrane (Chakhchar et al., 2015). CAT is an effective enzyme for the decomposition of H2O2 (Weng et al., 2015), preventing POD from degrading fatty acids (Gill and Tuteja, 2010). SOD activity of licorice (Pan et al., 2006), cowpea (Manivannan et al., 2007), poplar (Xiao et al., 2008), sunflower (Gunes et al., 2008), and tomato (Celik et al., 2017) increases under drought stress. The plant–water relationship plays a key role in the activation and regulation of the antioxidant defense mechanism under drought stress (Pan et al., 2014). Tolerant plants accumulate less hydrogen peroxide and free radicals by maintaining enzyme activities and have a superior protection system (Sinhababu and Kar, 2003). The activities of SOD and POD in drought-resistant varieties are higher than those in sensitive varieties (Seyed Ebrahimi et al., 2016). In this study, the activities of POD, CAT, and SOD of Q1 and DY2 increased under drought stress, which were consistent with the conclusions found in oats (Islam et al., 2011; Zhang et al., 2013) and maize (Kolarovič et al., 2009). Thus, this indicated that oat could also reduce the damage of drought stress by increasing the activity of oxidase to eliminate the excessive accumulation of free radicals.
Plant physiological activities and physiological functions are affected by drought stress. MDA and REC content are important indicators of cell plasma membrane permeability, which could be used to measure the degree of damage to the cell membrane structure (Giannopelitis and Ries, 1977; Sedaghat et al., 2017). MDA can increase antioxidant enzyme activities and antioxidant capacity, thereby eliminating reactive oxygen species and decreasing membrane lipid peroxidation damage (Esfandiari et al., 2007; Ge et al., 2014). In this study, the increase of REC in QH444 and DY2 was the smallest, and the MDA content in DY2 increased the least, indicating that the membrane stabilities of QH444 and DY2 were strong under drought stress. The MDA content of drought-tolerant varieties was lower than that of the drought-sensitive oat varieties, suggesting that drought-resistant oat varieties maintained stronger self-protection ability under drought stress. This is consistent with previous conclusions (Zhang et al., 2013), so it was inferred that MDA and REC are often negatively correlated with drought resistance (Tian et al., 2012). The greater the degree of increase in MDA and REC, the weaker the stability of the cell membrane.
The Chl fluorescence technique is used to screen tolerant varieties under abiotic stress. It provides valuable information about incomplete energy dissipation and changes in Fv/Fm (Ohashi et al., 2006; Oukarroum et al., 2007; Ristic et al., 2007; Jumrani et al., 2016). The Chl fluorescence parameter Fv/Fm reflects damage to the PSII center and is an appropriate index to evaluate the photoinhibition of plants under abiotic stress (Paknejad et al., 2007). Crop varieties that can maintain high Fv/Fm under drought conditions are considered to be stress-tolerant (Zlatev, 2009). Drought stress can damage chloroplasts and inhibit the synthesis of Chl, leading to a reduction in Chl and depressed photosynthesis (Fang and Xiong, 2015; Guo et al., 2018). The decrease of Chl concentration in plants may be a nonstomatal limiting factor, and Chl in plants with strong drought resistance is less affected by drought (Kraus et al., 1995). Studies on legumes, chickpeas, and wheat showed that drought stress decreased the content of Chl a and b (Mafakheri et al., 2010; Mathobo et al., 2017). The Chl content of drought-tolerant varieties was higher than that of drought-sensitive varieties (Khayatnezhad and Zaeifizadeh, 2011; Sharifi and Mohammad Khani, 2016). The Fv/Fm and Chl l were positively correlated with the plant’s sensitivity to drought (Maxwell and Johnson, 2000; Guo et al., 2016; Mo et al., 2016; Amor et al., 2018). Here, the Fv/Fm declined in all the tested materials. This was consistent with Dactylis under drought stress (Li et al., 2015). LX, TY2, and DY2 exhibited the smallest decreases in Fv/Fm, indicating that the three varieties possessed a strong tolerance to drought. Moreover, the Chl content of oat varieties decreased after drought stress, which may be the result of damage to chloroplasts and inhibition of Chl synthesis. Chl in plants with strong drought resistance is less affected by drought (Luo et al., 2018; Upadhyay et al., 2020). It was indicated that Fv/Fm and Chl content provide an important basis for drought resistance screening of different oat varieties.
Screening of Drought Resistance Indexes at the Seedling Stage
The drought tolerance coefficient (DC) is an index to measure drought effect based on the degree of decrease for each character under water stress compared with that under water adequacy. It can be used to identify drought tolerance varieties (Classen and Shaw, 1970; Fischer et al., 1989; Regan et al., 1993). Membership function value is a multi-index comprehensive evaluation method for determining the drought resistance of materials (Yan et al., 2009; Peng et al., 2013). Among the multivariate classification methods, principal component analysis is a commonly used sample classification method (Kim et al., 2013). Principal component analysis converts numerous related indicators into a new comprehensive index with less numbers and no correlation, based on retaining a large amount of the original information (Chen et al., 2014). It is difficult to associate drought resistance with specific physiological processes without using multivariate analysis. These methods enable many hypothetical drought tolerance traits to be sorted, depending on the degree of importance within crops, thus highlighting the traits that have a causal relationship with drought resistance. Yuan et al. (2019) screened the main drought resistance evaluation indexes using principal component analysis by measuring physiological indexes, such as osmotic adjustment substances and enzyme activities, considering that peroxidase activity and proline content were related to drought resistance ability of rice. Zeng et al. (2020) conducted gray correlation analysis on different physiological indicators of bermudagrass and screened for electrical conductivity, Chl content, and MDA content as the main drought resistance evaluation indicators. In our study, the DDI, RWC, Fv/Fm, and MDA content reflected the drought resistance of oat seedlings based on a principal component analysis and gray correlation analysis, which was similar to the results of Li et al. (2017). Therefore, it could be concluded that the photosynthetic characteristics (Fv/Fm), DDI, RWC, and membrane stability (MDA) could be used as the main evaluation indexes of oat seedlings under PEG drought stress. In the present study, 11 single indexes were transformed into three independent comprehensive indices using the principal component analysis. The first principal component mainly reflected information related to the water status, water-holding capacity, and membrane stability of the plant. Meanwhile, the second principal component mainly reflected the information related to protective enzymes, and the third principal component mainly reflects the information related to leaf photosynthetic physiology. Based on these three principal components, membership function analysis was carried out, and the comprehensive drought resistance value (D value) was also calculated. Finally, the three varieties with the strongest drought resistance were DY2, BY14, and LN. They can be used to select for more suitable varieties in regions that need crops with these characteristics. Additionally, a genotype that originated from Canada, LX, also had relatively strong drought resistance and thus could be used as a drought-resistant alternative cultivar among the introduced varieties. Principal component analysis and gray correlation analysis are simple and effective tools, which provided the possibility of early assessment of genotypic potential from the perspective of water stress tolerance. These methods could be used to evaluate plant responses to various environmental stresses in the early stage of development.
Conclusion
We found that oat demonstrated an effective adaptation mechanism by analyzing the drought resistance of enzymes, MDA, and osmotic regulators. Oat responded to drought stress by up-regulating antioxidant and osmotic regulation systems, thus enhancing their drought resistance. In addition, the DDI, RWC, Fv/Fm, and MDA content could be used as key attributes for evaluating drought resistance in oats. The varieties DY2 and BY14 were the most drought-resistant and could be used as candidate materials for breeding drought-resistant oats. These varieties can be effectively used as control parents in different cross breeding programs for the genetic improvement of oats for drought resistance.
Data Availability Statement
The original contributions presented in the study are included in the article/supplementary material, further inquiries can be directed to the corresponding author.
Author Contributions
HX and ML: data curation and project administration. HX, ML, and YC: formal analysis and writing – original draft. QZ and WL: funding acquisition. WL: investigation and software. GL and ZJ: methodology. HX, ML, GL, and ZJ: writing – review and editing. All authors contributed to the article and approved the submitted version.
Funding
This research was funded by the Key Laboratory of Superior Forage Cultivars in the Qinghai–Tibetan Plateau (2020-ZJ-Y03), the National Key Research and Development Program of China (2017YFC0504806), the Survey of Forage Resources in southern China (2017FY100602), and “The Fundamental Research Funds for the Central Universities,” Southwest Minzu University (2021PTJS30).
Conflict of Interest
The authors declare that the research was conducted in the absence of any commercial or financial relationships that could be construed as a potential conflict of interest.
Acknowledgments
We thank Hui Wang (Southwest Minzu University), ZJ (Qinghai Academy of Animal Science and Veterinary Medicine), and Xiang Ma (Qinghai Academy of Animal Science and Veterinary Medicine) for providing the materials used for the experiments.
References
Abraham, B., and Wayne, R. J. (1985). Breeding crop varieties for stress environments. Crit. Rev. Plant Sci. 2, 199–238. doi: 10.1080/07352688509382196
Amor, S., Elhem, M. M., Hatem, B. M., Thouraya, R., and Leila, R. (2018). A return to the genetic heritage of durum wheat to cope with drought heightened by climate change. PLoS One 13:e0196873. doi: 10.1371/journal.pone.0196873
Barrs, H. (1962). A Re-examination of the relative turgidity technique for estimating water deficits in leaves. Aust. J. Biol. Sci. 15, 413–428. doi: 10.1071/bi9620413
Celik, Ö, Ayan, A., and Atak, C. (2017). Enzymatic and non-enzymatic comparison of two different industrial tomato (Solanum lycopersicum) varieties against drought stress. Bot. Stud. 58:32. doi: 10.1186/s40529-017-0186-6jkl
Chakhchar, A., Wahbi, S., Lamaoui, M., Ferradous, A., Mousadik, E., Ibnsouda-Koraichi, S., et al. (2015). Physiological and biochemical traits of drought tolerance in Argania spinosa. J. Plant Interact. 10, 252–261.
Chen, X., Song, G. Y., Zhang, Z. W., and Wu, B. (2014). Identification and evaluation of drought resistance of naked oat (Avena nuda L.) under PEG 6000 stress at germination stage. J. Plant Genet. Resour. 15, 1188–1195. doi: 10.13430/j.cnki.jpgr.2014.06.004
Classen, M. M., and Shaw, R. H. (1970). Water deficit effects on corn: II. Grain Components Agron. J. 62, 652.
Deligoz, A., and Gur, M. (2015). Morphological, physiological and biochemical responses to drought stress of stone pine (Pinus pinea L.) seedlings. Acta Physiol. Plant. 37:243.
Dencic, S., Kastori, R., Kobiljski, B., and Duggan, B. (2000). Evaluation of grain yield and its components in wheat cultivates and landraces under near optimal and drought conditions. Euphytica 113, 43–52. doi: 10.1023/A:1003997700865
Esfandiari, E., Shekari, F., Shekari, F., and Esfandiari, M. (2007). The effect of salt stress on antioxidant enzymes activity and lipid peroxidation on the wheat seedling. Notulae Botanicae. Horti Agrobot. ClujNapoca 35, 48–56. doi: 10.15835/nbha351251
Fang, Y. J., and Xiong, L. Z. (2015). General mechanisms of drought response and their application in drought resistance improvement in plants. Cell. Mol. Life Sci. 72, 673–689. doi: 10.1007/s00018-014-1767-0
Farooq, M., Wahid, A., Kobayashi, N., Fujita, D., and Basra, S. M. A. (2009). Plant drought stress: effects, mechanisms and management. Agron. Sustain. Dev. 29, 185–212. doi: 10.1051/agro:2008021
Fischer, K. S., Edmeades, G. O., and Johnson, E. C. (1989). Selection for improvement in maize yield under moisture deficits. Field Crop Res. 22, 227–243. doi: 10.1016/0378-4290(89)90094-4
Ge, Y. J., He, X. Y., Wang, J. F., Jiang, B., Ye, R. H., and Lin, X. (2014). Physiological and biochemical responses of Phoebe bournei seedlings to water stress and recovery. Acta Physiol. Plant. 36, 1241–1250. doi: 10.1016/j.plaphy.2010.08.016
Giannopelitis, C. N., and Ries, S. K. (1977). Superoxide dismutase occurrence in higher plants. Plant Physiol. 59, 309–314. doi: 10.1104/pp.59.2.309
Gill, S. S., and Tuteja, N. (2010). Reactive oxygen species and antioxidant machinery in abiotic stress tolerance in crop plants. Plant Physiol. Biochem. 48, 909–930. doi: 10.1016/j.plaphy.2010.08.016
Gunes, A., Pilbeam, D. J., Inal, A., and Coban, S. (2008). Influence of silicon on sunflower cultivars under drought stress, I: growth, antioxidant mechanisms, and lipid peroxidation. Commun. Soil Sci. Plant Anal. 39, 1885–1903. doi: 10.1080/00103620802134651
Guo, C. J., Yi, Z., Sun, O. W., and Yang, Q. Q. (2018). Comprehensive evaluation and construction of drought resistance index system in Hydrangea macrophylla. J. Appl. Ecol. 29, 3175–3182. doi: 10.13287/j.1001-9332.201810.002
Guo, Y. Y., Yu, H. Y., Kong, D. S., Yan, F., and Zhang, Y. J. (2016). Effects of drought stress on growth and chlorophyll fluorescence of Lycium ruthenicum Murr. seedlings. Instit. Exp. Biol. Czech Acad. Sci. 54, 524–531. doi: 10.1007/s11099-016-0206-x
He, W., Fan, Y., Xu, Y. D., Wang, L., Qin, X. P., and Peng, Y. (2009). Screening identification indexes of drought resistance and comprehensive evaluation at seedling stage of red clover. J. Plant Genet. Resour. 10, 572–577.
Islam, M. R., Hu, Y. G., Mao, S. S., Jia, P. F., Eneji, A. E., and Xue, X. Z. (2011). Effects of water-saving superabsorbent polymer on antioxidant enzyme activities and lipid peroxidation in oat (Avena sativa L.) under drought stress. J. Sci. Food Agric. 91, 680–686. doi: 10.1002/jsfa.4234
Jin, J. Y., Zhang, W. H., and Yuan, L. (2015). Physiological responses of three forages to drought stress and evaluation of their drought resistance. Acta Prataculturae Sinica 24, 157–165. doi: 10.11686/cyxb2014505
Jumrani, K., Bhatia, V. S., and Pandey, G. P. (2016). Impact of elevated temperatures on specific leaf weight, stomatal density, photosynthesis and chlorophyll fluorescence in soybean. Photosynth. Res. 131, 333–350. doi: 10.1007/s11120-016-0326-y
Kabay, T., Erdinc, C., and Sensoy, S. (2017). Effects of drought stress on plant growth parameters, membrane damage index and nutrient content in common bean genotypes. J. Anim. Plant Sci. 27, 940–952.
Keshavarz, H., and Moghadam, R. S. G. (2017). Seed priming with cobalamin (vitamin B12) provides significant protection against salinity stress in the common bean. Rhizosphere 3, 143–149. doi: 10.1016/j.rhisph.2017.04.010
Keshavarz, H., Modarres, S. A. M., and Moghadam, R. S. G. (2016). Impact of foliar application with salicylic acid on biochemical characters of canola plants under cold stress condition. Not. Sci. Biol. 8, 98–105. doi: 10.15835/nsb819766
Khayatnezhad, M. M., and Zaeifizadeh, R. G. (2011). Effect of end-season drought stress on chlorophyll fluorescence and content of antioxidant enzyme superoxide dismutase enzyme (SOD) in susceptible and tolerant varieties of durum wheat. Afr. J. Agri. Res. 6, 6397–6406. doi: 10.5897/AJAR11.250
Kim, J. K., Park, S. Y., Lim, S. H., Eo, Y. Y., Cho, H. S., and Ha, S. H. (2013). Comparative metabolic profiling of pigmented rice (Oryza sativa L.) cultivars reveals primary metabolites are correlated with secondary metabolites. J. Cereal Sci. 57, 14–20. doi: 10.1016/j.jcs.2012.09.012
Kolarovič, L., Valentovič, P., Luxová, M., and Gašparíková, O. (2009). Changes in antioxidants and cell damage in heterotrophic maize seedlings differing in drought sensitivity after exposure to short-term osmotic stress. Plant Growth Regul. 59, 21–26. doi: 10.1007/s10725-009-9384-x
Kraus, T. E., Mckersie, B. D., and Fletcher, R. A. (1995). Paclobutrazole induced tolerance of wheat leaves to paraquat may involve antioxidant enzyme activity. J. Plant Physiol. 145, 570–576. doi: 10.1016/S0176-1617(11)81790-6
Levitt, J. (1982). Responses of Plants to Environmental Stresses. Volume II. Water, Radiation, Salt, and other Stresses. Responses of Plants to Environmental Stresses. New York, NY: Academic Press.
Li, S., Nie, Z. N., Chen, W., Jiang, Z. H., Chen, J. G., and Zhang, D. G. (2015). Effects of drought and salt stress on chlorophyll fluorescence kinetic parameters of Dactylis glomerate. Grassland Turf. 35, 23–27.
Li, X., Tian, X. H., and Du, W. H. (2017). Screening on the drought resistance index and conditions for×Triticale Wittmack at the seedling stage. Pratacultural Sci. 34, 539–546.
Lobell, D. B., Burke, M. B., Tebaldi, C., Mastrandrea, M. D., Falcon, W. P., and Naylor, R. L. (2008). Prioritizing climate change adaptation needs for food security in 2030. Science 319, 607–610. doi: 10.1126/science.1152339
Luo, X. Y., Li, Y. P., Chen, S. Y., Zhou, Q. P., Chen, Y. J., Tian, L. H., et al. (2018). Effects of drought stress on growth of oat seedlings. Southwest China J. Agric. Sci. 31, 1811–1816. doi: 10.16213/j.cnki.scjas.2018.9.008
Mafakheri, A. A., Siosemardeh, B., Bahramnejad, P. C., and Struik, Y. S. (2010). Effect of drought stress on yield, proline and chlorophyll contents in three chickpea cultivars. Aust. J. Sci. 4, 580–585. doi: 10.1007/s12230-010-9149-0
Manivannan, P., Jaleel, C. A., Kishorekumar, A., Sankar, B., Somasundaram, R., Sridharan, R., et al. (2007). Changes in antioxidant metabolism of Vigna unguiculata (L.) Walp. by propiconazole under water deficit stress. Colloids Surf. B: Biointerfaces 57, 69–74. doi: 10.1016/j.colsurfb.2007.01.004
Maqbool, M. A., Aslam, M., and Ali, H. (2017). Breeding for improved drought tolerance in chickpea (Cicer arietinum L.). Plant Breed. 136:300. doi: 10.1111/pbr.12477
Mathobo, R., Marais, D., and Steyn, J. M. (2017). The effect of drought stress on yield, leaf gaseous exchange and chlorophyll fluorescence of dry beans (Phaseolus vulgaris L.). Agric. Water Manage. 180, 118–125. doi: 10.1016/j.agwat.2016.11.005
Maxwell, K., and Johnson, G. N. (2000). Chlorophyll fluorescence—a practical guide. J. Exp. Bot. 51, 659–668. doi: 10.1093/jexbot/51.345.659
Meng, L. H., Yang, J., Guo, W., Tian, B., Chen, G. J., Yang, Y. P., et al. (2017). Differentiation in drought tolerance mirrors the geographic distributions of alpine plants on the Qinghai-Tibet Plateau and adjacent highlands. Sci. Rep. 7:42466. doi: 10.1038/srep42466
Mo, Y. L., Yang, R. P., Liu, L. H., Gu, X. R., Yang, X. Z., Wang, Y. Q., et al. (2016). Growth, photosynthesis and adaptive responses of wild and domesticated watermelon varieties to drought stress and subsequent re-watering. Plant Growth Regul. 79, 229–241. doi: 10.1007/s10725-015-0128-9
Morgan, J. M. (1984). Osmoregulation and water stress in higher plants. Annu. Rev. Plant Physiol 35, 299–319.
Mukherjee, S. P., and Choudhuri, M. A. (1983). Implications of water stress-induced changes in the levels of endogenous ascorbic acid and hydrogen peroxide in Vigna seedlings. Physiol Plant. 58, 166–170. doi: 10.1111/j.1399-3054
Nan, M., Zhao, G. Q., Li, J., and Cai, J. K. (2018). Correlation analysis and synthesize evaluation of yield and quality introduced oat varieties in the semi-arid of Northwest. Acta Agrestia Sinica 26, 125–133. doi: 10.11733/j.issn.1007-0435.2018.01.015
Ohashi, Y., Nakayama, N., Saneoka, H., and Fujita, K. (2006). Effects of drought stress on photosynthetic gas exchange, chlorophyll fluorescence and stem diameter of soybean plants. Biol. Plant. 50, 138–141. doi: 10.1007/s10535-005-0089-3
Oukarroum, A., Madidi, S. E., Schansker, G., and Strasser, R. J. (2007). Probing the responses of barley cultivars (Hordeum vulgare L.) by chlorophyll a fluorescence OLKJIP under drought stress and rewatering. Environ. Exp. Bot. 60, 438–446. doi: 10.1016/j.envexpbot.2007.01.002
Paknejad, F., Majidi Heravan, E., Nourmohammadi, G. H., Siyadat, A., and Vazan, S. (2007). Effects of drought stress on filling the grain of wheat cultivar. Iran J. Agric. Sci. 1, 138–148.
Pan, X., Qiu, Q., Li, J. Y., Wang, J. H., He, Q., Su, Y., et al. (2014). Physiological indexes of six plant species from the Tibetan plateau under drought stress. Acta Ecol. Sinica 34, 3558–3567. doi: 10.5846/stxb201306031288
Pan, Y., Wu, L. J., and Yu, Z. L. (2006). Effect of salt and drought stress on antioxidant enzymes activities and SOD isoenzymes of liquorice (Glycyrrhiza uralensis Fisch). Plant Growth Regul. 49, 157–165. doi: 10.1007/s10725-006-9101-y
Parry, M. L., Canziani, O. F., Palutikof, J. P., Linden, P. J., Hanson, C. E., Parry, M. L., et al. (2007). Climate change 2007: impacts, adaptation and vulnerability. contribution of working group II to the fourth assessment report of the intergovernmental panel on climate change. Summary for Policymakers. Tidee 19, 81–111. doi: 10.9774/GLEAF.978-1-907643-29-3_4
Passioura, J. B. (1998). Drought and drought tolerance. drought tolerance in higher plants: genetical, physiological and molecular biological analysis. Phytochemistry 47, 1175–1176. doi: 10.1007/978-94-017-1299-6
Peng, Y., Shi, G., and Cui, H. (2013). Evaluation of drought resistant of different processing tomato at seed germination stage under PEG-6000 stress. Seed 32, 44–49.
Regan, B. P., Cress, W. A., and Staden, J. V. (1993). Root growth, water relations, abscisic acid and proline level of drought resistant and drought sensitive maize cultivars in response to water stress. S. Afr. Bot. 59, 98–104. doi: 10.1016/S0254-6299(16)30780-3
Ristic, Z., Bukovnik, U., and Prasad, P. V. V. (2007). Correlation between heat stability of thylakoid membranes and loss of chlorophyll in winter wheat under heat stress. Crop Sci. 47, 2067–2073. doi: 10.2135/cropsci2006.10.0674
Sayfzadeh, S., Habibi, D., Taleghani, D. F., Kashani, A., Vazan, S., Qaen, S. H. S., et al. (2011). Response of antioxidant enzyme activities and root yield in sugar beet to drought stress. Int. J. Agric. Biol. 13, 357–362.
Sedaghat, M. S., Sarvestani, Z. T., Emam, Y., and Bidgoli, A. M. (2017). Physiological and antioxidant responses of winter wheat cultivars to strigolactone and salicylic acid in drought. Plant Physiol. Biochem. 119, 59–69. doi: 10.1016/j.plaphy.2017.08.015
Seyed Ebrahimi, F. S., Kumleh, H., Alami, A., and Rezadoost, M. H. (2016). Effect of drought stress on morphological traits and antioxidant enzymatic activity in two canola varieties. J. Plant Proc. Func. 4, 77–91.
Sharifi, P., and Mohammad Khani, N. (2016). Effects of drought stress on photosynthesis factors in wheat varieties during anthesis. Cereal Res. Commun. 44, 229–239. doi: 10.1556/0806.43.2015.054
Singh, R., De, S., and Belkheir, A. (2013). Avena sativa (Oat), a potential neutraceutical and therapeutic agent: an overview. Crit. Rev. Food Sci. Nutr. 53, 126–144. doi: 10.1080/10408398.2010.526725
Sinhababu, A., and Kar, R. K. (2003). Comparative responses of three fuel wood yielding plants to PEG-induced water stress at seedling stage. Acta Physiol. Plant. 25, 403–409. doi: 10.1007/s11738-003-0022-3
Stevens, E. J., Armstrong, K. W., Bezar, H. J., Griffin, W. B., and Hampton, J. G. (2004). “Fodder oats an overview,” in Fodder Oats: a World Overview, eds J. M. Suttie and S. G. Reynolds, (Rome: Food and Agriculture Organization of the United Nations).
Talebi, R., Ensafi, M. H., Baghebani, N., Karami, E., and Mohammadi, K. (2013). Physiological responses of chickpea (Cicer arietinum L.) varieties to drought stress. Environ. Exper. Biol. 11, 9–15.
Tian, Z. G., Wang, F., Zhang, W. N., Liu, C. M., and Zhao, X. M. (2012). Antioxidant mechanism and lipid peroxidation patterns in leaves and petals of marigold in response to drought stress. Korean Soc. Hortic. Sci. 53, 183–192. doi: 10.1007/s13580-012-0069-4
Tuberosa, R., and Salvi, S. (2006). Genomics based approaches to improve drought tolerance of crops. Trends Plant Sci. 11, 405–412. doi: 10.1016/j.tplants.2006.06.003
Upadhyay, D., Budhlakoti, N., Singh, A. K., Bansal, R., Kumari, J., Chaudhary, N., et al. (2020). Drought tolerance in Triticum aestivum L. varieties associated with enhanced antioxidative protection and declined lipid peroxidation. 3 Biotech. 10:281. doi: 10.1007/s13205-020-02264-8
Wang, C., Xie, H. M., Wang, N., and Wang, H. L. (2011). Study on the relation of soluble sugar, protective enzyme and drought resistance in wheat. Agric. Res. Arid Areas 29, 94–999.
Wang, S. R., Guo, L. L., He, B., Lyu, Y. L., and Li, T. W. (2020). The stability of Qinghai-Tibet Plateau ecosystem to climate change. Phys. Chem. Earth A B C 115:102827.
Wang, X. L., Shang, Q. M., Wang, P., Wang, H., Huang, T., and Li, H. H. (2016). Effect of exogenous salicylic acid treatment on regulation of carbohydrate metabolism in Cucumis sativus seedlings leaves. Southwest China J. of Agric. Sci. 29, 792–799.
Weng, M. Y., Cui, L. R., Liu, F. L., Zhang, M., and Deng, X. (2015). Effects of drought stress on antioxidant enzymes in seedlings of different wheat varieties. Pakistan J. Bot. 47, 49–56.
Xiao, X., Xu, X., and Yang, F. (2008). Adaptive responses to progressive drought stress in two Populus cathayana populations. Silva Fennica 42, 705–719. doi: 10.1017/CBO9780511754920.022
Xu, C. L. (2012). A study on growth characteristics of different cultivars of oat (Avena sativa) in alpine region. Acta Pratacultural Sci. 21, 280–285. doi: 10.11686/cyxb20120236
Yan, M., Huang, W., Hu, J., Lv, Z., Lei, S., and Huang, C. (2009). Evaluation of rice drought resistance by subordinate function. Hybrid Rice 24, 76–79.
Yuan, J., Wang, F. b., Jia, C. P., Zhao, Z. Q., Zhang, Y. H., and Wen, X. R. (2019). Response to PEG stress and drought resistance evaluation of japonica rice at seedling stage in xinjiang. Mol. Plant Breed. 17, 6088–6096.
Yang, H. X., Mao, P. C., Meng, L., Hu, T. M., and Gao, H. W. (2011). Assessment of drought resistance for 19 germplasm and materials of Arrhenatherum elatius at the seedling stage. Agric. Res. Arid Area 29, 6–14.
Yang, Y., Li, X., Kong, X., Ma, L., Hu, X., and Yang, Y. (2015). Transcriptome analysis reveals diversified adaptation of Stipa purpurea along a drought gradient on the Tibetan Plateau. Funct. Integr. Genomics 15, 295–307. doi: 10.1007/s10142-014-0419-7
Zegaoui, Z., Planchais, S., Cabassa, C., Djebbar, R., Belbachir, O. A., and Carol, P. (2017). Variation in relative water content, proline accumulation and stress gene expression in two cowpea landraces under drought. J. Plant Physiol. 218, 26–34. doi: 10.1016/j.jplph.2017.07.009
Zeng, L. S., Li, P. Y., Sun, X. F., and Sun, Z. J. (2020). A multi-trait evaluation of drought resistance of bermudagrass (cynodondactylon) cultivars from different habitats in Xinjiang province. Acta Prataculturae Sinica 29, 155–169.
Zhang, B. (2018). Effect of Drought Stress at Booting Stage on Nitrogen Metabolism of Japonica Rice in Cold-Region and Differences Among Varieties, Ph.D thesis. Harbin: Heilongjiang Northeast Agricultural University.
Zhang, J., Guo, G., Chen, L., Li, J. F., Yuan, X. J., Yu, C. Q., et al. (2015). Effect of applying lactic acid bacteria and propionic acid on fermentation quality and aerobic stability of oats-common vetch mixed silage on the Tibetan plateau. Anim. Sci. J. 86, 595–602. doi: 10.1111/asj.12340
Zhang, N., Zhao, B. P., Zhang, Y. L., Ren, P., Liu, J. H., and Wang, Y. (2013). Comparative experiment on drought-resistant characteristics of different oat cultivars. Agric. Res. Arid Areas 31, 166–171+218. doi: 10.3969/j.issn.1000-7601
Zhang, X. Q., Liu, J. H., Qi, B. J., and Guo, X. X. (2010). Cluster diversity analysis of the main agronomic traits in oat cultivars. J. Plant Genet. Resources 11, 168–174. doi: 10.1007/978-3-642-12220-0-13
Zhang, Y. J., Zhao, L. L., Chen, C., Wang, P. C., and Li, J. W. (2017). Physiological response of oat seedlings to PEG stress at germination stage. Northern Hortic. 21, 24–30.
Zhao, X. X., Huang, L. K., Zhang, X. Q., Li, Z., and Peng, Y. (2014). Effects of heat acclimation on photosynthesis, antioxidant enzyme activities, and gene expression in orchardgrass under heat stress. Molecules 19, 13564–13576. doi: 10.3390/molecules190913564
Zheng, M. N., Li, X. l, Wan, L. Q., He, F., Xi, C. l, and Chen, R. X. (2009). Physiological responses of four warm season grasses to water stress. Chin. Agric. Bull. 25, 114–119.
Zhou, Q. P., Gou, X. L., Tian, L. H., Chen, Y. J., Gao, S. Q., Bai, W. M., et al. (2018). Performances of early and late maturing oat varieties in cold regions. Chin. Sci. Bull. 63, 1722–1730.
Zhu, J. (2016). Abiotic stress signaling and responses in plants. Cell 167, 313–324. doi: 10.1016/j.cell.2016.08.029
Zhu, Y. Q., Peng, D. D., Peng, Y., Zhang, X. Q., Chen, S. Y., and Xu, W. Z. (2019). Physiological response and comparison of Sorghum sudanense and S. bicolor × S. sudanense seedlings under drought stress. Pratacultural Sci. 36, 1361–1370.
Keywords: oat, drought tolerant, physiological index, comprehensive evaluation, Qinghai-Tibetan Plateau
Citation: Xie H, Li M, Chen Y, Zhou Q, Liu W, Liang G and Jia Z (2021) Important Physiological Changes Due to Drought Stress on Oat. Front. Ecol. Evol. 9:644726. doi: 10.3389/fevo.2021.644726
Received: 21 December 2020; Accepted: 15 April 2021;
Published: 28 May 2021.
Edited by:
Jianshuang Wu, Chinese Academy of Agricultural Sciences, ChinaReviewed by:
Zhaojun Liu, Technical University of Munich, GermanyAhmed Sallam, Assiut University, Egypt
Copyright © 2021 Xie, Li, Chen, Zhou, Liu, Liang and Jia. This is an open-access article distributed under the terms of the Creative Commons Attribution License (CC BY). The use, distribution or reproduction in other forums is permitted, provided the original author(s) and the copyright owner(s) are credited and that the original publication in this journal is cited, in accordance with accepted academic practice. No use, distribution or reproduction is permitted which does not comply with these terms.
*Correspondence: Qingping Zhou, cXBpbmd6aEBhbGl5dW4uY29t; Wenhui Liu, cWhsaXV3ZW5odWlAMTYzLmNvbQ==