 Bismay Ranjan Tripathy1
 Xuehua Liu1*
 Melissa Songer2
 Lalit Kumar3
 Senipandi Kaliraj4
 Nilanjana Das Chatterjee5W. M. S. Wickramasinghe1Kirti Kumar Mahanta6
- 1State Key Joint Laboratory of Environmental Simulation and Pollution Control, School of Environment, Tsinghua University, Beijing, China
- 2Conservation Ecology Center, Smithsonian Conservation Biology Institute and National Zoo, Front Royal, VA, United States
- 3School of Environmental and Rural Science, University of New England, Armidale, NSW, Australia
- 4Central Geomatics Laboratory, National Centre for Earth Science Studies, Akkulam, India
- 5Department of Geography and Environment Management, Vidyasagar University, Midnapore, India
- 6Punjab Remote Sensing Centre, Ludhiana, India
Escalation of human-elephant conflict (HEC) in India threatens its Asian elephant (Elephas maximus) population and victimizes local communities. India supports 60% of the total Asian elephant population in the world. Understanding HEC spatial patterns will ensure targeted mitigation efforts and efficient resource allocation to high-risk regions. This study deals with the spatial aspects of HEC in Keonjhar forest division, where 345 people were killed and 5,145 hectares of croplands were destroyed by elephant attacks during 2001–2018. We classified the data into three temporal phases (HEC1: 2001–2006, HEC2: 2007–2012, and HEC3: 2013–2018), in order to (1) derive spatial patterns of HEC; (2) identify the hotspots of HEC and its different types along with the number of people living in the high-risk zones; and (3) assess the temporal change in the spatial risk of HEC. Significantly dense clusters of HEC were identified in Keonjhar and Ghatgaon forest ranges throughout the 18 years, whereas Champua forest range became a prominent hotspot since HEC2. The number of people under HEC risk escalated from 14,724 during HEC1 and 34,288 in HEC2, to 65,444 people during HEC3. Crop damage was the most frequent form of HEC in the study area followed by house damage and loss of human lives. Risk mapping of HEC types and high priority regions that are vulnerable to HEC, provides a contextual background for researchers, policy makers and managers.
Introduction
Rapid human population growth and over-exploitation of wildlife resources has degraded suitable habitats and threatened the survival of many wildlife species (Tischendorf and Fahrig, 2000; Fahrig, 2003; Rushton et al., 2006). The imbalance between economic development and wildlife conservation is not only causing economic loss but also impacting the day to day lives and personal safety of people (Jadhav and Barua, 2012; Li et al., 2018). Ultimately, this leads to frequent and severe conflicts between humans and wildlife in areas where they interface and where wild animals have easy access to concentrated and reliable food sources (Baruch-Mordo et al., 2008).
Indian Elephants (Elephas maximus indicus), a subspecies of Asian elephants (Elephas maximus) is a prime example of a species known for the highest wildlife damage in India, causing extensive damages to property and loss of human lives. Nearly 2,381 people and 490 elephants have died in India from 2015 to 2018 (MoEF and CC, 2018) and between 2000 and 2010, 0.5 million households have suffered annual losses due to crop raiding by elephants (MoEF, 2010, 2012). The Indian government has paid compensations of around US$ 19.2 million for damage to crops and property and US$ 5 million for human lives lost due to HEC from 2014 to 2018 (MoEF and CC, 2018). While 60% of the world’s elephant population is found in India, only 30% of these elephants survive within large contiguous forests (Naha et al., 2019; Sengupta et al., 2020). The rest depend on small forest ranges under constant pressure from human encroachment. Due to threats such as habitat degradation, human–elephant conflict (HEC), and poaching (Leimgruber et al., 2003; Hedges et al., 2005; Sukumar et al., 2016; Menon et al., 2017), Asian elephants are vested with the highest degree of Wildlife Protection under the Schedule-1 in India. Ongoing conservation efforts are directed toward protecting elephants, but HEC is a serious drawback in finding a tradeoff between anthropocentric development and protection of elephants (Sampson et al., 2019). Thus, effective mitigation of HEC is a top conservation priority for this keystone species, not only in India (Karanth et al., 2012), but also in the world (Chen et al., 2016).
Despite years of research and financial investments on mitigation, we are still lacking knowledge on the fundamentals of HEC (Dickman, 2010; Karanth et al., 2012). This data deficiency is a significant problem affecting the sustainability of HEC mitigation projects. Spatial analysis of HEC patterns is essential for understanding the underlying processes of conflict, and to develop mitigation management plans which prioritize high-risk regions. In general, there is a certain notable relationship between the spatial phenomenon of HEC and the geography of that area. Exploring these significant relationship patterns will not only provide insights about the geographic dispersal of HEC and the underlying drivers, but also allow various stakeholders to detect regions and populations under high risk of HEC, regardless of the area of extent (Huang et al., 2008; Jackson et al., 2009). This study integrated statistical and spatial analyses into human-elephant conflict research for an exploratory pattern analysis and locating the high-risk zones of HEC.
Socio-economic factors such as trust in administration, awareness and education, economic status and religion build communities’ tolerance toward elephants while promoting co-existence (Dickman, 2010; Redpath et al., 2015; Nyhus, 2016; Saif et al., 2019). Nevertheless, the competition for limited resources between humans and elephants co-habiting an overlapped landscape remains a leading cause of HEC (Morzillo et al., 2014; Shaffer et al., 2019). In spite of that, very few studies have explored the concepts of spatial distribution of HEC (Sitati et al., 2003; Morzillo et al., 2014; Chen et al., 2016; Kitratporn and Takeuchi, 2020), patterns of crop-raiding and prediction of HEC hotspots (Gubbi, 2012; Acharya et al., 2016; Chen et al., 2016; Naha et al., 2019) except for some studies on compensation distribution patterns (Karanth et al., 2012; Karanth et al., 2013; Sengupta et al., 2020).
Our study is based in the Keonjhar forest division of Odisha province, in eastern India. As per a state government report, Odisha has the highest HEC in India and loses more elephants than other more elephant-bearing provinces. Odisha also recorded the highest number of human deaths due to HEC in 2017–2018, while it only harbors 1,976 elephants, which is less than Assam (∼5,700) and Karnataka (∼6,000) provinces (MoEF and CC, 2018). Keonjhar forest division has evidenced a sharp fall in the elephant population from 112 elephants in 2002 to only 40 elephants in 2017. Such decline in the elephant population is not a consequence of poaching, which is a rare occurrence in the Keonjhar forest division, but as a result of a devastated and fragmented landscape, which has forced elephants to leave their native home range and scatter out into other regions (MoEF and CC, 2017). From 1989 to 2016, 13.7% of the total forest cover in Keonjhar forest division had been lost, mainly due to mining, agriculture and developed areas (Patra and Sethy, 2014; Tripathi et al., 2019). This has led to an escalation of HEC, that took 198 human lives (between 2000 and 2018) and destroyed 20,800 hectares of crop land (during 2005 and 2018). Many researchers who have discussed the issue of HEC in this region have done it from a very human-centric perspective and they have recommended some extremely restrictive measures that disregard the right to natural existence of elephants (Vihar et al., 2012; Thakur et al., 2016; Mohanty and Mishra, 2017).
This study spatially analyzed the distribution of HEC which would facilitate stakeholders to identify high-priority villages for conflict intervention. Thereby, we encouraged mitigation efforts to be focused toward these vulnerable regions and provided suggestions to improve the current mitigation approaches, and to maximize their impacts in a cost-effective manner. Our study aims to: (1) identify significant spatial patterns of HEC distribution, (2) evaluate the number of people under threat of HEC in the clusters using spatial scan statistics, (3) map the hotspots of HEC as well as its different types, and (4) assess the temporal changes in the spatial risk of HEC over the study period.
Materials and Methods
Study Area
Human-elephant conflict incidences that occurred in the forest ranges of Keonjhar forest division, East India (Figure 1), were the primary data source for this study. The study area is located between latitudes 21°1′ N–22° 10′ N and 85°11′ E–86°22′ E and covers an area of approximately 6,038 km2. The study area is the mining hub of Odisha province, where minerals like Manganese (Mn), Iron (Fe), and Chromite (Cr) are generally found within forest areas. Nearly 30% of the land is covered by dense forest which mostly include Northern tropical deciduous trees such as, Sal tree (Shorea robusta), Asan (Terminalia elliptica), Jamu (Syzygium cumini), Mahua (Madhuca longifolia), Mango (Mangifera indica), and Kendu (Diospyros melanoxylon). Keonjhar forest division has patchy forests which support 50–60 elephants and act as their movement paths to neighboring states. The study area has around 1,600 villages with a total human population of 1,801,733 people (Census, 2011). About 80% of its residents are classified as rural of which 35% depend on agriculture.
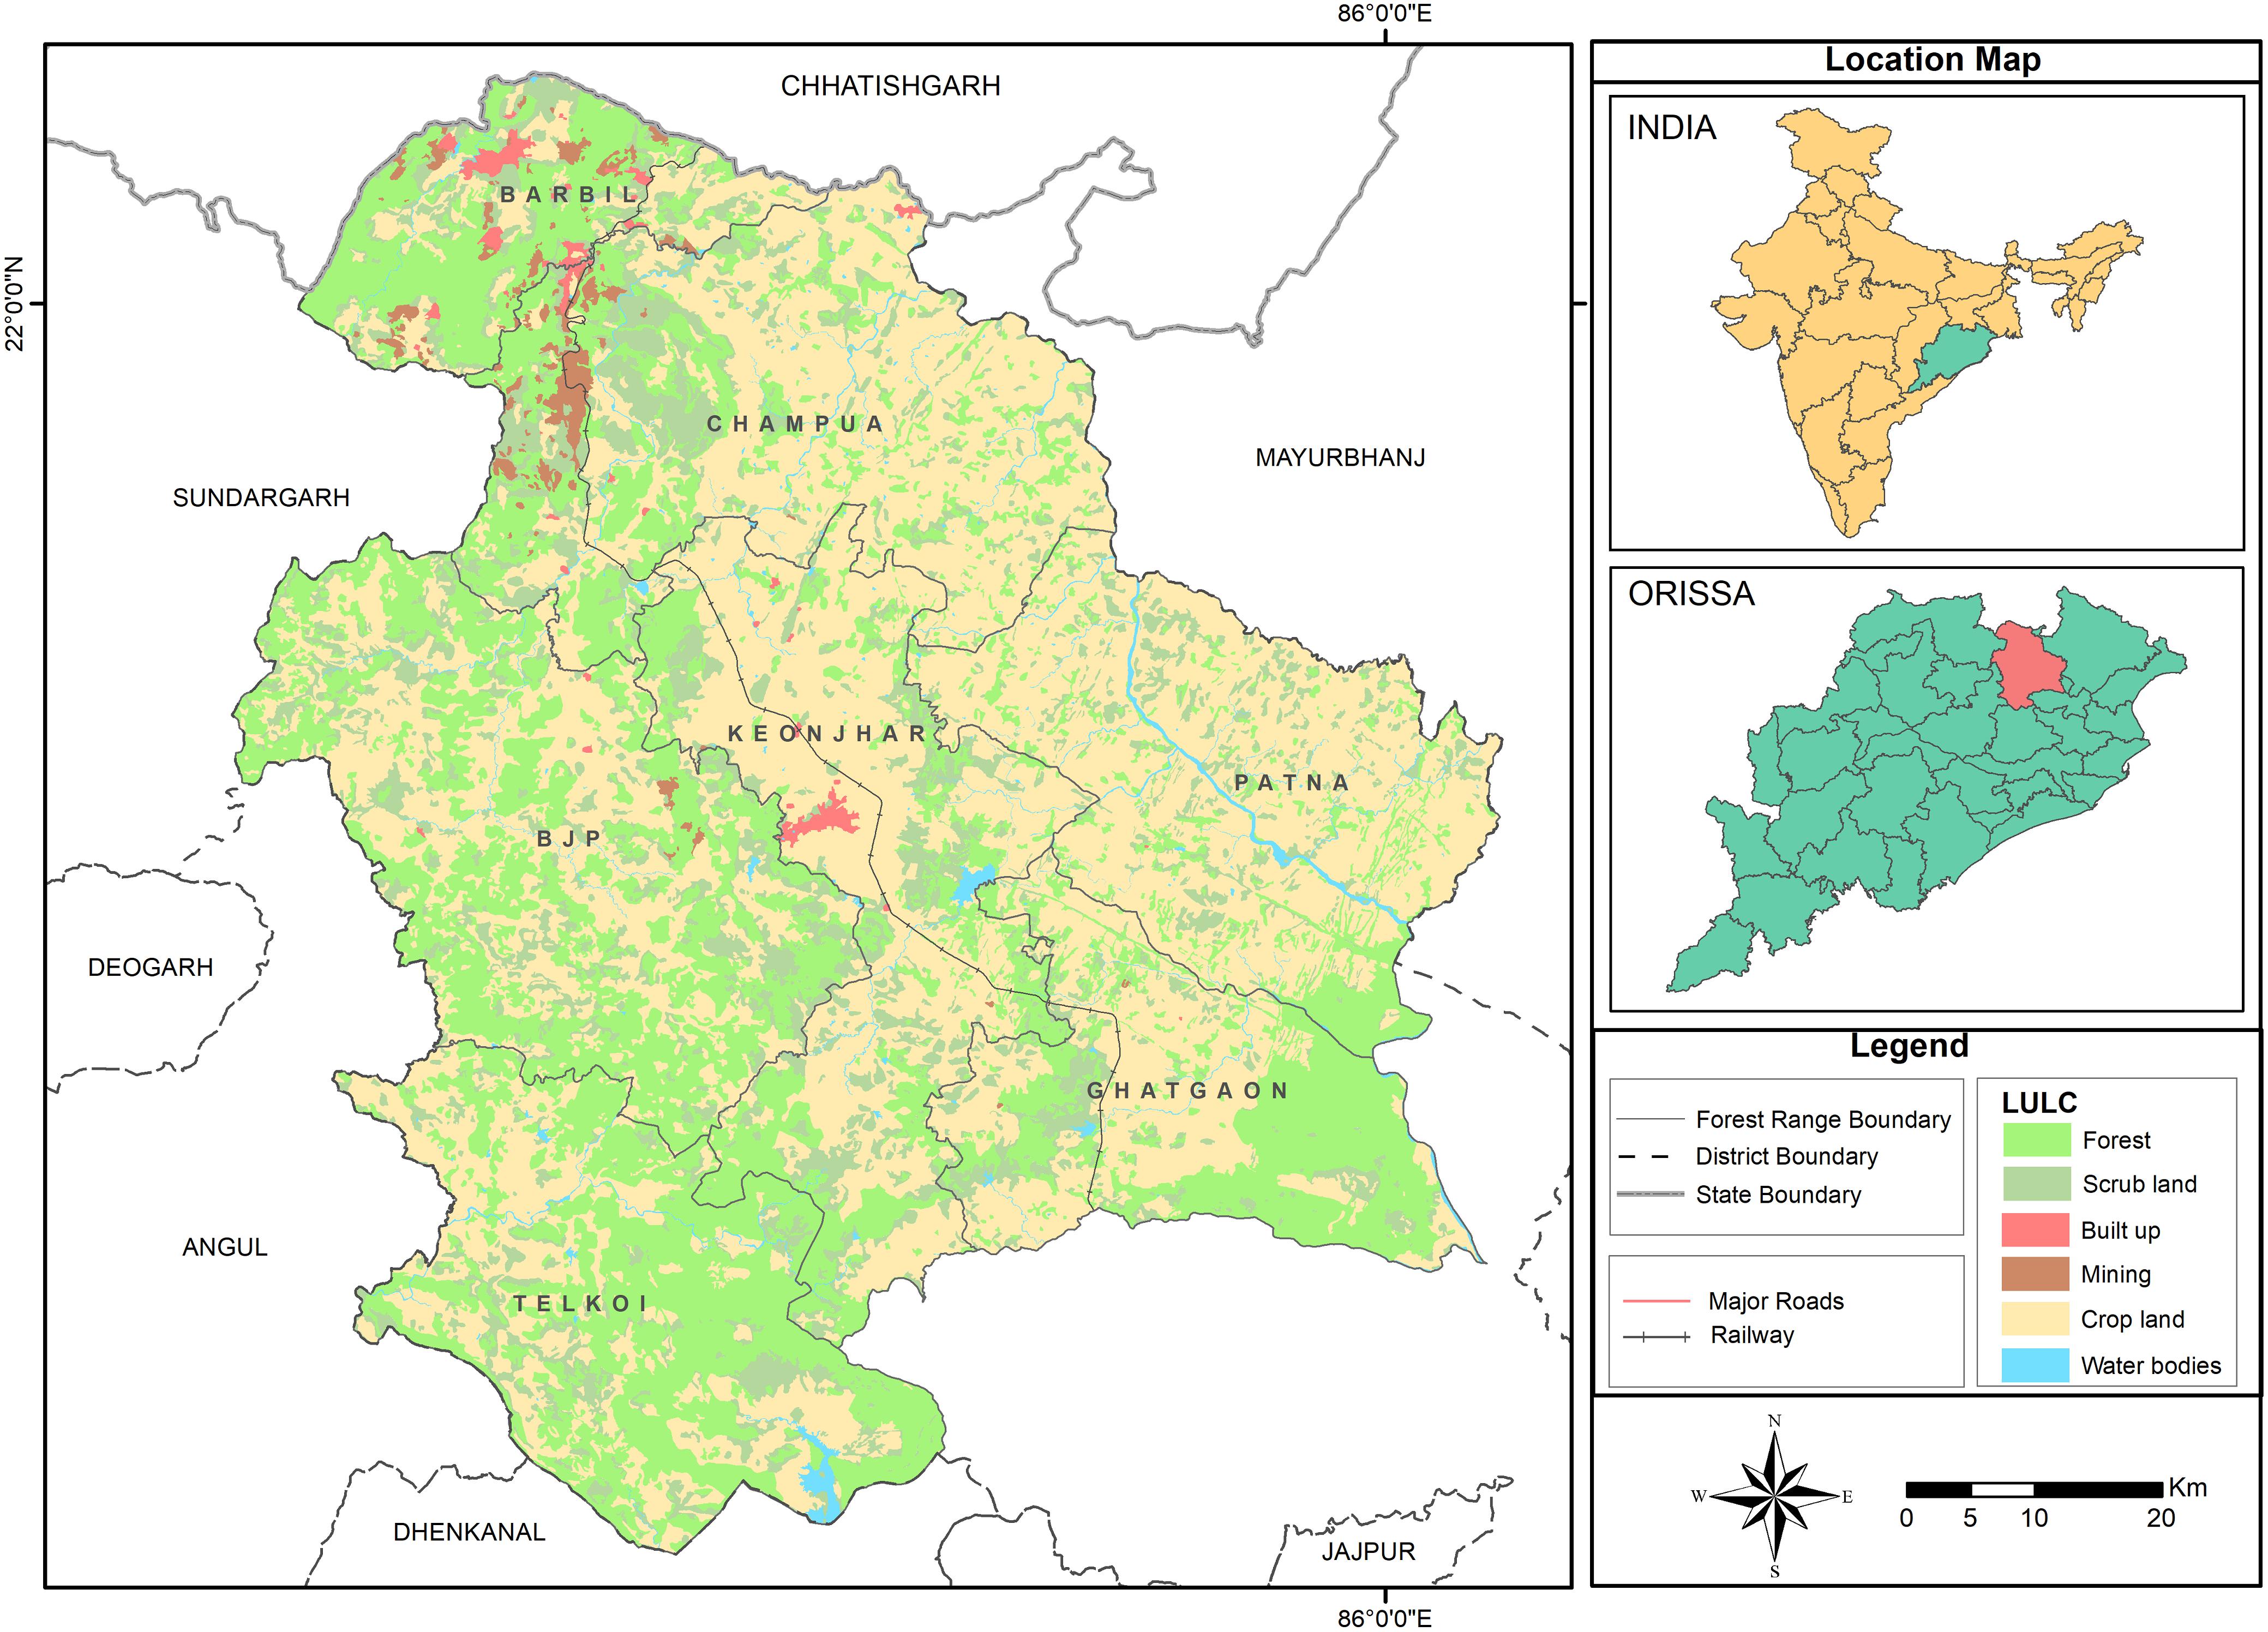
Figure 1. Map showing the land cover and land use of the study area comprising forests, scrub land, built up areas, mining, crop land, water bodies and transportation networks. Keonjhar District has seven-forest ranges: (1) Barbil, (2) Bhui yan-Juang Pihra (BJP), (3) Champua, (4) Ghatgaon, (5) Keonjhar, (6) Patna, and (7) Telkoi. Source: Keonjhar Forest Division.
The study area experiences three main seasons; summer, rainy season and winter. The temperature fluctuates depending on the season, with the average temperature during summer being 33–36°C and during winter it is 14–17°C. Rainfall is also highly variable with a mean annual rainfall of around 1,535 mm.
Data Collection and Generation of Spatial Data
We gathered data from all possible sources such as the damage compensation records of the Keonjhar Forest Division, published literature and reports from Indian Ministry of Environment, Forest and Climate Change (MoEF & CC). According to the Wildlife Protection Amendment Rules (2002) (Odisha), compensation shall be paid to the victims for the damages caused by wild animals, after a certain level of verification by the forest and police departments. The scheme encourages the public to voluntarily report losses suffered from wildlife. We collected HEC data recorded by victims from 2001 to 2018, which contains information about the victim’s details, village name, date of event, damage caused by elephants to people, property and crops, and the amount compensated according to the loss. The HEC incidences were grouped into three temporal phases such as HEC1 (2001–2006), HEC2 (2007–2012) and HEC3 (2013–2018) for analyzing the trend of HEC pattern over different phases of time in our study area. Although there was no spatial information in the collected data sets, we geocoded the incidents by assigning the centroid coordinate of the village where the incident had happened and prepared a geodatabase for further spatial analysis.
Descriptive Spatial Analysis
The descriptive spatial analysis of HEC incidences was carried out in three steps: (1) pattern detection of HEC distribution by measuring the spatial homogeneity using distance-based Ripley’s K-function; (2) neighborhood analysis and investigation of the HEC clusters and; (3) hotspot detection using spatial autocorrelation statistics (Figure 2).
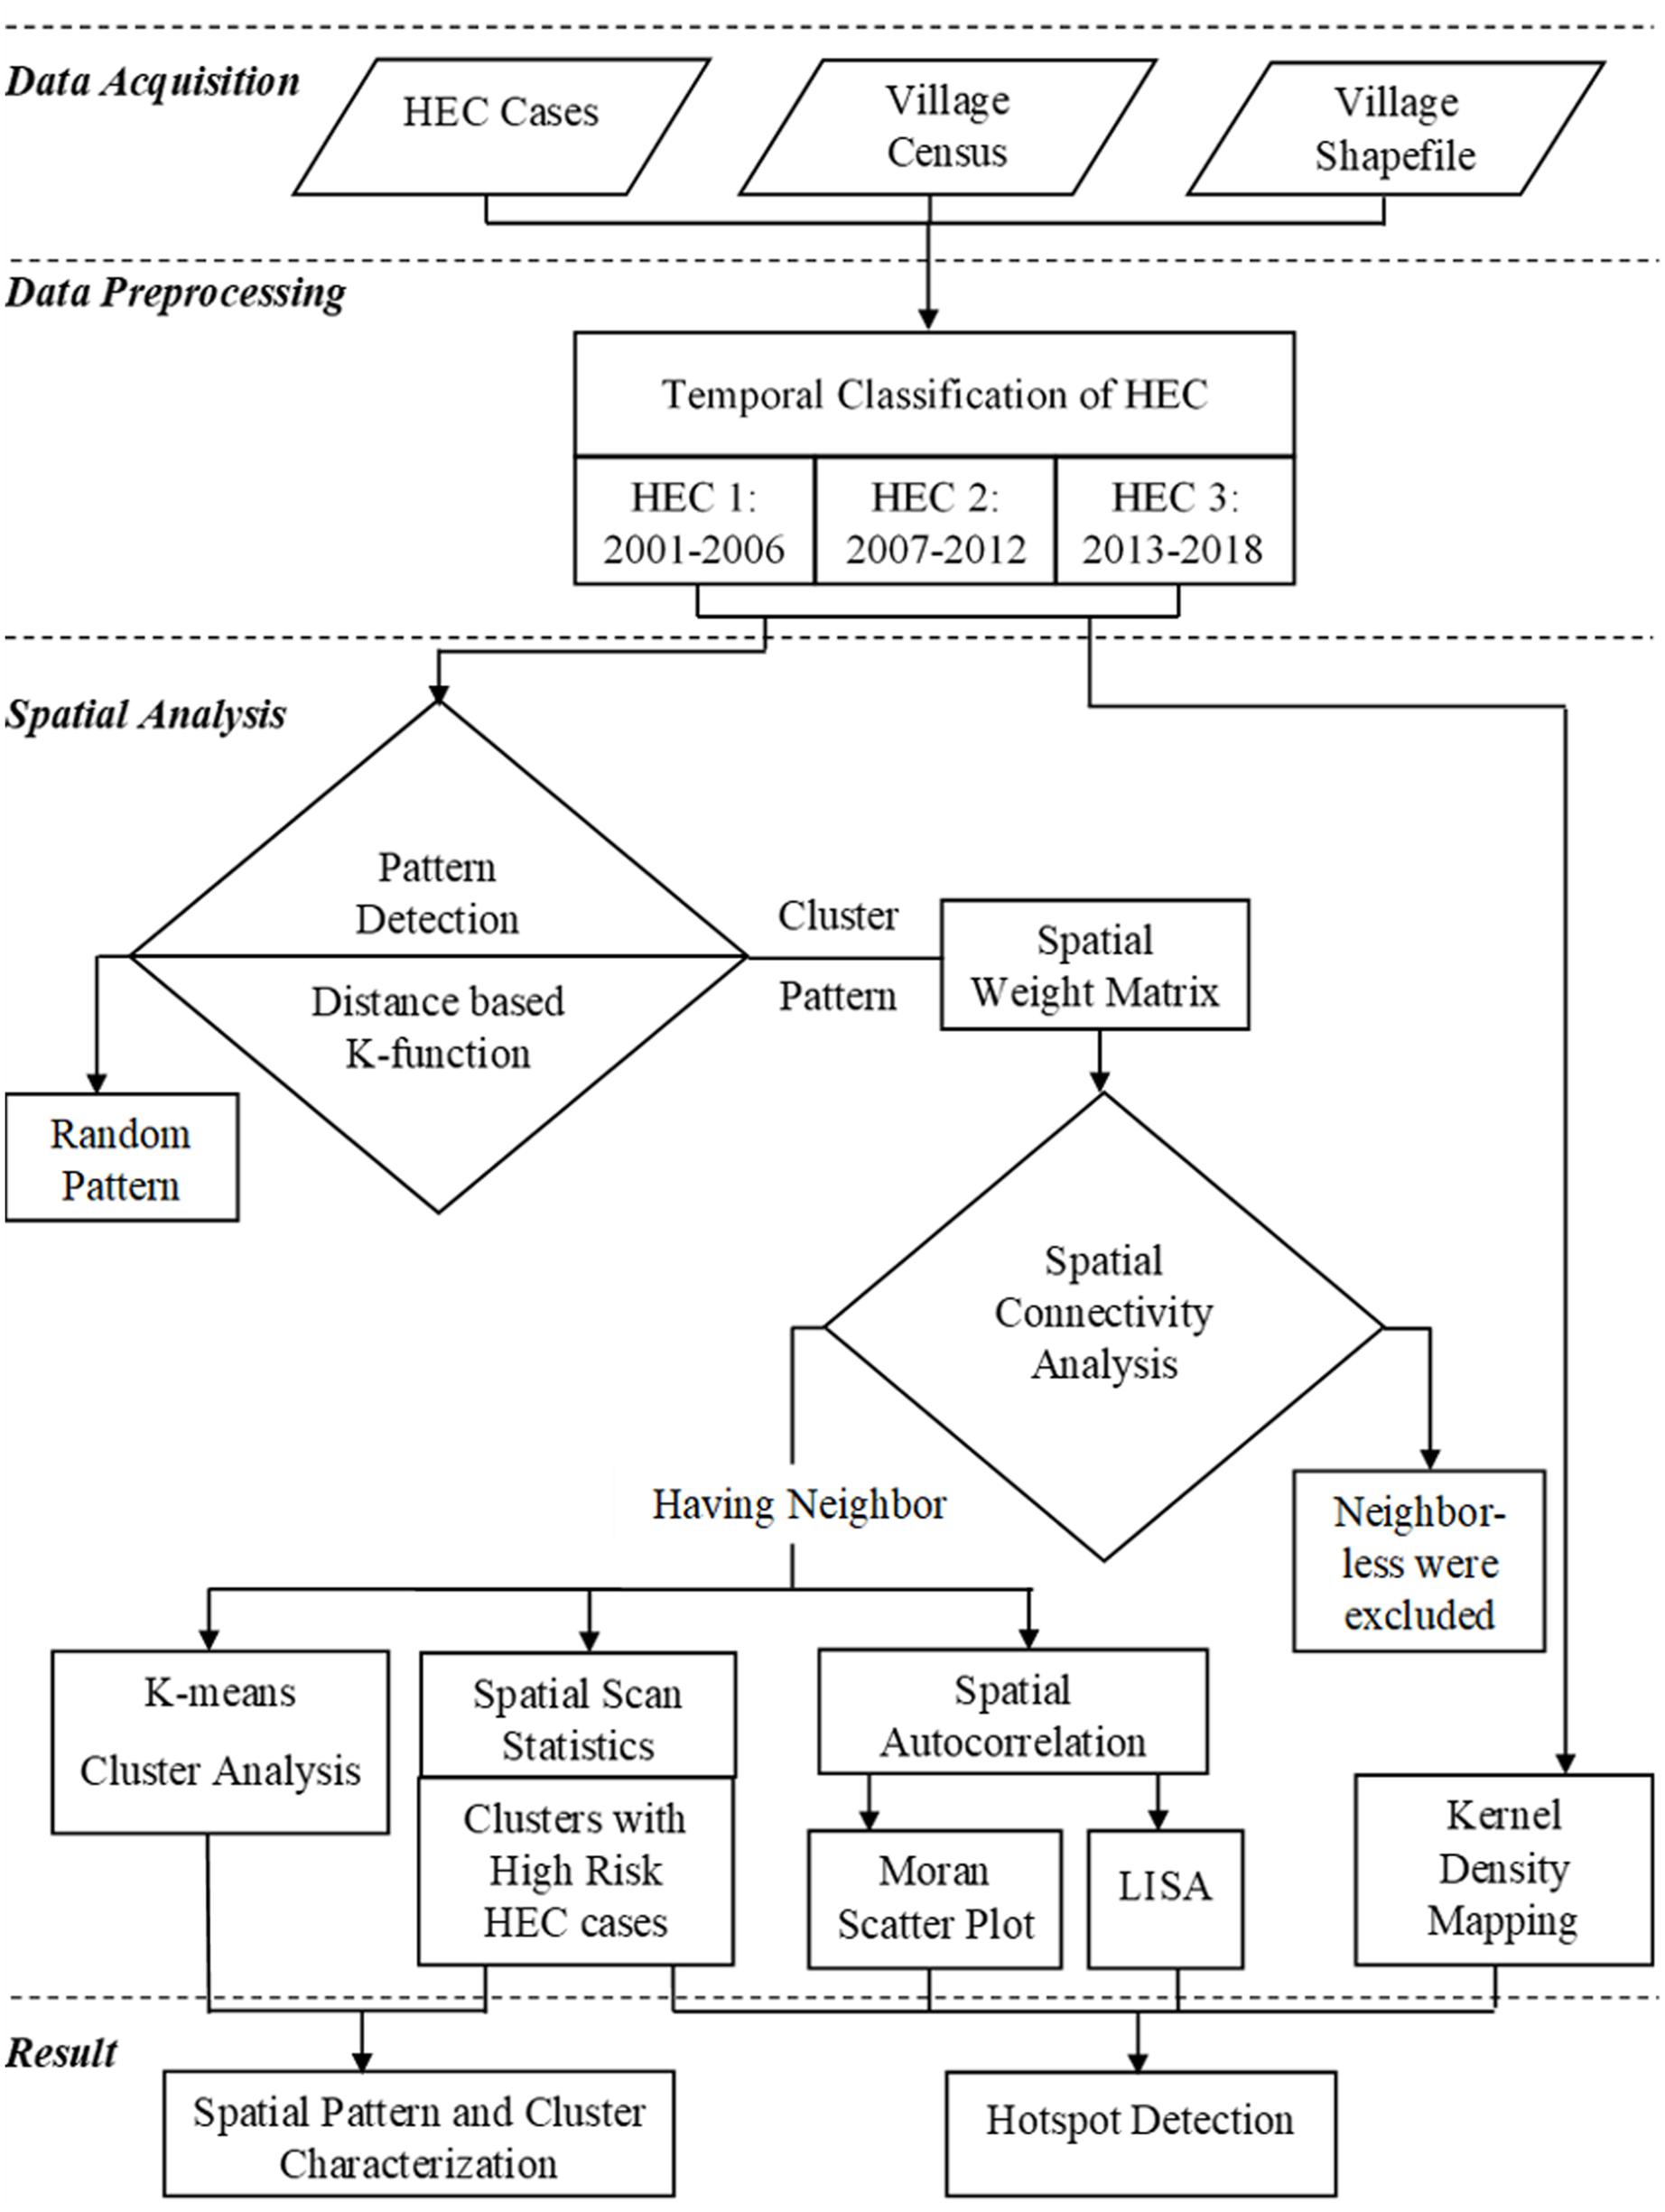
Figure 2. A methodological flowchart for this study.
Spatial Pattern Detection of HEC Distribution
HEC spatial patterns result from discrete stochastic phenomenon and using inappropriate approaches to analyze the pattern can lead to misrepresentation of the results due to spatial dependency, spatial noise, non-stationarity and heterogeneity (Boots and Getis, 1988; Bailey and Gatrell, 1995; Logan and Martinez, 2018). Our interests lay in the pattern of distribution of conflicts relative to one another, therefore, we preferred a distance-based point pattern analysis. Ripley’s K-function was used to interpret the spatial patterns of HEC distribution under the null hypothesis of complete spatial randomness. K-value was calculated using “Kest” function of “spatsat package” in R statistics for the three temporal phases HEC1, HEC2 and HEC3. This function compares the actual value of K (K-true) with expected value of K (K-expected) for assessing spatial regularity (clustering). Edge correction was applied to reduce the bias produced from the non-detectability of points from the random pattern outside the window (Ripley, 1988). The output of this analysis helped us to quantitatively assess whether the cases were driven by chance (random pattern) or some external factors (cluster pattern).
Investigation of HEC Clusters
Spatial-weighted matrix is the key component in constructing spatial autocorrelation statistics. Prior to cluster analysis, a spatial-weighted matrix was executed using higher order queen contiguity, which quantified spatial associations and connectivity among the HEC incidences. The HEC incidences which did not have neighboring incidences were excluded and the resulting matrix was used to construct the spatial autocorrelation (Getis and Aldstadt, 2004).
Although, there are other popular methods for investigating clusters (Kelsall and Diggle, 1995; Duczmal et al., 2006) they were not suitable for our study as they additionally required the geographic information for all non-case data too (Huang et al., 2008). The intention of this investigation was to find out the number of major HEC clusters in the study area. To this end, we used a K-means unsupervised clustering algorithm to evaluate the number of HEC clusters “K” in HEC1, HEC2, and HEC3 (James et al., 2013). To find the optimal K for the algorithm, we plotted the number of clusters (from 2 to 15) against the clustering compactness (sum of squares within the corresponding clusters). The algorithm then started randomly assigning each event to the K number of clusters and calculated the mean center of each cluster. Euclidean distance was calculated between each event and the clusters’ mean centers. The events were reassigned to a new cluster of closest mean centers and then it recalculated the mean of the new centers. The process was repeated until no points were reallocated to another centroid. The silhouette coefficient (Si) was used to validate the goodness of clustering, where overall positive Si explained the number of clusters in HEC distribution.
Detection of HEC Hotspots
Local indicator of spatial association (LISA) was used to locate hotspots where HEC cases are extreme and geographically homogeneous. LISA uses Moran scatterplot, which is calculated using Local Moran’s I and based on Moran scatterplot, all the HEC villages were categorized into four groups: High-High (HH), High-Low (HL), Low-High (LH), and Low-Low (LL). HH-HEC and LL-HEC are positive spatial autocorrelations, where HH represents the clusters center with high HEC cases surrounded by high HEC cases while LL represents the low HEC case clusters surrounded by low HEC cases. HL-HEC and LH-HEC are the negative spatial autocorrelations, which represent the dissimilar values in its neighboring locations (Anselin, 1995). Univariate LISA cluster maps were plotted based on the Moran scatterplot categorization for HEC1, HEC2, and HEC3. Monte Carlo randomization (499 permutations) was implemented to assess the significance. The HEC cases having p-values larger than 0.05 were classified as not significant.
Mapping Human Populations at Risk
SaTScan a non-parametric spatial scan statistic was used to characterize HEC clusters by scanning with spatial circular windows (SCW). SaTScan uses Kulldorff’s technique (Kulldorff, 1997; Kulldorff, 2013) which is the most powerful (Duczmal et al., 2006; Alemu et al., 2013) and widely used method (Zhao et al., 2013; Areias et al., 2015; Ge et al., 2016; Wang et al., 2016) for spatial analysis of irregularly shaped clusters. The scanning position and size of circular window are flexible, which changes for each location of HEC incidence and calculates the number of detected and expected incidences inside the SCW. The size of SCW was determined based on the radius enclosing a minimum of 30% population at risk of HEC. Ma et al. (2016) observed that the windows might be too large to contain the low-risk locations if the window covered 50% of the population, which might lead to a high false positive rate. However, the windows with smaller populations might be too small to detect the real high-risk locations, thereby leading to a high false negative rate. Considering several studies (Ge et al., 2016; Wang et al., 2016; Ma et al., 2016) and the nature of our data we selected the SCW covering 30% of the population at risk and the overlapping SCWs were excluded.
A map of SCW was plotted where each circular window represented significant high risk HEC clusters including the number of people living inside the respective circular windows. SaTScan also calculated the relative risk (RR = ratio of observed HEC counts within the SCW to its expected HEC counts) for each SCW (Kulldorff, 2013), which represented the HEC risk inside the SCWs with respect to outside. The SCWs where the risk within the circular window was twice (RR > 2) that of outside were identified as high-risk clusters (Ge et al., 2016), as the people inside these clusters were more likely to get attacked by elephants than people outside.
Assessing Temporal Trends in the Spatial Variation of HEC Risk
Kernel density interpolation was used to create a continuous surface map of HEC distribution. HH-HEC villages and high-risk SCWs were overlaid on the HEC kernel density map, for better perception of the densest clusters of high-risk HEC regions and its spatial variation over the period of 18 years in the study area.
Spatial Distribution of HEC Impacts on Human Life and Property
To illustrate the distinction and the underlying patterns of severity of HEC impacts on human lives, property and crops, HEC data was categorized into three classes; human casualty (human death and injury), house damage and crop raiding. We extracted the hotspot villages for each type of HEC using Moran scatter plot and LISA (according to the method followed in the section “Detection of HEC Hotspots”). Separate Kernel density maps were plotted for human casualty, house damage and crop raiding. Subsequently, the High-High hotspot villages of each HEC type were overlapped over the corresponding kernel density surface to assess the regions that were highly impacted by human death and injury, house damage and cropland destruction.
Software Tool
The SaTScanTM software (v 9.6, Kulldorff and Information Management Services, Inc.) was used to determine the high-risk clusters and to characterize the SCW. Open GeoDa software (Arizona State University, United States) was used for Moran scatterplots and LISA analysis. ArcGIS (v10.6, ESRI Inc.) was used to plot the HEC kernel density map. R (v3.6.1) was used for pattern detection using Ripley’s K-function and cluster analysis using k-means function.
Results
Spatial Patterns of HEC
Ripley’s K-function test provided evidence against the null-hypothesis of complete spatial randomness, i.e., the spatial pattern of HEC1, HEC2, and HEC3 were observed to be significantly clustered (Figure 3). We found that HEC incidences in HEC1 (Figure 3A), HEC2 (Figure 3B), and HEC3 (Figure 3C) appeared to be more clustered than expected at distances greater than 1.8, 2, and 2.1 km, respectively.
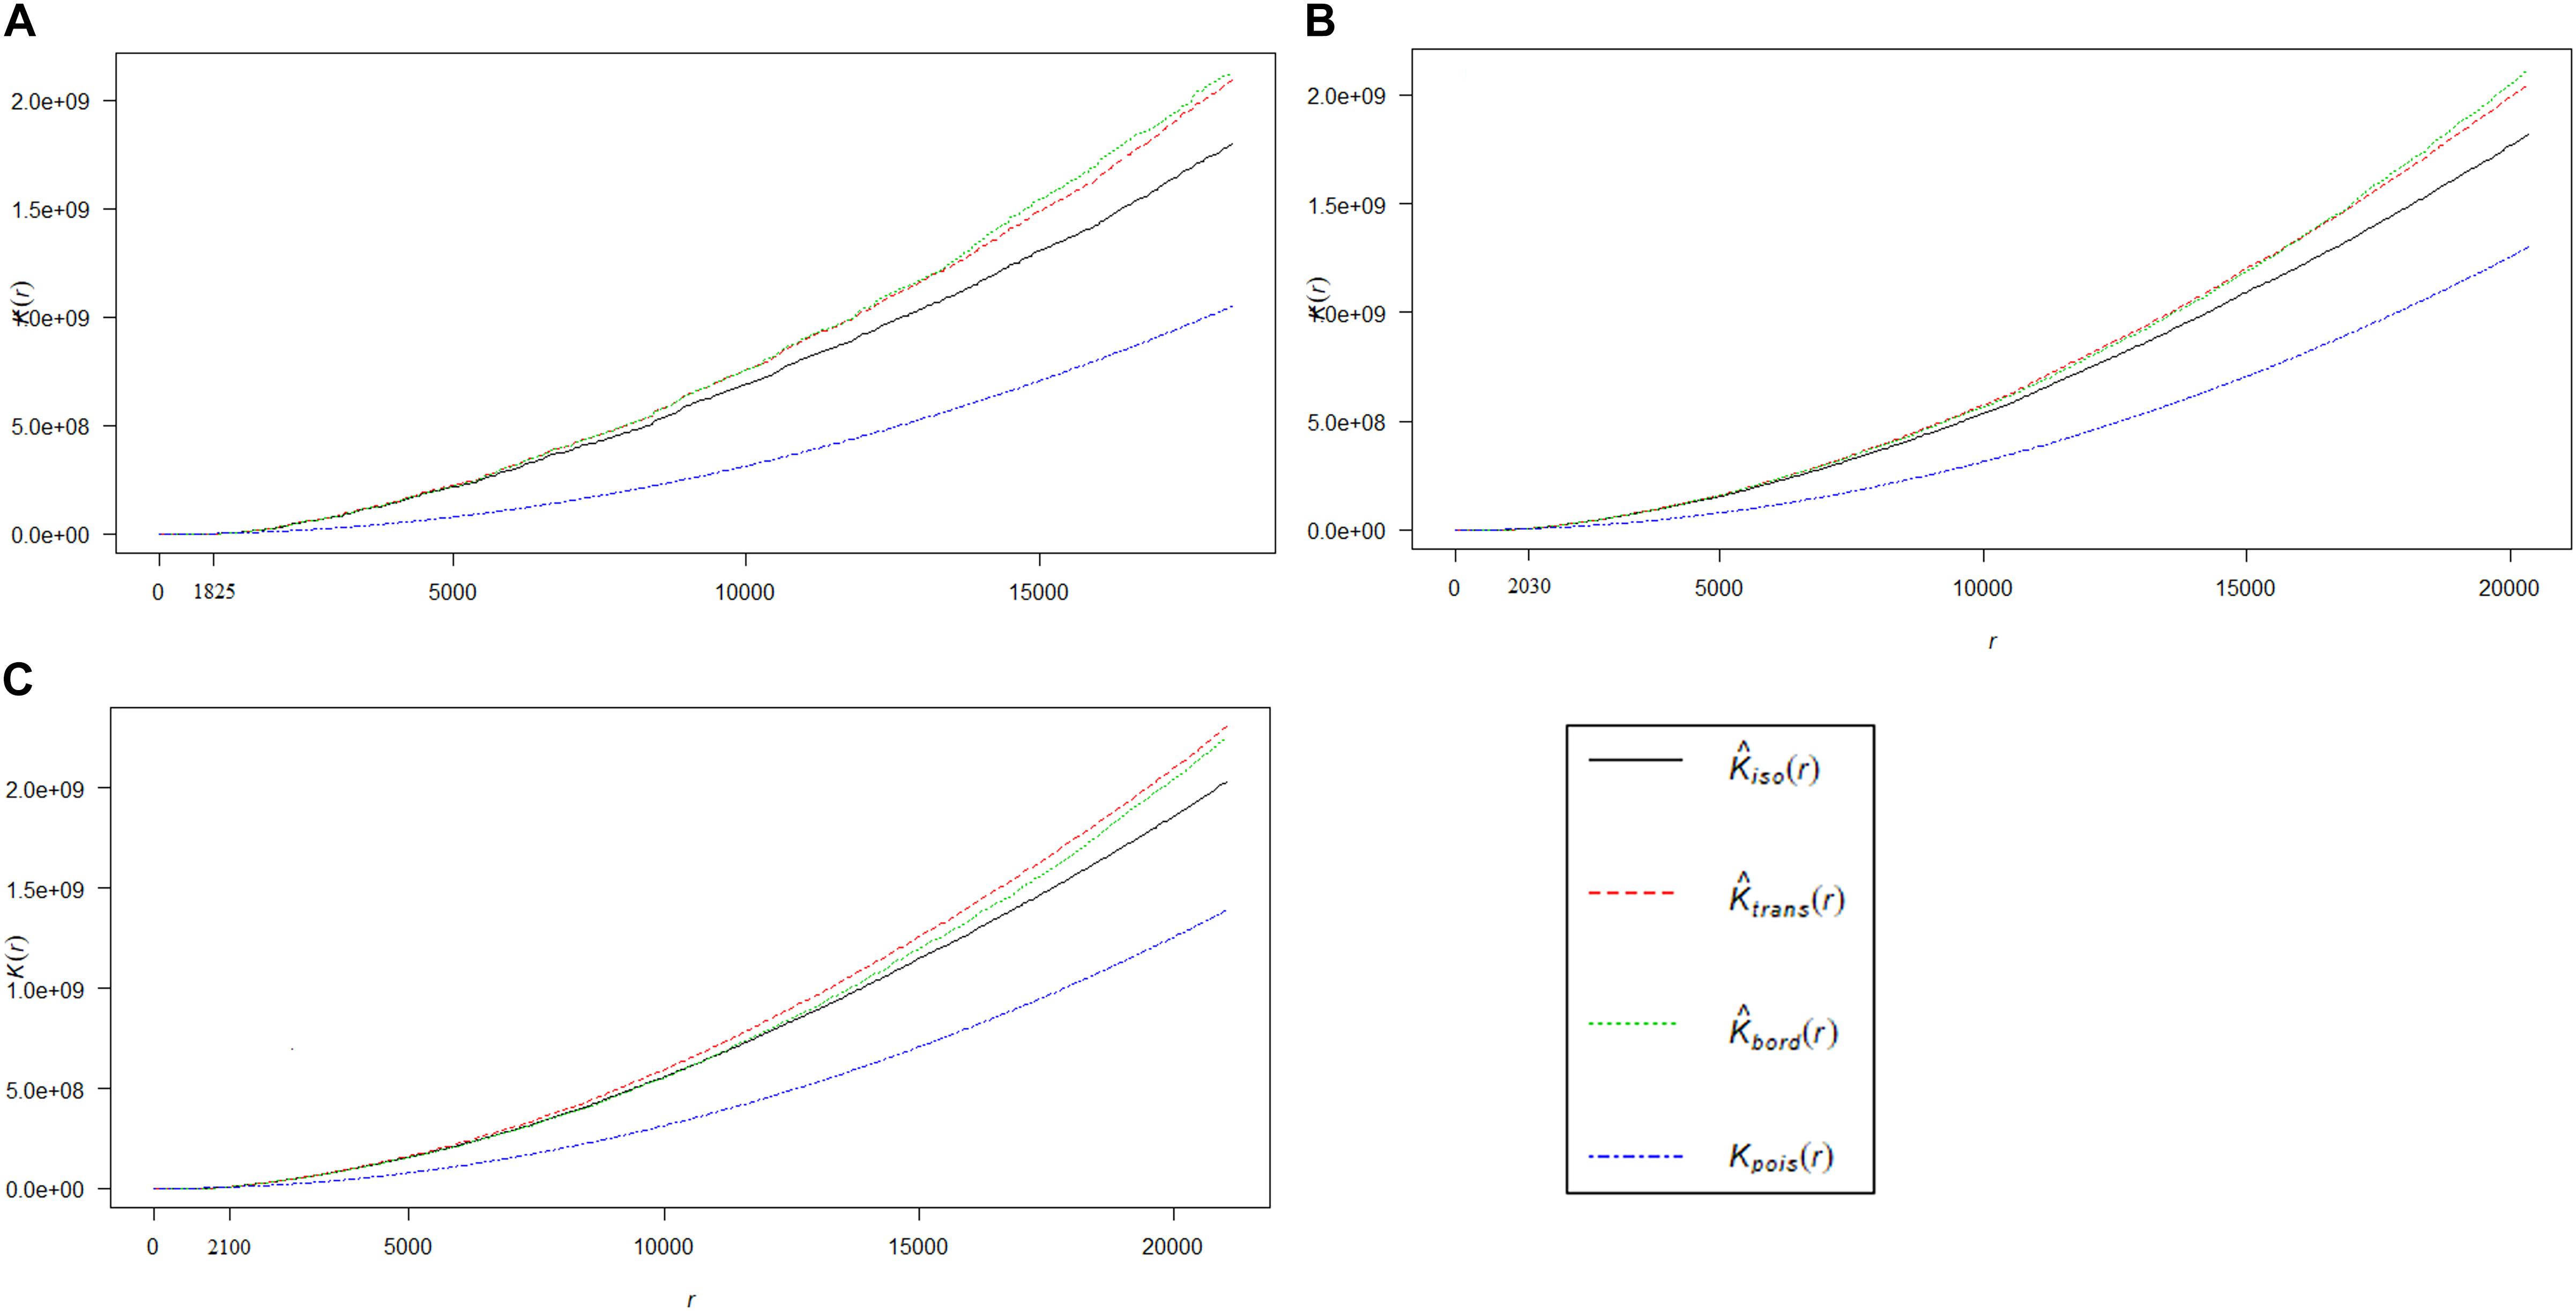
Figure 3. The graph represents the result of inferential analysis of K-function, which is statistically deviating from complete spatial randomness. Distribution of the true values of K [Kpois (r)] for HEC1 (A), HEC2 (B), and HEC3 (C) incidences (blue line), which is compared to their corresponding expected values [Kiso (r) in black line, Ktrans (r) in red line and Kbord (r) in green line]. HEC incidences are clustered at distances greater than 1.825 km, 2.03 and 2.1 km for HEC1, HEC2, and HEC3 respectively. Note: The isotropic, translate and border corrections are executed by default in the K-function of R.
A summary of spatial weighted matrix of higher order queen contiguity for HEC1, HEC2 and HEC3 are listed in Supplementary Table 1. The number of neighbors for each observation is shown in a connectivity histogram (Supplementary Figure 1), while the neighborhood structure is shown in connectivity maps (Supplementary Figure 2).
Characterization of HEC Clusters
The dissimilarity within the clusters is shown in a group sum of squares chart (Figure 4) for selecting the optimal K. The curve is monotonically decreasing, so it was difficult to figure out the point where the curve starts to flatten out. The change in the within-cluster sum of squares was observed to be increasing as the number of clusters reduced from 4 to 3 for HEC1 (Figure 4A) and HEC2 (Figure 4B) and 5 to 4 for HEC3 (Figure 4C).
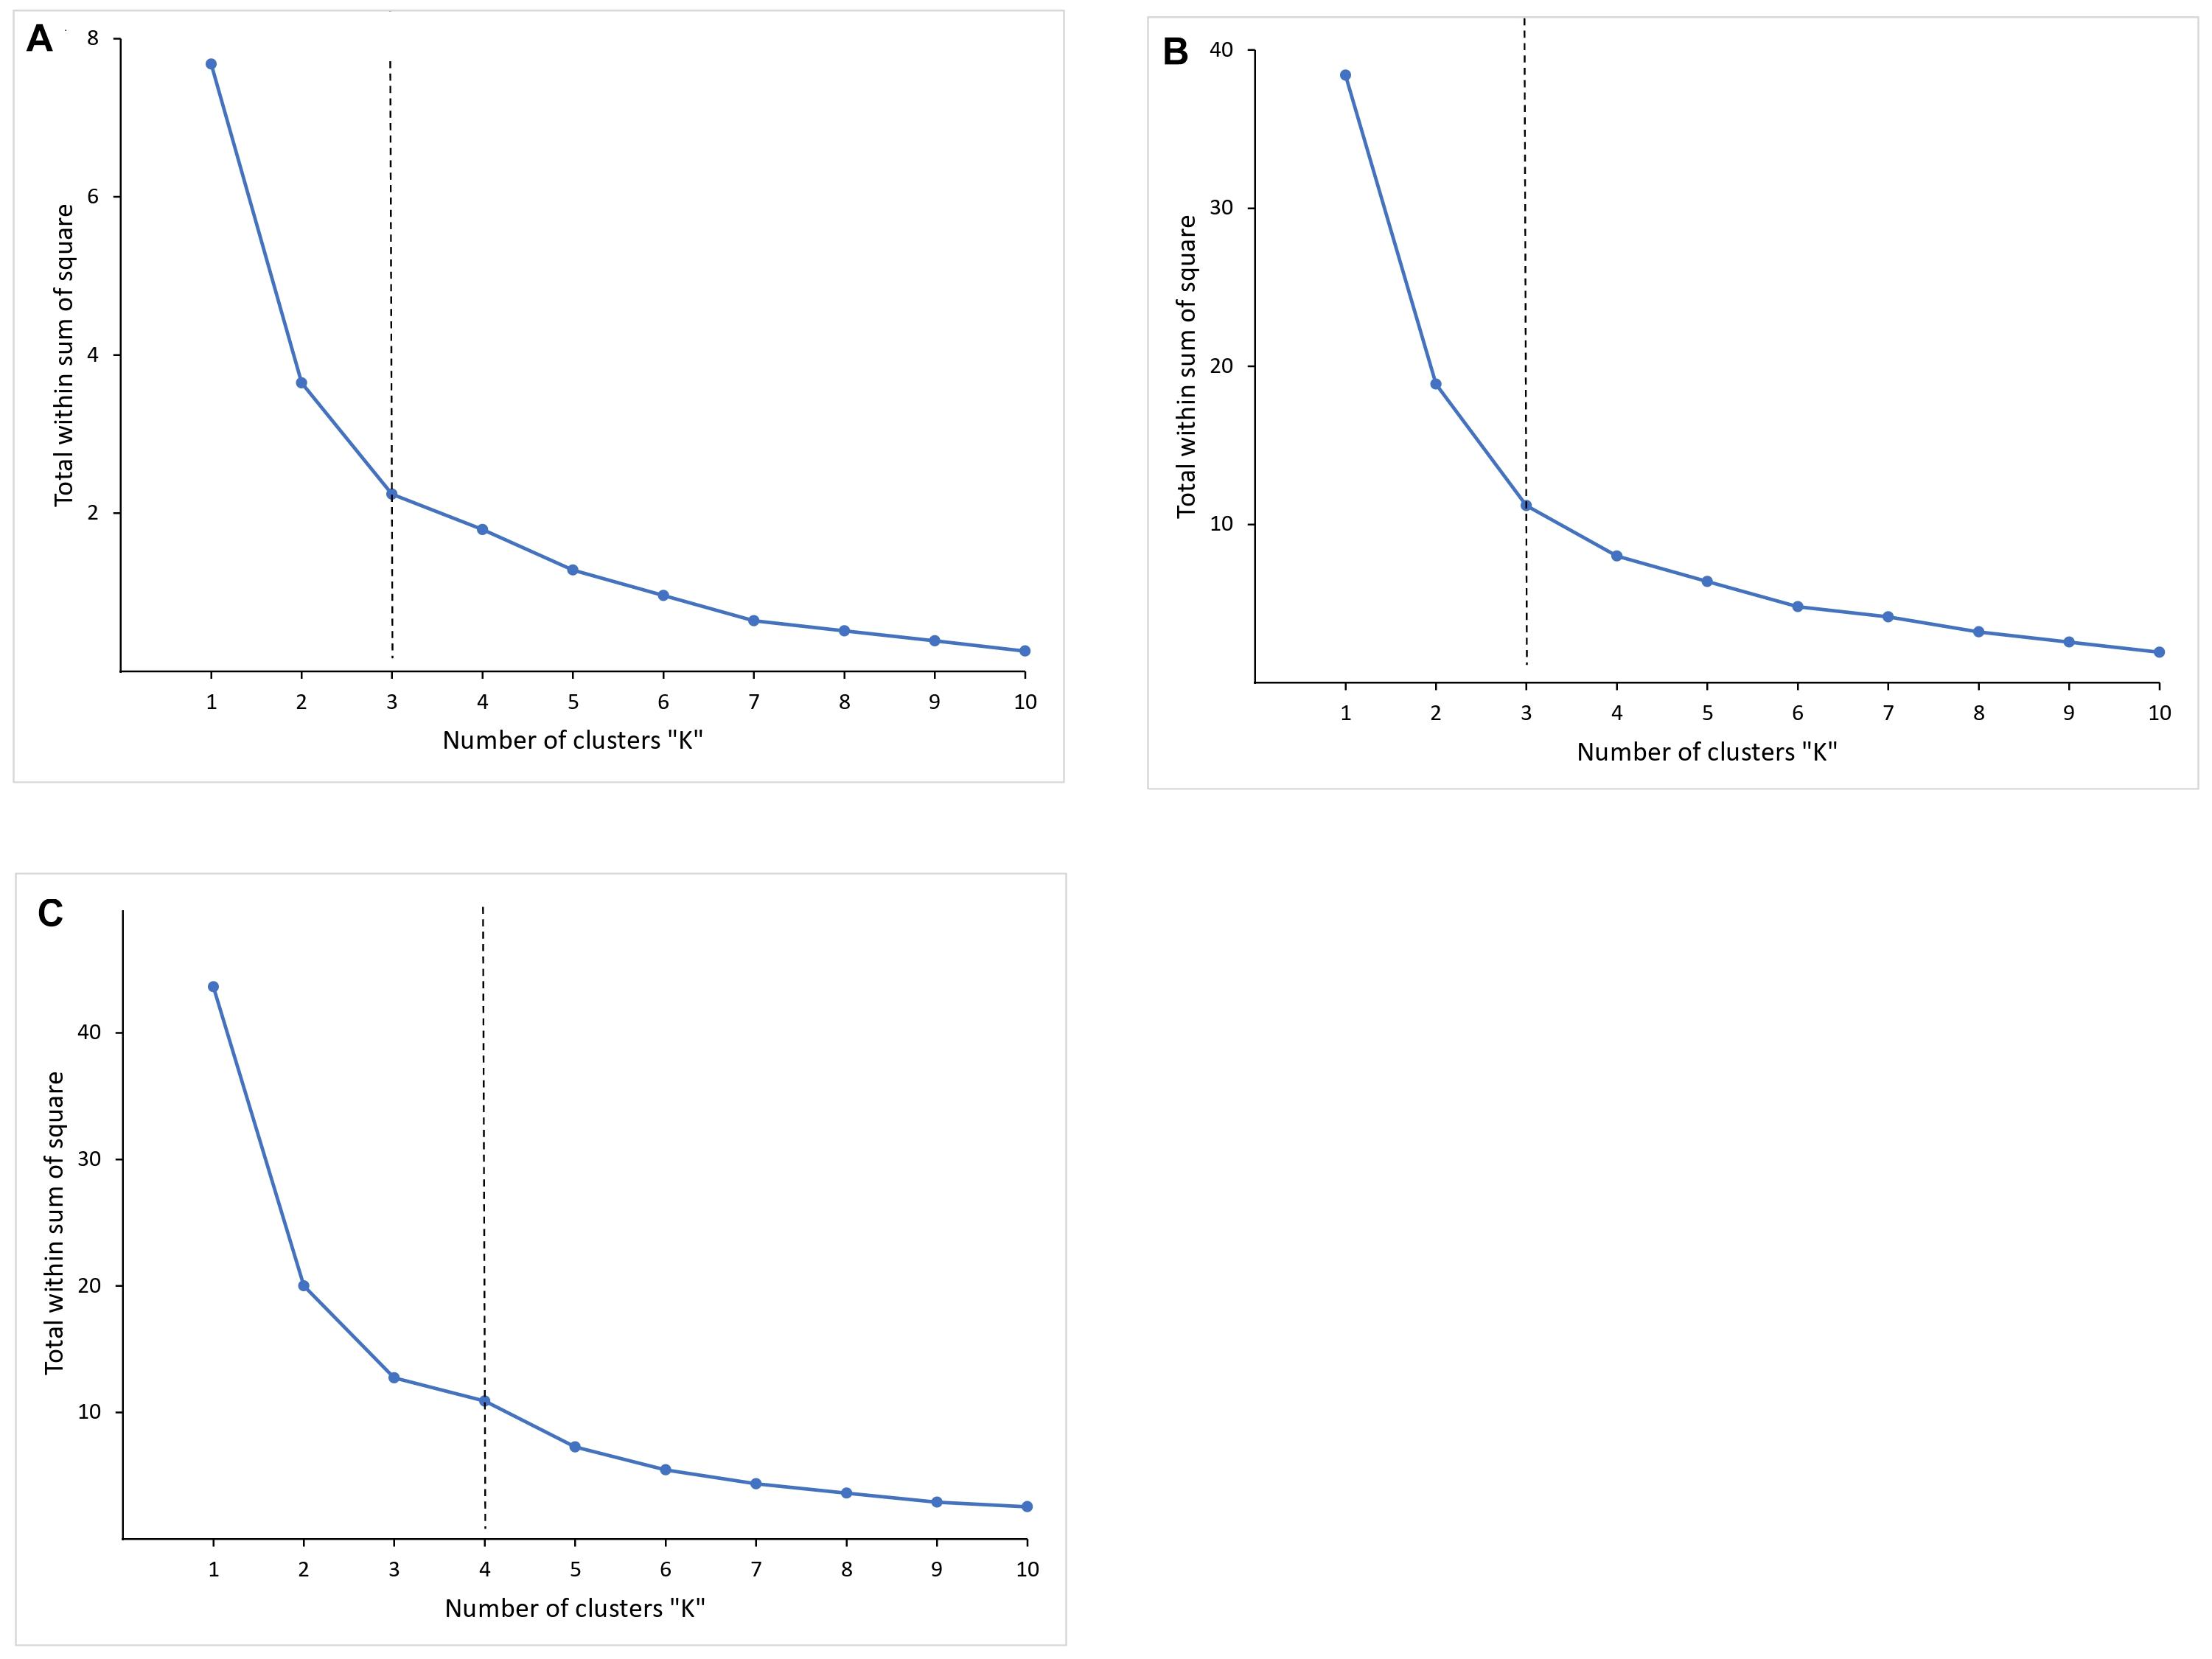
Figure 4. The graph is showing the dissimilarity within the clusters by calculating the within clusters sum of squares for corresponding number of clusters. The curves are not showing an obvious point where the curve starts to flatten out. However, it can be observed from the curves that it is decreasing at k = 3, k = 3 and k = 4, which can be considered as optimal-K for respective HEC1 (A), HEC2 (B), and HEC3 (C).
We set K = 3 for HEC1, K = 3 for HEC2 and K = 4 for HEC3, whose cluster compactness (Table 1) was 70.1, 69.8, and 77.6% respectively. Silhouette coefficient supported the evidence that the selected numbers of clusters were optimal as the overall silhouette values were positive (Si = 0.42 for HEC1, Si = 0.44 for HEC2, and Si = 0.40 for HEC3). The aim of this analysis was not to achieve 100% compactness within the clusters but to identify a reasonable number of clusters which could potentially explain a considerable part of the HEC distribution. The cluster centers for HEC1 were located in Keonjhar, BJP, and Ghatgaon forest ranges, for HEC2 in the border of Ghatgaon and Patna, Champua and Telkoi forest ranges and for HEC3 in Keonjhar, Champua, border of Champua and Patna and Telkoi forest ranges (Supplementary Figure 3).
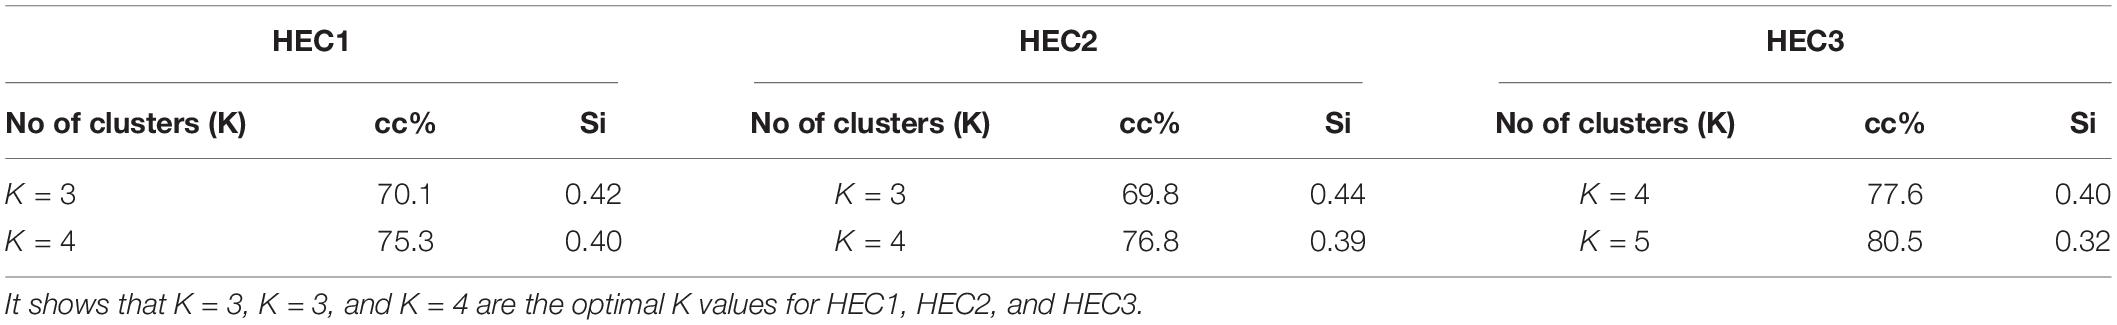
Table 1. List of different number of clusters according to within sum of squares with their cluster compactness values (cc%) and silhouette values (Si).
HEC Hotspots
The Moran scatterplot (Supplementary Figure 4) represents the linear fit through the standardized HEC values, where the slope corresponds to Moran’s I value [HEC1 = 0.112 (Supplementary Figure 4A), HEC2 = 0.039 (Supplementary Figure 4B) and HEC3 = 0.071 (Supplementary Figure 4C)].
The LISA cluster map (Figure 5) augments the location of significant HEC hotspots derived from the Moran scatter plot. However, we have only focused on the HH-HEC locations to identify the hotspots. The hotspots during HEC1 (Figure 5A) were mainly identified in Keonjhar, Ghatgaon and in the border of BJP and Keonjhar forest ranges. During HEC2 (Figure 5B) the hotspots were found in Keonjhar and Champua forest ranges with few HH-HEC clusters in Ghatgaon and Patna forest ranges. These regions were also observed to be hotspots during HEC3 but with a greater areal extent in the Champua forest range (Figure 5C).
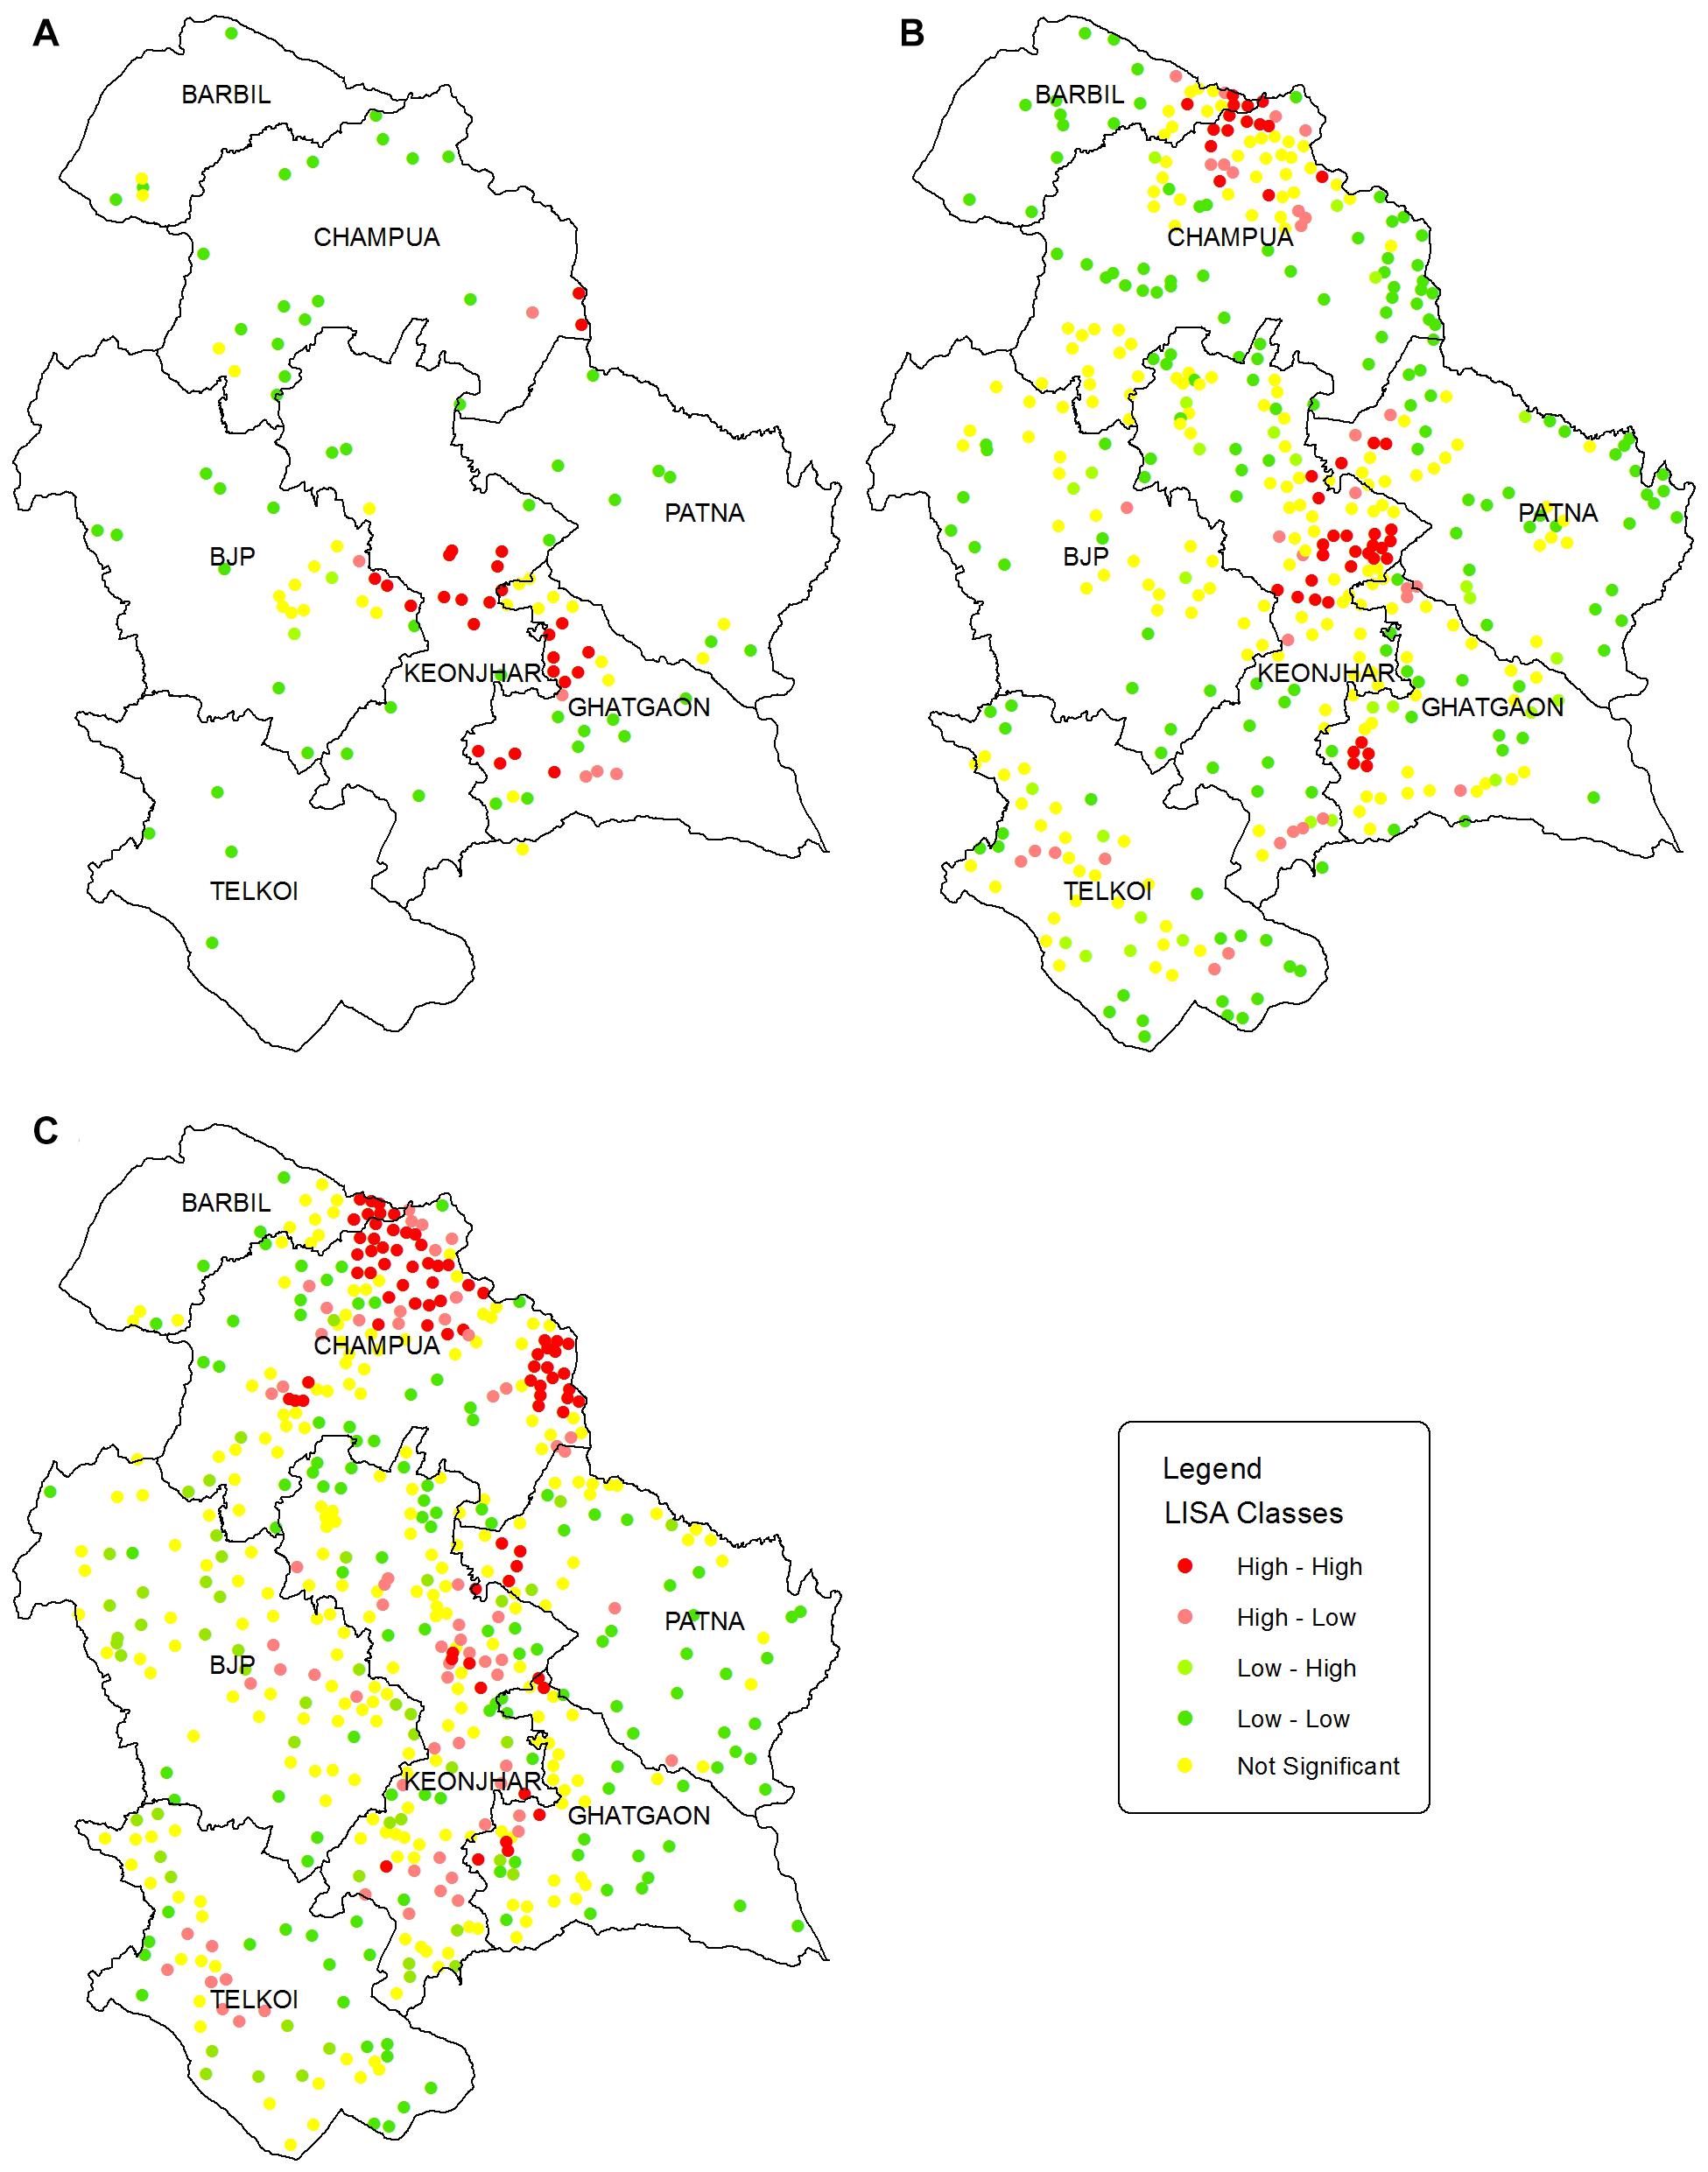
Figure 5. Maps showing the LISA significant point clusters for HEC incidences in Keonjhar district for (A) HEC1, (B) HEC2, and (C) HEC3. LISA cluster maps were classified into 4 classes based on Moran scatterplot categorization. The HEC cases having p-values larger than 0.05 were classified as not significant and shown in yellow dots. The dark red and dark green locations are indications of positive autocorrelation (HH; high HEC values surrounded by high, and LL; low HEC values surrounded by low) while, the light green and light red are negative autocorrelation indications (LH; low surrounded by high and HL; high surrounded by low HEC cases).
Populations at Risk Within HEC Clusters
The significant high-risk HEC clusters were represented in SCWs (0.5–10 km radius of blue circles) (Figure 6). The RR of significant SCWs (Table 2) for the whole study period ranged from 2.708 to 6.682. We found 4 SCWs for HEC1, where W13 SCW (radius 4.3 km) in Ghatgaon forest range (Figure 6A) with a population of ∼5,200 people were recorded as the most vulnerable zone for HEC1. The RR of W13 SCW was 2.085, indicating that the risk of HEC within the particular SCW was higher than that of outside. Around 10 SCWs were found for HEC2, where ∼13,800 residents (RR = 2.126) living in the W26 SCW (radius 4.7 km) of the Champua forest range (Figure 6B) were exposed to high risk of HEC. In the same period, W21 SCW (radius 3.9 km) in the Keonjhar forest range was also identified as a highly conflicted region with ∼6,150 people (RR = 3.134) under threat. We observed 12 SCWs for HEC3 (Figure 6C) where respective populations of ∼17,500 (RR = 1.971), ∼11,800 (RR = 1.923) and ∼16,250 (RR = 1.708) people living within the respective SCWs; W33, W34, and W36 (radius 4.8, 4.6, and 7.01 km) of the Champua forest range were highly vulnerable to HEC. Apart from the Champua forest range, W32 SCW (of radius 3.2 km) in the Patna forest range with a population of 3648 (RR = 2.505) was also identified as a major SCW with a significant risk of HEC.
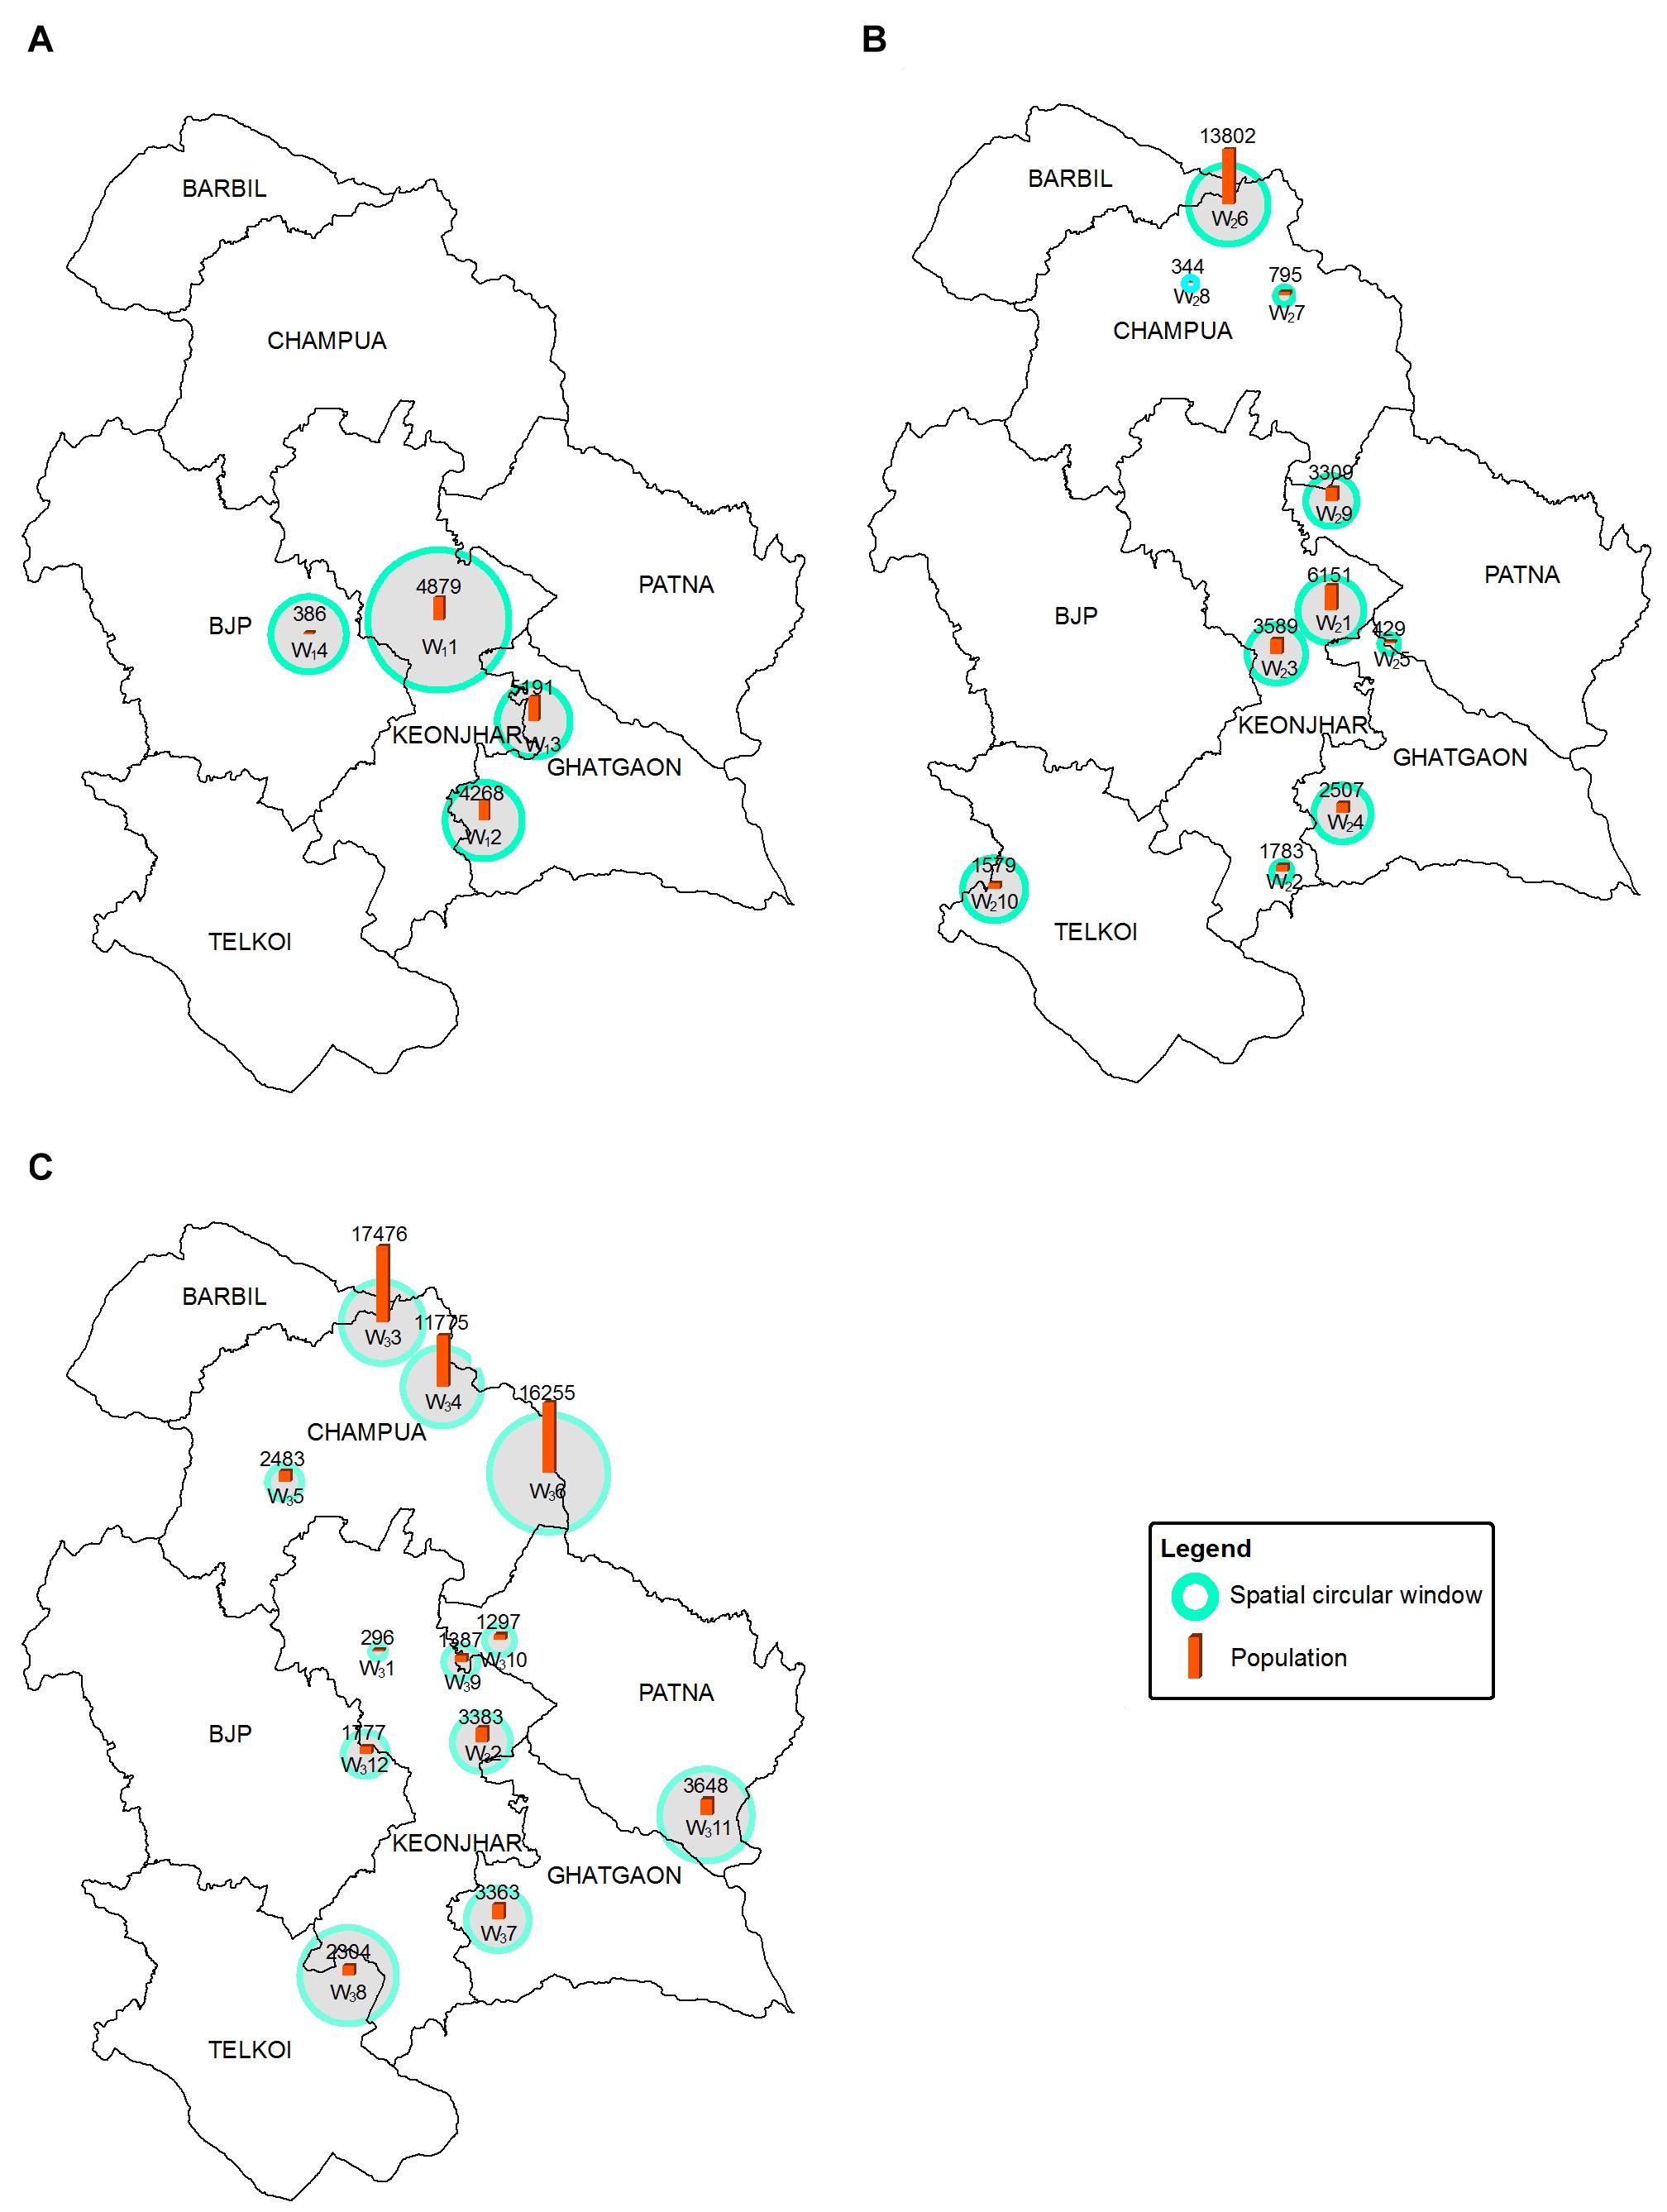
Figure 6. Maps showing the geographical locations of high-risk HEC SCWs for HEC1 (A), HEC2 (B) and HEC3 (C) where blue circles of radii ranging from 0.5 to 10 km show the SCWs. The red bars plotted within the SCWs show the number of people at risk in each SCW.
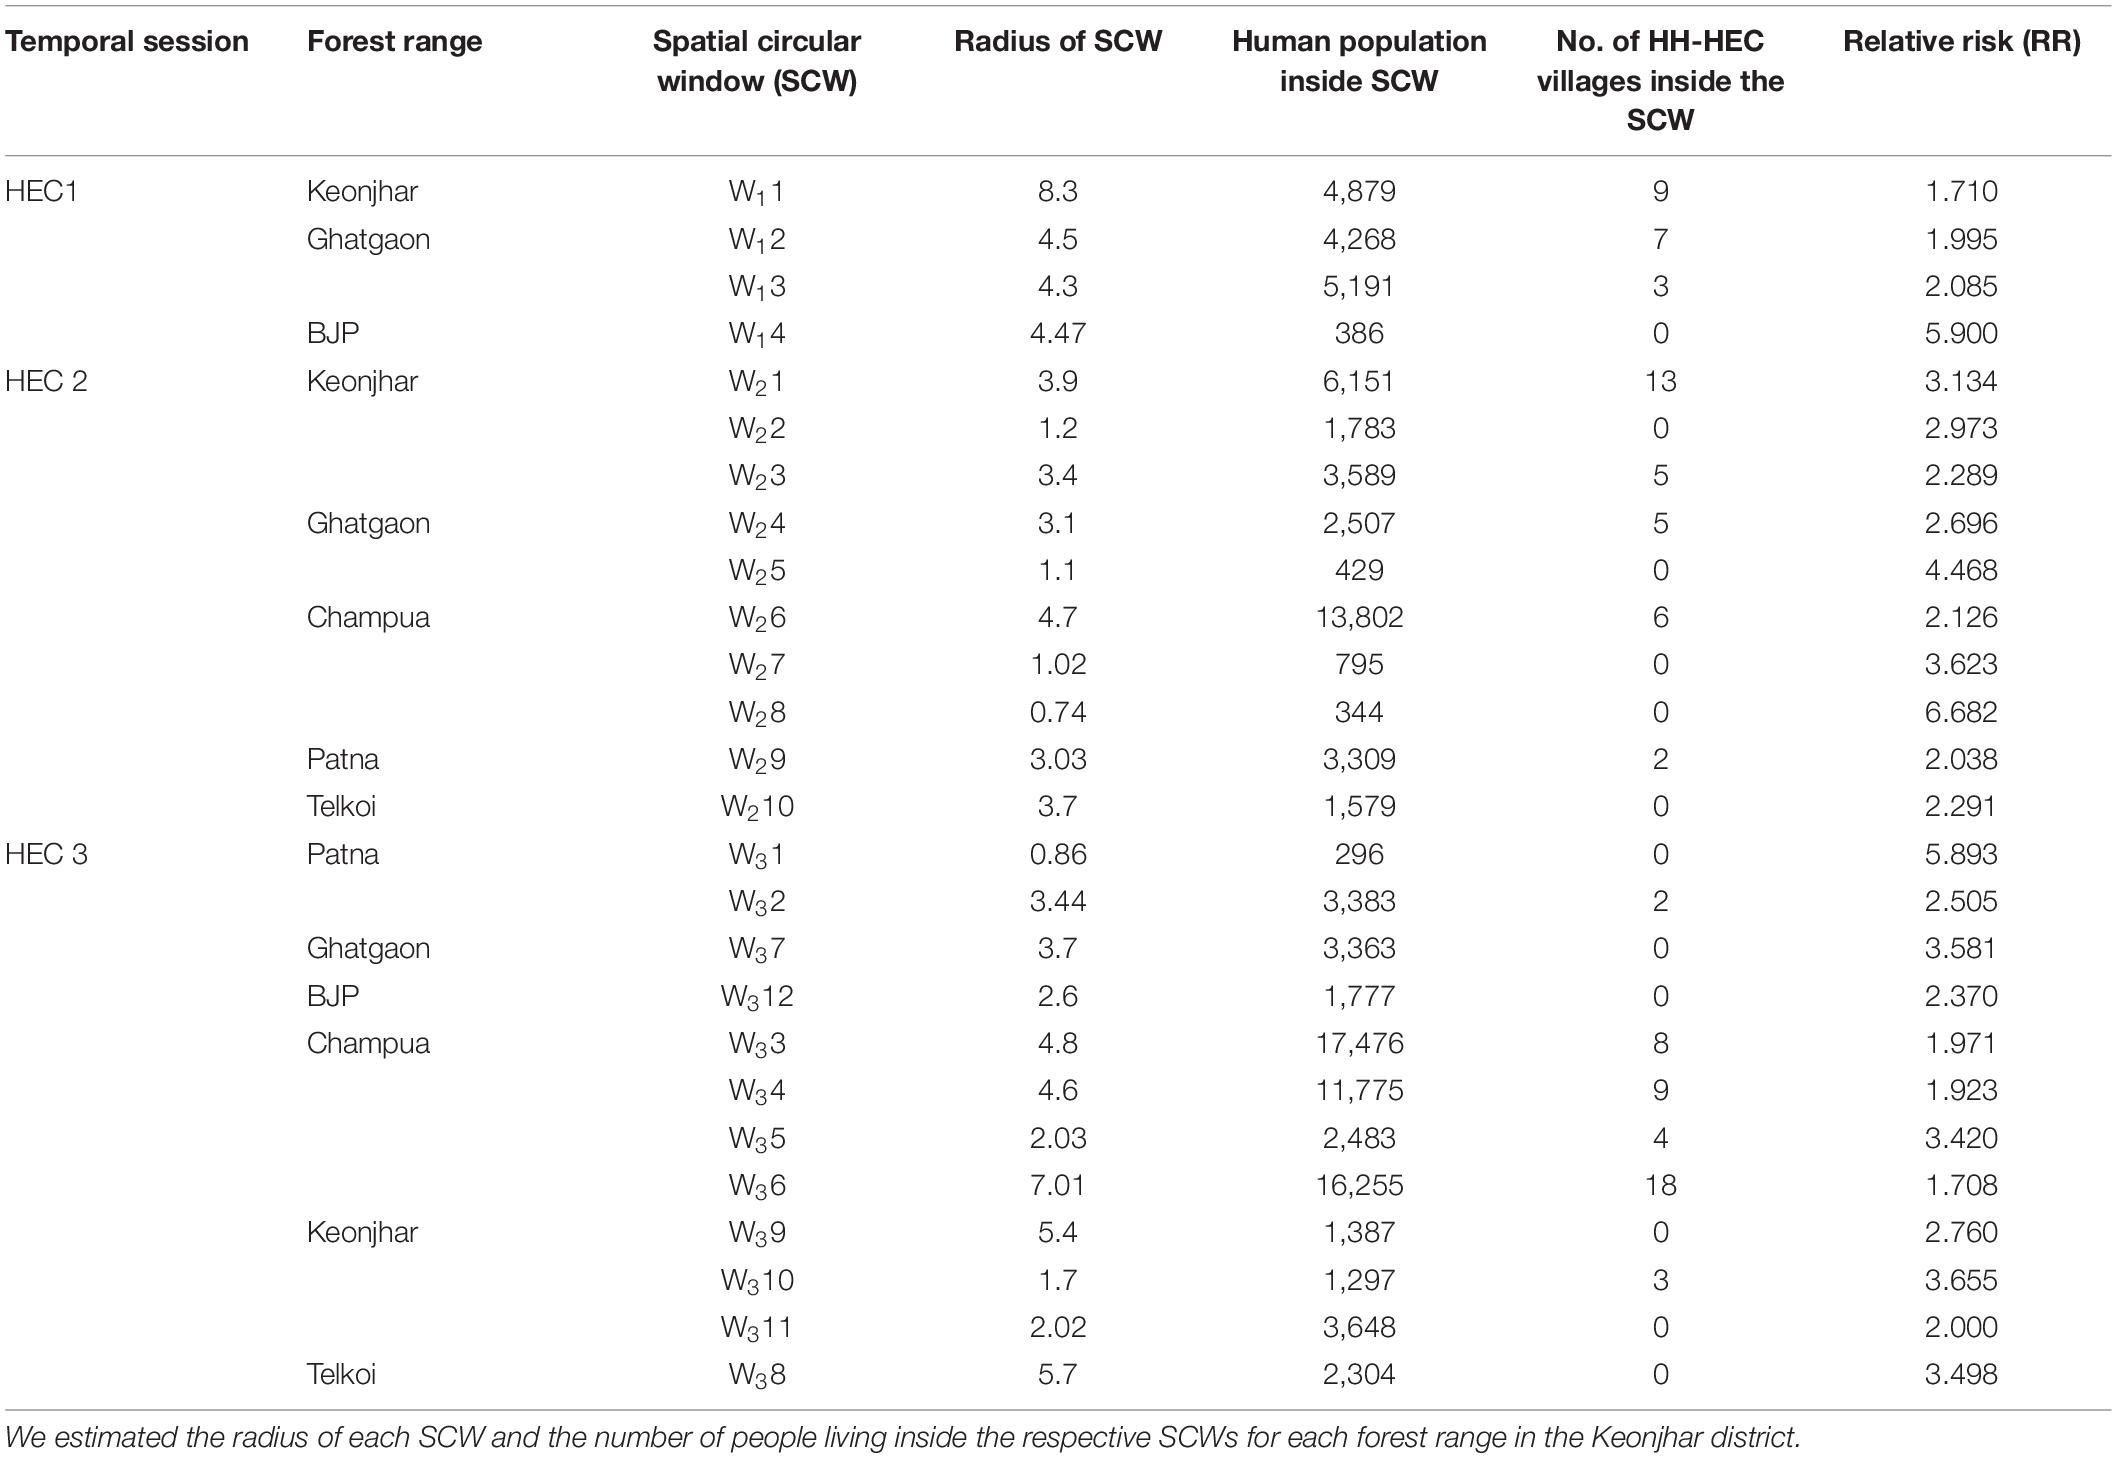
Table 2. Table showing the results from the Kulldorff’s spatial scan statistics performed in SatScan and the HH-HEC villages inside each SCW.
Temporal Trends in the Spatial Variation of HEC Risk
The kernel density map was created where the risk indices were ranging from 0 to 1 and equally divided into five groups: (1) non-risk areas (0–0.2), (2) very low-risk areas (0.2–0.4), (3) mid-risk areas (0.4–0.6), (4) high-risk areas (0.6–0.8) and (5) very high-risk areas (0.8–0.1). The densest clusters of high-risk HEC regions were distinguished by the commonly overlapped areas on the HH-HEC villages and SCWs maps overlaid on the kernel density map (Figure 7).
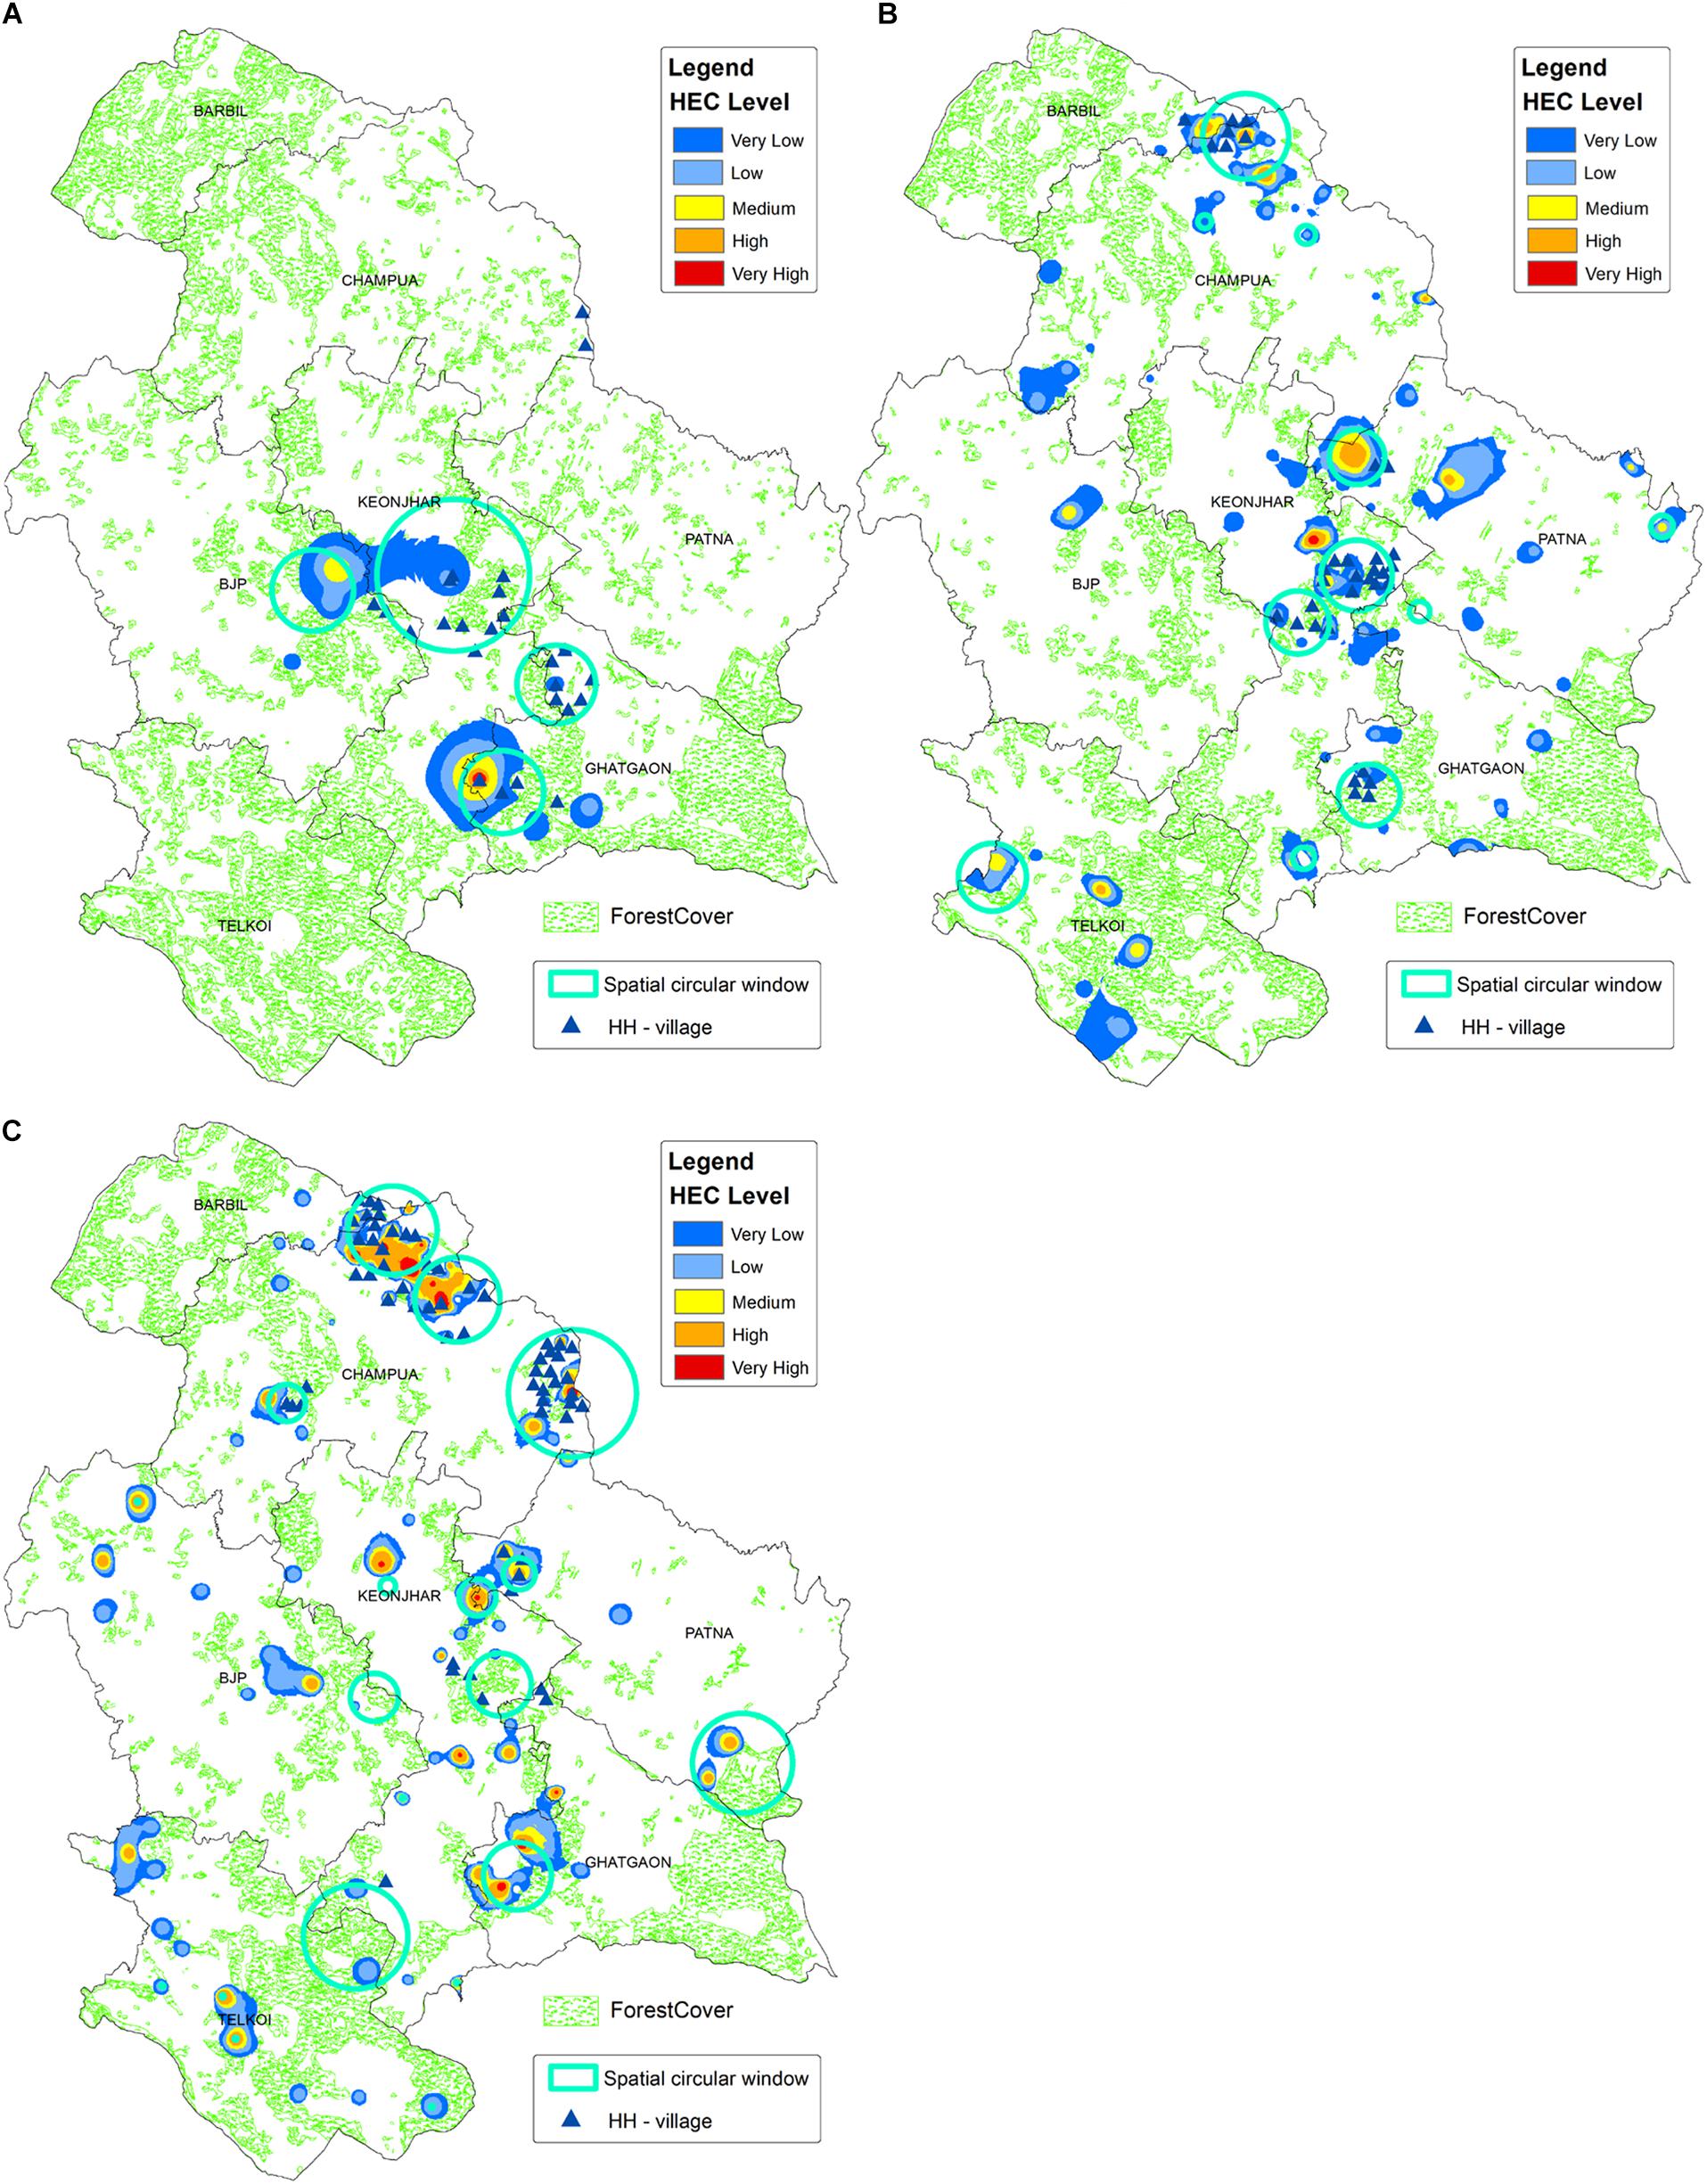
Figure 7. The descriptive map showing the regions highly affected by HEC, which was generated by overlaying high-high HEC and SCWs over kernel density map, for (A) HEC1, (B) HEC2, and (C) HEC3. The kernel density layer is showing the smooth surface map of HEC cases, where the shades of red regions have the highest density of HEC cases. Forest cover data for 2006 (A), 2012 (B), and 2018 (C) is given in the background, which is showing a decreasing trend in forest cover from HEC1 to HEC3.
During HEC1, the high-risk HEC regions were spatially concentrated in the border of Keonjhar and Ghatgaon forest ranges (Figure 7A), which scattered throughout the study area (Figure 7B) during HEC2. Around 20 villages primarily from the Ghatgaon forest range and nearly 30 villages, majorly from Keonjhar forest range were found to be highly affected by elephant attack during HEC1 and HEC2, respectively (Table 2). The spatial risk was severely intensified throughout the landscape and concentrated in the northern part of study area during HEC3 (Figure 7C), where around 45 villages were found to fall within the high-risk zone of HEC (Table 2).
Spatial Variation in HEC Impacts on Human Life and Property
In the seven forest ranges of Keonjhar forest division, 35,900 HEC cases were recorded from approximately 530 villages during 2000–2018. Wherein, the casualty was noted at ∼300 people and additionally hundreds of people were injured by elephants. We observed that human casualty incidents due to HEC had occurred in nearly 50 villages, among which 25 villages were entirely from the Keonjhar district (Figure 8A). The highest casualties were reported from villages in the Keonjhar forest range and its border to Ghatgaon and Champua ranges. Analysis of house damage showed that about 30% of total houses damaged by elephant attacks were completely destroyed and the rest were partially damaged. The house damage incidences were spread all over the study area (Figure 8B) and spatially concentrated in Keonjhar and Champua forest ranges, where the number of highly impacted villages were 22 and 12 respectively. Moreover, crop damage was the most challenging issue in the study area, with 5,140 hectares of cropland being raided and ruined by elephants. The intensity of crop damage which was experienced all over the landscape, was also very high in comparison to human death and house damage (Figure 8C). Champua forest range was the most susceptible to crop damage followed by Telkoi, Keonjhar and BJP forest ranges. Around 35 villages were found to be highly impacted by crop raiding in the Champua forest range, followed by around 25 villages in the Telkoi forest ranges. The Barbil forest range bordering the Champua range recorded the lowest crop raiding incidents in the study area with only a few affected villages.
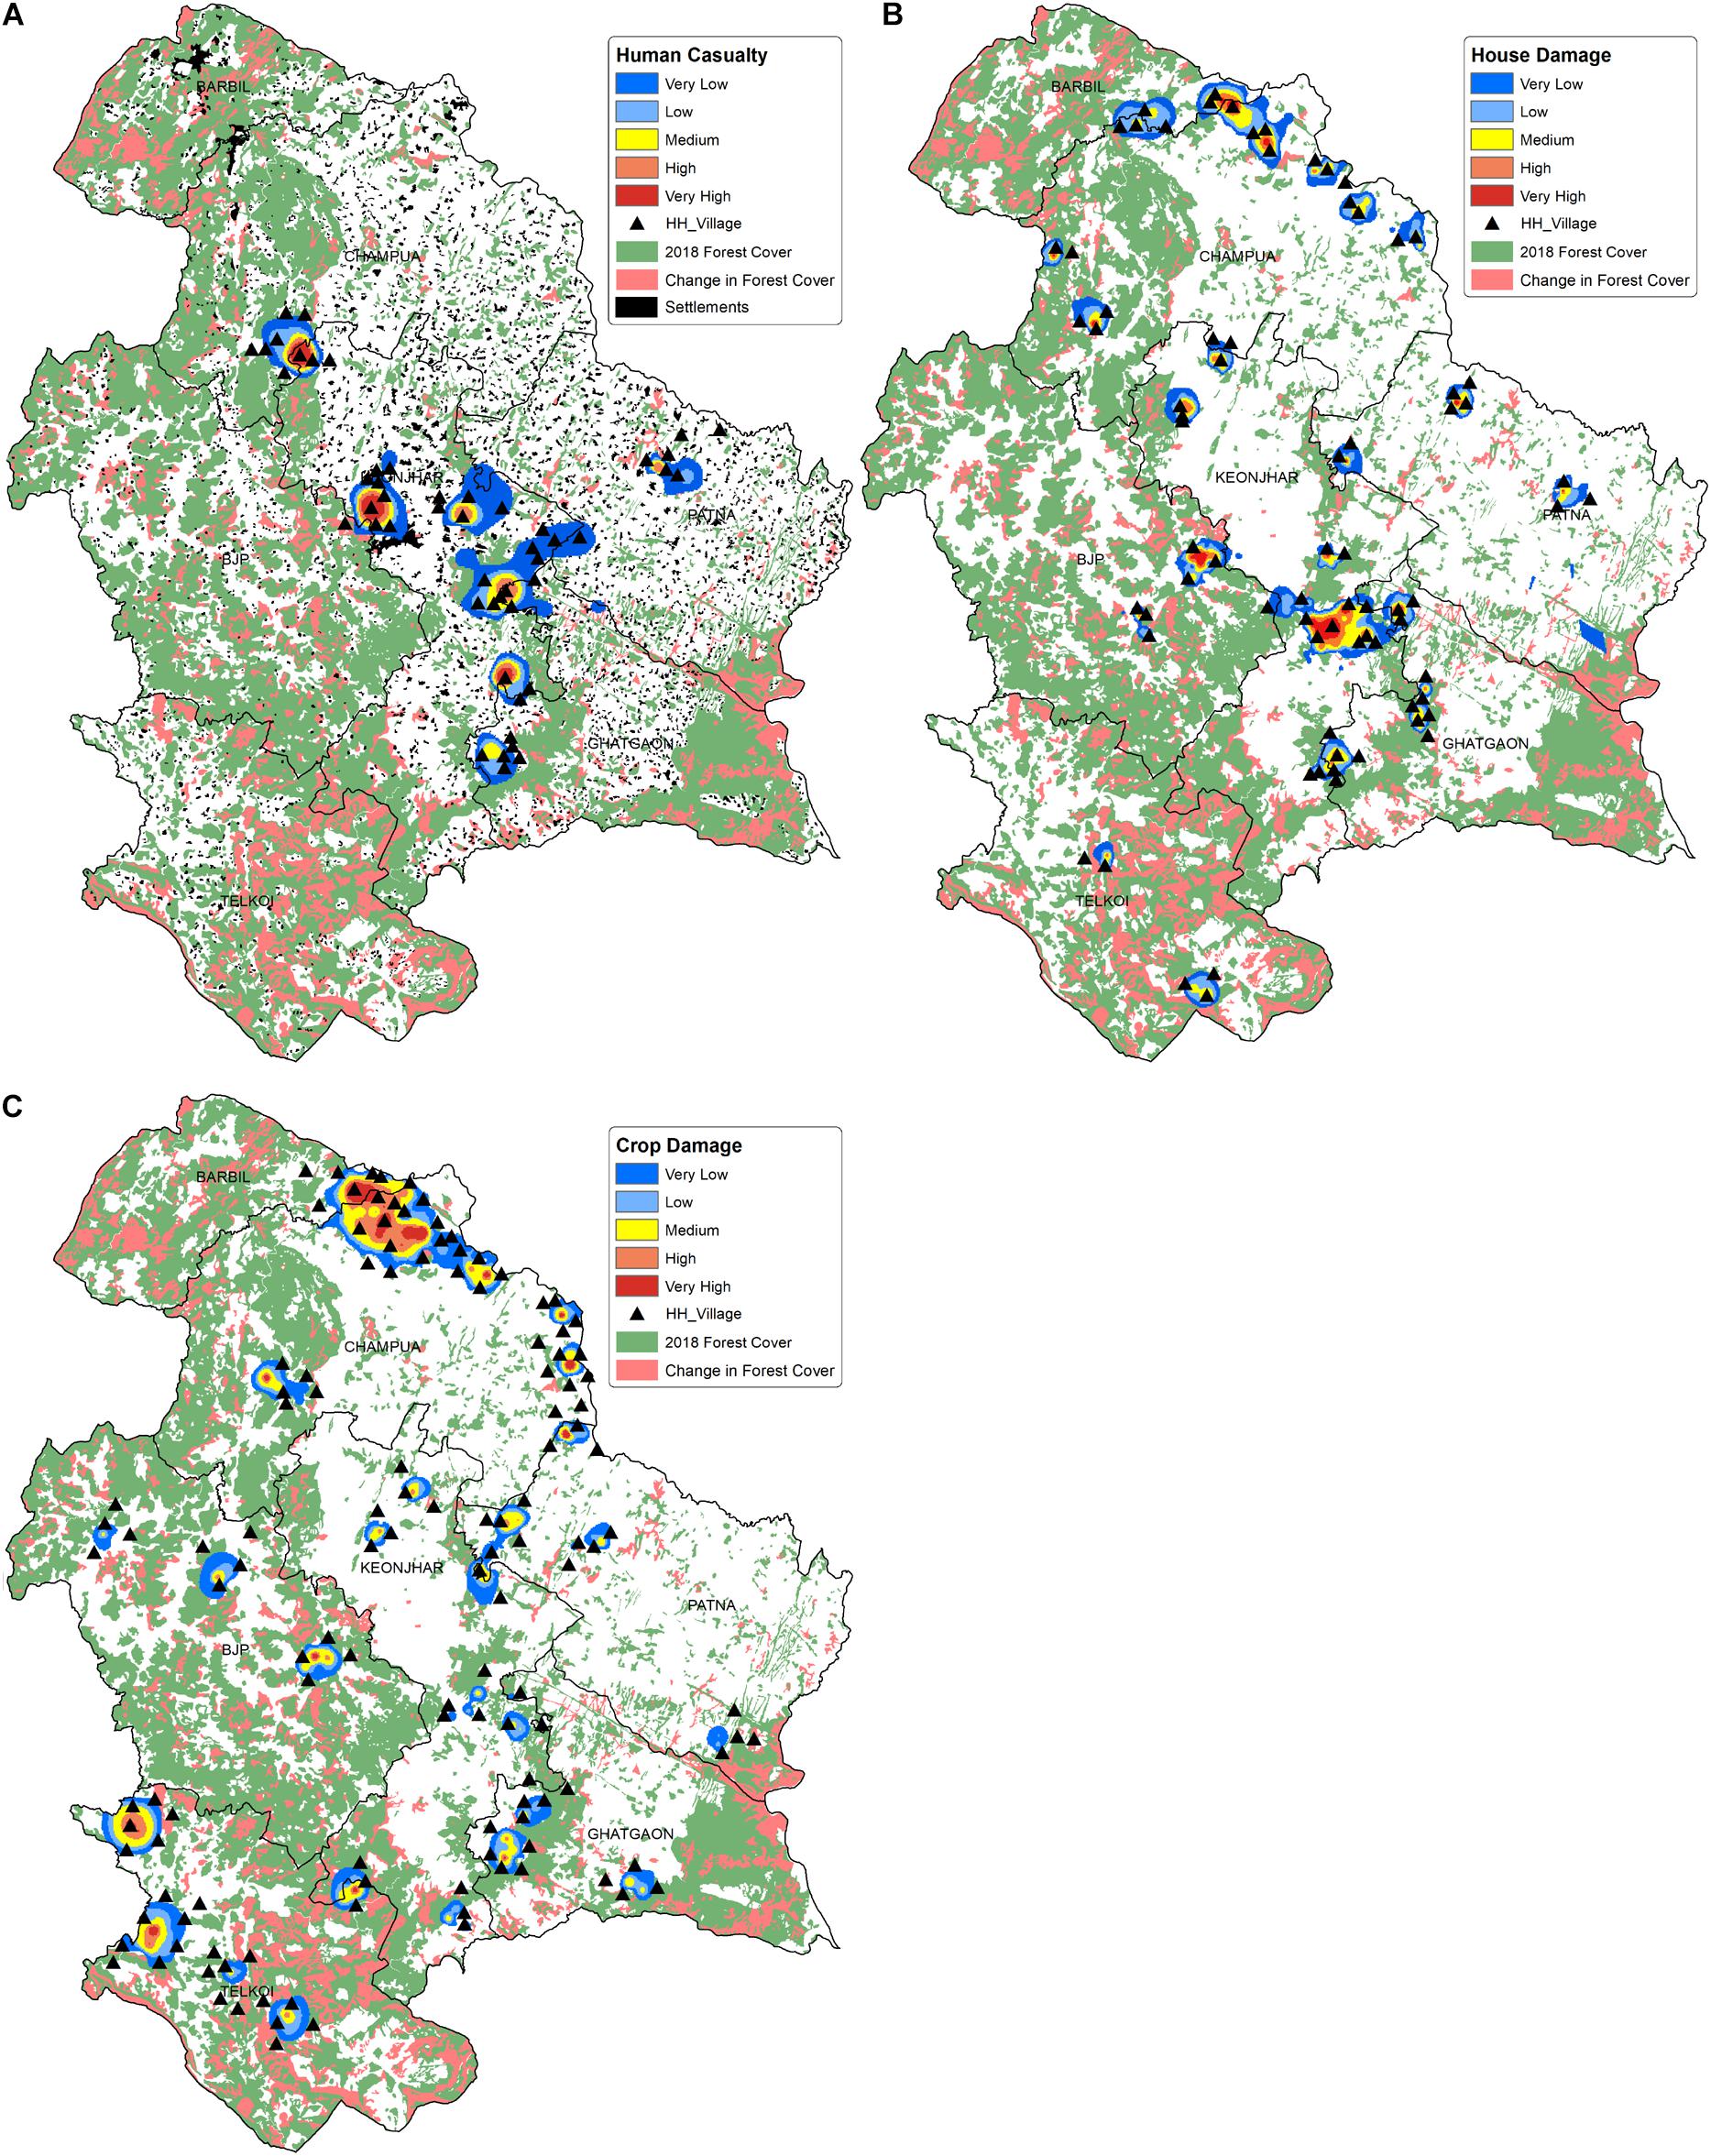
Figure 8. Map illustrating the spatial distribution of HEC impacts on human life and property where (A) Human casualties (death and injury), (B) House damage and (C) crop damage in the study area. The smooth surface layer in the map is showing the intensity of conflict and the triangle-dots are representing the highly impacted villages. The forest cover map of year 2018 is projected in green, while the change in forest cover between 2001 and 2018 is shown in pink. The human settlements are shown in black patches in (A) (Source of Human settlement and forest cover data: Keonjhar Forest Division).
Discussion
Human disturbance and land use change has limited original habitats of elephants (Leimgruber et al., 2003; Choudhury et al., 2008; Naha et al., 2019; Sampson et al., 2019). Converting habitats to cropland, urban spaces and linear construction (road, railway, channels and bridges etc.) influence the natural patterns of elephant movement (Dasgupta and Ghosh, 2015). Such fragmented habitats cause elephants to come into closer proximity and greater contact with human society as elephants seek to fulfill their nutritional, ecological and behavioral needs (Sukumar, 1990). This overlap in the space use between people and elephants lead to more frequent conflict (Wilson et al., 2015; de la Torre et al., 2021). Although past studies have analyzed spatial variation of HEC, conceptual obstacles still exist due to the complex nature of the relationship between HEC and its occurrence in a specific spatial context. Controlling elephant depredation requires proper understanding of the conflict distribution patterns across time and space scales (Gastineau et al., 2019; Williamson et al., 2020) and spatial risk assessment can be a valuable mechanism in locating the HEC hotspots.
Interpretation of Spatial Trends in HEC Prone Zones
The conflict incidences were concentrated to a few regions in the central part of the study area during HEC1, where ∼15,000 people suffered from damage caused by elephants. During HEC2, conflicts spread all over the landscape, putting ∼23,600 people from the Champua and Keonjhar forest ranges in high HEC risk. Around 1.02% (62 km2) of the total area was under high risk of conflict during HEC1 and 1.82% (110 km2) during HEC2, which increased to 5.46% (330 km2) during HEC3. As a result, ∼85 km2 within the Champua forest range became the largest area under high risk during HEC3, where the vulnerable human population to elephant attack was ∼45,500 people. Besides, Keonjhar, Ghatgaon and Patna forest ranges also have shown a steady rise in conflicts since HEC1. Owing to the periodical movement of elephants from neighboring provinces to the northern parts of the study area (Chatterjee, 2016; Das et al., 2018; Kanga et al., 2018), the indiscernible conflict risk in Champua and Barbil ranges during HEC1 had distinctly heightened by HEC2. Barbil forest has an elephant corridor connecting it to a forest reserve in the neighboring province (Jharkhand), which also happens to overlap with rich mineral resources in this area. The elephant range surrounding the corridor and the elephant movement pathways were encroached by mining and subjected to other biotic pressures from villages such as extraction of fuel wood and other forest products (Vihar et al., 2012; Menon et al., 2017). This in turn has led to a higher degree of HEC.
The conflict scenario in and around the central part of the study area has prevailed throughout the 18-year period. The southern extent of Keonjhar forest range is more likely to harbor permanent herds of elephants because it is in close proximity to the current Asian elephant habitat range (Menon et al., 2017). Therefore, the possibility of conflicts remains high due to increased infringement of elephant habitats by agriculture and rural settlements. The rate of declining forest density in the study area (Figure 7) can also be recognized as a factor contributing to the elephant menace due to its impact on shrinking elephant habitats (Vihar et al., 2012). The dense forest cover has been decreased by almost 40% between 1990 and 2000 and by 51% from 2000 to 2012 (Patra and Sethy, 2014; Tripathi et al., 2019), majorly due to mining and agriculture followed by urbanization, timber smuggling (Tripathi et al., 2019), and forest fires. Frequent explosions, transportation of ores and dumping of waste from the mining industry also disturb the tranquility of elephant habitats. Additionally, pollution and drying up of perennial streams (Harichandan et al., 2017) cause elephants to move away from their native territory in search of water. Consequently, elephants are attracted toward easily accessible sources of food and water in the nearby villages, which is leading to frequent conflict with the human society in this landscape.
Interpretation of HEC Impact on Human Life and Property
Crop damage was the most frequent form of HEC, which was spread persistently across the landscape (Figure 8C) predominantly in Champua, Telkoi and Keonjhar forest ranges. The forest covers of these respective ranges have been degraded by 9.5, 11, and 23% from 2001 to 2018, with an overall decline in 18% of the forest cover throughout the whole study area. The forests have been majorly converted to cropland and settlements (Vihar et al., 2012; Patra and Sethy, 2014; Tripathi et al., 2019) creating fragmented habitats which elephants continue to use for their sustenance because of their firm loyalty to their traditional home ranges (Baskaran et al., 1993; Cushman et al., 2005). Besides, cropland was dominant over other land use types in the hotspot regions, where paddy crops hold ∼50% share of crop area (Sahu, 2020) and are highly preferred by elephants over natural forage due to its easy accessibility, nutrition and palatability (Sukumar, 1990; Campos-Arceiz et al., 2009). Therefore, the conversion of elephants’ traditional home ranges into crop lands, along with dietary preferences of elephants cause frequent crop raiding in these hotspots.
The intensity of human casualty was found to be much higher in the central part of the study area (Figure 8A) followed by Champua, Patna and Ghatgaon forest ranges with lower intensities. The decline in forest cover due to human intervention has degraded elephant habitats leading to increased clashes between elephants and people. The higher casualties in the central region can be attributed to high human density (settlements) surrounding the elephant range. However, while the settlements in Patna are dispersed, and its highly fragmented forest patches which are too small to host elephant herds, thereby reducing the chance of casualties due to HEC in that area. Elephant attacks are mostly accidental in nature and driven by the lack of awareness of local residents, who either venture into the forest or settle and cultivate in elephant ranges (Sukumar, 2003; Sahu and Das, 2012; Mishra et al., 2015; Chatterjee, 2016). Also, there seems to be a high recurrence of house damages in Keonjhar and Champua forest ranges compared to other areas. Figure 8B illustrated that the distribution of house damages was majorly concentrated in the fringe zone closer to the forest border. Based on literature, it is more likely that houses located within 200m to 1km of a farmland, water source and/or elephant habitat range are frequently raided due to the higher and easy availability of stored grains, kitchen food and local brew (Chartier et al., 2011; Wilson et al., 2015; Gross et al., 2021).
Strengths and Limitations of the Study
In similar studies, significant variables were used to predict the probability of conflicts by employing grid-based geostatistical method (Sitati et al., 2003; Chen et al., 2016) and machine learning techniques (Maxent) (Naha et al., 2019). Taking the scale of study area and limited availability of high-resolution variables into consideration, we used a flexible scan statistic along with Moran’s I and kernel density to identify the risk prone zones to elephant attack. This upgrades the conventional method of evaluating the number of villages in HEC affected areas proposed by Gubbi (2012), by combining SCWs and LISA cluster map, in addition to assessing the human population vulnerable to elephant attack in these hotspots. While studies usually considered either overall HEC (Gubbi, 2012; Naha et al., 2019) or a particular type of HEC (Sitati et al., 2003; Wilson et al., 2015; Chen et al., 2016) to analyze the spatial aspect, we derived hotspots for overall HEC as well as different types of HEC, separately.
A major limitation of this study is reliance on compensation data as it might not reflect actual intensity of conflict (Karanth et al., 2018). All the victims of HEC might not have claimed compensation and there could also be instances where damage due to other wildlife are reported as damage from elephants. These instances can lead to a false estimation and mislead the interpretation outcome. Also, compensation schemes vary on factors like; economic status of the country, political scenario, degree of awareness, literacy and sometimes also gender, religion etc. (Agarwala et al., 2010; Karanth et al., 2012, 2013, 2018; Manral et al., 2016; Johnson et al., 2018), which could restrict voluntary reporting by victims. To overcome this, future studies can include surveys to compare the actual scenario with the estimations obtained from the hotspots as well as in the least/not affected regions. The absence of HEC spatial locations was another limitation, which might have led to some spatial error in estimating hotspot zones, resulting in a small degree of variation on the ground level. However, as the study objective was to map the HEC hotspot regions/villages, the precise location of HEC incidences were not required. Additionally, to overcome this spatial error in future studies it is advisable to conduct a preliminary survey to collect the actual locations of HEC for error estimation. Although, compensation records are prone to the above-mentioned errors, in the absence of primary data they are a faster and effective way for assessing the levels of conflict intensity (Sengupta et al., 2020) of a landscape. It also helps to address the lack of primary data availability since there is barely any published information in the study area at the village scale.
Implications and Recommendations
Analyzing spatial patterns of HEC and identifying high risk areas is important for policy formulation, HEC management and planning. It provides better context of the risks associated with the identified hotspots which helps to maximize the effectiveness and minimize the cost of HEC management, by ensuring efficient resource allocation to these zones. Finding hotspots for different types of HEC helps in devising streamlined compensation policies, whilst expanding the scope of mitigation measures. For instance, human casualty hotspots can be prioritized over property or crop damage hotspots when mitigation funds are scarce, as the cost of human casualty precedes cost of property or crop damage (Gulati et al., 2021). Furthermore, outcomes of this study will help forest administrations to develop location-based strategies and determine suitable locations to implement mitigation plans such as early warning systems, bio or non-lethal fencing, and restoration of wildlife habitats and corridors. Formulation of spatial baseline data on HEC hotspots, as demonstrated in our study, could contribute to improvement of regional databases which may further help in catalyzing larger analyses and collaborations.
This study makes the following recommendations based on the interpretations of its outcomes. The limitations of this study have brought to our understanding that having access to a detailed long-term dataset is key to a more dynamic analysis. Therefore, we recommend upgrading and strengthening HEC data collection protocols by adding the geolocation and other relevant information such as time of incidence and characteristics of species etc., which improves the utility of collected data in resolving conservation issues. Also, the data collection procedures should be reviewed and validated periodically by conducting ground-level surveys. As a proactive conflict management strategy toward coexistence, it is important to spread awareness on the compensation and insurance schemes (Merkle et al., 2011), which will also increase the reporting rate of HEC incidences by the victims. Apart from compensation schemes, we advocate for government collaborations with the forest division in promoting more community-based initiatives such as village response teams in vulnerable regions.
Before initiating any mining/industrial projects effective land-use planning should be carried out, where the changes in the land-use type and its consequences on elephant movement behavior along with their routes are considered. The hotspot map developed in our study can be considered as a baseline for such land use planning activities and it can also be used by the wildlife authorities in prioritizing different areas for promoting elephant conservation initiatives in this landscape. Future mitigation plans should focus on assessing elephant habitat utilization and reconfiguring their movement pathways to avoid further encounters with human society. Given the increasing trend in HEC and factors influencing elephant movement behavior (Chiyo et al., 2005) there is scope for future research in determining the significant factors affecting HEC distribution. Conservationists can further probe into factors (landscape characteristics, proximity between the conflict sites and elephant habitats etc.) that influence a site’s vulnerability to HEC. Future studies can also focus on potential inequalities in HEC by examining the socio-demographic status of people living within the identified high-risk zones compared to people outside.
Data Availability Statement
The datasets presented in this article are not readily available because with the permission of District Forest Department we can share the data. Requests to access the datasets should be directed to Divisional Forest Officer, Wildlife Division, Keonjhar, Govt. of Odisha - India, Email: cnRpLW9yaUBuaWMuaW4= Phone: 91- 674-2391356 Fax: 91- 674-2390818.
Ethics Statement
The animal study was reviewed and approved by the Mr. Santosh Joshi (Indian Forest service), District Forest Officer, Keonjhar Forest Department, Odisha, India.
Author Contributions
BT developed the theory. XL supervised the finding of this work and manuscript improvement. XL, BT, and NC conceived the framework and methodology of the study. BT, SK, and WW provided a factual review and helped write the manuscript. BT, SK, WW, and KM performed data collection, pre-processing, spatial analysis, and validation. MS, LK, and BT did a major discussion of results and recommendation. All the authors have given their contributions in many ways and provided essential feedback to shape the research.
Conflict of Interest
The authors declare that the research was conducted in the absence of any commercial or financial relationships that could be construed as a potential conflict of interest.
Funding
BT is a Doctoral Fellow at Tsinghua University, and would like to thank China Scholarship Council (CSC) for supporting his research.
Acknowledgments
The authors also thank Santosh Joshi (Indian Forest Service), Divisional Forest Officer Keonjhar, for granting the necessary permission to work in this study area. The authors gratefully acknowledge the staff involved in data collection. Moreover, this study was partially benefited by the project #29746-1, supported by the Rufford Foundation, and executed by BT in collaboration with the Service Association for Rural Progress (SARP) NGO, Keonjhar. The authors would like to thank the editor and the reviewers for their valuable comments and suggestions.
Supplementary Material
The Supplementary Material for this article can be found online at: https://www.frontiersin.org/articles/10.3389/fevo.2021.640624/full#supplementary-material
References
Acharya, K. P., Paudel, P. K., Neupane, P. R., and Köhl, M. (2016). Human-Wildlife Conflicts in Nepal: Patterns of Human Fatalities and Injuries Caused by Large Mammals. PLoS One 11:e0161717. doi: 10.1371/journal.pone.0161717
Agarwala, M., Kumar, S., Treves, A., and Naughton-Treves, L. (2010). Paying for wolves in Solapur, India and Wisconsin, USA: comparing compensation rules and practice to understand the goals and politics of wolf conservation. Biol. Conserv. 143, 2945–2955. doi: 10.1016/j.biocon.2010.05.003
Alemu, K., Worku, A., and Berhane, Y. (2013). Malaria Infection Has Spatial, Temporal, and Spatiotemporal Heterogeneity in Unstable Malaria Transmission Areas in Northwest Ethiopia. PLoS One 8:e79966. doi: 10.1371/journal.pone.0079966
Anselin, L. (1995). Local Indicators of Spatial Association—LISA. Geograph. Anal. 27, 93–115. doi: 10.1111/j.1538-4632.1995.tb00338.x
Areias, C., Briz, T., and Nunes, C. (2015). Pulmonary tuberculosis space–time clustering and spatial variation in temporal trends in Portugal, 2000–2010: an updated analysis. Epidemiol. Infect. 143, 3211–3219. doi: 10.1017/S0950268815001089
Bailey, T. C., and Gatrell, A. C. (1995). Interactive spatial data analysis. England: Longman Scientific & Technical Essex.
Baruch-Mordo, S., Breck, S. W., Wilson, K. R., and Theobald, D. M. (2008). Spatiotemporal Distribution of Black Bear-Human Conflicts in Colorado. USA. J. Wildlife Manag. 72, 1853–1862. doi: 10.2193/2007-442
Baskaran, N., Balasubramanian, M., Swaminathan, S., and Desai, A. A. (1993). “Home range of elephants in the Nilgiri Biosphere Reserve, South India,” in A week with elephants: Proceedings of the International Seminar on the Conservation of Asian Elephant, eds J. C. Daniel and H. S. Datye (Bombay, India: Bombay Natural History Society), 296–313.
Campos-Arceiz, A., Takatsuki, S., Ekanayaka, S. K., and Hasegawa, T. (2009). The Human-Elephant Con ict in Southeastern Sri Lanka: Type of Damage, Seasonal Patterns, and Sexual Differences in the Raiding Behavior of Elephants Recent Publications on Asian Elephants 50 News Briefs. Centre Conserv. Res. 61:5.
Williamson, C. N., Gilbert, M. A., Lischka, S., Prugh, S. A., Lawler, L. R., Metcalf, J. J., et al. (2020). Integrated spatial analysis for human-wildlife coexistence in the American West. Environ. Res. Lett. 15:021001. doi: 10.1088/1748-9326/ab60e1
Census (2011). Keonjhar District Census 2011. Available online at: http://www.census2011.co.in/district.php (accessed July 20, 2020).
Chartier, L., Zimmermann, A., and Ladle, R. J. (2011). Habitat loss and human–elephant conflict in Assam, India: Does a critical threshold exist? Oryx 45, 528–533. doi: 10.1017/s0030605311000044
Chatterjee, N. D. (2016). Man-Elephant Conflict: A Case Study from Forests in West Bengal, India. New York, NY: Springer.
Chiyo, P. I., Cochrane, E. P., Naughton, L., and Basuta, G. I. (2005). Temporal patterns of crop raiding by elephants: a response to changes in forage quality or crop availability? Afr. J. Ecol. 43, 48–55. doi: 10.1111/j.1365-2028.2004.00544.x
Chen, Y., Marino, J., Chen, Y., Tao, Q., Sullivan, C. D., Shi, K., et al. (2016). Predicting Hotspots of Human-Elephant Conflict to Inform Mitigation Strategies in Xishuangbanna. Southwest China. PLoS One 11:e0162035. doi: 10.1371/journal.pone.0162035
Choudhury, A., Lahiri Choudhury, D. K., Desai, A., Duckworth, J., Easa, P. S., Johnsingh, A. J., et al. (2008). he IUCN Red List of Threatened Species 2008. The IUCN Red List of Threatened Species. Elephas Maxim. 2008:8235.
Cushman, S. A., Chase, M., and Griffin, C. (2005). Elephants in space and time. Oikos 109, 331–341. doi: 10.1111/j.0030-1299.2005.13538.x
Das, S., Chockalingam, J., Mondal, S., and Sharma, R. (2018). Geospatial Modelling of Human-Elephant Conflicts in Dalma Wildlife Santuary and its Surroundings in India. New York, NY: Nova Science Publishers, Inc, 77–92.
Dasgupta, S., and Ghosh, A. K. (2015). Elephant–railway conflict in a biodiversity hotspot: Determinants and perceptions of the conflict in Northern West Bengal. India Hum. Dimens. Wildlife 20, 81–94. doi: 10.1080/10871209.2014.937017
de la Torre, J. A., Wong, E. P., Lechner, A. M., Zulaikha, N., Zawawi, A., Abdul-Patah, P., et al. (2021). There will be conflict – agricultural landscapes are prime, rather than marginal, habitats for Asian elephants. Anim. Conserv. 2021:12668. doi: 10.1111/acv.12668
Dickman, A. J. (2010). Complexities of conflict: the importance of considering social factors for effectively resolving human–wildlife conflict. Anim. Conserv. 13, 458–466. doi: 10.1111/j.1469-1795.2010.00368.x
Duczmal, L., Kulldorff, M., and Huang, L. (2006). Evaluation of Spatial Scan Statistics for Irregularly Shaped Clusters. J. Computat. Graph. Stat. 15, 428–442. doi: 10.1198/106186006X112396
Fahrig, L. (2003). Effects of Habitat Fragmentation on Biodiversity. Annu. Rev. Ecol. Evol. Syst. 34, 487–515. doi: 10.1146/annurev.ecolsys.34.011802.132419
Gastineau, A., Robert, A., Sarrazin, F., Mihoub, J., and Quenettea, P. (2019). Spatiotemporal depredation hotspots of brown bears, Ursus arctos, on livestock in the Pyrenees. France Biol. Conserv. 238:108210. doi: 10.1016/j.biocon.2019.108210
Ge, E., Zhang, X., Wang, X., and Wei, X. (2016). Spatial and temporal analysis of tuberculosis in Zhejiang Province, China, 2009-2012. Infect. Dis. Pover. 5:11. doi: 10.1186/s40249-016-0104-2
Getis, A., and Aldstadt, J. (2004). Constructing the Spatial Weights Matrix Using a Local Statistic. Geograph. Anal. 36, 90–104. doi: 10.1111/j.1538-4632.2004.tb01127.x
Gross, E. M., Lahkar, B. P., Subedi, N., Nyirenda, V. R., Klebelsberg, E., and Jakoby, O. (2021). Elephants in the village: Causes and consequences of property damage in Asia and Africa. Conserv. Sci. Pract. 3:e343. doi: 10.1111/csp2.343
Gubbi, S. (2012). Patterns and correlates of human–elephant conflict around a south Indian reserve. Biological Conservation 148, 88–95. doi: 10.1016/j.biocon.2012.01.046
Gulati, S., Karanth, K. K., Le, A. N., and Noack, F. (2021). Human casualties are the dominant cost of human–wildlife conflict in India. Proc. Natl. Acad. Sci. 118:8. doi: 10.1073/pnas.1921338118
Harichandan, A., Patra, H. S., and Sethy, K. M. (2017). Evaluation of Water Quality of Local Streams at Gandhamardan Iron Mines, Suakati, Keonjhar District of Odisha, India. J. Pollut. Eff. Cont. 5:199. doi: 10.4176/2375-4397.1000199
Hedges, S., Tyson, M. J., Sitompul, A. F., Kinnaird, M. F., Gunaryadi, D., and Aslan. (2005). Distribution, status, and conservation needs of Asian elephants (Elephas maximus) in Lampung Province, Sumatra, Indonesia. Biolog. Conserv. 124, 35–48. doi: 10.1016/j.biocon.2005.01.004
Huang, L., Pickle, L. W., and Das, B. (2008). Evaluating spatial methods for investigating global clustering and cluster detection of cancer cases. Stat. Med. 27, 5111–5142. doi: 10.1002/sim.3342
Jackson, M. C., Huang, L., Luo, J., Hachey, M., and Feuer, E. (2009). Comparison of tests for spatial heterogeneity on data with global clustering patterns and outliers. Intern. J. Health Geogr. 8:55. doi: 10.1186/1476-072X-8-55
Jadhav, S., and Barua, M. (2012). The Elephant Vanishes: Impact of human–elephant conflict on people’s wellbeing. Health Place 18, 1356–1365. doi: 10.1016/j.healthplace.2012.06.019
James, G., Witten, D., Hastie, T., and Tibshirani, R. (2013). An introduction to statistical learning. New York, NY: Springer.
Johnson, M., Karanth, K., and Weinthal, E. (2018). Compensation as a policy for mitigating human-wildlife conflict around four protected areas in Rajasthan. India. Conserv. Soc. 16, 305–319. doi: 10.4103/cs.cs_17_1
Kanga, S., Pandey, A., Shaheen, A., and Singh, S. K. (2018). Geospatial Modelling to Assess Human Elephant Conflict and Corridor Mapping in Palamau Tiger Reserve, Jharkhand (India). Manag. J. Future Eng. Technol. 13:24. doi: 10.26634/jfet.13.3.14227
Karanth, K., Gopalaswamy, A., DeFries, R., and Ballal, N. (2012). Assessing patterns of conflict risk and compensation distribution around a Central Indian protected area. PLoS One 7:e50433. doi: 10.1371/journal.pone.0050433
Karanth, K. K., Gopalaswamy, A. M., Prasad, P. K., and Dasgupta, S. (2013). Patterns of human–wildlife conflicts and compensation: Insights from Western Ghats protected areas. Biol. Conserv. 166, 175–185. doi: 10.1016/j.biocon.2013.06.027
Karanth, K. K., Gupta, S., and Vanamamalai, A. (2018). Compensation Payments, Procedures and Policies towards Human-Wildlife Conflict Management: Insights from India. Biol. Conserv. 227, 383–389. doi: 10.1016/j.biocon.2018.07.006
Kelsall, J. E., and Diggle, P. J. (1995). Non-parametric estimation of spatial variation in relative risk. Stat. Med. 14, 2335–2342. doi: 10.1002/sim.4780142106
Kitratporn, N., and Takeuchi, W. (2020). Spatiotemporal Distribution of Human–Elephant Conflict in Eastern Thailand: A Model-Based Assessment Using News Reports and Remotely Sensed Data. Remote Sens. 12:90. doi: 10.3390/rs12010090
Kulldorff, M. (1997). A spatial scan statistic. Comm. Stat. Theory Methods 26, 1481–1496. doi: 10.1080/03610929708831995
Kulldorff, M. (2013). SaTScan v9. 2 64-bit: software for the spatial and space-time scan statistics. Bos ton, MA: Harvard Medical School and Information Management Services, Inc.
Leimgruber, P., Gagnon, J., Wemmer, C., Kelly, D., Songer, M. A., and Selig, E. (2003). Fragmentation of Asia’s remaining wildlands: implications for Asian elephant conservation in Animal conservation forum. Cambridge, MA: Cambridge University Press, 347–359.
Li, W., Liu, P., Guo, X., Wang, L., Wang, Q., Yu, Y., et al. (2018). Human-elephant conflict in Xishuangbanna Prefecture, China: Distribution, diffusion, and mitigation. Glob. Ecol. Conserv. 16:e00462. doi: 10.1016/j.gecco.2018.e00462
Logan, J. R., and Martinez, M. J. (2018). The Spatial Scale and Spatial Configuration of Residential Settlement: Measuring Segregation in the Postbellum South. Am. J. Sociol. 123, 1161–1203. doi: 10.1086/694652
Ma, Y., Yin, F., Zhang, T., Zhou, X. A., and Li, X. (2016). Selection of the Maximum Spatial Cluster Size of the Spatial Scan Statistic by Using the Maximum Clustering Set-Proportion Statistic. PLoS One 11:e0147918. doi: 10.1371/journal.pone.0147918
Manral, U., Sengupta, S., Hussain, S., Rana, S., and Badola, R. (2016). Human wildlife conflict in India: a review of economic implication of loss and preventive measures. Indian Forester 142, 928–940.
Menon, V., Tiwari, S. K., Kyarong, S., Ganguly, U., and Sukumar, R. (2017). Right of passage: elephant corridors of India. Conserv. Refer. Series 31:4.
Merkle, J. A., Krausman, P. R., and Booth, M. M. (2011). Behavioral and attitudinal change of residents exposed to human-bear interactions. Ursus 22, 74–83. doi: 10.2192/ursus-d-10-00010.1
Mishra, S. R., Sethy, J., and Bisht, H. K. (2015). Study on Human-Elephant Conflict in Baripada Division of, Mayurbhanja, Odisha, India. J. Wildlife Res. 3, 21–26.
MoEF (2010). Government of India Ministry of Environment and Forest New Delhi-110003. Indira Paryavaran Bhavan: MoEF.
MoEF (2012). Government of India Ministry of Environment and Forest New Delhi-110003. Indira Paryavaran Bhavan: MoEF.
MoEF, and CC (2017). Synchronized elephant population estimation: India 2017. Project Elephant Division, Ministry of Environment, Forest and Climate Change, Government of India. Indira Paryavaran Bhavan: MoEF.
MoEF, and CC. (2018). Government of India Ministry of Environment, Forest and Climate Change New Delhi-110003. Indira Paryavaran Bhavan: MoEF.
Mohanty, N., and Mishra, S. P. (2017). Human-elephant conflict: a case study from bamra (WL) forest division, Sambalpur, Odisha, India. American-Eurasian J. Agric. & Environ. Sci. 17, 432–439. doi: 10.5829/idosi.aejaes.2017.432.439
Morzillo, A. T., de Beurs, K. M., and Martin-Mikle, C. J. (2014). A conceptual framework to evaluate human-wildlife interactions within coupled human and natural systems. Ecol. Soc. 19:3.
Naha, D., Sathyakumar, S., Dash, S., Chettri, A., and Rawat, G. (2019). Assessment and prediction of spatial patterns of human-elephant conflicts in changing land cover scenarios of a human-dominated landscape in North Bengal. PloS one 14:e0210580. doi: 10.1371/journal.pone.0210580
Nyhus, P. J. (2016). Human–Wildlife Conflict and Coexistence. Annu. Rev. Env. Resour. 41, 143–171. doi: 10.1146/annurev-environ-110615-085634
Patra, H., and Sethy, K. (2014). Assessment of impact of opencast mine on surrounding forest: a case study from Keonjhar district of Odisha, India. J. Env. Res. Dev. 9, 249–254.
Redpath, S. M., Bhatia, S., and Young, J. (2015). Tilting at wildlife: reconsidering human–wildlife conflict. Oryx 49, 222–225. doi: 10.1017/S0030605314000799
Ripley, B. D. (1988). Statistical inference for spatial processes. Cambridge, MA: Cambridge University Press.
Rushton, S. P., Wood, D. J. A., Lurz, P. W. W., and Koprowski, J. L. (2006). Modelling the population dynamics of the Mt. Graham red squirrel: Can we predict its future in a changing environment with multiple threats? Biolog. Conserv. 131, 121–131. doi: 10.1016/j.biocon.2006.02.010
Sahu, H. K., and Das, S. K. (2012). Human-Elephant Conflict in Mayurbhanj Elephant Reserve Orissa. India Gajah 36, 17–20.
Sahu, S. (2020). Aquifer mapping and management plan of keonjhar block in keonjhar district. Odisha. India: Central Ground Water Board.
Saif, O., Kansky, R., Palash, A., Kidd, M., and Knight, A. T. (2019). Costs of coexistence: understanding the drivers of tolerance towards Asian elephants Elephas maximus in rural Bangladesh. Oryx 2019, 1–9.
Sampson, C., Leimgruber, P., Rodriguez, S., McEvoy, J., Sotherden, E., and Tonkyn, D. (2019). Perception of Human–Elephant Conflict and Conservation Attitudes of Affected Communities in Myanmar. Trop. Conserv. Sci. 12:1940082919831242.
Sengupta, A., Binoy, V. V., and Radhakrishna, S. (2020). Human-Elephant Conflict in Kerala, India: a Rapid Appraisal Using Compensation Records. Hum. Ecol. 48, 101–109. doi: 10.1007/s10745-020-00128-6
Shaffer, L. J., Khadka, K. K., Van Den Hoek, J., and Naithani, K. J. (2019). Human-Elephant Conflict: A Review of Current Management Strategies and Future Directions. Front. Ecol. Evol. 6:235. doi: 10.3389/fevo.2018.00235
Sitati, N. W., Walpole, M. J., Smith, R. J., and Leader-Williams, N. (2003). Predicting spatial aspects of human-elephant conflict. J. Appl. Ecol. 40, 667–677. doi: 10.1046/j.1365-2664.2003.00828.x
Sukumar, R. (1990). Ecology of the Asian elephant in southern India. II. Feeding habits and crop raiding patterns. J. Trop. Ecol. 6, 33–53. doi: 10.1017/s0266467400004004
Sukumar, R. (2003). The Living Elephants: Evolutionary Ecology, Behaviour, and Conservation. Oxford: Oxford University Press.
Sukumar, R., Varma, S., Tiwari, S. K., and Menon, V. (2016). “Sustainable landscapes and corridors to conserve Asian elephants in India,” in ‘Tropical Conservation: Perspectives on Local and Global Priorities’, eds A. A. Aguirre and R. Sukumar (Oxford: Oxford University Press), 29–39.
Thakur, A. K., Yadav, D. K., and Jhariya, M. K. (2016). Socio-economic status of human-elephant conflict: Its assessment and solutions. J. Appl. Nat. Sci. 8, 2104–2110. doi: 10.31018/jans.v8i4.1098
Tischendorf, L., and Fahrig, L. (2000). On the usage and measurement of landscape connectivity. Oikos 90, 7–19. doi: 10.1034/j.1600-0706.2000.900102.x
Tripathi, R., Moharana, K. C., Nayak, A. D., Dhal, B., Shahid, M., Mondal, B., et al. (2019). Ecosystem services in different agro-climatic zones in eastern India: impact of land use and land cover change. Env. Monit. Assess. 191:98.
Vihar, S., Baripada, S., Palei, N., Palei, H., and Sahu, H. (2012). NORTH ORISSA UNIVERSITY Human-elephant conflict in Keonjhar. Odisha: implications for conservation.
Wang, W. L., Wang, H. J., Deng, Y., Song, T., Lan, J. M., Wu, G. Z., et al. (2016). Serological Study of An Imported Case of Middle East Respiratory Syndrome and His Close Contacts in China, 2015. Biomed. Env. Sci. 29, 219–223.
Wilson, S., Davies, T., Hazarika, N., and Zimmermann, A. (2015). Understanding spatial and temporal patterns of human–elephant conflict in Assam. India. Oryx 49, 140–149. doi: 10.1017/S0030605313000513
Keywords: human-elephant conflict (HEC), spatial pattern analysis, populations at HEC risk, HEC hotspot mapping, trends in spatial risk, types of HEC
Citation: Tripathy BR, Liu X, Songer M, Kumar L, Kaliraj S, Chatterjee ND, Wickramasinghe WMS and Mahanta KK (2021) Descriptive Spatial Analysis of Human-Elephant Conflict (HEC) Distribution and Mapping HEC Hotspots in Keonjhar Forest Division, India. Front. Ecol. Evol. 9:640624. doi: 10.3389/fevo.2021.640624
Received: 11 December 2020; Accepted: 11 May 2021;
Published: 07 June 2021.
Edited by:
Caroline Dingle, The University of Hong Kong, ChinaReviewed by:
Ahimsa Campos-Arceiz, Center for Integrative Conservation, Xishuangbanna Tropical Botanical Garden, Chinese Academy of Sciences, ChinaNagarajan Baskaran, A.V.C. College, India
Copyright © 2021 Tripathy, Liu, Songer, Kumar, Kaliraj, Chatterjee, Wickramasinghe and Mahanta. This is an open-access article distributed under the terms of the Creative Commons Attribution License (CC BY). The use, distribution or reproduction in other forums is permitted, provided the original author(s) and the copyright owner(s) are credited and that the original publication in this journal is cited, in accordance with accepted academic practice. No use, distribution or reproduction is permitted which does not comply with these terms.
*Correspondence: Xuehua Liu, eHVlaHVhLWhqeEB0c2luZ2h1YS5lZHUuY24=