
94% of researchers rate our articles as excellent or good
Learn more about the work of our research integrity team to safeguard the quality of each article we publish.
Find out more
ORIGINAL RESEARCH article
Front. Ecol. Evol., 28 May 2021
Sec. Ecophysiology
Volume 9 - 2021 | https://doi.org/10.3389/fevo.2021.638568
 Thure E. Cerling1*
 Stefano M. Bernasconi2
 Lino S. Hofstetter2
 Madalina Jaggi2Fabia Wyss3Claudia Rudolf von Rohr4
 Marcus Clauss5
Breath and diet samples were collected from 29 taxa of animals at the Zurich and Basel Zoos to characterize the carbon isotope enrichment between breath and diet. Diet samples were measured for δ13C and breath samples for CH4/CO2 ratios and for the respired component of δ13C using the Keeling plot approach. Different digestive physiologies included coprophagous and non-coprophagous hindgut fermenters, and non-ruminant and ruminant foregut fermenters. Isotope enrichments from diet to breath were 0.8 ± 0.9‰, 3.5 ± 0.8‰, 2.3 ± 0.4‰, and 4.1 ± 1.0‰, respectively. CH4/CO2 ratios were strongly correlated with isotope enrichments for both hindgut and foregut digestive strategies, although CH4 production was not the sole reason for isotope enrichment. Average CH4/CO2 ratios per taxon ranged over several orders of magnitude from 10–5 to 10–1. The isotope enrichment values for diet-breath can be used to further estimate the isotope enrichment from diet-enamel because Passey et al. (2005b) found a nearly constant isotope enrichment for breath-enamel for diverse mammalian taxa. The understanding of isotope enrichment factors from diet to breath and diet to enamel will have important applications in the field of animal physiology, and possibly also for wildlife ecology and paleontology.
The carbon-13 isotope enrichment from diet to tissue is key for using stable isotopes in diet studies, and the enrichment from diet to enamel for both modern and fossil diet studies. Lee-Thorp and Van der Merwe (1991) and Wang and Cerling (1994) showed that bioapatite as tooth enamel was far less susceptible to diagenesis than bioapatite as bone, and thus enamel can be used for paleodiet studies. A few studies have evaluated the enrichment from diet to bioapatite (either as bone or as tooth enamel) using modern mammals and the published range of values is from 9 to 16‰.
DeNiro and Epstein (1978) evaluated enrichments to a variety of tissues including bioapatite (bone) for a laboratory mouse (Mus musculus) on several formulated diets; they found an enrichment of about 10‰ from bulk diet to bone (bioapatite). Krueger and Sullivan (1984) suggested that the isotope enrichment from diet to bioapatite in herbivores should be about 12‰; their reasoning was based on the oxidation of carbohydrates to energy during respiration (CH2O = CO2 + H2O with complete isotope transfer from substrate (CH2O) to product (CO2) and the known equilibrium isotope fractionations in the CO2-H2CO3°-HCO3–-CO3–2 system. Ambrose and Norr (1993), also working with rodents (Rattus norvevicus), found the diet to bioapatite enrichment to be 9.4‰ across a variety of carbohydrate—protein mixtures and concluded that bioapatite faithfully records the δ13C of bulk diet and is not skewed toward the carbohydrate component. Tieszen and Fagre (1993) also used laboratory mice (Mus musculus) on a formulated laboratory diet and found an isotope enrichment of 9.1‰ for the δ13C value of diet to bone; they also measured breath CO2 and found an isotope enrichment of -1.2‰ from diet to breath.
Lee-Thorp and Van der Merwe (1987) and Lee-Thorp et al. (1989) found that large African herbivores had an isotope enrichment of 12‰ for diet to bioapatite based on comparison of collagen to bioapatite and on assumed δ13C value for C3 and C4 vegetation. Cerling and Harris (1999) studied a variety of ecosystems in East Africa and concluded that ruminant herbivores had an isotope enrichment of 14‰ for diet to bioapatite (enamel) and suggested that large non-ruminant herbivores may have a somewhat smaller enrichment. Following on these studies, Passey et al. (2005b) conducted feeding trials of herbivores over a range of sizes and digestive physiologies in which they measured the δ13C of diet, breath CO2, and tooth enamel; they concluded that the isotope enrichment between breath and enamel was constant at about 11.5‰ across different taxa, but that the diet-breath enrichment varied from −1 to + 3‰. Passey et al. (2005b) suggested that methane production, such as in ruminants with the largest diet-breath enrichment, should be considered as a possible reason for different diet-breath enrichment values. Recently, Tejada-Lara et al. (2018) showed correlations between body size and isotope enrichment from diet to enamel, and Codron et al. (2018) showed that shifts in collagen-carbonate spacing in herbivores are consistent with higher CH4 emissions for ruminants compared to non-ruminants.
Taken together, there are very few explicit studies to determine carbon isotope enrichment measurements for breath-diet or enamel-diet. Those studies include several rodents, one lagomorph, two sloths, domestic cattle, and domestic pigs. The purpose of this paper is to further evaluate the isotope enrichment in mammals by considering digestive physiology as a possible factor in understanding the diet to enamel isotope enrichment, and especially to see whether methane production has a significant role in determining the diet to enamel isotope enrichment factors for different mammals.
In this study we evaluate herbivores of different digestive physiologies for diet to breath isotope enrichment as related to methane/carbon dioxide (CH4/CO2) ratios in breath. We studied the following digestive physiologies: ruminant foregut fermenter, non-ruminant foregut fermenter, coprophagous hindgut fermenter, and non-coprophagous hindgut fermenter. We compare isotope enrichments values to CH4/CO2 production ratios and also compare the enrichment to body size for each of the digestive physiologies.
Breath and atmosphere samples were collected in 60 mL syringes with a valve to prevent atmosphere exchange after collection. Forty mL samples were injected into the in-line gas flushing a Picarro G2131-i High Concentration Isotopic Carbon Analyzer and analyzed for concentrations of CO2 and CH4, and for the δ13C of CO2. δ13C values were linear between 300 and 7,500 ppmV CO2; above 7,500 ppm CO2 the δ13C measurements were not linear and those δ13C values were not used. CH4/CO2 ratios were linear to concentrations of CH4 > 10,000 ppmV and CO2 concentrations > 40,000 ppmV, which was the range of our measurements in this experiment. Thus, some samples were suitable for CH4/CO2 measurements but not for δ13C measurements. For calibration of the δ13C we used 3 internal laboratory gas standards whose composition was determined by mass spectrometry on a ThermoFisher MAT 253 IRMS calibrated against the reference materials RM8562, 8563, and 8564 distributed by the IAEA. A secondary reference material SIRM consisted of a single large CO2 tank which was analyzed through the study on the Picarro G2131-i High Concentration Isotopic Carbon Analyzer; within-run precision for SIRM was ± 0.19‰ and overall precision was ± 0.33‰.
A single cow was sampled to determine variation in δ13C intercept and CH4/CO2 ratios between individual breaths of an animal in close succession; characterization of seven distinct single breaths was evaluated using a sample suite from this cow. Seven breath sample suites were collected from the cow over a period of about 30 min. Each sample suite comprised a background syringe sample, and 5 syringe samples collected simultaneously from a feeding bowl into which the animal had exhaled; the 5 syringe intakes were approximately within 3 cm of each other but pointed in various directions in the bowl. After each sampling event, the bowl was removed from the vicinity of the animal, turned upside down and flushed with ambient air for about a minute to clear it from remains of the previous breath.
Mammal breath was sampled from 29 different taxon groups at the Zurich and Basel Zoos (we consider the same taxon sampled at different zoos as different taxon groups), including both domestic and non-domestic species (Supplementary Data Set 2). Due to permitting restrictions, only individual breaths were allowed to be sampled. When possible, we collected between 5 and 8 different breaths from each animal, and 3–8 different individuals per taxon per zoo. For each individual, the different samples were taken within approximately 15 min. All animals had access to food in the hour prior to breath sampling. Breath was collected within a few cm of the nostrils of each animal, judging for the opportune moment during exhalation, during routine feeding procedures. Samples were collected in 60 mL valved syringes. Mammals were considered according to four different digestive physiologies: ruminant foregut fermenter; non-ruminant foregut fermenter; coprophageous hindgut fermenter; non-coprophageous hindgut fermenter (Müller et al., 2013). Body masses representative for the species were taken from Nowak and Walker (1999) or from estimates of individual animals in each study group.
δ13C intercepts using Keeling plots (δ13C vs. 1/CO2) were determined for each animal using all samples in the linear portion of the δ13C vs. CO2 range (i.e., <7,500 ppmV CO2) because variations in methane concentrations did not affect the δ13C intercept. CH4/CO2 ratios were determined for each breath sample by comparison to a background sample, where the CO2 concentration range (sample–background) was >200 ppmV.
The animals were fed typical zoo diets that consisted of combinations of forages, such as hay, a pelleted compound feed, and different individual items such as fruits and vegetables, and are detailed in Supplementary Material. Because individual intake recording was beyond the logistical scope of this study, the ratios of the individual diet components of the overall diet were estimated based on information of the respective zoo. Samples of diet items being consumed on the day of sampling were collected for each animal group at each zoo; these food items for all taxa were the long-term diet of each respective taxon. In the scope of this study, it was not possible to determine the exact food intake of the individual animals or animal groups; therefore, diet composition was estimated based on information given by the zoo. Approximately 20 g of each diet item was homogenized and ground to fine powder. Samples were analyzed in duplicate on a ThermoFisher Flash-EA coupled to a ThermoFisher DeltaV mass spectrometer, and proportions of items were weighted to give the average δ13C of the total diet (Supplementary Data Set 1). The method was calibrated using the international standards NBS22 (δ13C = −30.03) and IAEA CH-6 (δ13C = −10.46).
Epsilon (ε) is the isotope enrichment between related phases, originally defined as under isotope equilibrium conditions; we use ε∗ in this paper to remind ourselves that the breath-diet isotope relationship is not an equilibrium reversible reaction. Thus, we calculate:
for the isotope enrichment between diet and breath, and use an analogous expression for ε∗enamel–diet. ε∗CH4 is the estimated component of ε∗breath–diet assuming equilibrium fractionation between breath CH4 and CO2 for individual taxa studied using the fractionation observed for bovids (Klevenhusen et al., 2010); and ε∗other is the remaining isotope enrichment remaining after attribution of the ε∗CH4 component.
Statistical analysis was performed using JMP 15.0.0 (SAS Institute, 2019), and consisted of parametric correlations and linear regressions. If required, data were ln-transformed to meet requirements of normal distribution. The significance level was set to 0.05. For Keeling Plots, Pataki et al. (2003) showed that for r2 > 0.95 the intercepts using the standard linear regression method and geometric mean linear regression method were indistinguishable; therefore, we use the standard linear regression in this study.
A single cow was sampled to determine the variability of δ13C values and CH4/CO2 ratios in individual breaths. Supplementary Figure 1 shows that the δ13C of respired CO2 was very similar between breaths, with an average of −20.4 ± 0.3‰ determined by using a Keeling plot (δ13C vs. 1/CO2) using standard linear regression (Supplementary Table 1). Correlation coefficients (r2) were all > 0.98. CH4/CO2 ratios were measured in the same samples, and ranged over an order of magnitude: from 0.025 to 0.28 for the different breaths (Supplementary Figure 2), with an average value of 0.12 ± 0.9; yet, correlation coefficients (r2) within each breath sample were all > 0.99. The average δ13C intercept for the 7 samples was −20.4 ± 0.3‰ and the average CH4/CO2 ratio was 0.129 ± 0.92.
The δ13C of diets for both the Zurich and Basel Zoo animals have a restricted range and were mainly principally, or wholly, comprised of C3 plants. Therefore, differential digestibilities of C3 and C4 plants, such as may be found in formulated diets, was largely eliminated. Supplementary Data Set 1 gives the average diets for each animal group as the weighted δ13C value (δ13Cdiet) from the proportions as consumed on a long-term basis for each animal group.
δ13C and CH4/CO2 data for all taxon groups is given in Supplementary Data Set 2 where methane is reported as CH4/(CO2 + CH4) in percent. The different digestive physiologies each had a characteristic relationship for the breath-diet enrichment and methane production and therefore each is discussed separately. Table 1 summarizes the relationships for each digestive physiology.
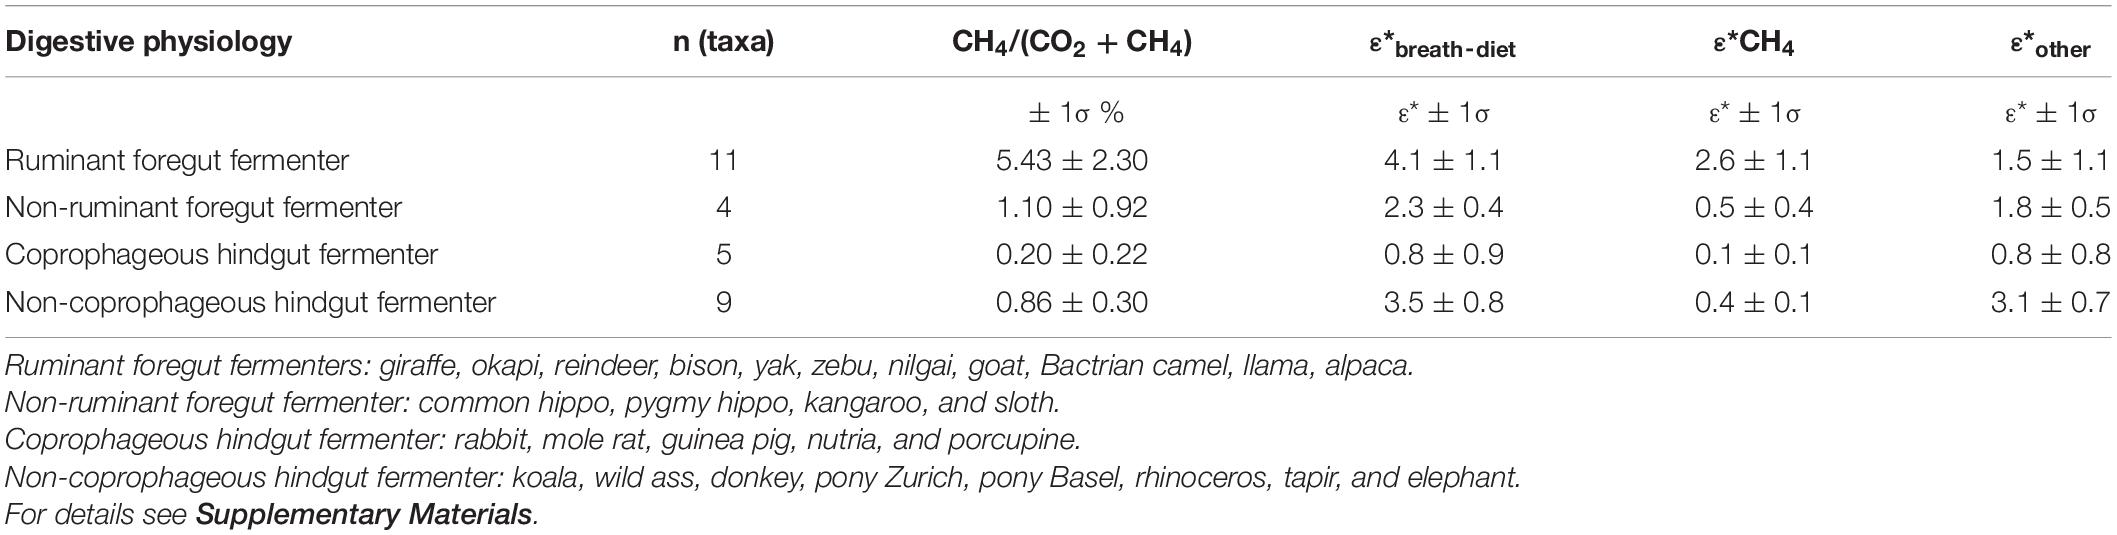
Table 1. Percent methane as (CO2 + CH4) and ε*breath–diet, ε*CH4, ε*other for this study for different digestive physiologies.
Non-coprophagous hindgut fermenter included several Perissodactyla (four equids, rhinoceros, tapir), Proboscidea (elephant), Cetartiodactyla (pig), and Diprotodontia (koala) and data are presented in Supplementary Data Set 2. Percent methane as CH4/(CO2 + CH4) in breath samples ranged from 0.5 to 1.4% with an average value of about 0.9%. Isotope enrichment ε∗breath–diet was 3.5 ± 0.8‰. CH4/(CO2 + CH4) values had variation between individual breaths (Supplementary Data Set 2), but the absolute range was smaller than ruminants.
Coprophagous hindgut fermenter included several Rodentia (four rodents) and Lagomorpha (rabbit) and data are presented in Supplementary Data Set 2. Percent methane as CH4/(CO2 + CH4) in breath samples ranged from 0.0 to 0.5% with an average value of about 0.2%. Isotope enrichment ε∗breath–diet was 0.8 ± 0.9‰ but ranged from −0.1 to 2.2‰; there was a significant correlation of ε∗breath–diet with percent methane (Figure 1 and Supplementary Table 2), but not with ln(body mass) (Supplementary Figure 3 and Supplementary Table 2). With the small sample size (n = 5) we do not speculate on the relationship between CH4/(CO2 + CH4) and ε∗breath–diet. CH4/(CO2 + CH4) values had some variation between individual breaths (Supplementary Data Set 2), but as with other hindgut fermenters, the absolute range was small compared to ruminants.
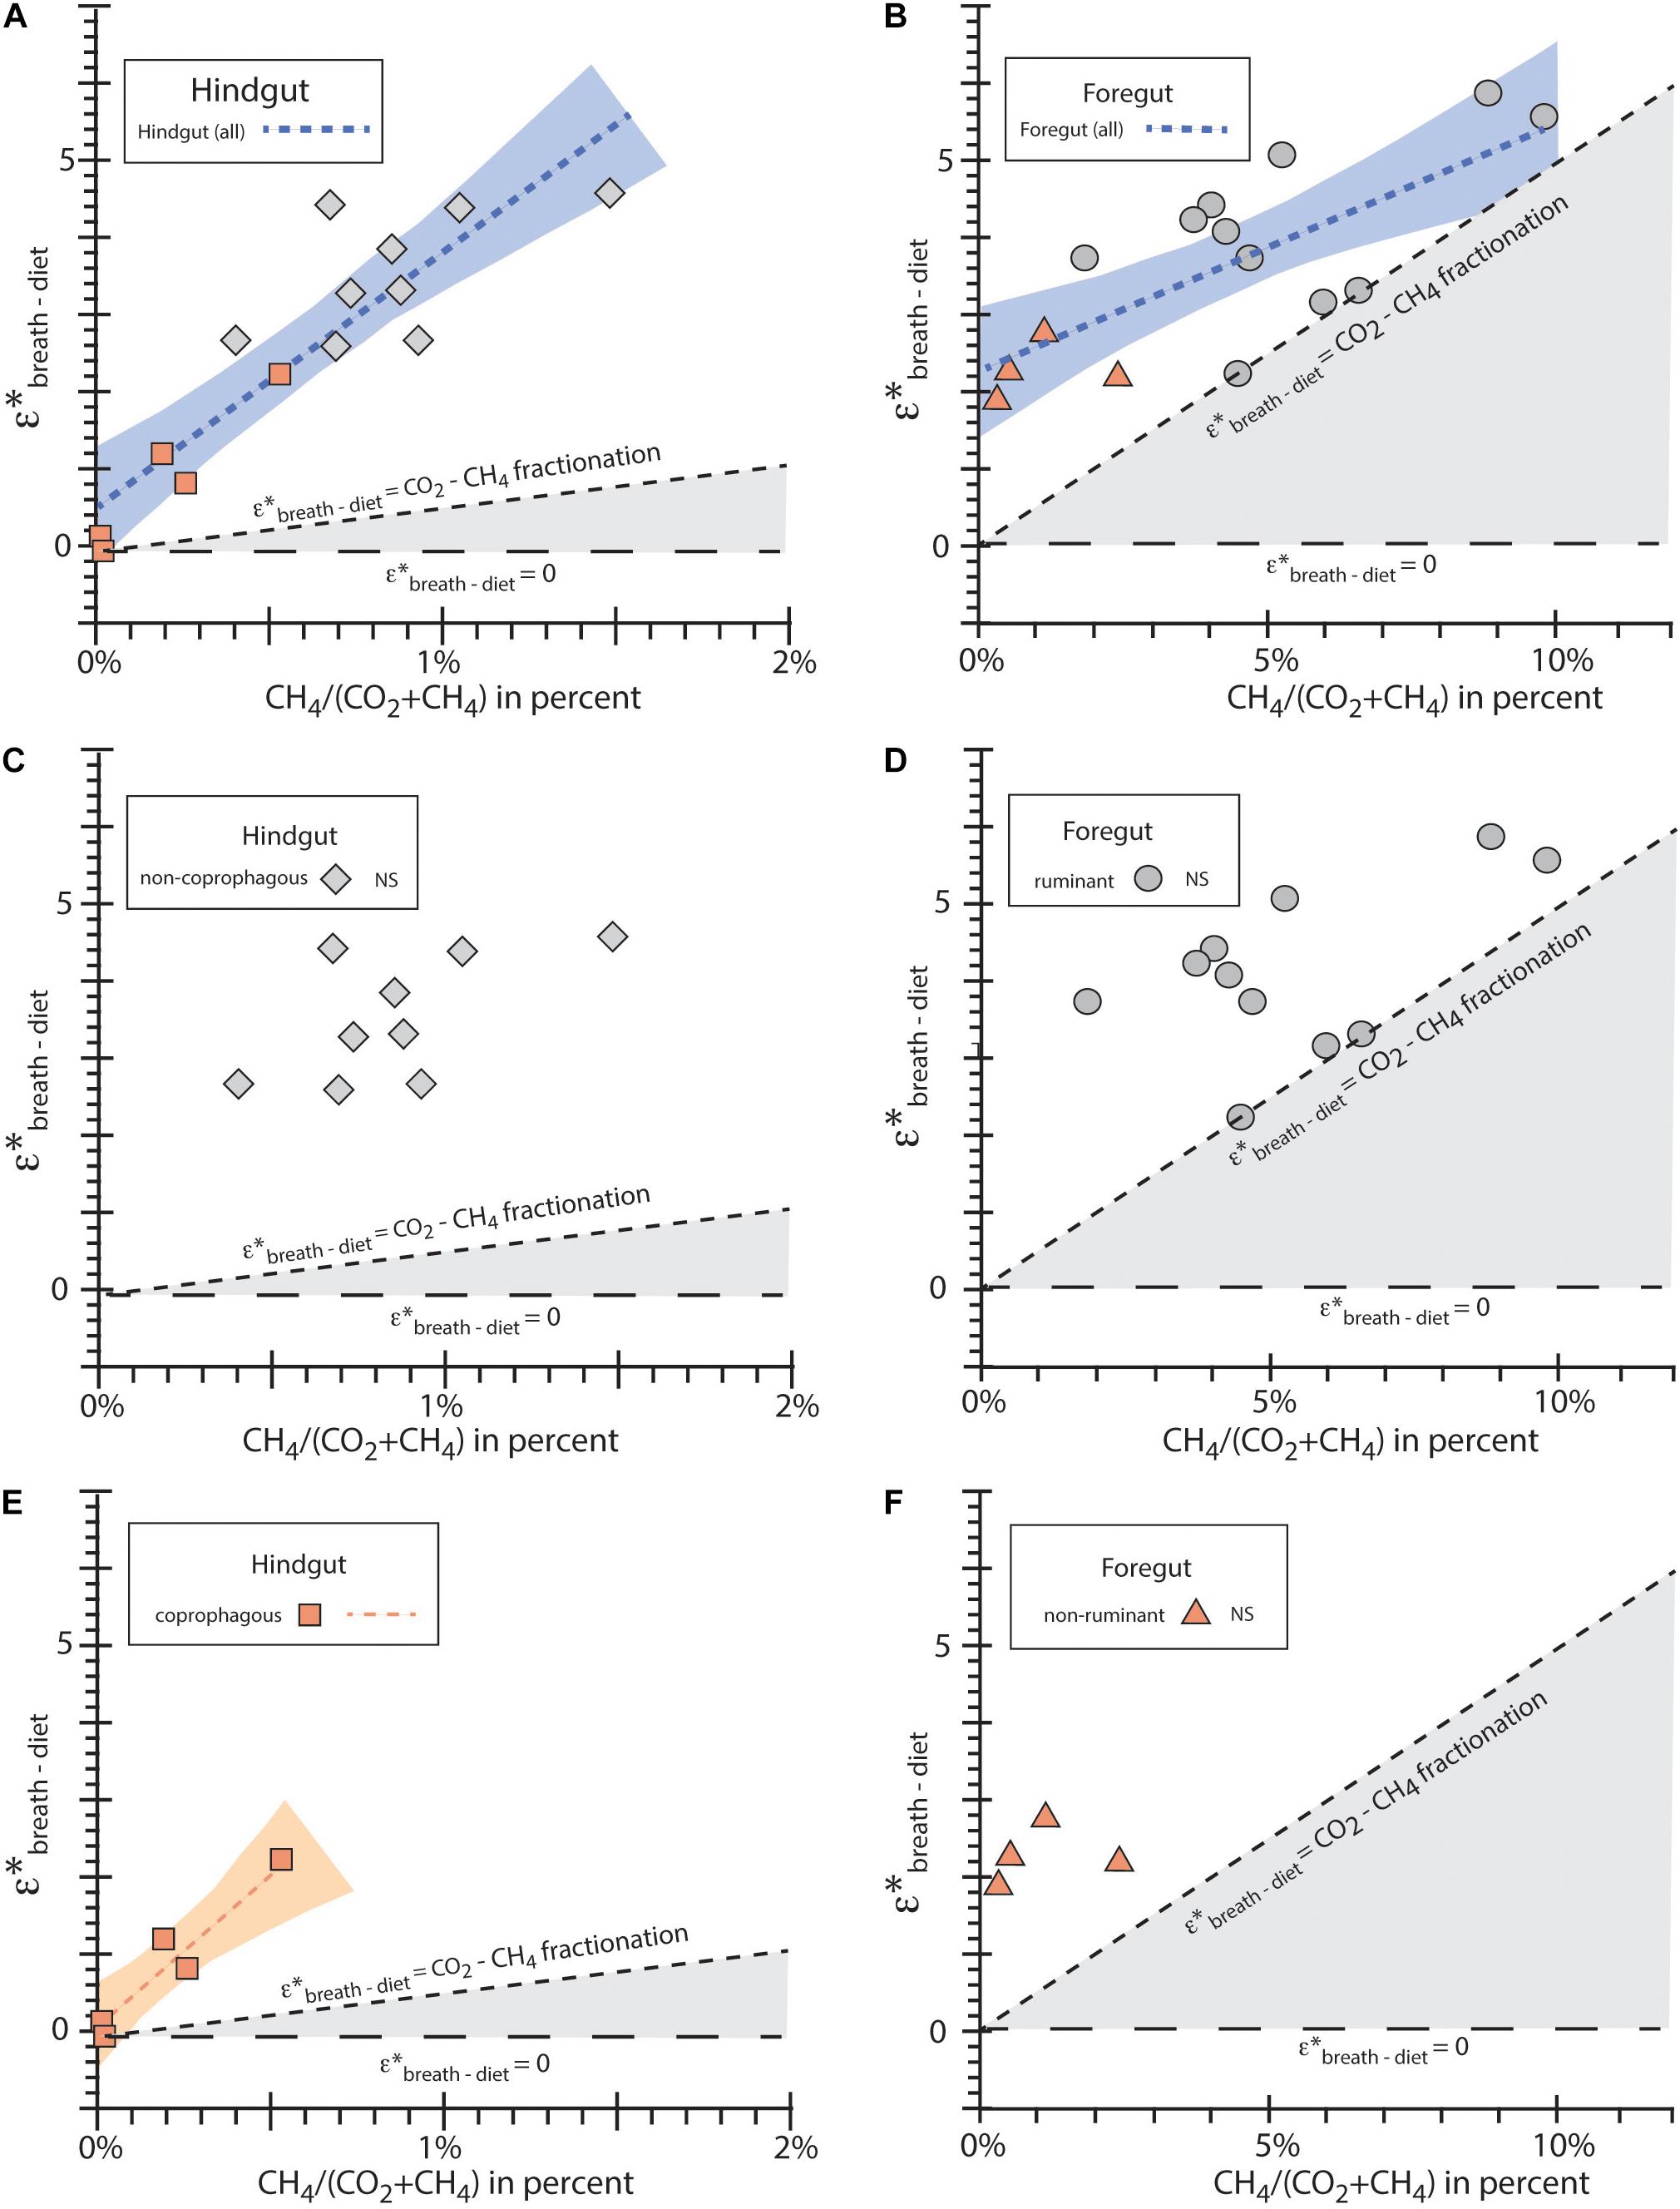
Figure 1. ε∗breath–diet vs. percent CH4/(CO2 + CH4) for taxa studied for (A) all hindgut fermenters; (B) all foregut fermenters; (C) non-coprophagous hindgut fermenters; (D) ruminant foregut fementers; (E) coprophagous hindgut fermenters; (F) non-ruminant foregut fermenters. The blue dotted lines in (A,B) show the best fit lines for all hindgut taxa and foregut taxa, respectively. The orange dotted line in (E) show the best fit lines for coprophagous hindgut digestive physiology. No significant correlations (NS) were observed for ruminant foregut, non-ruminant foregut, and non-coprophagous hindgut fermenters. Blue and orange shaded areas represent the confidence intervals for the best fit lines as computed by JMP (SAS Institute, 2019). Horizontal dashed line shows ε∗breath–diet = 0 for reference; slopped dashed line shows ε∗breath–diet fractionation due to CO2-CH4 isotope equilibrium; the gray shaded area represents the region with no differential digestion (ε∗breath–diet = 0) and where the total isotope enrichment ε∗breath–diet is smaller than ε∗CH4 due to CH4.
Non-ruminant foregut fermenters included Cetartiodactyla (2 hippos), Diprotodontia (kangaroo), and Xenartha (sloth) and data are presented in Supplementary Data Set 2. Percent methane as CH4/(CO2 + CH4) in breath samples ranged from 0.4 to 2.4% with an average value of about 1.1%. Isotope enrichment ε∗breath–diet was 2.3 ± 0.4‰. CH4/(CO2 + CH4) values had some variation between individual breaths (Supplementary Data Set 2), but the absolute range was small compared to ruminants.
Ruminant foregut fermenters were all Cetartiodactyla (5 Bovidae, 3 Camelidae, 1 Cervidae, and 2 Giraffidae) and data are presented in Supplementary Data Set 2. Percent methane as CH4/(CO2 + CH4) in breath samples ranged from 1.9 to 9.8% with an average value of about 5.4%. Isotope enrichment ε∗breath–diet was 4.1 ± 1.1‰ (Figure 1 and Table 1). CH4/(CO2 + CH4) values were quite variable between individual breaths so that the reported values are only an approximation of the true integrated CH4/(CO2 + CH4) percent values. Of the digestive groups studied, ruminants had the highest variation in CH4/(CO2 + CH4) ratios between individual breath samples (e.g., see Supplementary Figure 2).
Using the isotope enrichment ε∗CO2–CH4 of 50.1‰ for cattle as determined by Klevenhusen et al. (2010), it is possible to use the CH4/(CO2 + CH4) values to estimate the contribution of ε∗CH4 component to the total ε∗breath–diet, leaving the residual ε∗other component which represents the differential isotope digestibility of the diet. Previous studies (e.g., Sponheimer et al., 2003) have shown that mammalian feces are 13C depleted compared to bulk diet by 0 to 1.5‰, suggesting the differential digestion occurs in many taxa with the digested component being enriched in 13C compared to diet. Figure 1 shows that ε∗breath–diet values were greater than, or the same as, the ε∗CH4 value based on the enrichment of 13C in CO2 due to CH4 production. A few coprophagous hindgut fermenters had ε∗breath–diet values near 0‰ or < 0‰ (see Supplementary Data Set 3).
The results of this study show that methane production is an important factor for all digestive strategies in considering isotope enrichment of breath compared to diet, but in particular for ruminants; CH4-CO2 fractionation in isotope enrichment in CO2 from methane production can have a significant effect on the overall isotope enrichment of breath. Using the methane-related isotope enrichment of CO2, we can evaluate differential digestion as an isotope enrichment factor. We compare our isotope enrichment results to previous controlled diet studies which, to date, are few (e.g., DeNiro and Epstein, 1978; Ambrose and Norr, 1993; Tieszen and Fagre, 1993; Passey et al., 2005b; Podlesak et al., 2008); several of those studies showed a small range of isotope ε∗enamel–CO2, and thus we discuss isotope enrichment ε∗enamel–diet, which has important applications in paleoecology. We compare controlled feeding studies with previously published data for natural ecosystems to estimate enamel-diet enrichment in natural ecosystems. This comparison provides a basis for recommendations for using tooth enamel to estimate diet isotope values in natural ecosystems, both modern and fossil. In the final section we provide some recommendations for additional studies related diet, breath, and tooth enamel.
The experiment with a single cow showed up constraints when sampling breath for our analyses. Although the 5 samples from a single breath were collected within approximately 3 cm of each other, the CO2 concentration from those single breaths could vary by > 4X (Supplementary Figure 1), which underlines that even when sampling the same breath, uncontrolled variation in the positioning of the sampling equipment can lead to differences in dilution with ambient air. Nevertheless, within the samples of a single breath, the ratio of CH4/CO2 remained constant. This approach gave a robust value for the δ13C of respired CO2. However, different breaths varied distinctively in the CH4/CO2 ratio.
It is known that CH4 emissions can show strong variation across the day, which is, in respiration chamber experiments in cattle, particularly linked to feeding activity (Crompton et al., 2011). Our results from the single cow experiment suggest that in addition to these intra-diurnal fluctuations, individual breaths can also vary in the amount of CH4 exhaled. Possibly, this is linked to a rhythm of rumen gas eructation that is of a lesser frequency than the animal’s regular breathing frequency. Whether similar between-breath variation should be expected for other foregut fermenters in addition to demonstrated diurnal irregularities (Vendl et al., 2015), and to what degree CH4 produced in the hindgut will be excreted by flatulence vs. absorption in the blood and exhalation, remains to be investigated. Although it is well established that CH4 produced in the hindgut is also exhaled in breath (McKay et al., 1985; Sasaki et al., 1999), the contribution of flatulence to overall CH4 remains unexplored in non-ruminants, and even in respiration chambers.
Therefore, an average CH4/CO2 ratio representative for the individual or species should be integrated over a longer period than the 15 min of our sampling intervals, and single-breath data should not be used as a surrogate for respiration chamber measurements. Future studies should better integrate long-term CH4/(CO2 + CH4) concentrations than we were able to do in this preliminary survey. Although our preference would have been to use respiration chambers for this study, this was not possible given our IACUC (Institutional Animal Care and Use Committee) permissions. Yet, the long exchange time for isotope equilibrium between CO2 and CH4 is also evident in the single cow experiment: δ13C values are essentially constant for all samples in spite of a 10-fold change in the CH4/CO2 ratio of the samples we collected.
A different source for variation of δ13C values, which was not addressed in the present study, could be related to diurnal differences in the use of carbohydrates, fats or protein for energy production (McCue and Pollock, 2013; Whigham et al., 2014). This will depend critically on the time lag between feeding and measuring breath samples, and on the individual’s activity during that period (e.g., if it was highly active or at rest; Gautier et al., 1996; McCue et al., 2015). Although we collected breath during a short 15-min interval per animal, and always after the animals had had access to food, differences between individuals with respect to food intake and activity were beyond the control logistically feasible in our study. Yet, they might affect the variability of our δ13C readings between individuals, and hence groups. Additional controlled breath collection experiments with defined time periods since feeding represent an important future step.
Clauss et al. (2020) recently reviewed the literature for methane emissions from a wide variety of mammalian herbivore taxa. They found methane production in herbivores to be ubiquitous, and that no general rules related to digestive strategy explained the observations made in live animals in respiration experiments. When evaluating measured CH4:CO2 ratios, they found patterns similar to that in the present study, with an overall increase of the ratio with body mass due to the inclusion of (small) coprophagous hindgut fermenters (rodents) in the dataset. In their dataset, being a ruminant was the main predictor or having a high CH4:CO2 ratio, similar to our own findings where ruminants had generally higher values than other groups. Below we discuss relationships between ε∗breath–diet, CH4/(CO2 + CH4), and body mass.
Ruminant foregut fermenters have the highest CH4/(CO2 + CH4) production ratios, and range from 1.9 to 9.8%, with an average value of 5.4 ± 2.3% (Table 1 and Supplementary Data Set 2). Our data set is too small to speculate on the differences between Bovidae, Cervidae, Giraffidae and Camelidae. Respiration measurements in live animals do not suggest such a difference beyond a systematic difference due to the generally lower food intake in camelids as compared to ruminants, which, however, does not affect the CH4:CO2 ratio (Clauss et al., 2020).
Non-ruminant foregut fermenters are represented by a limited number of taxa in this study (4) and range in the CH4/(CO2 + CH4) production ratios from 0.4 to 2.4%. The position of the sloth with a ratio in the range of ruminants is in accord with a previous measurement (Vendl et al., 2016b), as is the low ratio in kangaroos and the higher value in pygmy hippos (Clauss et al., 2020). The most surprising result of the present study were the low values of the common hippos, which differed distinctively from those of the pygmy hippos in spite of the generally similar digestive anatomy and physiology of these two species (Clauss et al., 2004). The reason for the difference between these two species remains to be investigated, but the common hippo values match the observation by Codron et al. (2018) that collagen-carbonate 13C fractionation of free-ranging common hippos did not resemble that of ruminants, but of other non-ruminant grazers, which also suggests low CH4 production. The great variation in the foregut non-ruminants warns against using this descriptor of digestive strategy as a proxy for CH4 emissions.
The coprophagous hindgut fermenters had the lowest methane yield [as CH4/(CO2 + CH4)] and two taxa [Oryctolagus cuniculus (domestic rabbit) and Fukomus anselli (mole rat)] had CH4/(CO2 + CH4) production ratios indistinguishable from 0 (Supplementary Data Set 2). This confirms previously reported low CH4 emission values for the rabbit (Clauss et al., 2020). Other members of this group also have low CH4/(CO2 + CH4) production ratios (range 0.2–0.5%, Supplementary Data Set 2), and the average CH4/(CO2 + CH4) production ratio for the 5 taxa studied is 0.2 ± 0.2%. The main discrepancy to previous data is the lower ratios in nutrias and porcupines in this study; for these taxa methane emissions in the range of ruminants had been previously reported, albeit on diets of higher fiber content (Clauss et al., 2020). Again, verification of these species-specific values by further respiration chamber work is desirable.
The non-coprophagous hindgut fermenters have CH4/(CO2 + CH4) production ratios from 0.4 to 1.5% with an average value of 0.9 ± 0.3% (Table 1 and Supplementary Data 2), with the highest and lowest groups studied being equids. The generally low ratio of the group corresponds to previous observations in equids (Clauss et al., 2020). Among the species not investigated for their CH4 emissions so far, results for the other perissodactyls tapirs and rhinos were similar to those of equids, and to elephants, which matches the sparse observations in the latter. The koala corresponded to the other non-coprophagous hindgut fermenters. The wild pig species also resembled the other non-coprophagous hindgut fermenters; it has previously been suggested that the lower CH4 emissions measured in domestic pigs as compared to equids or guinea pigs were caused by the low-fiber diets on which these production animals are typically kept (Vendl et al., 2016a).
We calculated the enrichment for each taxon that is due to methane production (ε∗CH4) and find that the isotope enrichment in breath of foregut ruminants due to methane production is, on average, 2.6‰ (Table 1 and Figure 2). The other three digestive strategies have isotope enrichments ε∗CH4 < 0.5‰.
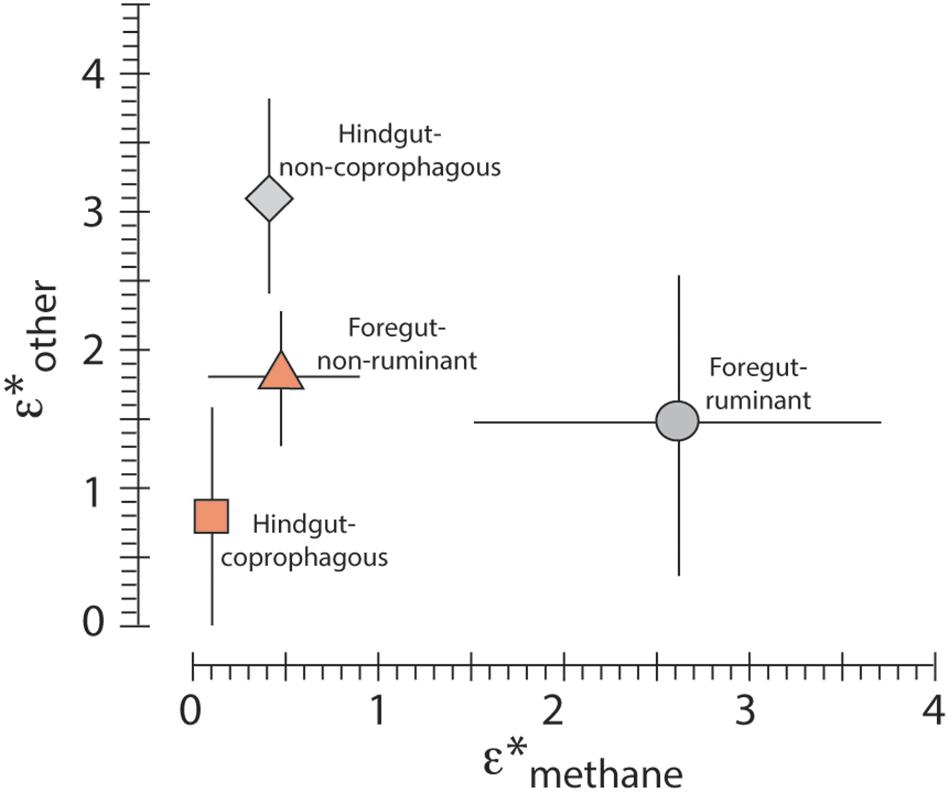
Figure 2. Average ε∗methane and ε∗other and 1 sigma values for the digestive strategies coprophageous hindgut fermenter, non-coprophageous hindgut fermenter, ruminant foregut fermenter and non-ruminant foregut fermenter.
Passey et al. (2005b) suggested that methane production could be an important factor to consider in evaluating the isotope enrichment values ε∗breath–diet and ε∗enamel–diet. Figure 1 shows that almost all taxa have a component of isotope enrichment in addition to ε∗CH4; this is ε∗other in the terminology of this paper (Figure 2, Table 1 and Supplementary Data Set 2) and is discussed in the section below.
Individual plant parts (seeds, leaves, roots) within single plants have a small range of isotope ratios whereas the different diet components (fats, proteins, carbohydrates) within individual plants have isotope ratios with a larger range as compared to the bulk plant value (Park and Epstein, 1961; Cernusak et al., 2009). It is expected that differential digestion of plant components could result in δ13C values of respired CO2 to have a value different than the bulk plant: thus, differential digestion can have a significant isotope effect in diet studies. Studies of herbivore feces on controlled diets shows that the feces are usually depleted in 13C compared to the bulk diet (e.g., Sponheimer et al., 2003; Codron et al., 2005) by up to 2‰; the implication of the observation is that the digested component is enriched in 13C compared to the bulk diet.
All digestive strategies have, on average, a non-zero ε∗other isotope enrichment. The hindgut coprophagous has the smallest value with an average ε∗other value of 0.8‰; however, within this group two taxa (rabbit: Oryctolagus cuniculus, and the mole rat: Fukomys anselli) have near 0 values for both methane production and ε∗other. One possible reason for difference in this effect might result from chewing efficiency: animals that comminute their diet more homogenously into very fine particles, such as ruminants or small hindgut fermenters (Fritz et al., 2009) might show less differential digestion than animals where the digesta remains more heterogenous due to less efficient chewing. However, in order to address this question systematically, measurements would have to be repeated with animals on a consistent diet and with a parallel recording of food intake and digestibility.
Previously, only a few studies have measured the δ13C of diet and the δ13C of breath for isotope fractionation studies to determine ε∗breath–diet (e.g., Metges et al., 1990; Tieszen and Fagre, 1993; Passey et al., 2005b; Podlesak et al., 2008; Klevenhusen et al., 2010). A few other studies have data that give additional ε∗breath–diet values but were not explicitly determined in the original paper (Ayliffe et al., 2004; Sponheimer et al., 2006) and are included in this analysis (Dataset 3). Thus, our study expands the number of taxa with ε∗breath–diet measurements, even though measurements on individual diet item intake and an assessment of digestibility was beyond the scope of the approach.
We find that the overall ε∗breath–diet is related to digestive strategy: the coprophagous hindgut fermenters have the smallest average ε∗breath–diet value (0.8 ± 0.9‰); followed by the non-ruminant foregut fermenters (2.3 ± 0.4‰); followed by non-coprophagous hindgut fermenters (3.5 ± 0.8‰); with the ruminant foregut fermenters having the highest ε∗breath–diet value (4.1 ± 1.1‰). The ε∗breath–diet values of this study can be used to greatly expand the understanding of ε∗enamel–diet values which are widely used in modern- and paleo-ecology studies. This will be discussed below.
We evaluated the measured ε∗breath–diet vs. CH4/(CO2 + CH4) for the taxa studied. Neither of the foregut fermenter groups had a significant correlation in itself, but the all the foregut taxa together had a significant relationship for ε∗breath–diet vs. CH4/(CO2 + CH4) (Figure 1 and Supplementary Table 2), corroborating a general ε∗breath–diet vs. CH4/(CO2 + CH4) relationship for foregut taxa.
The coprophagous hindgut fermenters had the lowest CH4/(CO2 + CH4) values, but had the highest correlation coefficients for ε∗breath–diet vs. CH4/(CO2 + CH4) with a significant relationship, although the number of total taxa considered is small (n = 5). The non-coprophagous hindgut fermenters did not have a significant relationship. Taken together, all hindgut fermenters had the highest significant relationship (Figure 1 and Supplementary Table 2), again corroborating that CH4 production is a major factor in determining ε∗breath–diet values.
Including all taxa in this study also gives a significant correlations between ε∗breath–diet and CH4/(CO2 + CH4) but with a lower r2 than then either hindgut fermenters or foregut fermenters considered separately (Supplementary Table 2).
Tejada-Lara et al. (2018) found a correlation between ε∗enamel–diet and ln(BM) for both hindgut and foregut digestive strategies. In the present study, we have further sub-divided these categories to coprophagous and non-coprophagous hindgut, and ruminant and non-ruminant foregut fermenters. Only hindgut coprophagous fermenters, of the individual digestive strategies, had a significant correlation for ε∗breath–diet vs. ln(BM). Including all the hindgut fermenters together also yielded a significant relationship for ε∗breath–diet vs. ln(BM) (Supplementary Figure 4 and Supplementary Table 4).
There are very few direct measurements for the isotope enrichment between breath and enamel (ε∗breath–enamel). Such studies require a long-term constant diet over the length of tooth enamel formation including the period of tooth maturation, measurements of breath, and measurements of tooth enamel after tooth extraction or after death of the animal; the measurements of diet, breath, and enamel must all be related temporally to each other. Tooth enamel maturation varies from weeks for incisors of small mammals (e.g., 18 days for lagomorphs (Passey et al., 2005a) to several years for the teeth of some large mammals; e.g., three or more years for hippo canines (maturation length and from Passey and Cerling, 2002 and growth rates from Passey et al., 2005a) and elephant molars (growth rate from Uno et al., 2013, and maturation length from Uno et al., 2020). Although bioapatite, such as bone, has a similar (and likely identical) carbon isotope value as tooth enamel if formed at the same time in the same individual, it is more readily altered and, relevant to this discussion, especially by methods used to “pre-treat” samples for isotope analysis. The typical methods include treatment with either sodium hypochlorite or hydrogen peroxide followed by treated with acetic acid (either 0.1 M or 1.0 M; either buffered or non-buffed). The treatment of bone by these methods results to changes the measured δ13C values of bone (Koch et al., 1997), but not enamel (Koch et al., 1997; Passey et al., 2002). Therefore, we do not consider in this analysis the data of Tieszen and Fagre (1993) for the evaluation of ε∗breath–enamel. Likewise, Passey et al. (2005b) noted that two individuals in their study had inadvertently been fed the wrong diet for a short time during the period of tooth enamel maturation, and therefore suggested that those individuals should not be used in the analysis for ε∗breath–enamel.
Thus, the number of taxa for evaluation of ε∗breath–enamel is limited to the studies of Passey et al. (2005b) and Podlesak et al. (2008; see Supplementary Data Set 5). These taxa represent a range of body size and digestive physiologies: domestic cattle, domestic pig, domestic rabbit, vole, and wood rat. Despite the differences in body size and physiology, the five-taxa average for the combined Passey et al. (2005b) and Podlesak et al. (2008) studies is ε∗breath–enamel = 11.6 ± 0.2‰ with a range from 11.2 to 11.8‰; the total of the 15 individual values has ε∗breath–enamel = 11.7 ± 0.4‰ with a range for individuals (n = 15) from 11.2 to 12.7‰. Presumably, breath is in isotope equilibrium with dissolved bicarbonate, and if enamel forms in isotope equilibrium with blood bicarbonate at the similar body temperatures for most mammals (ca. 37°C), then a near constant value for ε∗breath–enamel for most mammal species is expected. The observations of Yang et al. (2020) concerning ever-growing and non-ever growing teeth, presumably formed at the same time in the same individual, having different δ13C values suggests additional work needs to be done on understanding isotope signals in teeth of different growth and maturation patterns. The value for ε∗breath–enamel = 11.6 ± 0.2‰ is very similar to the 12‰ value proposed by Krueger and Sullivan (1984) based on isotope considerations in the H2O-CO2 system and assuming complete conversion of diet (as carbohydrates) to CO2. Note that ourpresent study does not add to this data base, but the above discussion is context for the application of determining additional ε∗enamel–diet values relevant to ecologic and paleo-ecologic studies.
There are few direct measurements of ε∗enamel–diet whereby both a prolonged controlled diet and tooth enamel were studied; the above referenced studies of Passey et al. (2005b) and Podlesak et al. (2008) have such data for ε∗enamel–diet. The earlier estimates of Lee-Thorp and Van der Merwe (1987) and Cerling and Harris (1999) had only estimates of the δ13C value of diet, so they did not make direct measurements on the taxa considered in those studies. DeNiro and Epstein (1978); Tieszen and Fagre (1993), and Ambrose and Norr (1993), determined ε∗bioapatite–diet values for Mus musculus, Mus musculus, and Rattus norvegicus, respectively, all analyzing bone bioapatite; and Tejada-Lara et al. (2018) determined ε∗bioapatite–diet values for Bradypus variegatus and Choloepus hoffmanni using dentine bioapatite. Taken together, there are few taxa that have direct measurements for ε∗enamel–diet or ε∗bioapatite–diet with prolonged diet control and measurement of tissues. Explicit ε∗enamel–diet determinations include domestic cattle, domestic pig, rabbit, vole, wood rat; explicit ε∗bone–diet determinations include laboratory mice and laboratory rats; explicit ε∗dentine–diet measurements exist for two species of sloths.
Zoo and lab studies with δ13C-measured diets can provide additional data for ε∗enamel–diet. Passey et al. (2005b) and Podlesak et al. (2008) found a near constant isotope enrichment factor ε∗enamel–breath of 11.6 ± 0.2‰ for 5 different taxa (see discussion above).
Using that enrichment and the ε∗breath–diet we calculate the enrichment ε∗enamel–diet for our study animals in Supplementary Data Set 2; results are tabulated in Supplementary Data Set 3. This analysis does not provide any additional information for CH4/CO2 vs. ε∗breath–diet than described previously, but would conclude that the isotope enrichments ε∗enamel–diet is related to CH4 production: the coprophagous hindgut fermenters have the smallest average ε∗enamel–diet value (12.4 ± 0.9‰; n = 5); followed by the non-ruminant foregut fermenters (13.9 ± 0.5‰; n = 4) and the non-coprophagous hindgut fermenters (14.1 ± 0.8‰; n = 9), with the ruminant foregut fermenters having the highest ε∗enamel–diet value (15.7 ± 1.1‰; n = 11).
We can also include previous studies of controlled diets or zoo-diet studies (Supplementary Data Set 3 and references therein). This analysis gives similar results with coprophagous hindgut fermenters having the smallest average ε∗enamel–diet value (11.5 ± 1.5‰; n = 11), followed by the non-ruminant foregut fermenters (13.3 ± 1.4‰; n = 7) and the non-coprophagous hindgut fermenters (14.8 ± 1.0‰; n = 13), with ruminant foregut fermenters having the highest ε∗enamel–diet value (15.2 ± 1.3‰; n = 19) (Supplementary Table 1).
Notably, the only mammals with an ε∗enamel–diet value of 11‰ or less, and therefore an apparent negative enrichment factor for ε∗breath–diet, were murids or cricetids of the Rodentia Family and one species of sloth: Mus musculus (DeNiro and Epstein, 1978; Tieszen and Fagre, 1993), Rattus norvegicus (Ambrose and Norr, 1993), Neotoma cinera (Podlesak et al., 2008), and Bradypus variegatus (Tejada-Lara et al., 2018). The study of Passey et al. (2005b), using Mus ochrogaster, found ε∗breath–diet of 0.3 ± 0.8‰, indistinguishable from 0. We note that all of murids and cricetid studies used commercial formulated (mixed) diets. Additional studies are needed to resolve whether murids and cricetids have a negative enrichment factor for ε∗breath–diet, different than other mammals, or if this is related to using commercial formulated diets.
Tejada-Lara et al. (2018) previously found correlations within the hindgut and foregut digestive physiologies; we also find a significant correlation between ln(BM) and ε∗enamel–diet for hindgut and foregut physiologies (Supplementary Figures 5A,B and Supplementary Table 5). However, when we look at the four digestive physiologies individually, we find that only the coprophagous hindgut fermenters have a significant relationship (p = 0.005; Supplementary Figure 5E and Supplementary Table 5). Thus, the body mass to ε∗enamel–diet (Tejada-Lara et al., 2018) seems to be related to grouping different physiologies with different body masses and different ε∗enamel–diet characteristic to those physiologies including CH4 production.
This study provides the opportunity to compare the same, or related, species for methane production and for isotope enrichment values. In all cases, diets have been homogeneous and well characterized for stable isotope but not for fiber or for other factors that might affect differential digestion or methane production, and therefore, net isotope enrichment between diet and breath, or diet and enamel. Taking all studies together, Equidae have a range in CH4/(CO2 + CH4) ratios from 0.4 to 1.5% (average 0.9 ± 0.4%, n = 4); have ε∗breath–diet values from 2.1 to 4.6‰ (average 3.4 ± 1.0‰, n = 5); and ε∗enamel–diet values 13.6 to 16.2 (average have a range in ε∗enamel–diet from 14.9 ± 1.0‰, n = 6). The family Bovidae provide a similar comparison: bovid taxa have a range in CH4/(CO2 + CH4) ratios from 4.0 to 9.8% (average 6.2 ± 2.2, n = 6); have ε∗breath–diet values from 2.9 to 5.4 (average 4.2 ± 0.9, n = 8); and have a range in ε∗enamel–diet from 14.6 to 17.21 (average 15.8 ± 0.8, n = 9). Thus, phylogenetically related taxa have broad similarities in methane production, ε∗breath–diet, and ε∗enamel–diet values, but additional studies are needed to determine further sub-divisions within any particular digestive physiology.
The recent large dataset of Cerling et al. (2015) provides the opportunity to compare the results from this analysis to field observations of diet enrichment factors; that study uses all of the data from Africa of the specimens of Cerling and Harris (1999). All tooth enamel and plant samples were corrected to the same baseline atmospheric value for the pre-Industrial atmosphere (δ13C1750 following Long et al. (2005) and Cerling et al. (2015). We consider taxa from Africa with n = / > 5 from an individual locality having a standard deviation < 1.0‰ for that locality, implying a constant diet for that population of animals in that taxa (Supplementary Data Set 4). The rationale is that the small standard deviation of < 1.0‰ for enamel values for a taxon in a particular locality implies a consistent diet for all specimens, and therefore that taxon likely has either a pure-C3 or a pure-C4 diet with little admixture of the minor component, making it suitable for determination of ε∗enamel–diet. δ13C1750 values for vegetation was estimated using published δ13C values for plants (Cerling and Harris, 1999; Cerling et al., 2003, 2004, 2018; Blumenthal et al., 2016) using the corrections from δ13Cmodern to δ13C1750, again following Long et al. (2005) and Cerling et al. (2015). For forest, mesic savanna, and xeric savanna sites we get average δ13C1750 values for C3 plants of −26.7, −26.7, and −25.4‰, respectively; and for forest, mesic savanna, and xeric savanna sites we get average δ13C1750 values for C4 plants of −9.7, −10.3, and −11.5‰, respectively. Sites were classified as forest, mesic savanna, or xeric savanna and the δ13C1750 values for C3 plants and C4 plants as above were used with δ13C1750 values for the African taxa from Supplementary Data Set 4 to calculate ε∗enamel–diet values for field observations.
This analysis of gives ε∗enamel–diet of 14.3 ± 0.8‰ (n = 13) for ruminant foregut fermenters, and 13.2 ± 1.1 (n = 13) for the non-coprophagous hindgut fermenters under field conditions. Both of these values are about 1‰ smaller than determined above for the zoo study (15.7 ± 1.1‰ and 14.1 ± 0.8‰, respectively), or for the larger data set using all previously published data for controlled and restricted diet studies (15.2 ± 1.3‰, and 14.8 ± 1.0‰, respectively). It is possible that this offset could be due to difference in CH4 production: CH4 methane production generally increases with increasing fiber content of a diet. Natural diets are typically of a higher fiber content than those used in captivity or in experimental conditions, but note that this effect is in the opposite direction as observed here. It is also possible that differences in differential digestion between the field conditions and the controlled diets could have a significant isotope effect. Until more controlled studies are available that compare the effects of different diets, such as zoo- or farm-type diets vs. natural diets, the issue remains unresolved.
We studied 29 taxa from the Basel and Zurich Zoos having four different digestive strategies for herbivorous mammals. We measured CH4/CO2 ratios in breath, δ13C of food, and δ13C of respired CO2. Keeling plots proved valuable for determining the δ13C of respired CO2 in these studies and will be a valuable addition to the methodology of isotope and animal physiology studies. CH4/(CH4 + CO2) ratios were correlated with isotope enrichment in breath (ε∗breath–diet) for both foregut and hindgut digestion, but the total ε∗breath–diet was related to both CH4 production (ε∗CH4–CO2) and differential digestion (ε∗other). Previous correlations of ε∗enamel–diet with body mass (Tejada-Lara et al., 2018) may be related to differences in CH4 production, with the smaller hindgut coprophagous fermenters being both smaller in size and have intrinsic lower CH4 production that larger hindgut non-coprophagous fermenters. Likewise, foregut fermenters have a large range in CH4/CO2 production ratios and any observed correlations between ε∗enamel–diet and body mass may also be related to CH4/CO2 production ratios.
Estimates of the ε∗enamel–diet isotope enrichment value is very important in ecological and paleontological studies. However, the determination of precise ε∗enamel–diet values is elusive: with the species measured to date, the groups of ruminant fermenters, non-coprophagous hindgut fermenters, non-ruminant foregut fermenters, and coprophagous hindgut fermenters have successively smaller ε∗enamel–diet values; we recommend using 14.5 ± 1‰, 13.5 ± 1‰, 12.5 ± 1‰, and 12 ± 1‰, respectively, for these categories for field conditions, but nevertheless remain cautious about potential species differences within these groups. Ruminants had the highest CH4/CO2 ratios and were the only group showing an average > 1‰ isotope enrichment due to CH4 production. Non-coprophagous hindgut fermenters had the highest apparent isotope enrichment due to differential digestion.
This study suggests that additional work on controlled diet studies in mammals will yield important insights into animal physiology that will have important applications in domestic livestock, wildlife ecology, and paleontology. The Keeling plot approach will have validity in both single breath sampling, as we have done here, or in respiration chamber-like experiments where better estimates of the integrated CH4/CO2 values are obtained by integrating over longer time periods for each taxon. Since only a few 100 ppmV range is needed for a high-quality Keeling plot (Pataki et al., 2003), only an hour or so should suffice for open respiration chamber (stall, room, or enclosure scaled to the size of the study animal) studies to obtain high quality values of δ13Cbreath–diet studies and to determine integrated CH4/CO2 ratios which could be compared for diurnal variations.
The original contributions presented in the study are included in the article/Supplementary Material, further inquiries can be directed to the corresponding author/s.
The animal study was reviewed and approved by University of Utah IACUC. The collection of breath was permitted by the Swiss Cantonal Veterinary Authorities under license no. ZH017/19+.
All authors listed have made a substantial, direct and intellectual contribution to the work, and approved it for publication.
This study was funded by the US National Science Foundation (NSF-1740383) and the FH Brown Presidential Chair Fund.
The authors declare that the research was conducted in the absence of any commercial or financial relationships that could be construed as a potential conflict of interest.
We thank the Basel Zoo and the Zurich Zoo for assistance with this study; and Stewart Bishop, Marc-Andre Cormier, and Roland Werner for assistance in the laboratory. We also thank Kevin Uno, Dan Davis, and Nancy Carpenter for discussions and preliminary data on Keeling plots. This work is done under the University of Utah IACUC protocol 17-08010.
The Supplementary Material for this article can be found online at: https://www.frontiersin.org/articles/10.3389/fevo.2021.638568/full#supplementary-material
Ambrose, S. H., and Norr, L. (1993). “Experimental evidence for the relationship of the carbon isotope ratios of whole diet and dietary protein to those of bone collagen and carbonate,” in Prehistoric Human Bone: Archaeology at the Molecular Level, eds J. B. Lambert and G. Grupe (Berlin: Springer), 1–37.
Ayliffe, L. K., Cerling, T. E., Robinson, T., West, A. G., Sponheimer, M., Passey, B. H., et al. (2004). Turnover of carbon isotopes in tail hair and breath CO2 of horses fed an isotopically varied diet. Oecologia 139, 11–22.
Blumenthal, S. A., Rothman, J. M., Chritz, K. L., and Cerling, T. E. (2016). Stable isotopic variation in tropical forest plants for applications in primatology. Am. J. Primatol. 78, 1041–1054. doi: 10.1002/ajp.22488
Cerling, T. E., and Harris, J. M. (1999). Carbon isotope fractionation between diet and bioapatite in ungulate mammals and implications for ecological and paleoecological studies. Oecologia 120, 347–363. doi: 10.1007/s004420050868
Cerling, T. E., Andanje, S. A., Blumenthal, S. A., Brown, F. H., Chritz, K. L., Harris, J. M., et al. (2015). Dietary changes of large herbivores in the Turkana Basin, Kenya from 4 to 1 Ma. Proc. Natl. Acad. Sci.U.S.A. 112, 11467–11472. doi: 10.1073/pnas.1513075112
Cerling, T. E., Andanje, S. A., Gakuya, F., Kariuki, J. M., Kariuki, L., Kingoo, J. W., et al. (2018). Stable isotope ecology of black rhinos (Diceros bicornis) in Kenya. Oecologia 187, 1095–1105. doi: 10.1007/s00442-018-4185-4
Cerling, T. E., Harris, J. M., and Passey, B. H. (2003). Dietary preferences of East African Bovidae based on stable isotope analysis. J. Mammal. 84, 456–471. doi: 10.1644/1545-1542(2003)084<0456:doeabb>2.0.co;2
Cerling, T. E., Hart, J. A., and Hart, T. B. (2004). Stable isotope ecology in the Ituri Forest. Oecologia 138, 5–12. doi: 10.1007/s00442-003-1375-4
Cernusak, L. A., Tcherkez, G., Keitel, C., Cornwell, W. K., Santiago, L. S., Knohl, A., et al. (2009). Why are non-photosynthetic tissues generally 13C enriched compared with leaves in C3 plants? Review and synthesis of current hypotheses. Funct. Plant Biol. 36, 199–213. doi: 10.1071/fp08216
Clauss, M., Dittmann, M. T., Vendl, C., Hagen, K. B., Frei, S., Ortmann, S., et al. (2020). Comparative methane production in mammalian herbivores. Animal 14, s113–s123.
Clauss, M., Schwarm, A., Ortmann, S., Alber, D., Flach, E. J., Kühne, R., et al. (2004). Intake, ingesta retention, particle size distribution and digestibility in the hippopotamidae. Comp. Biochem. Physiol. A Mol. Integr. Physiol. 139, 449–459. doi: 10.1016/j.cbpb.2004.10.002
Codron, D., Clauss, M., Codron, J., and Tütken, T. (2018). Within trophic level shifts in collagen-carbonate stable carbon isotope spacing are propagated by diet and digestive physiology in large mammal herbivores. Ecol. Evol. 8, 3983–3995. doi: 10.1002/ece3.3786
Codron, D., Codron, J., Sponheimer, M., Lee-Thorp, J. A., Robinson, T., Grant, C. C., et al. (2005). Assessing diet in savanna herbivores using stable carbon isotope ratios of faeces. Koedoe 48, 115–124.
Crompton, L. A., Mills, J. A. N., Reynolds, C. K., and France, J. (2011). “Fluctuations in methane emission in response to feeding pattern in lactating dairy cows,” in Modelling Nutrient Digestion and Utilisation in Farm Animals, ed. D. Sauvant (Wageningen: Wageningen Academic Publishers), 176–180. doi: 10.3920/978-90-8686-712-7_19
DeNiro, M. J., and Epstein, S. (1978). Influence of diet on the distribution of carbon isotopes in animals. Geochim. Cosmochim. Acta 42, 495–506. doi: 10.1016/0016-7037(78)90199-0
Fritz, J., Hummel, J., Kienzle, E., Arnold, C., Nunn, C., and Clauss, M. (2009). Comparative chewing efficiency in mammalian herbivores. Oikos 118, 1623–1632. doi: 10.1111/j.1600-0706.2009.17807.x
Gautier, J. F., Pirnay, F., Lacroix, M., Mosora, F., Scheen, A. J., Cathelineau, G., et al. (1996). Changes in breath 13CO2/12CO2 during exercise of different intensities. J. Appl. Physiol. 81, 1096–1102. doi: 10.1152/jappl.1996.81.3.1096
Klevenhusen, F., Bernasconi, S. M., Kreuzer, M., and Soliva, C. R. (2010). Experimental validation of the intergovernmental panel on climate change default values for ruminant-derived methane and its carbon-isotope signature. Anim. Prod. Sci. 50, 159–167. doi: 10.1071/an09112
Koch, P. L., Tuross, N., and Fogel, M. L. (1997). The effects of sample treatment and diagenesis on the isotopic integrity of carbonate in biogenic hydroxylapatite. J. Archaeol. Sci. 24, 417–429. doi: 10.1006/jasc.1996.0126
Krueger, H. W., and Sullivan, C. H. (1984). “Models for carbon isotope fractionation between diet and bone,” in Stable Isotopes in Nutrition. American Chemical Society Symposium Series 258, eds J. R. Turnland and P. E. Johnson (Washington, DC: American Chemical Society), 205–220. doi: 10.1021/bk-1984-0258.ch014
Lee-Thorp, J. A., Sealy, J. C., and van der Merwe, N. J. (1989). Stable carbon isotope ratio differences between bone collagen and bone apatite, and their relationship to diet. J. Archaeol. Sci. 16, 585–599. doi: 10.1016/0305-4403(89)90024-1
Lee-Thorp, J. L., and Van der Merwe, N. J. (1987). Carbon isotope analysis of fossil bone apatite. S. Afr. J. Sci. 83, 712–715.
Lee-Thorp, J. A., and van der Merwe, N. J. (1991). Aspects of the chemistry of modern and fossil biological apatites. J. Archaeol. Sci. 18, 343–354. doi: 10.1016/0305-4403(91)90070-6
Long, E. S., Sweitzer, R. A., Diefenbach, D. R., and Ben-David, M. (2005). Controlling for anthropogenically induced atmospheric variation in stable carbon isotope studies. Oecologia 146, 148–156. doi: 10.1007/s00442-005-0181-6
McCue, M. D., and Pollock, E. D. (2013). Measurements of substrate oxidation using 13CO2-breath testing reveals shifts in fuel mix during starvation. J. Comp. Physiol. B 183, 1039–1052. doi: 10.1007/s00360-013-0774-z
McCue, M. D., Passement, C. A., and Rodriguez, M. (2015). The magnitude of the naturally occurring isotopic enrichment of 13C in exhaled CO2 is directly proportional to exercise intensity in humans. Comp. Biochem. Physiol. A 179, 164–171. doi: 10.1016/j.cbpa.2014.08.021
McKay, L. F., Eastwood, M. A., and Brydon, W. G. (1985). Methane excretion in man - a study of breath, flatus, and faeces. Gut 26, 69–74. doi: 10.1136/gut.26.1.69
Metges, C., Kempe, K., and Schmidt, H. L. (1990). Dependence of the carbon-isotope contents of breath carbon dioxide, milk, serum and rumen fermentation products on the δ 13 C value of food in dairy cows. Br. J. Nutr. 63, 187–196. doi: 10.1079/bjn19900106
Müller, D. W. H., Codron, D., Meloro, C., Munn, A., Schwarm, A., Hummel, J., et al. (2013). Assessing the Jarman-Bell Principle: scaling of intake, digestibility, retention time and gut fill with body mass in mammalian herbivores. Comp. Biochem. Physiol. A 164, 129–140. doi: 10.1016/j.cbpa.2012.09.018
Nowak, R. M., and Walker, E. P. (1999). Walker’s Mammals of the World, Vol. 2. Baltimore: JHU Press, 1629.
Park, R., and Epstein, S. (1961). Metabolic fractionation of C13 & C12 in plants. Plant Physiol. 36, 133–138. doi: 10.1104/pp.36.2.133
Passey, B. H., and Cerling, T. E. (2002). Tooth enamel mineralization in ungulates: implications for recovering a primary isotopic time–series. Geochim. Cosmochim. Acta 18, 3225–3234. doi: 10.1016/s0016-7037(02)00933-x
Passey, B. H., Cerling, T. E., Schuster, G. T., Robinson, T. F., Roeder, B. L., and Krueger, S. K. (2005a). Inverse methods for estimating primary input signals from time–averaged intra–tooth profiles. Geochim. Cosmochim. Acta 69, 4101–4116. doi: 10.1016/j.gca.2004.12.002
Passey, B. H., Perkins, M. E., Voorhies, M. R., Cerling, T. E., Harris, J. M., and Tucker, S. T. (2002). Timing of C4 biomass expansion and environmental change in the Great Plains: an isotopic record from fossil horses. J. Geol. 110, 123–140. doi: 10.1086/338280
Passey, B. H., Robinson, T. F., Ayliffe, L. K., Cerling, T. E., Sponheimer, M., Dearing, M. D., et al. (2005b). Carbon isotope fractionation between diet, breath CO2, and bioapatite in different mammals. J. Archaeol. Sci. 32, 1459–1470. doi: 10.1016/j.jas.2005.03.015
Pataki, D. E., Ehleringer, J. R., Flanagan, L. B., Yakir, D., Bowling, D. R., Still, C. J., et al. (2003). The application and interpretation of Keeling plots in terrestrial carbon cycle research. Glob. Biogeochem. Cycles 17:1022. doi: 10.1029/2001GB001850
Podlesak, D. W., Torregrossa, A. M., Ehleringer, J. R., Dearing, M. D., Passey, B. H., and Cerling, T. E. (2008). Turnover of oxygen and hydrogen isotopes in the body water, CO2, hair, and enamel of a small mammal. Geochim. Cosmochim. Acta 72, 19–35. doi: 10.1016/j.gca.2007.10.003
Sasaki, N., Hobo, S., and Yoshihara, T. (1999). Measurement for breath concentration of hydrogen and methane in horses. J. Vet. Med. Sci. 61, 1059–1062. doi: 10.1292/jvms.61.1059
Sponheimer, M., Robinson, T. F., Cerling, T. E., Tegland, L., Roeder, B. L., Ayliffe, L., et al. (2006). Turnover of stable carbon isotopes in the muscle, liver, and breath CO2 of alpacas (Lama pacos). Rapid Commun. Mass Spectrom. 20, 1395–1399. doi: 10.1002/rcm.2454
Sponheimer, M., Robinson, T., Ayliffe, L., Roeder, B., Shipley, L., Lopez, E., et al. (2003). An experimental study of carbon isotopes in the diets, feces and hair of mammalian herbivores. Can. J. Zool. 81, 871–876. doi: 10.1139/z03-066
Tejada-Lara, J. V., MacFadden, B. J., Bermudez, L., Rojas, G., Salas-Gismondi, R., and Flynn, J. J. (2018). Body mass predicts isotope enrichment in herbivorous mammals. Proc. R. Soc. B Biol. Sci. 285:20181020. doi: 10.1098/rspb.2018.1020
Tieszen, L. L., and Fagre, T. (1993). “Effect of diet quality and composition on the isotopic composition of respiratory CO2, bone collagen, bioapatite, and soft tissues,” in Prehistoric Human Bone: Archaeology at the Molecular Level, eds J. B. Lambert and G. Grupe (Berlin: Springer), 121–155. doi: 10.1007/978-3-662-02894-0_5
Uno, K. T., Fisher, D. C., Wittemyer, G., Douglas–Hamilton, I., Carpenter, N., and Cerling, T. E. (2020). Forward and inverse methods for extracting climate and diet information from stable isotope profiles in proboscidean molars. Quat. Int. 557, 92–109. doi: 10.1016/j.quaint.2020.06.030
Uno, K. T., Quade, J., Fisher, D. C., Wittemyer, G., Douglas–Hamilton, I., Andanje, S. A., et al. (2013). Bomb–curve radiocarbon (14C) dating of recent biologic tissues and applications to stable isotope (paleo)ecology and wildlife forensics. Proc. Natl. Acad. Sci. U.S.A. 110, 11736–11741. doi: 10.1073/pnas.1302226110
Vendl, C., Clauss, M., Stewart, M., Leggett, K., Hummel, J., Kreuzer, M., et al. (2015). Decreasing methane yield with increasing food intake keeps daily methane emissions constant in two foregut fermenting marsupials, the western grey kangaroo and red kangaroo. J. Exp. Biol. 218, 3425–3434. doi: 10.1242/jeb.128165
Vendl, C., Frei, S., Dittmann, M. T., Furrer, S., Ortmann, S., Lawrenz, A., et al. (2016a). Methane production by two non-ruminant foregut-fermenting herbivores: the collared peccary (Pecari tajacu) and the pygmy hippopotamus (Hexaprotodon liberiensis). Comp. Biochem. Physiol. A 191, 107–114. doi: 10.1016/j.cbpa.2015.09.021
Vendl, C., Frei, S., Dittmann, M. T., Furrer, S., Osmann, C., Ortmann, S., et al. (2016b). Digestive physiology, metabolism and methane production of captive Linné’s two-toed sloths (Choloepus didactylus). J. Anim. Physiol. Anim. Nutr. 100, 552–564. doi: 10.1111/jpn.12356
Wang, Y., and Cerling, T. E. (1994). A model of fossil tooth and bone diagenesis: implications for paleodiet reconstruction from stable isotopes. Palaeogeogr. Palaeoclimatol. Palaeoecol. 107, 281–289. doi: 10.1016/0031-0182(94)90100-7
Whigham, L. D., Butz, D. E., Johnson, L. K., Schoeller, D. A., Abbott, D. H., Porter, W. P., et al. (2014). Breath carbon stable isotope ratios identify changes in energy balance and substrate utilization in humans. Int. J. Obes. 38, 1248–1250. doi: 10.1038/ijo.2014.7
Keywords: stable isotopes, diet, methane, carbon dioxide, physiology
Citation: Cerling TE, Bernasconi SM, Hofstetter LS, Jaggi M, Wyss F, Rudolf von Rohr C and Clauss M (2021) CH4/CO2 Ratios and Carbon Isotope Enrichment Between Diet and Breath in Herbivorous Mammals. Front. Ecol. Evol. 9:638568. doi: 10.3389/fevo.2021.638568
Received: 15 January 2021; Accepted: 22 April 2021;
Published: 28 May 2021.
Edited by:
Jose A. Masero, University of Extremadura, SpainReviewed by:
Gwyneth Gordon, Arizona State University, United StatesCopyright © 2021 Cerling, Bernasconi, Hofstetter, Jaggi, Wyss, Rudolf von Rohr and Clauss. This is an open-access article distributed under the terms of the Creative Commons Attribution License (CC BY). The use, distribution or reproduction in other forums is permitted, provided the original author(s) and the copyright owner(s) are credited and that the original publication in this journal is cited, in accordance with accepted academic practice. No use, distribution or reproduction is permitted which does not comply with these terms.
*Correspondence: Thure E. Cerling, dGh1cmUuY2VybGluZ0B1dGFoLmVkdQ==
Disclaimer: All claims expressed in this article are solely those of the authors and do not necessarily represent those of their affiliated organizations, or those of the publisher, the editors and the reviewers. Any product that may be evaluated in this article or claim that may be made by its manufacturer is not guaranteed or endorsed by the publisher.
Research integrity at Frontiers
Learn more about the work of our research integrity team to safeguard the quality of each article we publish.