 Béla Kuslits1,2*
 Ágnes Vári2
 Eszter Tanács2Réka Aszalós2Anghel Drasovean3Regina Buchriegler4Zsanett Laufer5Damir Krsic6Ranko Milanovic7Ildikó Arany2
- 1Institute of Geography, Geoeconomy and Sustainable Development, Corvinus University, Budapest, Hungary
- 2Centre for Ecological Research, Lendület Ecosystem Services Research Group, Vácrátót, Hungary
- 3Apuseni Natural Park, Localitatea Sudrigiu, Romania
- 4Kalkalpen National Park, Molln, Austria
- 5Bükk National Park, Eger, Hungary
- 6Žumberak—Samoborsko Gorje Nature Park, Samobor, Croatia
- 7Tara National Park, Bajina Bašta, Serbia
While a landscape usually provides a wide range of benefits, the ecological and spatial entanglement of the processes behind ecosystem services does not allow maximizing benefits from all services at the same time. Different stakeholders relying on different services might therefore prefer different policies and management for the wider area where they operate. Trade-offs, disagreements and mutual interests are rooted in ecological processes but are manifested in the social sphere. Social networks were shown to have a significant impact on the management of ecosystem services. In this paper we show that ecosystem services also influence the structure of management-networks and power-relations among stakeholders, thus ecological factors set the stage for (local-regional) political discourse. We used social network analysis (SNA) to show how ecological processes become agents of social-ecological systems (SES), this method is also useful for finding those players who can adopt a mediator role in the social sphere, having a special position in the web of competing interests. Our research shows how mutual influence between social and ecological elements shapes management strategies in five protected areas in Central and Eastern Europe. The most voluminous and profitable ecosystem services (primarily timber production in our cases) define which stakeholders are the most powerful in management networks—this eminent position allows these players to make decisions unilaterally. Other, smaller players tend to negotiate with a diverse set of counterparts with whom they share and co-manage often multiple services. Power relations that emerge as a consequence of production differences among ecosystem services often do not allow participatory management methods. These situations lead to over-utilization of natural resources with a narrow interpretation of sustainability which decreases resilience for the whole social-ecological system. Our results contribute to the theoretical understanding of political discourses in SES and showcase how SNA can be applied as a tool to facilitate participatory landscape-management. We show how ecological factors co-create the social sphere where decisions are made about sustainable land-use.
Introduction
Protected areas are increasingly studied and managed as social-ecological systems (SES) where people and ecological systems form complex interactions instead of the traditional view of nature and society being separated (Westley et al., 2002; Ostrom, 2009; Levin et al., 2013). This view calls for new approaches in landscape management that reflect on the multiplicity of views among stakeholders on the one hand and inherent, unpredictable variability of ecosystems on the other (Carlsson and Berkes, 2005; Folke et al., 2005). The study of governance in SES has also uncovered that informal, personal connections are sometimes more influential in natural resource management than formal institutions and strategies with top-down approach. These informal interactions can be uncovered with Social Network Analysis (SNA) that is a powerful tool both for decision makers and researchers (Bodin and Crona, 2009; Bodin and Prell, 2011).
There are numerous studies on how social networks influence natural resource management in various SES, for instance in protected areas (Calvet-Mir et al., 2015), small-scale fisheries (Crona and Bodin, 2010), urban green spaces (Ernstson et al., 2010), rural areas (Hirschi, 2010). Much less is discussed how these networks are formed and what factors influence their structure and their effect on local decision making. Social networks not only shape management through institutional arrangements and communication, but also determine if certain desired goals or processes (such as adaptive co-management or other community based conservation efforts—CBC) are feasible in a particular case (Carlsson and Sandström, 2008; Sandström and Rova, 2010). When stakeholders cooperate, use certain tools and resources together, they usually also share knowledge about the resource system—they form a social network. Central agents in such informal networks may play an important role in shaping public opinion on the state of the ecosystem and the need to change strategies for more sustainable methodologies (Crona and Bodin, 2010). Such informal ties among stakeholders can have a stronger effect on their views than their categorical attributes such as profession (Prell et al., 2010). It is increasingly clear, that the structure of a social network not only sets limits to the desired management options but also offers intervention points that might facilitate the transformation of a governance network into a more flexible, participative web of actors where learning, cooperation and dealing with uncertainty are accepted parts of management (Crona and Hubacek, 2010; Schröter et al., 2018).
SNA is increasingly used in studies and practice of natural resource governance. While this method requires more technical skills than many others, it offers unique insights into the context of stakeholder interests, alliances, conflicts and other relations (Borgatti et al., 2009). SNA is strong in selecting stakeholders for a participative process, where a wide range of views are to be considered, people with different interests have to work together or maybe conflicts are expected (Reed et al., 2009). SNA is a good tool to design interventions to improve conservation or collaboration and also offers a method to evaluate their outcome (Mills et al., 2014; Schröter et al., 2018). Networks often grow in collaborative management systems, but rearrangement of connections may be an even more important development in such situations: rearranging connections show changes in human interactions that might be a result of a new policy, alliance, conflict or other similar changes. Reflecting on the social network structure shows where is healthy and efficient cooperation and where there is need for some intervention (Bixler et al., 2016a). While there is a list of network characteristics that are worth examining in every case of natural resource management (Bodin et al., 2006). SNA often also reveals patterns that are less generalizable yet important in the local context such as consequences of local policies, presence of administrative borders or the role of a specific player with broader effect in the network.
In this paper, we present social networks compiled in five protected areas in South-East Europe. Each network was constructed to assist stakeholder involvement in a local planning process that focused on sustainable management of key ecosystem services (ES). In our study SNA was used to (1) find key players for stakeholder involvement in each of the study areas, (2) identify organizing forces (such as shared location of activity or shared economic sector) behind informal subgroups, (3) test if there is a relationship between communication patterns and ES use and finally (4) to show patterns of conflict and domination between groups of stakeholders. Analyzing the local stakeholder network is also expected to (5) help to assess the feasibility or preconditions of a CBC solution to the various challenges of the protected areas.
Materials and Methods
Data was collected in the Apuseni Nature Park, Romania (APUS); Bükk National Park, Hungary (BUKK); Kalkalpen National Park, Austria (KALK); Tara National Park, Serbia (TARA); Žumberak—Samoborsko gorje Nature Park, Croatia (ZUMB) (see Table 1 and Figure 1). These parks are all karstic areas, primarily covered with forest. Their management is very different, ranging from strict no-disturbance policy (KALK) to parks where park managers have limited influence on the intensive logging within the protected area (BUKK). The study sites were selected from the consortium of the “Eco Karst” project in the Danube Transnational Programme.
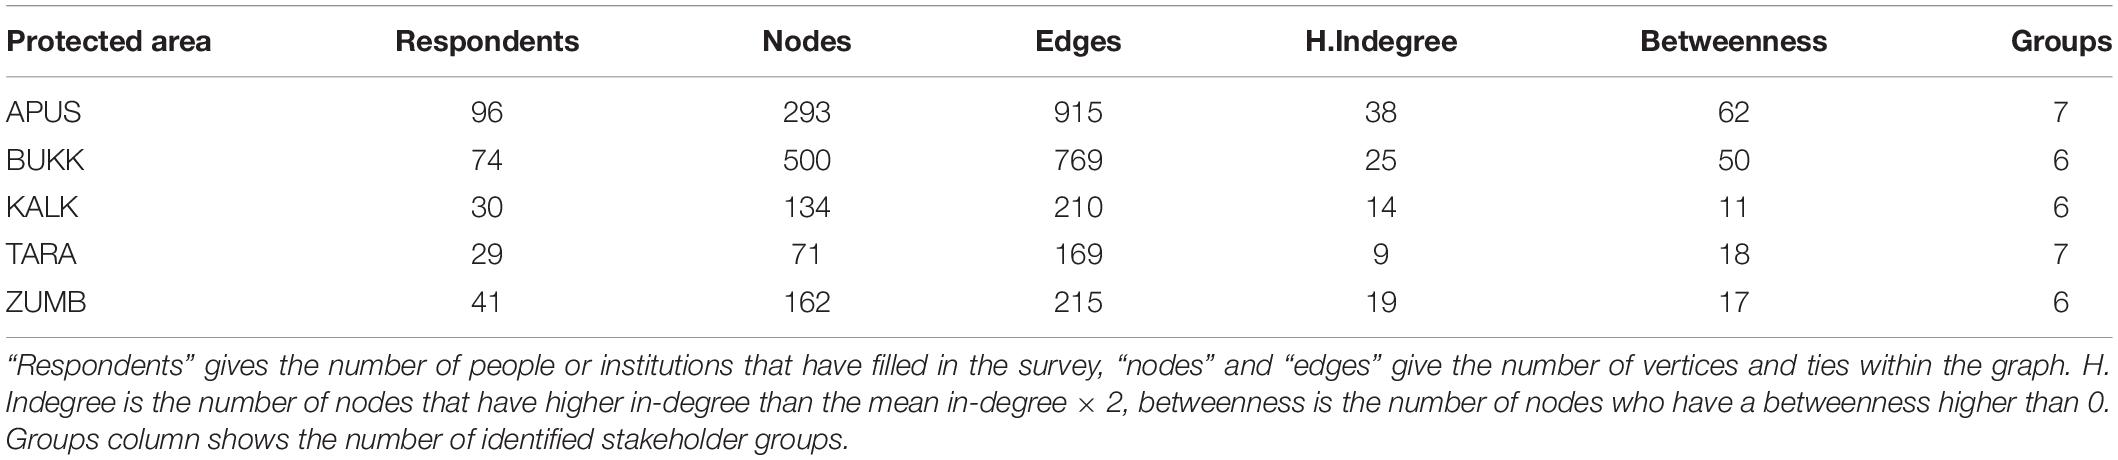
Table 1. Basic description of the network graphs.
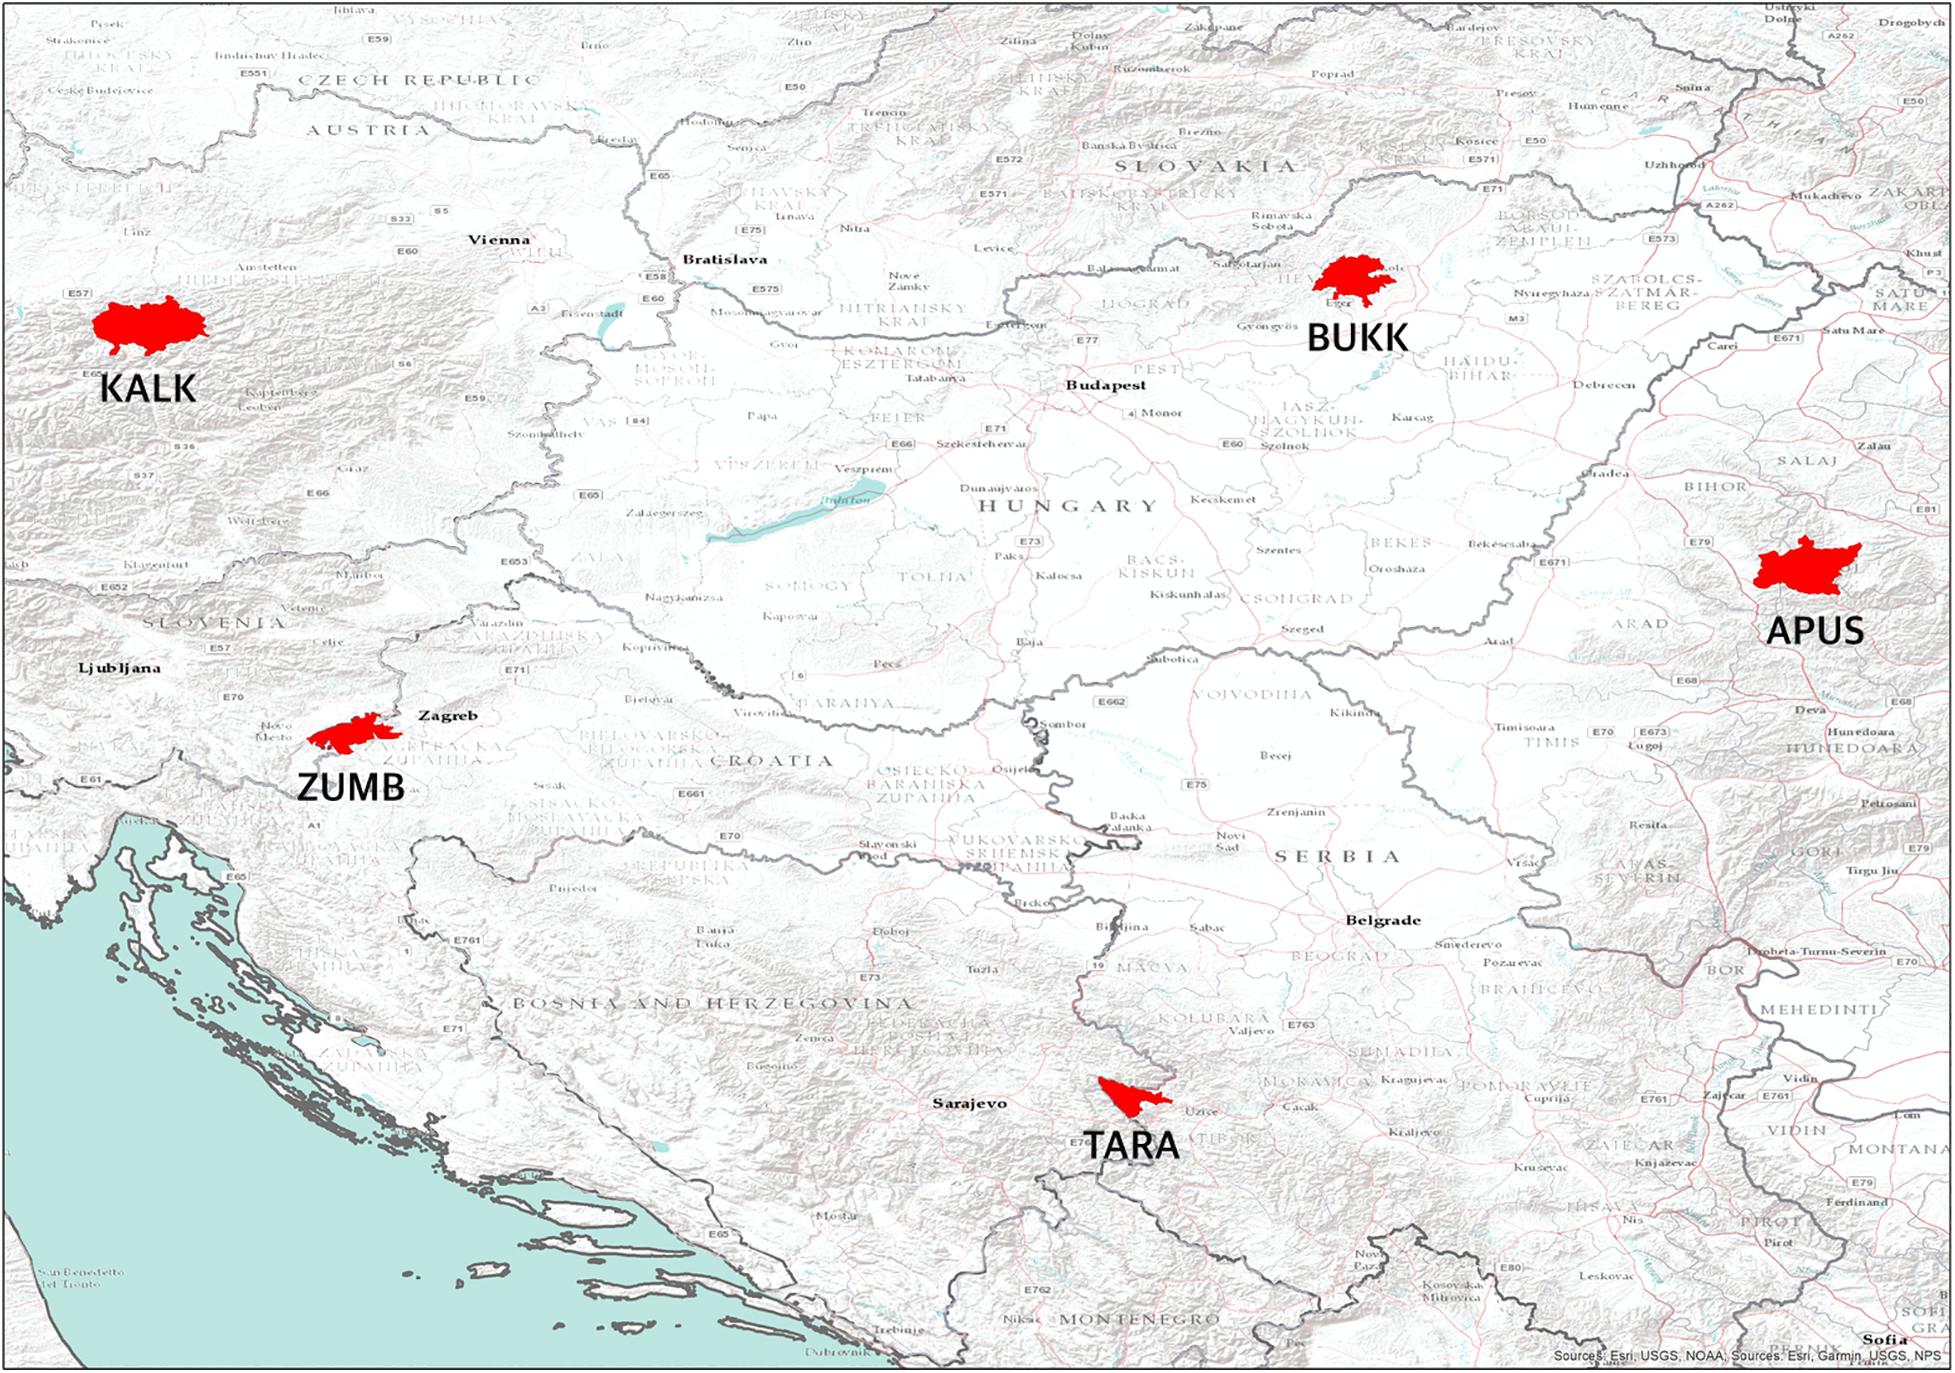
Figure 1. Central-Eastern Europe, our study sites are highlighted with red.
We used SNA to select people for participatory action planning, understand institutional challenges and find intervention points that could improve cooperation in conservation efforts within the five protected areas and with potential pro-biodiversity business efforts. The analysis was organized into a three-step process, similar to the structure recommended by Alexander et al. (2016): (1) creating a database of all possible stakeholders who use the landscape in question or who are interacting with the park management, (2) map power relations among stakeholders, and (3) collect and analyze social network data to inform stakeholder involvement for participatory work.
Stakeholder Groups
The first two steps were completed on a one-day interactive workshop where we worked together with local park-managers to list stakeholders and map their power relations according the framework described by Felipe-Lucia et al. (2015). Using pre-existing databases of external partners of the parks we compiled a list of stakeholders who might have interest in the development of the park. These stakeholders were then categorized by workshop-participants into six-to-seven groups based on their legal status, economic power and land-use strategies (step 1). Groups were placed in a coordinate system where the horizontal axis shows how dependent stakeholders are on local ES while the vertical axis shows how strong their decision-making power is. In this placement the primary ES use of each group was considered where this applied (e.g., forestry—timber) in other cases there were no differences, thus the position is based on a virtual average (e.g., national level regulators—all ES). There are three positions in this framework, that deserve special attention (Figure 2): the upper-left corner where decision makers can be found who do not depend on the landscape in question themselves (usually, national-level governance), the top-right corner, where major resource managers are placed (in our cases, most often forestry) and finally the bottom-right corner, where stakeholders are represented who rely heavily on the ecosystem but have little influence on policy (typically small-scale producers). Besides these important positions, other groups (such as tourism sector) took positions in-between. Apart from identifying the groups and placing them into the power-dependence framework, workshop participants also attached ES to them based on their most important economic or regulatory activities. According to this, some groups only use or manage one ES, others—typically “regulators”—influence a longer list of them (step 2).
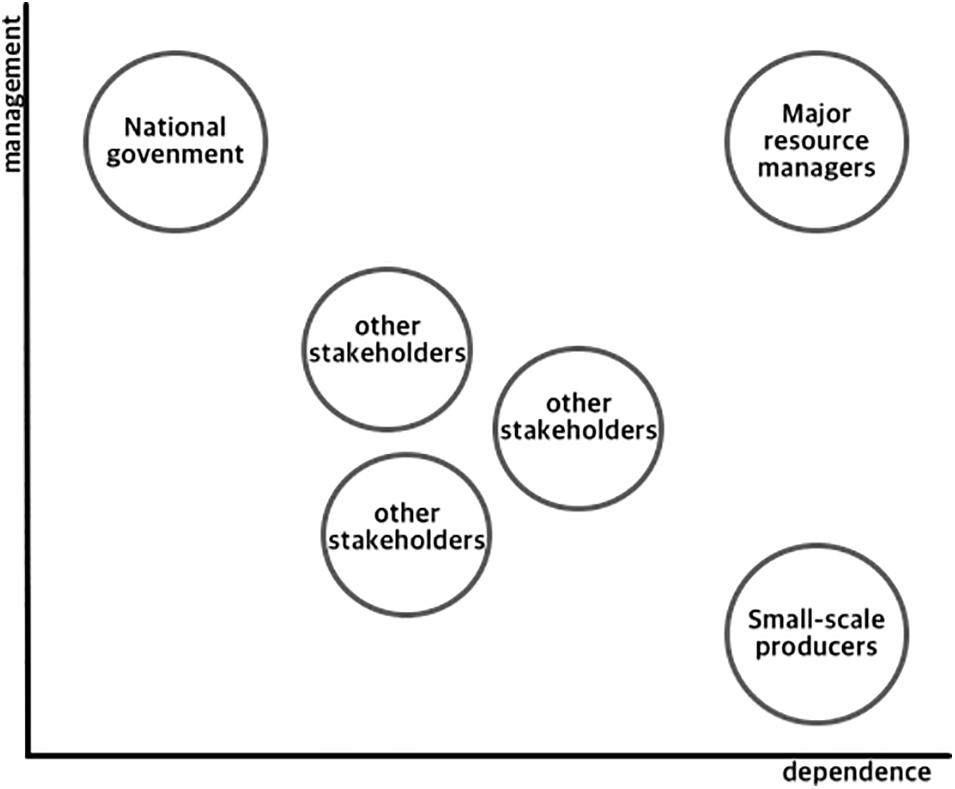
Figure 2. A schematic illustration of stakeholder groups’ power relations.
Data Collection for SNA
Based on these groups a survey was constructed in order to collect social network data, similarly to the one described by Prell et al. (2011). Name (person or institution), location (of activity) and economic sector of the respondent were collected first, then the following question was asked for all stakeholder groups: “Who do you communicate with from group X about issues related to the Y park? Please list up to 5 persons or institutions.” In this question “group X” was substituted with the groups identified in the process described above (steps 1 and 2) while “Y park” refers to the protected areas participating in the project. Questionnaires were translated to local language. Park managers could choose between online and paper-based data collection, but the questions and the structure of the surveys were identical.
Against our expectations, paper-based surveys were much more efficient in data collection both in terms of the volume and completeness of the responses. These were used in two cases (BUKK and APUS) and administered by national park rangers. In all other cases an online survey was distributed among the stakeholders identified in “step 1.” Data was cleaned and spell-checked by the park administrators. After cleaning, data analysis was done with Gephi (Bastian et al., 2009) by national park staff for further use, for which a guidance document was compiled giving a detailed, step by step description of the methods applied for non-expert users (EcoKarst, 2019). A more detailed and documented analysis was done using the igraph 1.2.2 R package (Csardi and Nepusz, 2006) by the authors that is presented in this paper. The anonymized datasets and the R script containing all analyses described in this paper are available in the Open Science Framework repository (Kuslits, 2020).
Network Graphs
Based on the surveys, in all five protected areas a directed social network of stakeholder communication was created (Figure 3). In these graphs, persons and institutions are represented by nodes. Edges represent that the source mentioned the target as a communication partner (see the exact survey question in the previous section), if both parties mentioned each other, two edges were added in the opposite directions. In each case, initially the protected area management authority had the most incoming edges, which is the consequence of the fact, that the park itself let all respondents fill out the survey. This is a by-product of the survey methodology; the park was therefore removed from all graphs to avoid distortion.
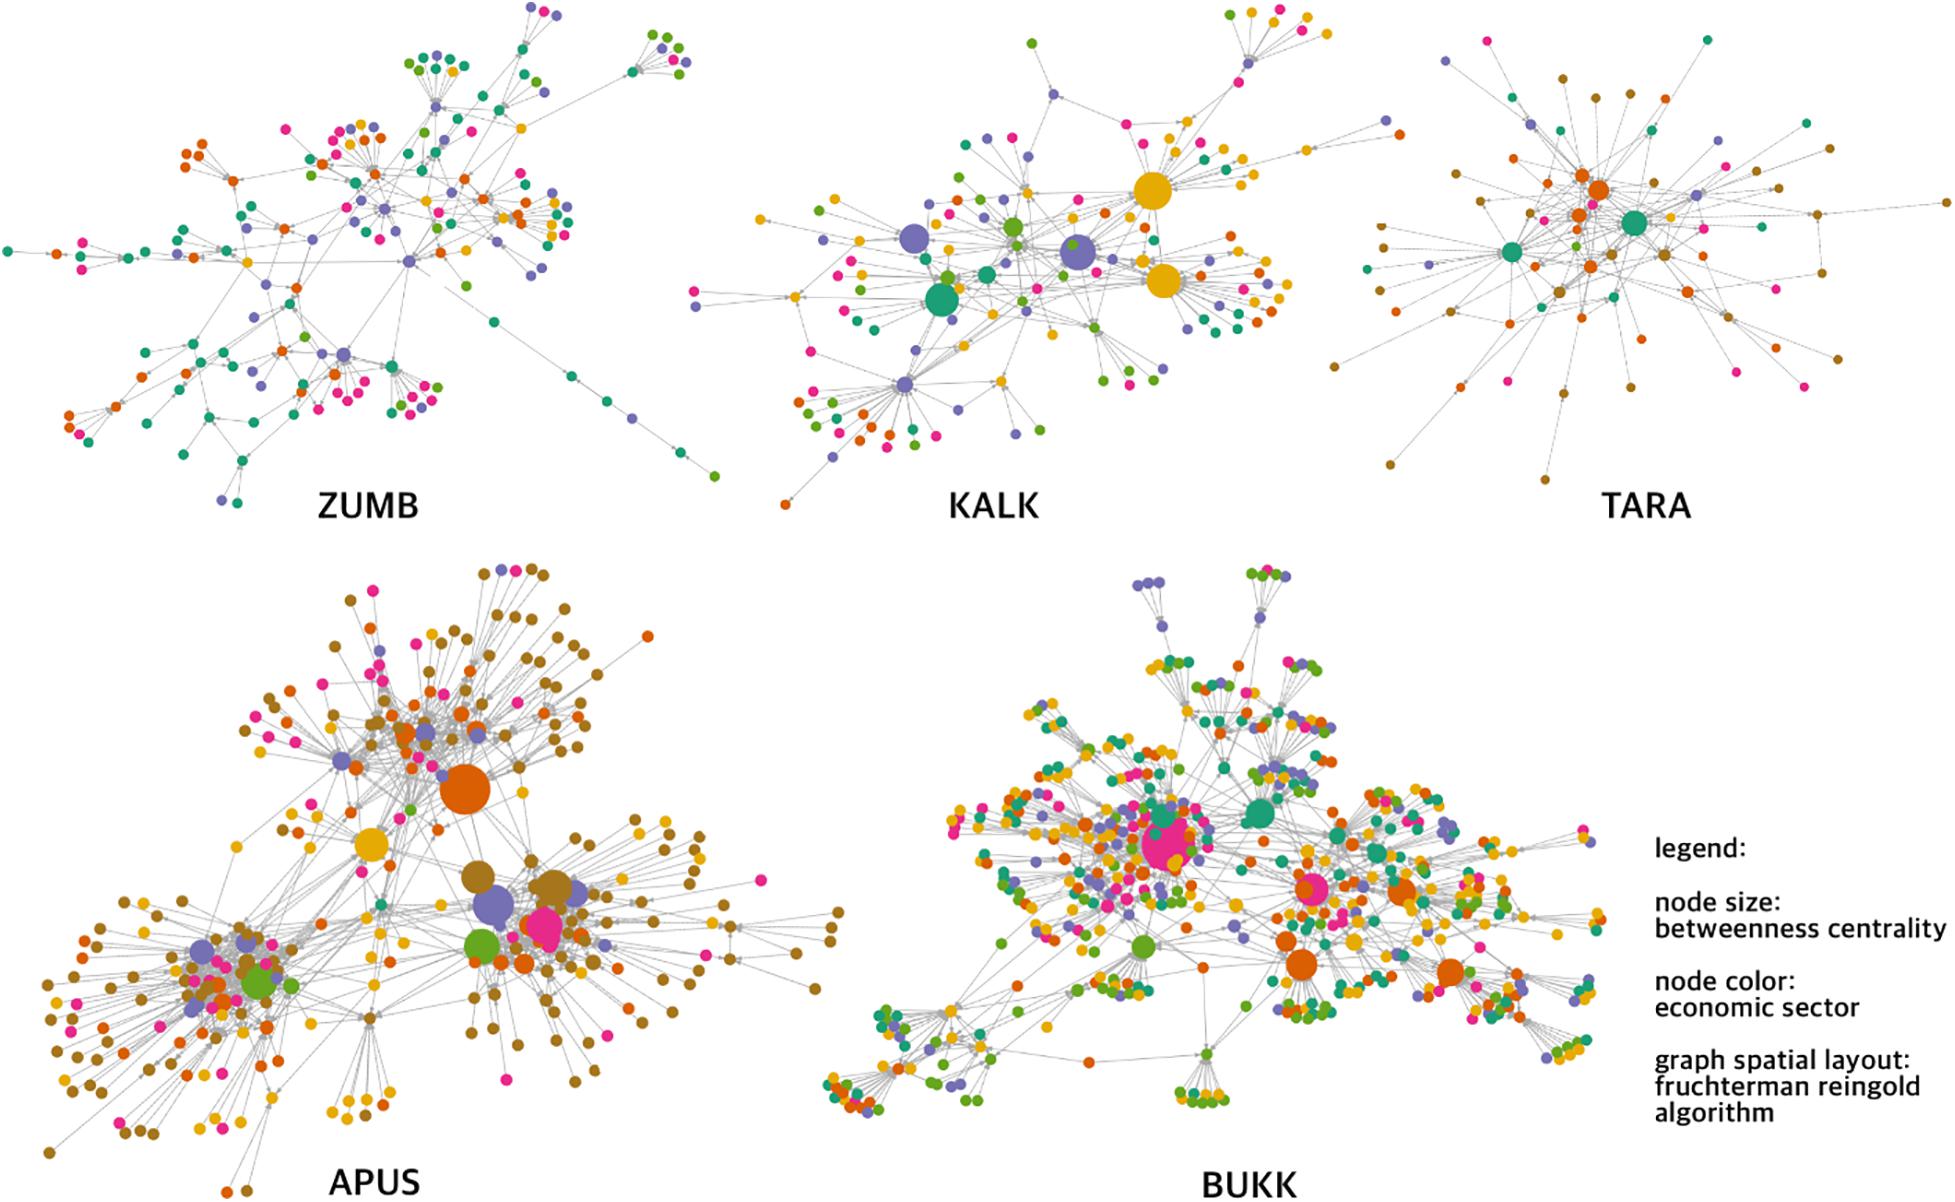
Figure 3. Social network graphs of the 5 study sites.
Key Players
Key players are network members with a special status in the graph structure that enables them to influence the whole system in specific ways. In practice these positions can be a consequence of various social attributes (position, personality traits)—but these cannot be specified exactly only by using SNA. We calculated the in-degree (number of all incoming edges) and betweenness centrality (number of times a node is on the shortest path between two others) of the nodes to find key players in the parks. We interpreted in-degree as a proxy for trust or power, as these nodes have a high number of incoming edges and much less outgoing—this is an influential position in information sharing that can be explained potentially by legal authority in some cases. Betweenness centrality is interpreted as the ability to connect players with different or conflicting views. Conflict is often represented in networks as a lack of connection, thus players having the ability to connect distant groups are in a position to ease these situations (Bodin and Prell, 2011). Players having higher than average values in these two dimensions were all selected for stakeholder involvement (node size on Figure 3 shows betweenness centrality). Before starting the three steps of stakeholder analysis, initial interviews were conducted with the teams from all the participating parks in order to test the efficiency of SNA. They were asked to name the most influential stakeholders based on their personal experience. Some teams were hesitant to choose any, others named some institutions. Comparing their selections with the results of our key player metrics we could test how selection based on a SNA differs from a stakeholder selection process that is based on the personal network of the park management.
Communities
Subsets in a network can be defined for example based on economic sectors, locations and other attributes of the individual nodes. Besides these, there are various algorithms that are able to detect subgroups based on connection patterns instead of categorical variables. The walktrap cluster algorithm in igraph takes short (four step in our case) random walks from the nodes of the graph, following the edges and their directions and defines clusters based on how many times such a path remains inside the same group of nodes. We can interpret the result of this model as communities, or subgroups who tend to circulate information among themselves with some level of relative separation from the rest of the network. Subsets in a network can also be defined for example based on economic sectors, locations and other attributes of the individual nodes. Using chi square test (in R 3.5.1), we compared the group membership generated by walktrap clustering to attribute-based subgroup memberships (location and economic sector) to see whether there is an association that indicates an organizing principle behind communication patterns.
Connections Between Groups
To see the strength of communication between groups, we have contracted individual nodes that belong to the same economic sector into one and merged their ties into undirected, weighted edges (Figure 4). For example, all mentioned NGOs were merged into one node whose connection with another group is an undirected and weighted tie, where the weight is the number of all connections between any member of these two groups in any direction. This way a relative strength of communication can be assessed between pairs of groups. Weak edges (edges with weight less than the median weight within the network) were dropped from these networks in order to make strong communication more apparent.
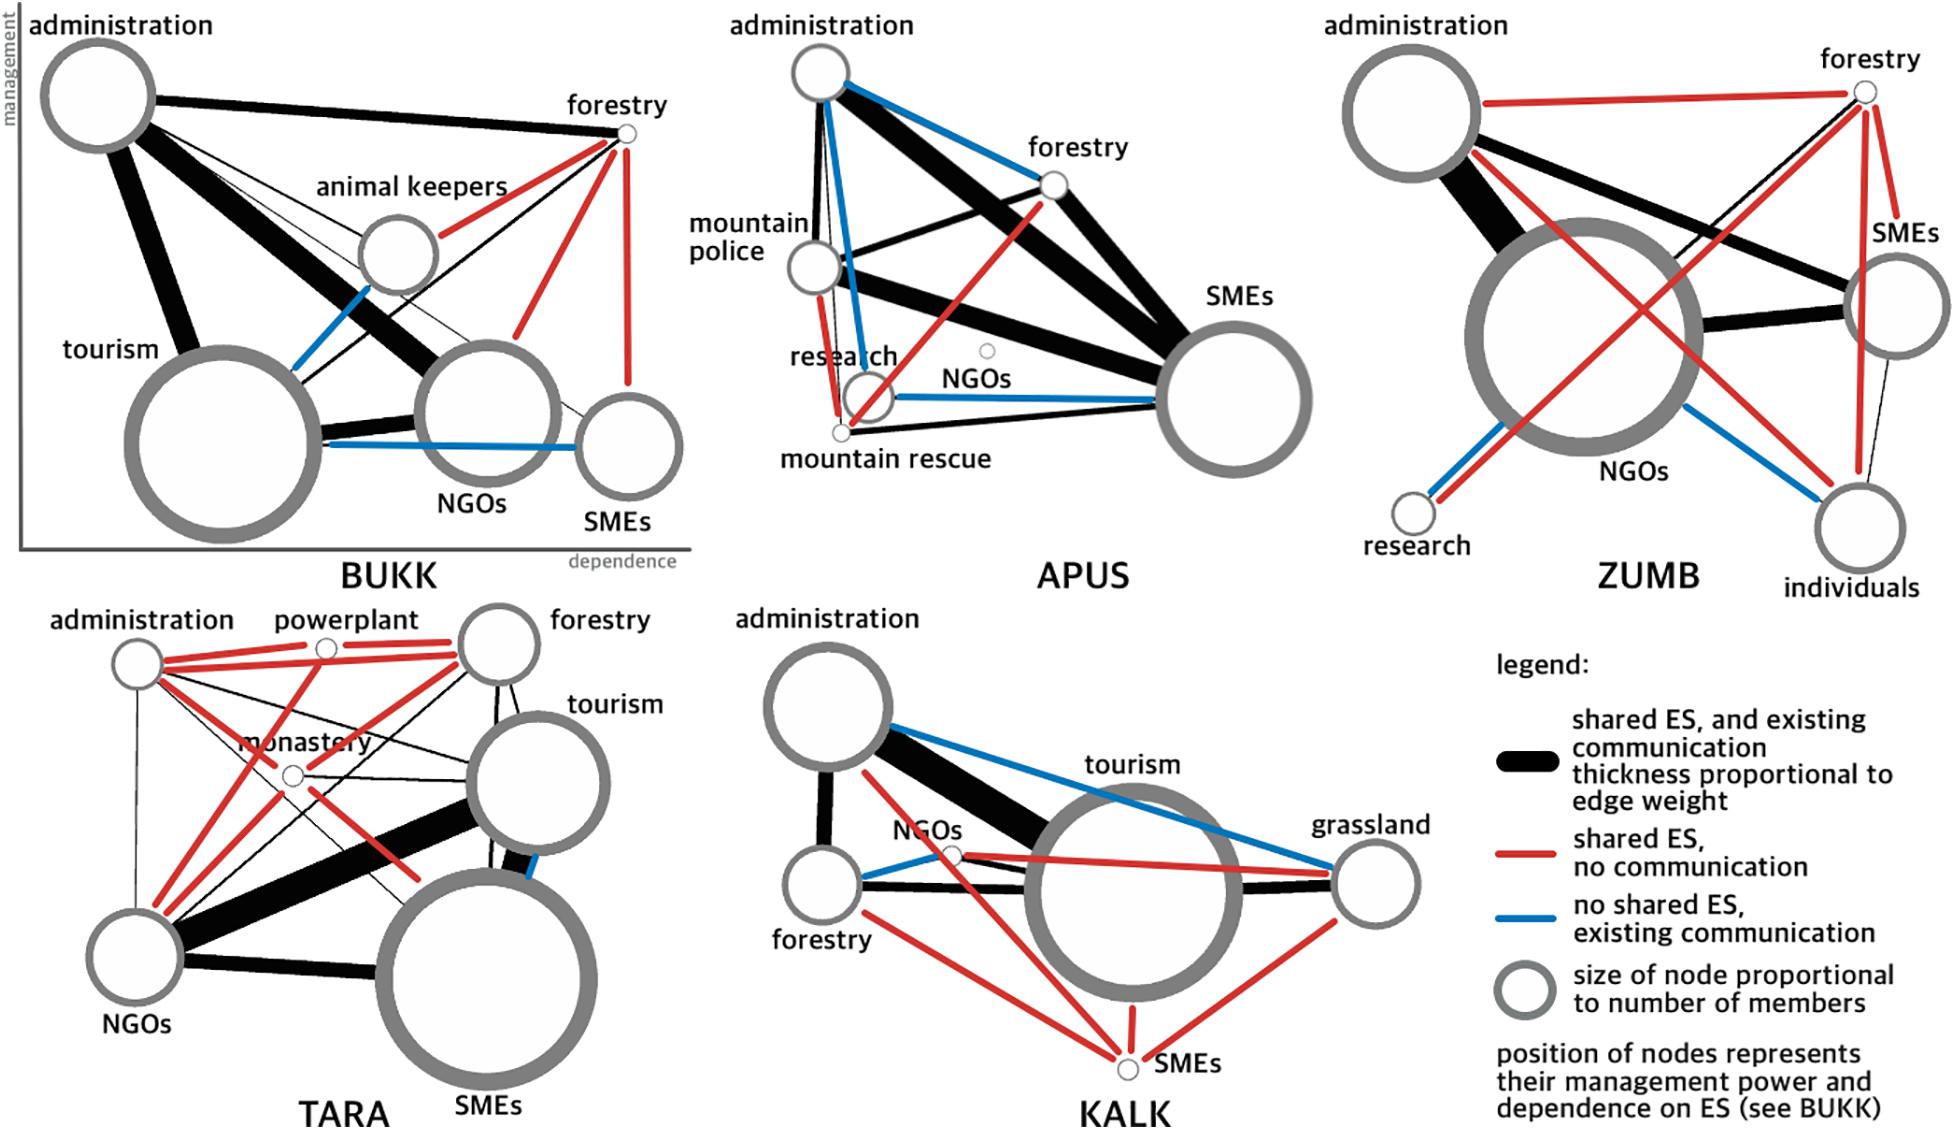
Figure 4. Group-networks, power relations and unexpected communication patterns in the 5 study sites.
When we identified stakeholders (step 1) and analyzed their power relations (step 2) we also collected which ES do the groups manage. From this data, we have created an ES co-management network with undirected, unweighted edges. The nodes in the group-communication network and the ES co-management network are the same, thus comparing the presence and absence of the edges reveals how strong the two processes are associated. When two actors manage together a shared ecosystem element, they inevitably influence the activity, opportunities and economic performance of the other. Sometimes these two actors might be interested in different aspects of the same habitat, for example a water management company has different preferences than a logging company, but both are interested in timber production and forest management in general. In other cases, preferences might be more compatible (for example, hiking and conservation NGOs).
Therefore, we hypothesized that any two groups that co-manage an ES need to have a strong communication connection (many members of both groups are connected to members of the other group), while groups who do not share ES tend to have weak communication connections—thus the presence and absence of edges in the two networks is expected to be the same. Comparing the pattern of edges in the two types of networks between group pairs from all five cases combined was used to test this hypothesis (with chi square test using R 3.5.1).
Results
Network Graphs and Key Players
In Table 1, we have summarized the basic properties of all graphs. It is apparent that the two parks that have used paper-based surveys (APUS, BUKK) were able to collect much more responses in a similar timeframe than the others. By comparing the SNA-identified key players to the list of stakeholders who were suggested as influential during initial interviews with the park management, the park managers did not find the results controversial, but were nevertheless surprised by some of the players that were listed.
Communities
Communication based subgroups (walktrap clusters) were compared with attributes as location and economic sector. Categories generated as a result of walktrap clustering were strongly related to the location attributes of the individual nodes (p-values of chi square test were between 10–8 and 10–16) with the exception of BUKK and TARA where only limited information was collected on location of nodes. This relation is much weaker between economic sectors and walktrap clusters. As walktrap clusters identify subgroups with stronger internal communication, we can conclude that communication is strongly associated with the location of stakeholders and much less with shared (economic) activity. If we look at sub-networks of members belonging to the same economic sector, usually we see many isolates (nodes who are not connected to any other within the subgraph) and a small component of 3–4 nodes (this pattern is typical even if we remove non-respondent nodes to compensate for their missing outgoing edges).
Relationship Between ES Use and Social Connections
In the networks of groups, we found that the weight of edges varies greatly. Weak edges (edge weight below median of all edges within the network) were dropped from these graphs. We compared this network with the ES co-management graphs where the same nodes had different edges based on ES use patterns (Figure 4). There is a significant correlation between the absence and presence of edges in these two networks (p < 0.03 with chi square test calculated on all cases involved together, individual cases are also significant to a lesser extent due to the smaller number of observations: 21–15 node-pairs in one case and 87 node-pairs in all cases combined). In the two graphs, nodes were the same, only edges were somewhat different. These results indicate that ES have a strong influence on formation of social interactions.
While this is a significant result, there are exceptions to this tendency that give some further insight into the formation of relations in the specific protected areas (Figure 4). Among nodes having such exceptional strong edges (group-pairs who do not share any ES in their activities but have a strong connection), usually one group is the tourism sector (40% of all exceptions) or the NGO group (30%). These players naturally tend to have many connections due to the nature of their work. The opposite kind of exceptions that occurred in our graphs consist of node-pairs who do share one or more ES in their activities, yet their communication is weak or non-existent. These pairs most often include the forestry sector (52%), while in other cases these players have some special legal status either with a high level of autonomy in their decisions (30%, e.g., there is a highly autonomous monastery within TARA that manages its land and ES exploitation relatively independent from national park officials or other regulators) or being excluded from the park activities due to conservation regulations (17%, e.g., due to the strict non-disturbance management in KALK).
Discussion
Our study showed that SNA is a feasible and useful tool in non-academic professional environment with limited expert support. While practitioners at the national parks had a deep contextual knowledge of the protected areas, with the application of SNA some new insights could be gained to support a more representative stakeholder involvement process. Key player metrics are one of the basic features of SNA that is also one of the easiest tasks to do once the data is collected. Our results show that such simple analyses can provide results that may not be intuitively available for locals. Since key player metrics have a limited sensitivity for sampling biases, we can conclude that SNA is able to help find key players even in situations where local conflicts, or other factors hinder collection of responses. All network graphs contain more nodes than the number of respondents, probably we also collected data about stakeholders who might not be in a friendly relationship with the park management. Similarly, this method was also able to provide data about players who have high informal power, who are trusted or those who can connect distant groups—despite the fact that these stakeholders themselves have not always responded to the survey. SNA as a method has a broader overview of the stakeholder network than any player within the graph. This means that it is worth the effort to collect and process social network data in order to have a more inclusive and more efficient participatory process.
Network members can be structured in sub-communities in multiple ways. Some of these are based on attributes of the nodes (“location” and “economic sector” in our cases), others rely on structural features of the network. Comparison of such communities offers insights into how communication patterns are shaped. In our case “location” was the strongest organizing factor in stakeholder communication—this finding is in line with results of similar studies conducted elsewhere (Maciejewski and Cumming, 2015). People who belonged to the same economic sector (that also means similar forms of land-use in the cases analyzed) did not have a strong relationship with each other. This is an important finding as it indicates that similar land-use strategies do not necessarily mean frequent communication, stakeholders do not necessarily share experiences with their colleagues within one park. Such a fragmented, localized structure hinders participatory processes and even more community-based landscape management structures (Sandström and Rova, 2010). In similar cases, such network structure is typical: network members tend to communicate with others based on non-professional social ties (kinship, friendship, shared life-history) that build trust over longer periods of time, primarily driven by social similarity (Ramirez-Sanchez, 2011).
We have found that communication patterns are strongly influenced by stakeholders’ reliance on ES. Those stakeholder groups who used or managed the same ES likely also had a strong channel of communication. The exceptions we found to this general rule are worth paying attention to: tourism sector and NGOs sometimes have strong ties to those whom they do not use common ES with, while the largest ES users (such as forest management in our cases) often have only loose ties where strong connections would be expected based on the general pattern of group connections. We believe that this is due to their effort to control the management of the habitat in a disproportionate way, a strategy that is enabled by their overwhelming economic power in the region. Such loose connections are interpreted by local park managers and stakeholders as signs of conflict in the literature (Bixler et al., 2016b) which was verified by the park management in our cases as well. These patterns may be signs of network capture efforts, when one network member tries to control many other members by some formal or informal means and thus extend its power over the whole managed area. These patterns are also hindering participatory processes and may be major obstacles in establishing community-based management structures. The eminent role of forestry among non-communicating players has probably little to do with forestry in particular. We hypothesize this is more a rupture between a powerful manager of a dominant ES and “the rest of stakeholders” who cannot challenge their dominance (economically, ecologically). As the protected areas studied are all forested landscapes, this powerful sector happens to be forestry, while other habitats might show a similar pattern with different dominant players.
Participatory management practices require a certain level of agreement among stakeholders, trust in the process and between the parties involved and flexibility in the management options so that the decisions agreed on can be implemented (Gunderson, 1999). Adaptive management and similar approaches to natural resource management are more popular in theory than in practice as they are often challenging (Lee, 1999). This is in part because conflicts are frequent in challenging management situations and institutions are rarely prepared for a long-term learning process that is necessary for this kind of decision-making. The fact, that adaptive and participative management practices often fail in situations where stakeholder involvement is weak, or cooperation is hindered by conflicts, does not mean that these methods themselves are not appropriate for the specific environmental challenges. In such situations however change, flexible decision making, adjustment of goals and tools are steps that are avoided due to the conflicts—with other words conflicts themselves contribute to rigid management and also hinder experimentation and learning (Rist et al., 2013). In management of SES effective and inclusive (formal and informal) leadership and support from trusted expertise are also necessary to achieve desired goals (Gregory et al., 2006). In a context of conflict, these preconditions are also usually lacking that makes it even harder to implement a new management regime. SNA can help to reveal these possible shortcomings and make it tangible to participants (Schröter et al., 2018) and possibly induce some momentum toward cooperation.
Our analysis of the communication patterns of the natural resource users in the five protected areas shows that professional groups have weak internal communication and powerful resource users tend to communicate sparsely with other stakeholders. These shortcomings are on the one hand consequences of national-level policies, on the other hand consequences of the locally uneven provision of various ES. These two factors reinforce each-other and are mainly responsible for the stability of the present pattern of communication and conflicts. As a consequence, we do not consider participatory or community-based management schemes feasible in the near future in the protected areas involved in our study. Conflict and rigid institutions are in part consequences of poor human decisions, but our results also show, that ecosystem services in themselves are a strong force shaping social networks, thus stakeholders might find themselves completely separated in a social network without ever engaging in a conflict. CBC methods are efficient to establish sustainable resource management but creating the preconditions for them requires long term effort. Key players identified with SNA can be crucial in pursuing this strategic goal.
Data Availability Statement
The original contributions presented in the study are included in the article/supplementary material, further inquiries can be directed to the corresponding author/s. The anonymized datasets and the R script containing all analyses described in this paper are available in the Open Science Framework repository (Kuslits, 2020).
Author Contributions
BK designed the study and conducted data analysis. BK, ÁV, ET, RA, and IA conducted and analyzed workshops and interviews. AD, RB, ZL, DK, and RM collected empirical data, cleaned database, and interpreted the local context. All authors contributed to the article and approved the submitted version.
Funding
This work was implemented within the frames of ECO KARST project, funded by the Interreg Danube Transnational Programme of the European Union (DTP1-1-159-2).
Conflict of Interest
The authors declare that the research was conducted in the absence of any commercial or financial relationships that could be construed as a potential conflict of interest.
References
Alexander, S. M., Andrachuk, M., and Armitage, D. (2016). Navigating governance networks for community-based conservation. Front. Ecol. Environ. 14:155–164. doi: 10.1002/fee.1251
Bastian, M., Heymann, S., and Jacomy, M. (2009). Gephi: An Open-Source Software for Exploring and Manipulating Networks. Available online at: https://www.aaai.org/ocs/index.php/ICWSM/09/paper/view/154 (accessed November 10, 2020)
Bixler, R. P., Johnson, S., Emerson, K., Nabatchi, T., Reuling, M., Curtin, C., et al. (2016a). Networks and landscapes: a framework for setting goals and evaluating performance at the large landscape scale. Front. Ecol. Environ. 14:145–153. doi: 10.1002/fee.1250
Bixler, R. P., Wald, D. M., Ogden, L. A., Leong, K. M., Johnston, E. W., and Romolini, M. (2016b). Network governance for large-scale natural resource conservation and the challenge of capture. Front. Ecol. Environ. 14:165–171. doi: 10.1002/fee.1252
Bodin, Ö, Crona, B., and Ernstson, H. (2006). Social networks in natural resource management: what is there to learn from a structural perspective? Ecol. Soc. 11:8. doi: 10.5751/ES-01808-1102r02
Bodin, Ö, and Crona, B. I. (2009). The role of social networks in natural resource governance: what relational patterns make a difference? Glob. Environ. Change 19, 366–374. doi: 10.1016/j.gloenvcha.2009.05.002
Bodin, Ö, and Prell, C. (eds) (2011). Social Networks and Natural Resource Management. New York, NY: Cambridge University Press. doi: 10.1017/CBO9780511894985
Borgatti, S. P., Mehra, A., Brass, D. J., and Labianca, G. (2009). Network analysis in the social sciences. Science 323, 892–895. doi: 10.1126/science.1165821
Calvet-Mir, L., Maestre-Andrés, S., Molina, J. L., and van den Bergh, J. (2015). Participation in protected areas: a social network case study in Catalonia. Spain. Ecol. Soc. 20:45. doi: 10.5751/ES-07989-200445
Carlsson, L., and Berkes, F. (2005). Co-management: concepts and methodological implications. J. Environ. Manag. 75, 65–76. doi: 10.1016/j.jenvman.2004.11.008
Carlsson, L., and Sandström, A. (2008). Network governance of the commons. Int. J. Commons 2, 33–54. doi: 10.18352/ijc.20
Crona, B., and Bodin, Ö (2010). Power asymmetries in small-scale fisheries: a barrier to governance transformability? Ecol. Soc. 15:32. doi: 10.5751/ES-03710-150432
Crona, B., and Hubacek, K. (2010). The right connections: how do social networks lubricate the machinery of natural resource governance? Ecol. Soc. 15:18. doi: 10.5751/ES-03731-150418
Csardi, G., and Nepusz, T. (2006). The igraph software package for complex network research. InterJournal Complex Syst. 1695.
EcoKarst (2019). Mapping of Ecosystem Services at the Regional Level - A Practical Guide. Available online at: http://www.interreg-danube.eu/approved-projects/eco-karst/outputs [Accessed June 2, 2020]
Ernstson, H., Barthel, S., Andersson, E., and Borgström, S. T. (2010). Scale-crossing brokers and network governance of urban ecosystem services: the case of stockholm. Ecol. Soc. 15:28. doi: 10.5751/ES-03692-150428
Felipe-Lucia, M. R., Martín-López, B., Lavorel, S., Berraquero-Díaz, L., Escalera-Reyes, J., and Comín, F. A. (2015). Ecosystem services flows: why stakeholders’ power relationships matter. PloS One 10:e0132232. doi: 10.1371/journal.pone.0132232
Folke, C., Hahn, T., Olsson, P., and Norberg, J. (2005). Adaptive governance of social-ecological systems. Annu. Rev. Environ. Resour. 30, 441–473. doi: 10.1146/annurev.energy.30.050504.144511
Gregory, R., Ohlson, D., and Arvai, J. (2006). Deconstructing adaptive management: criteria for applications to environmental management. Ecol. Appl. 16, 2411–2425. doi: 10.1890/1051-0761(2006)016[2411:DAMCFA]2.0.CO;2
Gunderson, L. (1999). Resilience, flexibility and adaptive management - - antidotes for spurious certitude? Conserv. Ecol. 3:7. doi: 10.5751/ES-00089-030107
Hirschi, C. (2010). Strengthening regional cohesion: collaborative networks and sustainable development in swiss rural areas. Ecol. Soc. 15. doi: 10.5751/ES-03714-150416 [Epub ahead of print].
Levin, S., Xepapadeas, T., Crépin, A.-S., Norberg, J., de Zeeuw, A., Folke, C., et al. (2013). Social-ecological systems as complex adaptive systems: modeling and policy implications. Environ. Dev. Econ. 18, 111–132. doi: 10.1017/S1355770X12000460
Maciejewski, K., and Cumming, G. S. (2015). The relevance of socioeconomic interactions for the resilience of protected area networks. Ecosphere 6:145. doi: 10.1890/ES15-00022.1
Mills, M., Álvarez-Romero, J. G., Vance-Borland, K., Cohen, P., Pressey, R. L., Guerrero, A. M., et al. (2014). Linking regional planning and local action: towards using social network analysis in systematic conservation planning. Biol. Conserv. 169, 6–13. doi: 10.1016/j.biocon.2013.10.015
Ostrom, E. (2009). A general framework for analyzing sustainability of social-ecological systems. Science 325, 419–422. doi: 10.1126/science.1172133
Prell, C., Reed, M., and Hubacek, K. (2011). “Social network analysis for stakeholder selection and the links to social learning and adaptive co-management,” in Social Networks and Natural Resource Management, ed. Ö Bodin (New York, NY: Cambridge University Press), 95–118. doi: 10.1017/CBO9780511894985.006
Prell, C., Reed, M., Racin, L., and Hubacek, K. (2010). Competing structure, competing views: the role of formal and informal social structures in shaping stakeholder perceptions. Ecol. Soc. 15:34. doi: 10.5751/ES-03652-150434
Ramirez-Sanchez, S. (2011). “The role of individual attributes in the practice of information sharing among fishers from Loreto, BCS, Mexico,” in Social Networks and Natural Resource Management, ed. Ö Bodin (Cambridge: Cambridge University Press), 234–254.
Reed, M. S., Graves, A., Dandy, N., Posthumus, H., Hubacek, K., Morris, J., et al. (2009). Who’s in and why? A typology of stakeholder analysis methods for natural resource management. J. Environ. Manage. 90, 1933–1949.
Rist, L., Felton, A., Samuelsson, L., Sandström, C., and Rosvall, O. (2013). A new paradigm for adaptive management. Ecol. Soc. 18:63. doi: 10.1016/j.jenvman.2009.01.001
Sandström, A., and Rova, C. (2010). The network structure of adaptive governance: a single case study of a fish management area. Int. J. Commons 4, 528–551.
Schröter, B., Hauck, J., Hackenberg, I., and Matzdorf, B. (2018). Bringing transparency into the process: social network analysis as a tool to support the participatory design and implementation process of payments for ecosystem services. Ecosyst. Serv. 34, 206–217. doi: 10.18352/ijc.156
Westley, F., Carpenter, S., Brock, W. A., Holling, C. S., and Gunderson, L. H. (2002). “Why systems of people and nature are not just social and ecological systems,” in Panarchy:Understanding Transformations in Human and Natural Systems, eds L. H. Gunderson and C. S. Holling (Washington, DC: Island Press), 103–119. doi: 10.1016/j.ecoser.2018.03.007
Keywords: ecosystem services, social network analysis, participatory management, resource management, conflict resolution, adaptive management
Citation: Kuslits B, Vári Á, Tanács E, Aszalós R, Drasovean A, Buchriegler R, Laufer Z, Krsic D, Milanovic R and Arany I (2021) Ecosystem Services Becoming Political: How Ecological Processes Shape Local Resource-Management Networks. Front. Ecol. Evol. 9:635988. doi: 10.3389/fevo.2021.635988
Received: 30 November 2020; Accepted: 15 February 2021;
Published: 05 March 2021.
Edited by:
Antonio Bodini, University of Parma, ItalyReviewed by:
Kristi Maciejewski, Stellenbosch University, South AfricaMartin Drechsler, Helmholtz Centre for Environmental Research (UFZ), Germany
Copyright © 2021 Kuslits, Vári, Tanács, Aszalós, Drasovean, Buchriegler, Laufer, Krsic, Milanovic and Arany. This is an open-access article distributed under the terms of the Creative Commons Attribution License (CC BY). The use, distribution or reproduction in other forums is permitted, provided the original author(s) and the copyright owner(s) are credited and that the original publication in this journal is cited, in accordance with accepted academic practice. No use, distribution or reproduction is permitted which does not comply with these terms.
*Correspondence: Béla Kuslits, YmVsYUBrdXNsaXRzLmh1