
95% of researchers rate our articles as excellent or good
Learn more about the work of our research integrity team to safeguard the quality of each article we publish.
Find out more
ORIGINAL RESEARCH article
Front. Ecol. Evol. , 01 April 2021
Sec. Biogeography and Macroecology
Volume 9 - 2021 | https://doi.org/10.3389/fevo.2021.628606
This article is part of the Research Topic The Ecology, Evolution, and Preservation of Biodiversity in Amazonian Floodplain Ecosystems View all 7 articles
 John Ethan Householder1
 Jochen Schöngart2Maria T. F. Piedade2Wolfgang J. Junk3
 Hans ter Steege4,5Juan Carlos Montero6Rafael L. de Assis7Daniel Praia Portela de Aguiar8
 Maihyra Marina Pombo2Adriano Costa Quaresma2Layon O. Demarchi2Pia Parolin9
 Aline Lopes10Gildo Vieira Feitoza2
 Flávia Machado Durgante2Bianca Weiss Albuquerque2Antonia Chu11Daniel Enßlin11Tobias Fabian11Kirke Fettweiß11Moritz Hirsch11Myriam Hombach11Alisa Hubbuch11Benedikt Hutter11Timo Jäger11Ronja Kober-Moritz11Meike K. R. Lindner11Felix Maier11Julia Nowak11Zoe Petridis11Larissa Schierling11Erika Snjaric11Gregory Egger1Erika Schneider1
 Christian Damm1
 Florian Wittmann1,2*
The large flood pulse of the Amazon basin is a principal driver of environmental heterogeneity with important implications for ecosystem function and the assembly of natural communities. Understanding species ecological response to the flood pulse is thus a key question with implications for theories of species coexistence, resource management, and conservation. Yet these remain largely undescribed for most species, and in particular for trees. The large flood pulse and high tree diversity of the Negro River floodplain makes it an ideal system to begin filling this knowledge gap. We merged historical hydrologic data with 41 forest inventories under variable flooding conditions distributed across the Negro River basin, comprising a total area of 34 ha, to (i) assess the importance of flood duration as a driver of compositional variation, (ii) model the response curve shapes of 111 of the most frequent tree species in function of flood duration, and (iii) derive their niche properties (optima and tolerance). We found that flood duration is a strong driver of compositional turnover, although the majority site-to-site variation in forest composition still remains unexplained. About 73% of species responded to the flood duration gradient, exhibiting a diversity of shapes, but most frequently skewed. About 29% of species were clearly favored by flood durations >120 days year–1, and 44% of species favored by shorter floods. The median niche breadth was 85 flood days year–1, corresponding to approximately 30% of the flood duration gradient. A significant subset of species (27%) did not respond to flooding, but rather exhibited wide tolerance to the flood gradient. The response models provided here offer valuable information regarding tree species differential capacity to grow, survive, and regenerate along an ecologically important gradient and are spatially valid for the Amazon Negro basin. These attributes make them an appealing tool with wide applicability for field and experimental studies in the region, as well as for vegetation monitoring and simulation models of floodplain forest change in the face of hydrologic alteration.
In large Amazonian river floodplains, annual water level oscillation – the flood pulse – generates immense site-to-site hydrologic variation with important consequences for ecosystem functioning and the assembly of natural communities (i.e., Junk, 1989; Ferreira, 2000; Wittmann et al., 2002, 2006). As forest communities occupy 70–90% of floodplain areas in the Amazon (Melack and Hess, 2010) and underpin many aspects of ecosystem function, understanding the species-specific responses of tree species to the flood pulse is a key question with implications to ecosystem management, conservation planning, as well as to theories of species coexistence (Junk et al., 1989; Killeen and Solórzano, 2008; Wittmann et al., 2013).
The traditional approach to study species-environment distributions in Amazonian floodplains has relied heavily on ordination methods of multi-species assemblages sampled along flooding, disturbance, and/or soil nutrition gradients (e.g., Junk, 1989; Ferreira, 2000; Wittmann et al., 2004; Montero et al., 2014; Assis et al., 2015; Targhetta et al., 2015). This approach has beyond doubt established that differences in flooding exert considerable control on tree species composition. Compositional variation observed along the flooding gradient has most often been ascribed to differences in the capacity of species to tolerate waterlogging, thus contributing to the widely held hypothesis that species occupy limited and predictable ranges of flooding where they are best suited (Junk, 1989). Data and tests verifying this, however, are lacking, representing a major knowledge gap in our understanding of Amazonian floodplain forests. The species-level flooding relationships needed are rarely derived from approaches based on ordination of multiple assemblages and, if they are, often based on limited data and weakly supported assumptions that species ecological response along the flood gradient is symmetric and unimodal (Ter Braak, 1987). A more flexible, data-driven approach to characterizing the species-specific ecological responses of trees to flooding is likely to be a more fruitful approach with wider applicability.
Here, we model the response curves of 111 of the most frequent tree species in floodplains of the Negro River basin in the central and northwestern Brazilian Amazon to the natural flood pulse. The basin provides good opportunity to study the distribution and ecological niche of tree species along the hydrologic gradient. First, it is amongst the largest in the world in terms of its drainage volume (Latrubesse, 2008), and its floodplains cover large areas still relatively unaffected by human disturbance (Junk et al., 2011). Second, the basin’s large seasonal flood pulse subjects floodplain forests to some of the most severe hydrologic conditions world-wide, with some experiencing up to 300 flood days annually and flood heights up to 9 m (Wittmann et al., 2010; Junk et al., 2015). This long flooding gradient provides opportunity for better discrimination among species regarding their tolerance for growth and survival under different flood conditions. Lastly, river channels in the basin are mostly geomorphologically stable on time-scales relative to the life cycle of trees, a phenomenon related to the underlying Precambrian geology and the limited sediment load of the rivers (Furch and Klinge, 1989; Latrubesse and Franzinelli, 2005; Junk et al., 2011, 2015). This condition contrasts starkly with other Amazonian lowland rivers, where sedimentation-erosion processes modify floodplain surface topography through constant erosion, deposition and channel migration from year to year, causing constant resetting of forest succession (Kalliola et al., 1991; Mertes et al., 1996; Wittmann et al., 2004; Peixoto et al., 2009). The relative geomorphic stability of rivers in the Negro basin implies that tree distributions should reflect equilibria with long-term hydrologic regimes, rather than past disturbance and succession history caused by alluvial geomorphology.
More intimate knowledge of species ecological response to flooding in the Negro River basin is likely to have a variety of regional applications. For example, a growing number of field studies document cumulative impacts on Amazonian floodplain forests resulting from hydroelectric dams and the alteration of downstream river hydrology that their operation causes (i.e., Wittmann et al., 2015; Assahira et al., 2017; Forsberg et al., 2017; Latrubesse et al., 2017; Lobo et al., 2019; Rocha et al., 2019; Resende et al., 2020; Schöngart et al., 2021). However, parameterization of predictive or simulation models about these impacts are not possible without better information on species-flooding relationships. Improved species-level knowledge is also required to answer long-standing questions regarding the functional and evolutionary underpinnings of flood tolerance, which are central to our understanding of species coexistence and community assembly (Householder et al., 2015, 2017; Aldana et al., 2017; Mori et al., 2019; Fontes et al., 2020).
Our objective here is to provide species-specific ecological responses to hydrologic variability in the Negro river basin. To describe site hydrologic conditions, we estimate the mean annual flood duration (days year–1). Flood duration is expected to strongly act on species distributions through known physio-chemical processes, namely the cumulative impacts on plant growth resulting from reduced gas diffusion required for aerobic metabolism (Colmer and Voesenek, 2009). Previous studies, however, have also shown vegetation patterns to correlate with differences in flood heights, and even binary categories (flooded vs. non-flooded; Wittmann et al., 2013) which may also correlate with physiologically active variables that shape species distributions. We therefore first examine covariation and spatial pattern among hydrologic metrics commonly employed in vegetation analysis. We then model species response curves along the flood duration gradient using Huisman–Olff–Fresco (HOF) models (Huisman et al., 1993; Jansen and Oksanen, 2013) and derive parameters describing species niche positions to ask the following questions: (1) to what degree do differences in flood duration explain dissimilarity in forest composition among sites? (2) how do individual species respond to the flood duration gradient? Finally, we discuss a variety of approaches by which our results might be applied to other research questions.
The Negro River basin covers 712,000 km2, including areas in Brazil, Colombia and Venezuela. With a mean annual discharge of 28,400 m3 s–1, the Negro River contributes approximately 35% of the water to the Amazon River, is the largest black-water river on Earth, and belongs to one of the ten largest rivers worldwide (Latrubesse, 2008; Junk et al., 2015). The Negro River also hosts the two largest freshwater archipelagos (Mariuá and Anavilhanas; Latrubesse and Franzinelli, 2005). About 119,000 km2 of the basin are covered by floodplains (igapó) with forest coverage >85% (Melack and Hess, 2010). The catchment covers strongly weathered kaolinitic soils, podzols, and the rocky Guiana Shield. Water is generally poor in suspended solids and rich in humic substances, which give it a dark brown color. As annual floods carry little dissolved and suspended nutrients, soil nutrition in the floodplains is low (Junk et al., 2015).
A total of 41 permanent floristic inventories in floodplain forests along the Negro River and the lower courses of seven tributaries in the central and northwestern Brazilian Amazon were installed during low river water levels (usually August-December) between 2007 and 2019 by the MAUA working group (Ecology, Monitoring and Sustainable Use of Wetlands) of the National Institute for Amazon Research (INPA, Manaus-Brazil). Inventories were located at the Anavilhanas arquipelago, near the cities of Barcelos, at the Mariuá arquipelago, near the city of Santa Isabel do Rio Negro, and at the lower courses of the Negro River tributaries, including (from SE to NW) the Cuieiras, Jaú, Branco, Jufaris, Cuiuni, Aracá, and Padauari Rivers (Figure 1A and Supplementary Table 1). Among these sites, the number and area of inventories differed, with a minimum of 1.5 ha at the Cuieiras and Araca Rivers (three and two inventories, respectively) to a maximum of 10 ha at the Jaú River (ten 1-ha inventories). In total, 34 ha were inventoried. At each study site we sought to capture as much of the local flooding gradient as possible by using water-level marks on tree stems as a local reference to discriminate among (usually) three distinct topographic levels for separate floristic inventories. Individual inventories were oriented to follow topographic isohypses to ensure similar flooding conditions within a single sample. The stratified sampling strategy over a geographically large area assures that ecological response models do not merely reflect local species-flooding correlations specific to any one site, but rather correlations with wide spatial validity. All stems with diameter at breast height ≥10 cm were tagged with numbered aluminum plates, measured in diameter, and identified to the lowest taxonomic level possible by consultation with voucher specimen in herbaria (INPA, Missouri and New York Botanical Gardens), specialized literature, and expert knowledge. Species names were verified following the Taxonomic Name Resolution Service (iPlantcollaborativeTM, Taxonomic Name Resolution Service – Home), version 4.1, excluding unidentified species and treating synonymous species under the currently valid name. To ensure a standardized taxonomy comparable to other publications, we further improved our species list following the list of verified species names provided by Cardoso et al. (2017) and ter Steege et al. (2019).
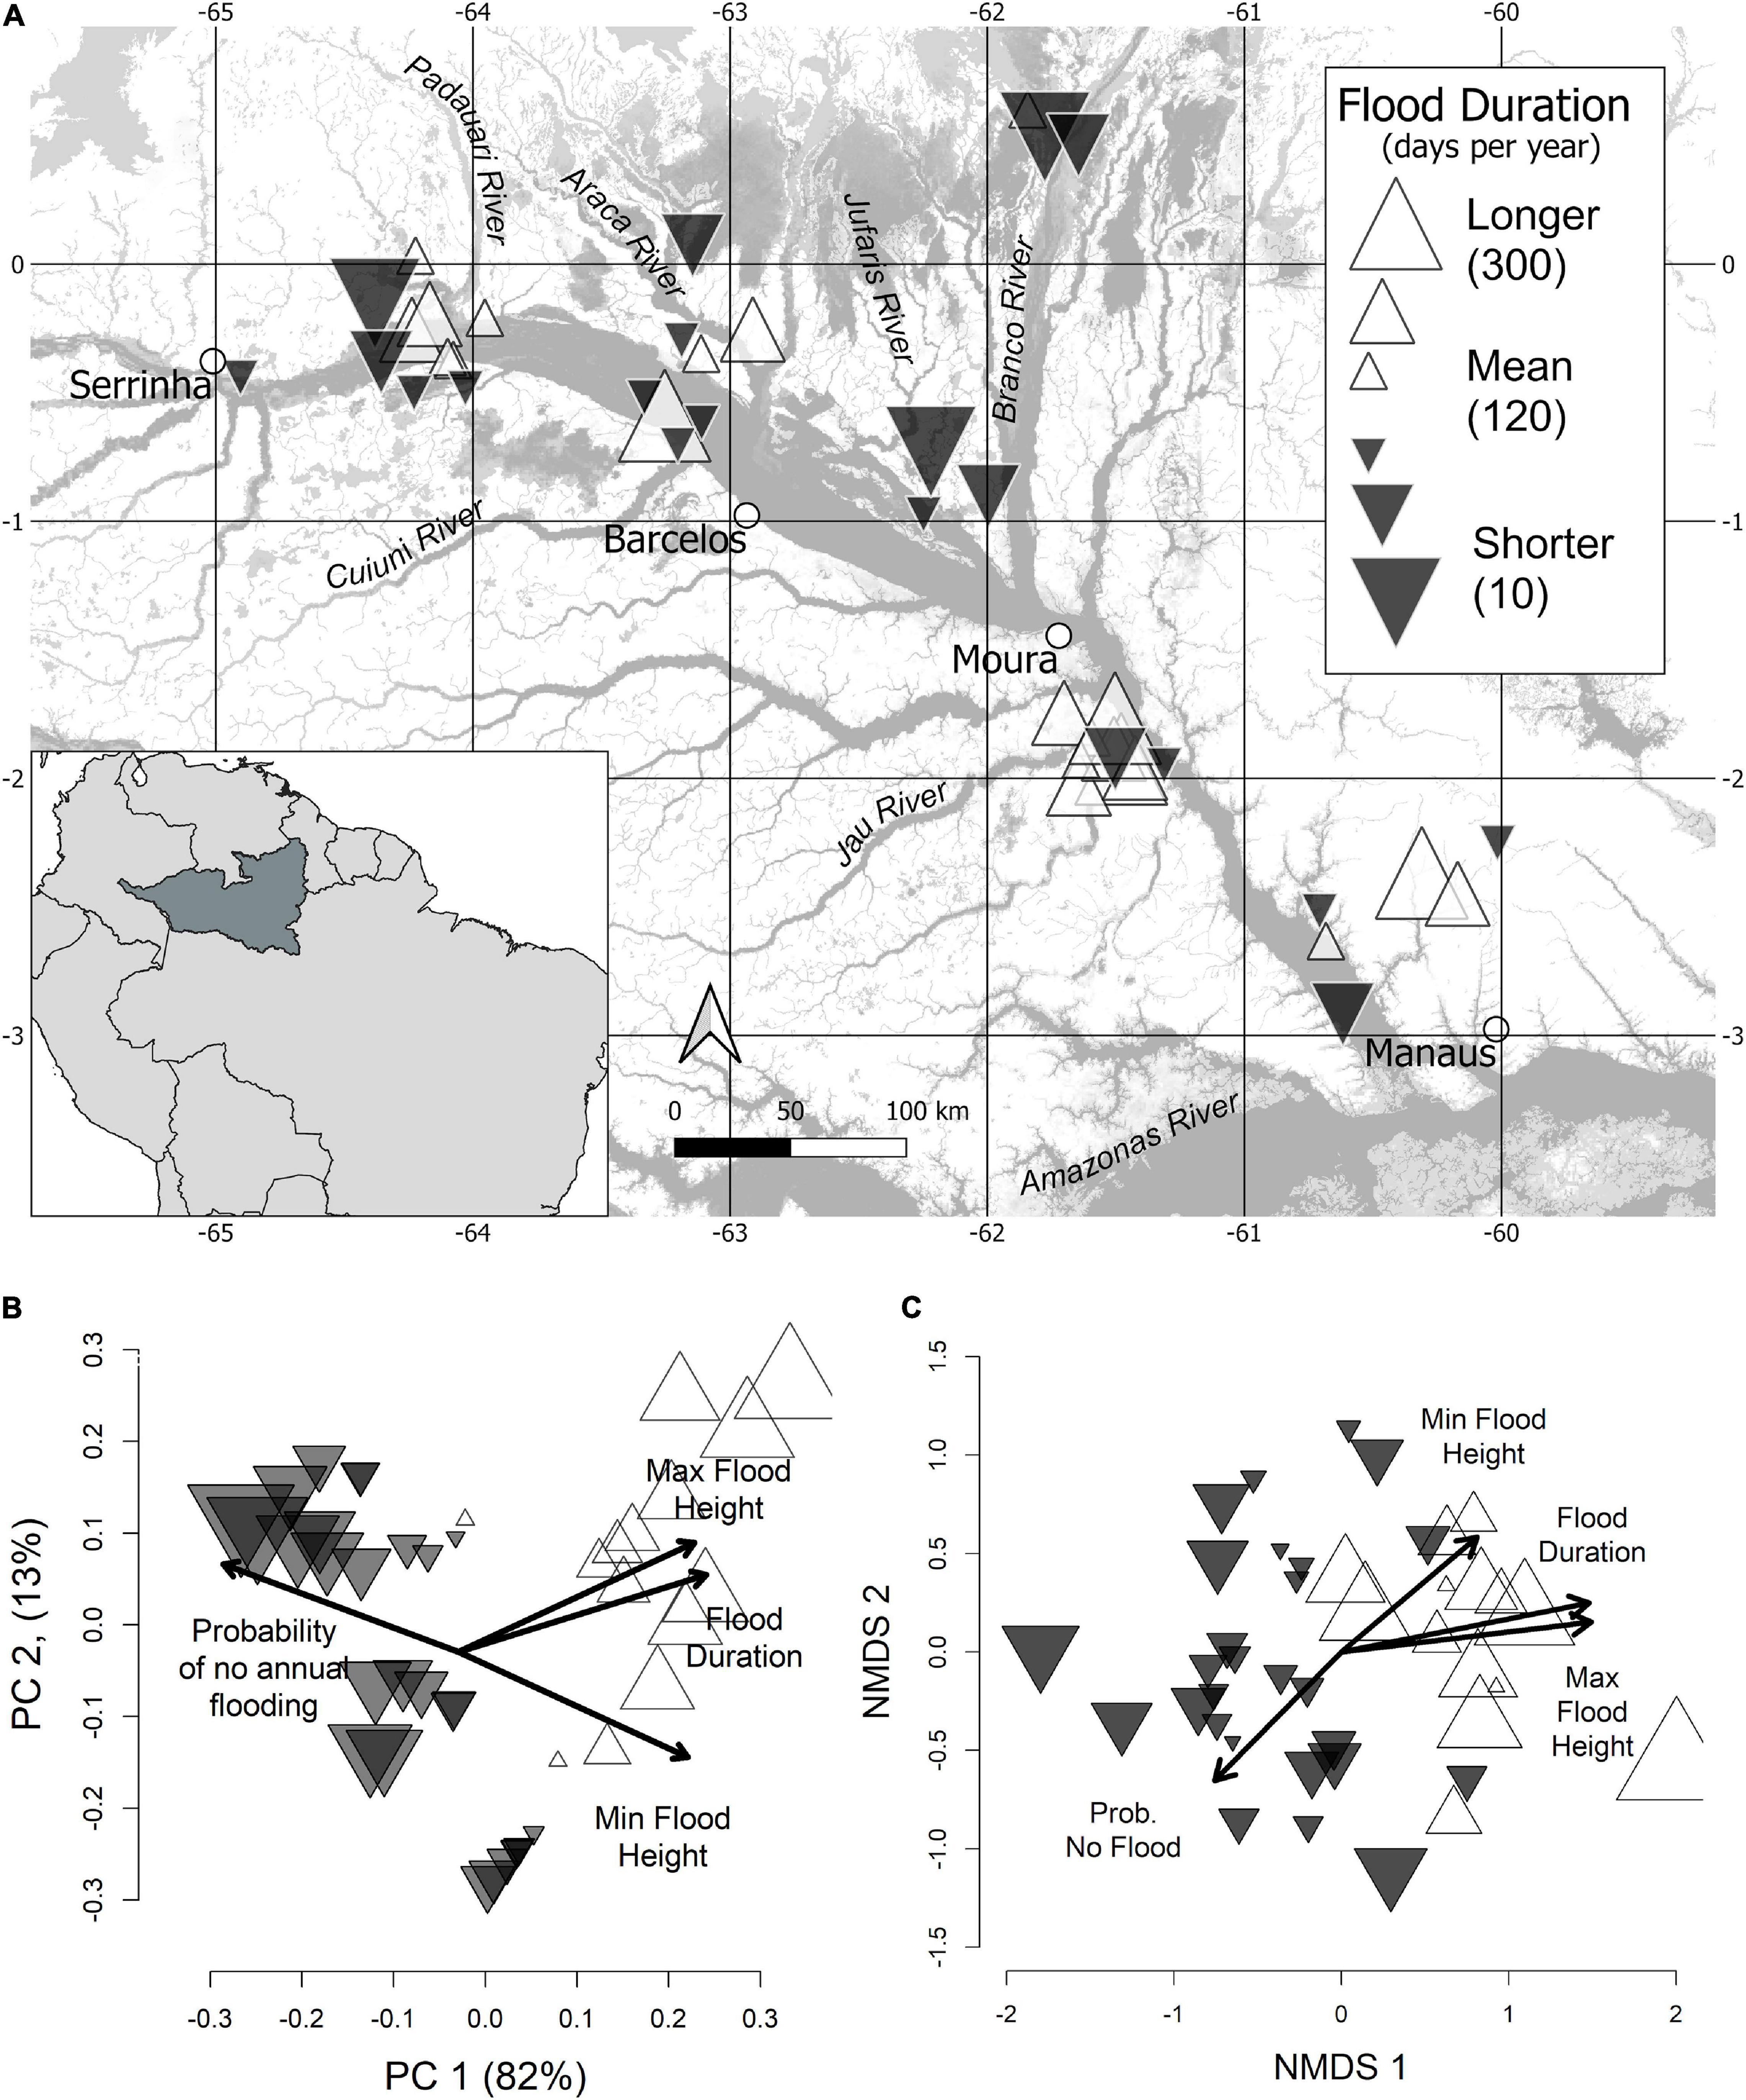
Figure 1. Geographic (A), hydrologic (B), and compositional (C) pattern of floodplain forest inventories. In all panels, inventories are represented by triangles, where size and color reflect direction and magnitude from the mean flood duration across all sites. Symbol size is proportional to the absolute difference from mean conditions, where black-filled, and white-filled, triangles are below and above the mean, respectively. (A) Geographic positions of inventoried sites. A small amount of random scatter was added to reduce overlapping symbols. Open circles indicate gauge locations used to calibrate historical flooding conditions at each inventory. The base layer showing flooded areas has been adapted from Hess et al. (2003), based on dual season Global Rain Forest Mapping Project (GRFM) Amazon mosaics. (B) Principal Components Analysis showing covariation in 4 hydrological variables, flood duration, maximum flood height, minimum flood height, and annual flooding probability. (C) Non-metric multidimensional scaling solutions (in two dimensions) of inventory compositional data based on Sørensen’s distance metric (stress = 0.19). Fitted vectors of significant (p < 0.001) hydrologic variables have been mapped on, where their length is scaled to their correlation coefficient (R2).
Historical hydrologic conditions at each inventory location were assessed by calibrating plot elevation to water-level data from the nearest gauge station, operated by the Brazilian Water Agency – ANA1. Historical water-level series (Sérias Históricas de Estações in Portuguese) were downloaded from stations located at Manaus, Moura, Barcelos, and Serrinha, corresponding, respectively, to code numbers 14990004, 14840000, 14480000, and 14420000 on the ANA website (Figure 1A). These data consist of daily river height measurements above sea level. Water-level data from river gauges was calibrated to plot elevation by equating the height of maximum water-level marks on trees to the maximum water level recorded by the nearest gauge during the sampling period – for each inventoried tree, the watermark left on stems during the former high-water period was measured to the ground. We used this reference point to obtain the flooding history of each inventory by back calculating hydrological data 30 years from the date of plot sampling (between 2007 and 2019). Few missing daily water level data at the gauge Serrinha (from 01.02.1990 to 25.02.1990, 10.01.1991 to 19.05.1991, and 25.08.1992 to 02.09.1992) and Moura (01.01.1979 – 18.01.1979) were interpolated as the average water level over 30 years during the same time frame. From calibrated hydrologic data we calculated the mean annual flood duration (days year–1), mean annual maximum flood height (cm), mean annual minimum flood height (cm), and annual flooding probability, where flooding was defined as any water level in plots above the ground surface. Mean annual flood duration thus estimates the average length of time during which at least below ground roots experience anoxic conditions. Maximum flood height estimates the extent to which above ground organs (stems and leaves) may be flooded. Minimum flood height is often negative as river channels are below surrounding floodplains, and is a rough estimate of the depth to groundwater that may be correlated to water availability (deeper groundwater is more difficult to access). The annual probability of flooding estimates the year-to-year regularity of flooding disturbance. Bivariate relationships among these four flooding metrics were evaluated using linear and non-linear least squares. Principal components analysis was also applied to centered and scaled hydrologic variables to further examine patterns of covariation.
We evaluated the degree of spatial autocorrelation in hydrologic conditions with Mantel tests. For this, we generated Euclidean distance matrices for individual hydrologic variables and for all four in combination after centering and scaling. Mantel correlations were tested against a separate matrix of site-site geographic distances and statistical significance was assessed with a Monte Carlo permutation using 999 permutations, using the R package VEGAN (Oksanen et al., 2017; R Core Team, 2019).
Floristic dissimilarity among plots was calculated as the Steinhaus and Sørensen indices for abundance and occurrence data, respectively. We employed Mantel tests to assess the correlation (rM) between dissimilarity of forest composition and hydrologic dissimilarity, which included all four hydrologic variables after scaling, and mean flood duration alone. We also used partial Mantel tests to reexamine the correlation of composition-environment dissimilarity after controlling for geographic distances, since correlations can be inappropriately inflated if compositional and environmental data are spatially structured in a similar way. All Mantel tests were carried out on occurrence and abundance data in parallel. Occurrence and abundance-based dissimilarity matrices were also subjected to a non-metric multidimensional scaling (NMDS) to map out site-to-site floristic variation in ordination space. We produced two-dimensional solutions and calculated squared correlation coefficients (R2) for each predictor in relation to the NMDS axes and determined their significance with a Monte Carlo permutation test using 999 random permutations. All floristic analyses were done with R package VEGAN (Oksanen et al., 2017; R Core Team, 2019).
Species responses along the flood duration gradient were tested using HOF models (Huisman et al., 1993). These comprise a series of increasingly complex logistic regression models that statistically test for a variety of theoretical response shapes, including a flat response (model I), monotone sigmoid with a top at maximal abundance (model II), monotone sigmoid with a plateau below maximal abundance (model III), symmetric unimodal (model IV), and skewed unimodal (model V). For 111 species occurring in at a least 5 inventories, we fitted the logistic regression models with binomial link function on occurrence data. Akaike Information Criterion was used to initially choose the most adequate model, but because final model choice can be sensitive to data selection, especially for poorly sampled species, the initial choice of model was compared to 100 bootstrapped models, and, if different, replaced with the most frequent bootstrap model. All HOF model analyses were done with the eHOF package in R (Jansen and Oksanen, 2013; R Core Team, 2019).
Our approach to modeling species responses is conservative in two important ways. First, we base the HOF modeling procedure on occurrence, rather than abundance data. In preliminary analyses we observed that when based on abundance data, model choice skewed heavily toward higher complexity, despite built-in precautions against this with model bootstrapping. Specifically, we observed that 85% of differences in model choice between occurrence and abundance data were the result of more complex model fits to often trivial variation in abundance. As local abundance is highly sensitive to a variety of processes other than flooding, we opted for the more conservative approach to estimating response curves to occurrence data. Second, more complex responses, such as bimodal distributions (Model VI and VII in the eHOF package), are feasible, but not implemented. Preliminary runs allowing such models indicated statistical support for bimodal responses of a small minority (7 of 111) of candidate species. The average number of occurrences for these species was, however, less than 10. Therefore, we concluded that in such high diversity floodplain forests where many species are still poorly sampled, sampling lacunae are a more parsimonious explanation than a true bimodal response.
From response models we estimated two niche properties, species optimum and niche breadth (i.e., tolerance). A species optimum was estimated as the flood duration value where the species modeled response was highest. For model III species an interval of optimum values was provided. Species tolerances were estimated as the difference between central borders, identified as the range of flood duration values where the response reaches exp–0.5 of the highest estimated response value (Heegaard, 2002).
The range of flooding conditions in our study inventories is comparable with the overall lower and upper limits of floodplain forests in the Rio Negro basin (Junk et al., 2015). Among sampled sites, flood duration ranged from 11 to 296 days year–1, with a mean (±sd) at 118 ± 73 days year–1. The mean maximum flood height was 245 cm, with a range from 12 to 788 cm. Whereas at shorter flood durations forests transition to non-flooded terra firme, at longer flood durations trees cannot establish and do not form closed-canopy forests.
The four flooding metrics quantified to describe hydrologic site conditions were strongly correlated. The majority (82%) of hydrologic variation was accounted for by the first principal component axis, with mean flood duration achieving the highest loading (Figure 1B). Mean flood duration was linearly related to both maximum and minimum flood heights (adjusted r2 = 0.96). The relationship of mean annual flood duration to the probability of annual flooding is described by a logistic curve (Supplementary Figure 1). This curve reached a sill at approximately 120 flood days year–1, indicating that locations with longer-than-average flood durations experience at least superficial flooding on an annual basis, but that in locations with less flooding the annual probability declines markedly.
Mantel correlation tests between dissimilarity of hydrologic site conditions and geographic distance were weak but significant (rM = 0.17, p = 0.002), although the degree of spatial autocorrelation varied among individual hydrologic metrics. Flood duration and the number of non-flooded years were not significantly correlated with geographic distance, reflecting our sampling strategy to capture a long flooding gradient at each study site. Maximum and minimum flood heights, the difference of which describes the amplitude of yearly water-level oscillations, showed strong correlation with geographic distance (rM = 0.81, p = 0.001). More specifically, sites nearer to the Amazon River experienced greater flood amplitudes than those upstream. These geographic trends, however, were more pronounced in sites with longer flood duration – for sites with approximately 250 flood days year–1, geographic differences in average maximum flood height between up and downstream sites reached up to 100 cm, whereas in sites flooded less than 100 days year–1 geographic differences were negligible (Supplementary Figure 1). These spatial trends are consistent with natural damming effects of the oscillating Amazon River that strongly influences the amplitude of the flood pulse of the lower Negro River (and major tributaries) along a stretch of up to 250 km, whereas upstream of the confluence of the Negro and Branco Rivers this damming effect weakens quickly (Meade et al., 1991).
In 41 sites a total of 25,945 stems were inventoried. From those, 21,122 (81.4%) were identified to species, while the remaining stems could only be identified to the genus (n = 4,749, 18.3%) and family (n = 74, 0.28%) levels. The total number of species with valid names was 449. The range of tree species richness among the 1 ha inventories varied from nearly mono-dominant (3 species at a Jaú River plot with an average flood duration of 264 days year–1) to high (78 species at a Negro River, Anavilhanas plot with an average flood duration of 92 days year–1).
Mantel correlations between floristic dissimilarity and hydrologic dissimilarity (including all four hydrologic variables) were 0.43 (p = 0.001) and 0.38 (p = 0.001) for occurrence and abundance data, respectively. When flood duration was considered in isolation, Mantel correlations were similar, estimated at 0.35 (p = 0.001) and 0.32 (p = 0.001) for occurrence and abundance data, respectively. The relationship of floristic dissimilarity with geographic distance was of comparable magnitude, with significant matrix correlations between 0.31 (occurrence data) and 0.26 (abundance data). When the effect of geographic distance was controlled for using partial Mantel tests, the correlations between floristic dissimilarity and dissimilarity in mean flood duration were relatively unchanged at 0.38 and 0.34 (p = 0.001). Therefore, considerable correspondence between variation in forest composition and flooding duration are not due to spatial auto-correlation in the data. Correlation coefficients (R2) of all hydrologic metrics were significantly related to NMDS solutions of abundance and occurrence (stress 0.19–0.20). Mean flood duration (R2 = 0.53) and maximum flood height (R2 = 0.56) had the highest correlation coefficients and were most strongly related to the first ordination axis (Figure 1C).
A total of 338 species remained too poorly sampled, with fewer than five occurrences. Of the 111 species for which we applied HOF models, 73% exhibited a non-flat response (models II–V) along the flood duration gradient (Figure 2A). The most frequent response shape was skewed unimodal (model V), comprising 35 species, followed distantly by symmetric unimodal (model IV, 19 species), monotone sigmoid with a plateau (model III, 18 species), and monotone sigmoid (model II, 9 species). The mean (±sd) optimal value was 124 (±80) flooded days year–1, corresponding to an intermediate position along the flood duration gradient. Species optima, however, varied considerably and encompassed the whole spectrum of flood duration values (Figure 2B). Optima near the gradient extremes were associated with skewed response curves (Model V), so that right skewed species had a mean optima value of 75 flooded days year–1, significantly lower than the group of left-skewed species with average optimal position at 169 flooded days year–1 (F = 38.2, p < 0.001). Species with optima nearer intermediate conditions tended to have symmetric unimodal response. The median tolerance of species was 85 flooded days, corresponding to approximately 30% of the flood duration range. As most species exhibited relatively limited tolerances, the majority fall clearly into one of two flood duration classes, with 32 species (29%) favored by longer-than-average flood periods of lower floodplain topographies, and 49 species (44%) favored by shorter floods in upper floodplain topographies.
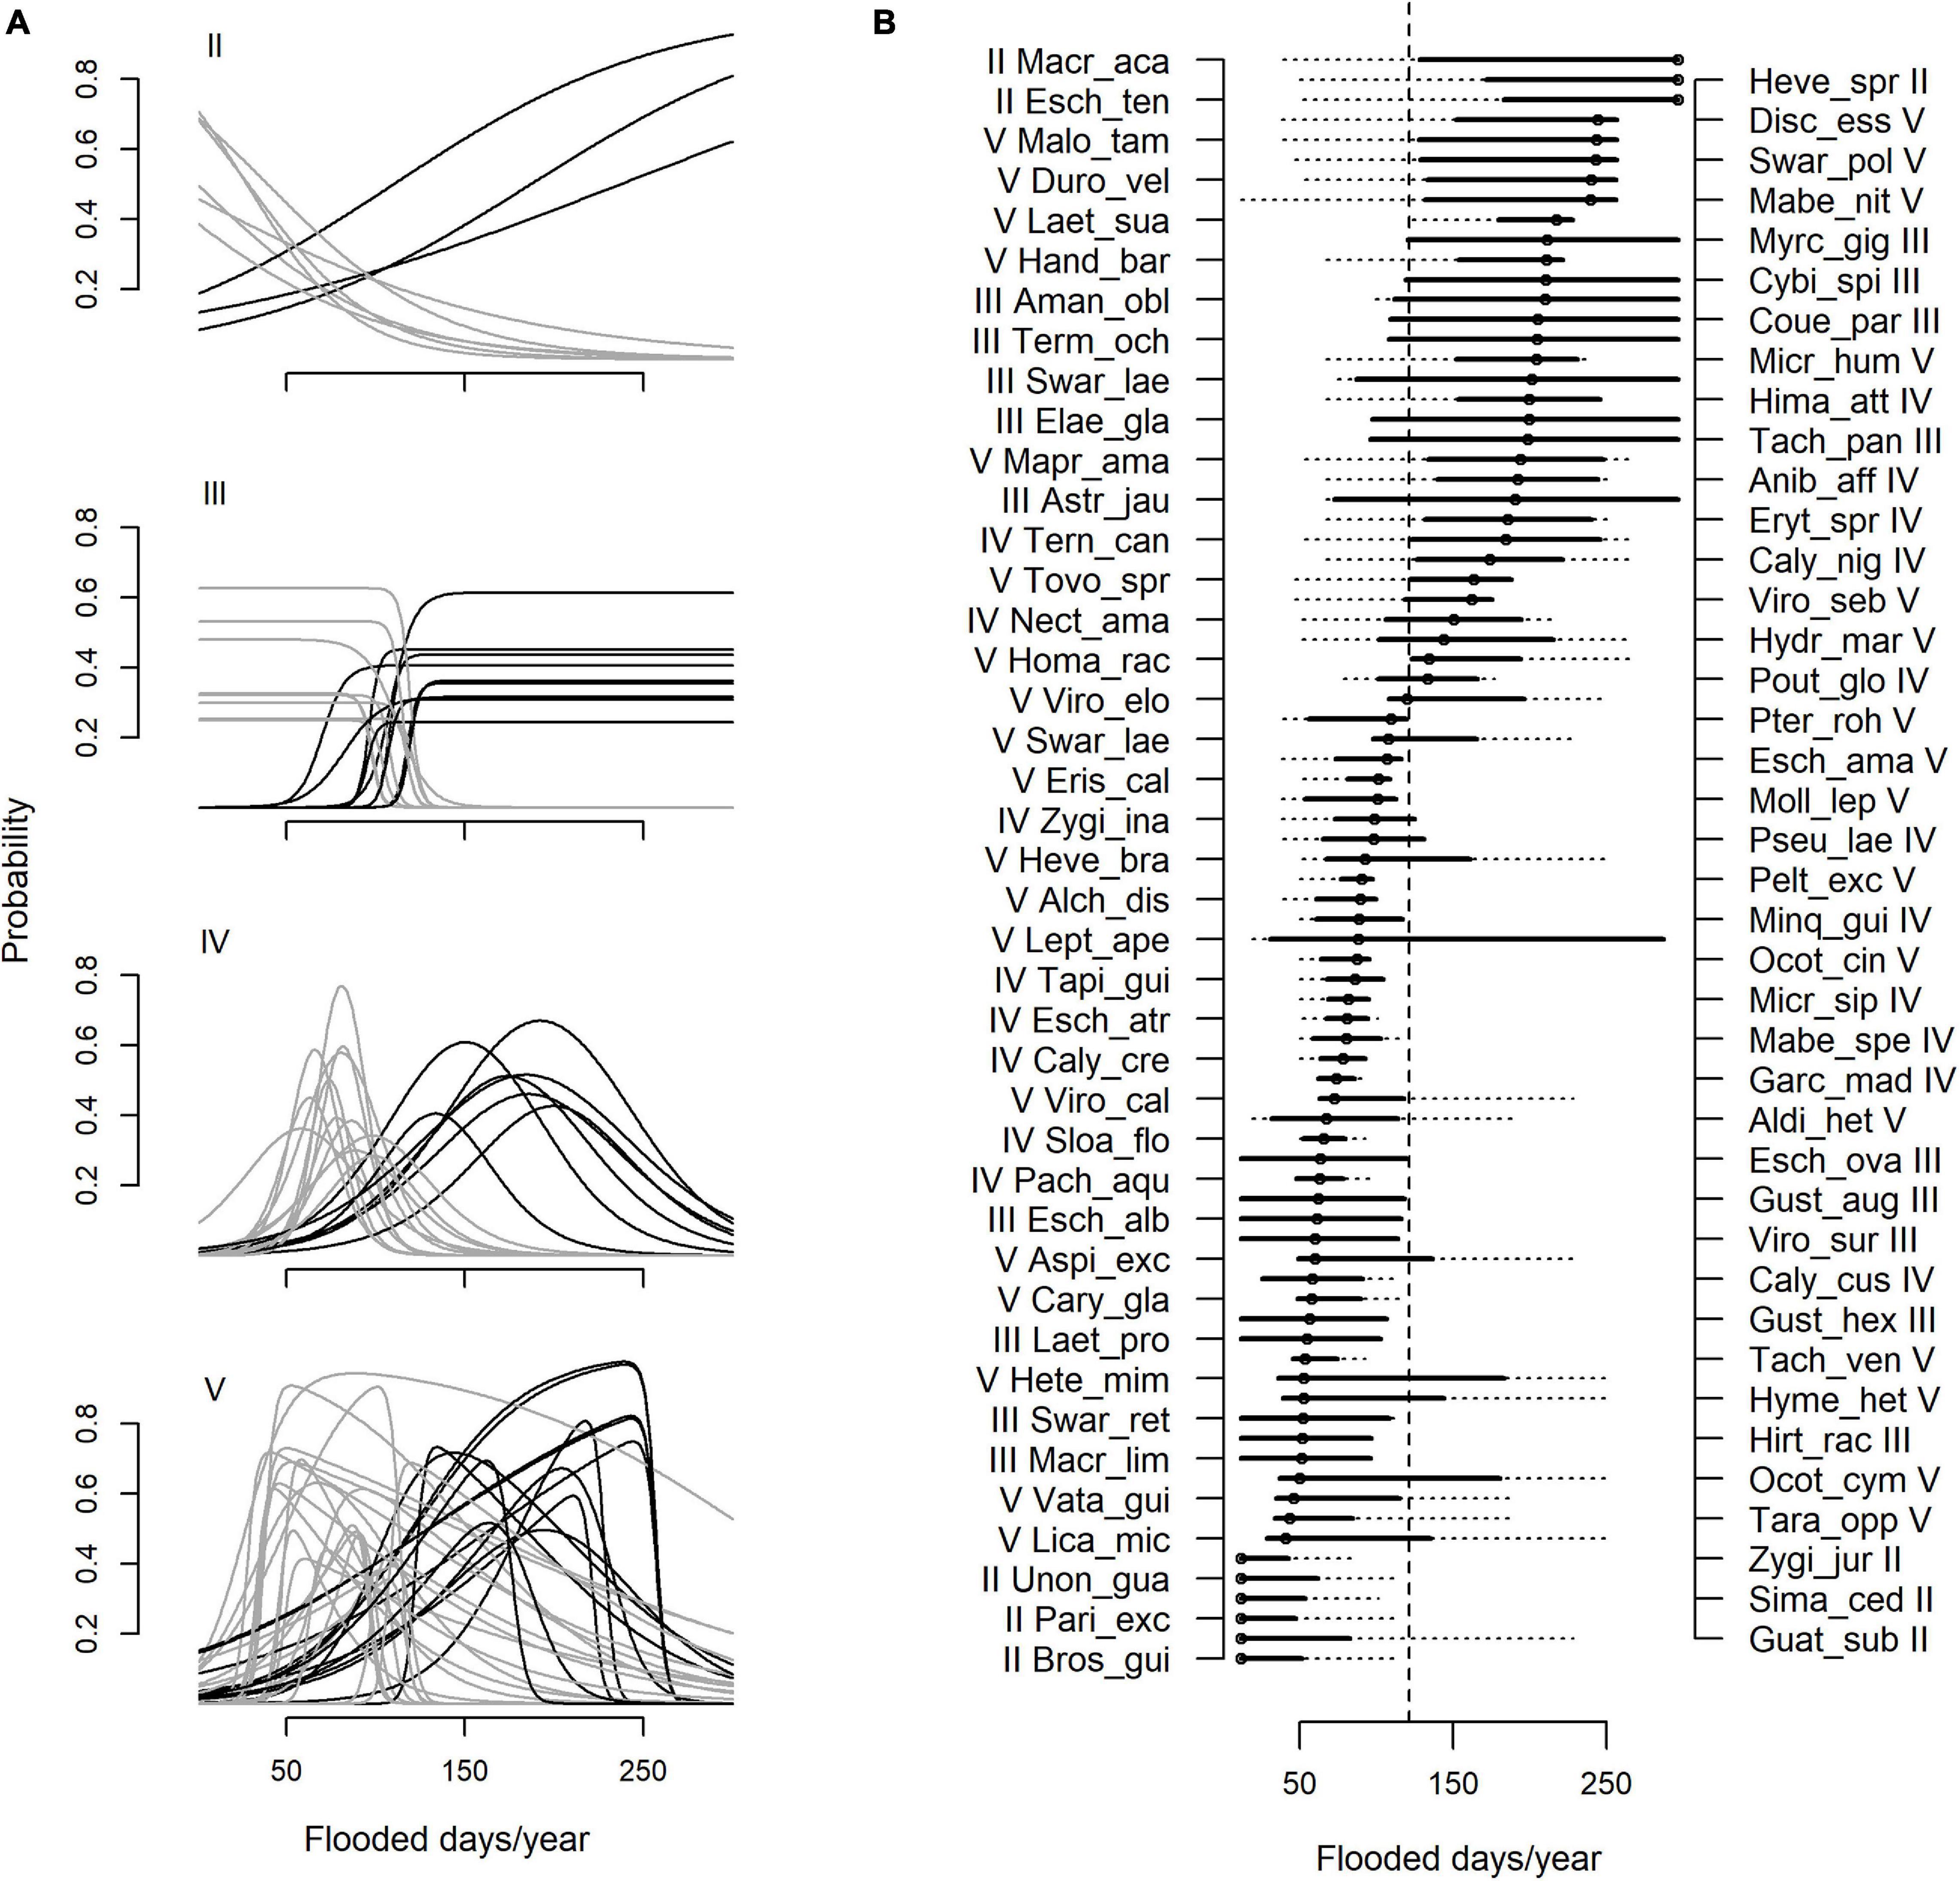
Figure 2. Modeled response curves (A) and niche properties (B) of 81 floodplain species along the flood duration gradient. The responses of an additional 30 species were more consistent with a flat model (Model I) and not shown. (A) Roman numerals indicate the most appropriate HOF model, selected according to the Akaike Information Criterion and a parallel bootstrap approach to account for sensitivity of model choice for poorly sampled species. Huisman–Olff–Fresco models (eHOF): (II) monotonic sigmoid (III) sigmoid with plateau, (IV) unimodal symmetric, and (V) unimodal skewed. Species have been categorized into those favored by severe flooding >120 flooded days year–1 (black curves), and those favored by weak flooding, with optima less than 120 flooded days year–1. (B) Genus and species epithets are abbreviated (see Supplementary Table 2 for full names), with roman numerals indicating the best fitting response shape. Species optima (open circles) are estimated as the flood duration value where the species response is highest. Realized niches, or tolerance (solid horizontal lines) were estimated at where the response reaches exp–0.5 of the highest estimated response value. Broken horizontal lines show the full range of flood duration for species, between at the maximum and minimum flood duration values where species occurred. A vertical broken line at 120 flooded days year–1 marks the mean optimal value of all species.
A total of 30 species (27%) showed no response to flooding (model I). These species occur widely along the flood duration gradient and accounted for 22% of sampled floodplain stems. The mean of log abundance values for model I species was slightly, but not significantly, lower than that of species with flooding responses (F = 0.83, p = 0.36).
Our results support the general hypothesis that the flood duration gradient is a major environmental driver of compositional turnover in floodplain forests (Junk et al., 1989). Flood duration correlated strongly with the major floristic pattern visible in the NMDS and accounted for substantial variation in compositional turnover assessed via Mantel tests. A considerable amount of floristic variation, however, remains unexplained. Other factors such as edaphic variation (Worbes, 1997; Lobo et al., 2019), fire disturbance (Flores et al., 2014; Schöngart et al., 2017; Neves et al., 2019), and the spatial and environmental history of fluvial units (Montero and Latrubesse, 2013) are also likely to influence the composition of forests in important ways. Considerable compositional differences may arise from chance alone, even among sites with identical environmental conditions, because small forest inventories are drawn from a diverse regional species pool (Ricklefs, 1987). While these additional factors may further elucidate compositional differences among inventories, our results clearly indicate common patterns of compositional differentiation along the flood duration gradient, even among distant sites. This implies that species ecological distributions along the flood duration gradient are predictable, and unlikely to be geographically idiosyncratic between sites. Results from the HOF modeling procedure were consistent with this. The majority of species exhibited a clear ecological response to flood duration. Response curves varied in position and shape, but most typically had tolerance values accounting for no more than 30–50% of the gradient, resulting in strong turnover of species along the gradient. These patterns are largely consistent with the idea that species distribution along the flood gradient is determined by evolutionary tradeoffs that confer advantages within a limited range of flooding conditions, but disadvantages outside this range (Wittmann et al., 2010, 2013).
We observed a diversity of response shapes along the flood duration gradient, but skewed responses were most frequent. A total of 37 species, one third of all species tested, were strongly right skewed, exhibiting either disappearing (model II) or abruptly declining (model V) responses as they approached non-flooded forest. The optima of these species were therefore generally located at weakly flooded positions. Their response shape as it approached terra firme is likely to be influenced by our restricted sampling window to sites that were at least occasionally flooded. It is reasonable to expect that in regions of the gradient approaching terra firme, many species still remain under-sampled because higher floristic diversity decreases the probability of finding individuals of single species. As such, the nature of species distributions as they approach terra firme remain uncertain for this group of species in particular. Nonetheless, modeled response shapes and niche properties still provide meaningful approximations for their ecological response to flooding. Species within this group exhibit notably long tails directed toward longer flood duration (e.g., Leptobalanus apetalus, Ocotea cymbarum, and Heterostemon mimosoides). This suggests physiological tolerance for a wide range of flooding conditions, although only within a more restricted range of weak and unpredictable flooding do they appear to be efficient competitors.
Left skewed responses were observed in 13 species, exhibiting abrupt declines at longer flood duration (e.g., Virola sebifera, Handroanthus barbatus, and Malouetia tamaquarina, among others). These tended to have high optima values of more than 120 flood days year–1, and were thus favored under more severe flood conditions. An additional three species showing monotone sigmoidal responses that increased toward long flood durations might also be included in this group: Eschweilera tenuifolia, Hevea spruceana, and Macrolobium acaciifolium. The responses of the latter species are artificially truncated because we did not sample any sites beyond which forests can tolerate. It seems clear that they would otherwise exhibit steep declines at more severe floods. Steep response shapes approaching more abiotic stressful conditions are expected when physiological tolerance is the dominant factor limiting species occurrence (Ellenberg, 1953; Mueller-Dombois and Ellenberg, 1974; Austin, 1990). This may imply a high degree of sensitivity to hydrologic alteration for this group of species. Indeed, some observational evidence already supports this idea (Junk et al., 2015). Particularly notable are mass mortality events of the highly flood-tolerant tree species M. acaciifolium and E. tenuifolia downstream of the Balbina hydropower dam on the Uatumã River (central Brazilian Amazon), which were correlated to extreme hydrologic events due to dam constructions and operation (Assahira et al., 2017; Resende et al., 2020; Schöngart et al., 2021).
Distributions of a considerable number of species (nearly one third of those tested) were consistent with a flat response to flood duration (Model I), indicating tolerance to a wide range of flood conditions. This is a surprising result, and an interesting contrast to most species tested in which natural selection appears to have favored trait values that maximize fitness to a relatively small portion of the flood duration gradient. Different evolutionary scenarios to explain wide tolerances of this species group are possible. One potential scenario is that populations occurring along different portions of the flooding gradient are differentiated genetically so as to be locally adapted (Palacio-López et al., 2015). Ferreira et al. (2009), for example, demonstrated a genetic basis of variation in ecologically important trait values between populations of Himatanthus sucuuba in central Amazonian white-water floodplains distributed at opposite ends of the flooding gradient. This suggests that along the flood duration gradient, natural selection strongly favors the differentiation of trait values, even within species. Changes in the ecological attributes of populations are an important component of speciation and species identified as Model I may be exciting models for investigating the mechanisms of ecological speciation. Another possible scenario is that individuals are phenotypically plastic, expressing different phenotypes in different environments (Palacio-López et al., 2015). In the face of rapid hydrologic alteration, species that are highly plastic, or locally adapted, are likely to demonstrate considerably different responses. Plasticity may provide a buffer against rapid hydrologic alteration, allowing species to persist locally despite changing conditions, whereas locally adapted species would have to migrate to follow conditions to which they are suited.
It is worth noting that flood duration is but one aspect of an oscillating phenomenon that includes both wet and reciprocal dry phases. The flood duration gradient is thus associated with several physiologically active variables and observed ecological responses are most likely the result of multiple mechanisms operating simultaneously. During the wet phase, flood duration impacts plant growth through reduced gas diffusion under waterlogged conditions that severely reduces soil O2 availability for aerobic metabolism (Colmer and Voesenek, 2009). This is a powerful environmental filter and many floodplain species exhibit a variety of metabolic and morphological adaptations to mitigate these hypoxic conditions (Parolin et al., 2004). Flood duration is also correlated with the height of flooding, which is also likely to impact plant growth because it determines the extent to which above ground organs are submerged. Juvenile trees, for example, may often be completely submerged, where conditions of low light, together with low CO2 availability greatly hampers photosynthesis (Parolin, 2002; Oliveira Wittmann et al., 2007; de Melo et al., 2015). During dry phases, drought is thought to be an important factor impacting plant growth (Parolin et al., 2010). For floodplain trees that are generally not water-limited because of a high water table, investment in drought-resistant hydraulic systems may not be advantageous (Fontes et al., 2020). Consequently, many species otherwise tolerant to flooding may be highly vulnerable to the stresses of the dry phase (Resende et al., 2020). The physiological impact of drought is likely to vary with the duration of the dry-phase and the depth of the fluctuating water table as well as its temporal correlation with seasonal precipitation. Oscillating dry and flood phases may also act synergistically to amplify drought conditions, for example, when damage to root tips during long-duration flood events limits water uptake when flood waters subsequently recede and aeration is restored (Colmer and Voesenek, 2009). As such, the correlation between drought and flood duration may be complex. Lastly, the pluriannual behavior of flooding disturbance also varies along the flood duration gradient. Based on our data, flood disturbances tend to be annual in lower floodplain topographies where flood duration is >120 days year–1, whereas in sites with shorter flood duration, only one in 3 years may be flooded. Annual flooding is likely to favor tighter coupling of tree life cycles to flood disturbances (Kubitzki and Ziburski, 1994; Schöngart et al., 2002, 2005). For example, despite stressful conditions afforded by prolonged floods, seed and fruit production of many floodplain trees is timed during high water levels, presumably to ensure their germination niche is satisfied (Parolin, 2002; Oliveira Wittmann et al., 2007; de Melo et al., 2015). Such phenological adaptation to annual flood oscillations may be disadvantageous in sites where annual flooding is less predictable at higher floodplain topographies.
Although the ecological responses of species are a function of multiple factors that are correlated with flood duration, these correlations are likely to be similar from site to site within the Negro basin because of a shared hydrological regime that is strongly governed by backwater effects from the Amazon main stem (Meade et al., 1991). Under different hydrologic regimes, however, local species populations may not show consistent response curves. Therefore, extrapolation of species information to other regions or ecosystems should only be done with caution.
Our database has, for the first time, allowed us to model the ecological responses of 111 tree species to the flood duration gradient of the Negro River along approximately 700 km of its course (see Supplementary Table 2 for species information). We believe the modeled species responses presented here give meaningful information regarding species differential capacity to establish, grow and survive along the flood duration gradient that is likely to be spatially valid across large parts of the basin. This information may be useful in a variety of research questions. The most basic way in which our data may be used is as a reference to aid in the design of experiments (i.e., species selection) or in the interpretation of the main ordination axes of floristic variation. More intimate knowledge of species flooding niches may also be useful in functional trait-based approaches seeking greater understanding of the functional basis of species’ different flooding responses and the underlying trade-offs involved (e.g., Fontes et al., 2020). Trait values, for example, could be tracked across a large number of tree species with contrasting ecological responses to flooding. Detailed knowledge of species flooding niches may also be helpful in paleoecological research seeking to reconstruct the environmental and fluvial histories of sites (Householder et al., 2015).
Of particular concern is the development of quantifiable methods for monitoring and assessing risk of floodplain forests in the face of rapid hydrologic alteration induced by climate change (i.e., Barichivich et al., 2018) or river damming (i.e., Wittmann and Junk, 2016; Assahira et al., 2017; Latrubesse et al., 2017; Lobo et al., 2019). Dam operation, for example, affects downstream hydrological regimes by (i) altering seasonal predictability of flooding, (ii) suppressing the aquatic phase at higher floodplain topographies that are no longer inundated, (iii) suppressing the terrestrial phase at lower floodplain elevations, which remain permanently flooded, and (iv) increasing rise and fall rates and flood reversals, so that flooding tends to be flashier (Timpke and Kaplan, 2017). In response to changing hydrological conditions species are expected to migrate to track suitable conditions, resulting in shifts in forest composition. Species response shapes to the flood duration gradient could be used to parameterize predictive models of forest change. They also offer a potentially effective approach for monitoring compositional change. For example, community-level averages of species flooding niches can express change in floristic composition as a single, continuous variable that is comparable across time and space. Thus, our data are likely to be an important component in testing hypotheses of whether, how, and to what degree forests are responding to rapid alteration of local or regional hydrologic regimes.
The original contributions presented in the study are included in the article/Supplementary Material, further inquiries can be directed to the corresponding author/s.
FW and JH conceived the idea and wrote the manuscript. FW collated the floristic and hydrologic data. JH performed the analyses and produced the figures. MTP and JS provided critical infrastructure. All authors assisted in field work and made significant intellectual contributions to the manuscript.
Floristic inventories were funded by the Brazilian Council of Science and Technology PRONEX-MCT/CNPq/FAPEAM “Tipologias al gaveis 2007,” Universal (479599/2008-4), and the Support Program “Fixing doctors in Amazonas” (FIXAM/AM/005/2018), CNPq-PELD 441590/2016-0 and 403792/2012-6, INCT ADAPTA 465540/2014-7, and CAPES 001. RA was supported by the Norwegian State Educational Loan Fund and JM through the Department of Silviculture of the University of Freiburg, Germany.
The authors declare that the research was conducted in the absence of any commercial or financial relationships that could be construed as a potential conflict of interest.
We wish to thank the Technical/Scientific Cooperation Agreement between INPA and the Max Planck Society and INPA/MAUA (Ecology, Monitoring, and Sustainable Use of Wetlands) projects for logistical assistance. We also wish to thank Celso R. Costa, Valdeney de A. Azevedo, Jos Lima, and Joé Ramos from INPA for their efforts in collecting field data and the identification of tree species.
The Supplementary Material for this article can be found online at: https://www.frontiersin.org/articles/10.3389/fevo.2021.628606/full#supplementary-material
Aldana, A. M., Carlucci, M. B., Fine, P. V. A., and Stevenson, P. R. (2017). Environmental filtering of eudicot lineages underlies phylogenetic clustering in tropical South American flooded forests. Oecologia 183, 327–335. doi: 10.1007/s00442-016-3734-y
Assahira, C., Piedade, M. T. F., Trumbore, S. E., Wittmann, F., Cintra, B. B. L., Batista, E. S., et al. (2017). Tree mortality of a flood-adapted species in response of hydrographic changes caused by an Amazonian river dam. For. Ecol. Manag. 396, 113–123. doi: 10.1016/j.foreco.2017.04.016
Assis, R. L., Wittmann, F., Piedade, M. T. F., and Haugaasen, T. (2015). Effects of hydroperiod and substrate properties on tree alpha diversity and composition in Amazonian floodplain forests. Plant Ecol. 216, 41–54. doi: 10.1007/s11258-014-0415-y
Austin, M. P. (1990). “Community theory and competition in vegetation,” in Perspectives on Plant Competition, eds J. B. Grace and D. Tilman (San Diego, CA: Academic Press Inc), 215–238. doi: 10.1016/b978-0-12-294452-9.50015-1
Barichivich, J., Gloor, E., Peylin, P., Brienen, R. J. W., Schöngart, J., Espinoza, J. C., et al. (2018). Recent intensification of Amazon flooding extremes driven by strengthened Walker circulation. Sci. Adv. 4:eaat8785. doi: 10.1126/sciadv.aat8785
Cardoso, D., Särkinen, T., Alexander, S., Amorim, A. M., Bittrich, V., Celis, M., et al. (2017). Amazon plant diversity revealed by a taxonomically verified species list. PNAS 114, 10695–10700.
Colmer, T. D., and Voesenek, L. A. C. J. (2009). Flooding tolerance: suites of plant traits in variable environments. Funct. Plant Biol. 36, 665–681. doi: 10.1071/fp09144
de Melo, R. B., Franco, A. C., Silva, C. O., Piedade, M. T. F., and Ferreira, C. S. (2015). Seed germination and seedling development in response to submergence in tree species of the central Amazon floodplains. AoB Plants 7:lv041.
Ellenberg, H. (1953). Physiologisches und ökologisches Verhalten derselben Pflanzenarten. Ber. Dt. Bot. Ges. 65, 351–362.
Ferreira, C., Piedade, M. T. F., Franco, A. C., Gonzalves, J. F. C., and Junk, W. J. (2009). Adaptive strategies to prolonged flooding in seedlings of upland and floodplain populations of Himatanthus sucuuba, a Central Amazonian tree. Aquat. Bot. 90, 246–252. doi: 10.1016/j.aquabot.2008.10.006
Ferreira, L. V. (2000). Effect of flooding duration on species richness, floristic composition and forest structure in river margin habitats in Amazonian blackwater floodplain forests: implications for future design of protected areas. Biodivers. Conserv. 9, 1–14.
Flores, B. M., Piedade, M. T. F., and Nelson, B. W. (2014). Fire disturbance in Amazonian blackwater floodplain forests. Plant Ecol. Divers. 1-2, 319–327. doi: 10.1080/17550874.2012.716086
Fontes, C. G., Fine, P. V. A., Wittmann, F., Bittencourt, P. R. L., Piedade, M. T. F., Higuchi, N., et al. (2020). Convergent evolution of tree hydraulic traits in Amazonian habitats: implications for community assemblage and vulnerability to drought. New Phytol. 228, 106–120. doi: 10.1111/nph.16675
Forsberg, B. R., Melack, J. M., Dunne, T., Barthem, R. B., Goulding, M., Paiva, R. C. D., et al. (2017). The potential impact of new Andean dams on Amazon fluvial ecosystems. PloS One 12:e0182254. doi: 10.1371/journal.pone.0182254
Furch, B., and Klinge, H. (1989). “Chemical relationships between vegetation, soil and water in contrasting inundation areas of Amazonia,” in Mineral Nutrients in Tropical Forest and Savanna Ecosystems, ed. J. Proctor (Oxford: Blackwell Scientific Publications), 189–204.
Heegaard, E. (2002). The outer border and central border for species/environmental relationships estimated by non-parametric generalized additive models. Ecol. Model. 157, 131–139. doi: 10.1016/s0304-3800(02)00191-6
Hess, L. L., Melack, J. M., Novo, E. M. L. M., Barbosa, C. C. F., and Gastil, M. (2003). Dual-season mapping of wetland inundation and vegetation for the central Amazon basin. Remote Sens. Environ. 87, 404–428. doi: 10.1016/j.rse.2003.04.001
Householder, J. E., Janovec, J., Tobler, M., and Wittmann, F. (2017). “A diversity of biogeographies in an extreme Amazonian wetland habitat,” in Forest Structure, Function, and Dynamics in Western Amazonia, ed. R. W. Myster (Hoboken, NJ: John Wiley & Sons Ltd), 145–155. doi: 10.1002/9781119090670.ch7
Householder, J. E., Wittmann, F., Tober, M., and Janovec, J. (2015). Montane bias in lowland Amazonian peatlands: plant assembly on heterogenous landscapes and potential significance to palynological inference. Palaeogeogr. Palaeoclimatol. Palaeoecol. 423, 138–148. doi: 10.1016/j.palaeo.2015.01.029
Huisman, J., Olff, H., and Fresco, L. F. M. (1993). A hierarchical set of models for species response analysis. J. Veg. Sci. 4, 37–46. doi: 10.2307/3235732
Jansen, F., and Oksanen, J. (2013). How to model species responses along ecological gradients –Huisman-Olff-Fresco models revisited. J. Veg. Sci. 24, 1108–1117. doi: 10.1111/jvs.12050
Junk, W. J. (1989). “Flood tolerance and tree distribution in central Amazonian floodplains,” in Tropical Forests: Botanical Dynamics, Speciation and Diversity, eds L. B. Holm-Nielsen, I. C. Nielsen, and H. Balslev (London: Academic Press), 47–64. doi: 10.1016/b978-0-12-353550-4.50012-5
Junk, W. J., Piedade, M. T. F., Schöngart, J., Cohn-Haft, M., Adeney, J. M., and Wittmann, F. (2011). A classification of major naturally-occurring Amazonian lowland wetlands. Wetlands 31, 623–640. doi: 10.1007/s13157-011-0190-7
Junk, W. J., Wittmann, F., Schöngart, J., and Piedade, M. T. F. (2015). A classification of the major habitats of Amazonian black-water river floodplains and a comparison with their white-water counterparts. Wetl. Ecol. Manag. 23, 677–693. doi: 10.1007/s11273-015-9412-8
Junk, W. J., Bayley, P. B., and Sparks, R. E. (1989). “The flood pulse concept in river-floodplain systems,” in Proceedings of the International Large River Symposium, Vol. 106, ed. D. Dodge (Ottawa: 110–127).
Kalliola, R., Salo, J., Puhakka, M., and Rajasilta, M. (1991). New site formation and colonizing vegetation in primary succession on the western Amazon floodplains. J. Ecol. 79, 877–901. doi: 10.2307/2261087
Killeen, T. J., and Solórzano, L. A. (2008) Conservation strategies to mitigate impacts from climate change in Amazonia. Philos. Trans. R. Soc. L. B. Biol. Sci. 363, 1881–1888. doi: 10.1098/rstb.2007.0018
Kubitzki, K., and Ziburski, A. (1994). Seed dispersal in floodplain forest of Amazonia. Biotropica 26, 30–43.
Latrubesse, E. M. (2008). Patterns of anabranching channels: the ultimate end-member adjustment of mega rivers. Geomorphology 101, 130–145. doi: 10.1016/j.geomorph.2008.05.035
Latrubesse, E. M., Arima, E. Y., Dunne, T., Park, E., Baker, V. R., d’Horta, F. M., et al. (2017). Damming the rivers of the Amazon basin. Nature 546, 363–369. doi: 10.1038/nature22333
Latrubesse, E. M., and Franzinelli, E. (2005). The late quaternary evolution of the Negro River, Amazon, Brazil: implications for islands and floodplain formation in large anabranching tropical systems. Geomorphology 70, 372–397. doi: 10.1016/j.geomorph.2005.02.014
Lobo, G. D. S., Wittmann, F., and Piedade, M. T. F. (2019). Response of black-water floodplain (igapó) forests to flood pulse regulation in a dammed Amazonian river. For. Ecol. Manag. 434, 110–118. doi: 10.1016/j.foreco.2018.12.001
Meade, R. H., Rayol, J. M., Da Conceicão, S. C., and Natividade, J. R. G. (1991). Backwater effects in the Amazon River basin of Brazil. Environ. Geol. Water Sci. 18, 105–114. doi: 10.1007/bf01704664
Melack, J., and Hess, L. (2010). “Remote sensing of the distribution and extent of wetlands in the Amazon Basin,” in Amazonian Floodplain Forests: Ecophysiology, Biodiversity and Sustainable Management. Ecological Studies, Vol. 210, eds W. Junk, M. Piedade, F. Wittmann, J. Schöngart, and P. Parolin (Heidelberg: Springer Verlag), 43–60. doi: 10.1007/978-90-481-8725-6_3
Mertes, L. A. K., Dunne, T., and Martinelli, L. A. (1996). Channel-floodplain geomorphology along the Solimões – Amazon River, Brazil. Geol. Soc. Am. Bull.refvol108, 1089–1107. doi: 10.1130/0016-7606(1996)108<1089:cfgats>2.3.co;2
Montero, J. C., and Latrubesse, E. M. (2013). The igapo of the Negro River in central Amazonia: linking late-successional inundation forest with fluvial geomorphology. J. S. Am. Earth Sci. 46, 137–149. doi: 10.1016/j.jsames.2013.05.009
Montero, J. C., Piedade, M. T. F., and Wittmann, F. (2014). Floristic variation across 600 km of black-water inundation forests (igapó) along the Brazilian Negro River. Hydrobiologia 729, 229–246. doi: 10.1007/s10750-012-1381-9
Mori, G. B., Schietti, J., Poorter, L., and Piedade, M. T. F. (2019). Trait divergence and habitat specialization in tropical floodplain forest trees. PloS One 14:e0212232. doi: 10.1371/journal.pone.0212232
Mueller-Dombois, D., and Ellenberg, H. (1974). Aims and Methods of Vegetation Ecology. (New York, NY: John Wiley and Sons).
Neves, J. R. D., Piedade, M. T. F., Resende, A. F., Feitosa, Y. O., and Schöngart, J. (2019). Impact of climatic and hydrological disturbances on blackwater floodplain forests in central Amazonia. Biotropica 51, 484–489. doi: 10.1111/btp.12667
Oksanen, J., Guillaume Blanchet, F., Friendly, M., Kindt, R., Legendre, P., McGlinn, D., et al. (2017). vegan: Community Ecology Package. R Package Version 2.4-3. Avaliable at: https://CRAN.R-project.org/package=vegan (accessed November 28, 20202).
Oliveira Wittmann, A., Piedade, M. T. F., Parolin, P., and Wittmann, F. (2007). Germination in four low-várzea tree species of central Amazonia. Aquat. Bot. 86, 197–203. doi: 10.1016/j.aquabot.2006.10.001
Palacio-López, K., Beckage, B., Scheiner, S., and Molofsky, J. (2015). The ubiquity of phenotypic plasticity in plants: a synthesis. Ecol. Evol. 5, 3389–3400. doi: 10.1002/ece3.1603
Parolin, P. (2002). Submergence tolerance versus escape from submergence: two strategies of seedling establishment in Amazonian floodplains. Environ. Exp. Bot. 48, 177–186. doi: 10.1016/s0098-8472(02)00036-9
Parolin, P., De Simone, O., Haase, K., Waldhoff, D., Rottenberger, S., Kuhn, U., et al. (2004). Central Amazonian floodplain forests: tree adaptations in a pulsing system. Bot. Rev. 70, 357-380.
Parolin, P., Lucas, C., Piedade, M. T. F., and Wittmann, F. (2010). Drought responses of flood-tolerant trees in Amazonian floodplains. Ann. Bot. 105, 129–139. doi: 10.1093/aob/mcp258
Peixoto, J. M. A., Nelson, B. W., and Wittmann, F. (2009). Spatial and temporal dynamics of alluvial geomorphology and vegetation in central Amazonian white-water floodplains by remote-sensing techniques. Remote Sens. Environ. 113, 2258–2266. doi: 10.1016/j.rse.2009.06.015
R Core Team (2019). R: A Language and Environment for Statistical Computing. Vienna: R Foundation for Statistical Computing.
Resende, A. F., Piedade, M. T. F., Feitosa, Y. O., Andrade, V. H. F., Trumbore, S. E., Durgante, F. M., et al. (2020). Flood pulse disturbances as a threat for long-living Amazonian trees. New Phytol. 227, 1790–1803. doi: 10.1111/nph.16665
Ricklefs, R. E. (1987). Community diversity: relative roles of local and regional processes. Science 235, 167–171. doi: 10.1126/science.235.4785.167
Rocha, M., Asses, R. L., Piedade, M. T. F., Feitosa, Y., Householder, J. E., Lobo, G., et al. (2019). Thirty years after Balbina Dam: diversity and floristic composition of the downstream floodplain forest, central Amazon, Brazil. Ecohydrology 12:e2144.
Schöngart, J., Piedade, M. T. F., Ludwigshausen, S., Horna, V., and Worbes, M. (2002). Phenology and stem-growth periodicity of tree species in Amazonian floodplain forests. J. Trop. Ecol. 18, 581–597. doi: 10.1017/s0266467402002389
Schöngart, J., Wittmann, F., Junk, W. J., and Piedade, M. T. F. (2017). Vulnerability of Amazonian floodplains to wildfires differs according to their typologies, impeding generalizations. PNAS 114, E8550–E8551.
Schöngart, J., Wittmann, F., Piedade, M. T. F., Junk, W. J., and Worbes, M. (2005). Wood growth patterns of Macrolobium acaciifolium (Benth.) Benth. (Fabaceae) in Amazonian black-water and white-water floodplain forests. Oecologia 145, 454–461. doi: 10.1007/s00442-005-0147-8
Schöngart, J., Wittmann, F., Resende, A. F., Assahira, C., Sousa Lobo, G., Neves, J., et al. (2021). The shadow of the Balbina dam: a synthesis of over 35 years of downstream impacts on floodplain forests in Central Amazonia. Aquat. Conserv. 1–19. doi: 10.1002/AQC.3526 [Epub ahead of print].
Targhetta, N., Kesselmeier, J., and Wittmann, F. (2015). Effects of the hydroedaphic gradient on tree species composition and aboveground wood biomass of oligotrophic forest ecosystems in the central Amazon basin. Folia Geobot. 50, 185–205. doi: 10.1007/s12224-015-9225-9
Ter Braak, C. (1987). The analysis of vegetation-environment relationships by canonical correspondence analysis. Vegetatio 69, 69–77. doi: 10.1007/978-94-009-4061-1_7
ter Steege, H., Oliveira, S. M., Pitman, N. C. A., Sabatier, D., Antonelli, A., Andino, J. E. G., et al. (2019). Towards a dynamic list of Amazonian tree species. Sci. Rep. 9:3501.
Timpke, K., and Kaplan, D. (2017). The changing hydrology of a dammed Amazon. Sci. Adv. 3:e1700611. doi: 10.1126/sciadv.1700611
Wittmann, F., Anhuf, D., and Junk, W. J. (2002). Tree species distribution and community structure of central Amazonian várzea forests by remote-sensing techniques. J. Trop. Ecol. 18, 805–820. doi: 10.1017/s0266467402002523
Wittmann, F., Householder, E., Oliveira Wittmann, A., Lopes, A., Junk, W. J., and Piedade, M. T. F. (2015). Implementation of the Ramsar convention on South American wetlands: an update. Res. Rep. Biodiv. Stud. 4, 47–58. doi: 10.2147/rrbs.s64502
Wittmann, F., Householder, E., Piedade, M. T. F., Assis, R. L., Schöngart, J., Parolin, P., et al. (2013). Habitat specificity, endemism and the neotropical distribution of Amazonian white-water floodplain trees. Ecography 36, 690–707. doi: 10.1111/j.1600-0587.2012.07723.x
Wittmann, F., Junk, W. J., and Piedade, M. T. F. (2004). The várzea forests in Amazonia: flooding and the highly dynamic geomorphology interact with natural forest succession. For. Ecol. Manag. 196, 199–212. doi: 10.1016/j.foreco.2004.02.060
Wittmann, F., Schöngart, J., and Junk, W. J. (2010). “Phytogeography, species diversity, community structure and dynamics of Amazonian floodplain forests,” in Amazonian Floodplain Forests: Ecophysiology, Biodiversity and Sustainable Management. Ecological Studies, Vol. 210, eds W. J. Junk, M. T. F. Piedade, F. Wittmann, J. Schöngart, and P. Parolin (Heidelberg: Springer Verlag), 61–104. doi: 10.1007/978-90-481-8725-6_4
Wittmann, F., Schöngart, J., Montero, J. C., Motzer, T., Junk, W. J., Piedade, M. T. F., et al. (2006). Tree species composition and diversity gradients in white-water forests across the Amazon basin. J. Biogeogr. 33, 1334–1347. doi: 10.1111/j.1365-2699.2006.01495.x
Wittmann, F., and Junk, W. J. (2016). “The amazon river basin,” in The Wetland Book II: Distribution, Description and Conservation, eds C. M. Finlayson, G. R. Milton, R. C. Prentice, and N. C. Davidson (Berlin: Springer Verlag Heidelberg), 1–20.
Keywords: ecosystem functioning, HOF models, species response curves, niche optima, hydrologic alteration, Igapo forest
Citation: Householder JE, Schöngart J, Piedade MTF, Junk WJ, ter Steege H, Montero JC, de Assis RL, de Aguiar DPP, Pombo MM, Quaresma AC, Demarchi LO, Parolin P, Lopes A, Feitoza GV, Durgante FM, Albuquerque BW, Chu A, Enßlin D, Fabian T, Fettweiß K, Hirsch M, Hombach M, Hubbuch A, Hutter B, Jäger T, Kober-Moritz R, Lindner MKR, Maier F, Nowak J, Petridis Z, Schierling L, Snjaric E, Egger G, Schneider E, Damm C and Wittmann F (2021) Modeling the Ecological Responses of Tree Species to the Flood Pulse of the Amazon Negro River Floodplains. Front. Ecol. Evol. 9:628606. doi: 10.3389/fevo.2021.628606
Received: 12 November 2020; Accepted: 12 March 2021;
Published: 01 April 2021.
Edited by:
Carlos Freitas, Federal University of Amazonas, BrazilCopyright © 2021 Householder, Schöngart, Piedade, Junk, ter Steege, Montero, de Assis, de Aguiar, Pombo, Quaresma, Demarchi, Parolin, Lopes, Feitoza, Durgante, Albuquerque, Chu, Enßlin, Fabian, Fettweiß, Hirsch, Hombach, Hubbuch, Hutter, Jäger, Kober-Moritz, Lindner, Maier, Nowak, Petridis, Schierling, Snjaric, Egger, Schneider, Damm and Wittmann. This is an open-access article distributed under the terms of the Creative Commons Attribution License (CC BY). The use, distribution or reproduction in other forums is permitted, provided the original author(s) and the copyright owner(s) are credited and that the original publication in this journal is cited, in accordance with accepted academic practice. No use, distribution or reproduction is permitted which does not comply with these terms.
*Correspondence: Florian Wittmann, Zmxvcmlhbi53aXR0bWFubkBraXQuZWR1
Disclaimer: All claims expressed in this article are solely those of the authors and do not necessarily represent those of their affiliated organizations, or those of the publisher, the editors and the reviewers. Any product that may be evaluated in this article or claim that may be made by its manufacturer is not guaranteed or endorsed by the publisher.
Research integrity at Frontiers
Learn more about the work of our research integrity team to safeguard the quality of each article we publish.