- 1Laboratory of Forest Ecosystem, Department of Forest Science, Faculty of Agriculture, The University of Tokyo, Bunkyo, Japan
- 2The University of Tokyo Chichibu Forest, The University of Tokyo Forests, Graduate School of Agricultural and Life Sciences, The University of Tokyo, Chichibu, Japan
Eutrophication of aquatic ecosystems is a serious global issue. Stream nitrate concentrations at the University of Tokyo Chichibu Forest have increased since 2000 after the opening of the new highway in 1998. Nitrogen oxide emissions from automobile exhausts were the most likely source of increased nitrate input in the forest ecosystem. Around the area, the sika deer Cervus nippon Temminck population has greatly increased since around 2000 and intensively browsed the understory vegetation. We hypothesized that the degradation of the understory vegetation caused by the deer overpopulation was one of the causes of increased nitrate output. Monthly observations were carried out from April to October 2013 to investigate the understory vegetation at the heights of 0–30 and 100–150 cm above the ground inside (without deer) and outside (with deer) of a deer exclusion fence. Plant taxa and % coverage of each taxon at each layer were recorded. The in vivo nitrate reductase activity (NRA) (≈ nitrate assimilation rate) was determined for each plant taxa each month. Compared to inside the fence, the understory vegetation outside was poor with smaller % coverage and less diverse community structure, and was occupied by unpalatable plant taxa that were uncommon or absent inside the fence. Contrary to our expectation, the phylogenetic diversity of the community assemblage outside the fence showed greater evenness (less clustering) than inside. The NRA peaked in early in the season or late in the season. In contrast to a previous report, no significant difference in the NRA was found between woody and herbaceous plants. Although the difference was no more than that of vegetation coverage, the estimated community-level NRA inside the fence was 5.6 times higher than that of the outside. The difference was greatest early in the season. These results support our hypothesis.
Introduction
Eutrophication of aquatic ecosystems is a serious global issue (Chislock et al., 2013). Nitrogen overload that results in the alleviation of nitrogen limitations to biological functions and increase in nitrate mobility in soils is called nitrogen saturation, which has been reported in various temperate forests, especially in Europe and North America (Aber et al., 1998). Because the nitrogen budget of a forest ecosystem is determined by the balance between nitrogen input and output (Vitousek and Howarth, 1991), it is necessary to evaluate possible causes of input–output nitrogen saturation. Nitrogen deposition has increased approximately five times over the past 100 years (Galloway and Cowling, 2002). Approximately 80% of the deposited anthropogenic nitrogen originates from the industrial production of nitrogen-based fertilizers, whereas the other 20% relates to emissions from fossil fuel (Gruber and Galloway, 2008). However, almost all the nitrogen deposition in forest ecosystems is attributed to the latter. Nitrogen absorption by plants determines the output. Some studies have reported that understory vegetation in old-growth stands played a more important role in preventing nitrate leaching than canopy trees (Goodale et al., 2000; Furusawa et al., 2005). Therefore, the degradation of the understory vegetation by increased herbivore densities may influence leaching from soil and thereby affect the nitrate output. In Alaska, moose density has had a substantial effect on nutrient cycling, ostensibly through browsing and inputs from fecal and urinary nitrogen (Molvar et al., 1993).
Overpopulation by the Sika deer Cervus nippon Temminck has caused various problems in forest and agricultural ecosystems. The degradation of the understory vegetation by deer grazing and the mortality of adult trees by debarking are major direct effects of the deer (Takatsuki, 2009). In some places in Japan, forest ecosystems have changed to grassland ecosystems by regime shifts caused by deer overpopulations (Shibata and Hino, 2009).
In the University of Tokyo Chichibu Forest (UTCF), the influence of deer overpopulation on the forest ecosystem has become obvious since around 2000 (Kamata et al., 2020) with an increase in dead tree skeletons, the degradation of understory vegetation, and an increase in plants unpalatable to deer (Sakio et al., 2013). A population of an endangered species, Cypripedium japonicum Thunberg, grows in the understory of a Zelkova serrata (Thunberg) Makino plantation that was planted 1934. In 2006, UTCF constructed an exclosure fence (5 m × 20 m) to protect the endangered population from deer grazing. The great difference in the understory vegetation between the inside and outside of the fence is evidence of the substantial influence of deer grazing on the understory vegetation (Supplementary Figure S1).
On the other hand, the construction of a new highway started inside the territory of the UTCF from the middle of the 1980s. To monitor the impact of the road construction and gallets from the tunnels, UTCF began monitoring the water quality of the two branch rivers of the Arakawa River System in 1989 (The University of Tokyo Forests, 1998). One of these branches is actually the main stream of the Arakawa River. According to monitoring reports (The University of Tokyo Forests, 1998; Gomyo et al., 2011), nitrate (NO-N) concentrations in the stream water have increased since 2000. The emission of NOX from automobile exhausts was the most likely cause of the increase in nitrate input in the forest ecosystem. Although the influence of sika deer overpopulation became obvious around the same time (Kamata et al., 2020), no studies have been conducted to determine indirect impact of the overpopulation on nitrate leaching (output) via the degradation of understory vegetation.
Plants absorb inorganic nitrogen, such as ammonium (NH-N) and NO–N, in the soil. All vascular plants can utilize NH–N; however, not all plants can utilize NO–N. Organic nitrogen supplied to the soil will be mineralized to NH and then nitrified to NO by bacteria. Soil particles are negatively charged in most parts of Japan because the soil is volcanic and acidic. Ammonium nitrogen is a positively charged cation that is usually attached to the negatively charged soil particles, whereas NO-N is a negatively charged anion that is not attached to soil particles, so that NO-N has higher mobility in the soil. For these reasons, the free NO-N easily leaches from the soil (the forest ecosystem) to stream water (aquatic ecosystem). If a large amount of NO flows into streams, it will lead to eutrophication of the aquatic ecosystem. The utilization of NO varies greatly among plant taxa (Al Gharbi and Hipkin, 1984; Gebauer et al., 1998). It is known that the NO reductase activity (NRA), which is an index of the ability of NO utilization by plants, is generally higher in herbaceous plants than woody plants (Smirnoff et al., 1984). We hypothesized that the degradation of the understory vegetation, especially of herbaceous plants, by the deer overpopulation was one of the causes of the increased NO concentration in the stream water in UTCF.
In this study, we surveyed seasonal changes in the understory vegetation inside and outside the deer exclusion fence. The percentage of coverage and NRA of each plant taxon was determined. Taxonomic diversity and phylogenetic diversity were estimated from the vegetation data to evaluate the influence of deer on the understory plant community assemblage. A community-level NRA was estimated inside and outside of the fence by using the percent coverage and NRA values. The indirect influence of deer on the increase of stream water NO was discussed, as well as the direct influence of deer on the diversity of the understory vegetation.
Materials and Methods
Research Site
The survey was conducted in an 80-year-old Z. serrata plantation (planted 1934) at the UTCF located about 1,030 m a.s.l. (35°56′35″N, 138°49′00″E). An endangered species, C. japonicum, grows in the understory, which is registered to the Red Data of Saitama Prefecture. Due to the rapid increase of Sika deer (Kamata et al., 2020), a 5 m × 20 m exclosure fence was installed in 2006 to protect C. japonicum from deer grazing. We expected that the effect of deer could be estimated by comparing the vegetation inside and outside of the fence.
Vegetation Survey and Samples for the in vivo Assay
The monthly vegetation surveys and plant material sampling for the in vivo NRA assays were conducted on April 11, May 7, June 4, July 8, August 8, September 9, and October 15, 2013.
Twelve 1 m × 1 m quadrats (six for inside the fence and six for outside) were set before seed germination or budburst. The distance between quadrats was approximately 4 m. The quadrats inside and outside the fence were approximately 1 and 5 m apart from the fence, respectively. The percentage of vegetation coverage and proportion of each plant taxa were recorded for the layer of 0–30 cm above the ground level (a.g.l.) and the layer 100–150 cm a.g.l.
Approximately 3 g (fresh weight) of leaf samples of each taxa were collected on each sampling date from plants outside of the 12 quadrats and placed in a cooler box with ice packs until the laboratory analysis. Therefore, the plant taxa used for the assay did not completely overlap with those found in the vegetation survey (Supplementary Table S1). The samples were collected between 13:00 and 15:00 to avoid the effect of diurnal changes in the NRA.
In vivo NRA Assay
The in vivo NRA assay was performed based on a modified version of the Jaworski method (Jaworski, 1971). We followed Koyama et al. (2019) as follows:
Reagents
Incubation buffer: 0.1 mol L–1 KNO3, 0.1 mol L−1 KH2PO4, and 1.5% 1-propanol; the pH was adjusted to ca. 7.5 using a NaOH solution.
Diazotizing agent: 0.5 g of sulfanilamide was dissolved in 100 ml of 2.4N HCl.
Coupling agent: 0.3 g of N-1-naphthylethylenediamine dihydrochloride was dissolved in 100 ml of 0.12 N HCl.
NO2-standard solution: 0.6900 g of NaNO2 was dissolved in an appropriate amount of ion-exchanged water and then filled up to 100 ml. It was diluted with ion-exchanged water to 2, 10, 20, 30, 40, and 50 μM.
In vivo Assay
(i) Approximately 100 mg (fresh weight) of leaf laminae were cut into small fragments (approximately 2.5 mm × 2.5 mm segments of leaves) and transferred to test tubes.
(ii) The incubation buffer (5 ml) was added to the leaves, and the tube contents were vacuum-infiltrated. The samples were incubated for 1 h in darkness and then placed in hot water (>80°C) to terminate enzyme activity.
(iii) Absorbance (545 nm) was measured following diazotization and coupling as the end-point. The confounding effects of plant pigments were corrected by subtracting the absorbance of the controls, to which N-naphthyl ethylene diamine dihydrochloride was not added (Gebauer et al., 1998).
(iv) The six levels of the NO2-standard solution were subjected to step (iii) to obtain a calibration curve.
NRA per Mass and per Leaf Area
A fraction of each leaf sample was oven-dried at 70°C for 1 week and then weighed. The concentration of NO-N in the incubation buffer was calculated from the curve. The NRA per mass was obtained for each sample.
Using three fresh leaves for each taxon, which were not used for the NRA assay, the leaf area was determined using the free software ImageJ ver. 1.50i (Schneider et al., 2012) after digitizing each leaf. The leaves were oven-dried at 70°C for 1 week and then weighed. The leaf mass per area was calculated for each leaf. Finally, the NRA per area was also determined for each taxon.
Analyses
Phylogenetic Tree
The pairwise phylogenetic distance among plant taxa used in this study was calculated from trees stored by Zanne et al. (2014). Plant taxa that were not included in the database were replaced with other taxa in the same genus. Sasa was used as a substitute for Sasamorpha borealis because no taxa belonging to the genus Sasamorpha were registered.
Plant Community
Seasonal changes in the vegetation index metrics were compared between the inside and outside of the fence. The vegetation coverage was compared between the lower (0–30 cm a.g.l.) and higher (100–150 cm a.g.l.) layers of the understory separately. Species richness (R: the number of taxa) and the Shannon index (H′) (Shannon, 1948) were calculated by combining the two layers. The Shannon index was calculated using the following equation:
where pi is the sum of the proportion of vegetation coverage of the ith taxon in the lower and higher layers (200% at maximum). On the other hand, the species richness was not the sum of the number of species found in each of the two layers, but the total number of species in the two layers. Namely, one species was counted as a single species even if the species was found in both layers. The Bray-Curtis dissimilarity index was also calculated to compare the similarity of the community assemblage between the outside and inside of the fence and among months.
The effects of the factors FENCE (inside/outside) and MONTH (April to October) on the plant community were tested using a permutational analysis of variance (PERMANOVA) following a test of homogeneity of dispersions by a permutational multivariate analysis of dispersion (PERMDISP). To visualize the effects of FENCE and MONTH in relation to each taxon, plant taxa were ordinated using non-metric multidimensional scaling (NMDS) with a Bray-Curtis dissimilarity index as the distance between the assemblages. The sum of the vegetation coverage of the two layers was used for these analyses.
Three phylogenetic diversity metrics, namely phylogenetic diversity (PD), mean pairwise distance (MPD), and mean nearest taxon distance (MNTD), were estimated. The PD evaluates the total length of phylogenetic trees, MPD evaluates the average of the evolutionary distance between all pairs of species in the assemblage, and MNTD evaluates the average of the evolutionary distance between each species and its nearest relative (Barber et al., 2017). To remove the effect of species richness (the number of taxa in each assemblage) and evaluate the phylogenetic evenness or clustering of the species in the assemblages (Kellar et al., 2015), the standardized effect sizes (SES) of the three metrics were also estimated. The SES metrics were calculated by comparing the observed value and a randomly generated dataset (Kellar et al., 2015). There were 1,000 randomizations in each standardized effect size analysis.
A generalized linear mixed model (GLMM) was employed to test the effect of the factor FENCE on these metrics with the factor MONTH as a random effect. A gamma distribution was used as an error structure with a log link function except for species richness, where a Poisson distribution was used as an error structure with a log link function. A linear mixed model (LMM) was used for the SES values. Regarding vegetation coverage, a beta regression with a log link function was employed after transforming the percentage of coverage (0–100) to the proportion (0–1) by dividing by 100. In the beta regression, both the factors FENCE and MONTH were used as explanatory variables due to a limitation of the library.
NRA at an Individual Plant Level
To test the difference in the NRA between woody and herbaceous plants, a GLMM was employed, with the factor WH (woody/herbaceous) set as a fixed effect, and MONTH and SPECIES as random effects. Next, to test differences in the NRA between plant taxa that were found only inside the fence (I) and those outside (O), the fixed effect of the previous model was replaced with I/O.
To test the effects of season on the NRA, a GLMM with the same error structure was employed, with MONTH as a fixed effect and SPECIES as a random effect. A post-hoc Tukey HSD multiple comparison was employed for pairwise comparisons among months. The coefficients of each month and each plant taxon were used to estimate a community-level NRA in section “NRA at a Community Assemblage Level” (Supplementary Table S2).
To test for phylogenetic signals in the NRA, a K statistic (Blomberg et al., 2003) and p-value based on randomization were calculated to investigate the relationship between the NRA and phylogeny for each plant taxon. The K statistic was calculated from the phylogeny of taxa and NRA of each taxon, which is the variance of phylogenetically independent contrasts (PIC) (Felsenstein, 1985) divided by its expectation under a Brownian motion model. The coefficients of taxa as a random effect in the GLMM that were conducted to test the effects of MONTH on the NRA in the previous paragraph were used as the NRA values. A K < 1 indicates that closely related taxa have NRA levels that are less similar than expected under a Brownian motion model of evolution, while K > 1 indicates that closely related taxa have NRA levels that are more similar than expected. We then tested the p-value by comparing the variance of the PIC computed from the NRA coefficients on the topology of the phylogenetic tree to those computed by randomly assigning the NRA coefficients to the tips in the phylogenetic tree 999 times. If the variances in the PIC for the observed data were lower than those from the permutations, then significant conservatism was indicated (Blomberg et al., 2003). In order to help intuitively interpret the meaning of K, we examined a traitgram (Ackerly, 2009), in which the isolates were arranged along the NRA-coefficient axis and connected by the underlying phylogeny, thus reconstructing the evolution under a Brownian motion model. Traitgrams with more branches crossing indicate lower similarity between phylogenetic relatedness and traits.
NRA at a Community Assemblage Level
The index of net NRA (NetNRA) activity of each quadrat on each sampling date was calculated by summing the product of the NRA per leaf area (NRAA) and the coverage (COV) of each plant taxa on each sampling date as follows:
where i is the ith plant taxon. However, we could not sample all taxa found in the quadrats because plant samples used for the NRA assays were taken from outside of the quadrats. Regarding taxa for which the NRAA value was not obtained by the in vivo assay, the value was estimated using coefficients of each month and each plant taxon obtained by the GLMM with MONTH as a fixed effect and SPECIES as a random effect in section “Plant Community” (Supplementary Table S2). Monthly NRAA estimates without a species effect were used for species for which the NRA was not analyzed at all.
Software and Library
All analyses were performed using the free software R (ver. 3.6.3) (R Development Core Team, 2019). A package “glmmADMB (Skaug et al., 2018)” was used for the GLMM, a package “betareg” was used for a beta regression (Cribari-Neto and Zeileis, 2010), a package “vegan (Oksanen et al., 2019)” was used for metrics of community diversity and dissimilarity, and packages “brranching (Chamberlain, 2020),” “ape (Paradis and Schliep, 2019),” and “picante (Kembel et al., 2010)” were used for phylogenetic analyses.
Results
Fifty-four species were founds in this study (Supplementary Table S1). Among these, 48 species were recorded during the vegetation surveys and 51 were used for the in vivo NRA assay. All biennials and perennials were deciduous plants so that there were no evergreen plants in the site. The phylogenetic tree used in this study is shown in Supplementary Figure S2.
Seasonal Changes in Plant Community Assemblage Inside and Outside Fence
The mean coverage of each plant species inside and outside of the fence at 0–30 and 100–150 cm a.g.l. from May to October are shown in Supplementary Table S3. The number of taxa found inside and outside the fence were 38 and 31, respectively. Among these, 18 taxa appeared in both locations.
The vegetation coverage at 0–30 cm a.g.l. peaked in May and September inside and outside the fence, respectively (Figure 1A), whereas that at 100–150 cm a.g.l. peaked in August (Figure 1B). The vegetation coverage at 100–150 cm a.g.l. was almost 0% outside the fence and was without a clear peak. Species richness (the number of taxa) increased with season until August inside the fence and until September outside (Figure 1C). On the other hand, the Shannon index increased until May inside the fence and until Jun outside the fence, and did not change thereafter (Figure 1D). All four indicators were significantly greater inside the fence than outside, with significant differences (beta regression for vegetation coverage, GLMM for the number of species and Shannon index: p < 0.05). The seasonal peaks of all the metrics appeared earlier inside the fence than outside of it.
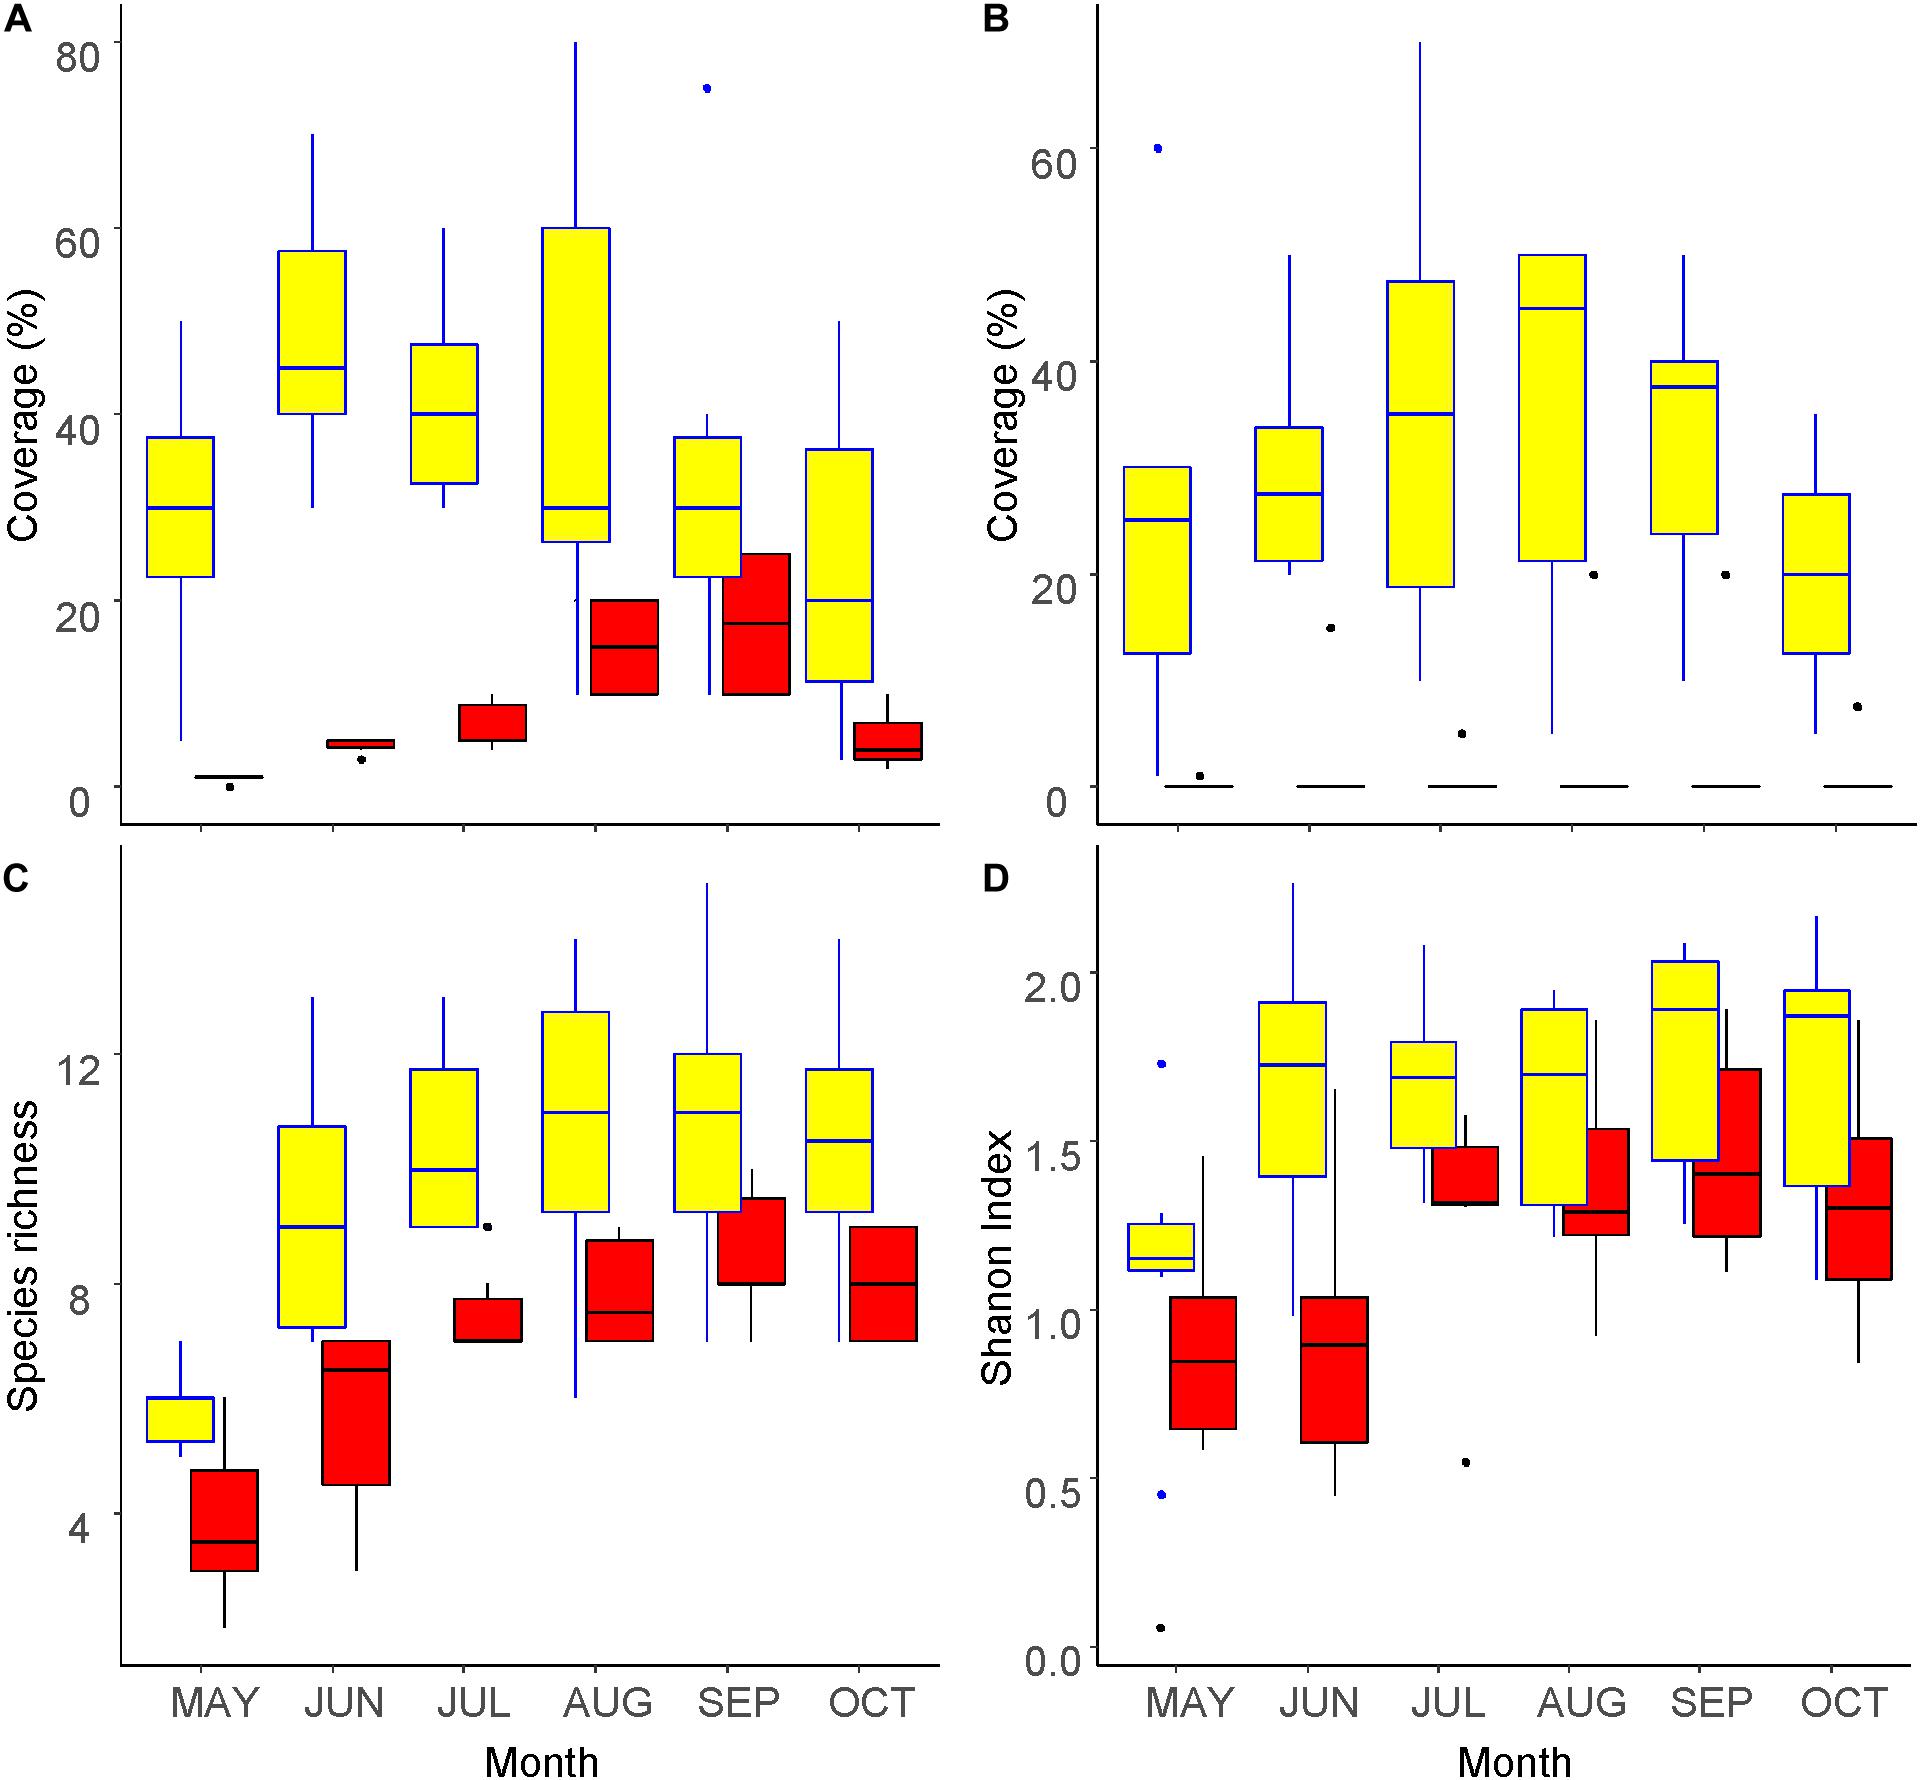
Figure 1. Seasonal changes in vegetation inside (yellow) and outside (red) of the exclosure fence at the Zelkova serrata plantation in the University of Tokyo Chichibu Forest. (A) Percentage of vegetation coverage at 0–30 cm above ground level. (B) Percentage of vegetation coverage at 100–150 cm above ground level. (C) Number of species. (D) Shannon index.
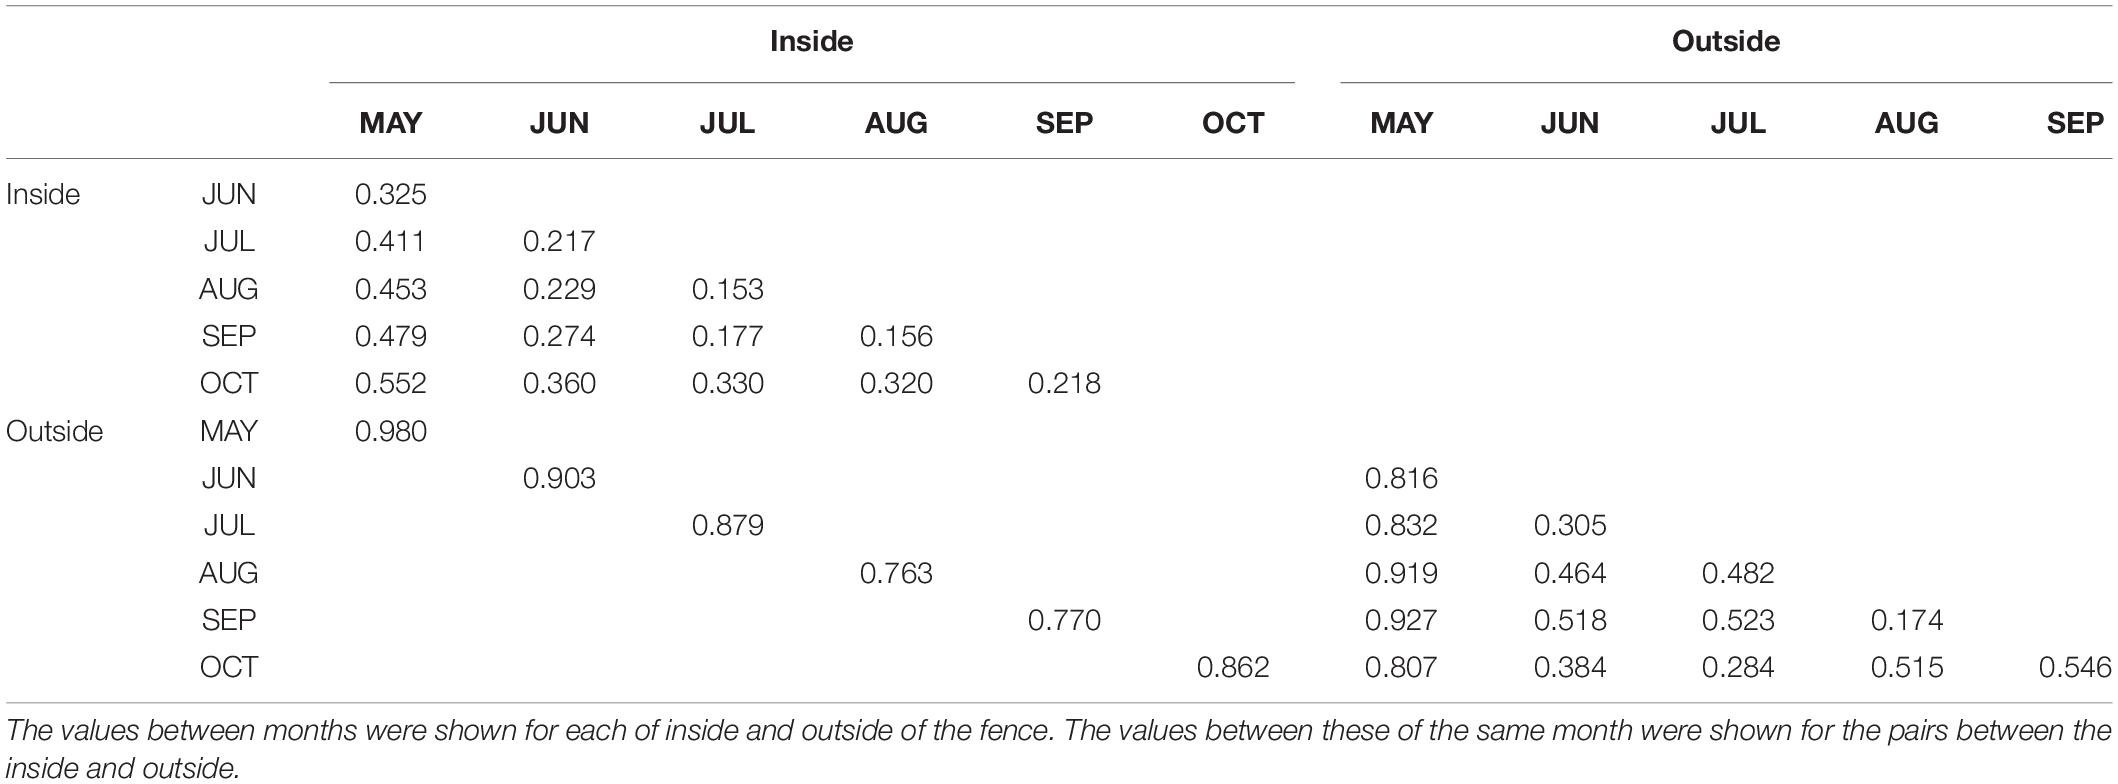
The pairwise Bray-Curtis dissimilarity indices indicated that dissimilarity was high between the inside and outside of the fence for the same month (Table 1). The pairwise dissimilarity among the months was lower inside the fence than outside. Dissimilarities between May and the other months were high both inside and outside of the fence. The plant community assemblage was significantly influenced by both FENCE (p < 0.001) and MONTH (p < 0.05) (PERMANOVA), although the dispersion of the assemblage did not differ among the groups by FENCE or MONTH (PERMDISP: p > 0.05). The NMDS results supported the Bray-Curtis dissimilarity indices (Figure 2). Namely, the 95% SE of the centroid did not overlap between the outside and inside of the fence. The 95% SE of the centroid among months other than May greatly overlapped each other, whereas overlaps between May and the other months were small.
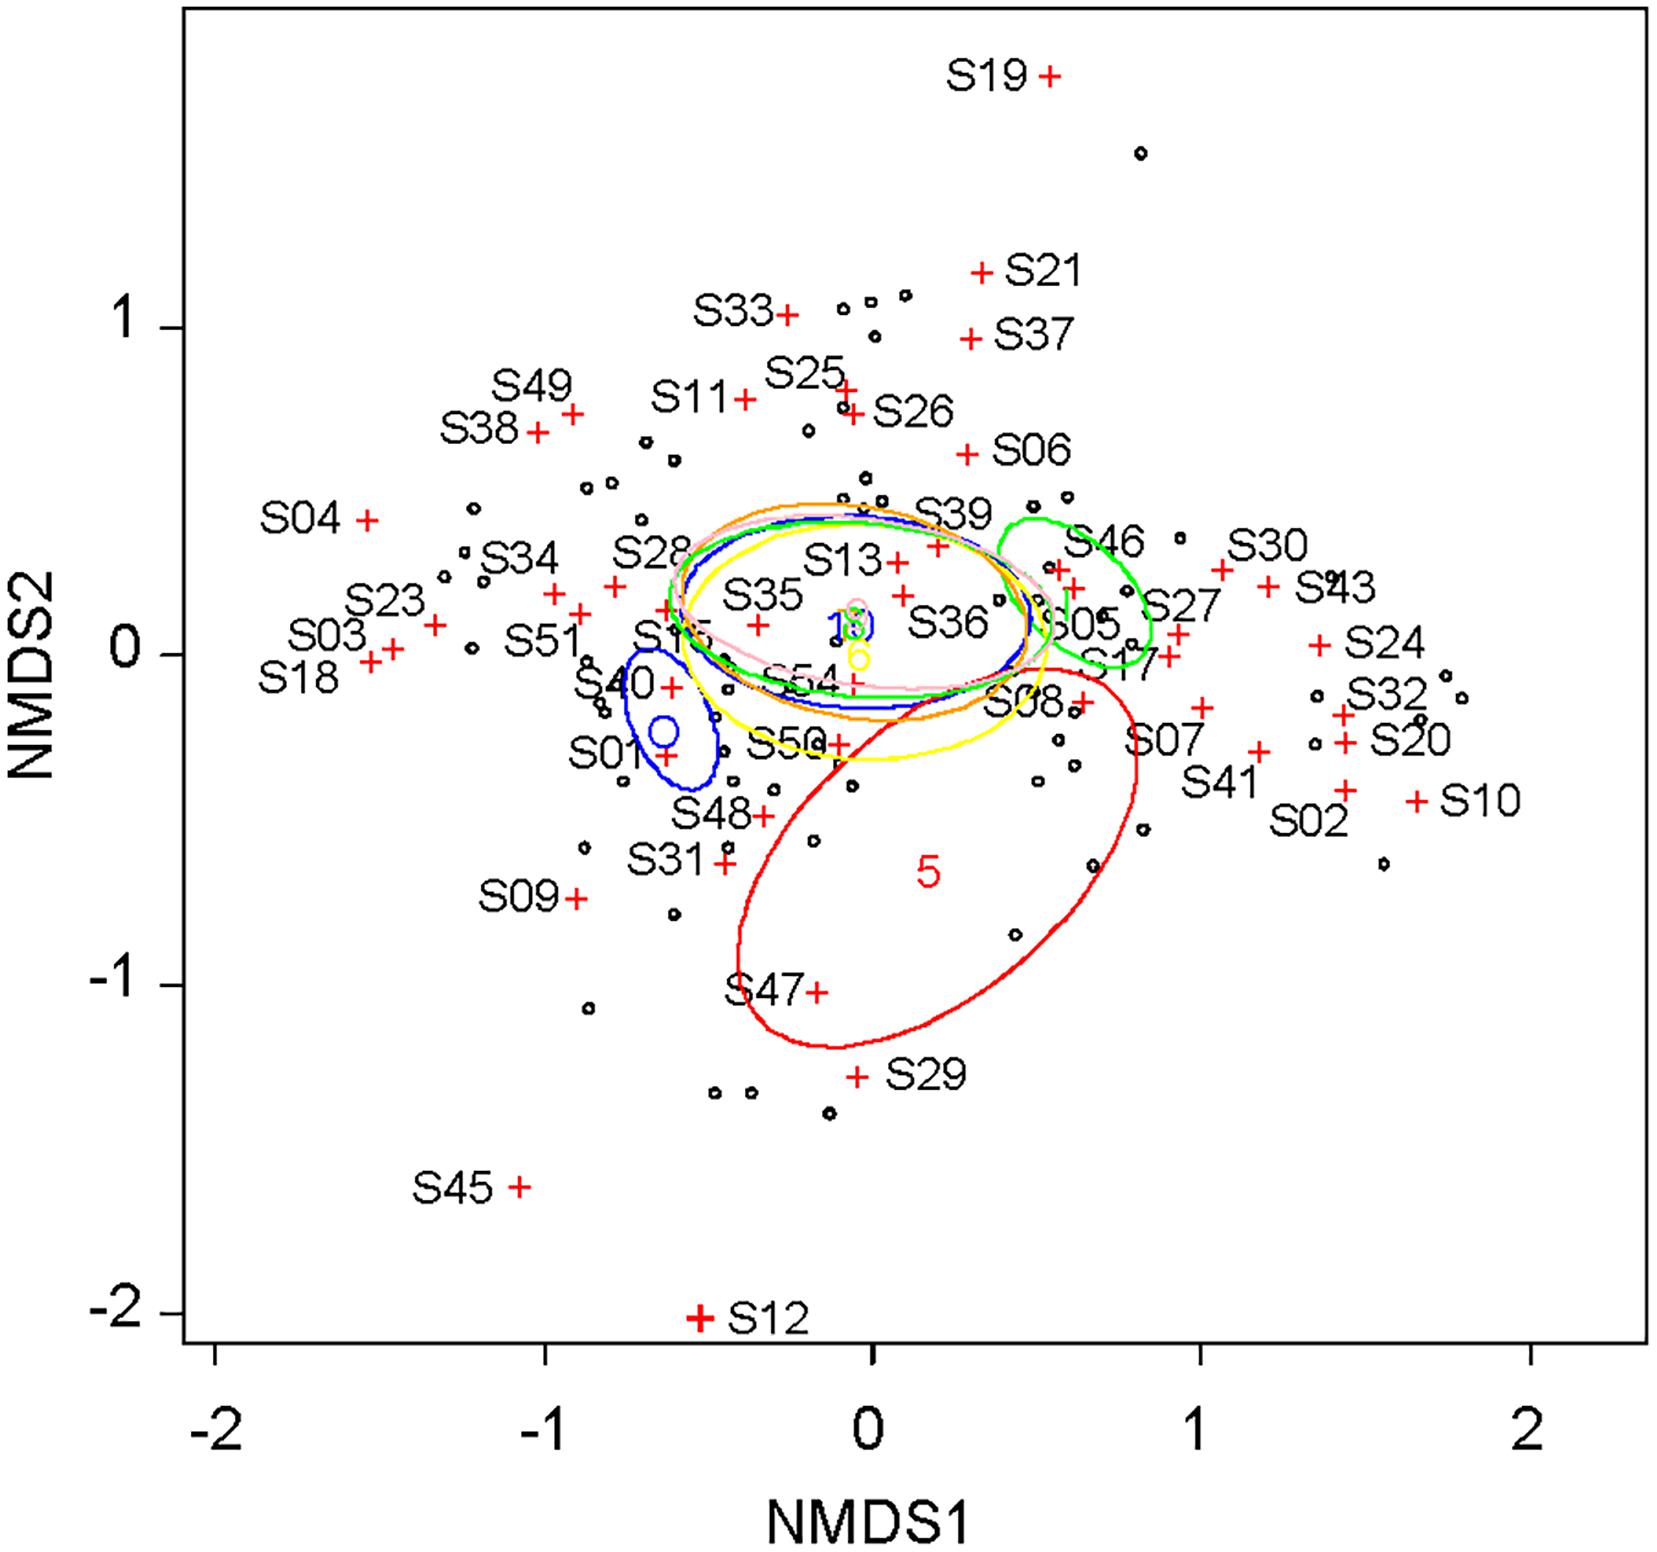
Figure 2. Coordination of the plant community according to coverage by each plant taxon, which were observed monthly outside and inside the fence from May to October. Non-metric multidimensional scaling (NMDS) was used with a Bray-Curtis dissimilarity index as the distance between the assemblages. Ellipses for the 95% confidence interval of the centroid were shown for inside and outside of the fence and for each month from May to October. See Supplementary Table S1 for taxa ID.
Figure 3 shows seasonal changes in the three phylogenetic diversity metrics. Similar to the number of taxa shown in Figure 1C, the values of PD increased with the seasonal progression until August inside the fence and until September outside (Figure 3A), whereas those of MNTD changed in an opposite manner (Figure 3E). The change in MPD differed between the inside and outside of the fence, which showed a similar and an opposite trend to that of species richness, respectively (Figure 3C). Comparing the inside and outside of the fence, the PD values were greater inside, whereas those of MPD and MNTD were greater outside. The difference in each of the three metrics between the outside and inside of the fence was significant (GLM, p < 0.001). Regarding the SES values of the three metrics, the seasonal trends were less clear and the values were consistently smaller inside than outside of the fence (Figures 3B,D,F), indicating stronger phylogenetic clustering inside the fence, which was significantly different compared with outside the fence (LM, p < 0.001).
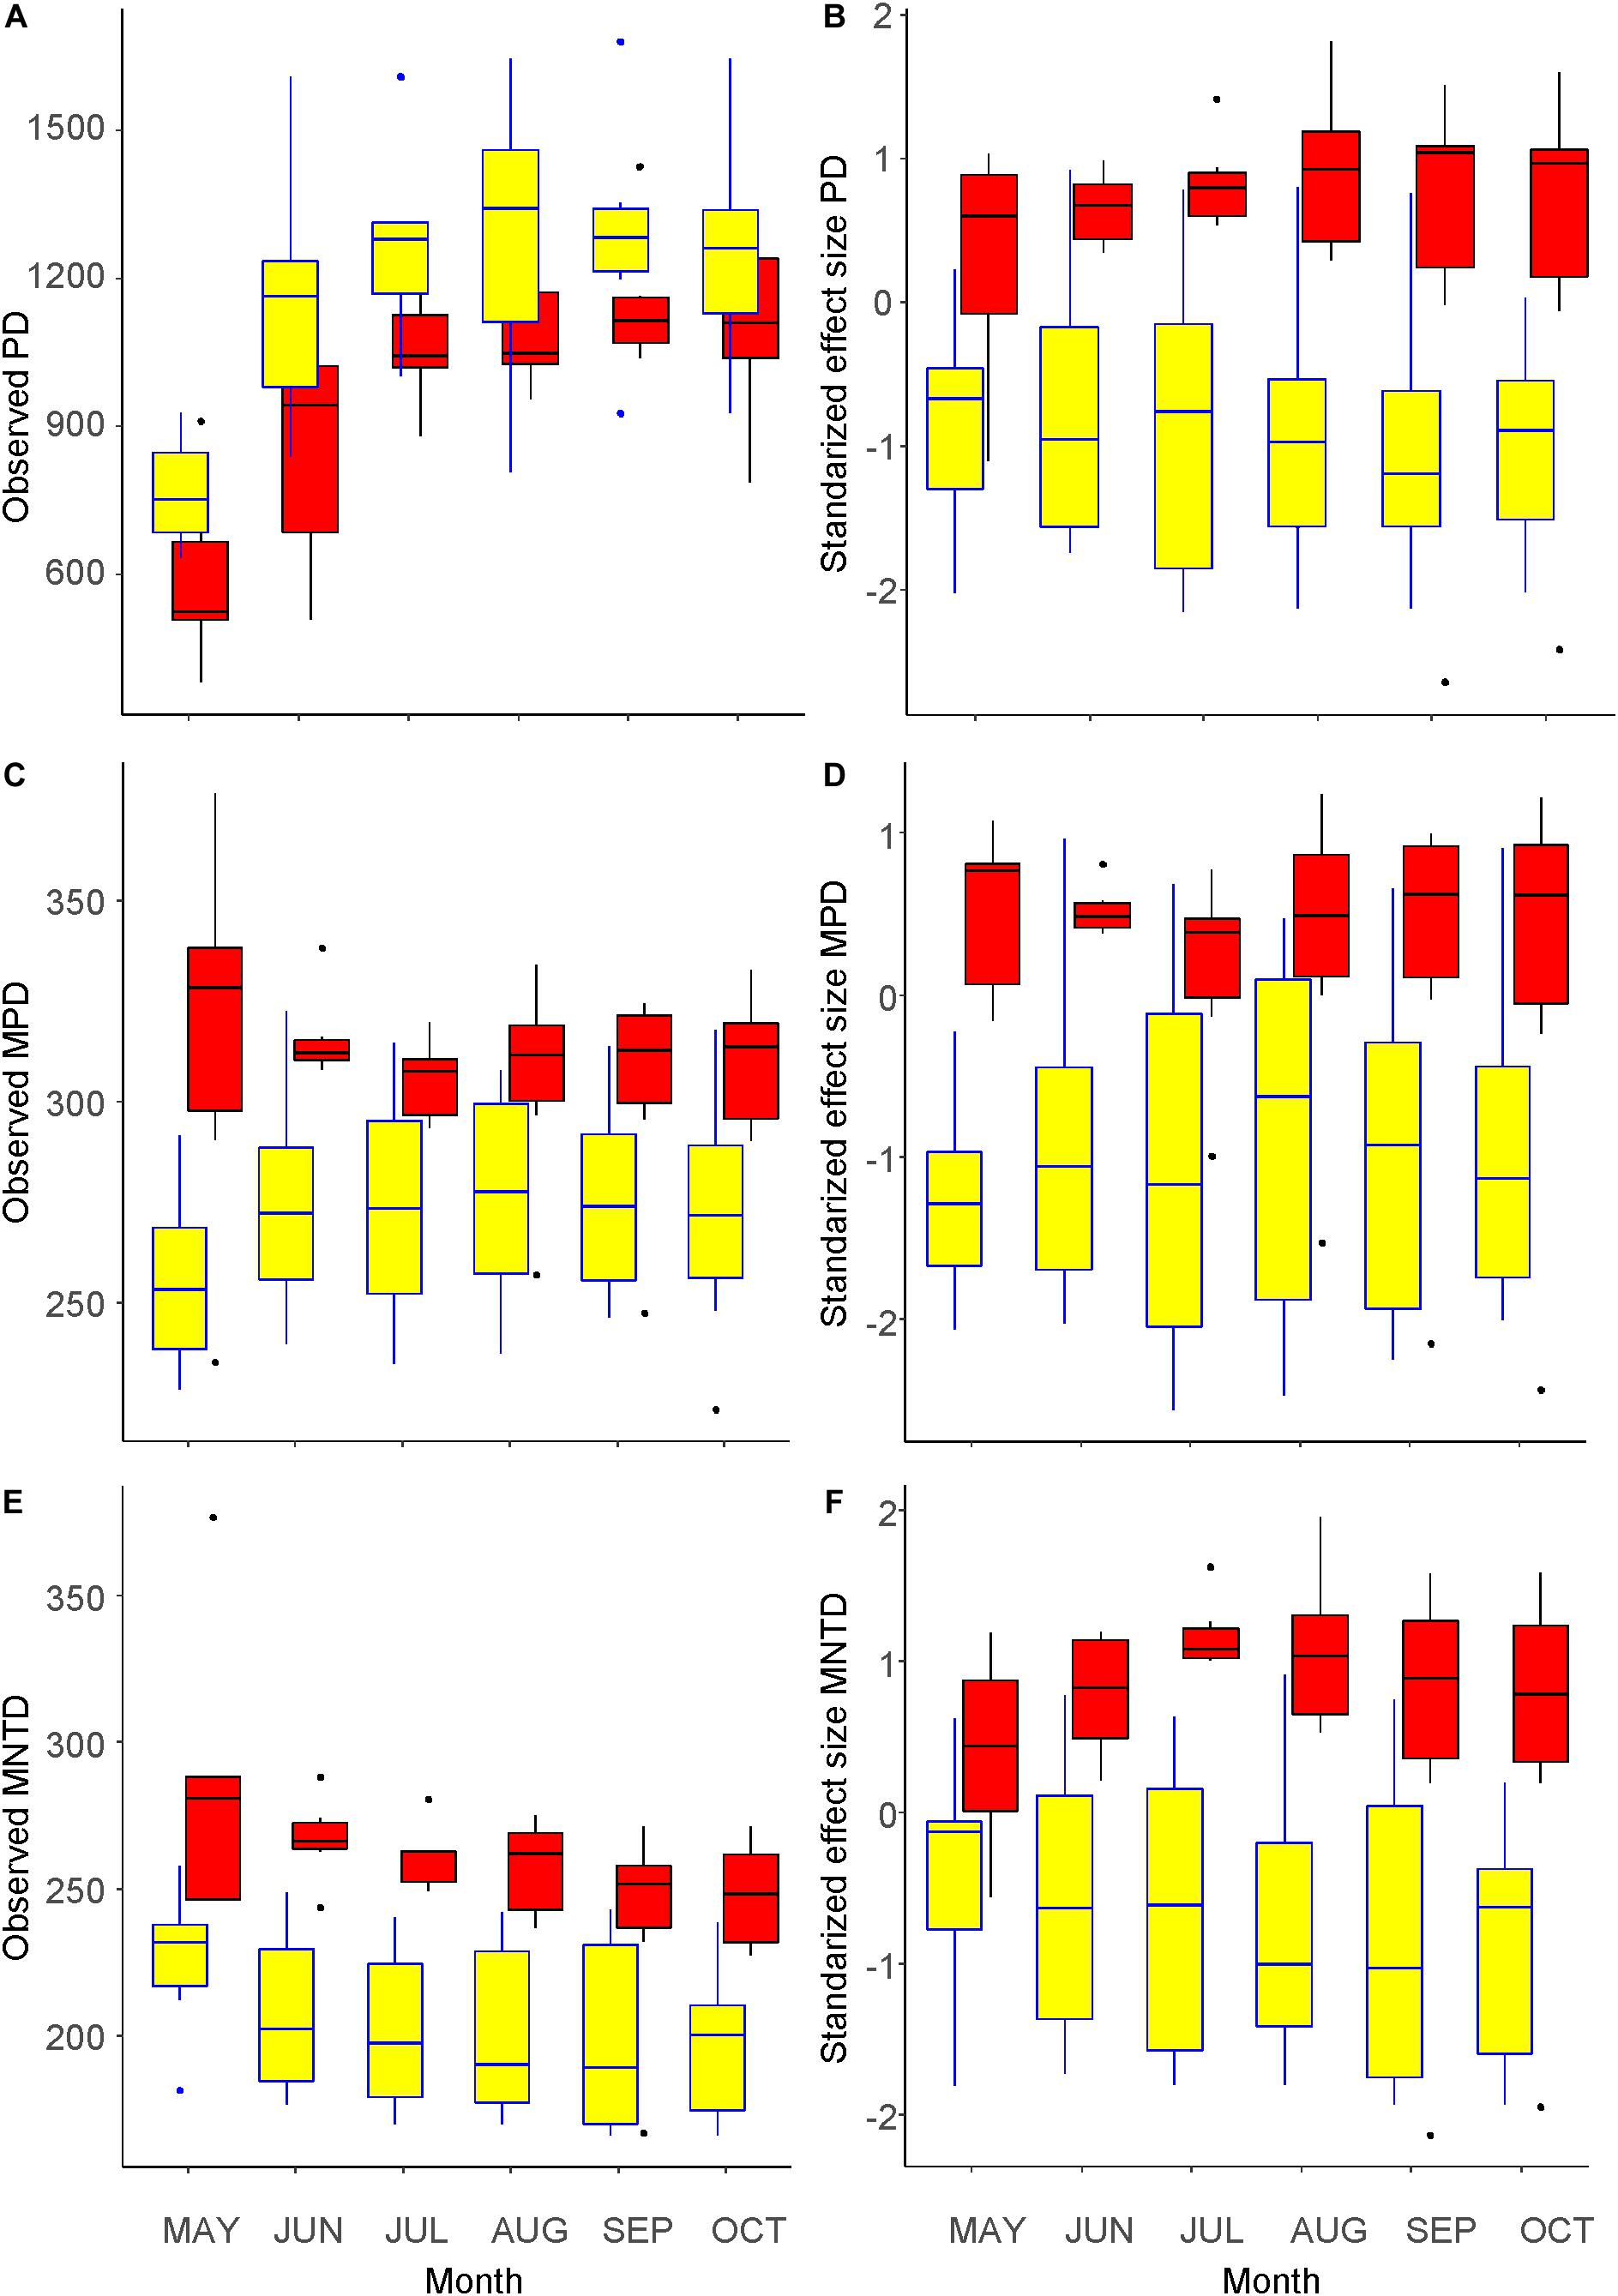
Figure 3. Metrics of phylogenetic diversity of the understory vegetation inside (yellow) and outside (red) of an exclosure fence at a Zelkova serrata plantation in the University of Tokyo Chichibu Forest. (A) Phylogenetic diversity (PD). (B) Standardized effect sizes of phylogenetic diversity (SES.PD). (C) Mean pairwise distance (MPD). (D) Standardized effect sizes of mean pairwise distance (SES.MPD). (E) Mean nearest taxon distance (MNTD). (F) Standardized effect sizes of mean nearest taxon distance (SES.MNTD).
Nitrate Reductase Activity at the Species Level
The NRA per mass of leaves are shown in Supplementary Table S4.
The NRA tended to be higher early and late in the season but low in the middle (Figure 4). The NRA was significantly higher in April and May than in the other months and significantly lower in June and July than in the other months. However, at the species level, regardless of the timing (month) of the first appearance of each species, the values tended to decrease from the first sampling to the next sampling. The NRA at the first appearance was higher than both the second appearance (n = 41 taxa) and the next month (n = 39 taxa), and both differences were significant (GLMM, p < 0.001).
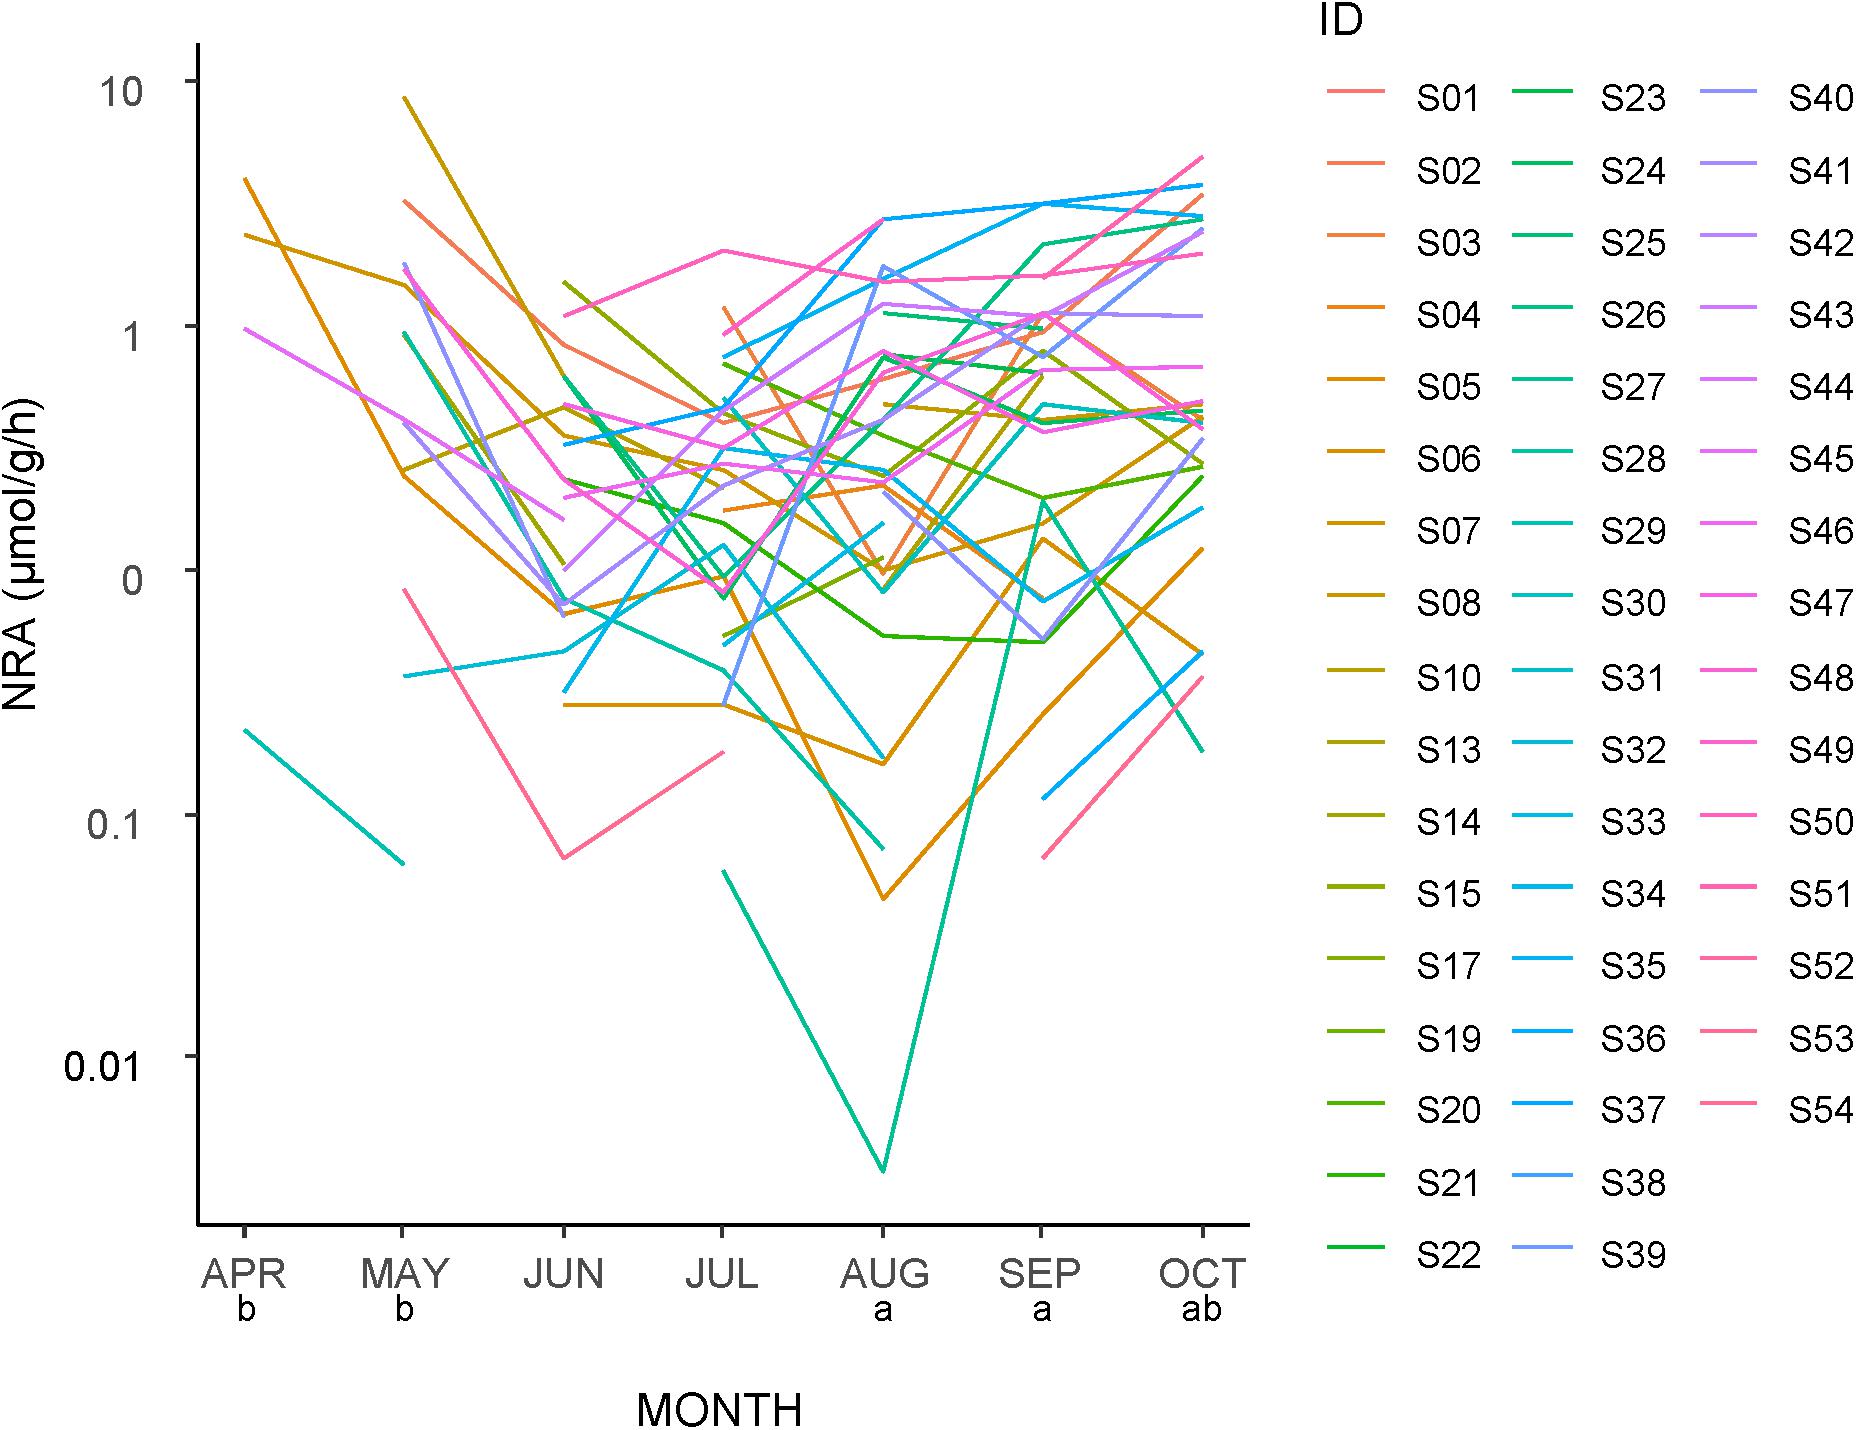
Figure 4. Seasonal changes in the nitrate reductase activity (NRA) of leaves of each plant taxa in a logarithmic scale. The same letters below the month labels indicate no significant difference in the NRA among the months by a Tukey HSD multiple comparison following a generalized linear mixed model with SPECIES as a random effect (Gamma error structure and a log link function). See Supplementary Table S1 for taxa ID.
No significant differences in the NRA were found between woody and herbaceous plants (GLMM, p > 0.05), nor between taxa found only inside or outside the fence (GLMM, p > 0.05).
Figure 5 shows a traitgram of the NRA. The phylogenetic signal was smaller than the Brownian motion expectation because Blomberg’s K was smaller than 1 (K = 0.47). The results of PIC also indicated no significant correlation between the NRA and plant phylogeny (p > 0.05).
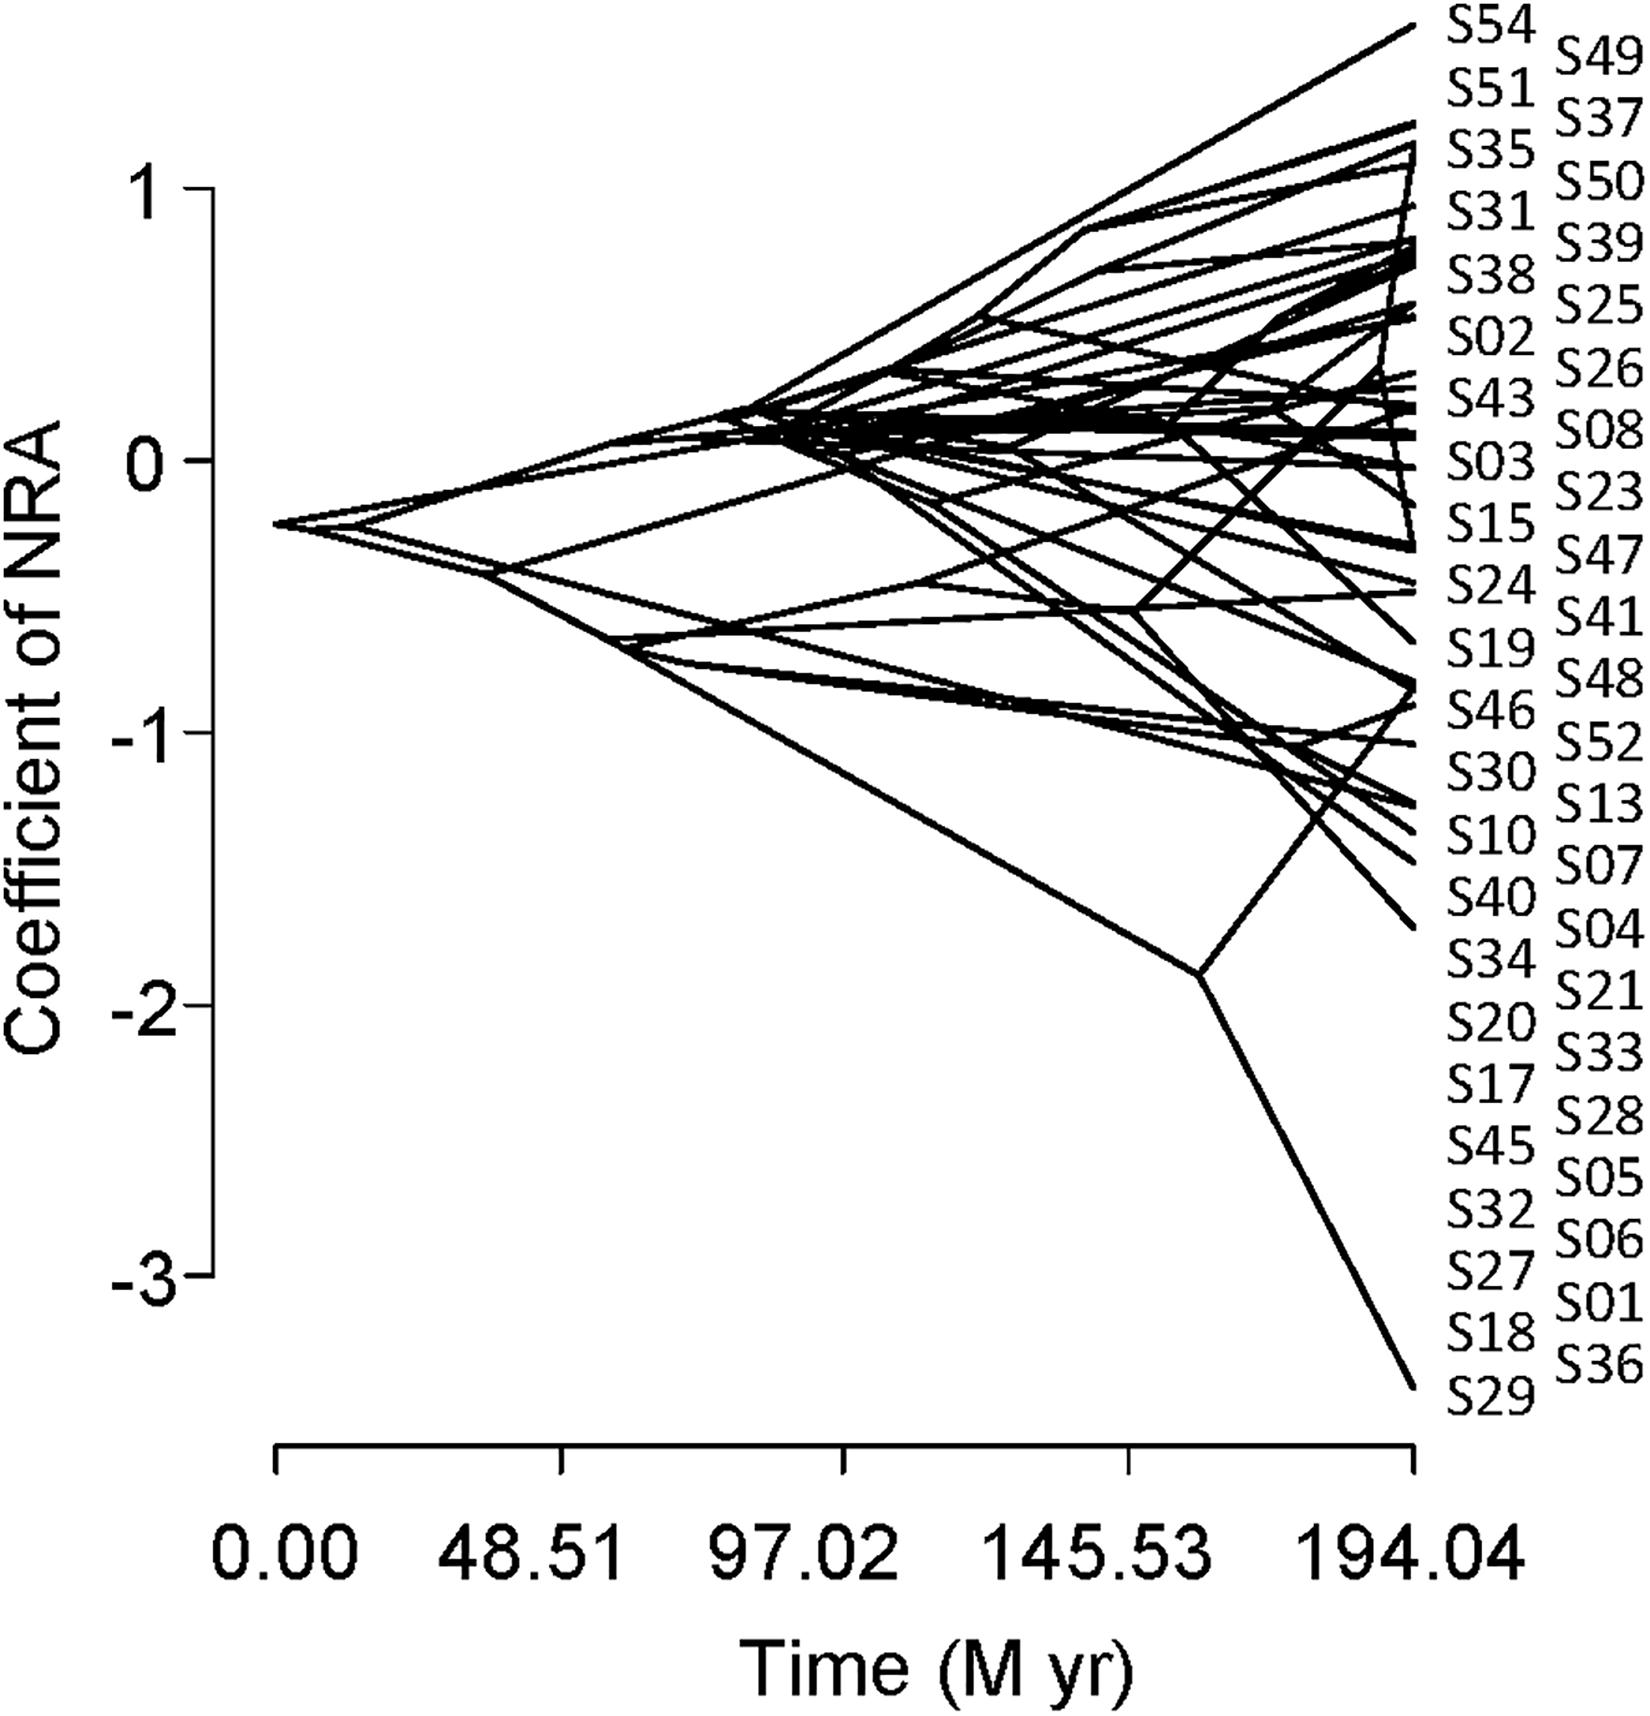
Figure 5. Phylogenetic traitgram indicating the nitrate reductase activity of leaves collected inside and outside of the exclosure fence from the understory of a Zelkova serrata plantation at the University of Tokyo Chichibu Forest.
NRA at the Community Assemblage Level
The community-level NRA peaked in May and September inside the fence (Figure 6). Only one peak was found outside the fence, such that the difference between the outside and the inside was greatest in May. The value inside the fence was 5.41 times higher than that outside, which was a significant difference (GLMM, p < 0.001).
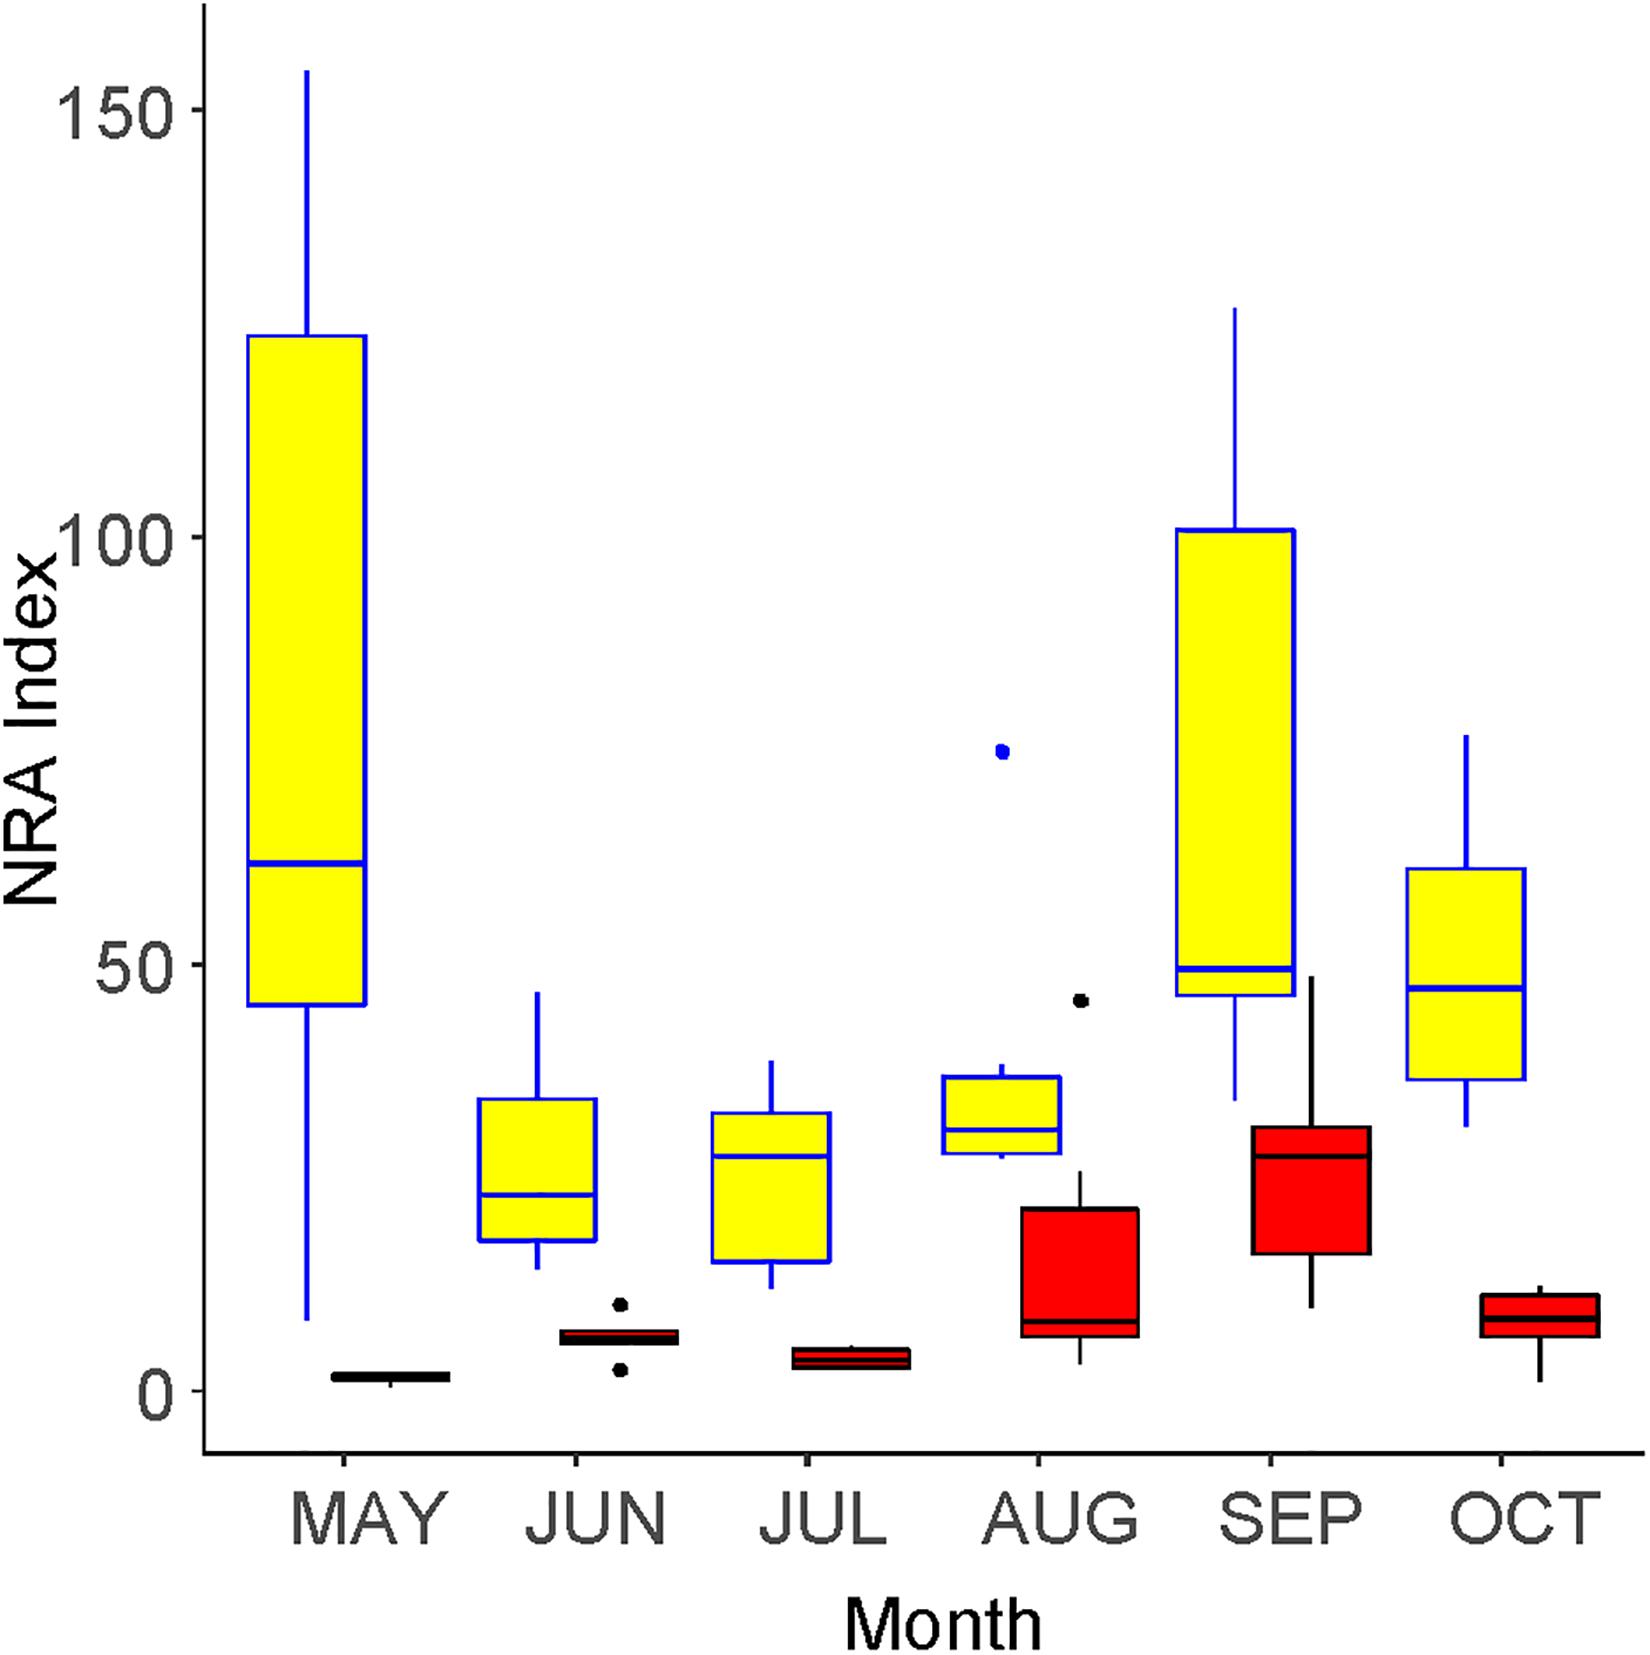
Figure 6. Seasonal changes in the community-level nitrate reductase activity (NRA) inside (yellow) and outside (red) of an exclosure fence at a Zelkova serrata plantation in the University of Tokyo Chichibu Forest.
Discussion
There have been many reports on the influence of deer overpopulation on vegetation in Japan (e.g., Takatsuki, 2009). In this study, the degradation of plant communities observed as reductions in plant coverage, species richness, and the Shannon index outside of the fence were likely caused by deer grazing. Selective grazing by deer was the likely cause of the decrease in the understory vegetation biomass and disappearance of some taxa from outside the fence. It is difficult for plants palatable to deer to grow outside the fence. Some taxa that were found only outside of the fence were probably not good at competition. Under strong disturbance (i.e., grazing pressure), inter-specific competition was probably weak and allowed the existence of these species. We expected that deer grazing would cause phylogenetic clustering in the understory community assemblage if plant traits related to palatability to deer were phylogenetically conservative. Interestingly, contrary to our expectation, the community assemblages outside the fence were less clustered (higher evenness) than inside (Figure 3). These results suggest stronger phylogenetic conservativeness in plant traits related to interspecific competition than those related to palatability to deer.
The NRA tended to be high in spring and fall (Figure 4). A possible cause of the high NRA in spring was the high nitrogen requirement for the foliar nitrogen used for chlorophyll. This hypothesis is supported by the results that showed the NRA decreased from the first measurement to the next, irrespective of the timing (month) of the first appearance of the taxon, although the timing of the first appearance depended on the plant taxa. On the other hand, the high NRA in the fall was probably due to the high nitrogen demand for fruiting.
No significant phylogenetic signal was found in the NRA in this study (Figure 5, Blomberg’s K statistic and PIC). It has been reported that plant taxa belonging to the family Ericaceae generally show low NRA (Routley, 1972; Al Gharbi and Hipkin, 1984; Smirnoff et al., 1984). On the other hand, great differences in the NRA were reported among two genera (Salix and Populus) in the family Salicaceae (Al Gharbi and Hipkin, 1984) and among congenic species, such as within the genera Acer (Koyama et al., 2019) and Piper (Fredeen et al., 1991). These facts are consistent with the results of our study.
It is generally believed that the NRA was greater in herbaceous plants than in woody plants (e.g., Smirnoff et al., 1984). In fact, herbaceous plants occupied the top eight of the highest NRA taxa in this study. However, no significant difference was found between herbaceous and woody plants. Of the 28 taxa with positive coefficient values of NRA (Supplementary Table S2), 14 taxa were woody plants. Koyama et al. (2019) reported that Pterostyrax hispida (S47) had an NRA as high as herbaceous plants. In this study, six woody plants showed higher NRAs than P. hispida. Another possible cause of the lack of difference between woody and herbaceous plants in our study was that we assayed shrub plants and saplings of canopy/subcanopy plants because we were studying the understory vegetation. The NRA of Zelkova serrata leaves differed greatly between young seedlings and canopy trees in May but were similar in June (Supplementary Table S4). It is likely that the NRA of canopy plants depends on plant age and/or size.
Al Gharbi and Hipkin (1984) reported that woody plants living in ruderal sites, such as Sambucus nigra (a species that is congenic with S02 in this study), Acer pseudoplatanus (a congenic species with S45), and Populus alba showed high NRAs that were similar to herbaceous plants. These high NRAs and fast growth rates were related to their high ability to invade after disturbance. In this study, the NRA was higher in plants that were only found outside the fence compared with those only found inside, although the difference was not significant. This seems reasonable because plants found only outside the fence were relatively early successional species under strong disturbance. The reduction of community-level NRA (Figure 6) was no more than that of the vegetation coverage (Figure 1), which was also influenced by the species-level NRA.
Gomyo et al. (2011) reported that the NO increase in stream water started around 2000. The increase in nitrogen deposition due to the opening of the new highway in 1998 was the most likely cause of nitrogen input in the area. However, unprocessed atmospheric nitrate stream flux represented a small percentage (<3%) of the atmospherically delivered wet nitrate flux to the studied region (Barnes et al., 2008). Most of the nitrogen deposition was accumulated in forest ecosystems; therefore, the nitrate output needs to be discussed. In contrast, damage to vegetation by deer became apparent in areas during similar times (Kamata et al., 2020). In another area in Japan, the nitrate concentration in stream water decreased when the catchment was fenced to exclude deer (Fukushima et al., 2013). Our study demonstrated that the degradation of the understory vegetation was a likely cause of the increase in nitrate output in forest soil and stream water in the UTCF (Gomyo et al., 2011). Our findings will help to understand nitrogen saturation in forest ecosystems with deer overpopulation.
Data Availability Statement
The original contributions presented in the study are included in the article/Supplementary Material, further inquiries can be directed to the corresponding author/s.
Author Contributions
A part of this work was a bachelor thesis of YT at Faculty of Agriculture, The University of Tokyo, FY2013. YY established the exclosure fence in 2006. YT, MF, and NK conceived the idea and analyzed the data for the bachelor thesis. YT, MF, YY, and NK conducted field surveys. YY identified plant taxa. YT and MF conducted in vivo assay. NK re-analyzed the data and wrote this manuscript. All authors contributed to the article and approved the submitted version.
Funding
This research was supported by the research funding from SUNTORY to The University of Tokyo Chichibu Forest (FY2013).
Conflict of Interest
The authors declare that the research was conducted in the absence of any commercial or financial relationships that could be construed as a potential conflict of interest.
Acknowledgments
We thank to Dr. Lina Koyama for her helpful suggestions to in vivo NRA assay.
Supplementary Material
The Supplementary Material for this article can be found online at: https://www.frontiersin.org/articles/10.3389/fevo.2021.626905/full#supplementary-material
References
Aber, J., McDowell, W., Nadelhoffer, K., Magill, A., Berntson, G., Kamakea, M., et al. (1998). Nitrogen saturation in temperate forest ecosystems: hypotheses revisited. BioScience 48, 921–934. doi: 10.2307/1313296
Ackerly, D. (2009). Conservatism and diversification of plant functional traits: evolutionary rates versus phylogenetic signal. Proc. Natl. Acad. Sci.U.S.A. 106(Suppl. 2), 19699–19706. doi: 10.1073/pnas.0901635106
Al Gharbi, A., and Hipkin, C. R. (1984). Studies on nitrate reductase in British angiosperms. New Phytol. 97, 629–639. doi: 10.1111/j.1469-8137.1984.tb03627.x
Barber, N. A., Jones, H. P., Duvall, M. R., Wysocki, W. P., Hansen, M. J., and Gibson, D. J. (2017). Phylogenetic diversity is maintained despite richness losses over time in restored tallgrass prairie plant communities. J. Appl. Ecol. 54, 137–144. doi: 10.1111/1365-2664.12639
Barnes, R. T., Raymond, P. A., and Casciotti, K. L. (2008). Dual isotope analyses indicate efficient processing of atmospheric nitrate by forested watersheds in the northeastern U.S. Biogeochemistry 90, 15–27. doi: 10.1007/s10533-008-9227-2
Blomberg, S. P., Garland, T., and Ives, A. R. (2003). Testing for phylogenetic signal in comparative data: behavioral traits are more labile. Evolution 57, 717–745. doi: 10.1554/0014-3820(2003)057[0717:tfpsic]2.0.co;2
Chamberlain, S. (2020). Brranching: Fetch ‘Phylogenies’ from Many Sources. R package version 0.6.0. Available online at: https://CRAN.R-project.org/package=brranching (accessed October 20, 2020).
Chislock, M. F., Doster, E., Zitomer, R. A., and Wilson, A. E. (2013). Eutrophication: causes, consequences, and controls in aquatic ecosystems. Nat. Educ. Knowl. 4:10.
Felsenstein, J. (1985). Phylogenies and the comparative method. Am. Nat. 125, 1–15. doi: 10.1086/284325
Fredeen, A. L., Griffin, K., and Field, C. B. (1991). Effects of light quantity and quality and soil nitrogen status on nitrate reductase activity in rainforest species of the genus Piper. Oecologia 86, 441–446. doi: 10.1007/BF00317614
Fukushima, K., Sakaguchi, S., Inoue, M., Fujiki, D., Tokuchi, N., Nishioka, Y., et al. (2013). Deer overgrazing affects soil nitrogen dynamics and nitrate leaching in a cool-temperate forest ecosystem. J. Jpn. Soc. Reveget. Technol. 39, 360–367. doi: 10.7211/jjsrt.39.360
Furusawa, H., Hino, T., Kaneko, S., and Araki, M. (2005). Effects of dwarf bamboo (Sasa nipponica) and deer (Cervus nippon centralis) on the chemical properties of soil and microbial biomass in a forest at Ohdaigahara, central Japan. Bull. FFPRI 4, 157–165.
Galloway, J. N., and Cowling, E. B. (2002). Reactive nitrogen and the world: 200 years of change. Ambio 31, 64–71. doi: 10.1579/0044-7447-31.2.64
Gebauer, G., Hahn, G., Rodenkirchen, H., and Zuleger, M. (1998). Effects of acid irrigation and liming on nitrate reduction and nitrate content of Picea abies (L.) Karst. and Oxalis acetosella L. Plant Soil 199, 59–70. doi: 10.1023/a:1004263223917
Gomyo, M., Kuraji, K., Haruta, Y., Ohmura, K., Chishima, T., Saiki, M., et al. (2011). Impact of tunnel excavation muck dumped along the canyon on streamwater chemistry. Bull. Univ. Tokyo For. 125, 23–44.
Goodale, C. L., Aber, J. D., and McDowell, W. H. (2000). The long-term effects of disturbance on organic and inorganic nitrogen export in the White Mountains, New Hampshire. Ecosystems 3, 433–450. doi: 10.1007/s100210000039
Gruber, N., and Galloway, J. N. (2008). An earth-system perspective of the global nitrogen cycle. Nature 451, 293–296. doi: 10.1038/nature06592
Jaworski, E. G. (1971). Nitrate reductase assay in intact plant tissues. Biochem. Biophys. Res. Commun. 43, 1274–1279. doi: 10.1016/S0006-291X(71)80010-4
Kamata, N., Sanguansub, S., Beaver, R. A., Saito, T., and Hirao, T. (2020). Investigating the factors influencing trap capture of bark and ambrosia beetles using long-term trapping data in a cool temperate forest in central Japan. J. For. Res. 25, 163–173. doi: 10.1080/13416979.2020.1762288
Kellar, P. R., Ahrendsen, D. L., Aust, S. K., Jones, A. R., and Pires, J. C. (2015). Biodiversity comparison among phylogenetic diversity metrics and between three North American prairies. Appl. Plant Sci. 3:1400108. doi: 10.3732/apps.1400108
Kembel, S. W., Cowan, P. D., Helmus, M. R., Cornwell, W. K., Morlon, H., Ackerly, D. D., et al. (2010). Picante: R tools for integrating phylogenies and ecology. Bioinformatics 26, 1463–1464. doi: 10.1093/bioinformatics/btq166
Koyama, L. A., Terai, M., and Tokuchi, N. (2019). Nitrate reductase activities in plants from different ecological and taxonomic groups grown in Japan. Ecol. Res. 35, 708–712. doi: 10.1111/1440-1703.12083
Molvar, E. M., Bowyer, R. T., and Van Ballenberghe, V. (1993). Moose herbivory, browse quality, and nutrient cycling in an Alaskan treeline community. Oecologia 94, 472–479. doi: 10.1007/BF00566961
Oksanen, J., Blanchet, F. G., Friendly, M., Kindt, R., Legendre, P., McGlinn, D., et al. (2019). vegan: Community Ecology Package. R package version 2.5-5. Available online at: https://CRAN.R-project.org/package=vegan (accessed October 20, 2020).
Paradis, E., and Schliep, K. (2019). ape 5.0: an environment for modern phylogenetics and evolutionary analyses in R. Bioinformatics 35, 526–528. doi: 10.1093/bioinformatics/bty633
R Development Core Team (2019). R: a Language and Environment for Statistical Computing. Vienna: R Foundation for Statistical Computing.
Sakio, H., Kubo, M., Kawanishi, M., and Higa, M. (2013). Effects of deer feeding on forest floor vegetation in the Chichibu Mountains, Japan. J. Jpn. Soc. Reveget. Technol. 39, 226–231. doi: 10.7211/jjsrt.39.226
Schneider, C. A., Rasband, W. S., and Eliceiri, K. W. (2012). NIH Image to ImageJ: 25 years of image analysis. Nat. Method 9, 671–675. doi: 10.1038/nmeth.2089
Shibata, E., and Hino, T. (eds.). (2009). Ecology of Shika Deer and Forest Ecosystem of Mt. Ohdaigahara. Hatano: Tokai University Press.
Skaug, H., Fournier, D., Nielsen, A., Magnusson, A., and Bolker, B. (2018). Package ‘glmmADMB’ (ver. 0.8.3.4). Available online at: https://www.researchgate.net/profile/Arni_Magnusson/publication/265915218_glmmADMB_generalized_linear_mixed_models_using_AD_Model_Builder/ (accessed October 20, 2020).
Smirnoff, N., Todd, P., and Stewart, G. R. (1984). The occurrence of nitrate reduction in the leaves of woody plants. Ann. Bot. 54, 363–374. doi: 10.1093/oxfordjournals.aob.a086806
Takatsuki, S. (2009). Effects of sika deer on vegetation in Japan: a review. Biol. Conserv. 142, 1922–1929. doi: 10.1016/j.biocon.2009.02.011
The University of Tokyo Forests (1998). Transaction of Natural Environment Assessment at the University of Tokyo Chichibu Forest: Environment of Chichibu Forest. Tokyo: The University of Tokyo Forests, 388. (in Japanese).
Vitousek, P. M., and Howarth, R. W. (1991). Nitrogen limitation on land and in the sea: how can it occur? Biogeochemistry 13, 87–115. doi: 10.1007/BF00002772
Keywords: Cervus nippon, NRA, nitrate, vegetation degradation, phylogenetic diversity, phylogenetic signal
Citation: Tsuboike Y, Fujii M, Yoshida Y and Kamata N (2021) An Indirect Impact of Sika Deer Overpopulation on Eutrophication of an Aquatic Ecosystem via Understory Vegetation: An Individual-Based Approach Using Nitrate Reductase Activity. Front. Ecol. Evol. 9:626905. doi: 10.3389/fevo.2021.626905
Received: 07 November 2020; Accepted: 18 February 2021;
Published: 10 March 2021.
Edited by:
Guangyu Wang, University of British Columbia, CanadaCopyright © 2021 Tsuboike, Fujii, Yoshida and Kamata. This is an open-access article distributed under the terms of the Creative Commons Attribution License (CC BY). The use, distribution or reproduction in other forums is permitted, provided the original author(s) and the copyright owner(s) are credited and that the original publication in this journal is cited, in accordance with accepted academic practice. No use, distribution or reproduction is permitted which does not comply with these terms.
*Correspondence: Naoto Kamata, a2FtYXRhbkB1Zi5hLnUtdG9reW8uYWMuanA=
 Yasuo Tsuboike1
 Naoto Kamata