
94% of researchers rate our articles as excellent or good
Learn more about the work of our research integrity team to safeguard the quality of each article we publish.
Find out more
ORIGINAL RESEARCH article
Front. Ecol. Evol., 18 February 2021
Sec. Phylogenetics, Phylogenomics, and Systematics
Volume 9 - 2021 | https://doi.org/10.3389/fevo.2021.626752
 Carlos Lopez-Vaamonde1,2*
 Natalia Kirichenko3,4
 Alain Cama5
 Camiel Doorenweerd6,7H. Charles J. Godfray8
 Antoine Guiguet9Stanislav Gomboc10Peter Huemer11
 Jean-François Landry12Ales Laštůvka13Zdenek Laštůvka14
 Kyung Min Lee15
 David C. Lees16Marko Mutanen15
 Erik J. van Nieukerken7Andreas H. Segerer17Paolo Triberti18Christian Wieser19
 Rodolphe Rougerie20
Gracillariidae is the most species-rich leaf-mining moth family with over 2,000 described species worldwide. In Europe, there are 263 valid named species recognized, many of which are difficult to identify using morphology only. Here we explore the use of DNA barcodes as a tool for identification and species discovery in European gracillariids. We present a barcode library including 6,791 COI sequences representing 242 of the 263 (92%) resident species. Our results indicate high congruence between morphology and barcodes with 91.3% (221/242) of European species forming monophyletic clades that can be identified accurately using barcodes alone. The remaining 8.7% represent cases of non-monophyly making their identification uncertain using barcodes. Species discrimination based on the Barcode Index Number system (BIN) was successful for 93% of species with 7% of species sharing BINs. We discovered as many as 21 undescribed candidate species, of which six were confirmed from an integrative approach; the other 15 require additional material and study to confirm preliminary evidence. Most of these new candidate species are found in mountainous regions of Mediterranean countries, the South-Eastern Alps and the Balkans, with nine candidate species found only on islands. In addition, 13 species were classified as deep conspecific lineages, comprising a total of 27 BINs with no intraspecific morphological differences found, and no known ecological differentiation. Double-digest restriction-site associated DNA sequencing (ddRAD) analysis showed strong mitonuclear discrepancy in four out of five species studied. This discordance is not explained by Wolbachia-mediated genetic sweeps. Finally, 26 species were classified as “unassessed species splits” containing 71 BINs and some involving geographical isolation or ecological specialization that will require further study to test whether they represent new cryptic species.
Alarming projections of biodiversity loss indicate that we have entered the world’s sixth mass extinction (Raven and Miller, 2020). Meanwhile, only a small fraction of species on Earth have been formally described and assigned a scientific name (Scheffers et al., 2012), so many taxa are likely to go extinct before we know of their existence (Eggleton, 2020). The incompleteness of our current census of life, referred as the “Linnean shortfall” (Raven and Wilson, 1992), is especially acute for the most diverse yet least studied groups such as small insects, and for the high diversity tropics (Delabye et al., 2019; Lopez-Vaamonde et al., 2019).
The increasing use of genetic tools in species discovery has shown the shortfall to be greater than previously recognized because of the frequent discovery of sets of two or more cryptic species that have been incorrectly classified as a single taxon due to their morphological similarity. In particular, DNA barcoding, a tool for species identification based on the use of a single standard DNA marker (a fragment of the COI mtDNA gene; Hebert et al., 2003), has contributed to the discovery of many new species, including among them the most closely studied and best documented groups of organisms (Hrbek et al., 2014). Some of those new species are cryptic, rare and of conservation value; assessing the level of cryptic diversity and identifying their biodiversity hotspots should then be a conservation priority (Bickford et al., 2007).
The European Lepidoptera is one of the best-studied faunas in the world, thanks to more than two and a half centuries’ work by a large community of both professional and amateur lepidopterists. The fauna has been the focus of intensive barcoding activity with 7,831 species barcoded out of the 10,723 (73%) species of Lepidoptera known to occur in Europe (Rennwald and Rodeland, 2020) (Barcode of Life Datasystems, www.boldsystems.org; as of mid-October 2020; Ratnasingham and Hebert, 2007). Many European Lepidoptera species show deeply divergent mitochondrial intraspecific lineages raising the possibility of high levels of cryptic diversity (Dincă et al., 2011, 2013, 2015; Hausmann et al., 2013; Mutanen et al., 2013, 2016; Vodă et al., 2015; Hernández-Roldán et al., 2016). Little is known about the extent to which these barcode splits reflect biological species. A number of studies have addressed this question by looking at the correspondence between COI clusters and nuclear lineages using genome-wide DNA analysis. Some have found a significant association suggesting the presence of cryptic species (Janzen et al., 2017; Kozlov et al., 2017; Dincă et al., 2019) whereas others have found a strong discrepancy between mitochondrial and nuclear DNA (Hinojosa et al., 2019). One explanation for the discrepancy is mitochondrial drive causing the replacement of one mitotype by another due to the introduction of the intracellular bacterium Wolbachia which spreads by causing cytoplasmic incompatibility, or by another agent with the same or similar genetic strategy. Divergent COI clusters have been found to have different Wolbachia strains in some (Kodandaramaiah et al., 2013) but not all cases (Bereczki et al., 2015).
Here, we explore the diversity of European Gracillariidae, the largest family of leaf-mining micro-moths, by analyzing DNA barcode data in the context of the current taxonomy of the family on a continental scale. The Gracillariidae are one of the most species-rich families of Lepidoptera with 1996 described species worldwide, data on September 23, 2020 (De Prins and De Prins, 2020), though many more species await description, particularly in the neotropics (Lees et al., 2014). In contrast, the faunistics, alpha taxonomy and ecology of this family in Europe are relatively well known (Doorenweerd et al., 2014), with 24 genera and 263 species recorded (Supplementary Table S1). The majority of gracillariids are leaf miners (their larvae feed and live within a single leaf) and feed on a huge diversity of different host plants (De Prins and De Prins, 2020). However, most species are monophagous or oligophagous (Lopez-Vaamonde et al., 2003). Several species are serious pests of agricultural and ornamental plants (Lopez-Vaamonde et al., 2010), and some are highly invasive (Valade et al., 2009; Lees et al., 2011). Ongoing DNA barcoding campaigns represent a potential valuable source for documenting intraspecific variation and can answer questions about the phylogeography and invasion genetics of gracillariid moths. Examples of such studies include work on European species that have expanded their distribution range like the Horse-Chestnut Leaf Miner, Cameraria ohridella Deschka and Dimić (Valade et al., 2009; Lees et al., 2011) and alien species that have recently invaded Europe such as the Lime Leaf Miner Phyllonorycter issikii (Kumata) (Kirichenko et al., 2017).
The striking coloration of the forewings of many species and the ease with which they can be reared, make this family an attractive group for amateur microlepidopterists to study (Emmet et al., 1985; Bengtsson and Johansson, 2011; Nel and Varenne, 2014). New gracillariid species are still being described in southern Europe (Corley, 2014; Kirichenko et al., 2015; Huemer et al., 2016; Varenne and Nel, 2016) and even in well-known areas like the UK (Langmaid and Corley, 2007).
Some species such as representatives of genus Phyllocnistis, and Fabaceae-feeding Phyllonorycter species, are notoriously difficult to identify using external morphology only or even after genitalia examination, but DNA barcoding has been shown to be a useful tool to identify those difficult groups (Laštůvka et al., 2013; Kirichenko et al., 2018).
The main aims of this study are: (1) to develop a comprehensive DNA barcode reference library for the Gracillariidae of Europe based on morphological analysis by taxonomic experts that will facilitate reliable species identification; (2) to highlight deeply diverged mitochondrial lineages within species which represent potential cases of cryptic species; (3) to investigate deep COI splits in a selection of species by using genome-wide double-digest restriction-site associated (ddRAD) markers and Wolbachia screening; (4) to assess the number of identified but taxonomically undescribed new candidate species, their geographical distribution and host plant use.
We compiled a revised checklist of the 263 European Gracillariidae species (checklist CL-EUGRA in BOLD) following the higher classification of Kawahara et al., 2017 (Supplementary Table S1).
Our study countries encompass the 27-member states of EU as well as Albania, Bosnia and Herzegovina, Macedonia, Montenegro, Belarus, Ukraine, Russia (West of Urals), Liechtenstein, Norway, Switzerland, and United Kingdom (Figure 1), although we lacked records for a few countries (e.g., Estonia, Ireland). We refer to Europe here in a loose sense to include all these countries (Turkey, Russia east of Urals and overseas territories not included). We included five species [Parornix kumatai Ermolaev, Ph. macrantherella (Kuznetzov), Ph. populi (Filipjev), Ph. populialbae (Kuznetzov), and Ph. laurocerasi (Kuznetzov)] that are known to occur in the northeast Caucasus (Chechnya and Dagestan), a region sometimes excluded from Europe for practical reasons (i.e., in Fauna Europaea; de Jong et al., 2014).
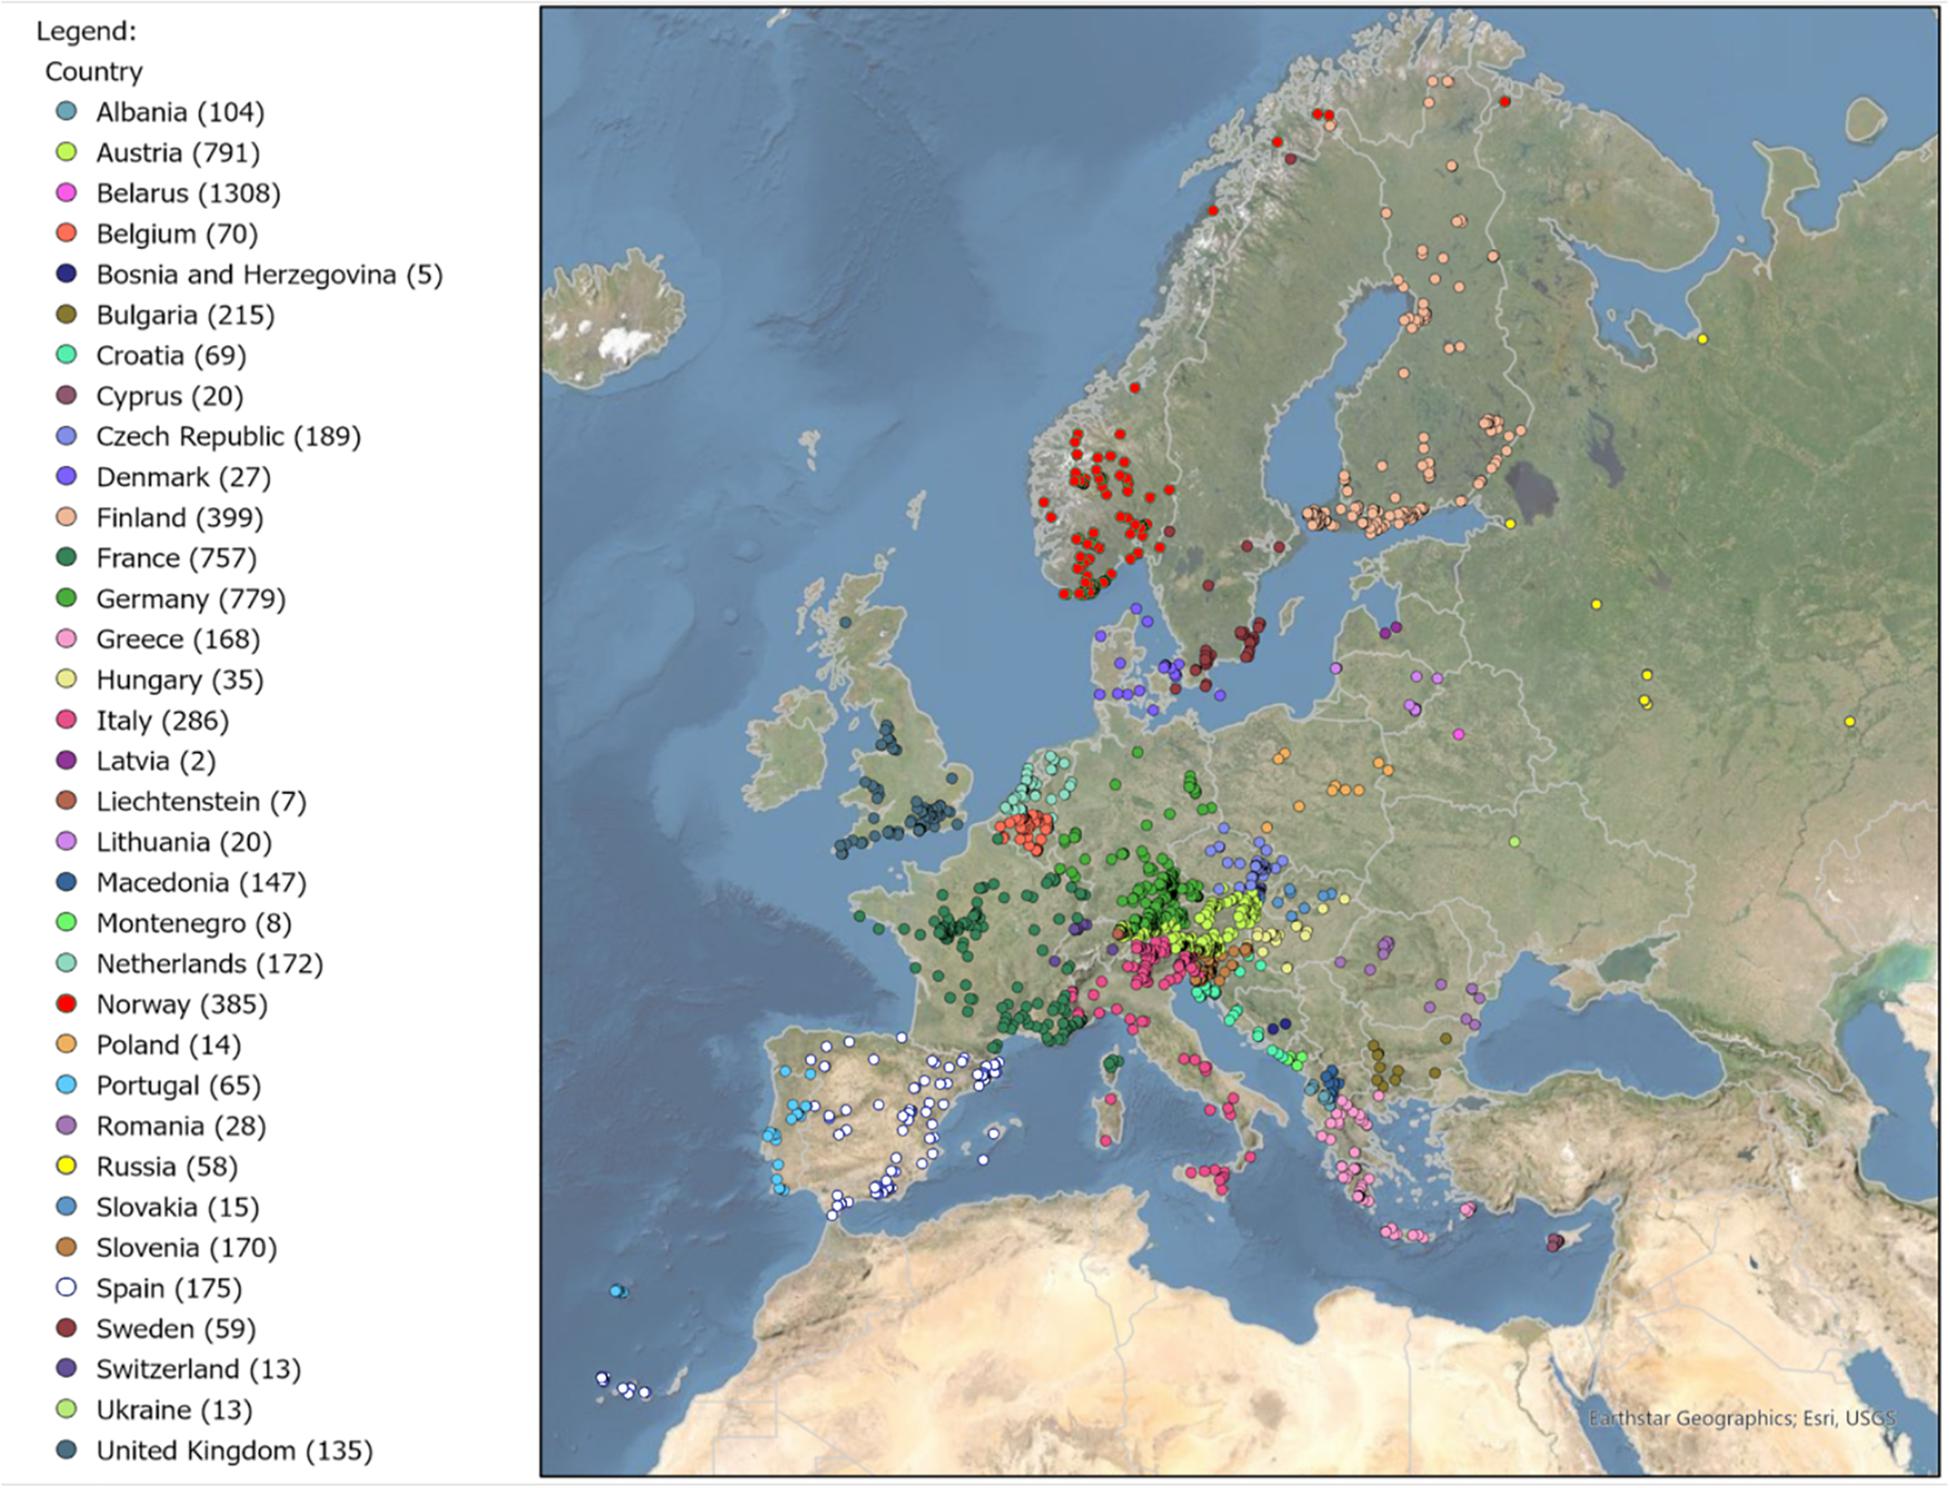
Figure 1. Distribution of all georeferenced DNA barcode records used in this study across Europe. Number of DNA barcoded specimens per country is indicated in round brackets in the legend.
Our taxon sampling strategy aimed to obtain DNA barcodes from as many different European species as possible, but also to sample multiple specimens from as many different geographic localities as possible to document genetic diversity over the European distribution range of each species. We built a DNA barcode dataset of 6,791 specimens of European Gracillariidae based on 5,383 adult specimens and 1,408 immature stages deposited in a total of 60 research collections (24 public and 36 private reference collections) (Supplementary Table S2). We used ESRI ArcGIS Pro software to map all georeferenced records from 1,840 different localities ranging from 28° to 70°N latitude; 18°W to 48°E longitude and elevations ranging from 0 to 2,300 m to show the sample coverage in European countries (Figure 1). For the base map, ESRI topographic map layers from ArcGIS online version 10.6 were used.
We preferentially barcoded recently collected individuals with 75% of specimens sequenced being between four and eight years old at time of sequencing.
Voucher specimens came from rearings (1,646 individuals), Malaise traps (1,873 individuals), light traps (1,764 individuals), or were hand-netted (379 individuals); 1,408 larvae or pupae were dissected from leaf mines. A total of 2,368 records in our dataset include food plant information from reared individuals (see Lopez-Vaamonde et al., 2021 for collecting and rearing protocols) or from immature stages dissected out of their leaf mines (Supplementary Table S2). Identification of immature stages was based on a combination of host plant data and DNA barcoding results.
Adult specimens were identified based on examination by expert taxonomists of wing pattern and in some cases genitalia (Supplementary Table S2).
DNA barcodes were obtained from adult specimens by removing either one hind leg or the whole abdomen for DNA extraction (in the latter case the abdomen could be recovered for genitalia analysis). For immature stages, whole bodies of larvae or pupae were used, usually stored in 96% ethanol, except in some cases where larvae were dissected from dried herbarium specimens with leaf mines.
In most cases, tissue samples were shipped to the Canadian Centre for DNA Barcoding (CCDB, Biodiversity Institute of Ontario, University of Guelph) for sequencing; other samples were processed at Naturalis Biodiversity Center (Leiden, Netherlands) or at laboratories of the authors’ research organizations. For the CCDB laboratory protocol see deWaard et al. (2008); for the Naturalis protocol see Doorenweerd et al. (2017). Primers LCO1490 and HCO2198 were used to sequence the COI barcode fragment (Folmer et al., 1994).
In total, 4,885 COI DNA barcodes (72%) were obtained with Sanger sequencing; the remaining 1,873 sequences of Malaise trap samples were obtained using Single Molecule Real-Time (SMRT) sequencing through the Sequel (PacBio) pipeline at CCDB (Hebert et al., 2018). In addition, 33 sequences were obtained from historical specimens of the Jäckh Collection deposited at the National Museum of Natural History, Smithsonian Institution (Washington DC, United States) using the protocol and workflow described in Prosser et al. (2016). Our data set also includes 217 reared barcoded adult specimens of Deschka’s major reference collection (recently deposited at ZSM, Munich). Sequences over 300 bp are assigned automatically to BINs in BOLD (Ratnasingham and Hebert, 2013).
We used PyCOIStats v1.3 (Doorenweerd et al., 2020) to calculate the number of haplotypes distinct to each respective species, that is without considering missing data (Ns) and ambiguous base-calls such as Y, W, N, etc. as differences in the assignment of each haplotype (for further details see the readme document at https://doi.org/10.5281/zenodo.4123683). Haplotype detection was performed on the total alignment with sequences generated in our study; for sequences with different lengths only the aligned length with sequence information for both sequences was considered for the distance calculation. Maximum and mean intraspecific distances and nearest-neighbor genetic distances for all species were calculated using both PyCOIStats v1.3 and BOLD v4.
Sequences were aligned using the “BOLD aligner” option in BOLD v4, based on an Amino Acid Hidden Markov Model. The resulting alignment was checked by eye in Geneious R101 and contained no insertions or deletions.
We used IQ-Tree v2.0.3 (Minh et al., 2020) to infer a maximum likelihood (ML) tree based on the alignment with distinct haplotypes and sequences >500 bp. We used the IQ-Tree integrated ModelFinder with 286 DNA models, which selected GTR + F + R8 as the best-fit model according to the Bayesian information criterion. We then used the “monophylizer” perl script (Mutanen et al., 2016) on the IQ-Tree generated tree to assess species’ monophyly and test the concordance between COI-based and morphology-based species delineations.
Neighbor-joining (NJ) trees, used to visualize genetic distances within and between species and sequence clusters, were generated in MEGA X (Kumar et al., 2018) using uncorrected p-distances, and pairwise-deletion options. We used iTOL v.5.6.3 (Letunic and Bork, 2019) for the circular visualization of the NJ tree representing the entire DNA barcode library, after exclusion of all records of Cam. ohridella collected outside the native area of this invasive species (Valade et al., 2009).
Non-parametric Mann–Whitney U test was used to test for differences in haplotype diversity between alien and native species. Correlation between haplotype diversity and number of sequences per species was assessed with Pearson correlation (p < 0.05). These two statistical analyses were run in STATISTICA 8.0 (Stat Soft. Inc., United States).
We used morphology, ecology (host plant use) and Barcode Index Numbers (BINs) to identify candidate species using an integrative approach (Figure 2A) (Padial et al., 2010). To identify species boundaries and assess the extent of overlooked diversity we used the candidate species approach of Vieites et al. (2009). We have used this integrative approach because it explicitly combines genetic, morphological and ecological data while systematics of leaf-mining moths traditionally considers host plant data in its workflow.
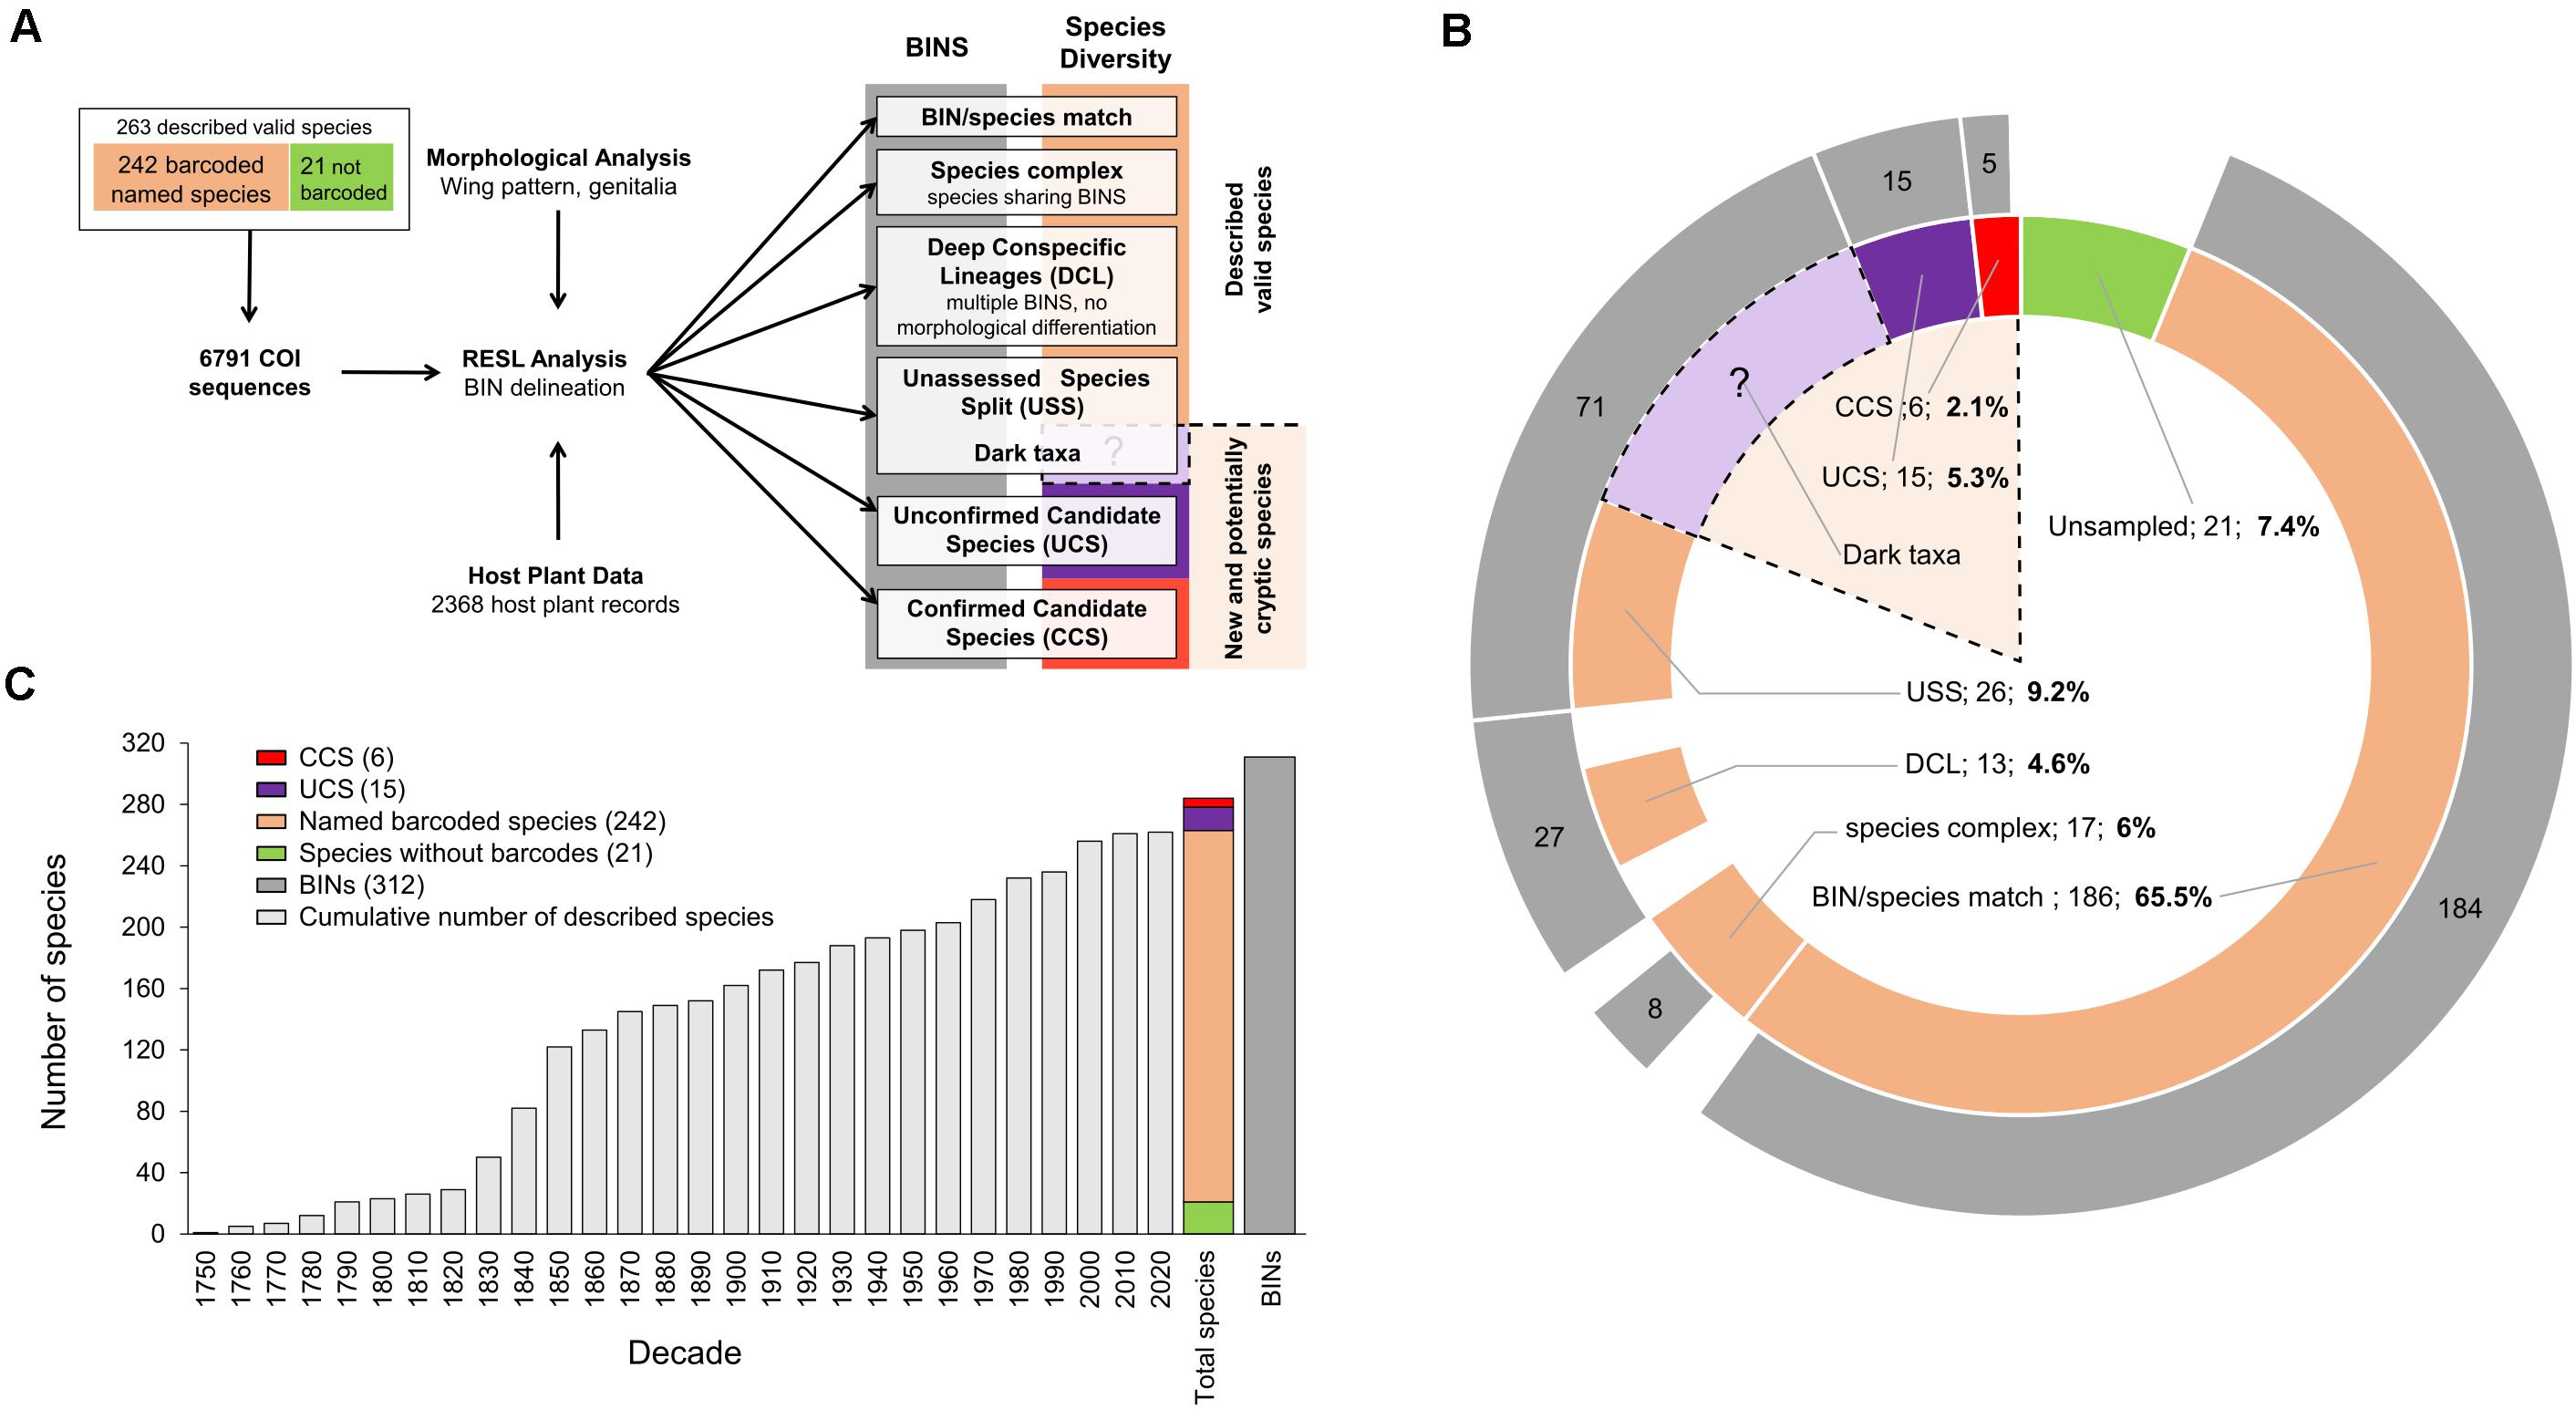
Figure 2. (A) Workflow of integrative taxonomy (candidate species approach) used to identify species boundaries in European Gracillariidae records and to assign them to six species categories with main results. RESL, Refined Single Linkage Analysis implemented in BOLD; BIN, Barcode Index Number. (B) Number of BINs per species category (external circle in gray) and number of species within each category (inner circle): in green, European species lacking DNA barcodes; in beige, the number of named species in each of four species categories; in black, the potential “dark taxa” among 71 BINs representing the 26 USS; in red, the confirmed candidate species (CCS); in purple, the unconfirmed candidate species (UCS). Dotted lines delimit the three species categories comprising new (CCS) and potential cryptic diversity (UCS and USS/dark taxa) in European Gracillariidae. The question mark refers to the unknown number of cryptic species within the 71 BINs of USS category (we refer to those 71 BINs as dark taxa). In the 1:1 species/BIN and the CCS categories, the number of BINs (184) is slightly lower than species numbers (186), because two short DNA barcodes were not automatically assigned BIN numbers on BOLD; they nonetheless represent monophyletic genetic units and were considered within these categories. Percentages are given for each category with respect to a total number of species of 284 (including CCS and UCS), ignoring the unknown part represented by splits in unaddressed species (USS). (C) For the 263 named valid species recognized in 2020, this histogram represents the cumulative number of species described per decade since 1750. It also shows the 312 BINs and the increase from 263 described species (in green, 21 without DNA barcodes; in beige, 242 with DNA barcodes) to 284 species including 6 CCS (red) and 15 UCS (purple).
Each gracillariid record in the database was assigned to one of six categories shown in Figure 2A:
1. “BIN/species match”: there was a “one-to-one” match between a named species in the current taxonomy and the BIN assignment.
2. “Confirmed candidate species” (CCS): specimens assigned to a BIN (i.e., a divergent genetic cluster) that can be distinguished from currently described species by diagnostic morphological characters supporting the hypothesis that they represent an undescribed species; they are given a preliminary species name composed of the genus followed by the name of the host plant (if known) and that of the country (or one of the countries) where it is found, all written in one word and in between inverted commas.
3. “Unconfirmed candidate species” (UCS): specimens assigned to a BIN that represents a divergent genetic cluster for which morphological diagnostic characters remain tentative (either because available adult specimens were too few or not available), or for which differences in host plant use were found, indicating that they likely represent undescribed species. BINs in this category receive a preliminary species name as described above for CCS.
4. “Deep conspecific lineages” (DCL): specimens of a currently accepted species that are assigned to multiple BINs and for which detailed morphological and ecological comparative studies failed to reject the hypothesis that they belong to a single species.
5. “Unassessed species splits” (USS): specimens belonging to multiple BINs that have been assigned preliminarily to currently accepted species, but that could not be examined in detail within the framework of this study and could not be assigned to any of the three previous categories. We refer to those multiple BINs as “dark taxa.”
6. “Species complexes”: specimens belonging to morphologically distinct species that are not differentiated by DNA barcodes (shared BINs between species). These include unconfirmed synonymies (USY), where species that share the same BINs have been suggested by previous authors to be potential synonyms based on insufficiently distinct morphology.
Formal descriptions of new species are in preparation and will be published elsewhere.
We used ddRAD sequencing (Peterson et al., 2012) to test the hypothesis of cryptic diversity in five species with multiple BINs within a currently accepted species. We looked at whether there was any correspondence between BINs and RADseq clades in two species initially classified as USS [Phyllocnistis saligna (Zeller) and Phyllonorycter salictella (Zeller)] and three as DCL [Phyllonorycter roboris (Zeller), Ph. maestingella (Müller) and Ph. salicicolella (Sircom)]. Altogether 108 specimens with DNA barcodes were chosen for the ddRAD analyses, with a preference for samples that were recently collected at the time of DNA extraction. Extracts used for DNA barcoding which had been cryo-preserved at the Canadian Centre for DNA Barcoding (CCDB) were used for ddRAD library preparation.
Prior to the genomic library preparation, the quantity and quality of genomic DNA (gDNA) extracts were checked using PicoGreen Kit (Molecular Probes). To obtain a sufficient quantity of gDNA, whole genome amplification (WGA) was performed using REPLI-g Mini Kits (Qiagen) because of the low concentration of gDNA in the original extracts. As a result, 33 samples were omitted after WGA because they failed to meet minimum quality criteria (Supplementary Table S4). However, the reduction of specimens did not reduce the number of species tested. The ddRAD library was built following protocols described in Lee et al. (2018) with two exceptions: digestion was carried out using the restriction enzymes PstI and MspI (New England Biolabs) while the size distribution was controlled with a Bioanalyzer (Agilent Technology). The de-multiplexed fastq data are archived in the NCBI SRA: PRJNA562838.
We used ipyrad v.0.7.23 (Eaton and Overcast, 2016) to assemble loci de novo and create SNP datasets. All ipyrad defaults were used, with the following exceptions: the minimum depth at which majority rule base calls are made was set to 3, the cluster threshold was set to 0.80 and 0.90, and the minimum number of samples per locus was set to 2 and 3.
We inferred evolutionary relationships using ML methods implemented in RAxML v.8.2.0 (Stamatakis, 2014) with bootstrap support estimated by 1,000 replicates of rapid-bootstrap under the GTR + CAT model. We visualized the resulting phylogeny and illustrated bootstrap support using FigTree v.1.4.2 (Rambaut, 2015).
To test the hypothesis that Wolbachia was responsible for deep COI splits we looked at whether a particular species with deep splits showed a pattern of infected and uninfected BINs and or ddRADseq clades. Therefore, the same 108 specimens that were used for ddRAD sequencing were also screened for the presence of Wolbachia, using two markers, FstZ and Wsp. Primer sequences and PCR protocols were used according to Braig et al. (1998) and Zha et al. (2014); detailed information can be found in Supplementary Table S5.
We summarized the current known distribution of European gracillariid species based on the literature and our own records, assigning them to nine biogeographical categories: (1) Palearctic, (2) Euro-Siberian, (3) Euro-Central Asian, (4) European (5) Mediterranean, (6) Macaronesian, (7) Alpine, (8) Boreal, and (9) Holarctic (Supplementary Table S3). In addition, seven alien invasive species that have established recently in Europe have been included, i.e., three Nearctic and four Asian species (Supplementary Figures S1, S2).
We used BOLD to document and analyze the distribution range and host plant use of each of the multiple BINs within DCLs and their nearest neighbors (NNs). BINs were considered sympatric when both co-occur on the same site (i.e., also syntopically).
We compiled host plant data containing 2,368 host plant records belonging to 26 plant families, 81 plant genera and 206 plant species (Supplementary Table S3). In total, 1,594 host plant records are based on reared adults, 748 are based on barcoded immature stages (larvae or pupae) dissected from their leaf mines, and 26 are based on adults found resting or swept on their host plants (Supplementary Table S3). Supplementary Figure S3 shows host plant use for the whole European Gracillariidae fauna, including species not barcoded (Supplementary Table S6). We characterized the host plant range of each species as monophagous, oligophagous, or polyphagous (Hering, 1951) (Supplementary Table S3).
We standardized host plant names in the BOLD field “Associate Taxa,” largely following the 2020 Catalog of Life (Hassler, 2020), and likewise in Supplementary Table S3. We made the following exceptions:
1. We split the former Cytisus balansae (Boiss.) Ball (Fabaceae) into Cyt. balansae s. str., occurring in Spain (Granada and Almeria) and North Africa (European population previously known as Cyt. balansae subsp. nevadensis or Cyt. galianoi), and Cyt. oromediterraneus Rivas Mart et al., in other parts of Europe, following Auvray and Malecot (2013) (previously known as Cyt. purgans auct., Cyt. balansae var. europaeus).
2. The name Salix euxina Belyaeva is now used for what was previously known as Salix fragilis L., while the name S. fragilis is used for the much commoner hybrid of S. euxina with S. alba L. (Belyaeva, 2009). As separation of the full species and the hybrid is difficult and not very relevant for leaf miners, we retained the names (S. fragilis or S. euxina) as given by the original collector. Likewise, we kept the names S. cinerea L. and S. atrocinerea Brot. as recorded by the original collector, as not all floras separate them and the differences are subtle. Most likely, the majority of records from the British Isles and western parts of Iberia and France in fact represent S. atrocinerea.
In general, we accepted the host plant identification given by the original collector, where possible checking back with the collector in cases of doubt. Material of Ph. nevadensis Walsingham in the Deschka collection was labeled as being reared from Teline linifolia L. (now Genista linifolia L.). We consider this as a misidentification for Adenocarpus decorticans Boiss., based on the locality, habitat and known host plant preference.
For host plant data from the literature we queried the Global Taxonomic Database of Gracillariidae (De Prins and De Prins, 2020), but while this is comprehensive, it also includes old records that have no recent confirmations. In cases where such old records could lead to incorrect estimation of host plant range, we excluded them from Supplementary Table S3 (column AM) and Supplementary Table S6. An example is Sabulopteryx limosella (Duponchel), a known leaf miner of Teucrium (Lamiaceae) for which old records of two unrelated hosts exist: Jurinea sp. (Asteraceae) and Genista sp. (Fabaceae). Rennwald in Lepiforum e.V. (2008–2020) critically considered these records and concluded that these must have been based on misidentifications.
Among the immature stages dissected from their leaf-mines, some interesting cases of xenophagy were noted, such as larvae of Cam. ohridella found feeding on Corylus avellana (L.). This species has also been found feeding on Ostrya carpinifolia Scop. and Fagus sylvatica L. (Ellis, 2020). These cases of xenophagy have not been included in the global analysis of gracillariid/host plant interactions since they represent either oviposition errors or unusual host plants and do not reflect the “normal” host plant use of the leaf miner. This highlights the importance of distinguishing which host plant records are based on reared adults, as they better reflect the “true” host plant use of the leaf miner, versus those that are based on dissected immature stages which might contain oviposition errors.
We generated a total of 6,791 COI sequences representing 242 of the 263 species (92%) of Gracillariidae known to occur in Europe (Supplementary Table S2 and Supplementary Figure S4) with an average of 25.8 specimens per species [minimum one specimen (in 12 (5%) of the 242 named species), maximum 1,932 specimens] (Supplementary Table S3). We were unable to obtain sequences for 21 species (Supplementary Table S6). A total of 6,524 sequences (96.1%) were ≥500 bp long.
The monophylizer analysis identified 21 out of 242 named species (8.7%) species as non-monophyletic. The remaining 221 species (91.3%) are monophyletic and can therefore be identified reliably using barcodes (Supplementary Table S7). If we exclude 41 named species that are singletons (only one distinct haplotype per species) and by definition monophyletic, then the non-monophyly percentage is 10.5%.
Overall, 6,587 sequences were assigned by BOLD to one of the 312 different BINs (results on the 4th of November 2020) (Supplementary Table S3). Out of the 242 named species barcoded, 184 (76%) had their own unique BIN (one to one match category, Supplementary Table S3; Figure 2B). Only eight BINs out of the 312 (2.6%) were shared (seven BINs shared between species pairs and one BIN shared in a triad) among 17 species (Supplementary Table S3 column W). Definite species assignment using BINs is not possible in these 17 cases.
The dataset contains 1,491 distinct haplotypes with a maximum of 56 haplotypes found in 138 individuals of Ph. salictella (Figure 3A) and an average of 5.7 haplotypes per species (Supplementary Table S3). Haplotype diversity was significantly correlated to sampling effort expressed in number of individuals sequenced per species (Pearson correlation: r = 0.70, N = 262, p < 0.05; Figure 3A).
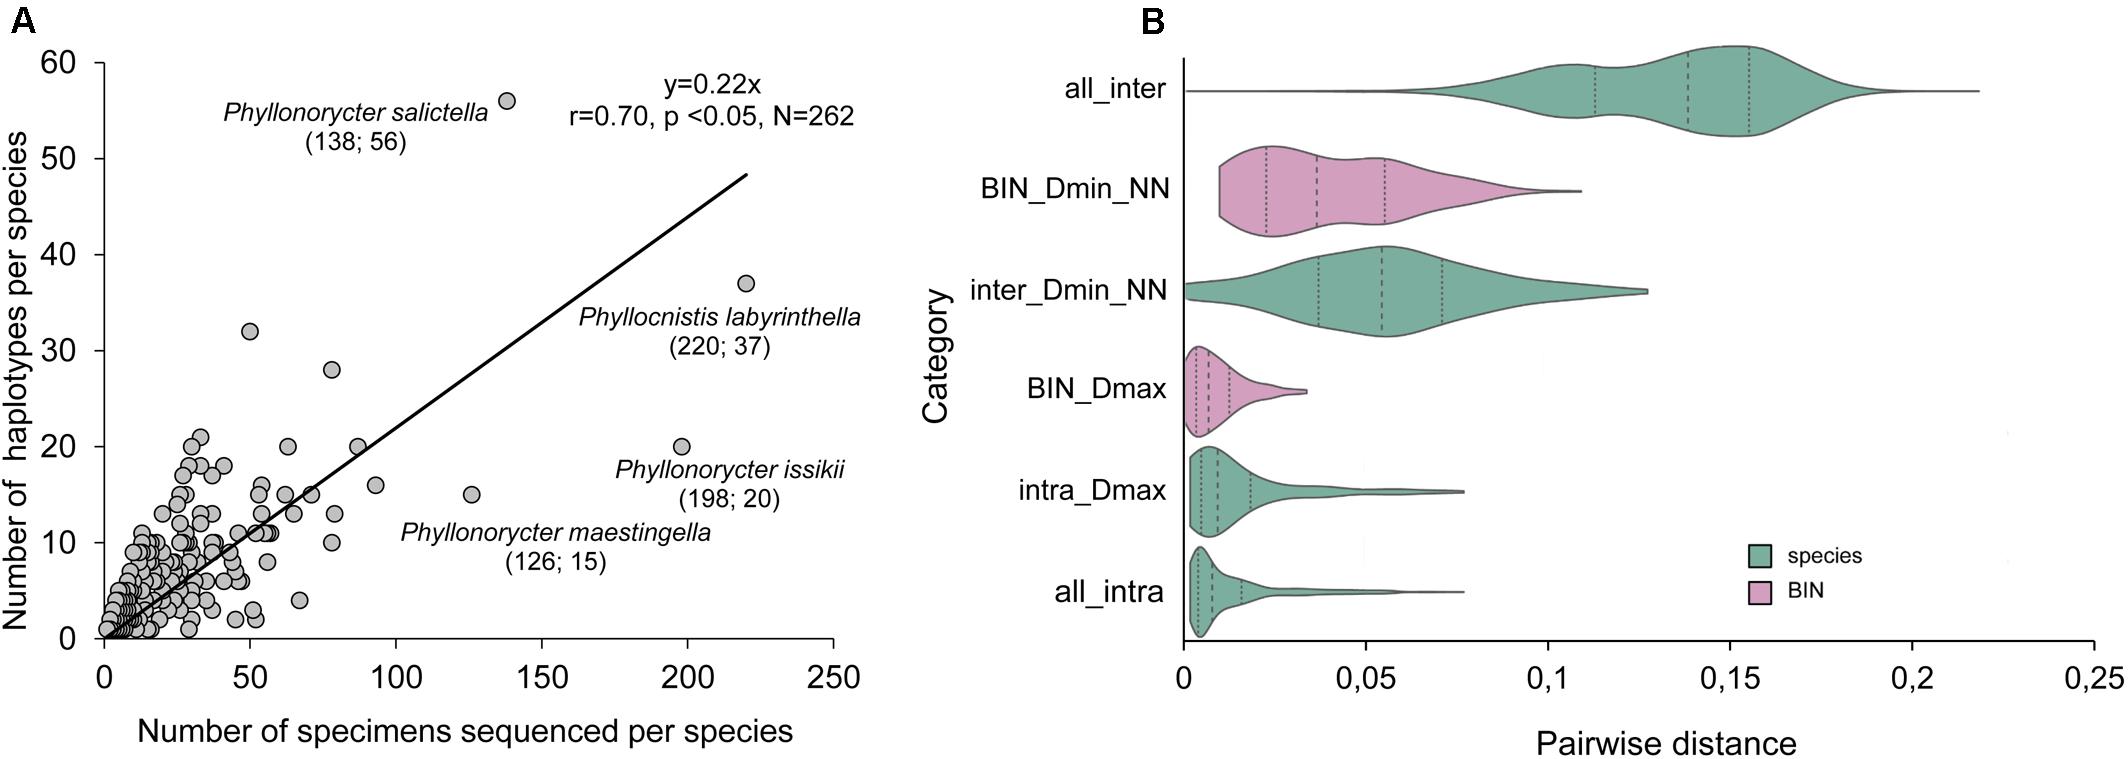
Figure 3. Intra and interspecific diversity of European Gracillariidae. (A) Number of distinct haplotypes per species vs number of specimens sequenced per species. Total number of distinct haplotypes: 1,491; total number of specimens sequenced: 6,791. The correlation equation, Pearson correlation coefficient, probability (p) and sampling number are shown in the graph (N = 262 sequences). A point represented by Cameraria ohridella (1,932 specimens; 14 haplotypes) was excluded from calculation because its sampling was biased with a large number of samples from a Malaise trap under a single highly infected horse chestnut tree. The gracillariid species with sampling >100 specimens are indicated in the graph: species name (number of specimens; number of haplotypes). (B) Violin plot showing the pairwise distances between and within species and BINs. “all_inter” and “all_intra” show the inter- and intraspecific distances, respectively, across all species in the dataset. “Dmin_NN” shows the minimum distances to the nearest neighbor, and Dmax the maximum distances within species. The dotted lines inside each “violin” indicate the first, middle and third quartiles of the data. The maximum width (observed values) of each violin is scaled to be equal across all categories.
We obtained barcode data for seven out of eight species alien to Europe (Supplementary Tables S3, S6), five European species that became invasive and expanded their range across Europe, and six European species alien in other continents (Supplementary Table S3). Stomphastis conflua (Gerasimov) has not yet been barcoded; it originates from north eastern tropical Africa and has been introduced to the Mediterranean with its host plant (Supplementary Table S6). The seven-alien species to Europe show a similar average number of haplotypes (5.7 ± 2.6) compared to the native European fauna (5.6 ± 0.4) (Mann–Whitney U test: Z = 0.3, p = 0.75, Nalien = 7 vs Nnative = 256). The alien species Ph. issikii shows one of the highest numbers of haplotypes (20) in our analysis (Figure 3A).
Removing non-distinct haplotypes prior to pairwise distance calculations and ignoring ambiguous bases in the comparisons with PyCOIStats scripts results in slightly larger differences (maximum intraspecific distance was 1.5%) (Supplementary Table S8) overall in comparison to a more conventionally used software, such as BOLD (maximum intraspecific distance was 1.4%) (Supplementary Table S3). In total, 46 species show maximum intraspecific distances higher than 2% and 12 species higher than 5% (Supplementary Table S3).
The pairwise distance statistics within and between species and BINs are shown in Figure 3B to allow for easy comparison with other DNA barcoding literature where such analyses are used to explore the presence or absence of a “barcoding gap.” DNA barcoding is deemed reliable if the variation within species (i.e., Dmax) is smaller than the variation between species (i.e., Dmin_NN). For our dataset, both at the species and BIN level, there is some overlap between the two measures, indicating that a pairwise distance threshold to separate species cannot be set at a strict value. The maximum variation within species is greater when they are defined using classical taxonomy (max. 7.8%) compared with BINs (max. 3.4%), though this is to be expected as the BIN algorithm employs genetic distance data. Application of the BIN algorithm also leads to greater splitting and to smaller distances between sister species: on average 4.1% (BIN) versus 5.6% (species).
Our integrative workflow combining morphology, host plant use data and DNA barcodes (Figure 2A) identified 21 new candidate species distinct from the 242 named species sampled (Figures 2B,C and Supplementary Table S3). Indeed, we discovered six confirmed candidate species (CCS) and 15 unconfirmed candidate species (UCS) that show a Mediterranean distribution (Figure 4), with eleven of these candidate species occurring on islands, four of them feeding on Alnus spp. (Supplementary Table S3). If we add these 21 new candidate species (6 CCS and 15 UCS) to the known European fauna of gracillariids the total number of species raises from 263 to 284 species, an increase of 7.4% in species richness (Figures 2B,C).
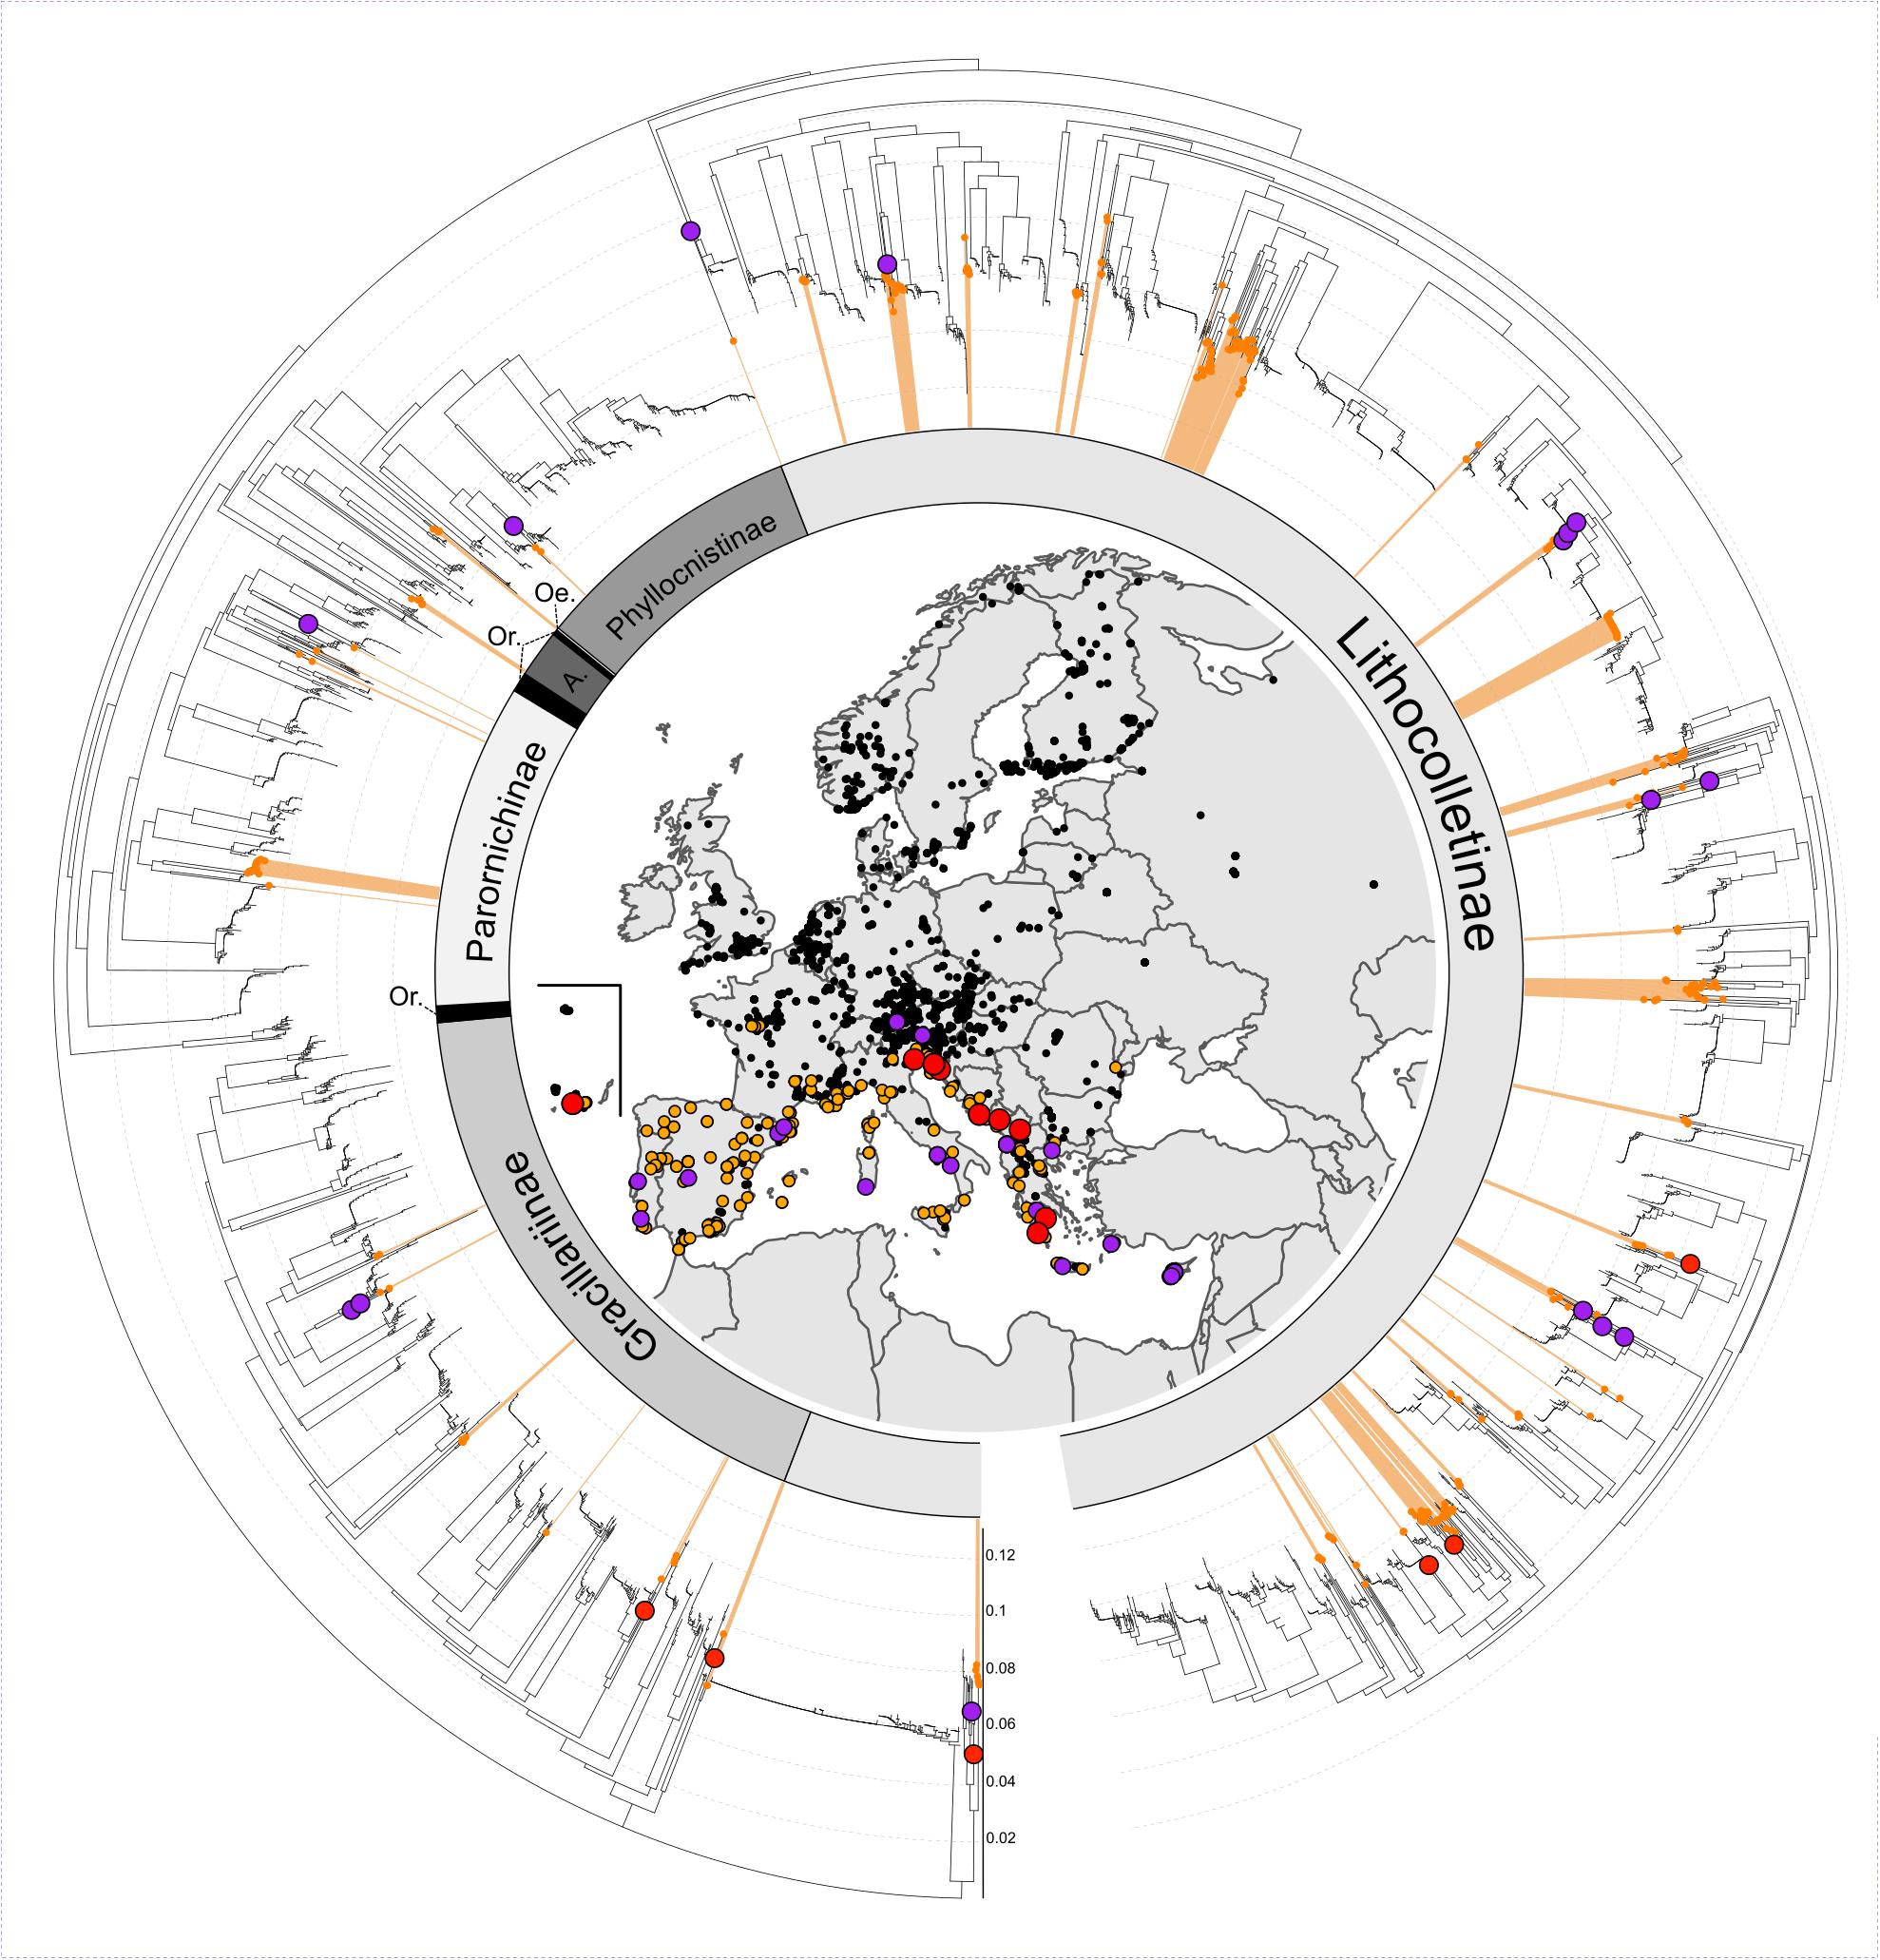
Figure 4. DNA barcode variation in European Gracillariidae and geographical distribution of new candidate species. Neighbor-joining tree based on uncorrected p-distances for 5,148 records of the DNA barcode library of European Gracillariidae (1,643 records of Cameraria ohridella were removed to avoid topology distortion). The map shows all 6,791 georeferenced DNA barcode records for 242 named species and 21 new candidate species of European gracillariids. Colored circles represent individual records (map) or clusters (tree): in red six Confirmed Candidate Species (CCS); in purple 15 Unconfirmed Candidate Species (UCS); in orange 80 out of the 83 Mediterranean species sampled (three species, C. ohridella, Phyllonorycter platani, and P. leucographella were not colored on the map because they have undergone massive range expansion over most of Europe). Inner circle indicates the seven subfamilies of Gracillariidae found in Europe (Or: Ornixolinae; Oe: Oecophyllembinae; A: Acrocercopinae).
In addition, 13 species were classified as deep conspecific lineages (DCLs), comprising a total of 27 BINs with no intraspecific morphological differences found, and no known ecological differentiation (Figure 2B and Supplementary Table S3). Twenty-six species were classified as “unassessed species splits” (Figures 2A,B); they comprise 71 BINs. More work is needed to assess the status of those 71 BINs that are considered here as “dark taxa”.
The Mediterranean is the region with the highest species richness of gracillariids (mainly Lithocolletinae) in Europe (Figure 4 and Supplementary Figure S1) feeding mostly on Fabaceae and Fagaceae (Supplementary Figure S2 and Supplementary Table S3). The 15 Macaronesian endemic species feed on a wide variety of host plant families (Supplementary Figure S2) and their host plant range reflects the high local endemism of the flora (Hobohm, 2000) specializing on native endemic plants of high conservation value, e.g., Caloptilia laurifoliae (Hering) restricted to the native tertiary relic of laurisilva forests (Supplementary Table S3).
Of the 39 species (13 DCL + 26 USS) that show multiple BINs, 24 species (61.5%) have BINs with non-overlapping allopatric distribution ranges, whereas 11 species (28.2%) have BINs with overlapping sympatric distribution and four species (10.3%) have both allopatric and sympatric BINs (Supplementary Table S9).
Out of the 25 species with multiple BINs for which we have host plant data, 17 species (68%) have BINs that share the host plant, five species (20%) have BINs with non-overlapping host-plant ranges, and three species (12%) show a mix of BINs on separate and shared host plants (Supplementary Table S10). We identified nine species with different BINs co-occurring sympatrically and feeding on the same host plant (Supplementary Table S11).
The ddRAD sequencing of five species with multiple BINs produced a minimum of 663 loci (124,949 bp) and a maximum of 2,457 loci (465,525 bp) (Supplementary Table S4). Only one species, Phyllocnistis saligna, shows correspondence between the clades obtained via ddRAD ML trees and the BINs suggesting the presence of a cryptic species in the Czech Republic (Figure 5). However, sampling for ddRAD was limited and it is unclear if there is any ecological difference that correlates with the BINs. Moreover, BIN AAL5482, with European samples identified as Ph. asiatica solely based on association with this BIN, may prove to be conspecific with Ph. saligna when samples from across the Palearctic are combined in a single analysis.
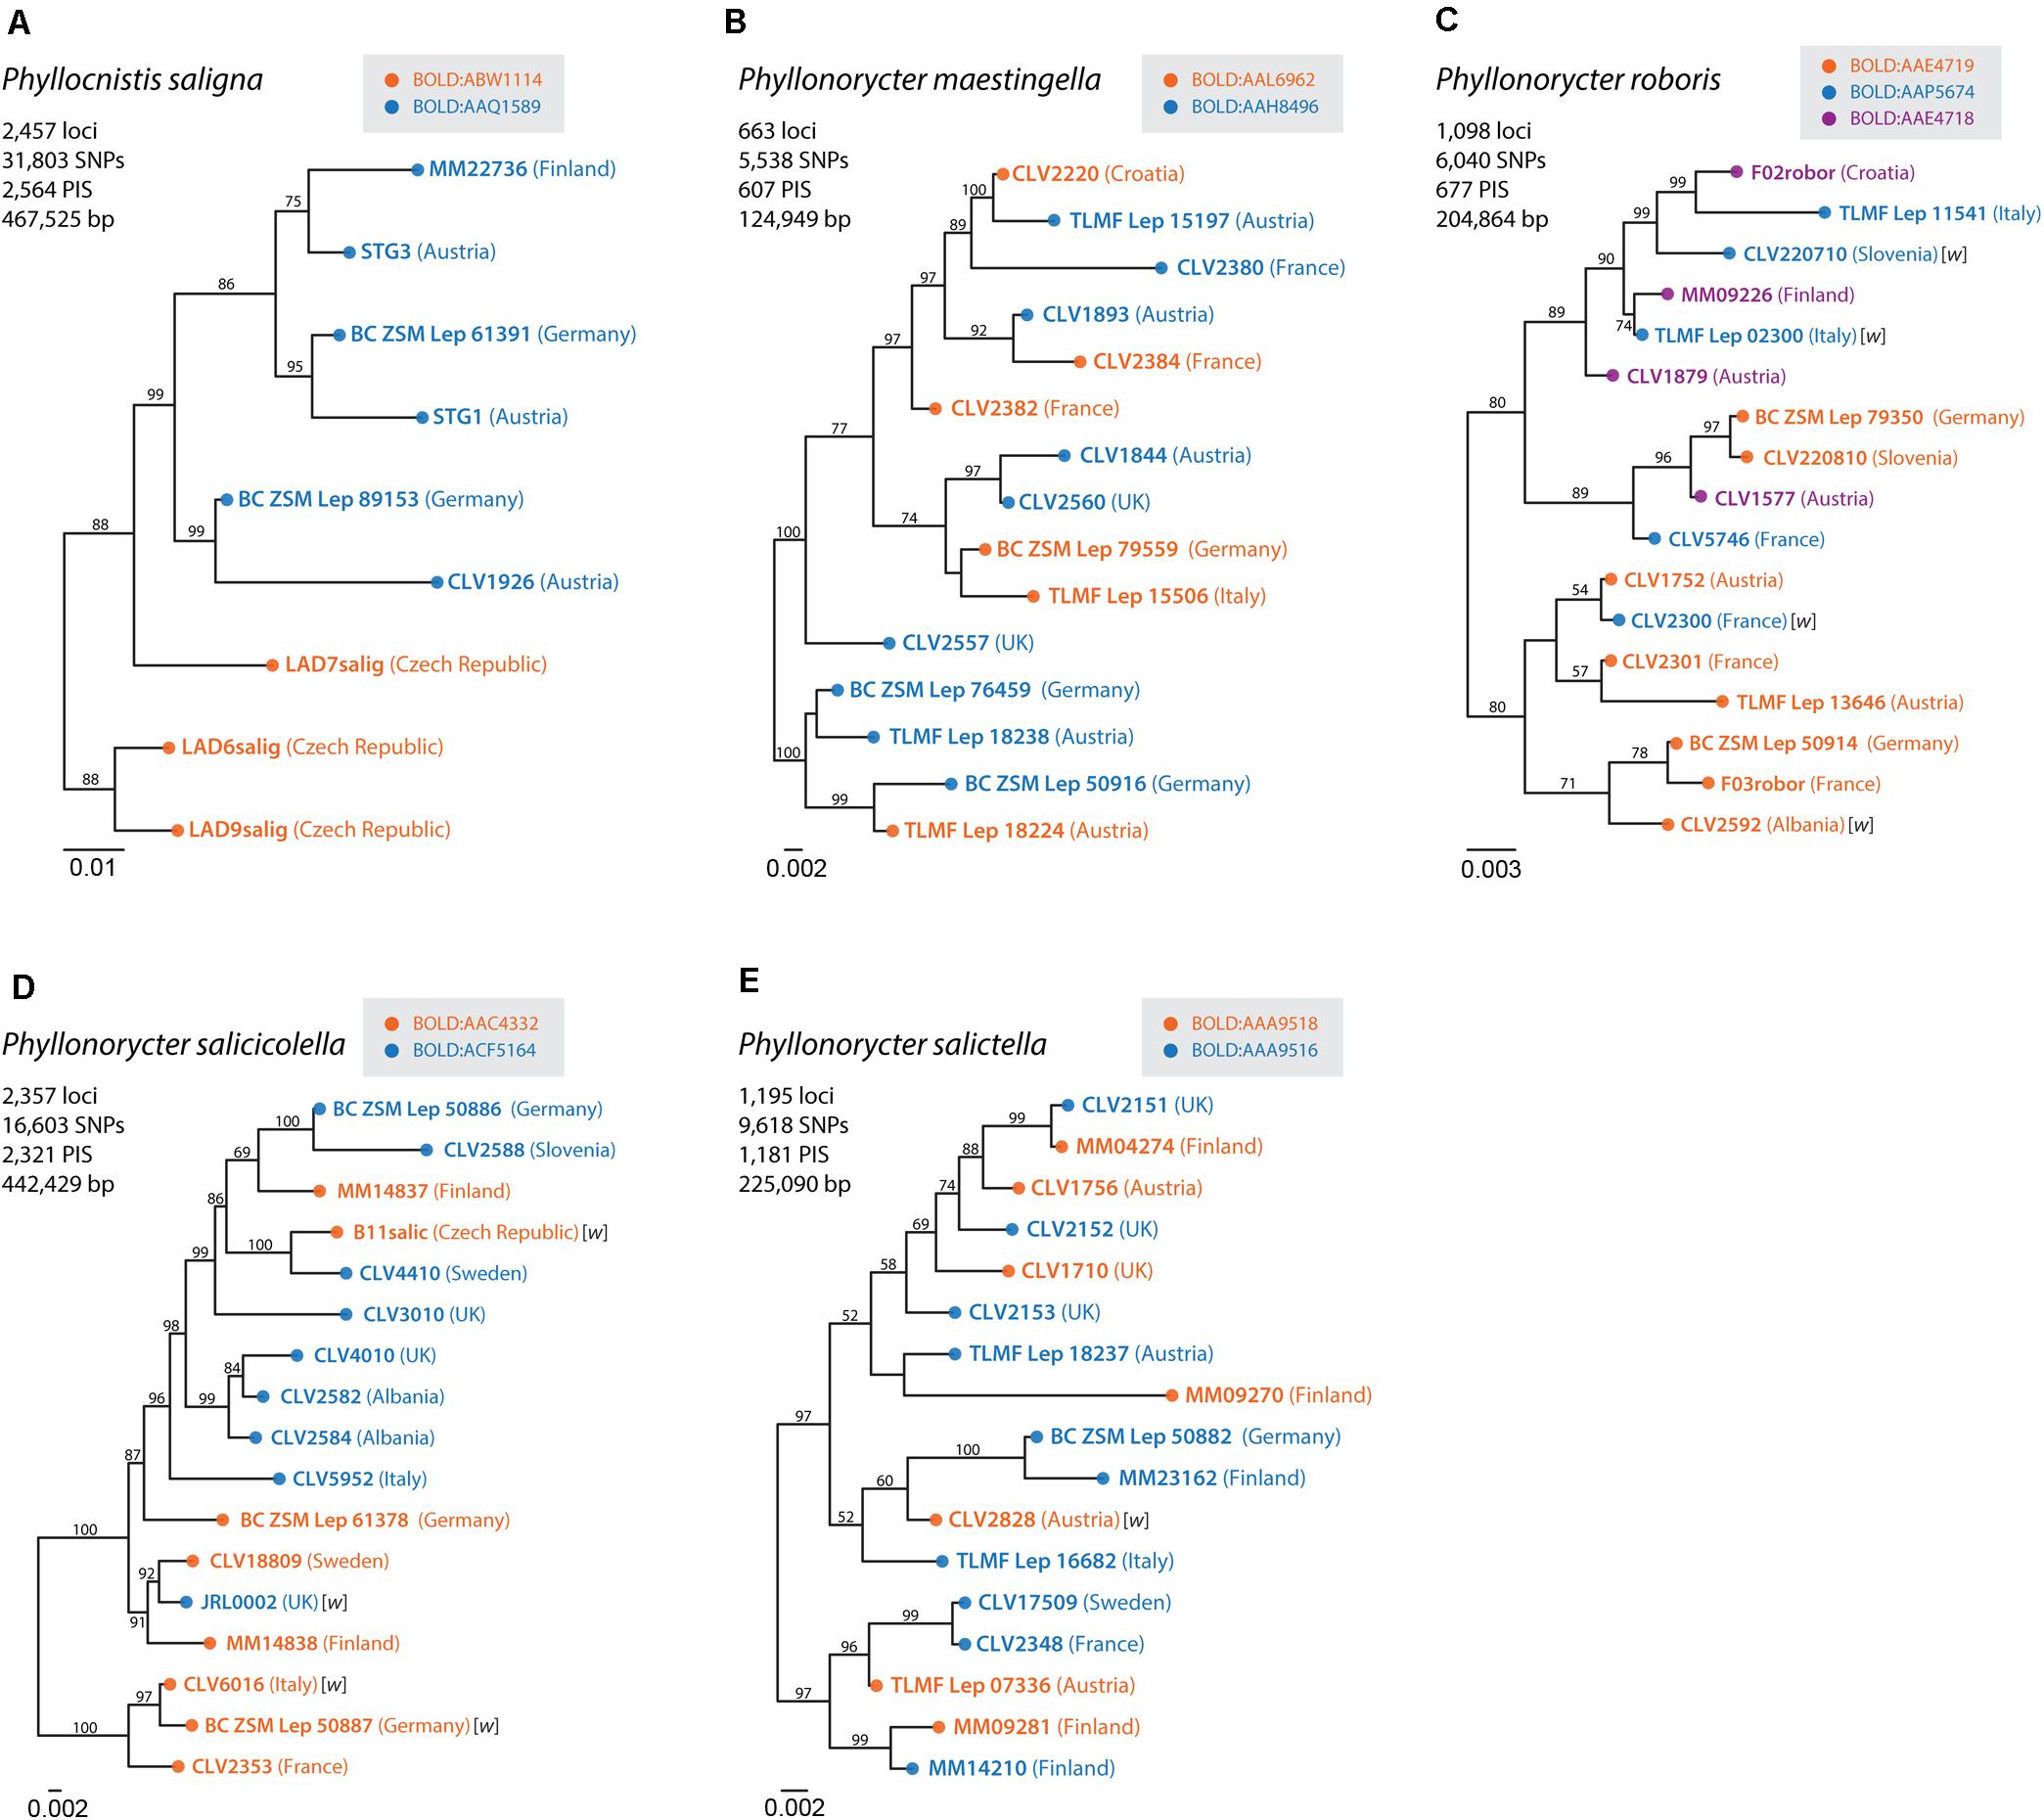
Figure 5. Maximum likelihood (ML) phylogenies of (A) Phyllocnistis saligna, (B) Phyllonorycter maestingella, (C) Phyllonorycter roboris, (D) Phyllonorycter salicicolella, and (E) Phyllonorycter salictella. ML trees were inferred from the concatenated ddRAD data with RAxML. Bootstrap values are indicated near the branches and only >50% are shown. Colors used for the ddRAD sequences match the clade assignment based on DNA barcoding data. Fourteen samples infected by Wolbachia are indicated in the trees marked with w between brackets.
Fourteen of the 108 (13%) samples analyzed were positive for infection by Wolbachia and all 14 infected samples were detected by the FtsZ gene (Supplementary Table S4). The pattern of infection is not associated with neither BIN clustering nor RADseq clades (Figure 5).
Over 73% of Lepidoptera species known to occur in Europe have been barcoded so far. Germany is leading the way on DNA barcoding progress in Europe with over 24,000 animal and plant species barcoded and an almost completed reference library for Lepidoptera, covering more than 3,300 species (91%) (Geiger et al., 2016; Hausmann pers. comm.). Identification reliability in the DNA barcode library of European Lepidoptera is high, with levels of monophyly over 90% (Dincă et al., 2015; Mutanen et al., 2016). Our dataset shows similar levels of monophyly with only 8.7% of the 242 species sampled being non-monophyletic (10.5% if excluding species represented by singletons). Some cases of non-monophyly may still be attributable to operational error such as inaccurate reference taxonomy (unconfirmed synonyms, misidentifications) but others could be due to introgression/incomplete lineage sorting. For instance, two species pairs [Cal. laurifoliae (M. Hering)/Cal. nobilella (Klimesch) and Ph. adenocarpi (Staudinger)/Ph. parvifoliella (Ragonot)] have been hypothesized as synonyms. Another case revealed here is Ph. brunnea Deschka and Ph. acaciella (Duponchel). We obtained three short sequences of paratypes of Ph. brunnea which match the barcode of Ph. acaciella. Deschka (1975) described Ph. brunnea from moths reared from leaf mines on Ulmus that he collected on Rhodes (Greece). He noted that the genitalia are difficult to separate from those of the widespread Ph. acaciella that also feeds on Ulmus, but external characters clearly differentiate the two. The mainland Ph. acaciella we sequenced do indeed appear much darker, with many dark scales obscuring the pattern (RMNH.INS.554149 and RMNH.INS.554150), compared to the barcoded paratypes of Ph. brunnea (CLV2670, CLV2671, and CLV2672). However, pale specimens of Ph. acaciella are sometimes found in mainland populations. Since the incomplete barcodes of the Ph. brunnea paratypes are inseparable from those of Ph. acaciella, and we do not see real genitalia differences, we synonymize these two species, with Phyllonorcter brunnea Deschka (1975) syn. nov. becoming a junior synonym of Phyllonorycter acaciella (Duponchel, 1843).
Another case of non-monophyly is the “Ph. nicellii (Stainton)/Ph. chrysella (Constant)/Ph. froelichiella (Zeller)” complex, which could represent another potential case of mitochondrial introgression. Some specimens of Ph. froelichiella are placed within the Ph. nicellii BIN. Both species are clearly morphologically differentiated and feed on different host plant genera, so this could be another case of introgression. Both Ph. chrysella and Ph. froelichiella share the host plant Alnus glutinosa (Supplementary Table S3) and the three barcodes of Ph. chrysella are nested within Ph. nicellii and Ph. froelichiella. Another interesting case of non-monophyly and BIN-sharing is the Populus-feeding species complex of Phyllocnistis. This comprises the North American species P. populiella Chambers feeding mainly on Populus tremuloides Michx. and causing huge outbreaks in the Yukon and Alaska, and two European species P. labyrinthella (Bjerkander) developing mainly on Populus tremula L., but also frequently on Pop. alba L. and the hybrid Pop. × canescens (Aiton) Sm. (Ellis, 2020) and P. xenia M. Hering found mainly on Pop. alba (Aarvik et al., 2017). Although all three species share one single BIN, they show a low genetic divergence but consistent division between all three species. The nearest neighbor is a North American species feeding mainly on Populus balsamifera (Supplementary Table S3). We suspect that this complex represents a case of relatively recent evolutionary divergence and we therefore treat them as separate species pending further study, particularly using nuclear markers and morphology.
Interestingly, DNA barcodes distinguish clearly between species that had previously been synonymized [for instance, Par. alpicola (Wocke)/Par. scoticella (Stainton); Ph. cerasicolella (Herrich-Schäffer)/Ph. spinicolella (Zeller); Triberta cistifoliella (Groschke)/T. helianthemella (Herrich-Schäffer)]. The validity of all these species is considered confirmed here.
Gracillariidae now joins the megadiverse Geometridae and Gelechiidae as one of the few large (2,000 + species globally) Lepidoptera families with a high coverage of barcoded species for Europe (Hausmann et al., 2013; Huemer et al., 2020). However, a total of 21 species remain to be barcoded to complete the DNA barcode reference library of known European gracillariids (Supplementary Table S6). Six out of the 21 species without barcodes occur in islands; nine do not have any existing host plant record (Supplementary Tables S6, S12). It will therefore likely be a tedious task to obtain fresh specimens of these missing species and protocols for barcoding old material might represent a preferable solution to further complete the barcode reference library (Prosser et al., 2016) from collection specimens.
During the DNA barcoding of both the 24 public and 36 privately owned reference collections we were able to detect numerous cases of misidentified specimens. Indeed, DNA barcodes helped to correct and curate the reference collections in particular for those adult moths that had been identified only on the basis of external morphology, and were collected at light without any host plant data associated.
DNA barcoding has proved to be an efficient tool for accelerating species discovery of small moths both in tropical (Lees et al., 2014; Lopez-Vaamonde et al., 2019) and temperate areas (Mutanen et al., 2013; Huemer et al., 2020). By combining DNA barcodes, morphological and host plant use data, our study shows the diversity of Gracillariidae in Europe to have also been underestimated, and that there may be as many as 284 species in Europe (considering both CCS and UCS revealed here), possibly many more if we take into account the 45 unaddressed DNA barcode splits within USS, called here dark taxa (Figure 2B).
We found 21 lineages that represent candidate new species (6 CCS and 15 UCS). These newly revealed candidate species occur in the mountainous regions of Mediterranean islands, the South-Eastern Alps and the Balkans. These candidate species are likely to be rare, and knowing their true geographical distribution is crucial for their effective conservation. Our results highlight the Mediterranean as the most important biogeographical region within Europe in terms of gracillariid species richness, number of endemic species and new undescribed taxa.
Our analyses have also revealed 39 (16%) species with multiple BINs (i.e., deep COI splits; DCL and USS) and some of those might represent cryptic species. A barcoding study on European Gelechiidae micromoths found a similar level (15%) of species with multiple BINs (Huemer et al., 2020). However, these results will vary depending on sampling efforts, especially at intraspecific level. Indeed, most large-scale DNA barcode studies favored maximizing the number of different taxa sampled and neglected intraspecific sampling with typically fewer than ten individuals per species (Phillips et al., 2019). Our sampling effort with an average of 20.5 sequences per BIN significantly exceeds the average barcoding study. However, in our dataset, 63.5% (198/312) of the BINs were composed of less than 10 records, indicating a need to improve sampling efforts. One way of increasing intraspecific sampling is by combining national and regional DNA barcoding libraries. For instance, Finland had its entire gracillariid fauna DNA barcoded. Other countries show good progress such as Austria with 83.9% DNA barcoded species (119 barcoded out of 137 recorded species). On the contrary, Ireland and Estonia, for example, lack gracillariid DNA barcodes completely, thus efforts should be focused on such areas to extend coverage by sampling, if not of species.
Because the investigation of each individual case of DNA barcode divergence within species requires much time and material, our study leaves a total of 71 BINs within 26 named species as “unassessed species splits” (USS). Although they currently are assigned a valid Linnean species name in our reference library, we refer to those BINs as “dark taxa” (Page, 2016), until their status as potential cryptic species is fully examined. It was well beyond the scope of this study to examine all those multiple BINs, but we used nuclear data to explore the deep COI splits of two USS and three DCLs. Results obtained from the analysis of the ddRADseq data supports the presence of cryptic species in only one (Phyllocnistis saligna) of the five species studied. Indeed, six P. saligna specimens of BOLD:AAQ1589 and three specimens of BOLD:ABW1114 form different RADseq clusters (Figure 5). Additional specimens must be both barcoded and RAD sequenced to confirm this result. Therefore, we keep this species in the category “unassessed species splits” (Supplementary Table S3). While this result might appear to undermine the idea that intraspecific DNA barcodes splits are frequently indicative of cryptic diversity, it is likely biased because of the often-large proportion of missing data that characterize datasets generated with this method (Dincă et al., 2019), particularly when studied taxa are not closely related (Lee et al., 2018). Further genome-wide DNA analyses could be carried out using universal single-copy orthologs (USCOs) (Eberle et al., 2020) and ultra-conserved elements (UCEs) (Gueuning et al., 2020) coupled with breeding experiments to understand isolating mechanisms (Ohshima, 2005, 2008; Ohshima and Yoshizawa, 2010).
Another mechanism that could lead to the split of a species into deep mitochondrial lineages is via Wolbachia mediated spread of a new mitochondrial haplotype after an introgressive event. Indeed, deep mitochondrial splits have been found to be associated with specific Wolbachia strains in butterflies (Kodandaramaiah et al., 2013; Ritter et al., 2013; but see Bereczki et al., 2015). West et al. (1998) found that 38% (8/21, all but one Phyllonorycter spp.) of gracillariids analyzed were infected with Wolbachia, while Gutzwiller et al. (2015) found a similar percentage, 30% (35/119), in a larger sample. In our study only 13% of specimens analyzed (14/108) were found to be infected. This low level of prevalence must be taken with caution because we used only two molecular markers to detect Wolbachia and we screened a relatively small number of individuals per species. In addition, we did not find examples of where Wolbachia infection was associated with one particular BIN or RADseq clade within a morphospecies. This suggests that the endosymbiont does not play a major role in the generation of deep splits but further sampling is needed to confirm this conclusion. The possibility that other mitochondrial drive elements may be involved should also be considered.
Only one species, Phyllocnistis saligna, showed correspondence between nuclear and mitochondrial splits (Figure 5A). The two Czech specimens that show both nuclear and mitochondrial divergence are morphologically undistinguishable to the other European material examined from Austria, Germany and Finland. This might suggest the potential presence of a cryptic species in the Czech Republic but further specimens must be examined to confirm this hypothesis.
In our study we also looked at whether different BINs would correlate with geography and/or host plant shifts. We found that over 24 of the 39 species (61.5%) that show intraspecific splits have allopatric BINs (Supplementary Table S9). This pattern of checkered distributions has also been shown among cryptic taxa in other Lepidoptera like butterflies (Vodă et al., 2015). However, the number of individuals for many BINs is relatively low and it is likely that the number of BINs with sympatric distribution will increase as sampling effort increases.
Our analyses show that 68% (17/25) of the species with multiple BINs for which we have host plant data have BINs that share the host plant. This would suggest that host plant shifts are not important drivers of divergence in gracillariids (Imada et al., 2011). On the other hand, some studies have found host plant shifts between distantly related plants as the major driver of speciation in gracillariids (Ohshima, 2008).
We also identified nine species with multiple BINs co-occurring sympatrically and feeding on the same host plant (Supplementary Table S11). These species are good candidates to study Wolbachia-mediated genetic sweeps since neither geography nor host plant shifts seem to explain their COI splits.
To measure the relative impact of geography and host plant shifts on the diversification of gracillariids, we would need a robust phylogeny on which to reconstruct the major ancestral host switches and distributions (Winkler et al., 2018). The latest molecular phylogenetic study revised the classification of Gracillariidae into eight subfamilies, but relationships between them remain largely uncertain (Kawahara et al., 2017).
We have assembled a large barcode dataset covering nearly all of the European gracillariid fauna, allowing 91.3% of the known and named species to be identified accurately. We discovered new candidate species in Mediterranean mountains and islands. We also revealed a large number of DNA barcode splits (71 BINs in 26 USS), that have not been investigated through an integrative approach yet and may comprise many potentially cryptic lineages. Further assessment of those cases represents a major task that will require additional sampling, comparative morphology studies, breeding experiments or genome wide analyses.
The DNA barcode library made available by this study will enable identification of any life-stage, help discover and document the true diversity of European gracillariids, and contribute to the conservation assessment of these fascinating insects.
The resulting sequences, along with the voucher data, images, and trace files from Sanger sequencing, are deposited in the Barcode of Life Database (BOLD), http://www.boldsystems.org (Ratnasingham and Hebert, 2007) and the sequences subsequently deposited in GenBank. All data are available from BOLD in the dataset DS-EUGRACI2 (dx.doi.org/10.5883/DS-EUGRACI2). Github project doi: https://doi.org/10.5281/zenodo.4123683 ‘PyCOIstats’ contains the scripts used for analyzing the COI sequences.
CL-V and RR designed the study, carried out most of the analyses, and wrote the first draft. EN double checked and validated the host plant data and nomenclature. AG, NK, RR, and SG made the figures. NK analyzed the biogeographical and host plant data. CD ran both the PyCOIstats and monophyly tests. KL carried out the molecular lab work of ddRAD, performed the bioinformatics, data analysis, and drafted the ddRAD section. CL-V, AC, CD, HG, SG, PH, NK, J-FL, AL, ZL, MM, EV, AS, PT, and CW contributed to the material collection and DNA barcoding. CL-V led the writing of the manuscript. RR, NK, EV, AG, HG, CD, and DL contributed substantially to revisions. All authors contributed to the article and approved the submitted version.
This work was funded by the Studium (France) to both NK and DL to work as research fellows at INRAE Orléans; the Russian Foundation for Basic Research (No. 19-04-01029-a) and the basic project of Sukachev Institute of Forest SB RAS (project No. 0287-2021-0011) to NK; the Région Centre (France) project ENDOFEED (201000047141) to CL-V; the Ministry of Agriculture (France) project PASSIFOR to CL-V and RR; the Academy of Finland (grant number: 277984) to MM and the Kvantum Institute to KL; Kone foundation, Finnish Cultural foundation for financing the FinBOL (Finnish Barcode of Life) 2011-2015, and the Academy of Finland for financing FinBOL through the FinBIF national infrastructure project since 2014; Agriculture & Agri-Food Canada, Science and Technology Branch (projects Nos. J-000977 and J-002279) to J-FL; Promotion of Educational Policies, University and Research Department of the Autonomous Province of Bolzano – South Tyrol and Austrian Federal Ministry of Science, Research and Economics in the framework of ABOL (Austrian Barcode of Life) to PH. CD’s salary and all DNA sequencing at Naturalis Biodiversity Center was funded through the Dutch Economic Restructuring Fund (FES). AS was supported by the Bavarian Ministry of Science and Art (Germany) project BFB and the Federal Ministry of Education and Research (Germany) project GBOL. Funding for DNA barcoding was also partly provided by the Government of Canada through Genome Canada, the Ontario Genomics Institute in support of the International Barcode of Life project, and by the National Science and Engineering Research Council of Canada.
The authors declare that the research was conducted in the absence of any commercial or financial relationships that could be construed as a potential conflict of interest.
We are grateful to Ian Barton, Bengt Åke Bengtsson, Sylvain Charlat, Helmut Deutsch, Jurate and Willy De Prins, Gerfried Deschka (deceased), Willem Ellis, Gerald Fuchs, Theo Grünewald, Thomas Guggemoos, Alfred Haslberger, Axel Hausmann, Richard Heindel, Povilas Ivinskis, John Langmaid, Peter Lichtmannecker, Wouter Moerland, Enrique Murria, Elisenda Olivella, Annette von Scholley-Pfab, Ian Sims, Franz Theimer, Andreas Werno, Werner Wolf, and Steve Wullaert for sending valuable samples and/or allowing access to their collections. Thanks to Leif Aarvik, Kai Berggren, Jeremy deWaard, Per Falck, Arild Johnsen, Jari Junnilainen, Mark Sterling, and Martin Sigut for allowing access to unpublished barcodes. Thanks to both Ole Karsholt and Svetlana Baryshnikova for discussion on Micrurapteryx bistrigella and Caloptilia alpherakiella, respectively. We would like to thank Scott Miller for allowing us to use 33 sequences obtained as part of a collaboration between the Smithsonian Institution and the University of Guelph to barcode historical Lepidoptera specimens. We are grateful to Laura Törmälä for her efficient work in the laboratory at University of Oulu. The authors also wish to acknowledge CSC–IT Centre for Science, Finland and the technical support and advanced computing resources from University of Hawaii Information Technology Services – Cyberinfrastructure for providing computational resources. Thanks to two referees for their insightful comments.
This article is dedicated to the memory of the late Gerfried Deschka for his major contribution to the knowledge of European Gracillariidae and warm hospitality during our (CL-V, DL, and SG) visits to Steyr to work on his extensive collection and his help during this project.
The Supplementary Material for this article can be found online at: https://www.frontiersin.org/articles/10.3389/fevo.2021.626752/full#supplementary-material
Supplementary Table S1 | Checklist of the 263 European Gracillariidae species following the higher classification of Kawahara et al. (2017), and species not included in the checklist.
Supplementary Table S2 | Metadata of 6,791 COI sequences and 312 BINs used in this study.
Supplementary Table S3 | Summary statistics for specimens included in this study. UCS, unconfirmed candidate species; CCS, confirmed candidate species; DCL, deep conspecific lineages; Complex, species complexes; USS, unassessed species splits; Dmin_NN heterospecific, minimum distance to nearest neighbor; NN, nearest neighbor; BIN Dmax, maxim intraspecific distance within a BIN.
Supplementary Table S4 | Summary of the 108 specimens analyzed with ddRAD sequencing and Wolbachia screening.
Supplementary Table S5 | Primers and PCR protocols used for Wolbachia sequencing.
Supplementary Table S6 | List of 21 European Gracillariidae species without barcodes in BOLD with their host plant associations (when known) and distribution ranges.
Supplementary Table S7 | Output of Monophylizer analysis with non-monophyletic species highlighted in red.
Supplementary Table S8 | Summary of intraspecific and interspecific distances calculated with PyCOIStats v1.3.
Supplementary Table S9 | Geographic distribution of 39 species with multiple BINs.
Supplementary Table S10 | Host use of 25 species with multiple BINs.
Supplementary Table S11 | Nine species with different BINs co-occurring sympatrically (in same locality or localities a short distance apart) and sharing the same host plant.
Supplementary Table S12 | List of 15 European Gracillariidae species without host plant data.
Supplementary Figure S1 | Biogeographic classification of 284 European species (including 263 barcoded and 21 not barcoded). On the vertical axis, the total number of gracillariid species in each biogeographic category is given between parentheses. In the legend, the total number of gracillariid species in each subfamily is given between parentheses.
Supplementary Figure S2 | Number of Gracillariidae species on different host plant families according to the biogeographic categories. Note: the plant families where overall less than five gracillariid species are known are grouped into the category “Other 20 plant families” including: Adoxaceae, Anacardiaceae, Asteraceae, Berberidaceae, Boraginaceae, Cannabaceae, Caprifoliaceae, Cistaceae, Ericaceae, Hypericaceae, Juglandaceae, Lauraceae, Malvaceae, Oleaceae, Plantaginaceae, Polygonaceae, Rhamnaceae, Rutaceae, Ulmaceae, and Vitaceae.
Supplementary Figure S3 | Host plant use of European Gracillariidae fauna (284 species). Number of Gracillariidae species recorded per host plant family given between parentheses. In the legend, the total number of Gracillariidae species in each subfamily for which we have host plant data is given between parentheses.
Supplementary Figure S4 | A neighbor-joining tree based on 6,791 DNA barcodes of 263 European Gracillariidae species belonging to 312 BINs.
Aarvik, L., Bengtsson, B. Å, Elven, H., Ivinskis, P., Jürivete, U., Karsholt, O., et al. (2017). Nordic-baltic checklist of lepidoptera. Nor. J. Entomol. Suppl. 3, 1–236.
Auvray, G., and Malecot, V. (2013). A revision of Cytisus sections Alburnoides, Spartopsis and Verzinum (Genisteae, Fabaceae). Edinburgh J. Bot. 70, 61–120. doi: 10.1017/S0960428612000352
Belyaeva, I. (2009). Nomenclature of Salix fragilis L. and a new species, S. euxina (Salicaceae). Taxon 58, 1344–1348. doi: 10.1002/tax.584021
Bengtsson, B. Å, and Johansson, R. (2011). Nationalnyckeln till Sveriges flora och fauna. Fjärilar: Bronsmalar-rullvingemalar. Lepidoptera: Roeslerstammiidae-Lyonetidae. ArtDatabanken, SLU, Uppsala.
Bereczki, J., Racz, R., Varga, Z., and Toth, J. P. (2015). Controversial patterns of Wolbachia infestation in the social parasitic Maculinea butterflies (Lepidoptera: Lycaenidae). Organ. Div. Evol. 15, 591–607. doi: 10.1007/s13127-015-0217-7
Bickford, D., Lohman, D. J., Navjot, S. S., Ng, P. K. L., Meier, R., Winker, K., et al. (2007). Cryptic species as a window on diversity and conservation. Trends Ecol. Evol. 22, 148–155. doi: 10.1016/j.tree.2006.11.004
Braig, H. R., Zhou, W., Dobson, S. L., and O’Neill, S. L. (1998). Cloning and characterization of a gene encoding the major surface protein of the bacterial endosymbiont Wolbachia pipientis. J. Bacteriol. 180, 2373–2378. doi: 10.1128/JB.180.9.2373-2378.1998
Corley, M. (2014). Five new species of microlepidoptera from Portugal. Entomol. Rec. J. Var. 126, 229–243.
de Jong, Y., Verbeek, M., Michelsen, V., Bjørn, P. D. P., Los, W., Steeman, F., et al. (2014). Fauna Europaea – all European animal species on the web. Biodivers. Data J. 2:e4034. doi: 10.3897/BDJ.2.e4034
De Prins, J., and De Prins, W. (2020). Global Taxonomic Database of Gracillariidae (Lepidoptera). Belgian Biodiversity Platform. Available online at: http://www.gracillariidae.net (Accessed September 23, 2020).
Delabye, S., Rougerie, R., Bayendi, S., Andeime-Eyene, M., Zakharov, E. V., deWaard, J. R., et al. (2019). Characterization and comparison of poorly known moth communities through DNA barcoding in two Afrotropical environments in Gabon. Genome 62, 96–107. doi: 10.1139/gen-2018-0063
Deschka, G. (1975). Blattminierende Lepidopteren aus dem Nahen und Mittleren Osten. I. Teil. Zeitschrift der Arbeitsgemeinschaft Österreichischer Entomologen 26, 41–46.
deWaard, J. R., Ivanova, N. V., Hajibabaei, M., and Hebert, P. D. N. (2008). “Assembling DNA barcodes: analytical protocols,” in Methods in Molecular Biology: Environmental Genomics, ed. C. Martin (Totowa, NJ: Humana Press Inc.), 275–293.
Dincă, V., Lee, K. M., Vila, R., and Mutanen, M. (2019). The conundrum of species delimitation: a genomic perspective on a mitogenetically super-variable butterfly. Proc. R. Soc. B 286:20191311. doi: 10.1098/rspb.2019.1311
Dincă, V., Lukhtanov, V. A., Talavera, G., and Vila, R. (2011). Unexpected layers of cryptic diversity in wood white Leptidea butterflies. Nat. Commun. 2:324. doi: 10.1038/ncomms1329
Dincă, V., Montagud, S., Talavera, G., Hernández-Roldán, J., Munguira, M. L., Garcia-Barros, E., et al. (2015). DNA barcode reference library for Iberian butterflies enables a continental-scale preview of potential cryptic diversity. Sci. Rep. 5:12395. doi: 10.1038/srep12395
Dincă, V., Wiklund, C., Lukhtanov, V. A., Kodandaramaiah, U., Noren, K., Dapporto, L., et al. (2013). Reproductive isolation and patterns of genetic differentiation in a cryptic butterfly species complex. J. Evol. Biol. 26, 2095–2106. doi: 10.1111/jeb.12211
Doorenweerd, C., van Haren, M. M., Schermer, M., Pieterse, S., and van Nieukerken, E. J. (2014). A Linnaeus NG (TM) interactive key to the Lithocolletinae of North-West Europe aimed at accelerating the accumulation of reliable biodiversity data (Lepidoptera, Gracillariidae). Zookeys 422, 87–101. doi: 10.3897/zookeys.422.7446
Doorenweerd, C., van Nieukerken, E. J., and Hoare, R. J. B. (2017). Phylogeny, classification and divergence times of pygmy leaf-mining moths (Lepidoptera: Nepticulidae): the earliest lepidopteran radiation on Angiosperms? Syst. Entomol. 42, 267–287. doi: 10.1111/syen.12212
Doorenweerd, C., San Jose, M., Leblanc, L., Barr, N., Geib, S., Chung, A. Y. C., et al. (2020). DNA barcodes and reliable molecular identifications in a diverse group of invasive pests: lessons from Bactrocera fruit flies on variation across the COI gene, introgression, and standardization. BioRxiv [Preprint]. doi: 10.1101/2020.11.23.394510
Eaton, D. A. R., and Overcast, I. (2016). ipyrad: interactive assembly and analysis of RADseq datasets. Bioinformatics 36, 2592–2594. doi: 10.1093/bioinformatics/btz966
Eberle, J., Ahrens, D., Mayer, C., Niehuis, O., and Misof, B. (2020). A plea for standardized nuclear markers in Metazoan DNA taxonomy. Trends Ecol. Evol. 35, 336–345. doi: 10.1016/j.tree.2019.12.003
Eggleton, P. (2020). The state of the world’s insects. Annu. Rev. Environ. Resour. 45, 1–8.22. doi: 10.1146/annurev-environ-012420-050035
Ellis, W. (2020). Leafminers and Plant Galls of Europe. Plant Parasites of Europe: Leafminers, Gallers and Fungi. Available online at: http://bladmineerders.nl/ (Accessed October 8, 2020).
Emmet, A. M., Watkinson, I. A., and Wilson, M. R. (1985). “Gracillariidae,” in The Moths and Butterflies of Great Britain and Ireland, eds J. Heath and A. M. Emmet (Colchester: Harley Books), 244–363.
Folmer, O., Black, M., Hoeh, W., Lutz, R., and Vrijenhoek, R. (1994). DNA primers for amplification of mitochondrial cytochrome c oxidase subunit I from diverse metazoan invertebrates. Mol. Mar. Biol. Biotechnol. 3, 294–299.
Geiger, M. F., Astrin, J. J., Borsch, T., Burkhardt, U., Grobe, P., Hand, R., et al. (2016). How to tackle the molecular species inventory for an industrialized nation – lessons from the first phase of the German barcode of life initiative GBOL (2012–2015) 1. Genome 59, 661–670. doi: 10.1139/gen-2015-2185
Gueuning, M., Frey, J. E., and Praz, C. (2020). Ultraconserved yet informative for species delimitation: UCEs resolve long-standing systematic enigma in Central European bees. Mol. Ecol. 29, 4203–4220. doi: 10.1111/mec.15629
Gutzwiller, F., Dedeine, F., Kaiser, W., Giron, D., and Lopez-Vaamonde, C. (2015). Correlation between the green-island phenotype and Wolbachia infections during the evolutionary diversification of Gracillariidae leaf-mining moths. Ecol. Evol. 18, 4049–4062. doi: 10.1002/ece3.1580
Hassler, M. (2020). World Plants: Synonymic checklists of the vascular plants of the World (version Nov 2018). Species 2000 & ITIS Catalogue of Life 2020. Available online at: http://www.catalogueoflife.org/col (Accessed October 1, 2020).
Hausmann, A., Godfray, H. C., Huemer, P., Mutanen, M., Rougerie, R., van Nieukerken, E. J., et al. (2013). Genetic patterns in European geometrid moths revealed by the Barcode Index Number (BIN) system. PLoS One 8:e84518. doi: 10.1371/journal.pone.0084518
Hebert, P. D. N., Braukmann, T. W. A., Prosser, S. W. J., Ratnasingham, S., deWaard, J. R., Ivanova, N. V., et al. (2018). A sequel to sanger: amplicon sequencing that scales. BMC Genomics 19:219. doi: 10.1186/s12864-018-4611-3
Hebert, P. D. N., Cywinska, A., Ball, S. L., and deWaard, J. R. (2003). Biological identifications through DNA barcodes. Proc. R. Soc. B Biol. Sci. 270, 313–321. doi: 10.1098/rspb.2002.2218
Hernández-Roldán, J. L., Dapporto, L., Dincă, V., Vicente, J. C., Hornett, E. A., Šíchová, J., et al. (2016). Integrative analyses unveil speciation linked to host plant shift in Spialia butterflies. Mol. Ecol. 25, 4267–4284. doi: 10.1111/mec.13756
Hinojosa, J. C., Koubínová, D., Szenteczki, M. A., Pitteloud, C., Dincă, V., Alvarez, N., et al. (2019). A mirage of cryptic species: genomics uncover striking mitonuclear discordance in the butterfly Thymelicus sylvestris. Mol. Ecol. 28, 3857–3868. doi: 10.1111/mec.15153
Hobohm, C. (2000). Plant species diversity and endemism on islands and archipelagos, with special reference to the Macaronesian Islands. Flora 195, 9–24. doi: 10.1016/s0367-2530(17)30943-x
Hrbek, T., da Silva, V. M., Dutra, N., Gravena, W., Martin, A. R., and Farias, I. P. (2014). A new species of river Dolphin from Brazil or how little do we know our biodiversity. PLoS One 9:e83623. doi: 10.1371/journal.pone.0083623
Huemer, P., Karsholt, O., Aarvik, L., Berggren, K., Bidzilya, O., Junnilainen, J., et al. (2020). DNA barcode library for European Gelechiidae (Lepidoptera) suggests greatly underestimated species diversity. ZooKeys 921, 141–157. doi: 10.3897/zookeys.921.49199
Huemer, P., Lopez-Vaamonde, C., and Triberti, P. (2016). A new genus and species of leaf-mining moth from the French Alps, Mercantouria neli gen. n., sp. n. (Lepidoptera: Gracillariidae). ZooKeys 586, 145–162. doi: 10.3897/zookeys.586.8375
Imada, Y., Kawakita, A., and Kato, M. (2011). Allopatric distribution and diversification without niche shift in a bryophyte-feeding basal moth lineage (Lepidoptera: Micropterigidae). Proc. Biol. Sci. 278, 3026–3033. doi: 10.1098/rspb.2011.0134
Janzen, D. H., Burns, J. M., Cong, Q., Hallwachs, W., Dapkey, T., Manjunath, R., et al. (2017). Nuclear genomes distinguish cryptic species suggested by their DNA barcodes and ecology. Proc. Natl Acad. Sci. U.S.A. 114, 8313–8318. doi: 10.1073/pnas.1621504114
Kawahara, A. Y., Plotkin, D., Ohshima, I., Lopez-Vaamonde, C., Houlihan, P. R., Breinholt, J. W., et al. (2017). A molecular phylogeny and revised higher-level classification for the leaf-mining moth family Gracillariidae and its implications for larval host-use evolution. Syst. Entomol. 42, 60–81. doi: 10.1111/syen.12210
Kirichenko, N., Deutsch, H., Triberti, P., Rougerie, R., Huemer, P., and Lopez-Vaamonde, C. (2015). Integrative taxonomy reveals a new species of Callisto (Lepidoptera: Gracillariidae) in the Alps. Zookeys 473, 157–176. doi: 10.3897/zookeys.473.8543
Kirichenko, N., Triberti, P., Kobayashi, S., Hirowatari, T., Doorenweerd, C., Ohshima, I., et al. (2018). Systematics of Phyllocnistis leaf-mining moths (Lepidoptera, Gracillariidae) feeding on dogwood (Cornus spp.) in Northeast Asia, with the description of three new species. ZooKeys 736, 79–118. doi: 10.3897/zookeys.736.20739
Kirichenko, N., Triberti, P., Ohshima, I., Haran, J., Byun, B.-K., Li, H., et al. (2017). From east to west across the Palearctic: phylogeography of the invasive lime leaf miner Phyllonorycter issikii (Lepidoptera: Gracillariidae) and discovery of a putative new cryptic species in East Asia. PLoS One 12:e0171104. doi: 10.1371/journal.pone.0171104
Kodandaramaiah, U., Simonsen, T. J., Bromilow, S., Wahlberg, N., and Sperling, F. (2013). Deceptive single-locus taxonomy and phylogeography: wolbachia-associated divergence in mitochondrial DNA is not reflected in morphology and nuclear markers in a butterfly species. Ecol. Evol. 3, 5167–5176. doi: 10.1002/ece3.886
Kozlov, M. V., Mutanen, M., Lee, K. M., and Huemer, P. (2017). Cryptic diversity in the long-horn moth Nemophora degeerella (Lepidoptera: Adelidae) revealed by morphology, DNA barcodes and genome-wide ddRAD-seq data. Syst. Entomol. 42, 329–346. doi: 10.1111/syen.12216
Kumar, S., Stecher, G., Li, M., Knyaz, C., and Tamura, K. (2018). MEGA X: molecular evolutionary genetics analysis across computing platforms. Mol. Biol. Evol. 35, 1547–1549. doi: 10.1093/molbev/msy096
Langmaid, J., and Corley, M. (2007). Phyllocnistis ramulicola sp.nov (Lepidoptera: Gracillariidae) in England and Portugal. Ent. Gazette 58, 227–237.
Laštůvka, Z., Laštůvka, A., and Lopez-Vaamonde, C. (2013). A revision of the Phyllonorycter ulicicolella species group with description of a new species (Lepidoptera: Gracillariidae). SHILAP Rev. Lepidopt. 41, 251–265.
Lee, K. M., Kivelä, S. M., Ivanov, V., Hausmann, A., Kaila, L., Wahlberg, N., et al. (2018). Information dropout patterns in restriction site associated DNA phylogenomics and a comparison with multilocus Sanger data in a species-rich moth genus. Syst. Biol. 67, 925–939. doi: 10.1093/sysbio/syy029
Lees, D. C., Kawahara, A. Y., Bouteleux, O., Ohshima, I., Kawakita, A., Rougerie, R., et al. (2014). DNA barcoding reveals a largely unknown fauna of Gracillariidae leaf-mining moths in the Neotropics. Mol. Ecol. Resour. 14, 286–296. doi: 10.1111/1755-0998.12178
Lees, D. C., Lack, H. W., Rougerie, R., Hernandez, A., Raus, T., Avtzis, N. D., et al. (2011). Tracking origins of invasive herbivores using herbaria and archival DNA: the case of the horse-chestnut leafminer. Front. Ecol. Environ. 9, 322–328. doi: 10.1890/100098
Lepiforum, e.V. (2008–2020). Lepiforum: Bestimmungshilfe für die in Europa nachgewiesenen Schmetterlingsarten. Lepiforum e.V. Available online at: http://www.lepiforum.de/lepiwiki.pl (accessed October 7, 2020).
Letunic, I., and Bork, P. (2019). Interactive Tree Of Life (iTOL) v4: recent updates and new developments. Nucleic Acids Res. 47, W256–W259.
Lopez-Vaamonde, C., Agassiz, D. V. L., Augustin, S., De Prins, J., De Prins, W., Gomboc, S., et al. (2010). “Lepidoptera”, Chapter 11, in Alien terrestrial arthropods of Europe, eds A. Roques et al. BioRisk 4, 603–668. doi: 10.3897/biorisk.4.50
Lopez-Vaamonde, C., Godfray, C., and Cook, J. M. (2003). Evolutionary dynamics of host-plant use in a genus of leaf mining moth. Evolution 57, 1804–1821. doi: 10.1111/j.0014-3820.2003.tb00588.x
Lopez-Vaamonde, C., Kirichenko, N. I., and Ohshima, I. (2021). “Collecting, rearing and preserving leaf-mining insects and their host plants,” in Measuring Insect Biodiversity, eds J. C. Santos and G. W. Fernandes (Berlin: Springer), 439–466. doi: 10.1007/978-3-030-53226-0_17
Lopez-Vaamonde, C., Sire, L., Rasmussen, B., Rougerie, R., Wieser, C., Ahamadi, A., et al. (2019). DNA barcodes reveal deeply neglected diversity and numerous invasions of micromoths in Madagascar. Genome 62, 108–121. doi: 10.1139/gen-2018-0065
Minh, B. Q., Schmidt, H. A., Chernomor, O., Schrempf, D., Woodhams, M. D., Von Haeseler, A., et al. (2020). IQ-TREE 2: new models and efficient methods for phylogenetic inference in the genomic era. Mol. Biol. Evol. 37, 1530–1534. doi: 10.1093/molbev/msaa015
Mutanen, M., Kaila, L., and Tabell, J. (2013). Wide-ranging barcoding aids discovery of one-third increase of species richness in presumably well-investigated moths. Sci. Rep. 3:2901. doi: 10.1038/srep02901
Mutanen, M., Kivelä, S. M., Vos, R. A., Doorenweerd, C., Ratnasingham, S., Hausmann, A., et al. (2016). Species-level poly- and paraphyly in DNA barcode gene trees: strong operational bias in European Lepidoptera. Syst. Biol. 65, 1024–1040. doi: 10.1093/sysbio/syw044
Nel, J., and Varenne, T. (2014). Atlas des Lépidoptères Gracillariidae Lithocolletinae de France. Revue de l’Association Roussillonnaise d’Entomologie 23, 1–144. doi: 10.11646/zootaxa.3594.1.1
Ohshima, I. (2005). Techniques for continuous rearing and assessing host preference of a multivoltine leaf-mining moth, Acrocercops transecta (Lepidoptera: Gracillariidae). Entomol. Sci. 8, 227–228. doi: 10.1111/j.1479-8298.2005.00120.x
Ohshima, I. (2008). Host race formation in the leaf-mining moth Acrocercops transecta (Lepidoptera: Gracillariidae). Biol. J. Linn. Soc. 93, 135–145. doi: 10.1111/j.1095-8312.2007.00949.x
Ohshima, I., and Yoshizawa, K. (2010). Differential introgression causes genealogical discordance in host races of Acrocercops transecta. Mol. Ecol. 19, 2106–2119. doi: 10.1111/j.1365-294X.2010.04624.x
Padial, J. M., Miralles, A., De la Riva, I., and Vences, M. (2010). The integrative future of taxonomy. Front. Zool. 7:16. doi: 10.1186/1742-9994-7-16
Page, R. D. M. (2016). DNA barcoding and taxonomy: dark taxa and dark texts. Phil. Trans. R. Soc. B Biol. Sci. 371:20150334. doi: 10.1098/rstb.2015.0334
Peterson, B. K., Weber, J. N., Kay, E. H., Fisher, H. S., and Hoekstra, H. E. (2012). Double digest RADseq: an inexpensive method for de novo SNP discovery and genotyping in model and non-model species. PLoS One 7:e37135. doi: 10.1371/journal.pone.0037135
Phillips, J. D., Gillis, D. J., and Hanner, R. H. (2019). Incomplete estimates of genetic diversity within species: implications for DNA barcoding. Ecol. Evol. 9, 2996–3010. doi: 10.1002/ece3.4757
Prosser, S. W., deWaard, J. R., Miller, S. E., and Hebert, P. D. N. (2016). DNA barcodes from century-old type specimens using next-generation sequencing. Mol. Ecol. Resour. 16, 487–497. doi: 10.1111/1755-0998.12474
Rambaut, A. (2015). FigTree, v1.4.2: Tree Figure Drawing Tool. Molecular Evolution, Phylogenetics and Epidemiology. Available online at: http://tree.bio.ed.ac.uk/software/figtree/ (accessed October 7, 2020).
Ratnasingham, S., and Hebert, P. D. N. (2007). BOLD: the barcode of life data system (www.barcodinglife.org). Mol. Ecol. Notes 7, 355–364. doi: 10.1111/j.1471-8286.2006.01678.x
Ratnasingham, S., and Hebert, P. D. N. (2013). A DNA-based registry for all animal species: the barcode index number (BIN) system. PLoS One 8:e66213. doi: 10.1371/journal.pone.0066213
Raven, P. H., and Miller, S. E. (2020). Here today, gone tomorrow. Science 370:149. doi: 10.1126/science.abf1185
Raven, P. H., and Wilson, E. O. (1992). A fifty-year plan for biodiversity surveys. Science 258, 1099–1101. doi: 10.1126/science.258.5085.1099
Rennwald, E., and Rodeland, J. (2020). Lepiforums-Europaliste der Schmetterlinge – Lepiforum’s Checklist of European Lepidoptera, version 7. Lepiforum e.V. Available online at: http://www.lepiforum.de/lepiwiki.pl?Downloads (accessed October 13 2020).
Ritter, S., Michalski, S. G., Settele, J., Wiemers, M., Fric, Z. F., Sielezniew, M., et al. (2013). Wolbachia infections mimic cryptic speciation in two parasitic butterfly species, Phengaris teleius and P. nausithous (Lepidoptera: Lycaenidae). PLoS One 8:e78107. doi: 10.1371/journal.pone.0078107
Scheffers, B. R., Joppa, L. N., Pimm, S. L., and Laurance, W. F. (2012). What we know and don’t know about Earth’s missing biodiversity. Trends Ecol. Evol. 27, 501–510. doi: 10.1016/j.tree.2012.05.008
Stamatakis, A. (2014). RAxML version 8: a tool for phylogenetic analysis and post-analysis of large phylogenies. Bioinformatics 30, 1312–1313. doi: 10.1093/bioinformatics/btu033
Valade, R., Kenis, M., Hernandes-Lopez, A., Augustin, S., Mari Mena, N., Magnoux, E., et al. (2009). Mitochondrial and microsatellite DNA markers reveal a Balkan origin for the highly invasive horse-chestnut leaf miner Cameraria ohridella (Lepidoptera, Gracillariidae). Mol. Ecol. 18, 3458–3470. doi: 10.1111/j.1365-294X.2009.04290.x
Varenne, T., and Nel, J. (2016). Description de cinq nouvelles espèces de Lépidoptères découvertes en Corse: Trifurcula angustivalva sp. n., Trifurcula aureacorsa sp. n., Infurcitinea restonicae sp. n., Phyllonorycter corsica sp. n. et Sorhagenia orocorsa sp. n. Revue de l’Association Roussillonnaise d’Entomologie 25, 51–59.
Vieites, D. R., Wollenberg, K. C., Andreone, F., Köhler, J., Glawe, F., and Vences, M. (2009). Vast underestimation of Madagascar’s biodiversity evidenced by an integrative amphibian inventory. PNAS 106, 8267–8272. doi: 10.1073/pnas.0810821106
Vodă, R., Dapporto, L., Dincă, V., and Vila, R. (2015). Why do cryptic species tend not to co-occur? A case study on two cryptic pairs of butterflies. PLoS One 10:e0117802. doi: 10.1371/journal.pone.0117802
West, S. A., Cook, J. M., Werren, J. H., and Godfray, H. C. J. (1998). Wolbachia in two insect host-parasitoid communities. Mol. Ecol. 7, 1457–1465. doi: 10.1046/j.1365-294x.1998.00467.x
Winkler, I., Scheffer, S. J., Lewis, M. L., Ottens, K. J., Rasmussen, A. P., Gomes-Costa, G. A., et al. (2018). Anatomy of a Neotropical insect radiation. BMC Evol. Biol. 18:9. doi: 10.1186/s12862-018-1146-9
Keywords: barcode index number, cryptic diversity, Gracillariidae, Lepidoptera, mitonuclear discordance, new candidate species, RAD sequencing, Wolbachia
Citation: Lopez-Vaamonde C, Kirichenko N, Cama A, Doorenweerd C, Godfray HCJ, Guiguet A, Gomboc S, Huemer P, Landry J-F, Laštůvka A, Laštůvka Z, Lee KM, Lees DC, Mutanen M, van Nieukerken EJ, Segerer AH, Triberti P, Wieser C and Rougerie R (2021) Evaluating DNA Barcoding for Species Identification and Discovery in European Gracillariid Moths. Front. Ecol. Evol. 9:626752. doi: 10.3389/fevo.2021.626752
Received: 06 November 2020; Accepted: 27 January 2021;
Published: 18 February 2021.
Edited by:
Bernd Schierwater, University of Veterinary Medicine Hannover, GermanyReviewed by:
Felix David, University of Veterinary Medicine Hannover, GermanyCopyright © 2021 Lopez-Vaamonde, Kirichenko, Cama, Doorenweerd, Godfray, Guiguet, Gomboc, Huemer, Landry, Laštůvka, Laštůvka, Lee, Lees, Mutanen, van Nieukerken, Segerer, Triberti, Wieser and Rougerie. This is an open-access article distributed under the terms of the Creative Commons Attribution License (CC BY). The use, distribution or reproduction in other forums is permitted, provided the original author(s) and the copyright owner(s) are credited and that the original publication in this journal is cited, in accordance with accepted academic practice. No use, distribution or reproduction is permitted which does not comply with these terms.
*Correspondence: Carlos Lopez-Vaamonde, Y2FybG9zLmxvcGV6dmFhbW9uZGVAaW5yYWUuZnI=
Disclaimer: All claims expressed in this article are solely those of the authors and do not necessarily represent those of their affiliated organizations, or those of the publisher, the editors and the reviewers. Any product that may be evaluated in this article or claim that may be made by its manufacturer is not guaranteed or endorsed by the publisher.
Research integrity at Frontiers
Learn more about the work of our research integrity team to safeguard the quality of each article we publish.