 Jeferson G. E. Coutinho1,2*Juliana Hipólito1,3,4Rafaela L. S. Santos1,5Eduardo F. Moreira1Danilo Boscolo1,6Blandina F. Viana1,5
- 1National Institute of Science and Technology in Interdisciplinary and Transdisciplinary Studies in Ecology and Evolution, Federal University of Bahia, Salvador, Brazil
- 2Department of Technology in Health and Biology, Federal Institute of Education, Science and Technology, Salvador, Brazil
- 3Coordination of Research in Biodiversity, National Institute for Research in the Amazon, Manaus, Brazil
- 4Center for Integrated Studies of Amazonian Biodiversity, National Institute for Research in the Amazon, Manaus, Brazil
- 5Ecology Pos-Graduate Program: Theory, Application and Values, Institute of Biology, Federal University of Bahia, Salvador, Brazil
- 6Department of Biology, Faculty of Philosophy Sciences and Letters of Ribeirão Preto, University of São Paulo, São Paulo, Brazil
Land-use change is having a negative effect on pollinator communities, and these changes in community structure may have unexpected impacts on the functional composition of those communities. Such changes in functional composition may impact the capacity of these assemblages to deliver pollination services, affecting the reproduction of native and wild plants. However, elucidating those relationships requires studies in multiple spatial scales because effects and consequences are different considering biological groups and interactions. In that sense, by using a multi-trait approach, we evaluated whether the landscape structure and/or local environmental characteristics could explain the functional richness, divergence, and dispersion of bee communities in agroecosystems. In addition, we investigated to what extent this approach helps to predict effects on pollination services. This study was conducted in an agroecosystem situated in the Chapada Diamantina region, State of Bahia, Brazil. Bees were collected using two complementary techniques in 27 sample units. They were classified according to their response traits (e.g., body size, nesting location) and effect traits (e.g., means of pollen transportation, specialty in obtaining resources). The Akaike information criterion was used to select the best models created through the additive combination of landscape descriptors (landscape diversity, mean patch shape, and local vegetation structure) at the local, proximal, and broad landscape levels. Our results indicate that both landscape heterogeneity and configuration matter in explaining the three properties of bee functional diversity. We indicate that functional diversity is positively correlated with compositional and configurational heterogeneity. These results suggest that landscape and local scale management to promote functional diversity in pollinator communities may be an effective mechanism for supporting increased pollination services.
Introduction
Animal pollination is considered an essential ecosystem service. About 300,000 (90% of total angiosperm species) plant species depend on animal pollination (Ollerton et al., 2011), and 75% of agricultural food crops benefit in some way from the ecosystem services provided by pollinators (Klein et al., 2007). Among these animals, bees are considered the most expressive pollinators in both temperate and tropical areas, having diverse nesting habits, different degrees of sociality, and feeding habits. Despite their importance, studies point out the decline of species in some regions of the world (e.g., in Europe and North America) (Girão et al., 2007; Cameron et al., 2011; Dupont et al., 2011; Becher et al., 2013). Landscape changes driven by natural vegetation conversion into intensively managed agricultural fields, such as landscape simplification and native environment loss, are among the most critical factors to explain this loss of pollinator diversity (Stein et al., 2014). However, the landscape structure effects on pollinator species diversity is not always straightforward with mixed results being present in the literature (Williams et al., 2010; Coutinho et al., 2018). Additionally, different pollinator species do not respond equally to the same types of landscape changes. Therefore, much consideration is needed to understand how these landscape changes may increase or decrease pollinator diversity in different contexts.
Furthermore, most studies dealing with the decline of species focus on species’ taxonomic diversity, but this approach may have limitations in explaining cause and effect relationships because pollinator species are not functionally equivalent. For instance, in a recent meta-analysis, Woodcock et al. (2019) show that the magnitude of functional differences between species plays an important role in predicting the yield of oilseed rape. Similarly, Martins et al. (2015) show that pollination success depends on a core of effect traits that increase the probability of transferring pollen grains in a particular environmental context. Because of the increasingly recognized importance of functional traits in ecological systems, the study of functional diversity (FD) has been explored to establish links between biological diversity and ecosystem functions and services (Loreau, 2000; Díaz et al., 2003, 2007; Cadotte et al., 2011; Lavorel et al., 2011). Environmental filters and the species ability to disperse in space may influence the functional diversity in a community (Aiba et al., 2012; Biswas et al., 2016; Cisneros et al., 2016). However, there are different approaches to study the impact of environmental changes on FD, ranging from single response traits (Eviner and Chapin, 2003) to indexes describing community properties, such as dispersion and functional composition (Botta-Dukát, 2005; Peres-Neto et al., 2012; Cisneros et al., 2016). Traits can also be classified into two dimensions of FD: response and effect traits. The degree of correlation between these traits can indicate how resistant an ecosystem can be to environmental changes (Oliver et al., 2015). Uncorrelated traits indicate greater ecosystem resistance because species’ responses to environmental change are decoupled from their effects on ecosystem function (Larsen et al., 2005). Effect traits are related to one or more ecosystem functions, establishing direct mechanistic links between functional diversity and ecosystem function (Wood et al., 2015). Response traits can predict which species are present under a given environmental regime, elucidating the role played by the drivers modified by these regimes (Kremen and M’Gonigle, 2015; Wood et al., 2015).
Generally, the perspective of a single response trait links the most abundant species in a community to its performance in delivering a service (Sonkoly et al., 2019). In contrast, some studies emphasize the importance of trait diversity in a community to optimize ecosystem services because the larger the set of traits, the greater the likelihood of complementarity among species (Martins et al., 2015). Trait diversity is influenced by environmental and spatial filters that operate at different scales (Flinn et al., 2010; Aiba et al., 2012). A set of functional traits can occur in each location depending on the traits considered and their interaction with the environmental filters and spatial structure of patches and landscapes (Chase, 2014; Biswas et al., 2016), generating the expectation of FD to be spatially structured (Siefert et al., 2013). For bees, the most prominent pollinator group (Klein et al., 2007), solitary species are generally more affected by habitat loss than social species considering that solitary bees are more likely to be specialists in habitat use (Krauss et al., 2009). Within the bee group, FD can be highly impacted as there is great variation in other traits, such as diet breadth, foraging range, and body size (Banaszak-Cibicka and Zmihorski, 2012). Bees’ functional dispersion, considering response and effect traits is higher in natural habitats than in organic and conventional agricultural systems (Forrest et al., 2015), indicating a greater diversity of traits in unmanaged environments. However, there is still a need to understand the set of appropriate measures associated with ecosystem functions and the elucidation of mechanisms underlying multiple indices and scales’ variation.
Functional diversity can be separated into three components: functional richness (expressed as the space occupied by the species present in the community in a multidimensional space of traits); functional dispersion (defined as the average distance of individual species to the centroid of all species); and functional divergence (expressed as the distance of the species to the gravity center of the functional space). Functional richness represents the number of different traits in a community. The dispersion indicates the degree of differentiation between species, according to their functional characteristics. On the other hand, functional divergence represents how each species in the community separates itself from the most abundant species in this community. These functional diversity indexes are complementary, and the degree of correlation between them is one of the primary objectives in linking environmental changes and ecosystem function performance (Hooper et al., 2002; Oliver et al., 2015). However, most studies concentrate on one index, and the relationship among multiple indexes is mostly unknown (Bartomeus et al., 2018).
Some theoretical models have been used to explain the processes that regulate the formation of a community in heterogeneous environments (Warzecha et al., 2016). The species sorting model emphasizes effects of local abiotic features on population vital rates and species interaction (Leibold et al., 2004). On the other hand, the mass effect model focuses on immigration and emigration and its effects on local population dynamics, emphasizing the spatial dynamics role in local population densities (Leibold et al., 2004). Agroecosystems formed by a mosaic of agricultural and natural landscapes can be good scenarios in which to investigate the empirical support of these models because the different spatial arrangements of different types of land cover may indicate complementarity between multiple ecological processes.
From the perspective of landscape ecology, the landscape structure, comprising composition and configuration, can help us understand the mechanisms underlying these models (Holzschuh et al., 2010). Landscape composition has profound effects on the structure of communities as it is related to habitat availability for species. Configuration may have a direct influence on the movement pattern of many species. However, an integrated framework of these predictions considered from FD has been little explored (but see Silva and Hernández, 2015). Understanding the ecological processes that regulate FD can be fundamental for planning agricultural landscapes.
In this sense, to understand how different properties of FD respond to different land-use regimes, we address the questions of whether (1) landscape and/or environment local structures explain the functional structure of bee communities and (2) FD components (richness, divergence, and dispersion) of bee communities respond differently to environmental predictors.
Materials and Methods
Study Area
The data used in this study were collected from 27 sampling points in 2011 in the Mucugê-Ibicoara agricultural development region, Chapada Diamantina, Bahia, Brazil (41°28′40″ S, 13°09′10″ W) (Figure 1). The region has elevations that vary between 900 and 1400 m of altitude and an annual average temperature of 21°C with a minimum of 16°C and a maximum of 26°C (data provided by the Bagisa S/A Agropecuária e Comércio meteorological station). The vegetation of the region is xerophytic, which is typical of savannah, and dominated by two physiognomies: parkland and wooded savannah. The parkland is characterized by graminoid savannah vegetation with a substantial presence of hemicryptophytes and geophytes. The wooded savannah consists of nano cryptophytes, hemicryptophytes, and continuous graminoid vegetation with many stunted woody plants and dwarf palms (Veloso et al., 1991).
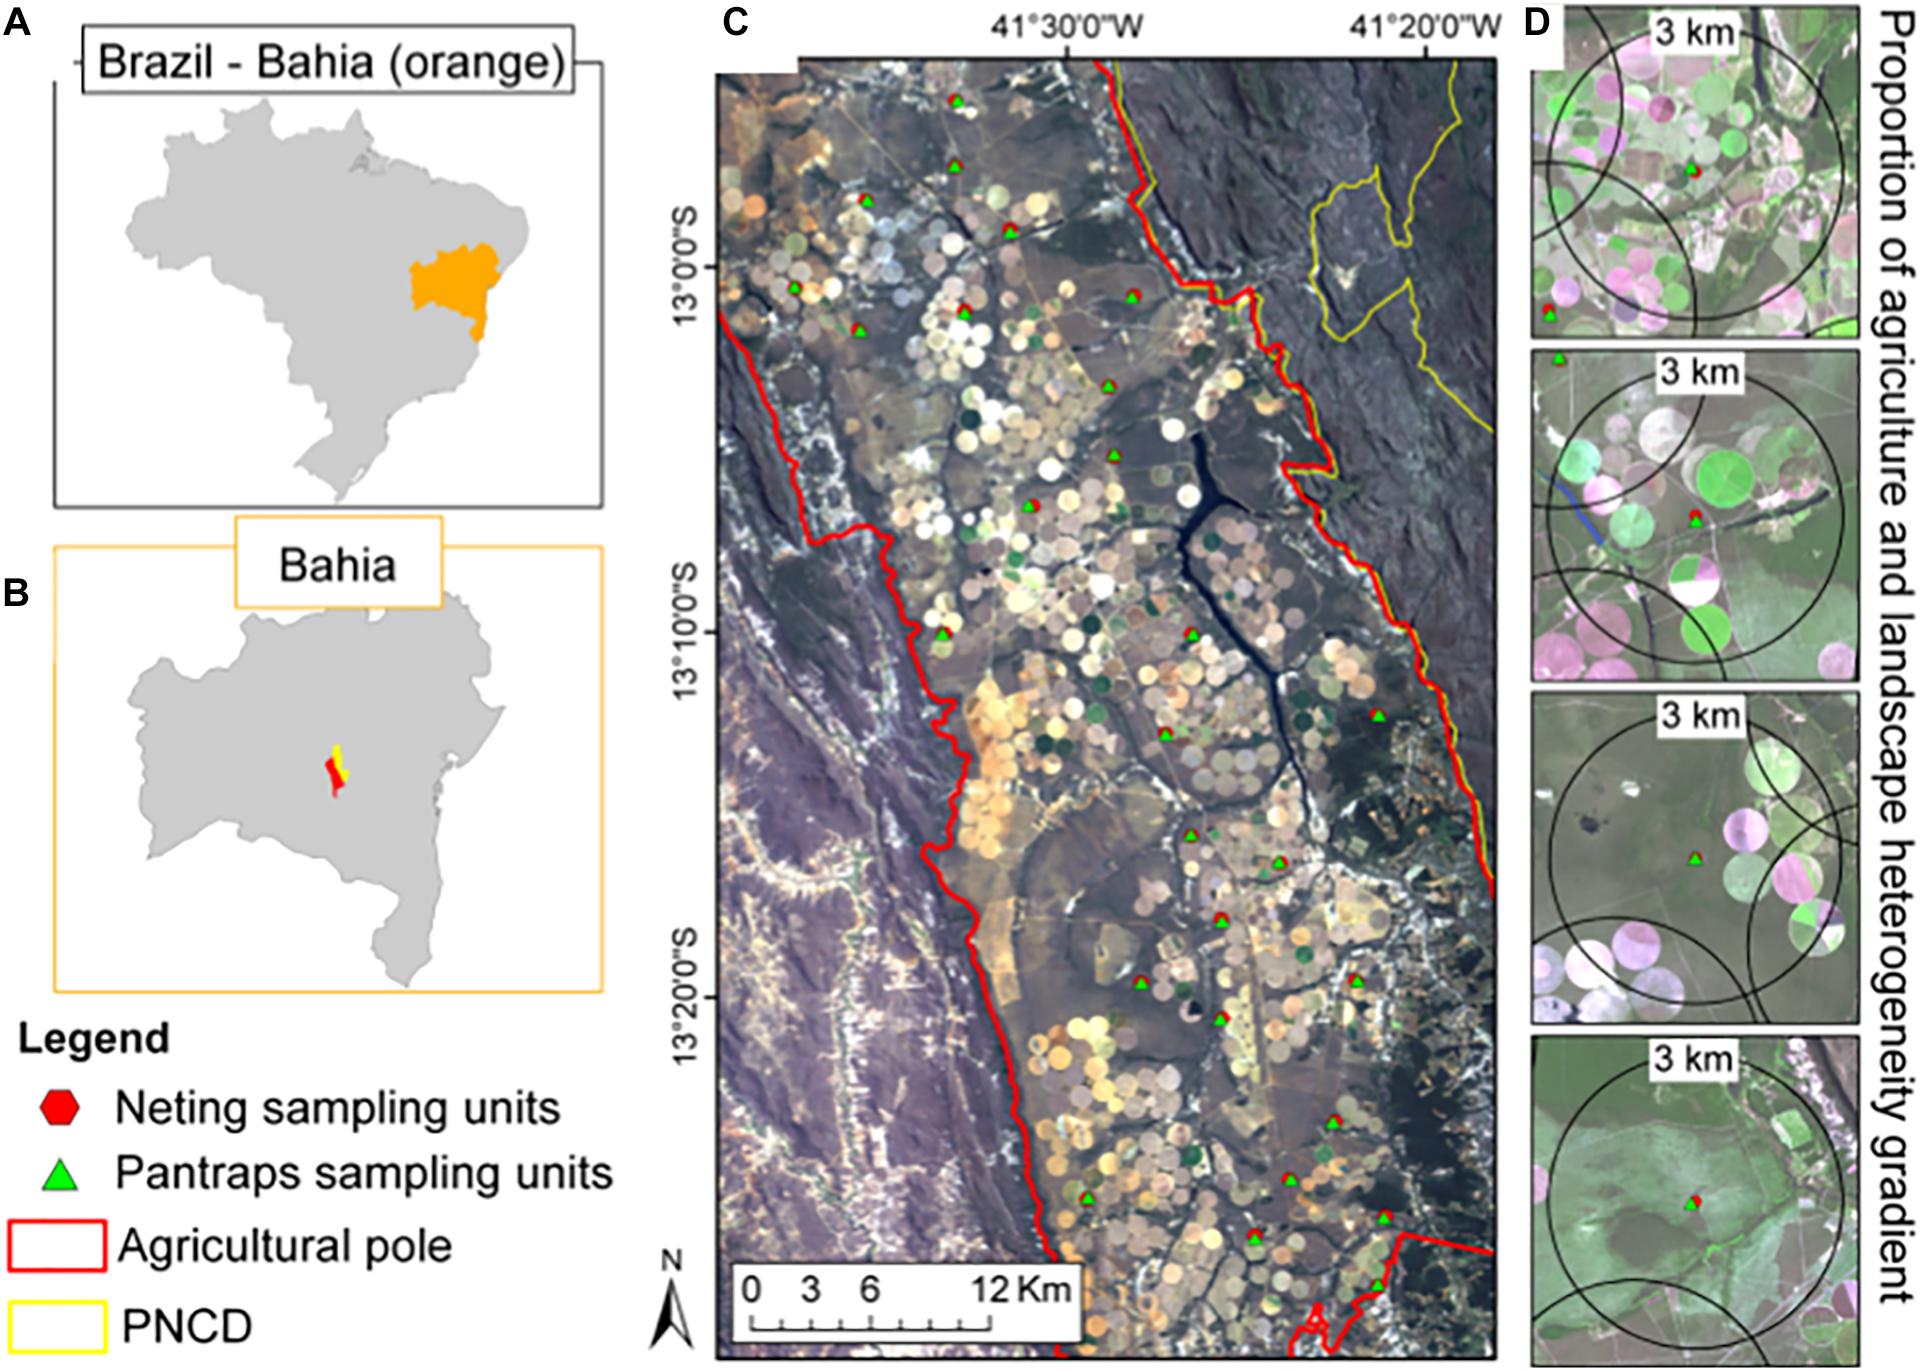
Figure 1. (A) Highlighted in orange and light gray, the state of Bahia and Brazil, respectively. (B) At the center of the state of Bahia (red), the studied region, with the lands of the agricultural partnership in red and Chapada Diamantina National Park in yellow. (C) Location of the 27 selected sampling units (red dots and green triangles) in the study region and the land cover classification used for the calculation of landscape metrics. (D) Example of the 3-km buffer used for the selection of sampling units. Modified from Moreira et al. (2015).
Sampling Unit Selection
A buffer of 3 km was used as the minimum distance between sampling units (minimum nearest neighbor distance = 4.6 km, mean = 25.5 km, maximum = 63.6 km). For that purpose, we used the software ArcGIS 9.3 ESRI 2008. Through the classification of the bee community, according to their response and effect traits, we calculate the richness, dispersion, and functional divergence varied through a gradient of agricultural and natural physiognomies. In addition, we observed how the configuration of landscape elements could influence this response. We chose sampling points according to landscape composition gradient. For this purpose, a land cover map was drawn based on the supervised classification of satellite images, according to Moreira et al. (2015). We used a geographic information system (GIS) containing a SPOT satellite image with 5 m spatial resolution for the selection of our 27 sample units. As selection criteria, we used the vegetation stratification at the sampling point, the proportion of agricultural area, and the diversity of land cover types within a radius of 3 km from the sampling point. A GIS and field checks were used to select the sampling units. Visual inspection was performed by contrast of colors after previous classification of a SPOT satellite image with high spatial resolution (5 m pixels). The preselected units were checked in the field, and if they were different from what was expected by the image inspection, this point was moved to the nearest location with the desired characteristics. For more details, see Moreira et al. (2015). To choose the sampling points, we actively searched for an orthogonal gradient between the two descriptors of the landscape, agricultural proportion, and Shannon landscape diversity index (SDI) to minimize spatial autocorrelation. SDI is a relative measure of patch diversity and is equal to zero when there is only one patch in the landscape, increasing as the number of patch types or the proportional distribution of patch types increases in the landscape (Moreira et al., 2015).
Biological Surveys
Biological data were collected in each sampling unit, which was positioned on a gradient of landscape proportion of agriculture and habitat types diversity at a 3-km scale. Two complementary sampling strategies were used: passive, using pan traps (Cane et al., 2000), and active through entomological nets (Moreira et al., 2015). The active sampling with entomological nets was made by two collectors walking through two isosceles triangles within a reference hexagon with 25-m sides (Supplementary Figure 1). All floral visitors seen on the flowers were collected with the nets between 07:30 and 17:30. Each group was sampled every 2 months between January and November 2011, corresponding to two rainy seasons and two dry seasons to avoid possible systematic effects of seasonality. Each sample unit was sampled for 40 h throughout the entire campaign. Collectors alternated the units they sampled to minimize possible systematic effects on collection (Moreira et al., 2015). Pan traps were placed in each of the 27 sample units and removed 24 h later. For the collection with pan traps, we used the three most common colors to attract bees: yellow, white, and blue. Blue and yellow traps also had ultraviolet radiation (Cane et al., 2000). In each pan trap, we put 120 ml of water and approximately five drops of neutral detergent to break the surface tension. The pan traps were installed at the height of 1 m from the ground using 25-mm-diameter PVC pipes and perforated metal ribbons, used as support for 18-mm-diameter colored dishes. Traps were 5 m distant from each other in an equidistant triangular shape in which each one was positioned at a vertex of this triangle. At each sampling point, three groups of three plates of different colors were installed, totaling nine pan traps for each sampling point (Supplementary Figure 2). This set of nine pan traps formed a larger triangle in each sample unit. Each group of three was 15 m from the next nearest group.
Environmental Descriptors
To assess the influence of the landscape structure and the local environment on the bees’ FD, we used images from LANDSAT 5 Thematic Mapper (TM) satellite (dated September 14, 2011) with 30 m spatial resolution. Images underwent geometric correction, georeferencing, atmospheric correction (DOS2), and radiometric calibration before the classification procedure was applied (Moreira et al., 2015). Classifications were made considering a total of 13 classes (as Moreira et al., 2015; Hipólito et al., 2018), including nine classes of vegetation and four complementary classes: disturbed vegetation (recently abandoned areas occupied by ruderal vegetation), grassy woody savannah, parkland savannah, wooded savannah, forested savannah, semideciduous forest, rocky park savannah, rocky wooded savannah, rocky steppe savannah, anthropic area (primarily including agricultural lands with minor contributions from roads, buildings, and bare soils of anthropogenic origin), clouds, water, and shadow.
Sampling points within the landscape considered the proportion of agriculture (PA), SDI, and the configuration of landscape elements (mean shape index or MSI) at spatial levels ranging from 200 to 12,500 m from the sampling point (more details on Moreira et al., 2015). The diversity of habitat types was based on the different types of land cover, using the landscape SDI (McGarigal et al., 2012). PA and SDI are part of landscape compositional heterogeneity (Fahrig et al., 2011). For the configuration, we used the landscape MSI, which describes the degree of the interposition of landscape elements weighted by area. Landscape metrics were calculated using the module Patch Analyst (Queens Press, Ontario Ministry of Natural Resources, 2012) in ArcGIS 9.3 (ESRI 2008). The PA and diversity of habitat types (SDI) were used as descriptors that reflect the influence of the environmental gradients (sorting species model) on bees’ FD at several spatial scales. The MSI was used as a measure of the degree of the structural complexity of the elements that compose this landscape in order to establish a proxy that can indicate the degree of difficulty that the landscape imposes for the movement of bees in the agroecosystem (mass effect) (Leibold et al., 2004). Although it is an indirect measure, this index reflects an important structural characteristic that, measured in broad spatial scales, can indicate the role that the dispersion can have in the functional structure of bees in a metacommunity. Finally, at the local scale, which varied between 25 and 150 m from the sampling point, we used the mean of the two-band enhanced vegetation index (EVI2) to describe the local vegetation structure. This index, used in previous works in the same area, is a good descriptor of the number of branches and the richness of plants in the savannah, which are two important characteristics in the composition of the niche spaces of bee species (Moreira et al., 2015).
For all descriptors, we considered multiple spatial scales (i.e., local vegetation: 25 to 150 m, proximal landscape scale: 250 to 3000 m, broad landscape scale 6000 to 12,500 m), which we used to select the most appropriate scale of effect. For this, the best explanatory power (R2) was adopted as the selection criterion. To detect the best explanatory measurement scale for the combinations of factors and FD indexes, we performed linear models of the different radii of MEVI2 and surrounding landscape metrics and searched for the highest value of R2. This analysis was performed using the lm function in R software, package “vegan.”
Functional Diversity
Trait Assignments
To calculate the FD indexes, we used response and effect traits. Through this approach, we can understand the role of environmental descriptors in FD and how it can potentially affect the pollination service. For all species in the data set (Supplementary Appendix 1), we compiled information on their life history traits, considering response and effect traits. For response traits, we used body size, dietary specialization, nesting location, nest construction behavior, and sociality. For effect traits, we used hairiness (density of hair because it affects pollen grain deposition on stigmas) (Stavert et al., 2016); glossa length, which is associated with a range of floral types that bees can access; mean of pollen uptake and transportation, both related to the versatility of interaction with pollen grains; and specialty in obtaining some resource (Michener, 2000; Martins et al., 2015) (Table 1). Body size was the quantitative functional attribute measured, and for this, we used the mean inter-tegular distance of the specimens collected (Greenleaf et al., 2007).
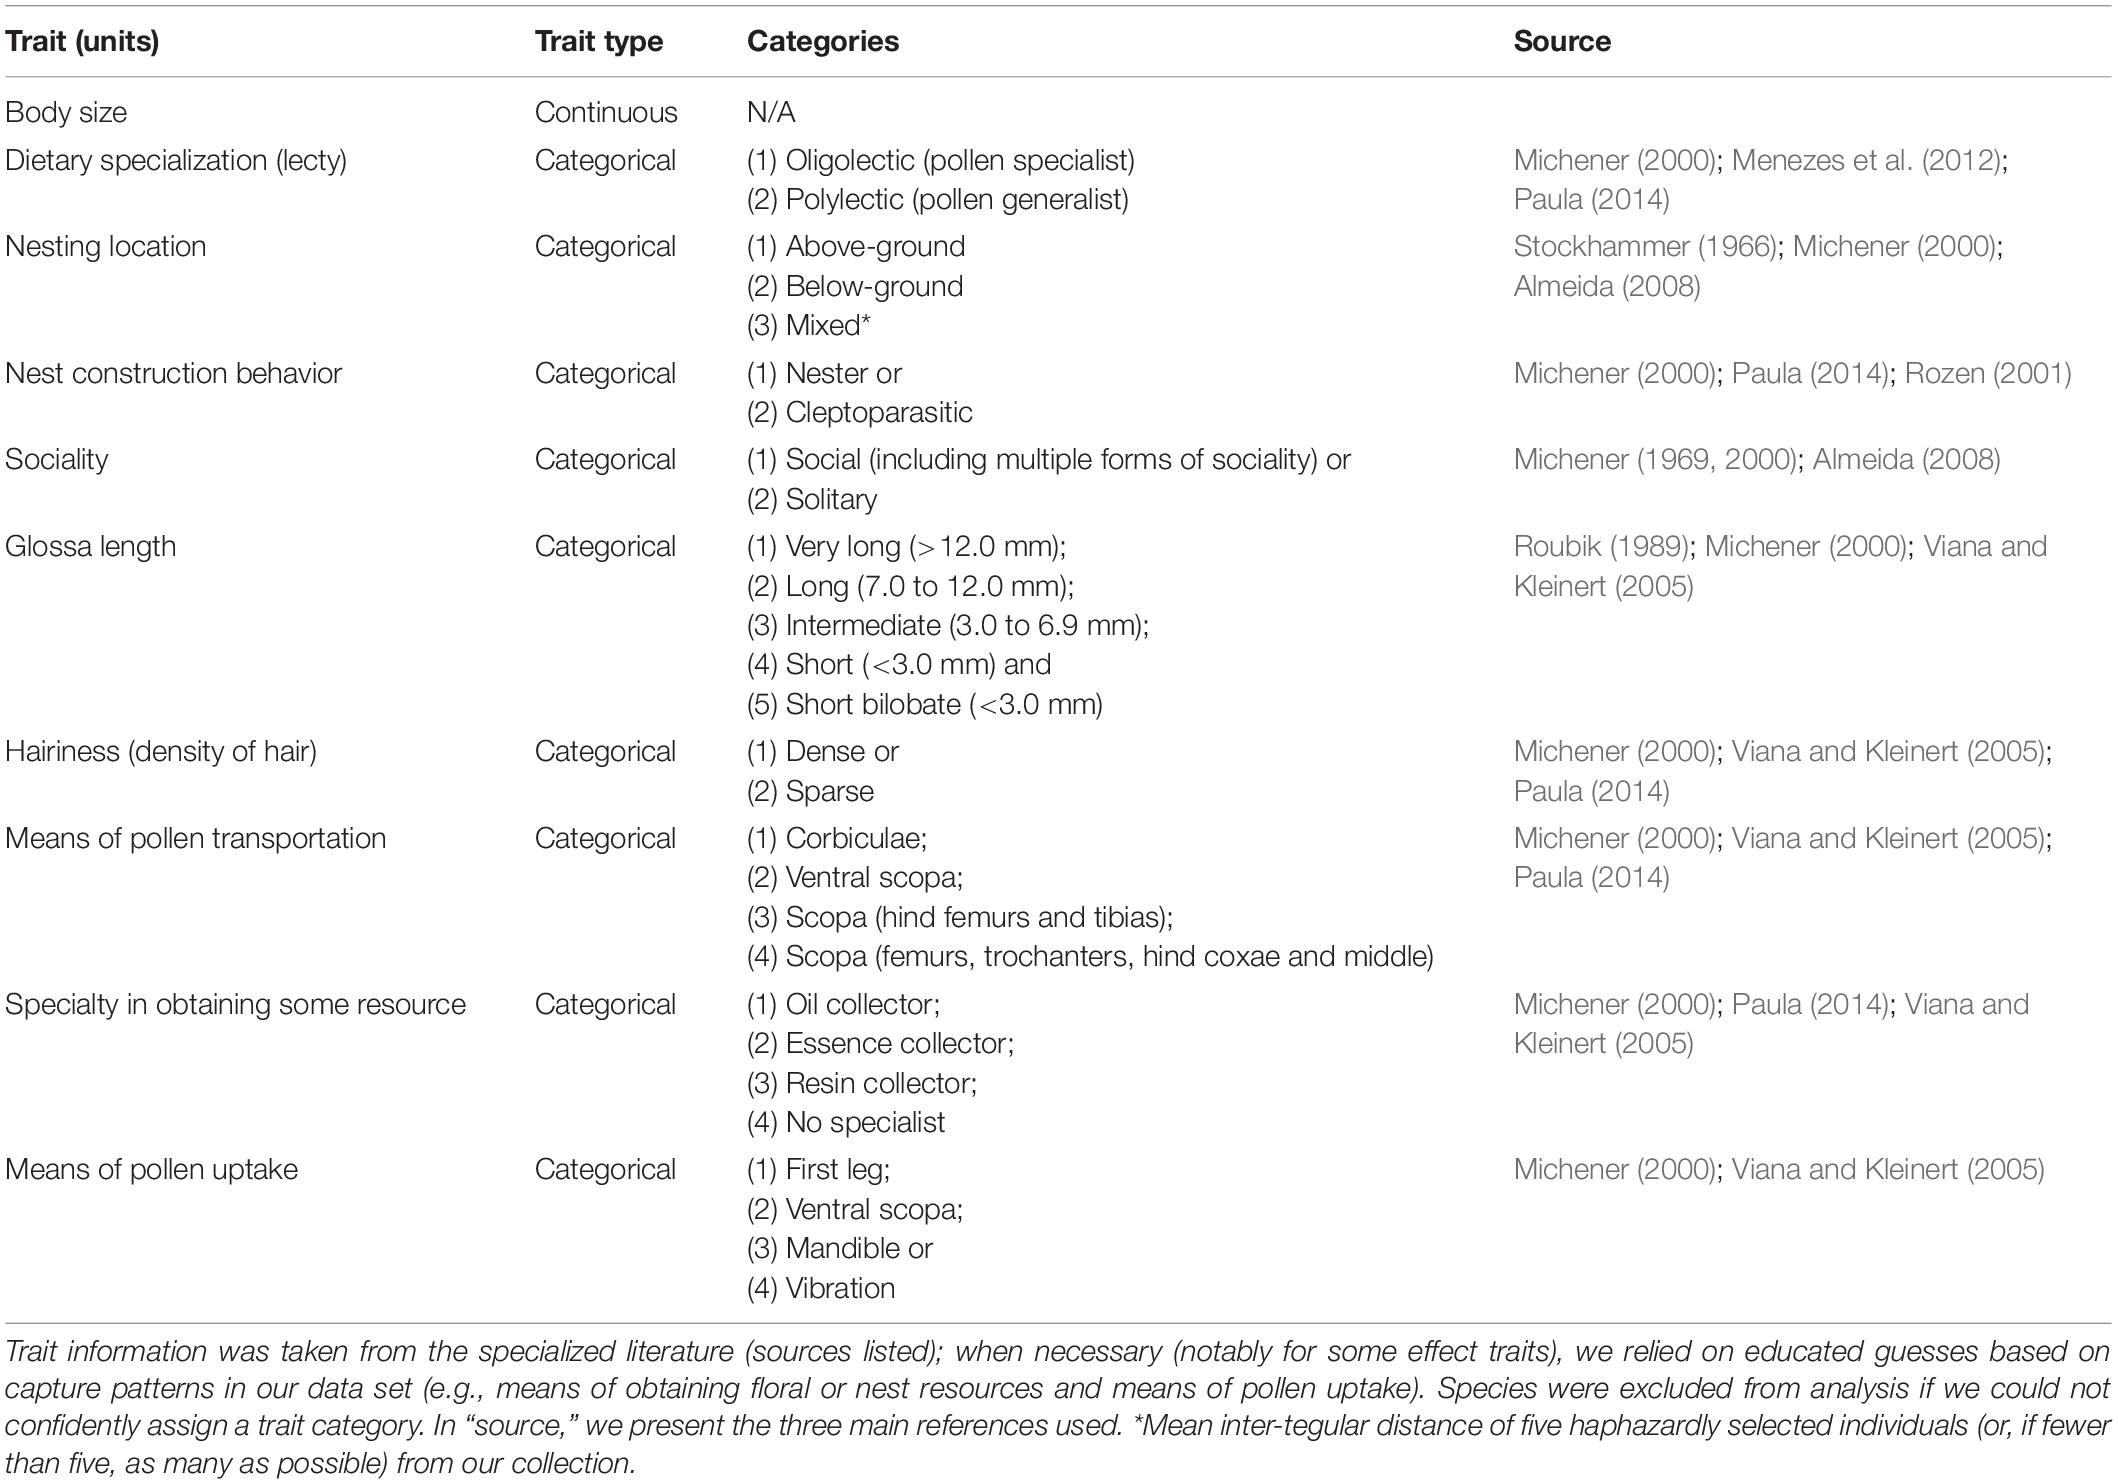
Table 1. Traits used in analyses of functional richness, functional divergence, and functional dispersion.
Measures for each species (or morphotype when identification was not possible) considered at least five individuals. For species of which we had fewer than five individuals, we used the number of individuals available in our data set. Information on the categorical functional attributes was obtained from the extensive survey of the specialized literature. Species were excluded from the analysis if we could not confidently assign a trait category.
To obtain complementary information regarding bee FD, we used three indexes that reflect the important properties of this diversity (Hooper et al., 2002). The functional richness is the volume in a multi-trait functional space that is occupied by a community (Villéger et al., 2008). The functional divergence reflects how much the species of a community diverge in their distances from the center of gravity of the functional space, considering the abundance of these species (Mason et al., 2005). There would be a low divergence if the majority of the most abundant species is close to the center of the values of this multi-trait space; this divergence is high when the most abundant species occupy the extremes of this multi-trait space (Villéger et al., 2008). The functional dispersion quantifies the mean distance of each species from its community centroid in a multivariate space defined by all included traits (Laliberté and Legendre, 2010). To calculate functional dispersion (FDis), functional richness (FRic), and functional divergence (FDiv), we used the function dbFD in package FD, in R version 3.4.4 (2018) with the Cailliez correction for non-Euclidean distances generated by the inclusion of categorical traits (Laliberté et al., 2014).
Statistical Analyses
We verified the role of environmental descriptors at three different levels, following the same logic of Moreira et al. (2015): local vegetation, proximal landscape, and broad landscape, considering the relevance of a multiscale approach to understand the trait distribution pattern in agricultural landscapes (Motzke et al., 2016). This division was performed to try to capture potential processes that operate at these three levels and is important and complementary in explaining the functional diversity of the bees, considering the response traits listed for this study, taking into account assumptions of species sorting and mass effect models. Bees are multi-habitat users and use resources within their radius of flight, which, on average, can be contemplated within this range of spatial scales (Ricketts et al., 2008; Warzecha et al., 2016). Finally, in relation to the broad landscape level, which ranged from 6000 to 12,500 m from the sampling point, we expect that population processes involving dispersal movements across the landscape occur at this spatial scale, being crucial to understanding the species occurrence patterns at smaller scales (Fahrig, 2013).
To standardize the effect sizes and reduce the influence of the range of each variable on the parameter estimation, both response and explanatory variables were rescaled. For this, we scaled and centered to zero each variable by subtracting its mean value and then dividing it by its standard deviation. This transformation preserves the original characteristics of the variables by adjusting the numerical values, making the results comparable (Moreira et al., 2015).
To evaluate the influence of the environmental predictors on the three indexes of FD (richness, divergence, and functional dispersion), we chose the scales that presented the highest R2 value and constructed an additive model with all the predictive variables for each functional diversity index. From this initial full model, a set of models was derived resulting from all possible combinations of the seven effect variables (MEVI2, SDI at the proximal and broad landscape levels, MSI at the proximal and broad landscape levels, PA at the proximal and broad landscape levels), (MuMIn package, dredge function) (Barton, 2014). The best models were compared with a “null” model without any fixed predicting variable to understand whether they provide any relevant fit. We then compared the models using the values of the second order Akaike information criterion (AICc), which is suitable for small samples (n < 40). The delta AICc (Δi) value for each model, namely the difference between the AICc value for that model and the lowest AICc value in the set of models, was used to evaluate the plausibility of the candidate models. Models with values of delta AICc (Δi) < 2 were considered equally plausible. We also considered the Akaike weights (Wi) of the models, the evidence ratio in relation to the minimum AICc model (W1/Wj), and the importance of the variables in each selection process (SW) to evaluate the normalized differences between the equally plausible models as well as the differences relative to the null model. Parameter estimates for models presented in Table 2 were obtained using the restricted maximum-likelihood method (Zuur et al., 2009). The model parameter estimation and model selection were performed with the “MuMIn” package (R Core Team, 2018).
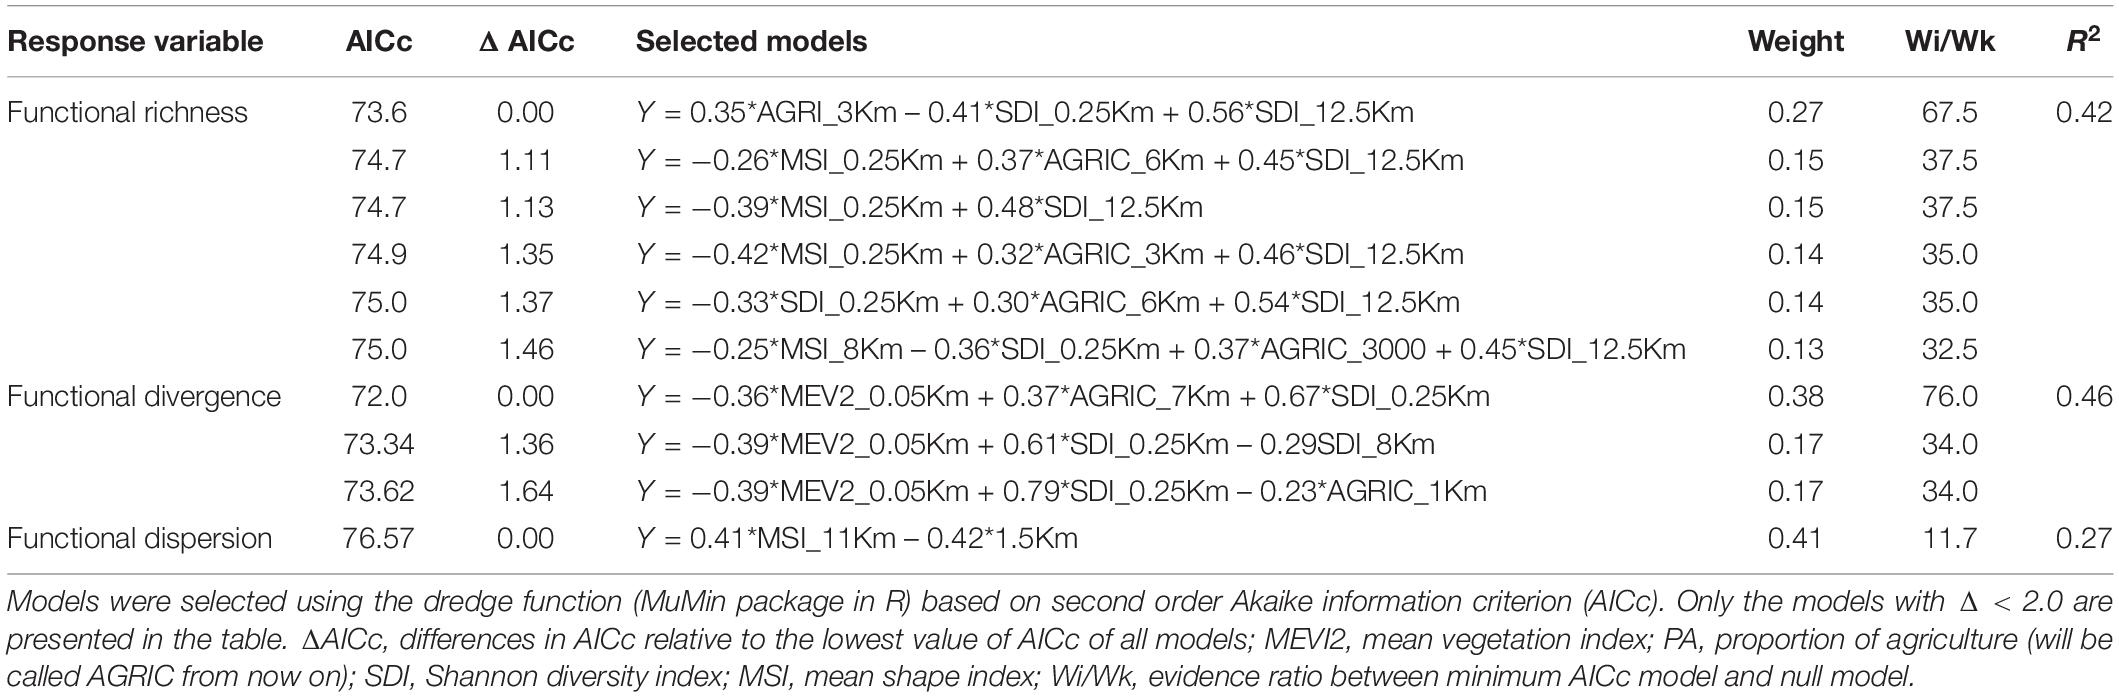
Table 2. Overview of minimal adequate models describing landscape and local effects on functional richness, functional divergence, and functional dispersion of bees in agricultural landscape.
Results
By using the combination of active and passive sampling methods, we collected a total of 2825 bee individuals from 125 species (families Apidae, Halictidae, Andrenidae, and Megachilidae). The most abundant species were Apis mellifera Linnaeus, 1758 (1454 individuals); Trigona spinipes (Fabricius, 1793) (306 individuals); Lasioglossum sp. (78 individuals); Geotrigona sp. (78 individuals); Bombus brevivillus Franklin, 1913 (59 individuals); Augochlora sp. (51 individuals); Augochlorella sp. (44 individuals); and Melipona quinquefasciata Lepeletier, 1836 (42 individuals).
Functional Richness
Functional richness indicates how much of a multi-trait space is occupied by a sample of species from a biological community. It is a good predictor of environmental filters, indicating whether there is any threshold imposed by the investigated environmental gradient (Mouchet et al., 2010). The best model combines the positive effects of the proportion of agriculture and negative effects of landscape compositional heterogeneity (SDI) at the proximal level with the positive effect of the landscape compositional heterogeneity at the broad level (Figure 2 and Table 2, R2 = 0.42). The volume occupied in a community of bees considering a multi-trait space is strongly dependent on the diversity of land cover types at broad spatial scales. The other five models in the set can be considered as equally plausible (ΔAICc < 2) and include models with other variables besides those appearing in the best model. The models that presented the proportion of agriculture in both scales pointed to a positive association of this predictor with functional richness. The structural complexity of the landscape had a negative influence on the functional richness regardless of spatial scale (Table 2). However, the only variable that was present in the set of the equally plausible models was the landscape compositional heterogeneity at the broad level with a consistent positive effect on the functional richness and which was, by far, the most important explanatory variable [SDI (w + j) = 73%] (Figure 3).
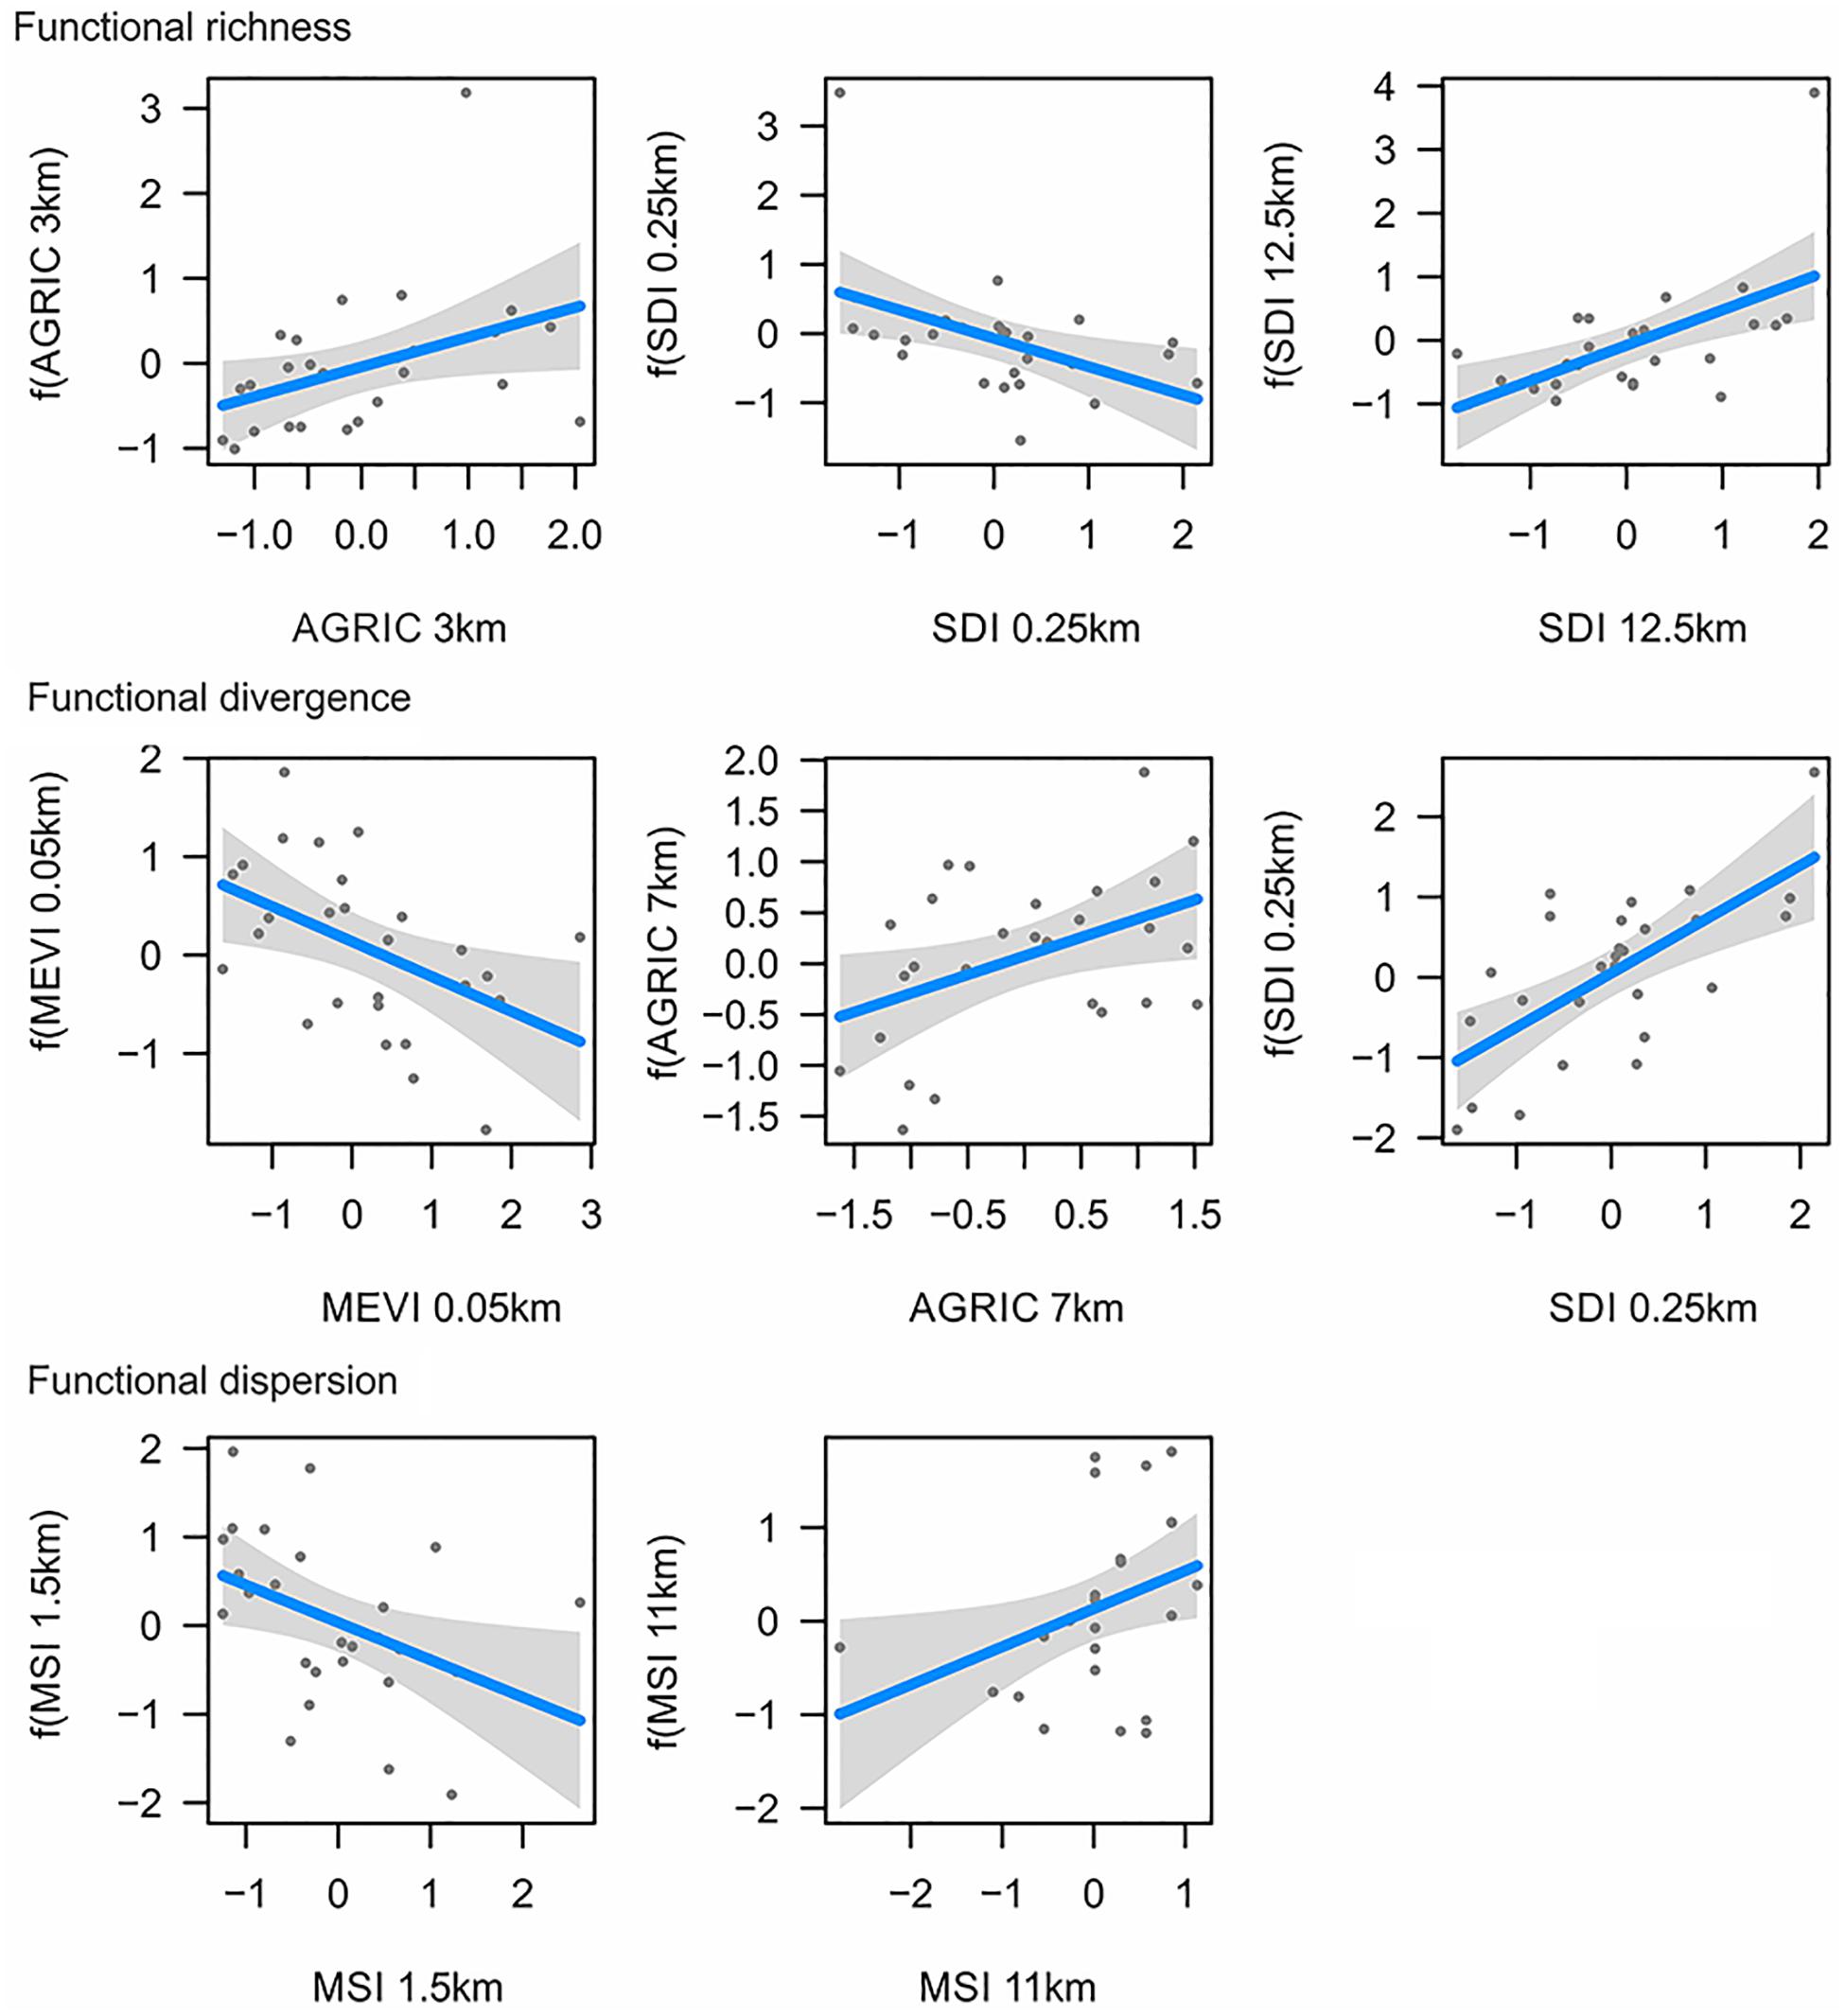
Figure 2. Influence of landscape and local vegetation descriptors on bee functional richness, functional divergence, and functional dispersion in the agricultural region at Mucuge-Ibicoara, Chapada Diamantina, Bahia, Brazil. The numbers in parentheses indicate the best spatial scale for landscape variables. Shaded areas indicate confidence interval at level 95% for the predicted values.
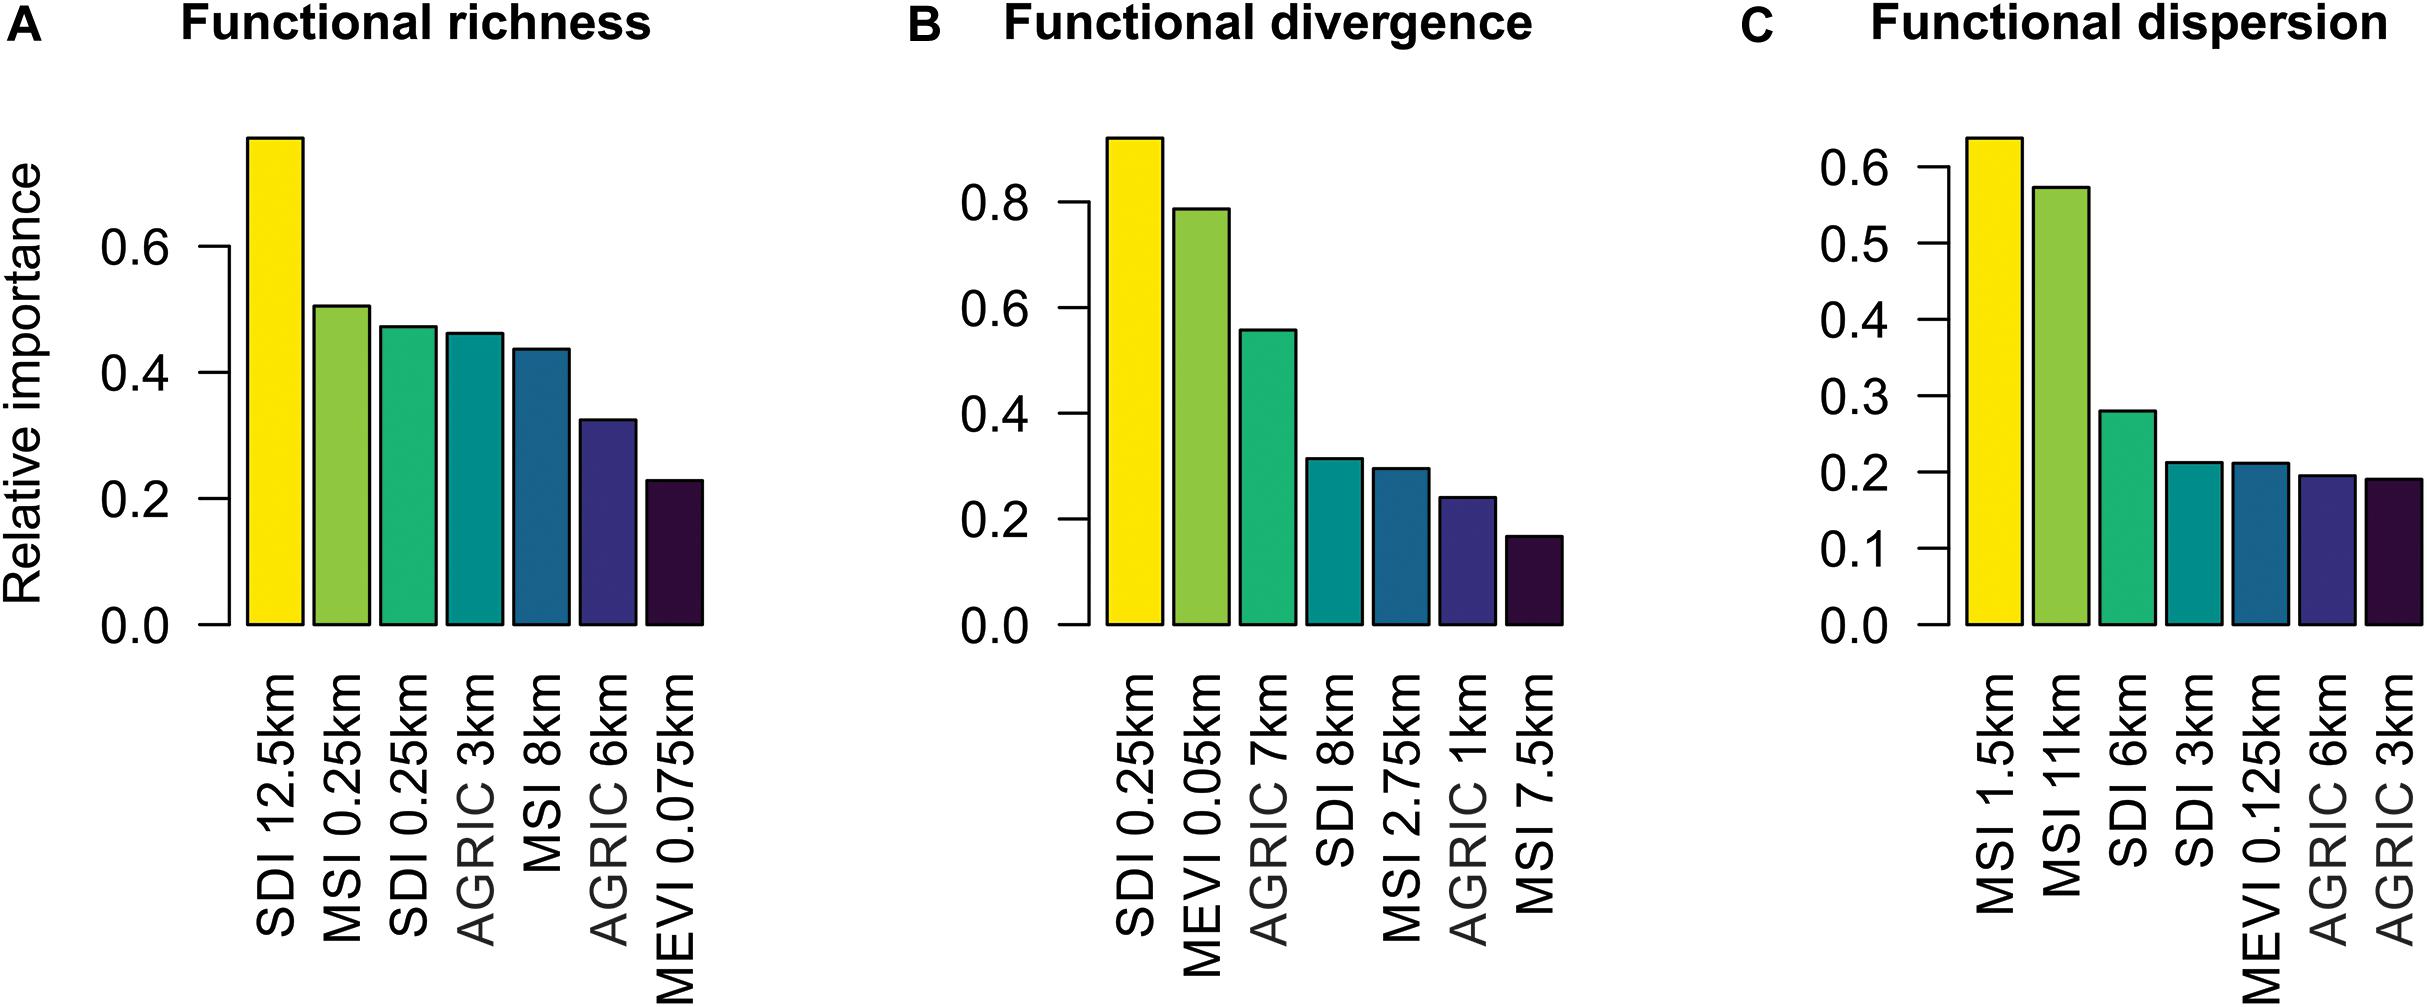
Figure 3. Relative importance of environmental predictors on functional richness (A), divergence (B), and functional dispersion (C). The relative importance is the sum of the Akaike information criterion weights of the models with each predictor. Shannon Diversity Index (SDI) was the best predictor for richness and functional divergence but in different spatial scales. Mean shape index (MSI) was the best predictor of functional dispersion at the proximal landscape level. The numbers associated with predictors represent the spatial scale with the highest R2 value. MEVI2, mean vegetation index; AGRIC, proportion of agriculture.
Functional Divergence
Functional divergence indicates how far the species in a community distance themselves from the more functionally redundant species in that community. The best of the three models combines predictors in different spatial scales: MEVI2 (in the spatial scale of 50 m), the proportion of agriculture (at the broad landscape level), and landscape diversity (at the proximal landscape level; R2 = 0.46). In all three models, the diversity of the landscape at the proximal landscape level showed a positive relationship with the functional divergence (Figure 2 and Table 2). The opposite trend was seen in the local scale, where MEVI2 (spatial scale of 50 m) was present in all the selected models, showing a negative relation with functional divergence (Table 2). The proportion of agriculture at the broad landscape level showed a positive relationship with the functional divergence in one of the three best models. On the other hand, the structural complexity (MSI) at the proximal landscape level and the proportion of agriculture at this same scale were present in only one model and presented a negative relationship with functional divergence. The evaluation of the predictors’ relative importance indicated the landscape diversity at the proximal landscape level as the most important predictor of functional divergence (Figure 3) (SDI = 90%).
Functional Dispersion
Functional dispersion captures the average distance between species based on their functional attributes and relative abundance in a multidimensional space. In this way, this metric quantifies the breadth of functional roles across species, and on average, systems with species pools representing higher dispersion should display greater functional dissimilarity and a broader range of responses to environmental perturbations (Mouchet et al., 2010; Laliberté et al., 2013). For functional dispersion, the clearest pattern observed was that landscape structural complexity (MSI) showed an opposite trend when distinct spatial scales were considered: a positive relation at the broad landscape level and a negative relation at the proximal landscape level. The best model combined effects of landscape structural complexity in both spatial levels (Figure 2 and Table 2, R2 = 0.27). The evaluation of the relative importance of the predictors indicated the landscape structural complexity at the proximal landscape level was the most important predictor of functional dispersion (MSI = 45%) (Figure 3).
Discussion
In general, our results indicate that landscape compositional and configurational heterogeneity are major predictors of three important and complementary properties of bee FD in agricultural landscapes: functional richness, functional divergence, and functional dispersion. However, the effects of these predictors on the response variables are dependent on the spatial scale. The observed patterns were distinct among the FD descriptors, indicating that different processes must regulate these three properties.
Functional Richness
Functional richness had a positive association with landscape diversity at the broad landscape level (Figure 2 and Table 2). This result may indicate that the variety of elements in the landscape, on a broad scale, can serve as a source of species with the diversity of traits that occupy new regions in the functional trait space. This may indicate that the premise of the mass effect model can be applied on a broad scale. Landscape diversity is an essential predictor of bee species richness (Steffan-Dewenter et al., 2002; Williams et al., 2010; Murray et al., 2012). More heterogeneous landscapes can safeguard species with different requirements in terms of habitat use, providing various floral and nesting resources over space and time (Kennedy et al., 2013). However, when this effect is dependent on the spatial scale, other mechanisms besides landscape complementation come into play, and more detailed mechanistic explanations are necessary.
More heterogeneous or diverse landscapes may present an additional discontinuity of specific soil cover types, increasing the range of trophic and non-trophic resources available (Okuyama et al., 2008; Zurbuchen et al., 2010). This scenario may favor species with different combinations of response and effect traits, increasing the functional volume occupied by a community of bees. Suppose this positive relationship is occurring at broader spatial scales. In that case, these more diverse landscapes may contribute to a large volume of response and effect traits that serves as a source for less diverse regions (Leibold et al., 2004). This critical spatial dynamic avoids local extinctions when we consider taxonomic diversity (Kuussaari et al., 2009; Metzger et al., 2009) and may increase the chances of retaining certain combinations of functional traits in local communities by considering a multi-trait approach. The assumptions deriving from species sorting (gradients influencing the species distribution) and mass effect (heterogeneous landscapes as sources for areas with less diversity) can be verified with the observed pattern toward functional richness (Urban et al., 2008; Tscharntke et al., 2012). In this way, the volume of the multi-trait space occupied by bee communities at the local level may be a subset of what is available at broader spatial scales when there is evident heterogeneity at these scales (Loreau et al., 2003). The proportion of agriculture had a positive effect on functional richness when this effect was combined with an increase in landscape diversity (Figure 2 and Table 2). This result can be explained given the additional supply of resources that agricultural areas may offer in diverse environments (Coutinho et al., 2020), attracting species with different combinations of functional traits.
At the proximal landscape level, the trend associated with landscape diversity was opposite to that found at the broad level. This pattern may be related to a phenomenon named the ‘area-heterogeneity trade-off’ (Kadmon and Allouche, 2007; Allouche et al., 2012). According to this mechanism, the niche width of the species is not unlimited. An increase in the environmental heterogeneity within a fixed space may reduce the average amount of effective area of use of a given species. Thus, we must explain the observed differences in responses to landscape heterogeneity for different species groups. Wide- and narrow-ranging species represent differences in habitat breadth: generalist species, mainly in trophic resources, tend to be wide-ranging, whereas specialist species tend to be narrow-ranging (Katayama et al., 2014). In a study with birds, Katayama et al. (2014) found a negative impact of landscape heterogeneity on species richness with narrow diet breadth. However, this richness was positively associated with open areas and low forest cover. For example, in our study, open areas, such as Savannah Park, can provide many resources for oligolectic species that nest in the ground. These bees may not benefit from very heterogeneous environments with different land cover types. Thus, although heterogeneity is positively associated with species richness, this relationship must be scale-dependent. Thus, when we refer to the functional richness, mechanisms that operate in fine scales should be approached. At the proximal scale, the increase in heterogeneity may favor the occupation of a volume of functional traits with more generalist species using the available resources.
Functional Divergence
The most plausible models include a negative association of vegetation’s structural complexity at the local scale as well as a positive effect of landscape diversity at the proximal scale and PA at the broad scale (Figure 2 and Table 2). The structural complexity of vegetation at the local scale was a good surrogate measure for the number of branches and plant richness of savannah physiognomies in the studied region (Moreira et al., 2015). This negative association can be explained by the fact that a site with high plant richness can be associated with high resource availability, which favors the occurrence of the community’s dominant species.
Generalist species tend to be the most abundant, and this condition places great weight on these species when we consider the asymmetry of plant–pollinator interaction networks concerning the less abundant species (Stang et al., 2007; Moreira et al., 2015; Ferreira et al., 2020) for example. Similarly, the most abundant species in our study share a core of response traits, which favors the high weight of these species in decreasing the functional divergence. About 62% of the total abundance of bees was shared between the species Apis mellifera and Trigona spinipes. Both species are social, polylectic, and above-ground nesting and with a short proboscis (Viana and Kleinert, 2005) and are able to thrive in environments that provide a high supply of resources (high plant richness) and structural complexity of the vegetation for nesting. The PA positively influenced the functional divergence at the broad spatial scale when combined with the diversity of the landscape at the proximal scale. Many species can survive in agricultural areas mainly because of the potential supply of trophic resources. When these areas are associated with more heterogeneous environments, these environments can attract species with contrasting traits. In this sense, more diverse areas inserted in regions with a large proportion of agriculture promote rescue effects on functional traits (Brown and Kodric-Brown, 1977).
Positive association between functional divergence and landscape diversity at the proximal landscape level can be explained by the fact that the increase in landscape heterogeneity increases the probability of variation in the spatiotemporal supply of trophic and non-trophic resources (Parrish and Bazzazz, 1979). In a functional perspective, more heterogeneous environments should increase productivity (number of offspring) of species with different response traits (Fahrig et al., 2011) because of the wide offer of trophic and non-trophic resources. Thus, for species that occupy the functional volume of traits in a community, the increase in the diversity of resources should favor the increase of the functional divergence in the multi-trait space.
Functional Dispersion
Functional dispersion was favored with increased structural complexity of the landscape at the broad landscape level, but this trend was opposite at the proximal landscape level. Recent findings in the literature have found differences in functional dispersion when comparing intensively managed agricultural systems with less managed areas, indicating that less managed areas are important to maintain high functional dispersion (Forrest et al., 2015). However, our study provides strong evidence of the role of landscape configuration in the functional dispersion of bees in agroecosystems.
The positive association between the functional dispersion with the mean shape index and the broad landscape scale can provide support to the mass effect model, indicating that dispersion plays an important role in the range of traits present in an agroecosystem. In parallel, as this index reflects the degree of irregularity of landscape elements and how much interspersion between them exists, this result also highlights the importance of functional connectivity between these elements (Boscolo et al., 2017). However, this relation is valid only in wider spatial scales, indicating that there is an important trade-off between scales that must be carefully evaluated.
The increase in structural complexity to the proximal landscape scale has been negatively associated with functional dispersion. This finding can be explained by the functional identities of the species that are favored with increasing structural complexity at this spatial scale. At the proximal scale, a high flux of organisms through the landscape can lead to a homogenization of the community from a taxonomic perspective (Mouquet and Loreau, 2002). We can extrapolate this effect by analyzing functional traits, which may contribute to increase the functional redundancy of the system as an effect exerted mainly by the most dominant species in the system, which form a cluster of traits, as explored above.
Our integrated approach between response and effect traits can be a useful tool to predict the impacts of land use on the pollination services in heterogeneous agricultural environments. We have evidence that divergence and the functional dispersion are indexes that depend on species abundance and were influenced by two dominant species, T. spinipes and A. mellifera. Both species are generalists with T. spinipes having a wide distribution and inhabiting diverse habitats, among which we can cite the “Cerrado” (neotropical savannah) and tropical forests throughout South America (Schwarz, 1948; Roubik, 1989). T. spinipes was the second most frequent floral visitor in native flowers in the sampled region, but this does not imply the delivery of efficient pollination. Similarly, Apis mellifera was the most abundant visitor in the region (46.4% of total recorded visits) but may also not be efficient in pollinating all plant species. Thus, pollinator identity should be considered carefully before providing information on FD in agricultural landscapes.
In a study with 41 crops worldwide, Garibaldi et al. (2013) show that the fruit set increased significantly with the visitation of Apis mellifera in only 14% of cultivated plant varieties. The authors verified that the rates of visitation by Apis and wild insects promote the increase in the fruit set independently and that high abundances of A. mellifera have a complementary effect but do not substitute for the role played by the native bees in the pollination of these crops. Viana et al. (2014) verified in the same study region of our study that the stingless bee Melipona quadrifasciata anthidioides (Lepeletier) could improve honeybee performance as pollinators of apple flowers because the presence of both of these bees results in increases in apple fruit and seed number. These studies point to the complementarity of responses and effect traits as a promising way to increase pollination success for wild and cultivated plants.
Here, the inclusion of effect traits and response traits on the functional classification of bee species can help us identify response and effect groups that maximize divergence and functional dispersion. This strategy presupposes identifying the factors that would contribute to increasing the chances of persistence of these species as well as the increase in the number of individuals of their populations.
Note that, at the proximal landscape level, functional richness has a negative association with landscape heterogeneity, but this relationship is positive with functional divergence, indicating a clear trade-off. However, this aspect should not be a problem if the landscapes are planned in a hybrid perspective (Ekroos et al., 2016) with multiple forms of habitat use, including open areas and dense vegetation, with different degrees of irregularity among the elements that compose this landscape. Thus, if functional richness is not favored in specific regions of this landscape, other areas (lower heterogeneity in some regions of the landscape) may serve to increase this richness. Most importantly, the design of this landscape is expected to increase the flux of organisms with distinct and complementary traits, which may increase the probability of delivering pollen between crops and wild vegetation.
Conclusion
Our study points to the influence of landscape descriptors on important properties of the FD of bees in agroecosystems in the tropical zone. Our results indicate that both the sorting species and mass effect models have empirical support in our study. Both the characteristics of the landscape composition (sorting species) and the irregularity of the landscape elements, which influence the displacement of the species (mass effect model), are important factors that influence FD. The indexes used describe different aspects of FD and point to the complementarity of properties that must be considered when planning agricultural landscapes. Maintaining compositional and configurational heterogeneity is a promising way to enhance FD (Supplementary Figure 3). However, the effects of these predictors are scale-dependent. This fact highlights the importance of considering hybrid management systems at multiple spatial scales (Kennedy et al., 2013; Moreira et al., 2015) that contemplate multiple states of landscape composition and configuration, favoring different dimensions of bee FD.
Besides our approach, considering the set of response and effect traits can contribute to the delineation of response and effect groups in a less arbitrary manner, arbitrariness that has been criticized in the literature (Mason et al., 2005; Petchey and Gaston, 2006; Bartomeus et al., 2018). The identification of the species that most contribute to the reduction of divergence and functional dispersion provides the possibility to back and evaluate which traits are shared by these most abundant species and which traits are disadvantaged in certain contexts, indicating more or less sensitive species groups to certain landscape composition and configuration.
Data Availability Statement
The datasets presented in this study can be found in online repositories. The names of the repository/repositories and accession number(s) can be found below: https://datadryad.org/stash/dataset/, 10.5061/dryad.n5tb2rbtn.
Author Contributions
JC, EM, DB, RS, and BV conceived the ideas and designed methodology, collected the data, analyzed the data, and led the writing of the manuscript. JC, JH, DB, RS, and EM contributed to the writing and manuscript revision. All authors contributed critically to the drafts and gave final approval for publication.
Funding
This research was supported by CNPq (Grant Number: 556050/2009-6) and the GEF/FAO/UNEP Global Environment Facility (GEF), the Food and Agriculture Organization of the United Nations (FAO), the United Nations Environment Programme (UNEP), the Brazilian Environment Ministry (MMA) and the “Fundo Brasileiro para a Biodiversidade” (FUNBIO). This study was financed in part by the Coordenação de Aperfeiçoamento de Pessoal de Nível Superior - Brasil (Capes) - Finance Code 001.
Conflict of Interest
The authors declare that the research was conducted in the absence of any commercial or financial relationships that could be construed as a potential conflict of interest.
Supplementary Material
The Supplementary Material for this article can be found online at: https://www.frontiersin.org/articles/10.3389/fevo.2021.624835/full#supplementary-material
Supplementary Figure 1 | Scheme of a sampling unit hexagon and movement of the collectors during sampling; yellow circles represent the flagged polyethylene pipes used for marking the limits of the hexagons; arrows and numbers represent the trajectory and the sequence of motion, respectively, of the two collectors, who are identified by the colors red and blue; A–F: Sequence of movements conducted by the collectors during the sampling, covering all sides of the triangles that formed the hexagons. Extracted from Moreira et al. (2015).
Supplementary Figure 2 | Scheme representing the collection with pan traps in a mosaic of agricultural and natural physiognomies, Chapada Diamantina, Bahia, Brazil. The vertices of the smaller triangles indicate the position of each pan trap. Central point sampling indicates the point of reference for choosing the points that represented the agricultural proportion gradient; landscape diversity and structural complexity (see text for details).
Supplementary Figure 3 | General overview of the main conclusions of this study. Functional diversity is the result of filters operating at different spatial scales. Functional richness is benefited by the diversity of the landscape at the broad landscape level and less diverse landscapes at the proximal landscape level, which increases the volume occupied by the species in a multi-trait space. Functional divergence benefits from more diverse landscapes at the proximal landscape level and a lesser structural complexity of vegetation on the local scale. Finally, functional dispersion benefits from the structural complexity of the landscape at the broad landscape level and from a lower structural complexity to the proximal landscape level, which shifts the centroid from a multi-trait space to more extreme values of that space. Only the descriptors with the highest relative importance are shown.
References
Aiba, M., Takafumi, H., and Hiura, T. (2012). Interspecific differences in determinants of plant species distribution and the relationships with functional traits. J. Ecol. 100, 950–957. doi: 10.1111/j.1365-2745.2012.01959.x
Allouche, O., Kalyuzhny, M., Moreno-Ruega, G., Pizarro, M., and Kadmon, R. (2012). Rea heterogeneity tradeoff and the diversity of ecological communities. Proc. Natl. Acad. Sci. U.S.A. 109, 17495–17500.
Almeida, E. A. B. (2008). Revision of the brazilian species of pseudaugochlora Michener 1954 (Hymenoptera: Halictidae: Augochlorini). Zootaxa 1679, 1–38.
Banaszak-Cibicka, W., and Zmihorski, M. (2012). Wild bees along an urban gradient: winners and losers. J. Insect. Conserv. 16, 331–343.
Bartomeus, I., Cariveau, D. P., Harrison, T., and Winfree, R. (2018). On the inconsistency of pollinator species traits for predicting either response to land-use change or functional contribution. Oikos 127, 306–315.
Becher, M. A., Osborne, J. L., Thorbek, P., Kennedy, P. J., and Grimm, V. (2013). Towards a systems approach for understanding honeybee decline: a stocktaking and synthesis of existing models. J. Appl. Ecol. 50, 868–880.
Biswas, S. R., Mallik, A. U., Braithwaite, N. T., and Wagner, H. H. (2016). A conceptual framework for the spatial analysis of functional trait diversity. Oikos 125, 192–200. doi: 10.1111/oik.02277
Boscolo, D., Tokumoto, P. M., Ferreira, P. A., Ribeiro, J. W., and dos Santos, J. S. (2017). Positive responses of flower visiting bees to landscape heterogeneity depend on functional connectivity levels. Perspect. Ecol. Conserv. 15, 18–24. doi: 10.1016/j.pecon.2017.03.002
Botta-Dukát, Z. (2005). Rao’s quadratic entropy as a measure of functional diversity based on multiple traits. J. Veg. Sci. 16, 533–540.
Brown, J. H., and Kodric-Brown, A. (1977). Turnover rates in insular biogeography: effect of immigration on extinction. Ecology 58, 445–449.
Cadotte, M. W., Carscadden, K., and Mirotchnick, N. (2011). Beyond species: functional diversity and the maintenance of ecological processes and services. J. Appl. Ecol. 48, 1079–1087. doi: 10.1111/j.1365-2664.2011.02048.x
Cameron, S. A., Lozier, J. D., Strange, J. P., Koch, J. B., Cordesa, N., Solter, L. F., et al. (2011). Patterns of widespread decline in North American bumble bees. PNAS 108, 662–666.
Cane, J. H., Minckley, R. L., and Kervin, L. J. (2000). Sampling bees (Hymenoptera: Apiformes) for pollinator community studies: pitfalls of pan-trapping. J. Kan Entomol. Soc. 73, 225–231.
Chase, J. M. (2014). Spatial scale resolves the niche versus neutral theory debate. J. Veg. Sci. 25, 319–322.
Cisneros, L. M., Fagan, M. E., and Willig, M. R. (2016). Environmental and spatial drivers of taxonomic, functional, and phylogenetic characteristics of bat communities in human-modified landscapes. Peer J. 4:e2551. doi: 10.7717/peerj.2551
Coutinho, J. G. E., Angel-Coca, C., Boscolo, D., and Viana, B. F. (2020). Heterogeneous agroecosystems support high diversity and abundance of trap-nesting bees and wasps among tropical crops. Biotropica 52, 991–1004.
Coutinho, J. G. E., Garibaldi, L. A., and Viana, B. F. (2018). The influence of local and landscape scale on single response traits in bees: a meta-analysis. Agr. Ecosyst. Environ. 256, 61–73.
Díaz, S., Lavorel, S., Chapin, F. S. III, Tecco, P. A., Gurvich, D. E., and Grigulis, K. (2007). “Functional diversity – at the crossroads between ecosystem functioning and environmental filters,” in Terrestrial Ecosystems in a Changing World, eds J. G. Canadell, D. Pataki, and L. Pitelka (Berlin: Springer-Verlag), 81–90.
Díaz, S., Symstad, A. J., Stuart Chapin, F., Wardle, D. A., and Huenneke, L. F. (2003). Functional diversity revealed by removal experiments. Trends Ecol. Evol. 18, 140–146.
Dupont, Y. L., Damgaard, C., and Simonsen, V. (2011). Quantitative historical change in bumblebee (Bombus spp.) assemblages of red clover fields. PLoS One 6:e25172. doi: 10.1371/journal.pone.0025172
Ekroos, J., Ödman, A. M., Andersson, G. K. S., Birkhofer, K., Herbertsson, L., Klatt, B. K., et al. (2016). Sparing land for biodiversity at multiple spatial scales. Front. Ecol. Evol. 3:145. doi: 10.3389/fevo.2015.00145
Eviner, V. T., and Chapin, F. S. I. I. I. (2003). Gopher-plant-fungal interactions affect establishment of an invasive grass. Ecology 84, 120–128.
Fahrig, L. (2013). Rethinking patch size and isolation effects: the habitat amount hypothesis. J. Biogeogr. 40, 1649–1663. doi: 10.1111/jbi.12130
Fahrig, L., Baudry, J., Brotons, L., Burel, F. G., Crist, T. O., Fuller, R. J., et al. (2011). Functional landscape heterogeneity and animal biodiversity in agricultural landscapes. Ecol. Lett. 14, 101–112.
Ferreira, P. A., Boscolo, D., Lopes, L. E., Carvalheiro, L. G., Biesmeijer, J. C., Rocha, P. L. B., et al. (2020). Forest and connectivity loss simplify tropical pollination networks. Oecologia 192, 577–590.
Flinn, K., Gouhier, T., Lechowicz, M., and Waterway, M. (2010). The role of dispersal in shaping plant community composition of wetlands within an old growth forest. J. Ecol. 98, 1292–1299.
Forrest, J. R. K., Thorp, R. W., Kremen, C., and Williams, N. M. (2015). Contrasting patterns in species and functional-trait diversity of bees in an agricultural landscape. J. Appl. Ecol. 52, 706–715. doi: 10.1111/1365-2664.12433
Garibaldi, L. A., Steffan-Dewenter, I., Winfree, R., Aizen, M. A., Bommarco, R., Cunningham, S. A., et al. (2013). Wild pollinators enhance fruit set of crops regardless of honey bee abundance. Science 339, 1608–1611. doi: 10.1126/science.1230200
Girão, L. C., Lopes, A. V., Tabarelli, M., and Bruna, E. M. (2007). Changes in tree reproductive traits reduce functional diversity in a fragmented Atlantic Forest landscape. PLoS One 2:e908. doi: 10.1371/journal.pone.0000908
Greenleaf, S. S., Williams, N. M., Winfree, R., and Kremen, C. (2007). Bee foraging ranges and their relationship to body size. Oecologia 153, 589–596.
Hipólito, J., Boscolo, D., and Viana, B. F. (2018). Landscape and crop management strategies to conserve pollination services and increase yields in tropical coffee farms. Agr. Ecosyst. Environ. 256, 218–225. doi: 10.1016/j.agee.2017.09.038
Holzschuh, A., Steffan-Dewenter, I., and Tscharntke, T. (2010). How do landscape composition and configuration, organic farming and fallow strips affect the diversity of bees, wasps and their parasitoids? J. Anim. Ecol. 79, 491–500. doi: 10.1111/j.1365-2656.2009.01642.x
Hooper, D. U., Solan, M., Symstad, A. J., Díaz, S., Gessner, M. O., Buchmann, N., et al. (2002). “Species diversity, functional diversity and ecosystem functioning,” in Biodiversity and Ecosystem Functioning: Syntheses and Perspectives, eds M. Loreau, S. Naeem, and P. Inchausti (Oxford: Oxford University Press), 195–208.
Kadmon, R., and Allouche, O. (2007). Integrating the effects of area, isolation, and habitat heterogeneity on species diversity: a unification of island biogeography and niche theory. Am. Nat. 170, 443–454.
Katayama, N., Amano, T., Naoe, S., Yamakita, T., Komatsu, I., Takagawa, S., et al. (2014). Landscape heterogeneity-biodiversity relationship: effect of range size. PLoS One 9:e93359. doi: 10.1371/journal.pone.0093359
Kennedy, C. M., Lonsdorf, E., Neel, M. C., Williams, N. M., Ricketts, T. H., Winfree, R., et al. (2013). A global quantitative synthesis of local and landscape effects on wild bee pollinators in agroecosystems. Ecol. Lett. 16, 584–599.
Klein, A.-M., Vaissière, B. E., Cane, J. H., Steffan-Dewenter, I., Cunningham, S. A., Kremen, C., et al. (2007). Importance of pollinators in changing landscapes for world crops. Proc. Biol. Sci. 274, 303–313. doi: 10.1098/rspb.2006.3721
Krauss, J., Alfert, T., and Steffan-Dewenter, I. (2009). Habitat area but not habitat age determines wild bee richness in limestone quarries. J. Appl. Ecol. 46, 194–202. doi: 10.1111/j.1365-2664.2008.01582.x
Kremen, C., and M’Gonigle, L. K. (2015). EDITOR’S CHOICE: small-scale restoration in intensive agricultural landscapes supports more specialized and less mobile pollinator species. J. Appl. Ecol. 52, 602–610. doi: 10.1111/1365-2664.12418
Kuussaari, M., Bommarco, R., Heikkinen, R. K., Helm, A., Krauss, J., Lindborg, R., et al. (2009). Extinction debt: a challenge for biodiversity conservation. Trends Ecol. Evol. 24, 564–571.
Laliberté, E., and Legendre, P. (2010). A distance-based framework for measuring functional diversity from multiple traits. Source Ecol. Ecol. 91, 299–305. doi: 10.1890/08-2244.1
Laliberté, E., Legendre, P., and Shipley, B. (2014). FD: Measuring Functional Diversity from Multiple Traits, and Other Tools for Functional Ecology. R Package Version 1.0–12.
Laliberté, E., Norton, D. A., and Scott, D. (2013). Contrasting effects of productivity and disturbance on plant functional diversity at local and metacommunity scales. J. Veg. Sci. 24, 834–842. doi: 10.1111/jvs.12044
Larsen, T. H., Williams, N. M., and Kremen, C. (2005). Extinction order and altered community structure rapidly disrupt ecosystem functioning. Ecol. Lett. 8, 538–547.
Lavorel, S., Grigulis, K., Lamarque, P., Colace, M. P., Garden, G., Girel, J., et al. (2011). Using plant functional traits to understand the landscape distribution of multiple ecosystem services. J. Ecol. 99, 135–147.
Leibold, M. A., Holyoak, M., Mouquet, N., Amarasekare, P., Chase, J. M., Hoopes, M. F., et al. (2004). The metacommunity concept: a framework for multi-scale community ecology. Ecol. Lett. 7, 601–613. doi: 10.1111/j.1461-0248.2004.00608.x
Loreau, M. (2000). Biodiversity and ecosystem functioning: recent theoretical advances. Oikos 91, 3–17.
Loreau, M., Mouquet, N., and Gonzalez, A. (2003). Biodiversity as spatial insurance in heterogeneous landscapes. Proc Nat Acad Sci. U.S.A. 100, 12765–12770.
Martins, K. T., Gonzalez, A., and Lechowicz, M. J. (2015). Pollination services are mediated by bee functional diversity and landscape context. Agric. Ecosyst. Environ. 200, 12–20. doi: 10.1016/j.agee.2014.10.018
Mason, N. W. H., Mouillot, D., Lee, W. G., and Wilson, J. B. (2005). Functional richness, functional evenness and functional divergence: the primary components of functional diversity. Oikos 111, 112–118.
McGarigal, K., Cushman, S., and Ene, E. (2012). FRAGSTATS v4: Spatial Pattern Analysis Program for Categorical and Continuous Maps. Massachusetts, MA: Comput. Softw. Progr. Prod. by authors Univ.
Menezes, G. B., Gonçalves-Esteves, V., Bastos, E. M. A. F., Augusto, S. C., and Gaglianone, M. C. (2012). Nesting and use of pollen resources by Tetrapedia diversipes Klug (Apidae) in Atlantic Forest areas (Rio de Janeiro, Brazil) in different stages of regeneration. Rev. Bras. Entomol. 56, 86–94.
Metzger, J. P., Martensen, A. C., Dixo, M., Bernacci, L. C., Ribeiro, M. C., Teixeira, A. M. G., et al. (2009). Time-lag in biological responses to landscape changes in a highly dynamic Atlantic forest region. Biol. Conserv. 142, 1166–1177.
Moreira, E. F., Boscolo, D., and Viana, B. F. (2015). Spatial heterogeneity regulates plant-pollinator networks across multiple landscape scales. PLoS One 10:e0123628.
Motzke, I., Klein, A. M., Saleh, S., Wanger, T. C., and Tscharntke, T. (2016). Habitat management on multiple spatial scales can enhance bee pollination and crop yield in tropical homegardens. Agric. Ecosyst. Environ. 223, 144–151.
Mouchet, M. A., Villéger, S., Mason, N. W. H., and Mouillot, D. (2010). Functional diversity measures: an overview of their redundancy and their ability to discriminate community assembly rules. Func. Ecol. 24, 867–876.
Mouquet, N., and Loreau, M. (2002). Coexistence in metacommunities: the regional similarity hypothesis. Am. Nat. 159, 420–426.
Murray, T. E., Fitzpatrick, U., Byrne, A., Fealy, R., Brown, M. J. F., and Paxton, R. J. (2012). Local-scale factors structure wild bee communities in protected areas. J. Appl. Ecol. 49, 998–1008.
Okuyama, T., Holland, J. N., and Letters, E. (2008). Network structural properties mediate the stability of mutualistic communities. Ecol Lett. 11, 208–216.
Ollerton, J., Winfree, R., and Tarrant, S. (2011). How many flowering plants are pollinated by animals? Oikos 120, 321–326. doi: 10.1111/j.1600-0706.2010.18644.x
Oliver, T. H., Heard, M. S., Isaac, N. J. B., Roy, D. B., Procter, D., Eigenbrod, F., et al. (2015). Biodiversity and resilience of ecosystem functions. Trends Ecol. Evol. 30, 673–684. doi: 10.1016/j.tree.2015.08.009
Parrish, J. A. D., and Bazzazz, F. A. (1979). Difference in pollination niche relationships in early and late successional plant communities. Ecology 60, 597–610.
Paula, G. A. R. (2014). Assembleias de Abelhas Sob a Perspectiva Funcional. Tese de doutorado, Universidade Federal do Paraná, Curitiba.
Peres-Neto, P.-R., Leibold, M., and Dray, S. (2012). Assessing the effects of spatial contingency and environmental filtering on metacommunity phylogenetics. Ecology 93, 14–30. doi: 10.1890/11-0494.1
Petchey, O. L., and Gaston, K. J. (2006). Functional diversity: back to basics and looking forward. Ecol. Lett. 9, 741–758. doi: 10.1111/j.1461-0248.2006.00924.x
R Core Team (2018). R: A Language and Environment for Statistical Computing. Vienna: R Foundation for Statistical Computing.
Ricketts, T. H., Regetz, J., Steffan-Dewenter, I., Cunningham, S. A., Kremen, C., Bogdanski, A., et al. (2008). Landscape effects on crop pollination services: are there general patterns? Ecol. Lett. 11, 499–515. doi: 10.1111/j.1461-0248.2008.01157.x
Roubik, D. W. (1989). Ecology and Natural History of Tropical Bees. Cambridge: University Press, 514.
Rozen, J. G. Jr. (2001). A taxonomic key to mature larvae of cleptoparasitic bees (Hymenoptera: Apoidea). Amer. Mus. Nov. 3309, 1–28.
Schwarz, H. F. (1948). Stingless bees (Meliponinae) ofthe Western Hemisphere. Bull. Am. Mus. Nat. Dist. 90, 1–546.
Siefert, A., Ravenscroft, C., Weiser, M. D., and Swenson, N. G. (2013). Functional beta-diversity patterns reveal deterministic community assembly processes in eastern North American trees. Glob. Ecol. Biogeogr. 22, 682–691.
Silva, P. G. D., and Hernández, M. I. M. (2015). Scale dependence of processes structuring dung beetle metacommunities using functional diversity and community deconstruction Approaches. PLoS One 10:e0123030. doi: 10.1371/journal.pone.0123030
Sonkoly, J., Kelemen, A., Valkó, O., Deák, B., Kiss, R., Tóth, K., et al. (2019). Both mass ratio effects and community diversity drive biomass production in a grassland experiment. Sci. Rep. 9:1848.
Stang, M., Klinkhamer, P. G. L., and van der Meijden, E. (2007). Asymmetric specialization and extinction risk in plant–flower visitor webs: a matter of morphology or abundance? Oecologia 151, 442–453.
Stavert, J. R., Liñán-Cembrano, G., Beggs, J. R., Howlett, B. G., Pattemore, D. E., and Bartomeus, I. (2016). Hairiness: the missing link between pollinators and pollination. PeerJ. 4:e2779.
Steffan-Dewenter, I., Nzenberg, U. M., Rger, C. B., Thies, C., and Tscharntke, T. (2002). Scale-dependent effects of landscape context on three pollinator guilds. Ecology 83, 1421–1432.
Stein, A., Gerstner, K., and Kreft, H. (2014). Environmental heterogeneity as a universal driver of species richness across taxa, biomes and spatial scales. Ecol. Lett. 17, 866–880.
Stockhammer, K. A. (1966). Nesting habit and life cycle of a sweet bee, Augochlora pura. J. Kansas. Entomol. Soc. 39, 157–192.
Tscharntke, T., Clough, Y., Wanger, T. C., Jackson, L., Motzke, I., Perfecto, I., et al. (2012). Global food security, biodiversity conservation and the future of agricultural intensification. Biol. Conserv. 151, 53–59. doi: 10.1016/j.biocon.2012.01.068
Urban, M. C., Leibold, M. A., Amarasekare, P., De Meester, L., Gomulkiewicz, R., Hochberg, M. E., et al. (2008). The evolutionary ecology of metacommunities. Trends Ecol. Evol. 23, 311–317.
Veloso, H. P., Filho, A. L. R. R., and Lima, J. C. A. (1991). Classificacão da Vegetacão Brasileira, Adaptada a um Sistema Universal. Rio de Janeiro: Fundacão Instituto Brasileiro de Geografia e Estatística.
Viana, B. F., Coutinho, J. G. E., Garibaldi, L. A., Castagnino, G. L. B., Gramacho, K. P., and Silva, F. O. (2014). Stingless bees further improve apple pollination and production. J. Poll. Ecol. 14, 261–269.
Viana, B. F., and Kleinert, A. D. M. P. (2005). A community of flower visiting bees (Hymenoptera: Apoidea) in the coastal sand dunes of northeastern Brazil. Bio Neot. 5, 79–91.
Villéger, S., Mason, N. W. H., and Mouillot, D. (2008). New multidimensional functional diversity indices for a multifaceted framework in functional ecology. Ecology 89, 2290–2301.
Warzecha, D., Diekötter, T., Wolters, V., and Jauker, F. (2016). Intraspecific body size increases with habitat fragmentation in wild bee pollinators. Landsc. Ecol. 31, 1449–1455. doi: 10.1007/s10980-016-0349-y
Williams, N. M., Crone, E. E., Roulston, T. H., Minckley, R. L., Packer, L., and Potts, S. G. (2010). Ecological and life-history traits predict bee species responses to environmental disturbances. Biol. Conserv. 143, 2280–2291. doi: 10.1016/j.biocon.2010.03.024
Wood, S. A., Karp, D. S., DeClerck, F., Kremen, C., Naeem, S., and Palm, C. A. (2015). Functional traits in agriculture: agrobiodiversity and ecosystem services. Trends Ecol. Evol. 30, 531–539. doi: 10.1016/j.tree.2015.06.013
Woodcock, B. A., Garratt, M. P. D., Powney, G. D., Shaw, R. F., Osborne, J. L., Soroka, J., et al. (2019). Meta-analysis reveals that pollinator functional diversity and abundance enhance crop pollination and yield. Nat. Commun. 10:1481.
Zurbuchen, A., Landert, L., Klaiber, J., Müller, A., Hein, S., and Dorn, S. (2010). Maximum foraging ranges in solitary bees: only few individuals have the capability to cover long foraging distances. Biol. Conserv. 143, 669–676.
Keywords: Brazilian landscapes, pollinators, agricultural fields, ecological intensification, functional richness, functional diversity, functional divergence, functional dispersion
Citation: Coutinho JGE, Hipólito J, Santos RLS, Moreira EF, Boscolo D and Viana BF (2021) Landscape Structure Is a Major Driver of Bee Functional Diversity in Crops. Front. Ecol. Evol. 9:624835. doi: 10.3389/fevo.2021.624835
Received: 01 November 2020; Accepted: 22 January 2021;
Published: 02 March 2021.
Edited by:
Sidney F. Gouveia, Federal University of Sergipe, BrazilReviewed by:
Ben Alex Woodcock, UK Centre for Ecology and Hydrology (UKCEH), United KingdomStefan Siebert, North-West University, South Africa
Copyright © 2021 Coutinho, Hipólito, Santos, Moreira, Boscolo and Viana. This is an open-access article distributed under the terms of the Creative Commons Attribution License (CC BY). The use, distribution or reproduction in other forums is permitted, provided the original author(s) and the copyright owner(s) are credited and that the original publication in this journal is cited, in accordance with accepted academic practice. No use, distribution or reproduction is permitted which does not comply with these terms.
*Correspondence: Jeferson G. E. Coutinho, jeferson.gabriel@gmail.com