- 1Faculty of Socio-Environmental Studies, Fukuoka Institute of Technology, Fukuoka, Japan
- 2Graduate School of Sciences and Technology for Innovation, Yamaguchi University, Yamaguchi, Japan
- 3Public Works Research Institute, National Research and Development Agency, Kakamigahara, Japan
The Ayu Plecoglossus altivelis altivelis is an amphidromous fish that is not only the most important commercial fishery species in Japanese rivers but also has a high economic value in recreational fishing. However, the degradation of its spawning grounds has caused a decrease in its abundance. In this study, we used environmental DNA (eDNA) to monitor the Ayu in the Takatsu River in Japan to (1) identify the spawning season in three known spawning grounds, (2) clarify changes in the main spawning grounds during the spawning season, and (3) discover unknown spawning grounds. We collected 1 L of the surface river water at three known spawning grounds nine times in 2018 and seven times in 2019 in the lower reaches of the Takatsu River. We also collected samples from seven unknown sites in 2018. The water samples were filtered through glass fiber filters. Total eDNA was extracted from each filtered sample and a Real-time quantitative PCR was performed with the specific primers and probe for Ayu. The results of the eDNA analyses showed that (1) the spawning season was in November in 2018 and in September in 2019. (2) One site was used as a spawning ground in both the early and the late spawning season, depending on the year. At the second site, the frequency of use changed year by year. The third site was the main spawning ground in the middle to late spawning season every year. From these results, we elucidated that some spawning grounds are used regularly every year, while the use of others varies year by year. (3) In five of the seven unknown sites, the nighttime eDNA concentrations were high at least once during the four surveys, suggesting that these sites may have functioned as spawning grounds. In particular, one site could be an important new spawning ground.
Introduction
The Ayu Plecoglossus altivelis altivelis is an amphidromous fish with a body length of approximately 10–30 cm that inhabits rivers from Japan to Vietnam (Nishida, 2001). The adult fish spawn in the riffles of the lower reaches of rivers from evening to night in fall, and then die after spawning. The eggs adhere to the riverbed and hatch after approximately 10 to 14 days. The larvae migrate downstream to brackish waters and the sea immediately after hatching and live there during the winter. In spring (February to May in western Japan), juveniles migrate upstream and expand their distribution area further upstream as they grow. In fall, they mature and descend downstream to spawn. The Ayu lives for only 1 year (Nishida, 2001).
The Ayu is not only the most important commercial fishery species in Japanese rivers but also has a high economic value in recreational fishing (Takahashi and Azuma, 2006, 2016). However, catches of Ayu have decreased in recent years throughout Japan (Minister of Agriculture, Forestry and Fisheries, 2016), especially in western Japan (Takahashi, 2009). To use Ayu sustainably as a natural resource, it is necessary to understand the dynamics of the populations, appropriate catch limits, the location of suitable habitats for each life stage, and the best times and places for closed seasons.
However, it is not easy to monitor Ayu because they inhabit rapids in summer and migrate to the lower reaches of rivers in the fall, and they are very fast swimmers (Nishida, 2001; Doi et al., 2017). In addition, there are conflicts with commercial and recreational fishermen because the monitoring sites tend to overlap the fishing grounds.
Based on this background, we examined whether environmental DNA (eDNA) could be used for monitoring of Ayu spawning activity. In a previous eDNA study on Ayu, Yamanaka and Minamoto (2016) developed a species-specific primer for Ayu and used the primer to survey the occurrence of Ayu in a year-round eDNA water sampling regime at 15 sites on the Yodo River, Kinki region, Japan. They reported that Ayu DNA was detected at most of the sites in the freshwater area during the warm months. In contrast, in the coldest month of February, eDNA was only detected in the uppermost site (the southern tip of Lake Biwa). Doi et al. (2017) compared the eDNA concentrations of Ayu with the results of daytime snorkeling surveys in seven sites in the Saba River, Chugoku region, Japan. Across the 3 months (May, July, and October), there were significant correlations between the eDNA concentration of Ayu and the species abundance/biomass at study sites within the river.
In this study, we focused on the spawning periods for Ayu, because it has been suggested that the degradation of the spawning grounds (e.g., armor coating of the riverbed owing to dam release) is one of the factors causing the decrease in the abundance of Ayu (Takahashi and Azuma, 2006, 2016). Therefore, for sustainable Ayu stock management, it is important to develop an efficient method for monitoring their spawning grounds and identifying suitable spawning grounds. Another reason is that the “Ochi-ayu fishery” is carried out to collect spawning populations of Ayu near their spawning grounds during the spawning season in many rivers in Japan. If eDNA real time monitoring is feasible in rivers where the Ayu fisheries are conducted, fishermen in each river will know when and where spawning populations are present in real-time and the data can be used to set the appropriate fishing grounds and quotas for each year.
There are several studies using eDNA that focused on fish spawning (e.g., Erickson et al., 2016; Bylemans et al., 2017; Tillotson et al., 2018; Thalinger et al., 2019; Hayer et al., 2020; Yatsuyanagi et al., 2020). Thalinger et al. (2019) and Yatsuyanagi et al. (2020) showed that eDNA concentrations increased because of fish migration into rivers during the spawning season. Erickson et al. (2016); Tillotson et al. (2018), and Hayer et al. (2020) reported that fish spawning behavior in rivers could temporarily increase eDNA concentrations and the spawning behavior could be captured using eDNA. These studies show that eDNA may increase with fish spawning behavior, perhaps because DNA fragments from sperm and dead fish promote a temporary increase in the eDNA concentrations (Bylemans et al., 2017).
Several studies have examined Ayu spawning activity using eDNA. Yamanaka and Minamoto (2016) developed a specific primer for Ayu which all subsequent studies have used. Doi et al. (2017) found higher eDNA concentrations of Ayu in the lower reaches of the Saba River in October than those in May and July possibly owing to the spawning events. Kono et al. (2017) conducted eDNA water sampling during the day in the Takatsu and Saba rivers in the Chugoku region, Japan, six times in May, July, and October-November. These results showed that Ayu moved downstream for spawning in mid-November in both rivers. Inui et al. (2018) conducted eDNA water sampling during the spawning season of Ayu during the daytime and nighttime (3 h after sunset) at four sites: a downstream site near an artificial spawning ground and three control sites (upstream, main river, and downstream) on the Nahari River, Shikoku region, Japan twice in November. Visual diving surveys in the Nahari River over the past decade reported that most of the Ayu spawned in artificial spawning grounds. The results of eDNA analyses showed that the highest eDNA concentrations were found downstream of the artificial spawning grounds at night, and the eDNA concentrations were higher at night compared to the day. In the second half of November (the peak of spawning season), the eDNA concentration at night was 25 times higher than that in the day. Inui et al. (2019) conducted hourly eDNA water sampling from 15:00 to 22:00 on 3 days in November downstream of a site considered to be a major spawning ground in the Saba River. The results showed that the eDNA concentrations increased after sunset on all days, and peaked either 1 h after sunset or 3 h after sunset. Yoshida et al. (2019) conducted a survey of eggs and eDNA analysis (daytime and nighttime) at one known spawning site and two unknown spawning sites on the Asahikawa River, Chugoku region, Japan in October. These results showed that the known spawning sites had the highest eDNA concentrations at night and Ayu eggs were found in all surveys. No eggs were found at unknown sites; however, the eDNA concentrations increased at night in some sites, suggesting the possibility of spawning. Saito et al. (2020) conducted eDNA water sampling eight times from September to December during the day, 1 h after sunset, and 3 h after sunset at six sites in the Takatsu River, Chugoku region, Japan. The results showed that the difference in the eDNA concentrations between 1 h after sunset and 3 h after sunset was small, but in a few sites the concentration was high only 1 h after sunset and decreased by 3 h after sunset. These results indicate that it is possible to check the spawning status both 1 and 3 h after sunset, but 1 h after sunset is ideal. Inui et al. (2020) sampled river water for an Ayu eDNA survey at three sites in the Shimanto River, Shikoku region, Japan and at three sites in the Takatsu River from November to February downstream of the known spawning sites (10 daytime samples in the Shimanto River, nine daytime samples in the Takatsu River, and one nighttime sample in November in both rivers) and measured water temperatures. The results showed that the spawning season was longer in the Shimanto River, which had a higher water temperature in December than the Takatsu River, and the daytime data indicated that the main spawning sites may have changed in both rivers.
These studies showed that the spawning migration of Ayu in rivers can be followed using eDNA. Furthermore, they demonstrated that the eDNA concentrations of Ayu spawning grounds increased at night during the spawning season. Thus, nighttime surveys can reveal the potential spawning grounds, and 1 to 3 h after sunset is an appropriate time for spawning surveys. Results from these methods suggest that Ayu migrate to the lower reaches of rivers in fall, that eDNA can be used to discover unknown spawning grounds, and that the main spawning grounds change during the spawning season. Previously, Kono et al. (2017) and Inui et al. (2020) studied the spawning season, spawning peak, and seasonal spawning grounds of Ayu in the Takatsu River, Chugoku region, Japan; however, these studies were mainly based on daytime sampling and used only a single year of data. In addition, a study searching for unknown spawning grounds was conducted by Yoshida et al. (2019); however, this was based on other rivers in Japan.
In this study, we clarify the generality of the spawning ecology of Ayu in the Takatsu River, Chugoku region, Japan, using daytime and nighttime eDNA data for two consecutive years (2018 and 2019). We aimed to: (1) identify the actual spawning season of Ayu, (2) clarify changes in the main spawning grounds during the spawning season, and (3) discover whether there were unknown spawning grounds.
Materials and Methods
Field Surveys
The field surveys were conducted in the lower reaches of the Takatsu River, which runs through the western part of Shimane Prefecture in Japan (Figure 1). We collected 1 L of the surface river water at three known spawning grounds (Sites 1, 2, and 3), nine times between September and December in 2018, and seven times between September and December in 2019. In addition, we sampled at seven locations (Sites A to G) on October 24, and November 1, 8, and 14 in 2018 to discover unknown spawning grounds. The eDNA water sampling was conducted once during the day (2–5 h before sunset) and once during the night (3–4 h after sunset). Water sampling was conducted at two sampling points (one upstream and one downstream of clear riffles), because Ayu spawn upstream and/or within the riffles. Bottles for the water sampling were bleached with 10% bleach solution and washed with DNA-free deionized water in the laboratory. In the field, 1 mL of 10% benzalkonium chloride solution (Fujifilm Wako, Osaka, Japan) was added to each sample to suppress the degeneration of eDNA before filtering water samples (Yamanaka et al., 2017). The water samples were then transported to the laboratory in a cooler box at 4°C. To check for cross-contamination during sampling, each survey day 1 L of deionized water was taken to the site and 1 mL of 10% benzalkonium chloride solution was added in the field (hereafter called a cooler blank). A total of 16 cooler blanks were created in the present study.
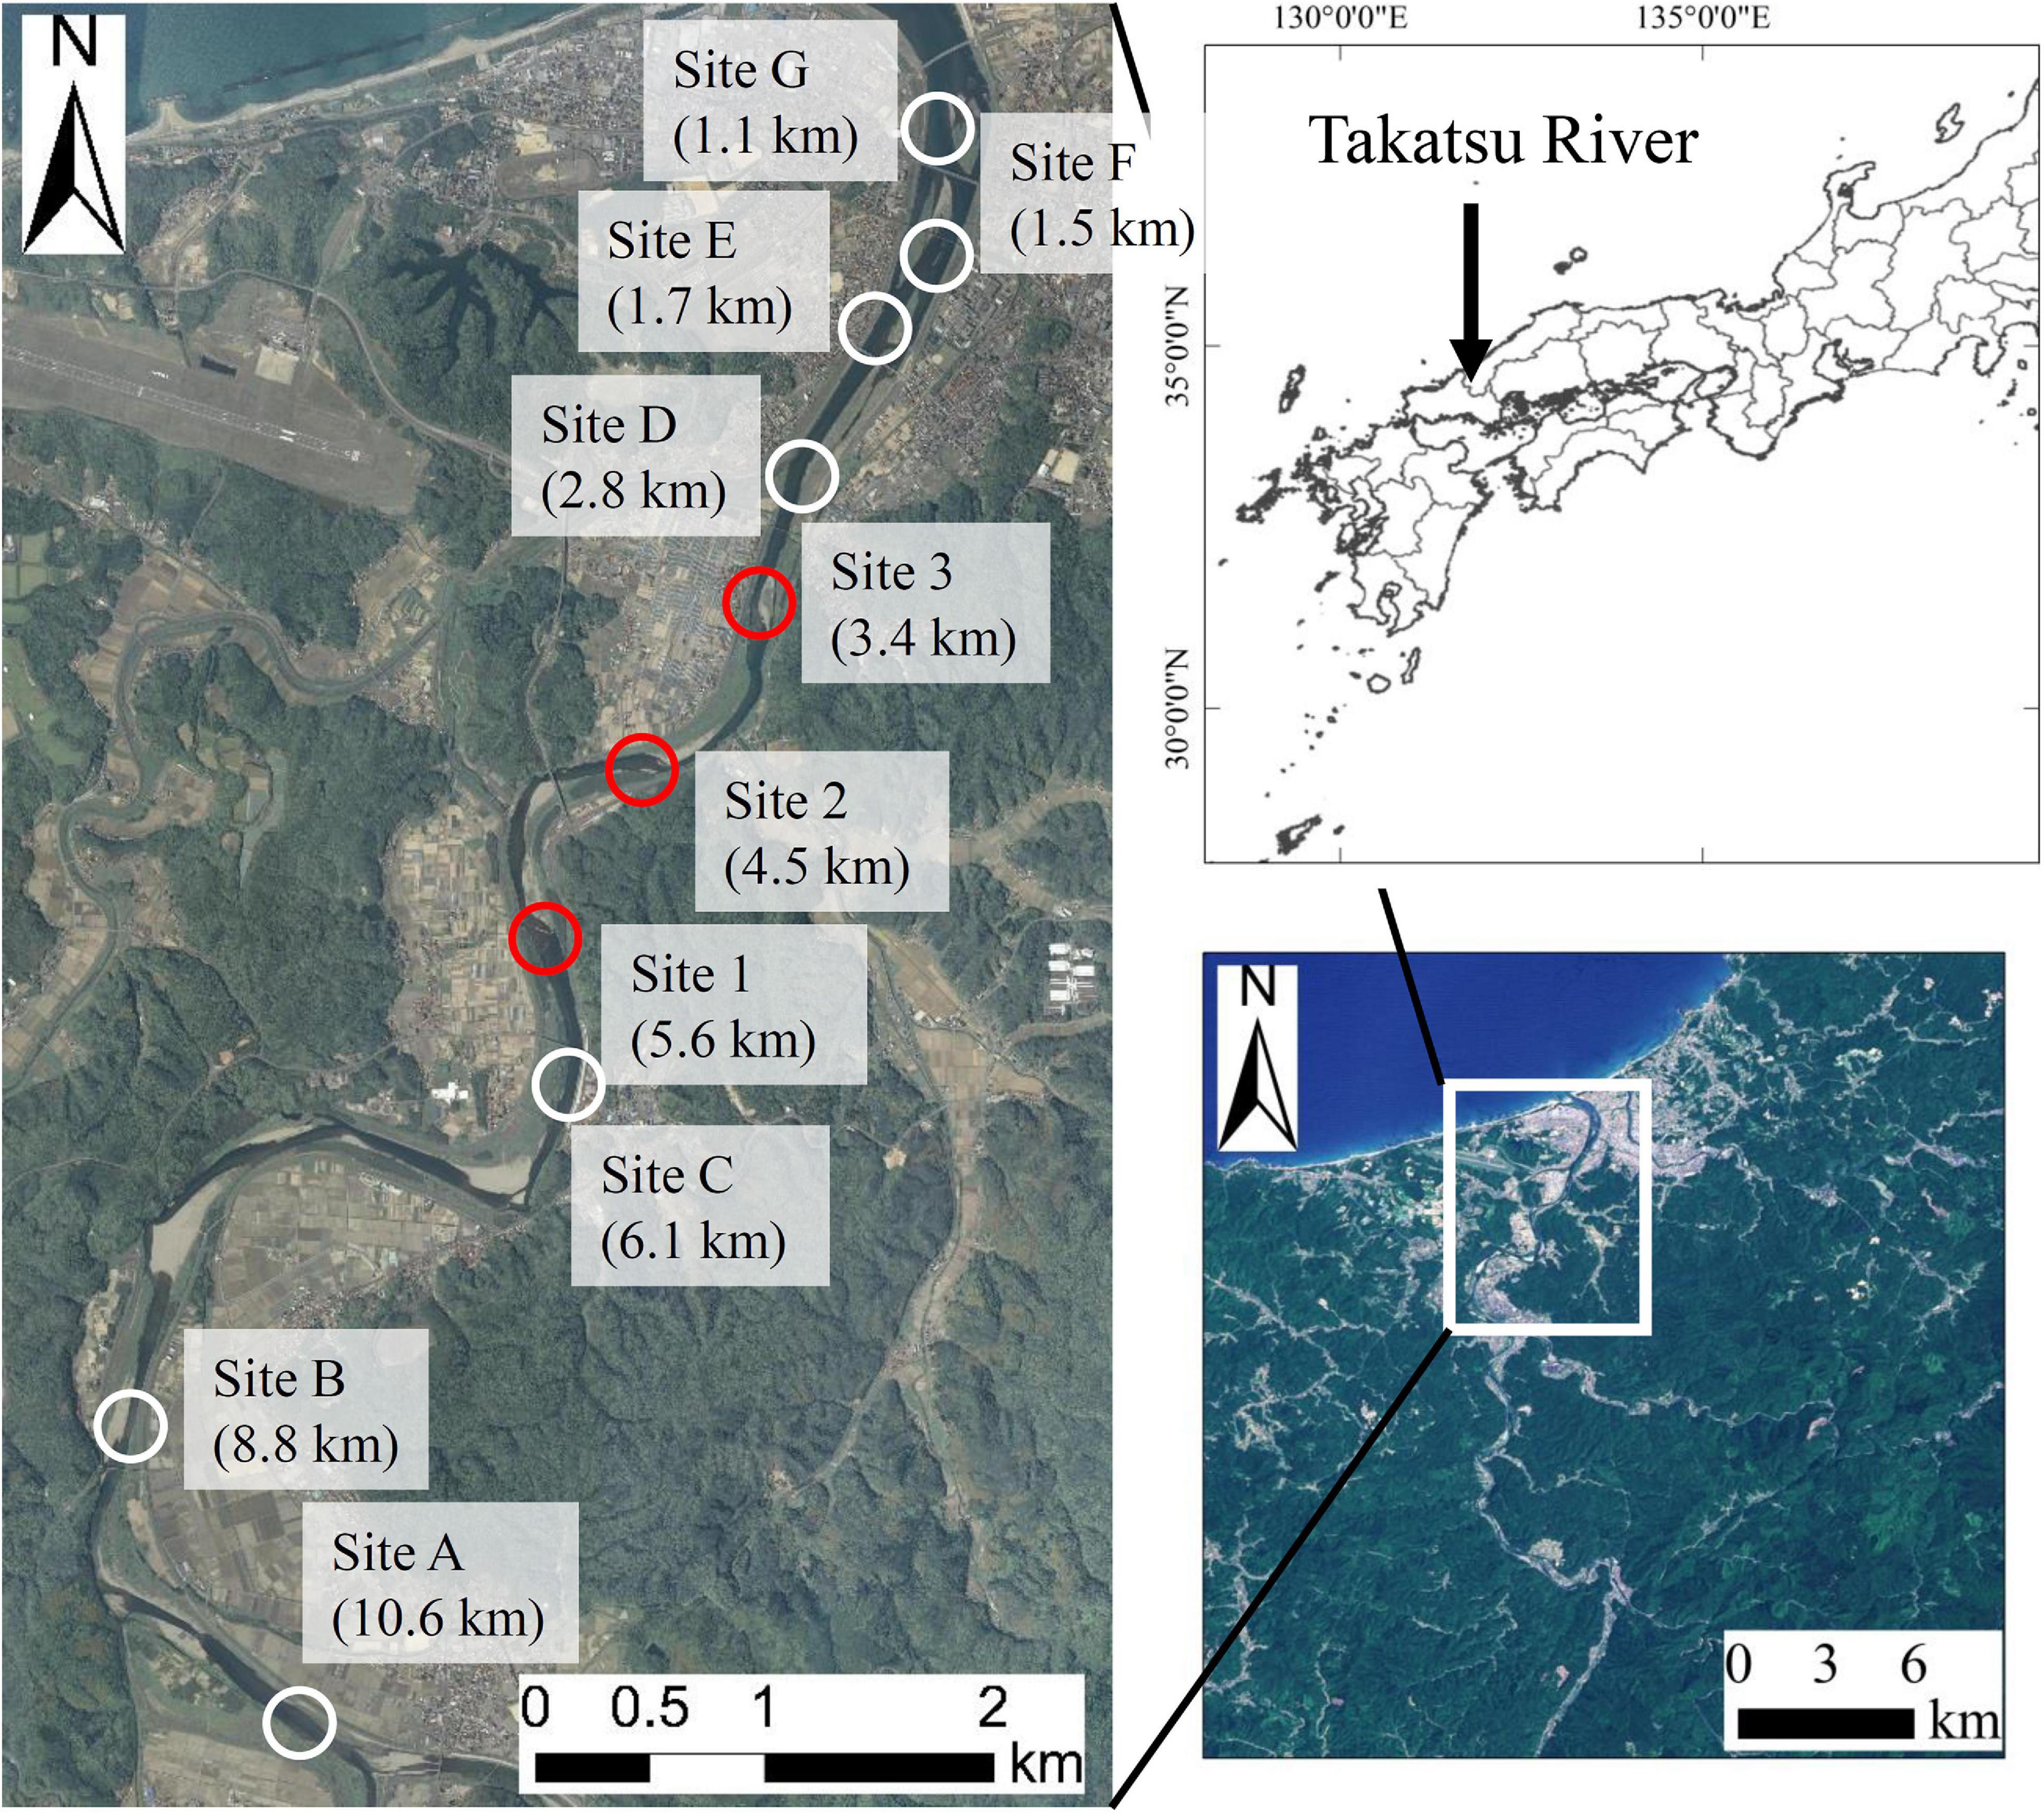
Figure 1. Study sites in the Takatsu River, western Japan. The distance indicated at each point is the distance from the river mouth. Red circles (Sites 1, 2, and 3) indicate the known spawning grounds, and white circles (Sites A to G) indicate the potential spawning grounds.
Filtration, DNA Extraction, and Quantitative PCR
Water samples and cooler blanks were filtered through a GF/F glass fiber filter (normal pore size = 0.7 μm; diameter = 47 mm; Global Life Sciences Technologies Japan, Tokyo, Japan) within 24 h. To prevent cross-contamination among the water samples, the filter funnels and measuring cups were bleached after filtration with 10% bleach solution. Then, bleached funnels and measuring cups were rinsed with DNA free deionized water. In 2018, 1 L of deionized water was filtered in the same manner in each filtration step in the laboratory and used as filtration negative controls (hereafter called a room blank). A total of nine room blanks were adopted in the present study. All filtered samples were stored at −20°C in the freezer until the DNA extraction step.
Total eDNA was extracted from each filtered sample using the DNeasy Blood and Tissue Kit (QIAGEN, Hilden, Germany). Extraction methods were according to Doi et al. (2017). The filtered sample was placed in the upper part of a Salivette tube (Sarstedt, Nümbrecht, Germany) with 400 μL Buffer AL and 40 μL proteinase K solution and incubated at 56°C for 30 min. Afterward, the Salivette tubes with filters were centrifuged at 5,000 × g for 5 min and 220-μL Tris–EDTA (TE) buffer was added to the filtered samples and re-centrifuged at 5,000 × g for 1 min. Subsequently, 400 μL of ethanol was added to the collected solution, and the mixture was transferred to a spin column. Total eDNA was eluted in 100 μL buffer AE according to the manufacturer’s instructions from the DNeasy Blood and Tissue Kit. All eDNA samples were stored at −20°C until the subsequent experiments.
A Real-time TaqMan quantitative PCR (qPCR) was performed on a PikoReal Real-Time System (Thermo Fisher Scientific, Waltham, MA, United States). The mitochondrial cytochrome b (cytb) gene fragments (131 bp) were amplified and quantified using the primers and TaqMan probe described in Yamanaka and Minamoto (2016): Paa-CytB-Forward: 5′-CCTAGTCTCCCTGGCTTTATTCTCT-3′, Paa-CytB-Reverse: 5′-GTAGAATGGCGTAGGCGAAAA-3′, and Paa-CytB-Probe: 5′-FAM-ACTTCACGGCAGCCAACCCCC-TAMRA-3′. Each 10 μL of PCR mixture contained 1 μL primer-probe mix (900 nM of primers and 125 nM probe), 5 μL TaqMan Environmental Master Mix 2.0 (Life Technologies, Carlsbad, CA, United States), 0.1 μL AmpErase Uracil N-Glycosylase (UNG; Thermo Fisher Scientific, Waltham, MA, United States), 1.9 μL sterilized water (Nacalai tesque, Kyoto, Japan), and 2 μL of the eDNA solution. The qPCR conditions were as follows: UNG incubation step at 50°C for 2 min, denaturation at 95°C for 10 min, followed by 55 cycles of 95°C for 15 s, and 60°C for 60 s. In the 2018 and 2019 samples, room blank and ultrapure water instead of the template DNA water were used as the PCR blanks in each qPCR run. There were four PCR replicates of template DNA and negative controls in 2018 and three in 2019. The standard curve was constructed using a dilution series of 6.0 × 10⁴, 103, 102, and 101 copies per PCR mixture using cloned plasmid DNA with the target sequence. Each PCR replicate of standard DNA was duplicated in 2018 and triplicated in 2019. The R2 values for the standard curves of all qPCR ranged from 0.912 to 0.995 (Supplementary Table 1). In 2019, no DNA was detected in any of the blanks; however, in 2018, DNA was detected there. The DNA concentration of blank samples ranged from 0.00 to 3.57 copies/2 μL in the daytime and nighttime, respectively. Thus, the data of 2018 were corrected by calculating the average of the concentrations of the four blank wells analyzed on that day, excluding the non-detected wells, and subtracting them from the concentration at each site on the relevant day.
Data Analysis
The mean eDNA concentration per template DNA (copies/2 μL) was calculated using the raw data of the qPCR results. Then, eDNA concentration per sample (copies/L) and eDNA flux (copies/s) was also calculated to account for daily changes in discharge or to make year to year comparisons. Discharge taken were the daily average discharge (m3/s) estimated from the depth measured at three nearby gauge stations (Ministry of Land, Infrastructure, Transport, and Tourism, 2020) using the H-Q curve for each station.
The eDNA concentrations and fluxes of each site on each day were plotted as a scatter plot with nighttime concentrations/fluxes on the vertical axis and daytime concentrations/fluxes on the horizontal axis. The scatter plot was used to identify the actual spawning season of Ayu, clarify the changes in the main spawning grounds during the spawning season, and discover unknown spawning grounds. In all figures, each data point shows the average of PCR replicates from one water sample from one site, and the upstream site and downstream site of riffles are shown in the separate plots.
Results
Spawning Season
We obtained eDNA concentrations for 132 samples, 16 cooler blanks and 16 PCR blanks from 28 qPCR runs. All the qPCR results are shown in Supplementary Tables 2, 3, while the eDNA concentrations and fluxes are shown in Supplementary Table 4. The data for Sites 1, 2, and 3 for 2019, and Sites 1, 2, and 3 for 2018 are taken from Inui et al. (2020) and Saito et al. (2020), respectively.
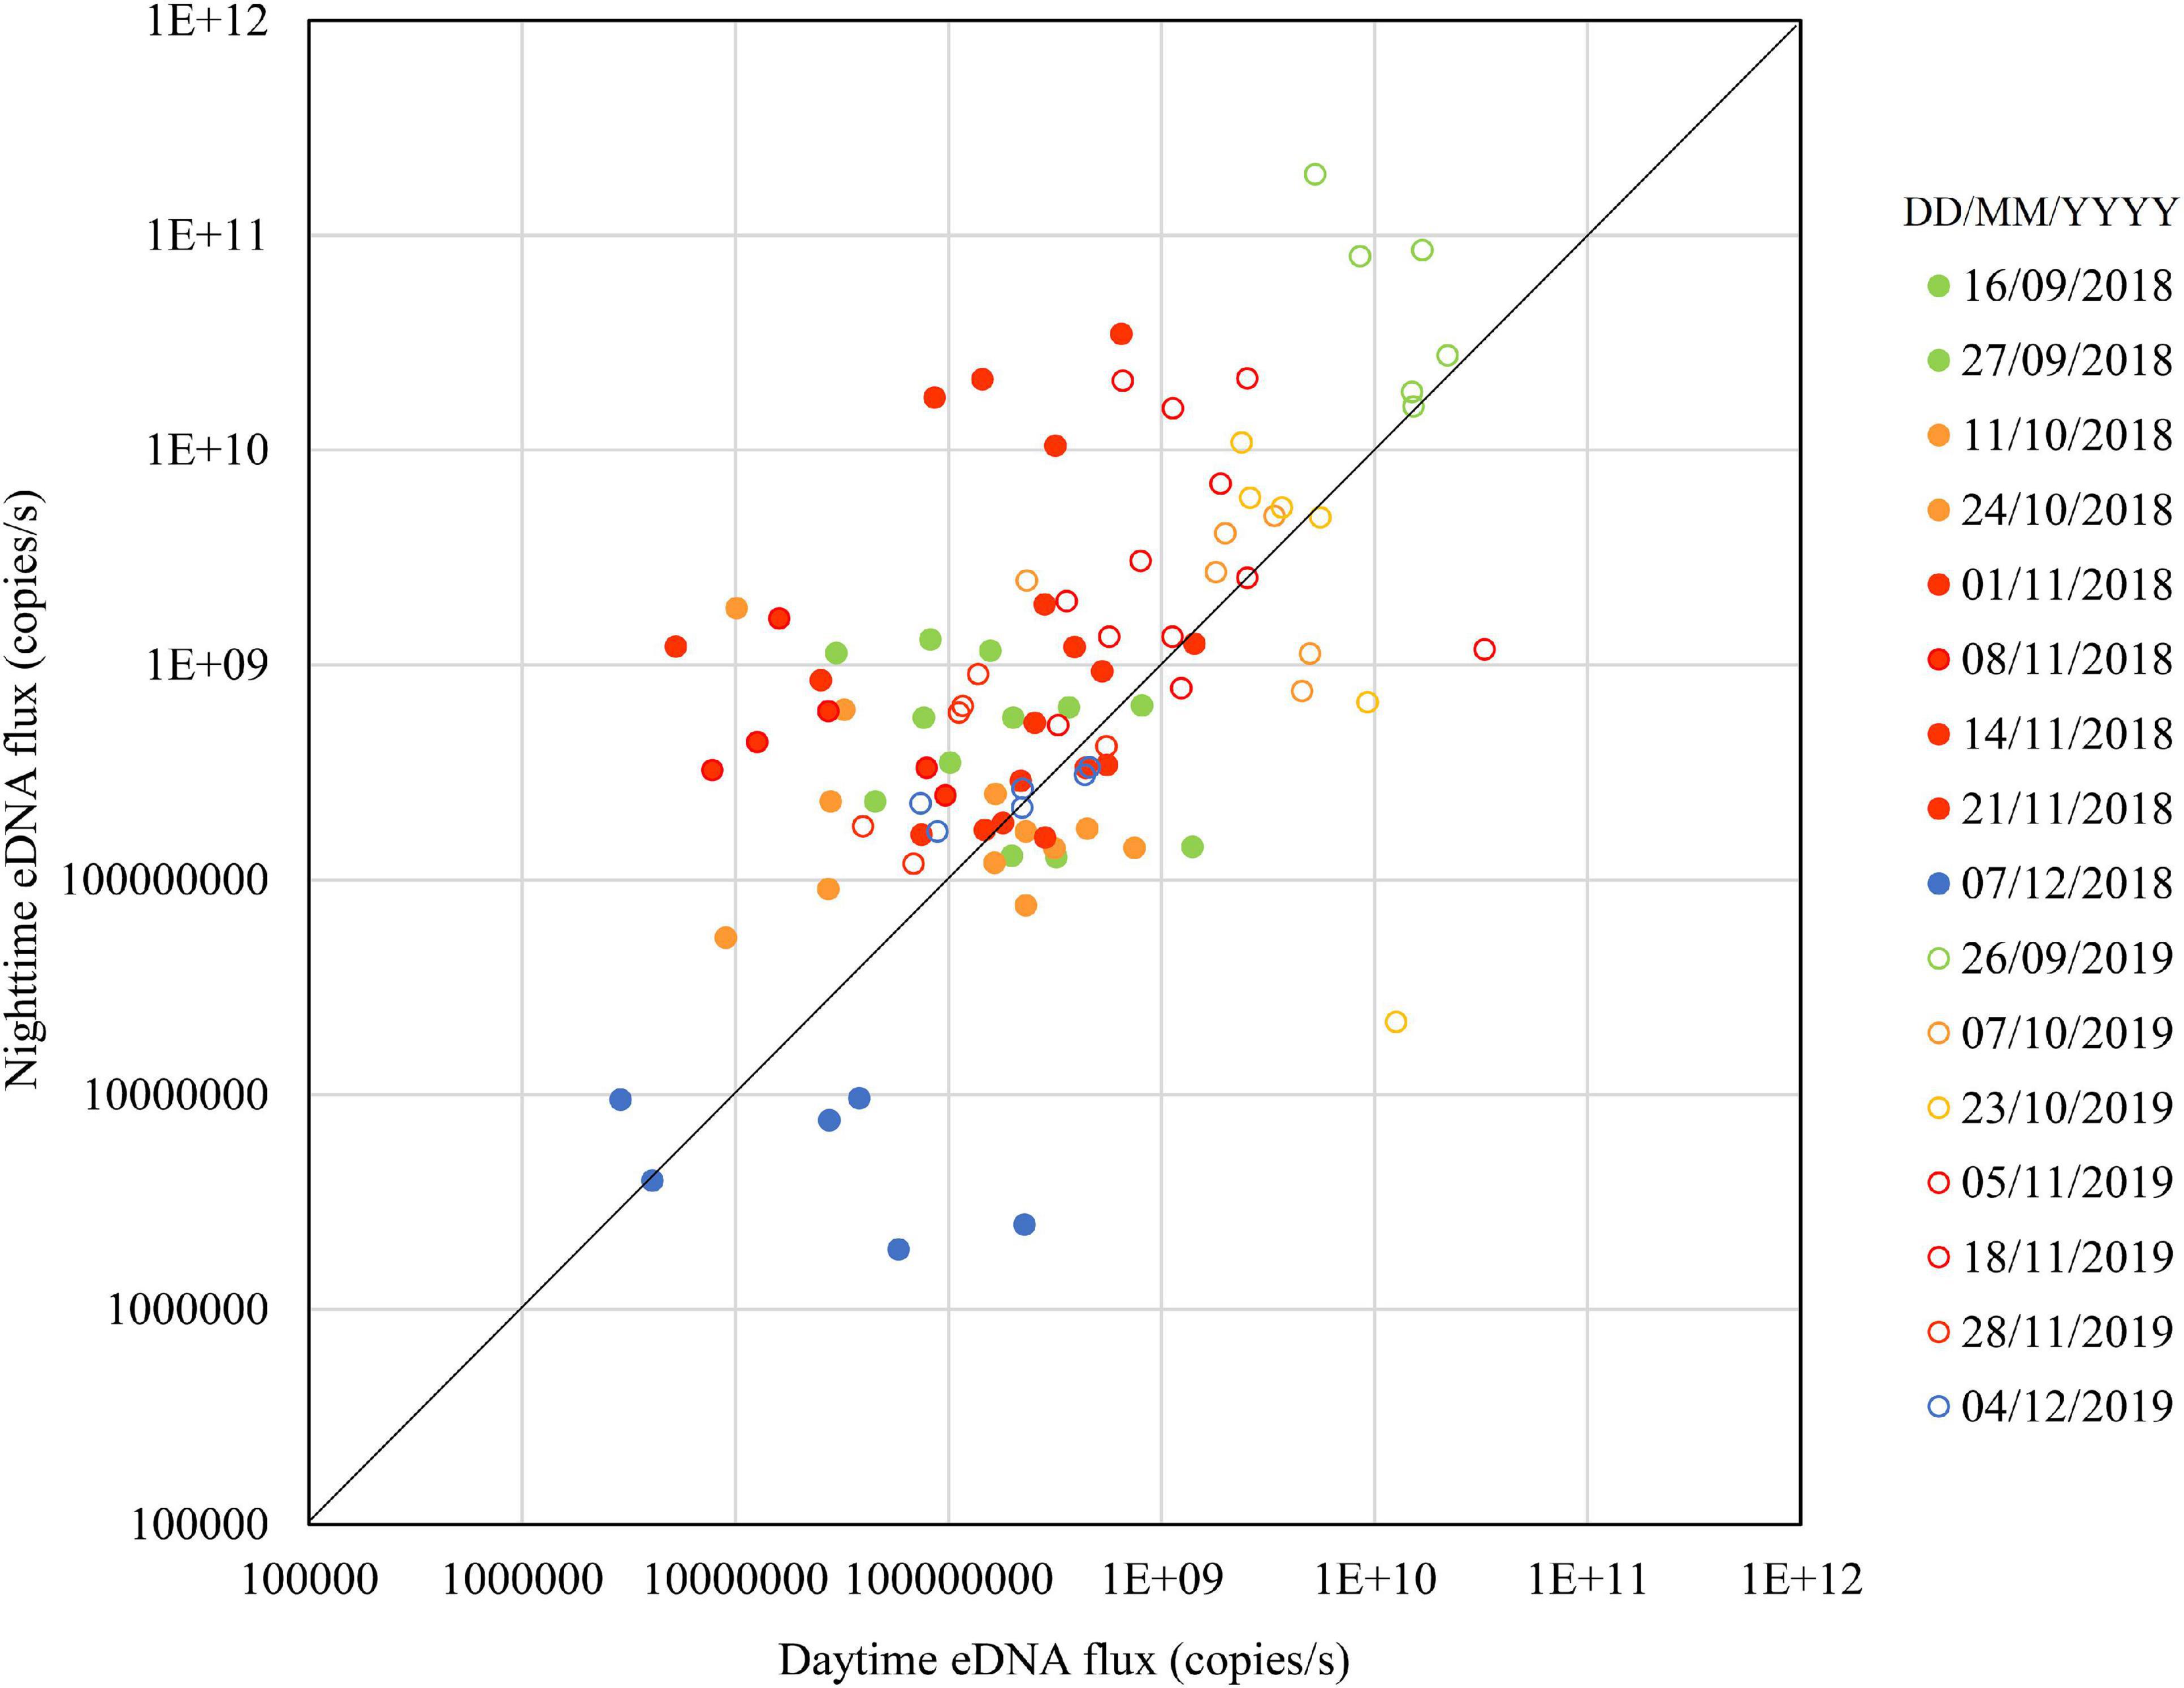
Figure 2 shows the seasonal changes in the daytime and nighttime eDNA concentrations at the three known spawning grounds (Sites 1, 2, and 3). Figure 3 shows the seasonal changes of the daytime and nighttime eDNA fluxes at the three known spawning grounds. In each figure, the diagonal (i.e., the line Y = X) is shown as a reference, and the plots above this line indicate that the value of the eDNA concentration in the nighttime sample divided by the eDNA concentration in the daytime sample (abbreviated to “night/day value”) is larger than 1, which could be an indicator of the spawning activity of Ayu.
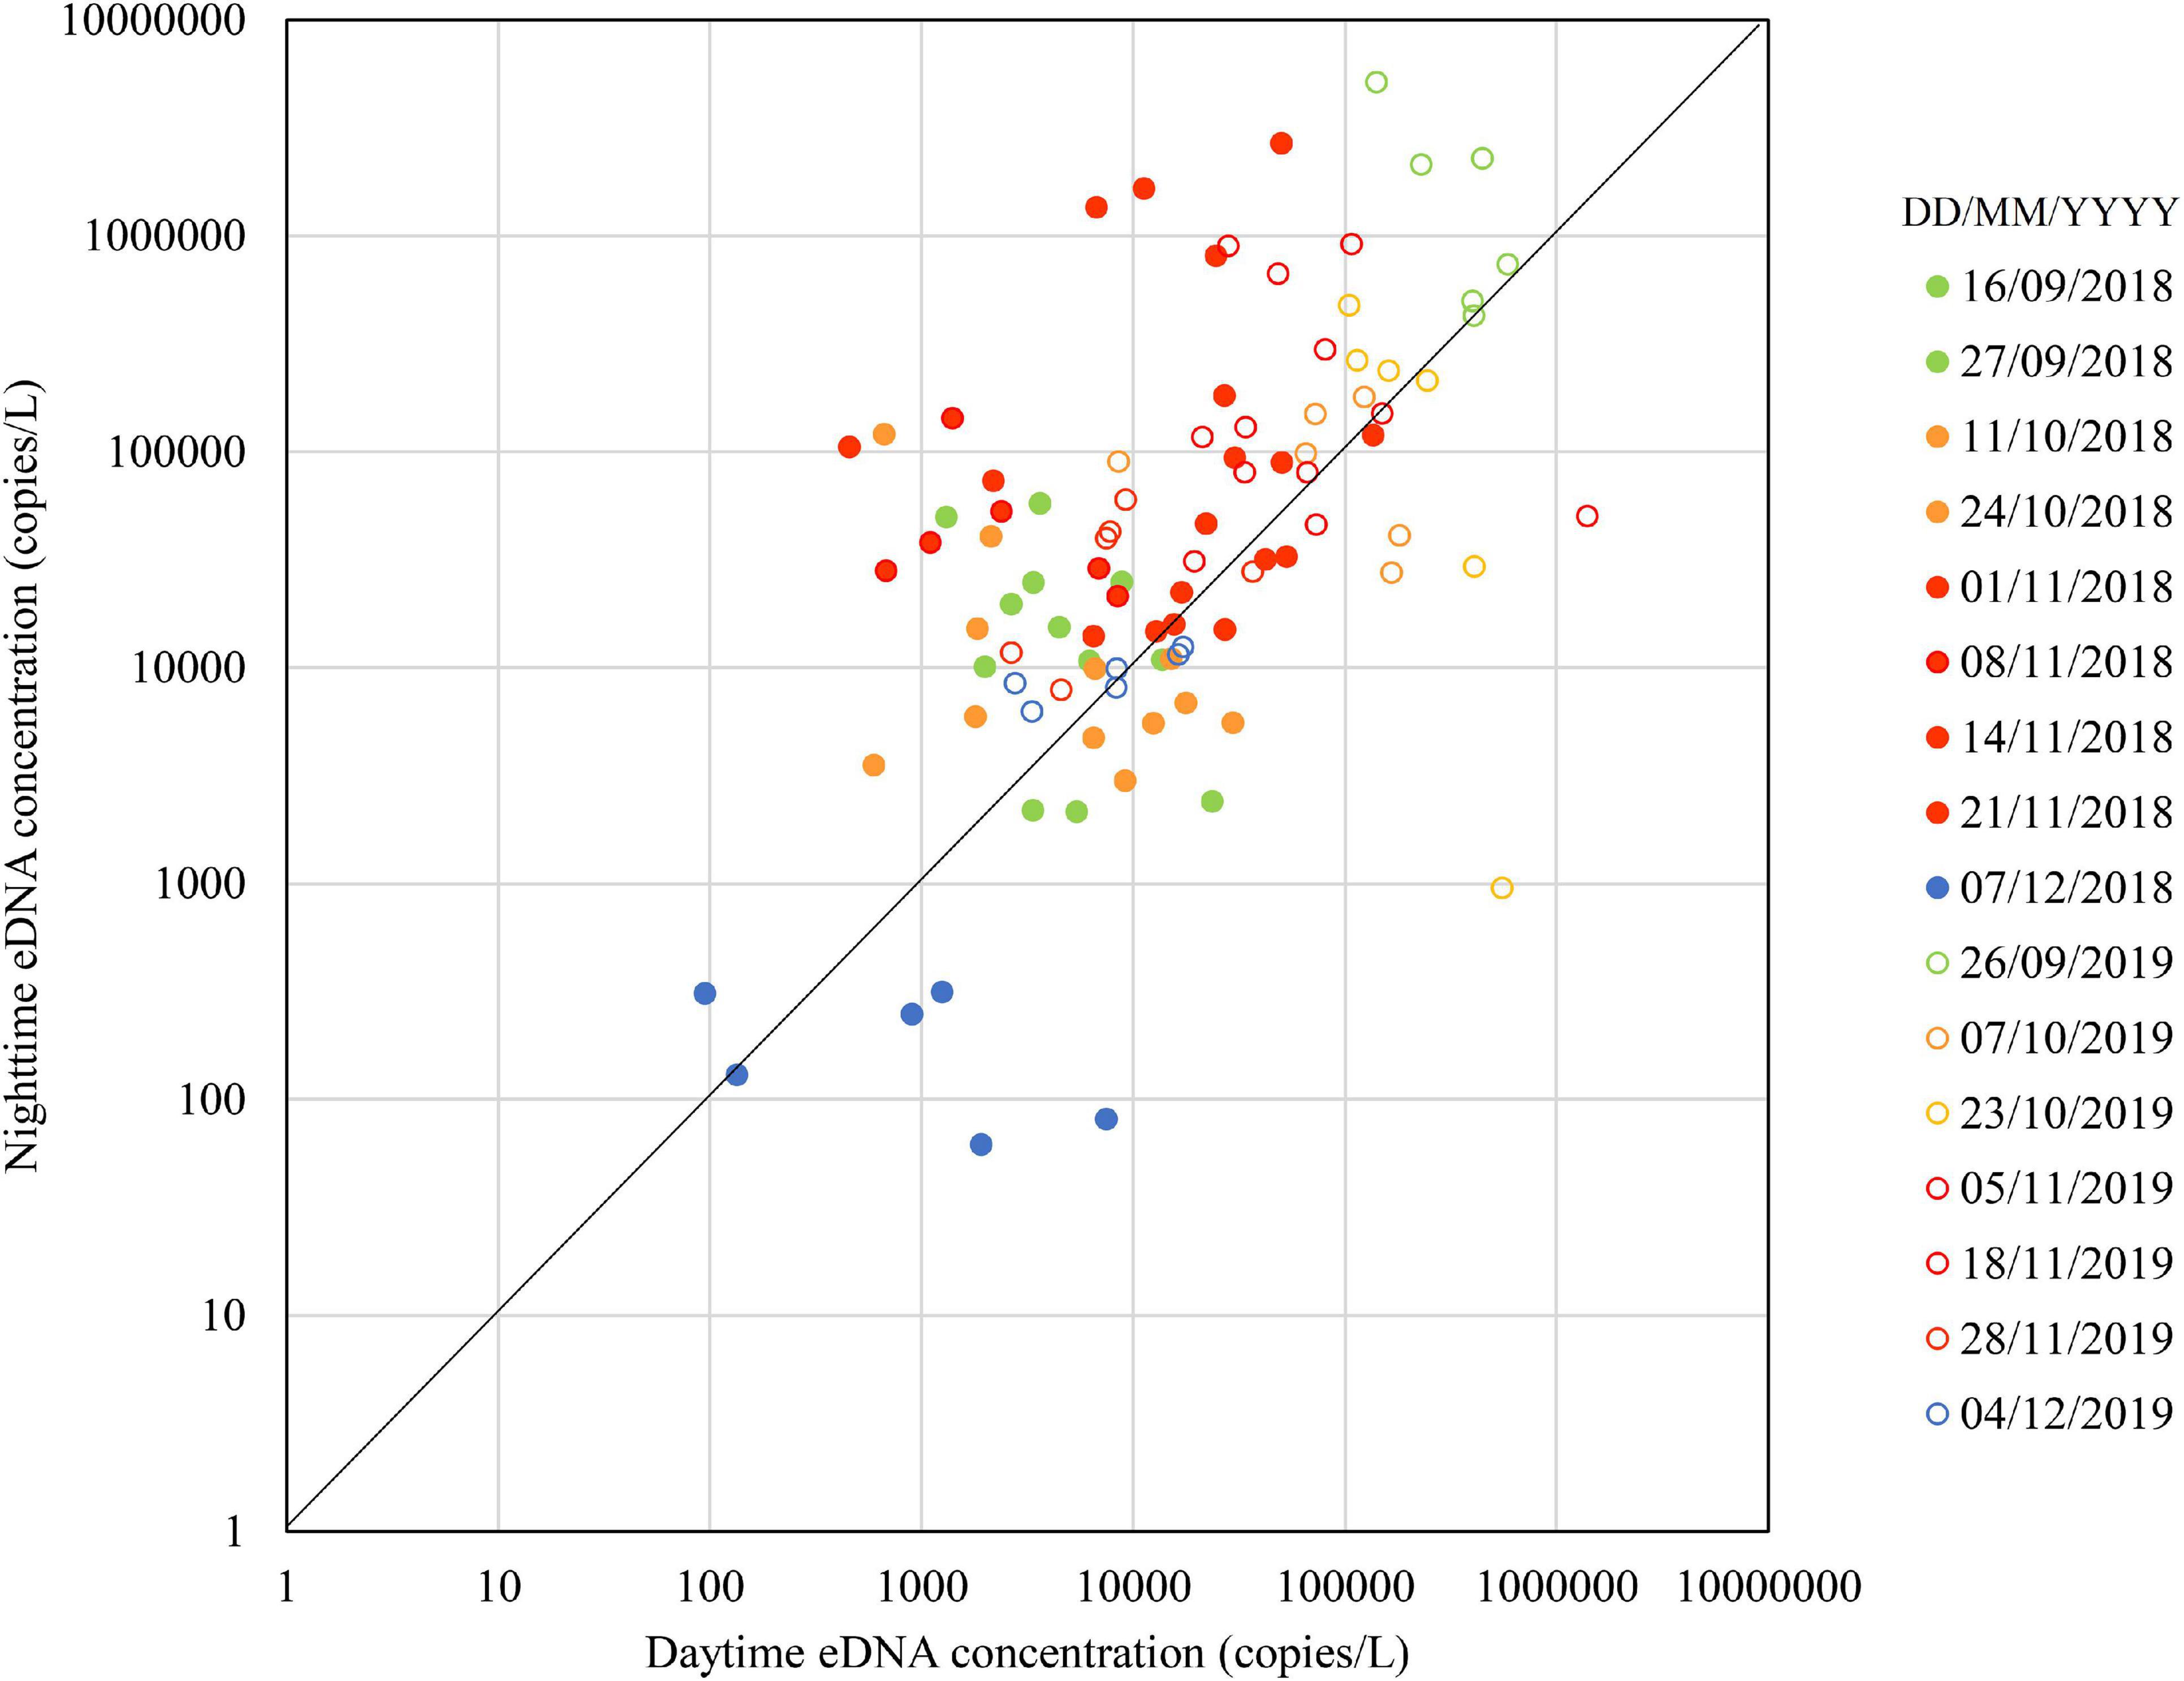
Figure 2. Seasonal changes in daytime and nighttime environmental DNA concentrations in 2018 and 2019.
In 2018, the daytime and nighttime eDNA concentrations and the eDNA fluxes were highest in November, intermediate in September and October, and lowest in December. The values above the diagonal were 67% in September, 50% in October, 83% in November, and 17% in December, respectively. In Figure 3, plots above the diagonal indicate the eDNA fluxes have increased in nighttime and those below the diagonal indicate the eDNA fluxes have decreased in nighttime. The distance from each plot to the diagonal in Figure 3 was calculated and used as the indicator of the spawning activity (i.e., the positive value of the distance is indicative of the spawning activity). In 2018, the mean distances for September, October, November, and December were 188 × 106, 87 × 106, 2679 × 106, and −38 × 106, respectively.
In 2019, the nighttime and daytime eDNA concentrations were highest in September, intermediate in October and November, and lowest in December. The plots above the diagonal were one hundred percent, 58 and 83% of the points were above the diagonal in September, October, and December, respectively. In 2019, the mean distances for September, October, November, and December were 39,673 × 106, −547 × 106, 1327 × 106, and 1 × 10⁶, respectively.
Changes in the Main Spawning Grounds
Figures 4–6 show the eDNA fluxes of the known spawning grounds in September, October, and November for each site.
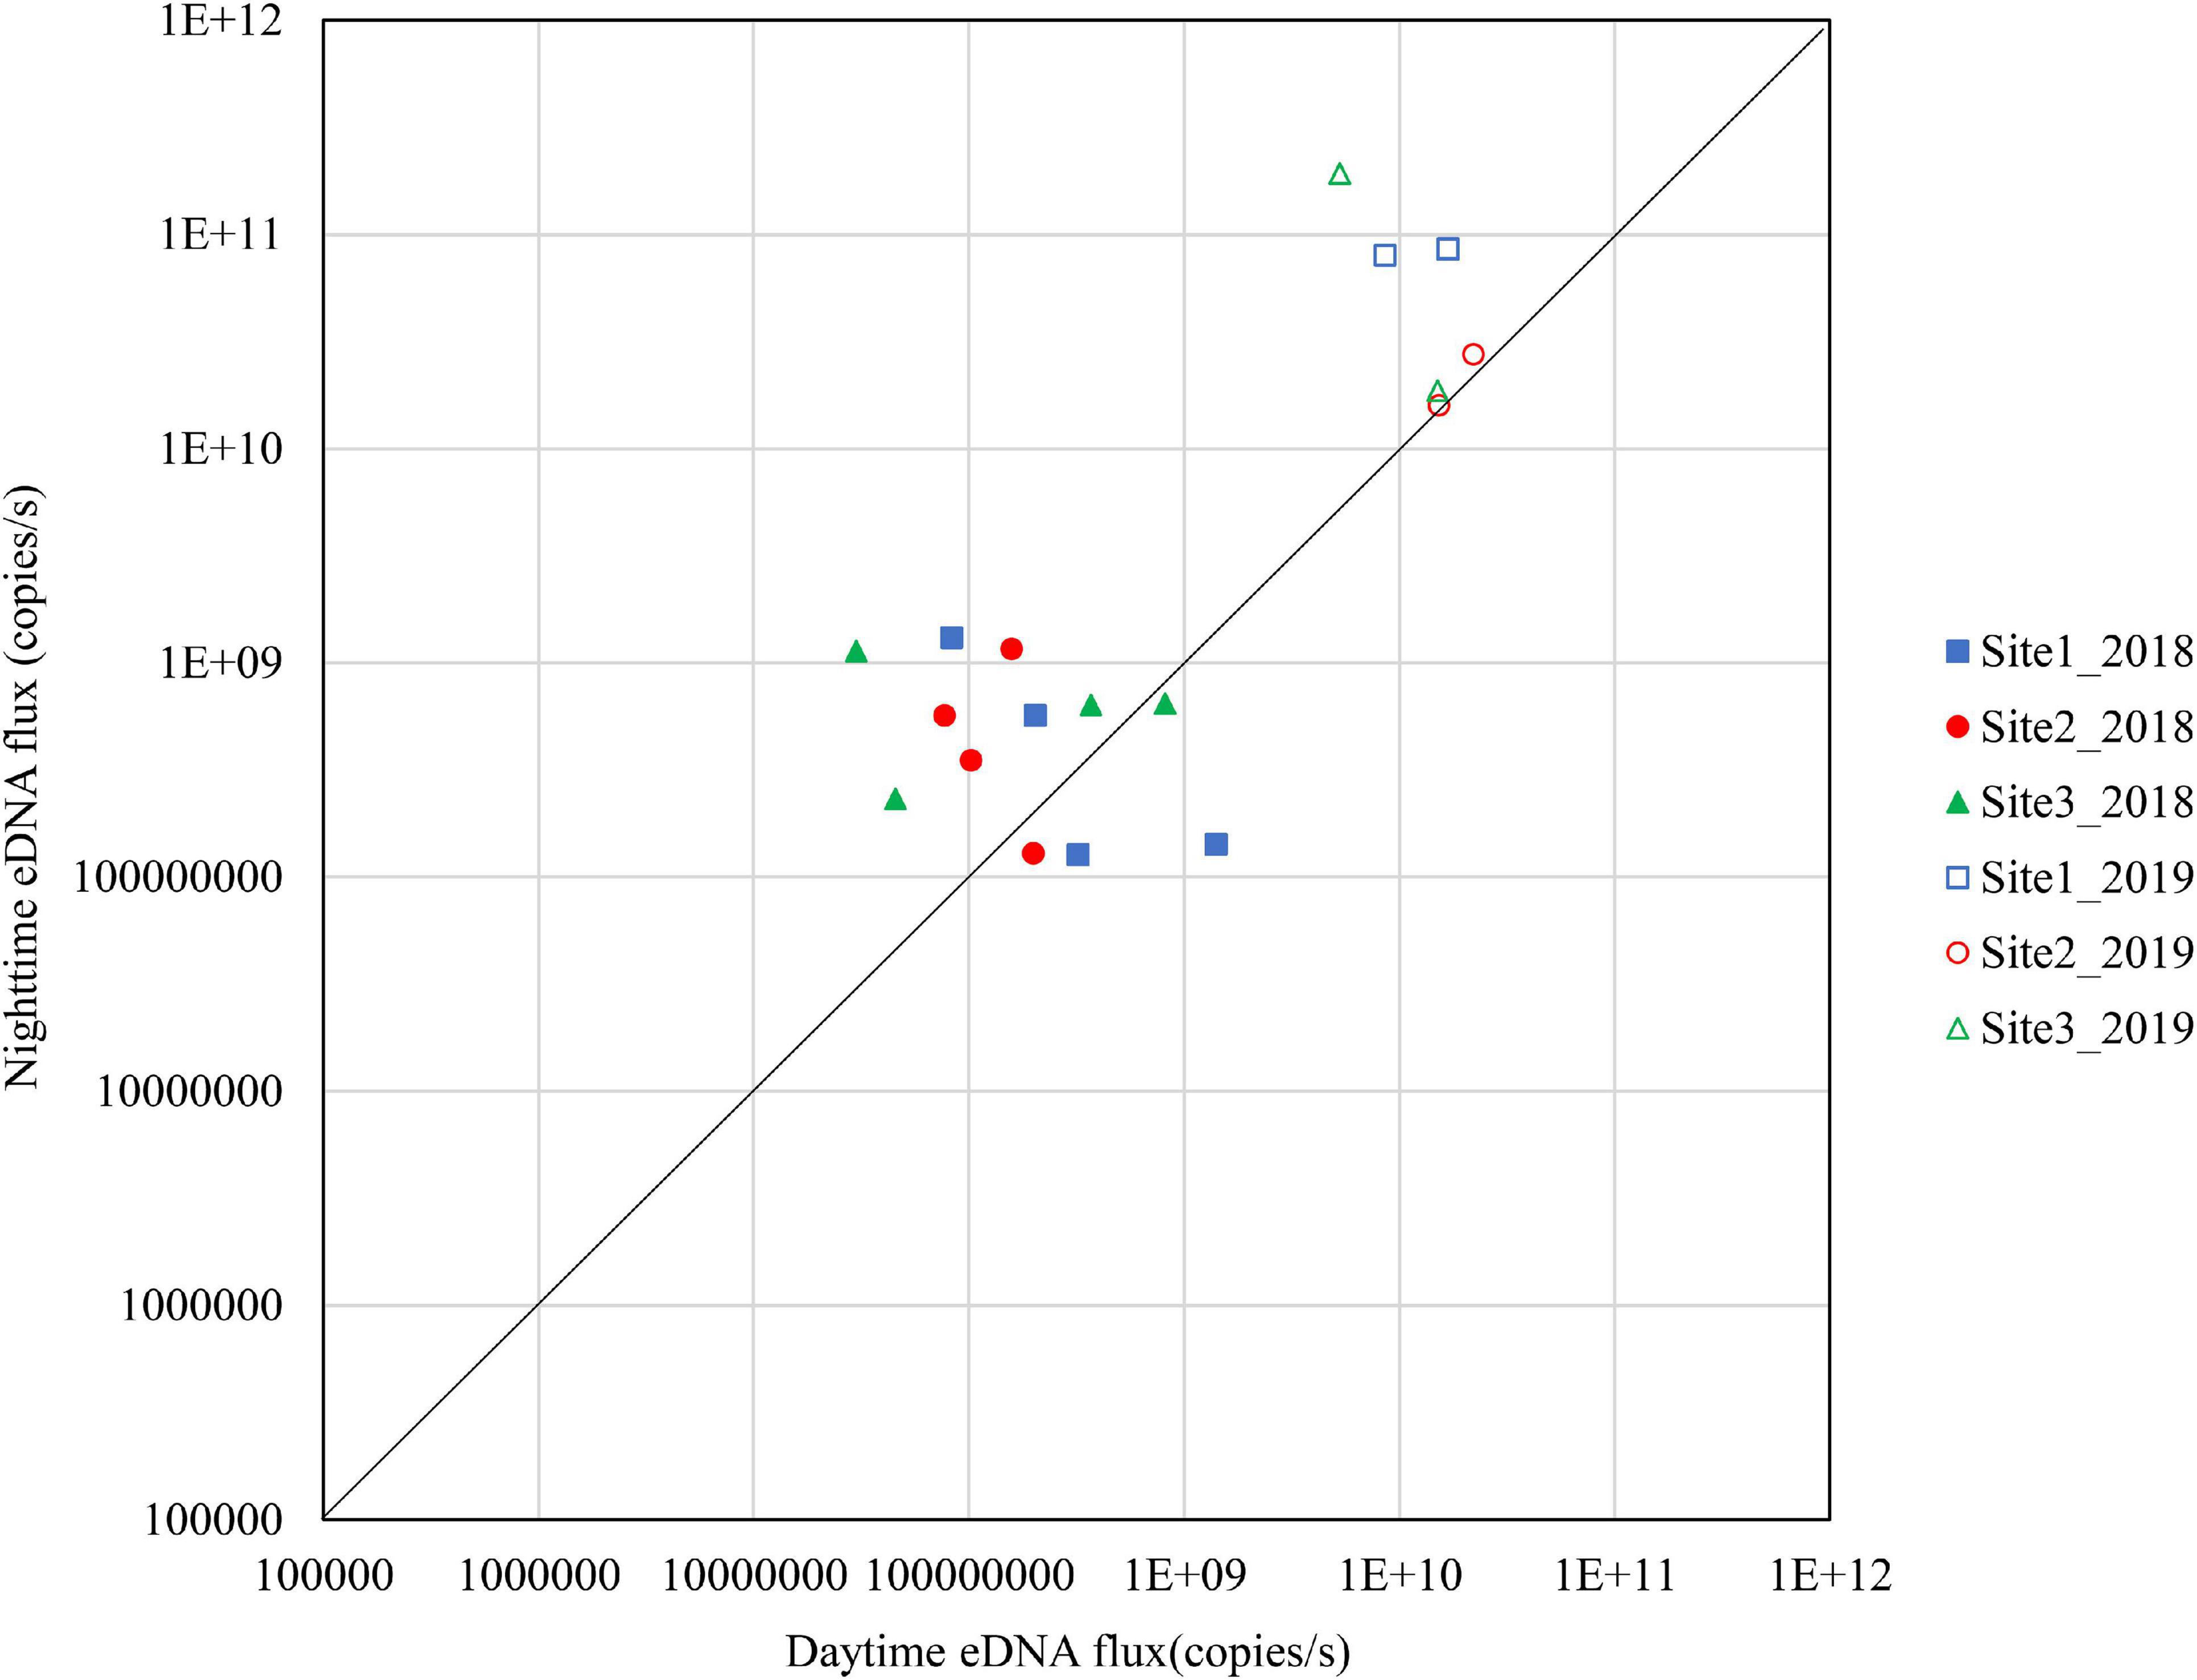
Figure 4. Differences in daytime and nighttime environmental DNA fluxes at sites 1–3 in September 2018 and 2019.
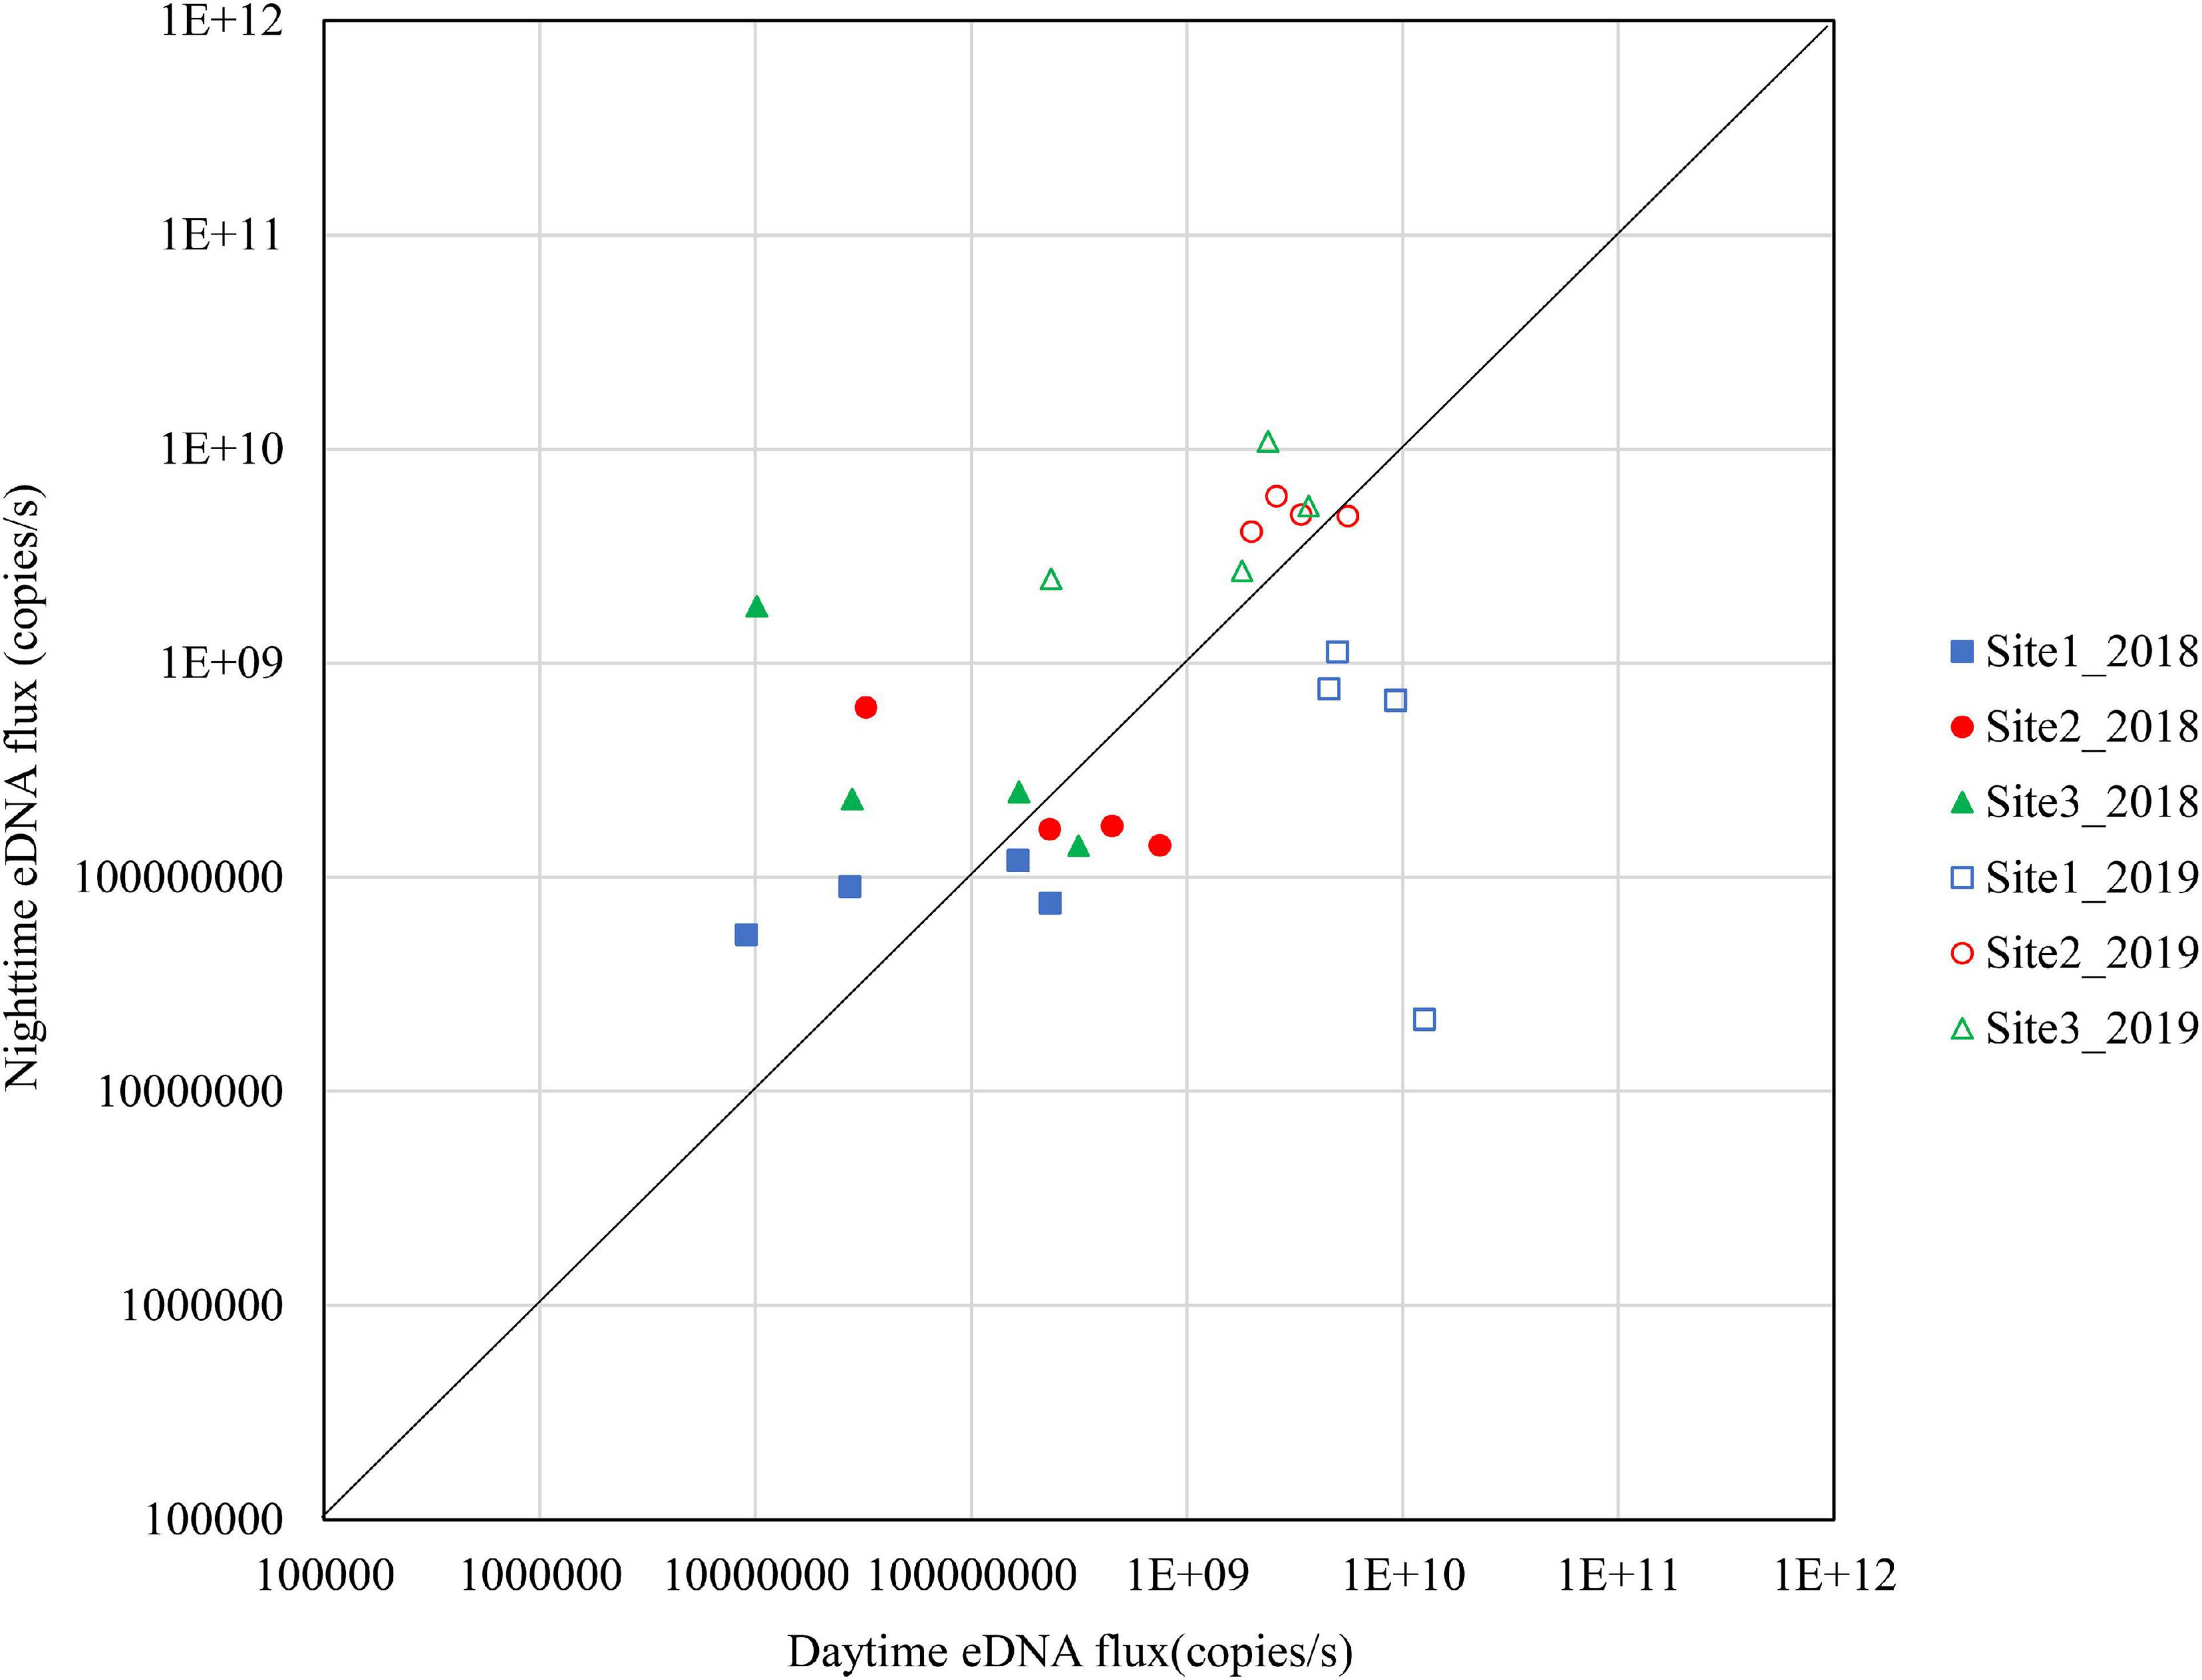
Figure 5. Differences in daytime and nighttime environmental DNA fluxes at sites 1–3 in October 2018 and 2019.
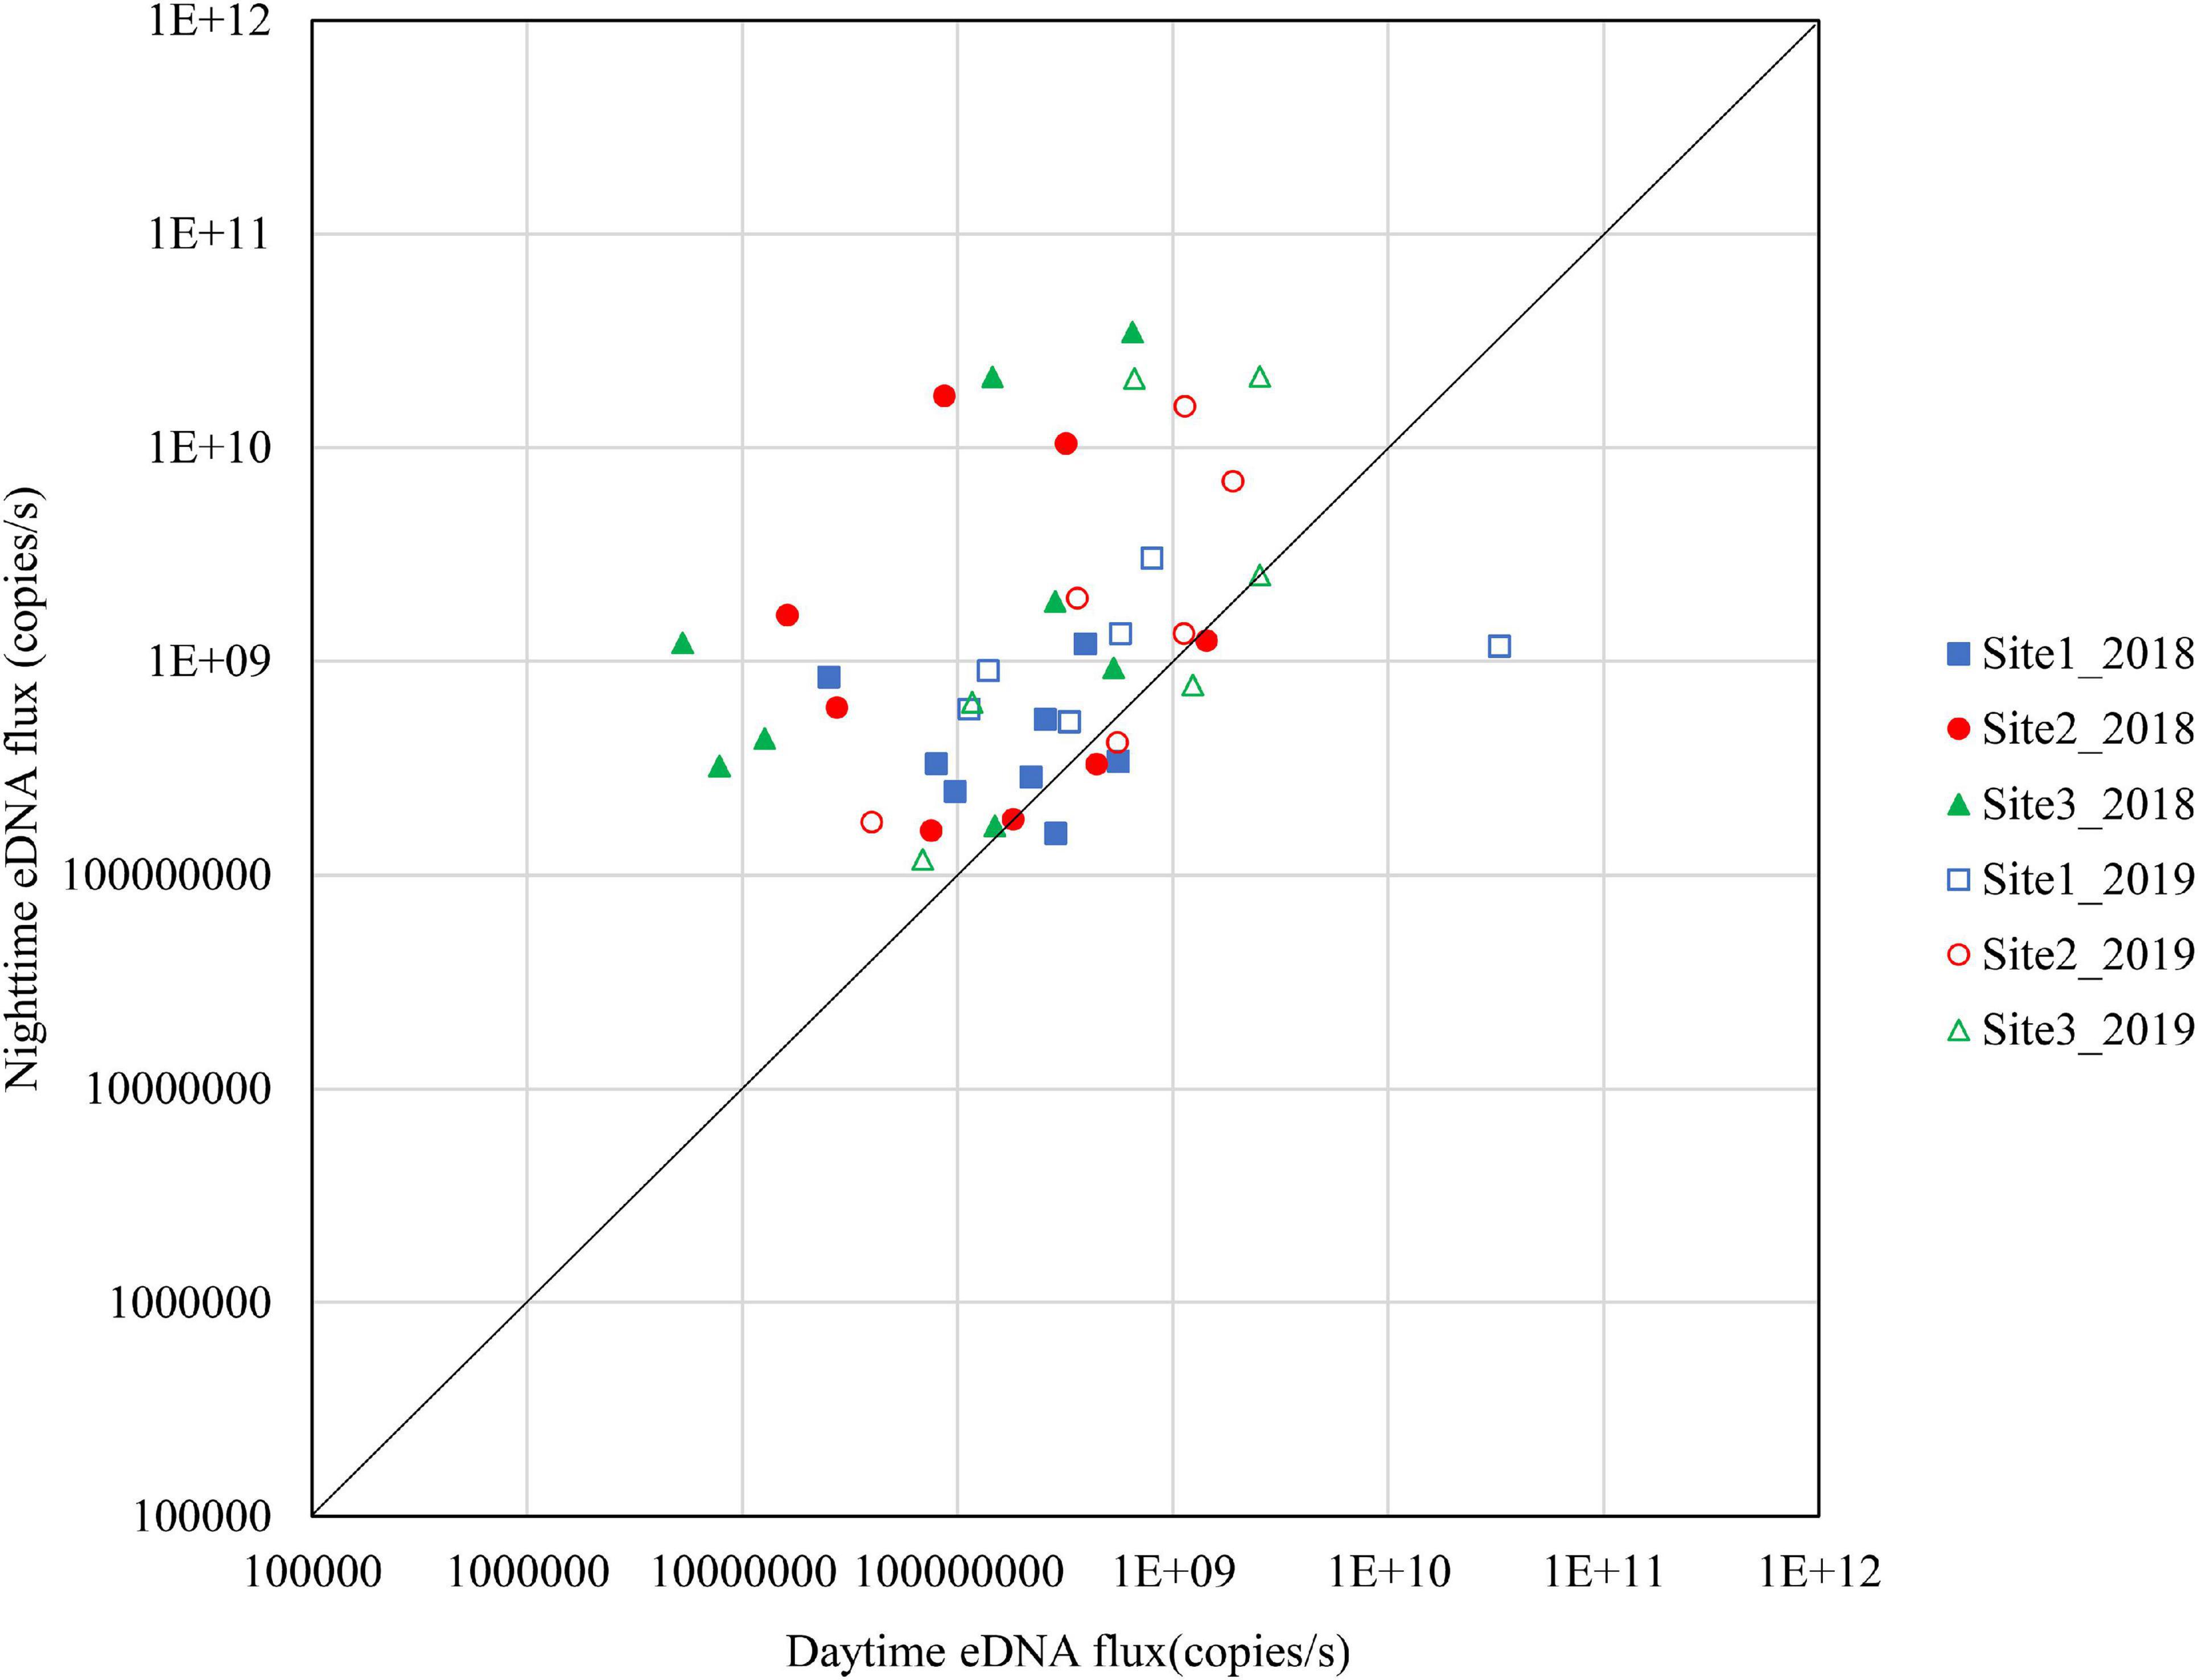
Figure 6. Differences in daytime and nighttime environmental DNA fluxes at sites 1–3 in November 2018 and 2019.
The results for September are shown in Figure 4. In 2018, 50% of the samples in Site 1, 66.7% in Site 2, and 66.7% in Site 3 were above the diagonal. The nighttime eDNA fluxes were higher at Site 1 and Site 3 on September 26. In 2019, all samples at Site 1 and Site 3 were above the diagonal and had higher nighttime eDNA fluxes.
The results for October are shown in Figure 6. In 2018, few sites were above the diagonal although Site 3 had relatively high nighttime eDNA fluxes and night/day values. In 2019, Site 2 and Site 3 had high eDNA fluxes at nighttime, and the night/day values were mostly above 1.
The results for November are shown in Figure 7. In 2018, Site 3 had high nighttime eDNA fluxes and all the samples were above the diagonal. Site 2 had relatively high nighttime eDNA fluxes, with 62.5% of the values above the diagonal. Site 1 did not have high levels of either nighttime eDNA fluxes or night/day values. In 2019, most of the plots at the three sites were above the diagonal.
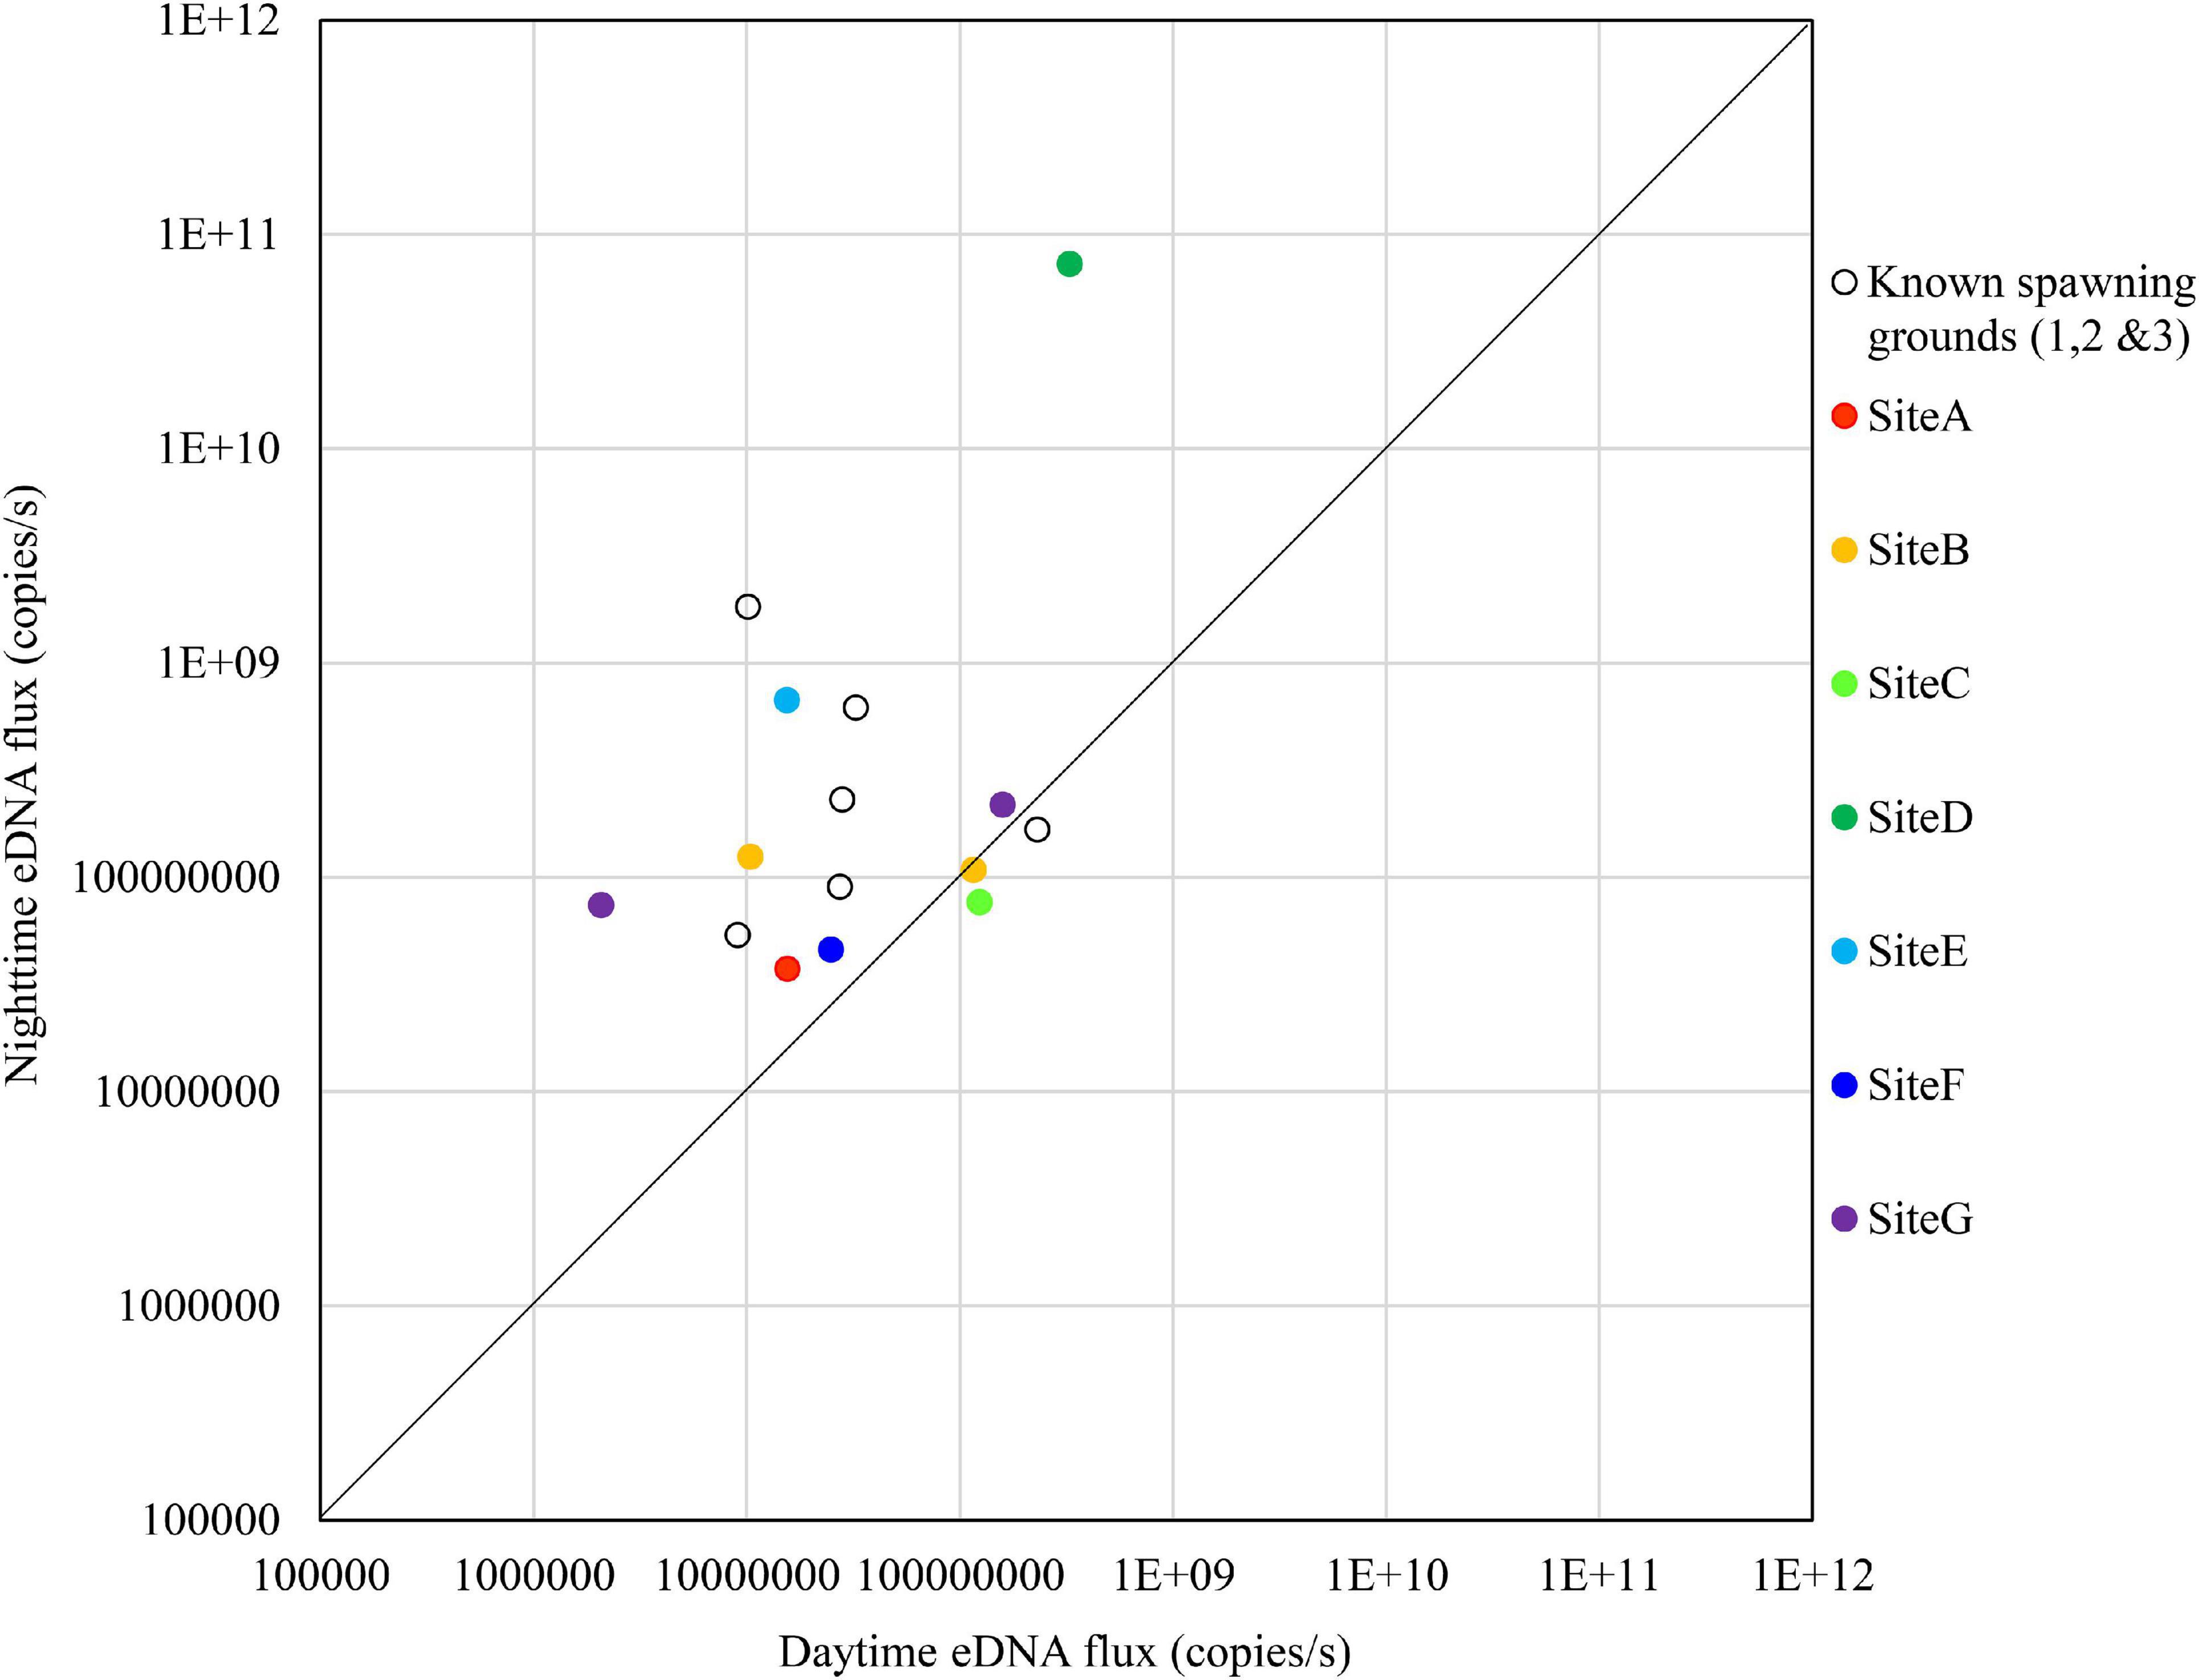
Figure 7. Comparison of daytime and nighttime environmental DNA fluxes between the potential spawning grounds (Sites A to G) and the known spawning grounds (Sites 1, 2, and 3) on October 24, 2018.
Searching for New Spawning Grounds
Figures 7–10 show the eDNA fluxes of the potential spawning grounds (Sites A to G). For comparison, the eDNA fluxes of the known spawning grounds (Sites 1, 2, and 3) on the same day are shown.
The results for October 24 are shown in Figure 7. The nighttime eDNA fluxes at Site D and Site E were higher than the average eDNA fluxes of the known spawning grounds, and the nighttime/daytime values of both sites were also higher.
On November 1, no sites exceeded the known spawning grounds on the nighttime eDNA fluxes; however, Sites B to E had relatively high nighttime eDNA fluxes and nighttime/daytime values (Figure 8).
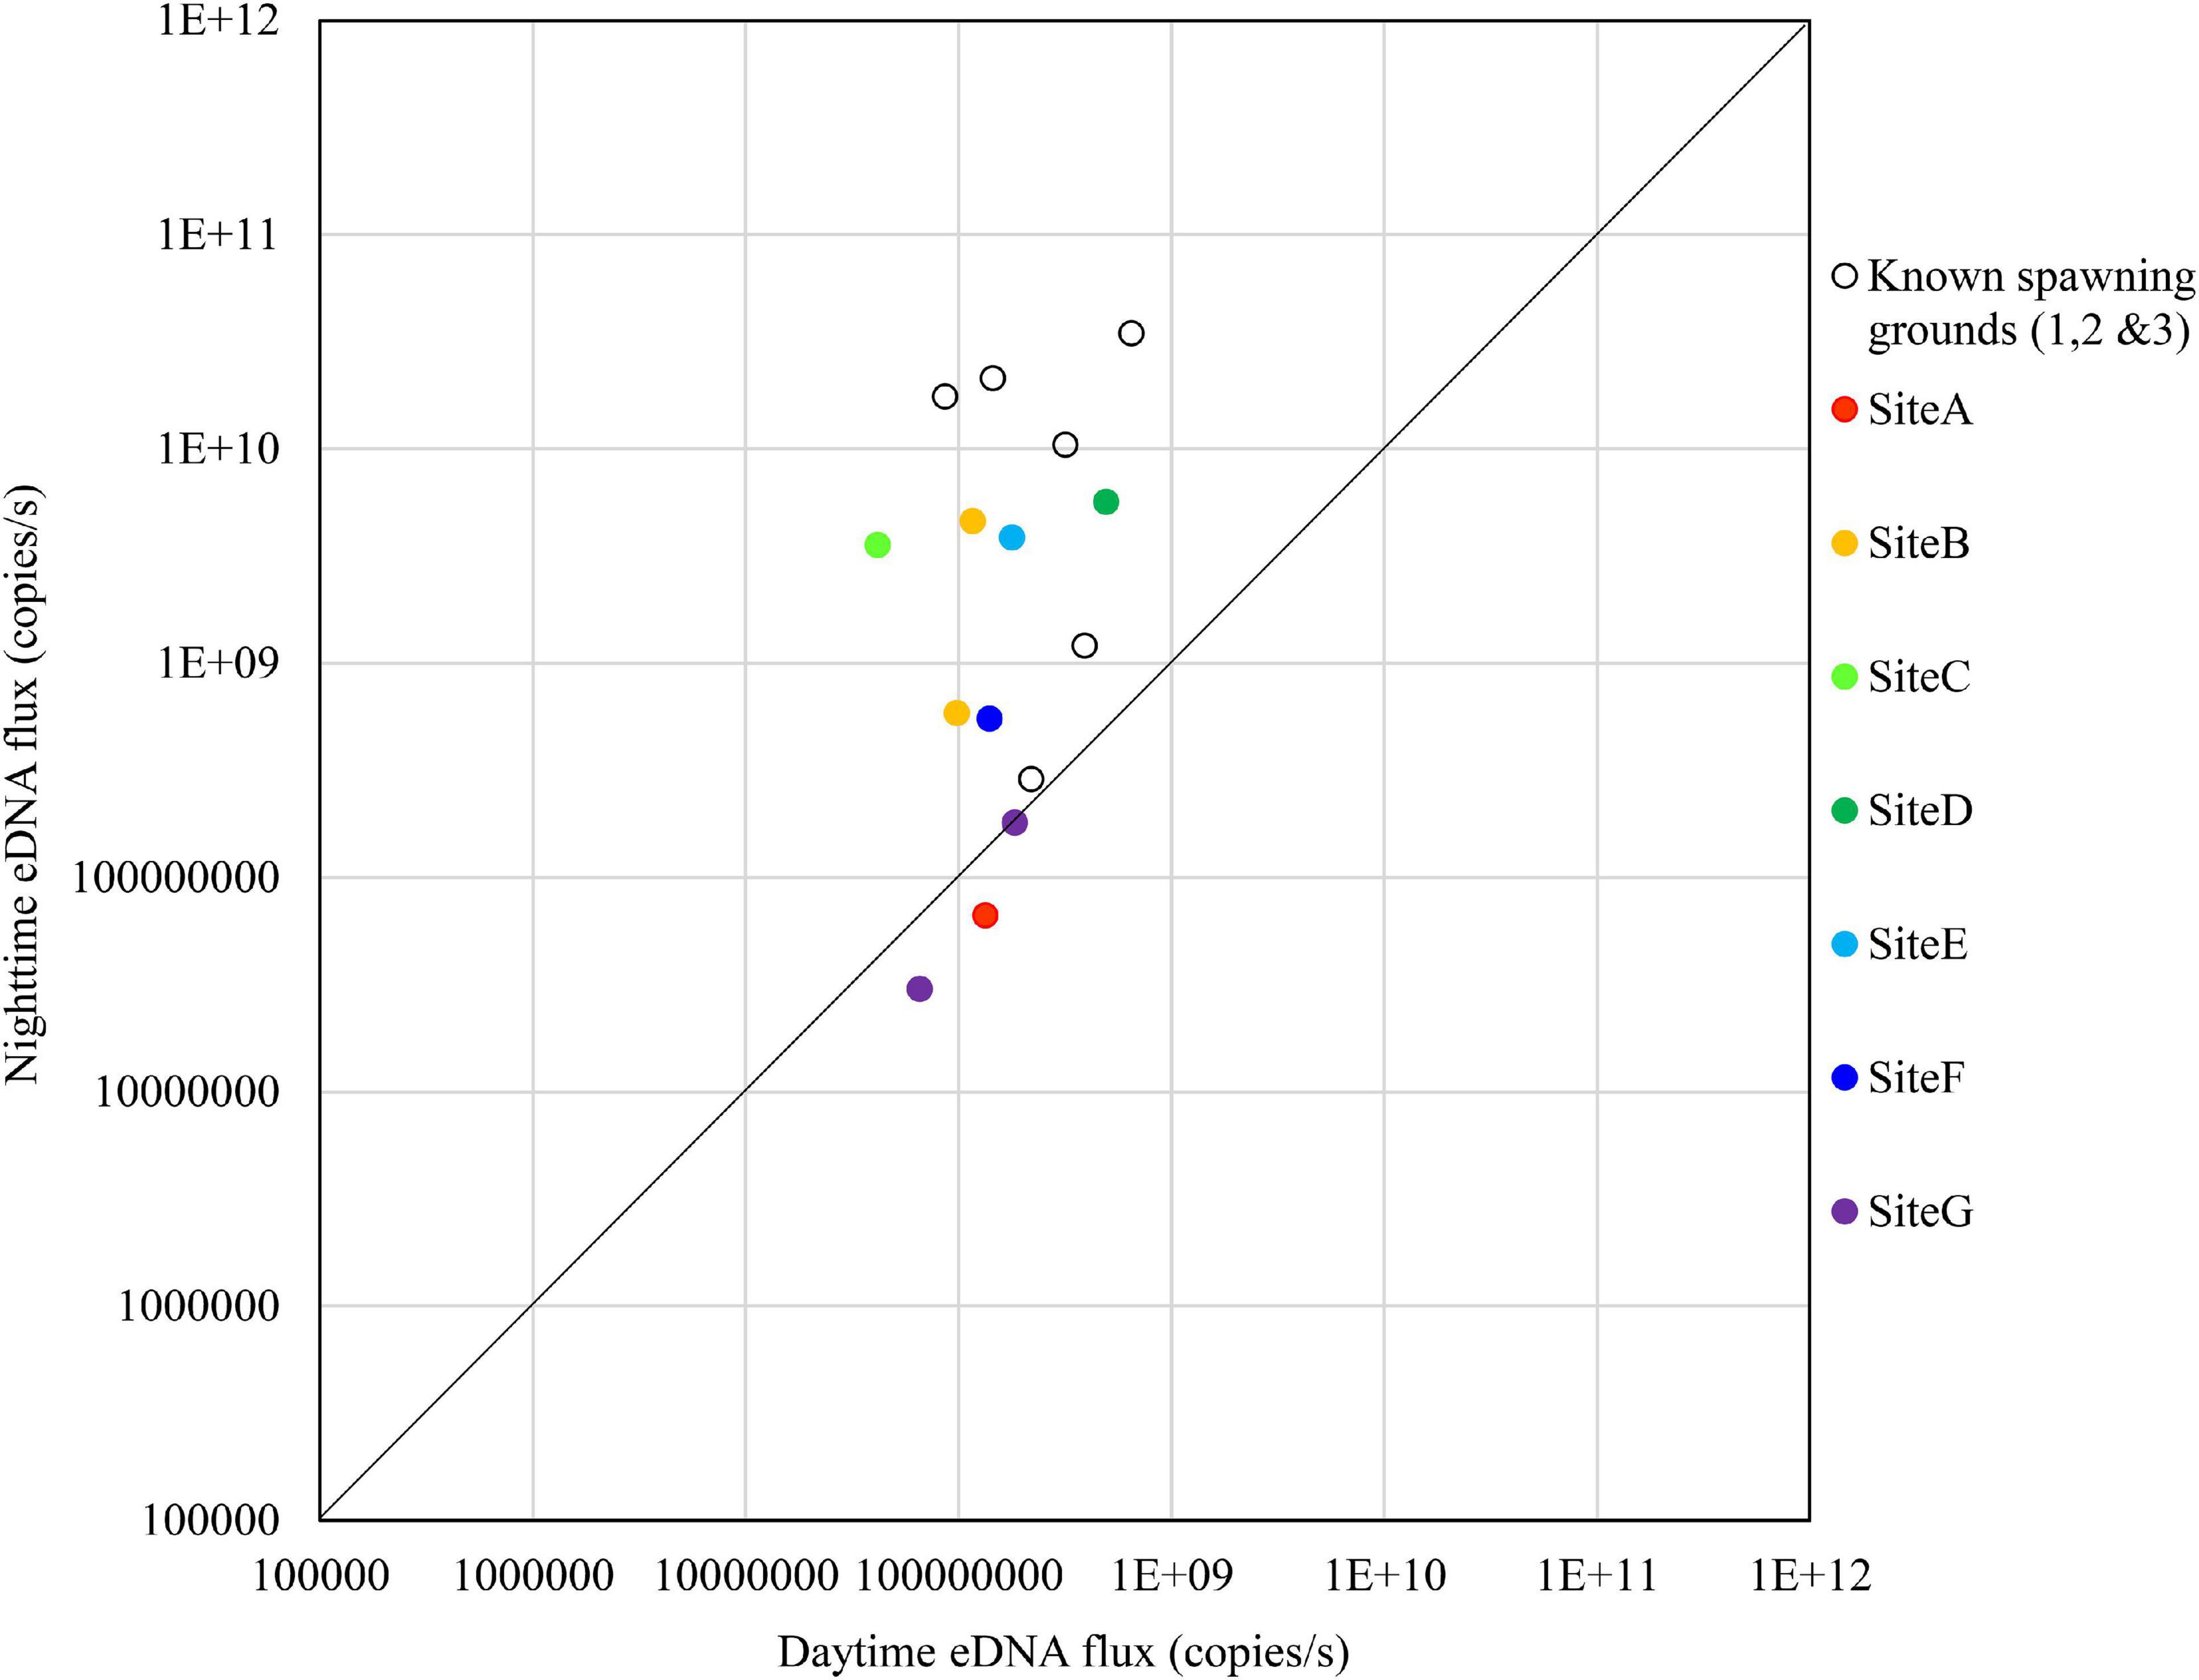
Figure 8. Comparison of daytime and nighttime environmental DNA fluxes between the potential spawning grounds (Sites A to G) and the known spawning grounds (Sites 1, 2, and 3) on November 1, 2018.
The results on November 8 showed that no sites exceeded the nighttime eDNA fluxes of the known spawning grounds, but Sites D and F had relatively high nighttime eDNA fluxes and nighttime/daytime values (Figure 9).
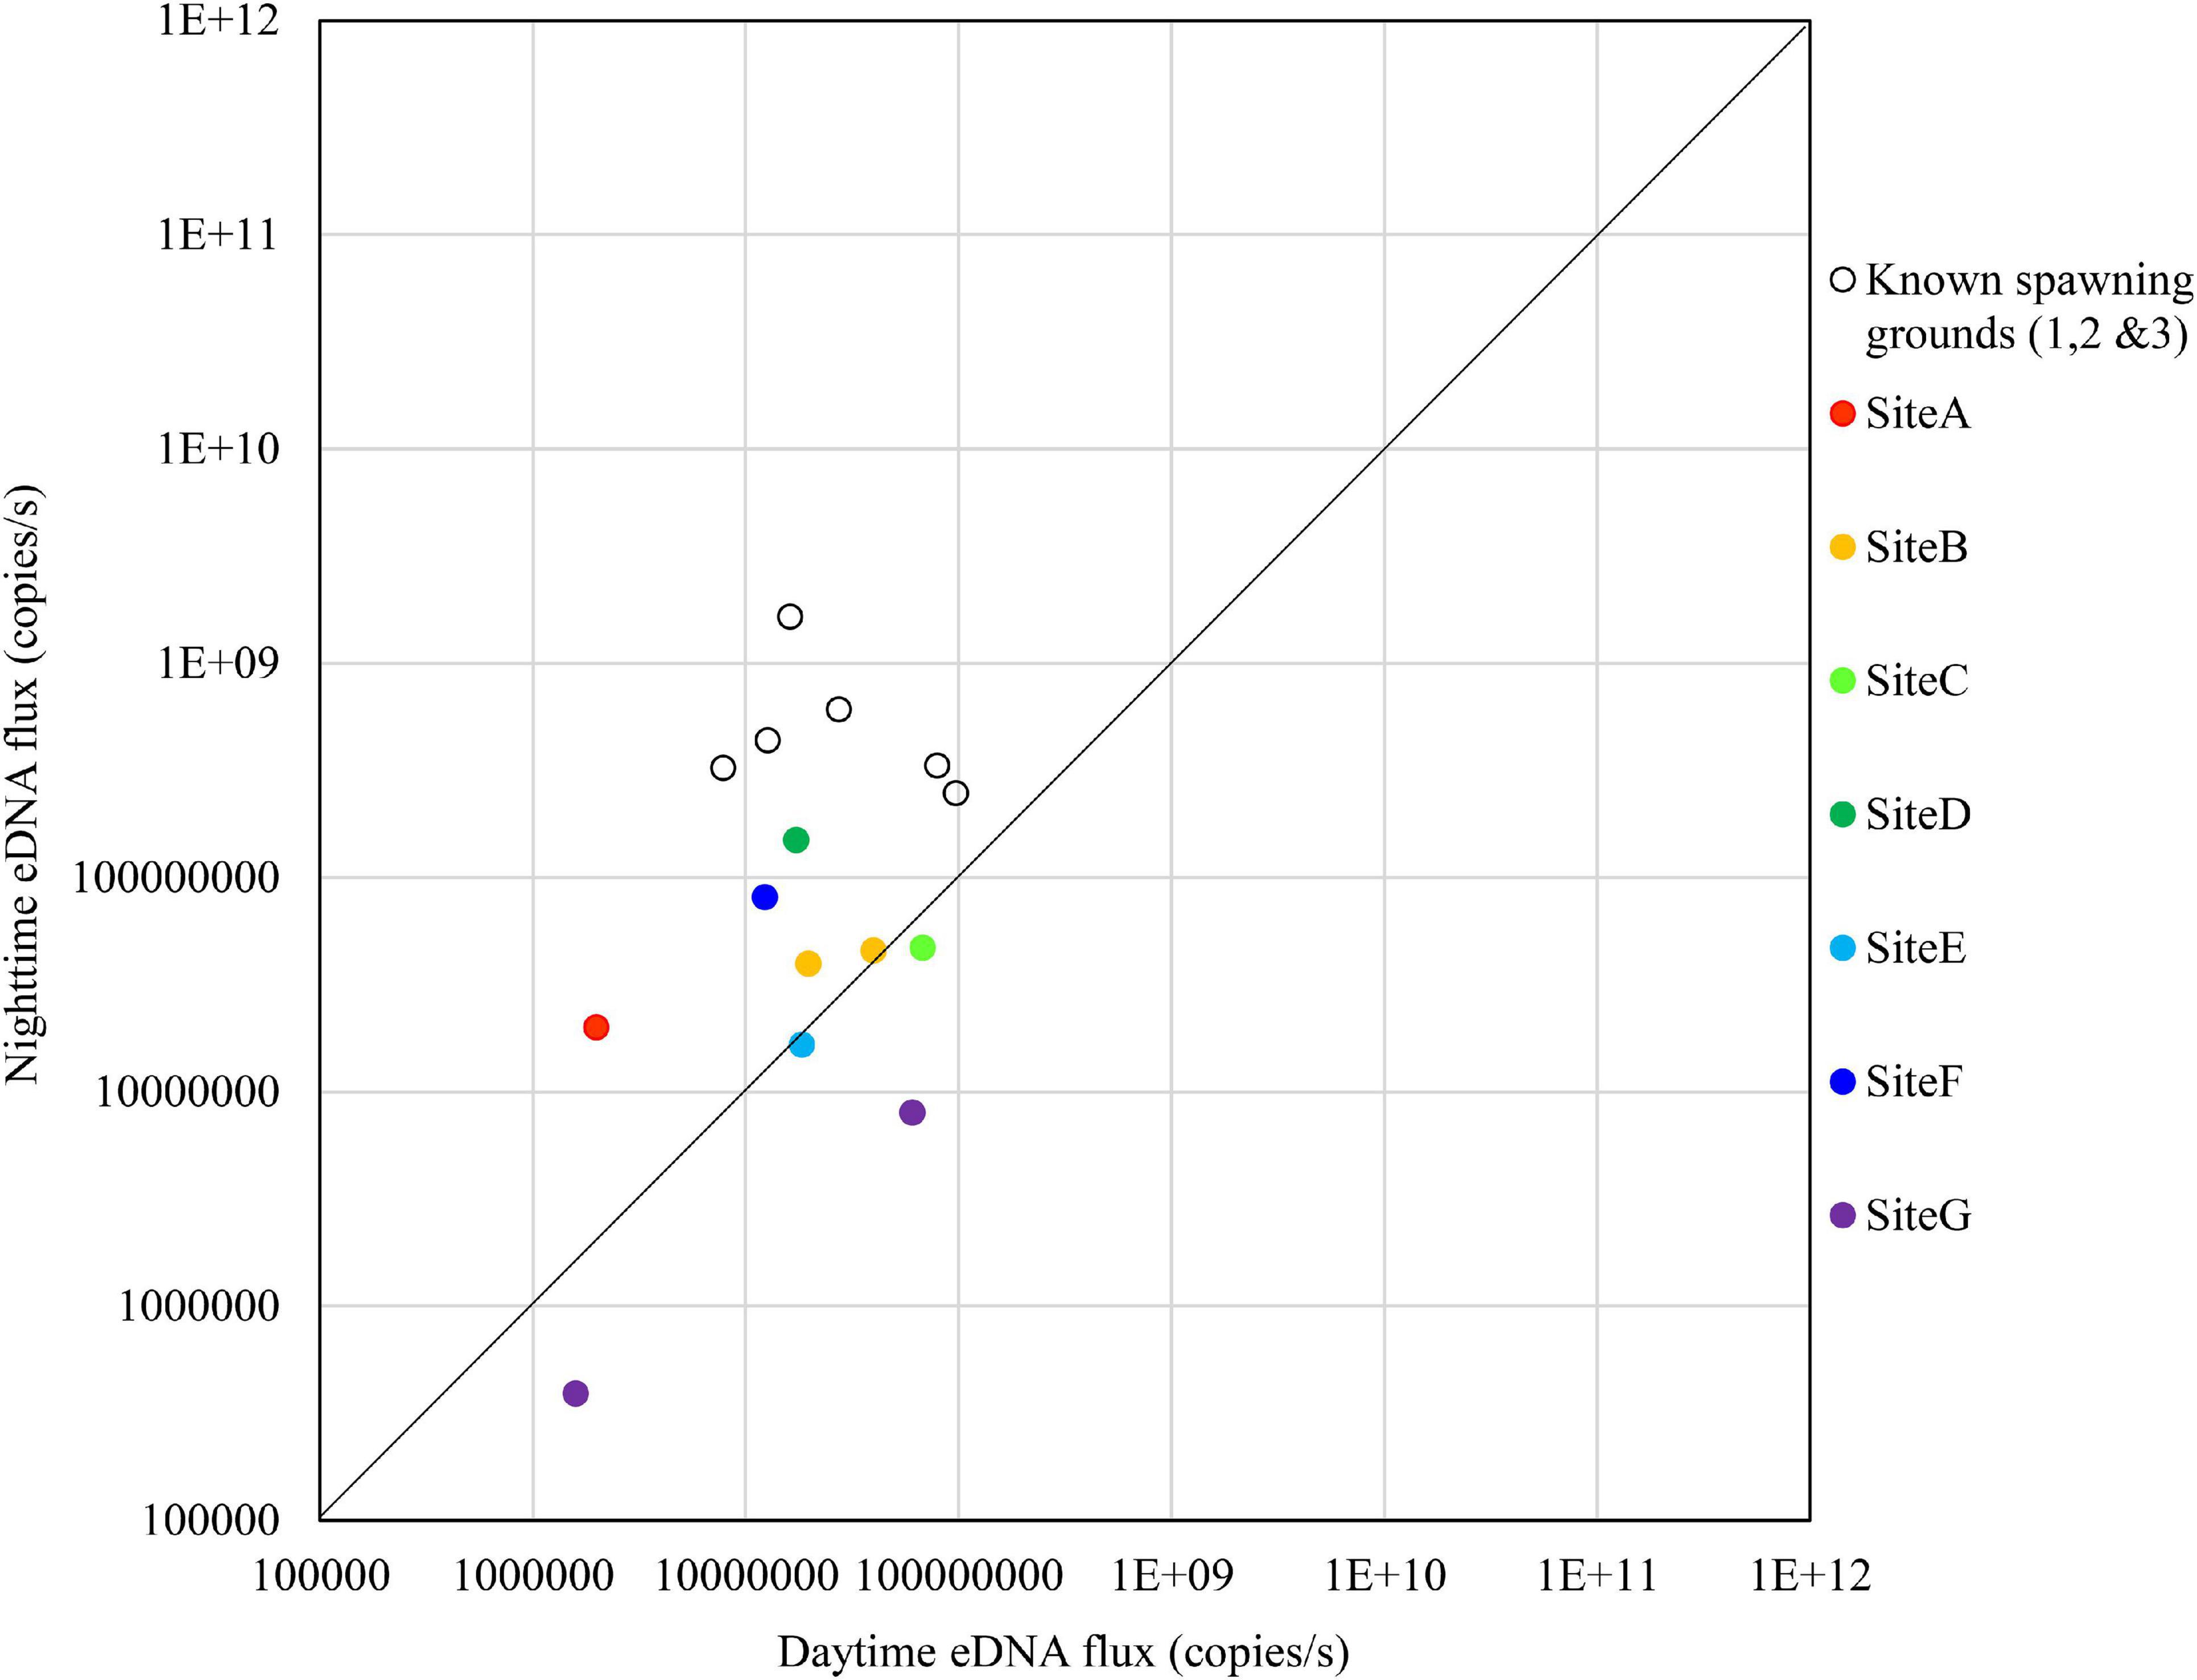
Figure 9. Comparison of daytime and nighttime environmental DNA fluxes between the potential spawning grounds (Sites A to G) and the known spawning grounds (Sites 1, 2, and 3) on November 8, 2018.
The results on November 14 are shown in Figure 10. There were no sites that exceeded the nighttime eDNA fluxes of the known spawning grounds, but Sites C, D, and F had relatively high nighttime eDNA fluxes and nighttime/daytime values.
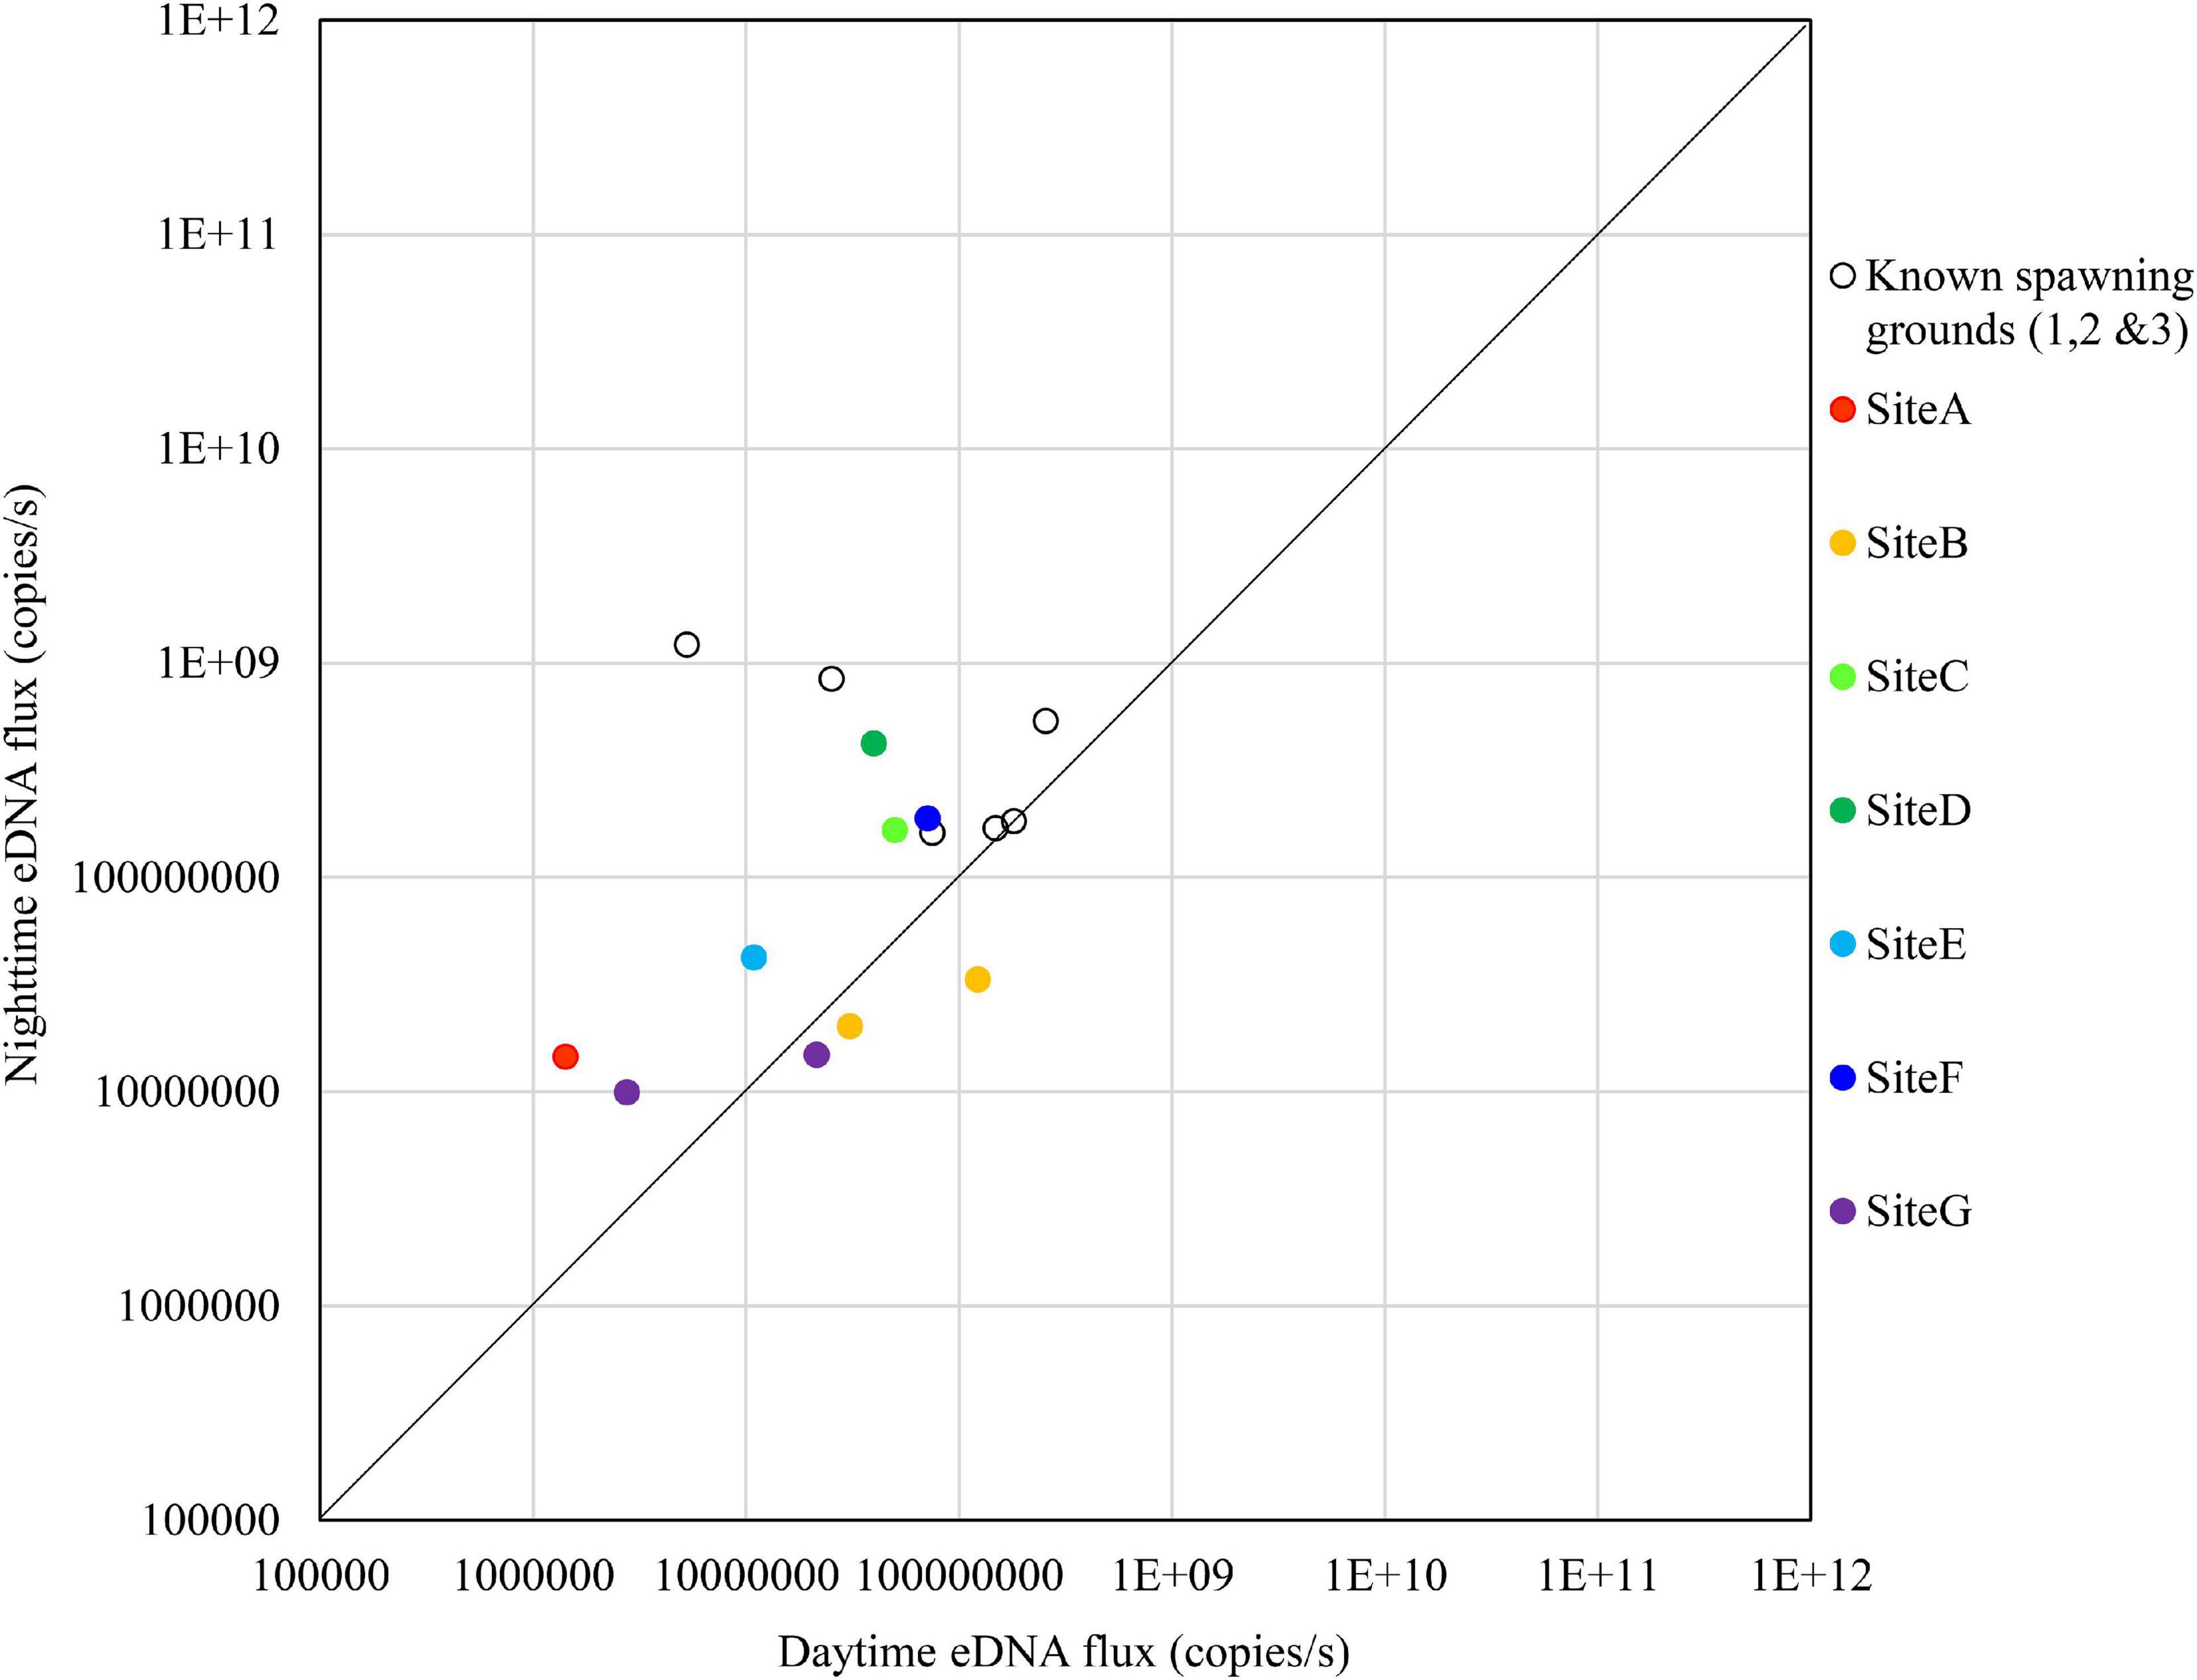
Figure 10. Comparison of daytime and nighttime environmental DNA fluxes between the potential spawning grounds (Sites A to G) and the known spawning grounds (Sites 1, 2, and 3) on November 14, 2018.
Discussion
Spawning Season
The results shown in Figures 2, 3 suggest that the spawning season was mainly in November in 2018 and in September in 2019. The eDNA concentrations and fluxes in December were lower than those in September, October, and November in both years, suggesting that the spawning season was in the final stage or had ended by December. These results suggest that although the spawning season of Ayu varied from year to year, it is in the final stages or ended by December. Tillotson et al. (2018) reported that the contribution of corpses on eDNA concentration was greater than those of the living adults in a Salmonid, Oncorhynchus nerka in an Alaskan stream. Ayu have life history traits similar to the Salmonid that the majority of adults die soon after spawning (Nishida, 2001). During our surveys, dead bodies of Ayu were rarely found. Consequently, in the Takatsu River, dead Ayu after spawning have been likely eaten up by predators or transported downstream, and probably had less biomass of corpses remaining in the river than salmon. Therefore, it is possible that the end of the Ayu spawning season can be clearly identified with eDNA.
Yoshida et al. (2019) showed that eDNA concentrations increased at night in the riffles where eggs were found, and in our study nighttime eDNA concentrations also increased during the presumed spawning season. Kono et al. (2017) showed that the peak of downstream migration for spawning was in early November and that the spawning season had ended in late November in the Takatsu River based on temporal changes in eDNA concentrations in the day. Our study provides a clearer indication of the estimated peak date and the end of the spawning season by using eDNA concentrations at night.
Changes in the Main Spawning Grounds
From the results shown in Figures 4–7, in September, Site 1 and Site 3 were used for spawning in 2018, and all sites were used for spawning in 2019. In October, Site 3 was used for spawning in 2018, and Site 2 and Site 3 were used for the spawning in 2019. In November, Site 2 and Site 3 were used for spawning in 2018, and all sites were used for spawning in 2019. Based on these results, the three known spawning sites can be characterized as follows. Site 1 is a spawning ground in the early spawning season, but is it also used in the late spawning season depending on the year. In Site 2 the frequency of use changes from year to year. Site 3 is the main spawning ground in the middle to late spawning season every year. From the results of this study, we elucidated that there could be spawning grounds that are used every year, such as Site 3, and spawning grounds that are used differently from year to year, such as Site 2.
Suitable spawning grounds for Ayu are relatively soft riverbeds consisting of gravels and cobbles (Takahashi and Azuma, 2016). It is thought that flooding helps to create such riverbeds by decreasing the embeddedness of the riverbed (Yoshida et al., 2018). Comparing the maximum annual outflows in 2018 and 2019, the former had an average daily flow of 1,253 m3/s and the latter 1,040 m3/s (Ministry of Land, Infrastructure, Transport, and Tourism, 2020). Therefore, there was no substantial difference in the maximum annual discharge between the 2 years. This suggests that the disturbance to the riverbed was not considerably different between the 2 years. Conversely, both the eDNA concentrations and fluxes were higher in 2019 than those in 2018, suggesting that the abundance of Ayu in 2019 may have been higher than in 2018 (Figures 2, 3). Therefore, we expect that adult stocks in 2018 were lower than those in 2019, and the downstream sites which are more favorable for the drifting of larvae were mainly used for spawning in 2018.
Kono et al. (2017) showed that the daytime eDNA concentrations at Site 2 and Site 3 were the highest among the known spawning grounds. However, it was not possible to determine the location of major spawning grounds from those data because their study did not compare the daytime eDNA concentrations with the nighttime eDNA concentrations and the difference in daytime eDNA concentrations between sites was small compared to the difference between the study days. The comparison of the daytime and nighttime eDNA concentrations and fluxes allowed us to identify the changes in the main spawning grounds within the study days.
Searching for New Spawning Grounds
In Sites B, C, D, E, and F, the nighttime eDNA fluxes and night/day values were high at least once during the four surveys, suggesting that these sites may have functioned as the spawning grounds. In particular, Site D could be an important spawning ground because it had high nighttime eDNA fluxes and night/day values across all four surveys. Generally, Ayu use shallow riffles as their spawning grounds. Because Site D is approximately 1 m deep, it may not have been recognized as a spawning ground until this study. There is a high probability that the eggs of Ayu will be found in Site D, if a visual survey is carried out in the future. By using the eDNA method, we were able to identify a previously unknown potential spawning site. This was one of the major discoveries of our study.
By clarifying the eDNA concentrations and fluxes of day and night samples during the spawning season, as we did in this study, we will be able to discover unknown potential spawning grounds in rivers other than the Takatsu River. In addition, we will be able to narrow down the areas of the spawning grounds of Ayu in large river systems by using eDNA to guide visual surveys of the eggs. This survey scheme will enable us to discover important, previously unknown spawning sites and reassess the value of previously known spawning grounds in each river. However, there are some limitations. For instance, in small to medium scale rivers with multiple spawning grounds it could be difficult to distinguish eDNA signals from each site owing to the short distances among the spawning sites. Yamaguchi et al. (2018) showed that the influence range of eDNA from Ayu was between 1,000 and 2,000 m; however, the eDNA concentration was reduced by half during the 80 m flow down on experimental studies. This rapid depletion of eDNA concentrations during the downstream transportation is thought to be caused not only by the eDNA degradation but also by the eDNA sedimentation (Yamaguchi et al., 2018). If the sampling sites are close to each other and the eDNA reaches the next spawning site before the sedimentation, it will be difficult to identify the spawning site with eDNA. In addition, if large Ayu farms are located near the spawning grounds, point-source contamination of Ayu eDNA could muffle the eDNA signals produced during spawning activities although there are no large Ayu farms in the Takatsu River. Furthermore, in cases where Ayu spawning grounds are not clumped in the lower reaches, employing multiple water sampling teams would enable coverage of the entire span of possible spawning grounds within a short period of time. In such cases, collaboration with fishery cooperative association and/or with residents near the river may be important for monitoring.
This study revealed the spatiotemporal variation in the spawning season and suitable spawning grounds by examining the eDNA concentrations of Ayu sampled in the daytime and nighttime at the known spawning grounds in the Takatsu River in 2018 and 2019. In addition, examining the eDNA concentrations at multiple sites in 2018 at daytime and nighttime allowed us to find new potential spawning grounds. The method used in this study will enable us to quickly identify potential spawning grounds for Ayu and to minimize harmful effects to eggs caused by surveys. Applying eDNA methods to multiple rivers will also lead to more knowledge about suitable spawning environments. Furthermore, if this monitoring method is applied to a river where the “Ochi ayu” fishery is carried out, the eDNA concentration during the daytime will indicate the existence of the main population and the eDNA concentration at night will indicate the spawning grounds. This will be important information for setting the fishing locations and catch quota.
Data Availability Statement
The original contributions presented in the study are included in the article/Supplementary Material, further inquiries can be directed to the corresponding author.
Ethics Statement
Ethical review and approval was not required for the animal study, because we only analyzed the DNA released by the fish into the river water.
Author Contributions
RI designed the plan of this study, conducted field survey, and analyzed all data. YA designed the study plan and obtained research funding. TK conducted field survey in 2018 and 2019. MS and SM conducted field survey and eDNA analysis in 2019. RN supervised the eDNA analysis of the entire study, checked the eDNA results, and instructed all co-authors on eDNA techniques. All authors contributed to the article and approved the submitted version.
Conflict of Interest
The authors declare that the research was conducted in the absence of any commercial or financial relationships that could be construed as a potential conflict of interest.
Supplementary Material
The Supplementary Material for this article can be found online at: https://www.frontiersin.org/articles/10.3389/fevo.2021.622149/full#supplementary-material
Supplementary Table 1 | Results of real-time quantitative PCR quality for each experiment in the present study.
Supplementary Table 2 | Detailed descriptions of real-time quantitative PCR results in 2018 samples.
Supplementary Table 3 | Detailed descriptions of real-time quantitative PCR results in 2019 samples.
Supplementary Table 4 | Detailed results of environmental DNA concentrations and flux analysis for individual samples used in the present study.
References
Bylemans, J., Furlan, M. E., Hardy, M. C., McGuffie, P., Lintermans, M., and Gleeson, M. D. (2017). An environmental DNA-based method for monitoring spawning activity: a case study, using the endangered Macquarie perch (Macquaria australasica). Ecol. Evol. 8, 646–655. doi: 10.1111/2041-210X.12709
Doi, H., Inui, R., Akamatsu, Y., Kanno, K., Yamanaka, H., Takahara, T., et al. (2017). Environmental DNA analysis for estimating the abundance and biomass of stream fish. Freshw. Biol. 62, 30–39. doi: 10.1111/fwb.12846
Erickson, A. R., Rees, B. C., Coulter, A. A., Merkes, M. C., McCalla, G. S., Touzinsky, F. K., et al. (2016). Detecting the movement and spawning activity of bigheaded carps with environmental DNA. Mol. Ecol. Resour. 16, 957–965. doi: 10.1111/1755-0998.12533
Hayer, C., Bayless, F. M., George, A., Thompson, N., Richter, A. C., and Chapman, C. D. (2020). Use of environmental DNA to detect grass carp spawning events. Fishes 5:27. doi: 10.3390/fishes5030027
Inui, R., Akamatsu, Y., Okada, S., Kono, T., and Nakao, R. (2020). A comparison of Plecoglossus altivelis spawning season in Shimanto River and Takatsu River using environmental DNA–The effect of water temperature. Adv. Riv. Eng. 26, 331–336.
Inui, R., Kono, T., Akamatsu, Y., Goto, M., and Yamaguchi, K. (2019). Examination of an appropriate method to monitor the spawning ground of Plecoglossus altivelis using environmental DNA – focusing on timely examination. Adv. Riv. Eng. 25, 429–434.
Inui, R., Takahashi, I., Goto, M., Akamatsu, Y., and Kawaguchi, Y. (2018). Monitoring the use of artificial spawning grounds for Plecoglossus altivelis altivelis at the Nahari River – focusing on the comparison between visual survey and environmental DNA analysis. Adv. Riv. Eng. 24, 333–338.
Kono, T., Akamatsu, Y., Goto, M., and Inui, R. (2017). Quantification of Plecoglossus altivelis using environmental DNA and trial of monitoring of downstream migration. Adv. Riv. Eng. 23, 669–674.
Minister of Agriculture, Forestry and Fisheries (2016). Data From: Fishery and Aquaculture Production Statistics in 2014, National Production by Year and Fish Type From 2004 to 2014. Digital Repository of Minister of Agriculture, Forestry and Fisheries. Available online at: https://www.maff.go.jp/j/tokei/kouhyou/kaimen_gyosei/ [accessed Oct. 1, 2020]
Ministry of Land, Infrastructure, Transport, and Tourism (2020). Data From: Site Information for Takatsuno. Water Information System. Available online at: http://163.49.30.82/cgi-bin/SiteInfo.exe?ID=307061287707040 [accessed Oct. 1, 2020]
Nishida, M. (2001). “Ayu,” in Freshwater Fishes of Japan, eds H. Kawanabe, N. Mizuno, and K. Hosoya (Tokyo: Yama-Kei Press), 66–79.
Saito, M., Inui, R., Kono, T., Akamatsu, Y., Nakao, R., and Kobayashi, K. (2020). Examinations on appropriate time of a day for evaluating spawning intensity of Plecoglossus altivelis altivelis using environmental DNA in the Takatsu River, Western Japan. J. Jpn. Soc. Civil Eng. Ser. B1 (Hydraul. Eng.) 76, I_1315–I_1320.
Thalinger, B., Wolf, E., Traugott, M., and Wanzenböck, J. (2019). Monitoring spawning migrations of potamodromous fish species via eDNA. Nature Sci. Rep. 9:15388. doi: 10.1038/s41598-019-51398-0
Tillotson, D. M., Kelly, P. R., Duda, J. J., Hoy, M., Kralj, J., and Quinn, P. T. (2018). Concentrations of environmental DNA (eDNA) reflect spawning salmon abundance at fine spatial and temporal scales. Biol. Conserv. 220, 1–11. doi: 10.1016/j.biocon.2018.01.030
Yamaguchi, K., Akamatsu, Y., Inui, R., Goto, M., Kono, T., and Kurita, Y. (2018). Fundamental study on the dynamics of materials containing eDNA in rivers. J. Jpn. Soc. Civil Eng. Ser. B1 (Hydraul. Eng.) 74, I_409–I_414.
Yamanaka, H., and Minamoto, T. (2016). The use of environmental DNA of fishes as an efficient method of determining habitat connectivity. Ecol. Indic. 62, 147–153. doi: 10.1016/j.ecolind.2015.11.022
Yamanaka, H., Minamoto, T., Matsuura, J., Sakurai, S., Tsuji, S., Motozawa, H., et al. (2017). A simple method for preserving environmental DNA in water samples at ambient temperature by addition of cationic surfactant. Limnology 18, 233–241. doi: 10.1007/s10201-016-0508-5
Yatsuyanagi, T., Ishida, R., Sakata, K. M., Kanbe, T., Mizumoto, H., Kobayashi, Y., et al. (2020). Environmental DNA monitoring for short-term reproductive migration of endemic anadromous species. Shishamo smelt (Spirinchus lanceolatus). EDNA. 2, 130–139. doi: 10.1002/edn3.50
Yoshida, K., Inui, R., Udagawa, R., Maeno, S., Akamatsu, Y., Nigo, S., et al. (2019). Spawning habitat potential evaluation for Ayu using an environmental DNA analysis in the lower Asahi River with degraded riverbed. J. Jpn. Soc. Civil Eng. Ser. B1 (Hydraul. Eng.) 75, 529–534. ∗vol,Google Scholar
Yoshida, K., Maeno, S., Takahashi, S., Nigo, S., Ogawa, S., and Akoh, R. (2018). Physical environmental evaluation of the spawning for Ayu based on estimation of flow field and sediment behavior using ALB data in the lower Asahi River. J. Jpn. Soc. Civil Eng. Ser. B1 (Hydraul. Eng.) 74, I_421–I_426.
Keywords: Plecoglossus altivelis, amphidromous fish, fishery, river, spawning, eDNA, qPCR, Japan
Citation: Inui R, Akamatsu Y, Kono T, Saito M, Miyazono S and Nakao R (2021) Spatiotemporal Changes of the Environmental DNA Concentrations of Amphidromous Fish Plecoglossus altivelis altivelis in the Spawning Grounds in the Takatsu River, Western Japan. Front. Ecol. Evol. 9:622149. doi: 10.3389/fevo.2021.622149
Received: 27 October 2020; Accepted: 08 March 2021;
Published: 29 March 2021.
Edited by:
Matthew A. Barnes, Texas Tech University, United StatesReviewed by:
Bettina Thalinger, University of Guelph, CanadaTakashi Yada, Japan Fisheries Research and Education Agency (FRA), Japan
Copyright © 2021 Inui, Akamatsu, Kono, Saito, Miyazono and Nakao. This is an open-access article distributed under the terms of the Creative Commons Attribution License (CC BY). The use, distribution or reproduction in other forums is permitted, provided the original author(s) and the copyright owner(s) are credited and that the original publication in this journal is cited, in accordance with accepted academic practice. No use, distribution or reproduction is permitted which does not comply with these terms.
*Correspondence: Ryutei Inui, aW51aXJ5dXRlaUBnbWFpbC5jb20=
 Ryutei Inui
 Yoshihisa Akamatsu2
 Minoru Saito
 Ryohei Nakao