
94% of researchers rate our articles as excellent or good
Learn more about the work of our research integrity team to safeguard the quality of each article we publish.
Find out more
ORIGINAL RESEARCH article
Front. Ecol. Evol., 12 April 2021
Sec. Conservation and Restoration Ecology
Volume 9 - 2021 | https://doi.org/10.3389/fevo.2021.621749
This article is part of the Research TopicAvian Biodiversity Collapse in the Anthropocene: Drivers and ConsequencesView all 17 articles
 Montague H. C. Neate-Clegg1*
 Samuel E. I. Jones2,3
 Joseph A. Tobias4
 William D. Newmark5
 Çaǧan H. Şekercioǧlu1,6
Globally, birds have been shown to respond to climate change by shifting their elevational distributions. This phenomenon is especially prevalent in the tropics, where elevational gradients are often hotspots of diversity and endemism. Empirical evidence has suggested that elevational range shifts are far from uniform across species, varying greatly in the direction (upslope vs. downslope) and rate of change (speed of elevational shift). However, little is known about the drivers of these variable responses to climate change, limiting our ability to accurately project changes in the future. Here, we compile empirical estimates of elevational shift rates (m/yr) for 421 bird species from eight study sites across the tropics. On average, species shifted their mean elevations upslope by 1.63 ± 0.30 m/yr, their upper limits by 1.62 m ± 0.38 m/yr, and their lower limits by 2.81 ± 0.42 m/yr. Upslope shift rates increased in smaller-bodied, less territorial species, whereas larger species were more likely to shift downslope. When considering absolute shift rates, rates were fastest for species with high dispersal ability, low foraging strata, and wide elevational ranges. Our results indicate that elevational shift rates are associated with species’ traits, particularly body size, dispersal ability, and territoriality. However, these effects vary substantially across sites, suggesting that responses of tropical montane bird communities to climate change are complex and best predicted within the local or regional context.
Both biodiversity and endemism are associated with elevational gradients in the tropics (Myers et al., 2000; Orme et al., 2005; Quintero and Jetz, 2018). Topographic complexity and steep climatic gradients (Rahbek et al., 2019b) coupled with dynamic orogenic and climatic histories have promoted high diversity (Rahbek et al., 2019a), high species turnover (Jankowski et al., 2013; McFadden et al., 2019), and high levels of ecological specialization (Salisbury et al., 2012) in tropical mountains. Climate change imperils many species that inhabit narrow elevational gradients (Şekercioǧlu et al., 2008), threatening to reduce their elevational ranges and eventually drive them to extirpation or extinction (Pounds et al., 1999; Freeman et al., 2018a, b). Despite this threat, the responses of tropical montane species to climate change vary substantially, but the ecological drivers of this variation remain unresolved.
Among animals, elevational shifts have been most widely documented in birds, with studies across the tropics revealing consistent upslope movements in bird communities (Freeman and Class Freeman, 2014; Freeman et al., 2018b; Neate-Clegg et al., 2018, 2020b). Yet, despite the prevalence of these elevational shifts, there is significant variation in the rate at which species have shifted between regions and between species (Freeman et al., 2018a; Mamantov et al., 2021). The overall shift rates generally lag behind those expected based on the local temperature increase and lapse rate (Forero-Medina et al., 2011b). Moreover, while most species tend to shift upslope as predicted, between a third and a fifth of species shift downslope (Forero-Medina et al., 2011b; Freeman and Class Freeman, 2014; Freeman et al., 2018b; Mamantov et al., 2021). Such variation suggests that elevational shifts are complex and site or species-specific (Fadrique et al., 2018), and that species are not simply tracking shifting climate envelopes.
Increased temperature has been predicted to drive the elevational distributions of montane species higher as they track their preferred thermal envelopes and corresponding vegetation upslope (Şekercioǧlu et al., 2008; La Sorte and Jetz, 2010). However, contemporary research has suggested that a suite of biotic and abiotic variables – either alone, or in combination – determine species’ elevational ranges (Jankowski et al., 2012). For example, abiotic variables such as precipitation can be an important driver of the elevational ranges of birds (Gasner et al., 2010; McCain and Colwell, 2011; Tingley et al., 2012; Boyle et al., 2020; Neate-Clegg et al., 2020b). However, the mechanisms by which abiotic variables constrain species distributions are not necessarily direct (Jankowski et al., 2012; Lister and Garcia, 2018), especially in endotherms (Aragón et al., 2010). Indeed, evidence for the direct role of temperature in placing physiological constraints on the elevational ranges of tropical birds appears to be weak (Freeman, 2016; Londońo et al., 2017) in comparison to the role of indirect biotic factors such as resource availability (Schumm et al., 2020), habitat (Jankowski et al., 2013; Elsen et al., 2017), competition (Jankowski et al., 2010; Freeman et al., 2019), interactions with natural enemies (Paxton et al., 2016), or combinations of these factors (Srinivasan et al., 2018; Jones et al., 2019). Thus, because of the multitude of ways that abiotic and biotic factors drive species elevational distributions, it is unsurprising that climate-associated elevational range shifts are not uniform.
Several related ecological traits could lead to variation in species’ ability to shift their elevational ranges (Angert et al., 2011; Reif and Flousek, 2012; MacLean and Beissinger, 2017). For example, shift rates could be linked to diet. Frugivores and nectarivores tend to have more elongated wings (Sheard et al., 2020) and higher gap-crossing ability (Lees and Peres, 2009), which is likely driven by the need to search for patchily distributed resources. These traits contrast with those of insectivorous birds which tend to have smaller home ranges (Laurance et al., 2004; Newmark et al., 2010) and lower dispersal capability (Şekercioǧlu, 2002). Similarly, species that occupy the forest canopy tend to be more vagile, and are thus more capable of crossing forest gaps than are terrestrial and understory species (Lees and Peres, 2009; Salisbury et al., 2012; Smith et al., 2014). Territorial behavior may also influence responses to climate change because species that defend year-round territories may be less likely to undergo rapid changes in distribution (Tobias et al., 2016; Sheard et al., 2020) or may be constrained by interactions with closely related species occurring upslope (Jankowski et al., 2010; Freeman et al., 2019). Forest-dependent species may also be less inclined to shift (Ibarra-Macias et al., 2011), especially if forested elevational gradients have become degraded and fragmented (Anderson et al., 2012). Each of these traits imply differing levels of dispersal ability, where birds with greater dispersal ability are theoretically more capable of shifting with changing climate. In other words, shift rates may be greater for species that are more likely to move or move greater distances. Finally, the extent of a species’ elevational range may itself influence shift rates (Mamantov et al., 2021). Species with wide elevational ranges can live within a wide breadth of abiotic and biotic conditions while species with narrower elevational ranges necessarily have narrower realized niches and may therefore be more sensitive to change.
While several studies have attempted to investigate the ecological drivers that determine variation in elevational shift rates (Forero-Medina et al., 2011b; Freeman and Class Freeman, 2014; Freeman et al., 2018b), these studies have not found pervasive evidence for a consistent role of diet, body size, or foraging strata. However, these studies have focused on single systems, limiting our ability to interpret the power of contributory factors. Pooling data across studies and utilizing comprehensive species-level ecological data could thus provide insights not detected at the local level. In this study, we combine data on the shift rates of birds along elevational gradients from eight tropical study sites. We determine whether species are shifting upslope on average, and whether the shift rates differ between species’ upper and lower range limits. We then investigate the ecological drivers of variation in shift rates. In the absence of global warming, we would expect shift rates to average ≈ 0, with similar proportions of species shifting upslope and downslope reflecting the natural expansions and contractions of ranges. However, given widespread temperature increases, we predict that species will have shifted upslope on average. We also predict that lower elevational limits will shift at a similar rate to upper elevational limits. We hypothesize that shift rates will be greater for larger, herbivorous, canopy-foraging, less territorial species with low forest dependency, high dispersal ability and narrow elevational ranges.
We collated published datasets of shift rates in the elevational distributions of tropical forest bird species. Studies were included only if they (a) occurred within the tropics, (b) occurred within forest, (c) included ≥ 1 tropical bird species, (d) had a known duration with at least two time points from which to calculate shift rates, and (e) were not based on anecdotal observations of extralimital individuals. We identified a total of seven studies across eight elevational gradients, comprising a total of 421 species (Figure 1; Table 1). The studies varied in duration from 10 to 47 years and used different survey methods, predominantly point counts and/or mist netting (Table 1). Studies also varied in the manner in which they estimated the elevational ranges of species. Some studies estimated shifts in species’ mean elevations (Forero-Medina et al., 2011b; Neate-Clegg et al., 2018), while others estimated shifts in species’ upper and lower range limits (Freeman and Class Freeman, 2014; Campos-Cerqueira et al., 2017), and some provided all three (Freeman et al., 2018b; Neate-Clegg et al., 2020b). Finally, while most of the gradients were continuously forested, two studies were characterized by disturbance with either large distances between forest blocks (Neate-Clegg et al., 2021) or some deforestation at lower elevations (Neate-Clegg et al., 2018).
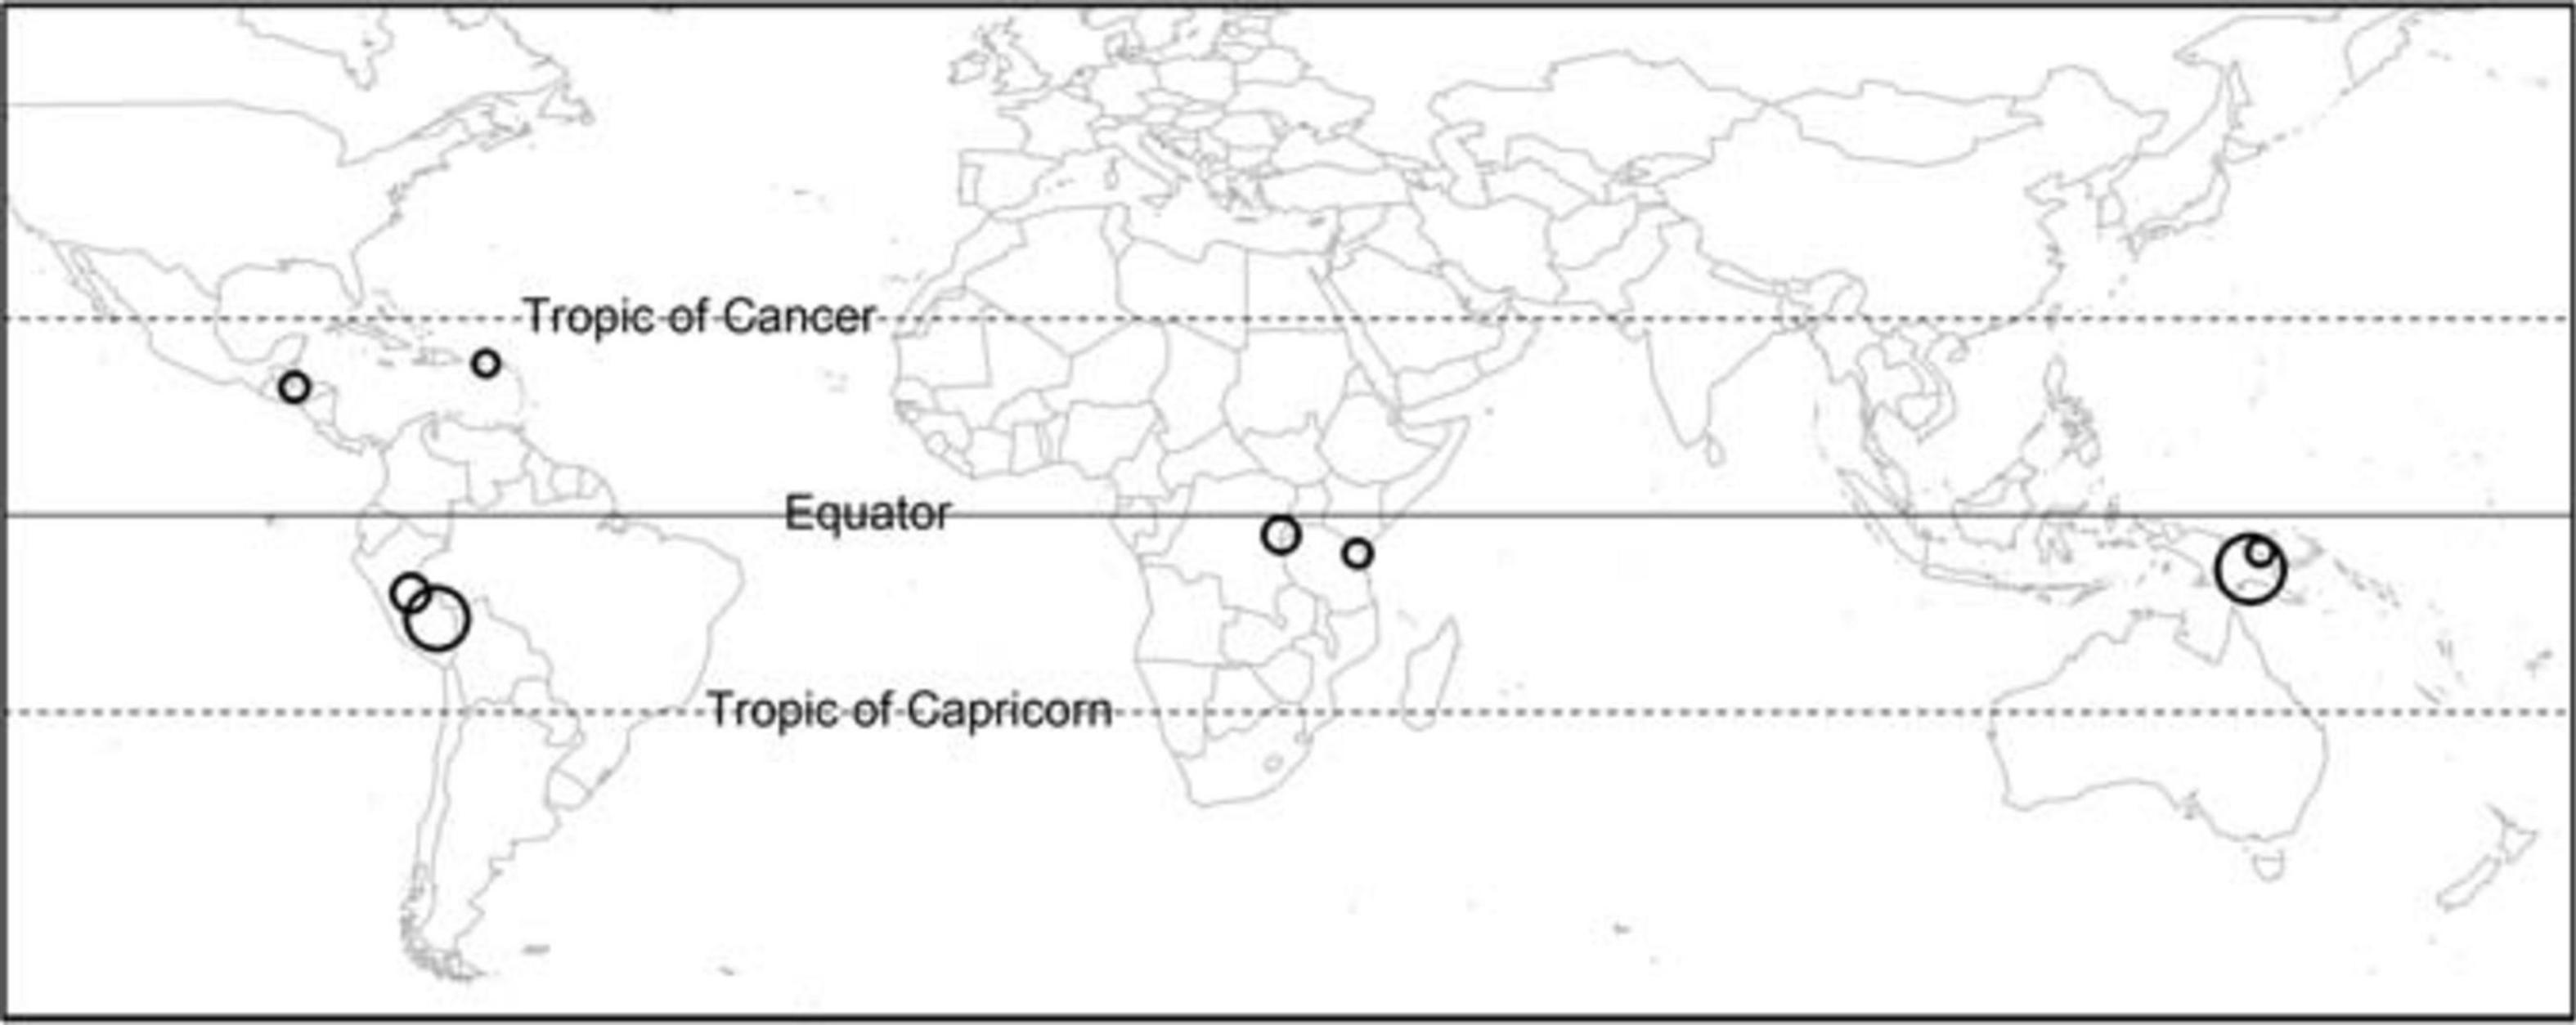
Figure 1. A map of study locations (n = 8), with point sizes proportional to the number of species included in the study (ranging from 21 to 138).
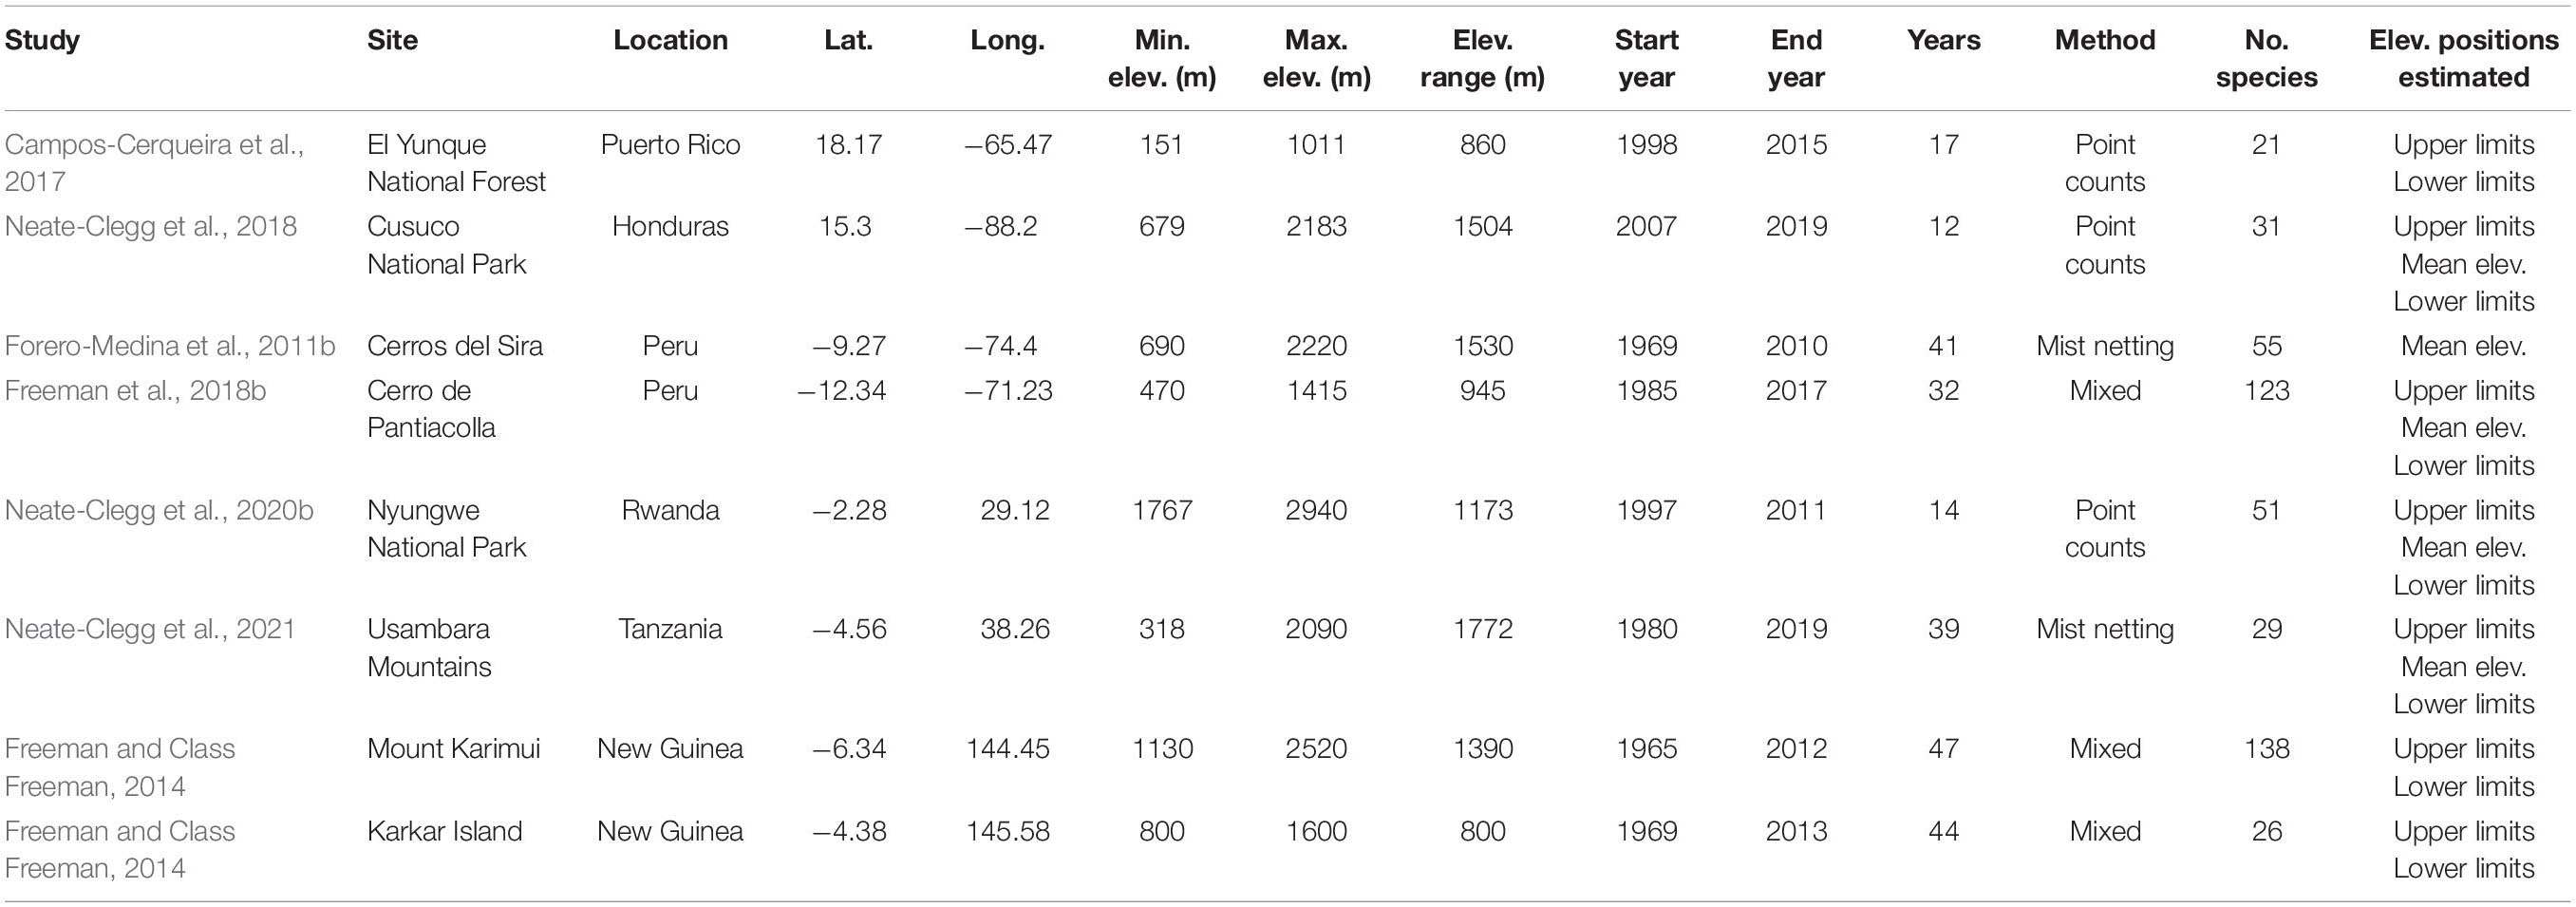
Table 1. Meta-data for eight elevational gradients used to analyze elevational shift rates in tropical birds.
Five studies were multi-decadal resurveys of elevational gradients. Forero-Medina et al. (2011b) resurveyed a gradient of five mist-netting sites in Cerros del Sira, Peru, and estimated the mean elevations of species at both time points. They calculated the differences in elevation for each species, correcting for differences expected by chance. Elsewhere in Peru (Cerro de Pantiacolla), Freeman et al. (2018b) used a variety of techniques to calculate differences in the mean elevations of species (using mist-netting data) and range limits (using ad libitum observations and autonomous soundscape recordings, rounded to the nearest 50 m) between two time points. Freeman and Class Freeman (2014) resurveyed two elevational gradients in New Guinea on Karkar Island and Mount Karimui. They used a variety of data sources (mist netting, collected specimens, point counts, ad libitum observations) to calculate differences in species’ upper and lower limits between two time points. All three studies employed techniques to correct for differences in sample size. In El Yunque National Forest, Puerto Rico, Campos-Cerqueira et al. (2017) compared species’ range limits between a historical point count dataset and a contemporary acoustic dataset using occupancy models that controlled for differences in detectability.
In a another study in the Usambara Mountains, Tanzania, we resurveyed an elevational gradient of seven sites ranging from approximately 300 to 2100 m asl that were originally surveyed in 1980 (Neate-Clegg et al., 2021). We identified 29 species that were caught at least twice in both time periods (1980, 2019). For each species we estimated the mean elevation and 95% range limits (2.5 and 97.5 percentiles; see Neate-Clegg et al., 2020b) for both time points and calculated shifts in the three metrics between the two time points. We corrected the shifts for variation in elevation that would exist by chance alone due to the differences in capture rates (following Forero-Medina et al., 2011b).
The two remaining studies used annual point count data to estimate shift rates over time. In Nyungwe National Park, Rwanda, Neate-Clegg et al. (2020b) estimated changes over time in species’ mean elevations and 95% range limits (2.5 and 97.5 percentiles), correcting for biases in survey effort over time. In Cusuco National Park, Honduras, Neate-Clegg et al. (2018) used ten years of annual point count data to estimate changes in the mean elevations of 20 cloud forest bird species. Here, we expand the analysis from that study (Supplementary Table 1) to include (1) data spanning 12 years (2007–2019; Jones et al., 2019 data), (2) all species that were recorded at least twice every year, and (3) changes over time in upper and lower range limits. We removed four species that form large aerial flocks that could produce highly skewed results. For the remaining 31 species, we calculated the mean elevation and 95% range limits (2.5 and 97.5 percentiles) for every year and conducted a linear model of elevation against year for each of the three metrics (see Neate-Clegg et al., 2020b). The year coefficients from each model were used as the shift rates for those species.
Some studies reported total elevational shifts over time (Forero-Medina et al., 2011b; Freeman and Class Freeman, 2014; Campos-Cerqueira et al., 2017; Freeman et al., 2018b) while others estimated annual shift rates (m/yr) (Neate-Clegg et al., 2018, 2020b). For comparability across studies, we converted total elevational shifts to shift rates (m/yr) by dividing the total shift by the duration of the study. We then combined the shift rates of all studies together. In total, shift rate data were compiled for 421 species. We compiled 235 mean elevation shift rates, 236 lower limit shift rates, and 346 upper limit shift rates, totaling 817 shift rate estimates. Some species (e.g., Arremon brunneinucha, Chlorospingus flavopectus) were represented multiple times (max 3) across different elevational gradients but were treated independently in the analyses to more accurately reflect the local drivers of elevational shifts.
Before testing the ecological drivers of elevational shifts, we tested for phylogenetic signal to assess whether elevational shift rates covaried with shared ancestry. We acquired 500 phylogenetic trees from birdtree.org (Jetz et al., 2012) and created a consensus tree (package Phytools; Revell, 2012). For the 421 species in our study, two pairs of species (Momotus momota and M. lessonii, Turdus abyssinicus and T. roehli) represented recent taxonomic splits recognized by Birdlife International (2020) that were not recognized by Jetz et al. We therefore averaged values for those species pairs when testing for phylogenetic signal. When species were represented multiple times from different study systems (e.g., Arremon brunneinucha), we also averaged values for those species across systems. We used Pagel’s λ in the R package Phytools (Revell, 2012) to estimate the phylogenetic signal. As an example, both log(body mass) and log(HWI) (nspecies = 419) showed a significant phylogenetic signal (body mass: λ = 0.42, p = 0.008; HWI: λ = 0.18, p = 0.005). We tested for phylogenetic signal in mean elevation shift rate, upper limit shift rate, and lower limit shift rate. In all three instances, λ was nominal (<0.0001) and non-significant (p ≈ 1) and thus we concluded there was no phylogenetic signal in shift rates. We therefore did not consider the role of phylogeny any further and consequently did not average shift rates for species with multiple records.
We collated species-level ecological data from a variety of datasets (Supplementary Table 2), including BirdBase (see Şekercioǧlu et al., 2004, 2019; Neate-Clegg et al., 2020a), EltonTraits (Wilman et al., 2014), and other published global data sources (e.g., Tobias et al., 2016; Pigot et al., 2020; Sheard et al., 2020). From BirdBase we extracted: body mass, primary diet, ecological specialization, and elevational range for each species. Most of these data were collated from the Handbook of the Birds of the World Alive (del Hoyo et al., 2019), now Birds of the World (Billerman et al., 2020), augmented with other sources including BirdLife International (Birdlife International, 2020) and the ornithological literature (see Şekercioǧlu et al., 2004). Primary diet was initially assigned to one of seven categories: carnivore, frugivore, herbivore (generalist plant eater), invertivore, nectarivore, omnivore, and granivore. However, because our hypotheses were based largely on trophic level, we grouped primary diet into three categories: carnivores, omnivores, and herbivores. Ecological specialization is an index calculated from species’ dietary breadth and habitat breadth values (Şekercioǧlu, 2011). Dietary breadth is a count of how many different major categories of food a species feeds on (such as invertebrates, fruits or seeds; max = 4 in this study) while habitat breadth is a count of how many different major habitat types a species can be found in (categories such as forest, grassland, wetland, etc; max = 8 in this study). Specialization was calculated as log10(100/[dietary breadth x habitat breadth]) with a maximum of 2 for the most specialized species that only feed on one major food group and live in one major type of habitat (e.g., forest frugivore; Şekercioǧlu, 2011). Forest dependency was categorized by BirdLife International (Birdlife International, 2020) as “high,” “medium,” or “low” (two “non-forest” species were also categorized as “low”). We converted forest dependency to a rating from 3 (high) to 1 (low).
We extracted data on foraging strata from EltonTraits (Wilman et al., 2014). Foraging strata was originally classified as the percent of time spent in each of five strata: ground, understory, midstory, canopy, and aerial. For example, a species could spend 20% of its time on the ground, 70% of its time in the understory and 10% of its time in the midstory. However, we hypothesized that shift rates would increase with foraging strata and so, to reflect this hypothesis, we constructed a single metric of foraging strata. We calculated the weighted average across the five strata where each stratum was rated from 1 (ground) to 5 (aerial). Using the above example, the average foraging strata would be ([1 × 20 + 2 × 70 + 3 × 10]/100 = 1.9).
We extracted information from other global datasets of hand-wing index (Sheard et al., 2020) and territoriality (Tobias et al., 2016). Hand-wing index is a single-parameter proxy of avian flight efficiency and dispersal ability (Sheard et al., 2020) that measures the ratio of Kipp’s distance (the distance between the tip of the longest primary feather and the tip of the first secondary feather) to the wing chord. Birds with long, pointed wings tend to have higher flight capability and higher HWI (e.g., Ocreatus underwoodii, HWI = 68.7) while birds with short, rounded wings tend to have lower flight capability and lower HWI (e.g., Myrmothera campanisona, HWI = 6.8). Territoriality was categorized numerically from 1 to 3 where 1 = non-territorial species, 2 = seasonal or weak territoriality, and 3 = year-round territoriality (Tobias et al., 2016).
To address possible issues of collinearity, we tested the pairwise correlation of all ecological covariates. Correlation between covariates was generally low (mean Pearson’s r = 0.15), with the highest correlation between log(HWI) and territoriality (r = 0.53; Supplementary Table 3). Because all correlation coefficients were below 0.7 (Dormann et al., 2013) we included all covariates in the modeling process. We later tested for multicollinearity by calculating the variance inflation factors (VIF) of the covariates in the models (function “vif” in package car). VIFs were all < 3, suggesting no issue of multicollinearity, particularly for HWI and territoriality (Zuur et al., 2010).
We first tested whether shift rates were statistically different from 0. We used t-tests for each elevational position: mean elevation, upper limit, and lower limit. We also tested for statistical differences in shift rates between the three positions using a linear mixed model with position as a fixed effect and location and species as random effects. We then modeled the shifts in species’ mean elevations, upper limits, and lower limits in separate linear models that contained the eight ecological explanatory variables as detailed above: log(mass), log(HWI), primary diet, foraging strata, forest dependency, ecological specialization, territoriality, and elevational range. All numerical variables were scaled to have a mean of 0 and a standard deviation of 1 to make their coefficients comparable. We also included the study location (nlocations = 8) as a fixed effect to test for differences between study sites which could result from landscape properties, rates of local warming (Román-Palacios and Wiens, 2020), study design, field protocols, and analytical methods. We initially considered using location as a random effect in linear mixed-models. However, with only five factor levels in some models, the variance explained by the random effect was 0 and we thus adopted a non-hierarchical modeling approach.
For each shift position (mean elevation, upper limit and lower limit) we began by creating a global model containing all covariates. We then used the function “dredge” from the R package MuMIn (Bartoń, 2015) to run models for every possible subset of covariates (512 models), to rank those models based on AICc, and to provide a model weight (relative likelihood) for each model (Burnham and Anderson, 2002). For each shift position, we provide results for the covariates in the model with the lowest AICc, including the multiple and adjusted R2 values. To assess the importance of those covariates among other competing models, we summed the model weights of all the models containing each covariate (Burnham and Anderson, 2002), and tabulated how often the covariates appeared in competing models. We used a traditional cut-off for competing models of ΔAICc < 2 (Burnham and Anderson, 2002) but we also present results for a more conservative cut-off of ΔAICc < 6 which is increasingly being used (Harrison et al., 2018).
Shift rates can be decomposed into two facets: shift direction and shift speed. The factors that affect whether a species moves upslope or downslope may differ from the factors that determine the speed of shift. To test these two facets, we conducted two additional analyses. In the first analysis we converted shift rates to a binary variable (1 = downslope, 0 = upslope) to calculate the proportion of downslope shifts, excluding any shift rates of 0 m/yr. To assess whether this proportion differed significantly from 50%, we performed a binomial exact test on all shift rates combined. We also tested for statistical differences in proportions between the three positions using a generalized linear mixed model with binomial errors and position as a fixed effect and location and species and random effects. We then tested which ecological traits predicted whether a species shifted downslope rather than upslope using a generalized linear mixed-model including the same set of explanatory variables, with a logistic error structure and a binary response variable. R2 cannot be calculated for a logistic model and so we calculated Nagelkerke’s Index as a pseudo-R2 (Nagelkerke, 1991). In the second analysis, we calculated the absolute values of the shift rates, i.e., |shift rate (m/yr)|. We then used these shift rates as the response variables in similarly, structured linear models. In both set of analyses, we again modeled the shift rates of mean elevation, upper limits, and lower limits separately, and repeated the approach of multi-model comparison and inference.
Finally, shift rates can be further decomposed into either range expansions and contractions. To test whether different traits favor elevational range expansions or contractions, we divided upper limit shifts into upper limit expansions (shifts upslope) and upper limit contractions (shifts downslope). Similarly, we divided lower limit shifts into lower limit expansions (shifts downslope) and lower limit contractions (shifts upslope). We tested for the statistical differences in shift rates between the four categories using a linear mixed model with category as a fixed effect and location and species as random effects. For each of these four shift categories, we followed the same modeling procedure as above. We excluded any shifts = 0.
All analyses were conducted in R v. 3.6.1 (R Core Team, 2020).
Shift rates differed significantly at species’ mean elevations, upper limits and lower limits (χ22 = 8.68, p = 0.013; Figure 2A). Species shifted their mean elevations (nshifts = 235) upslope on average by 1.63 ± 0.30 m/yr (t234 = 5.38, p < 0.001); their upper limits (nshifts = 346) upslope by 1.62 ± 0.38 m/yr (t345 = 4.27, p < 0.001); and their lower limits (nshifts = 236) upslope by 2.81 ± 0.42 m/yr (t235 = 6.72, p < 0.001). Because shift rates were generally greater at species’ lower limits than their upper limits, the elevational ranges of many species contracted. For 210 species with both upper and lower limits shift rate estimates, species’ elevational ranges on average contracted 1.64 ± 0.83 m/yr.
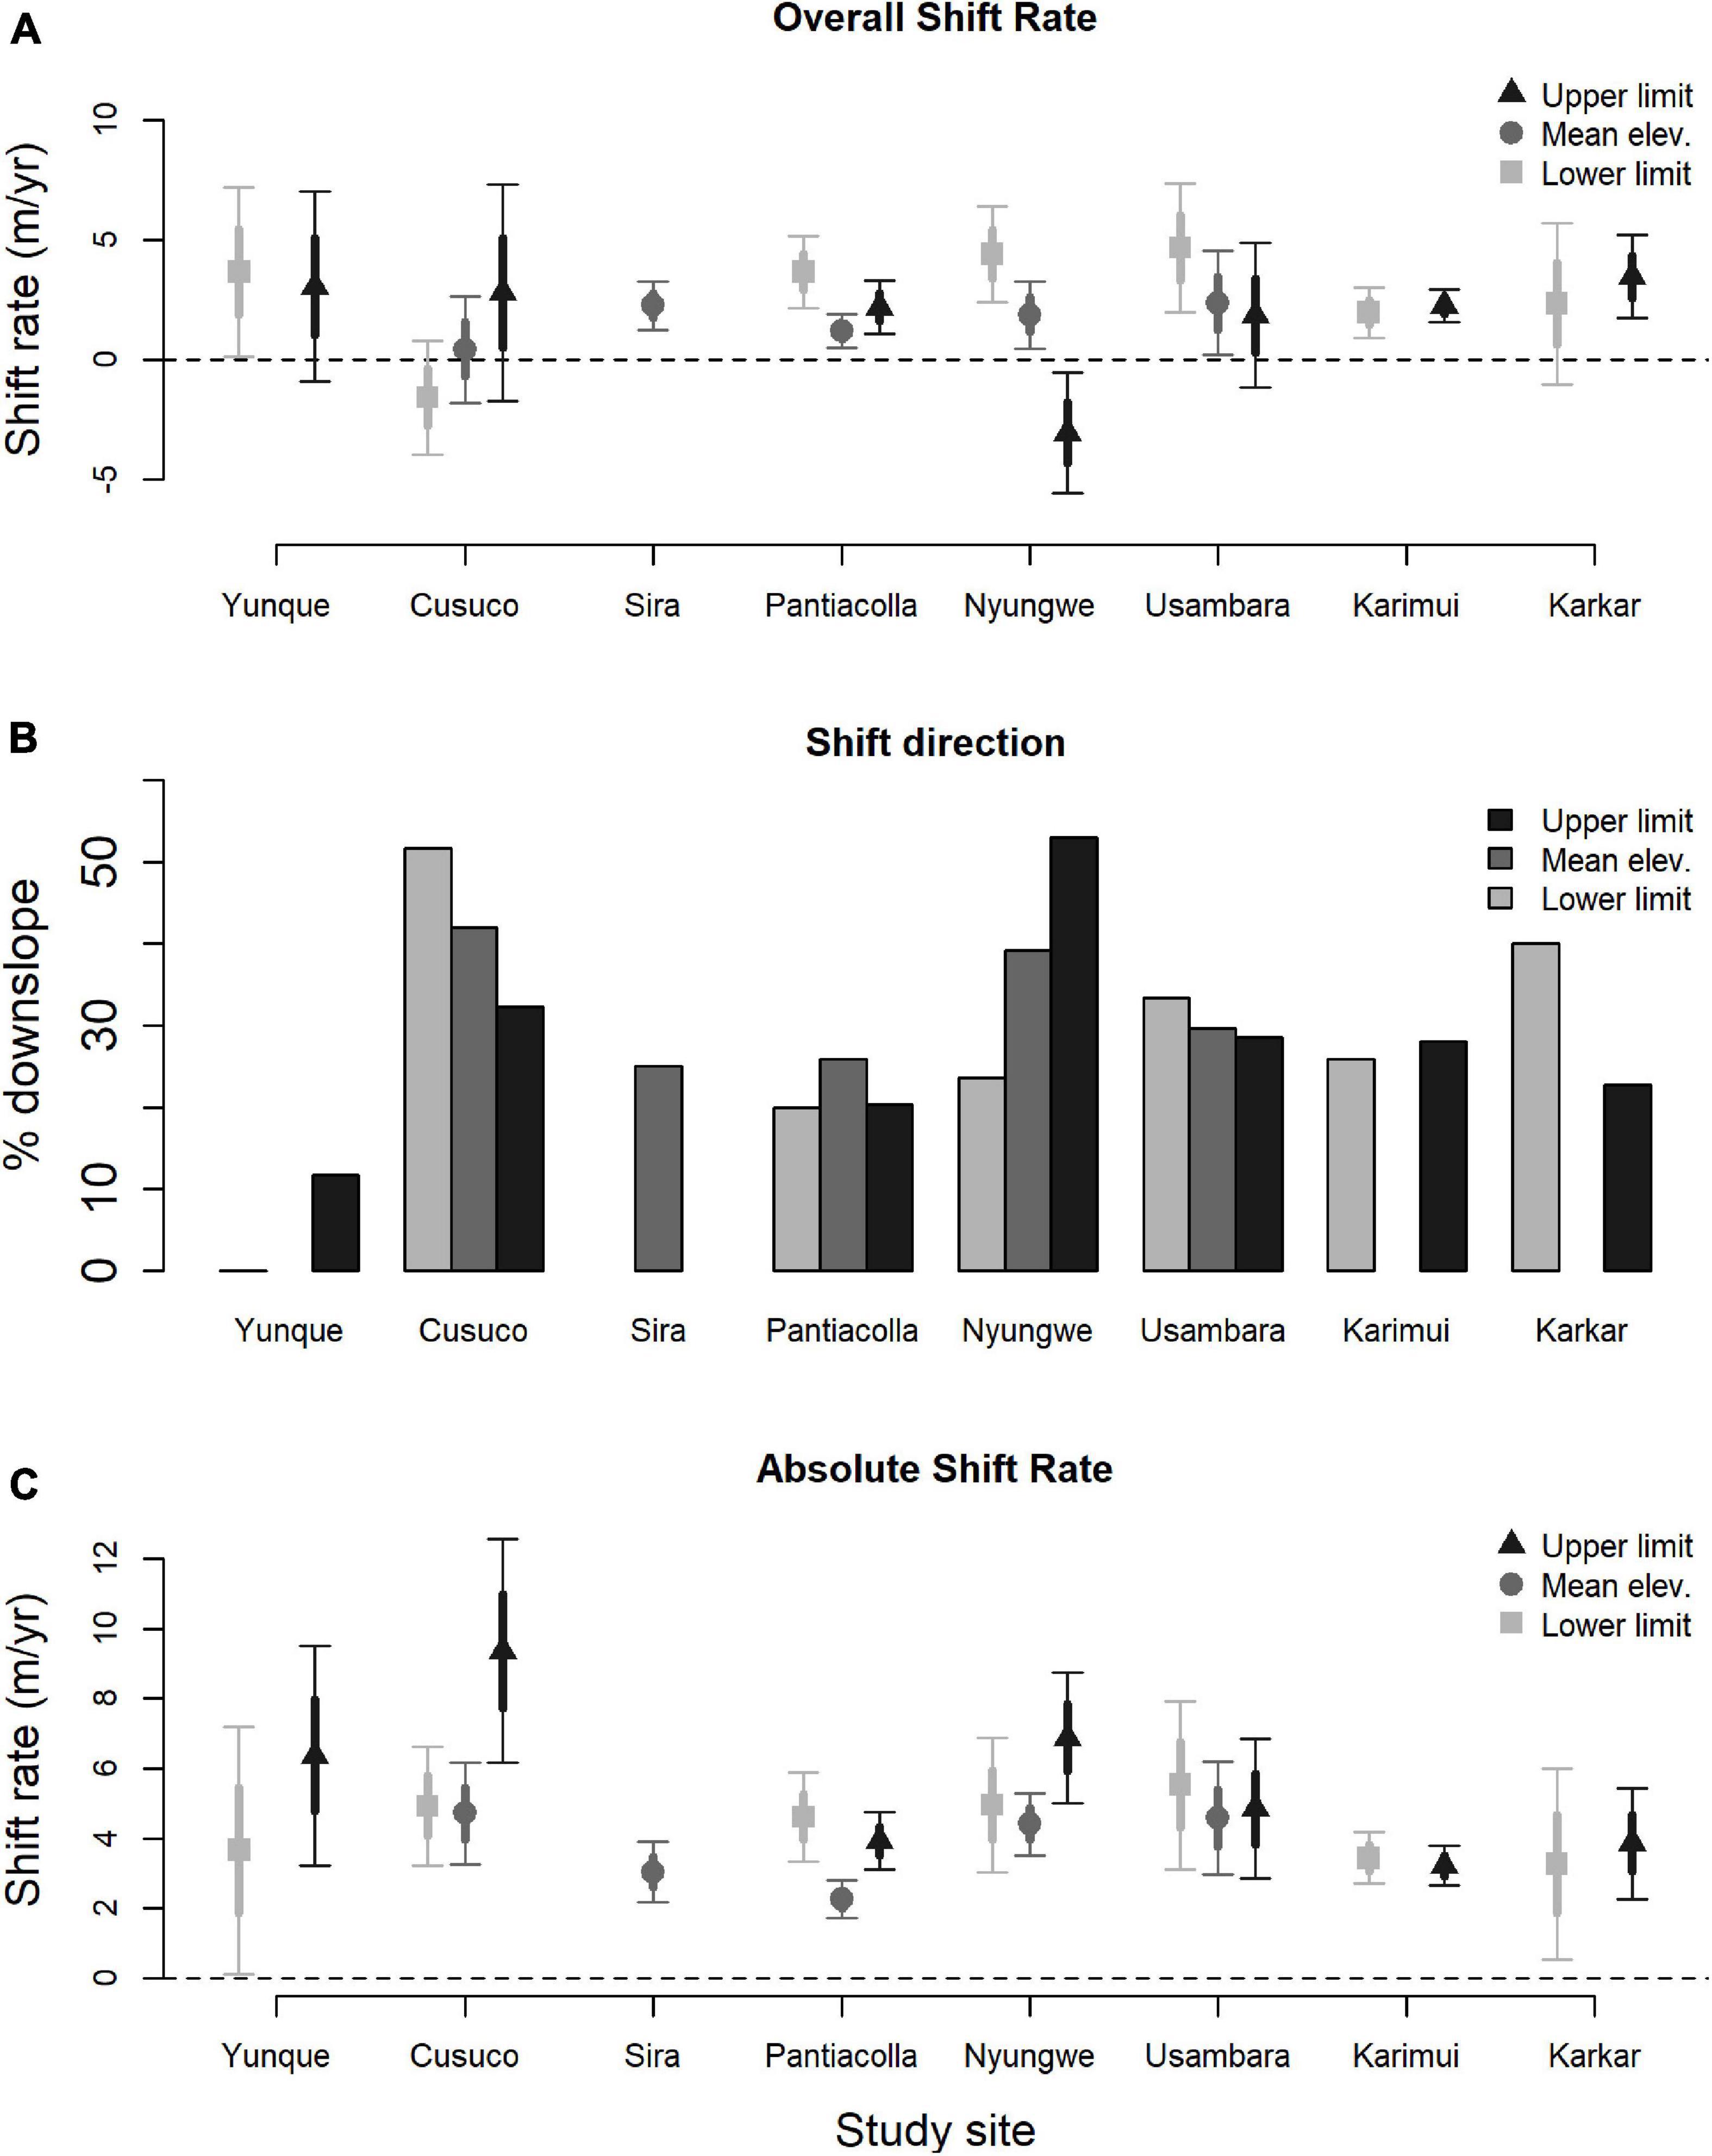
Figure 2. Elevational shift rates of tropical birds by study site. For each elevational position – upper limit, mean elevation, and lower limit – we plot (A) the overall shift rate (m/yr), (B) the proportion of species that shifted downslope, and (C) the absolute shift rate, i.e., | shift rate (m/yr)|. For overall and absolute shift rates we present the mean value, standard error (thick bars) and 95% confidence intervals (thin bars). Some studies did not estimate elevational shift rates at all positions.
The top model for mean elevation shift rates contained body mass, and territoriality, with high support for both covariates across models (Table 2, Supplementary Table 4). Upslope shifts in mean elevation were greater for smaller-bodied species (Figure 3A) and less territorial species (Figure 3B, Table 2). The top model for lower limit shift rates contained body mass and location (Figure 2A), with high support for both covariates across models (Table 2, Supplementary Table 5). Upslope shifts in lower limits were greater for smaller-bodied species (Figure 3C, Table 2). The top model for upper limit shift rates contained territoriality and location (Figure 2A), with high support for both covariates across models (Table 2, Supplementary Table 6). Upslope shifts in upper limits were greater for less territorial species (Figure 3D, Table 2).
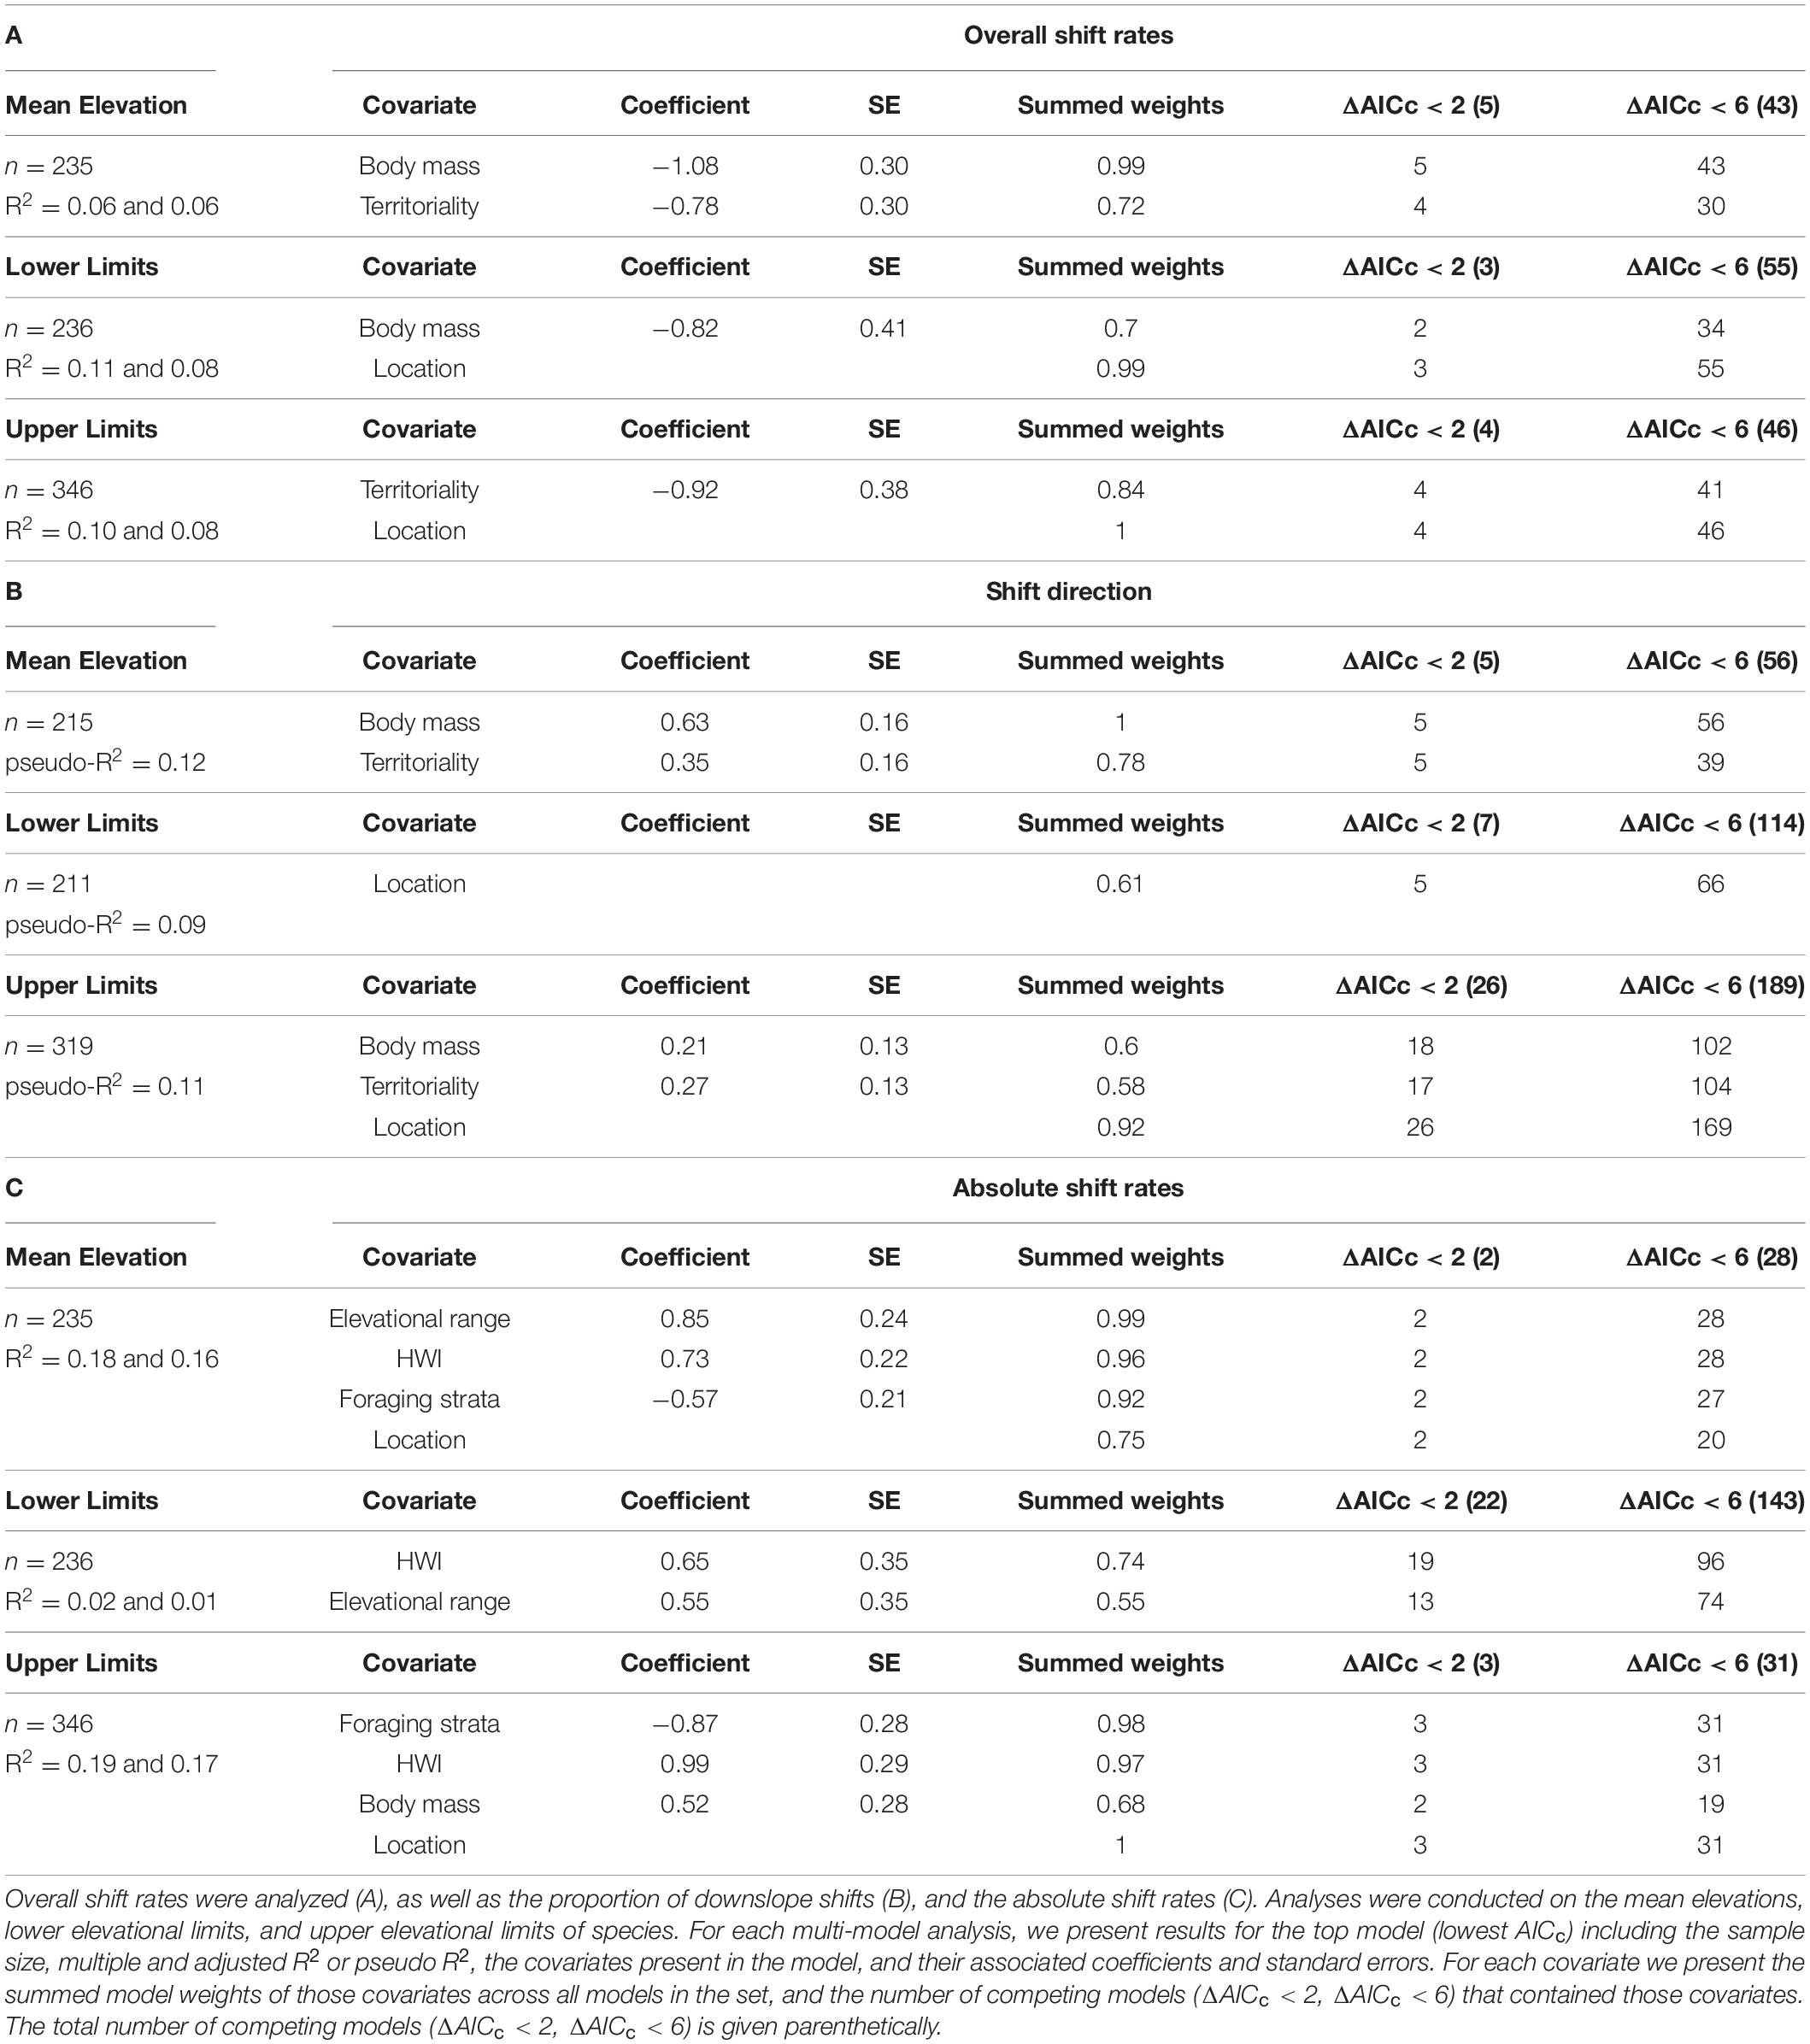
Table 2. Results from multi-model comparison of the effects of ecological traits on the elevational shift rates of tropical birds.
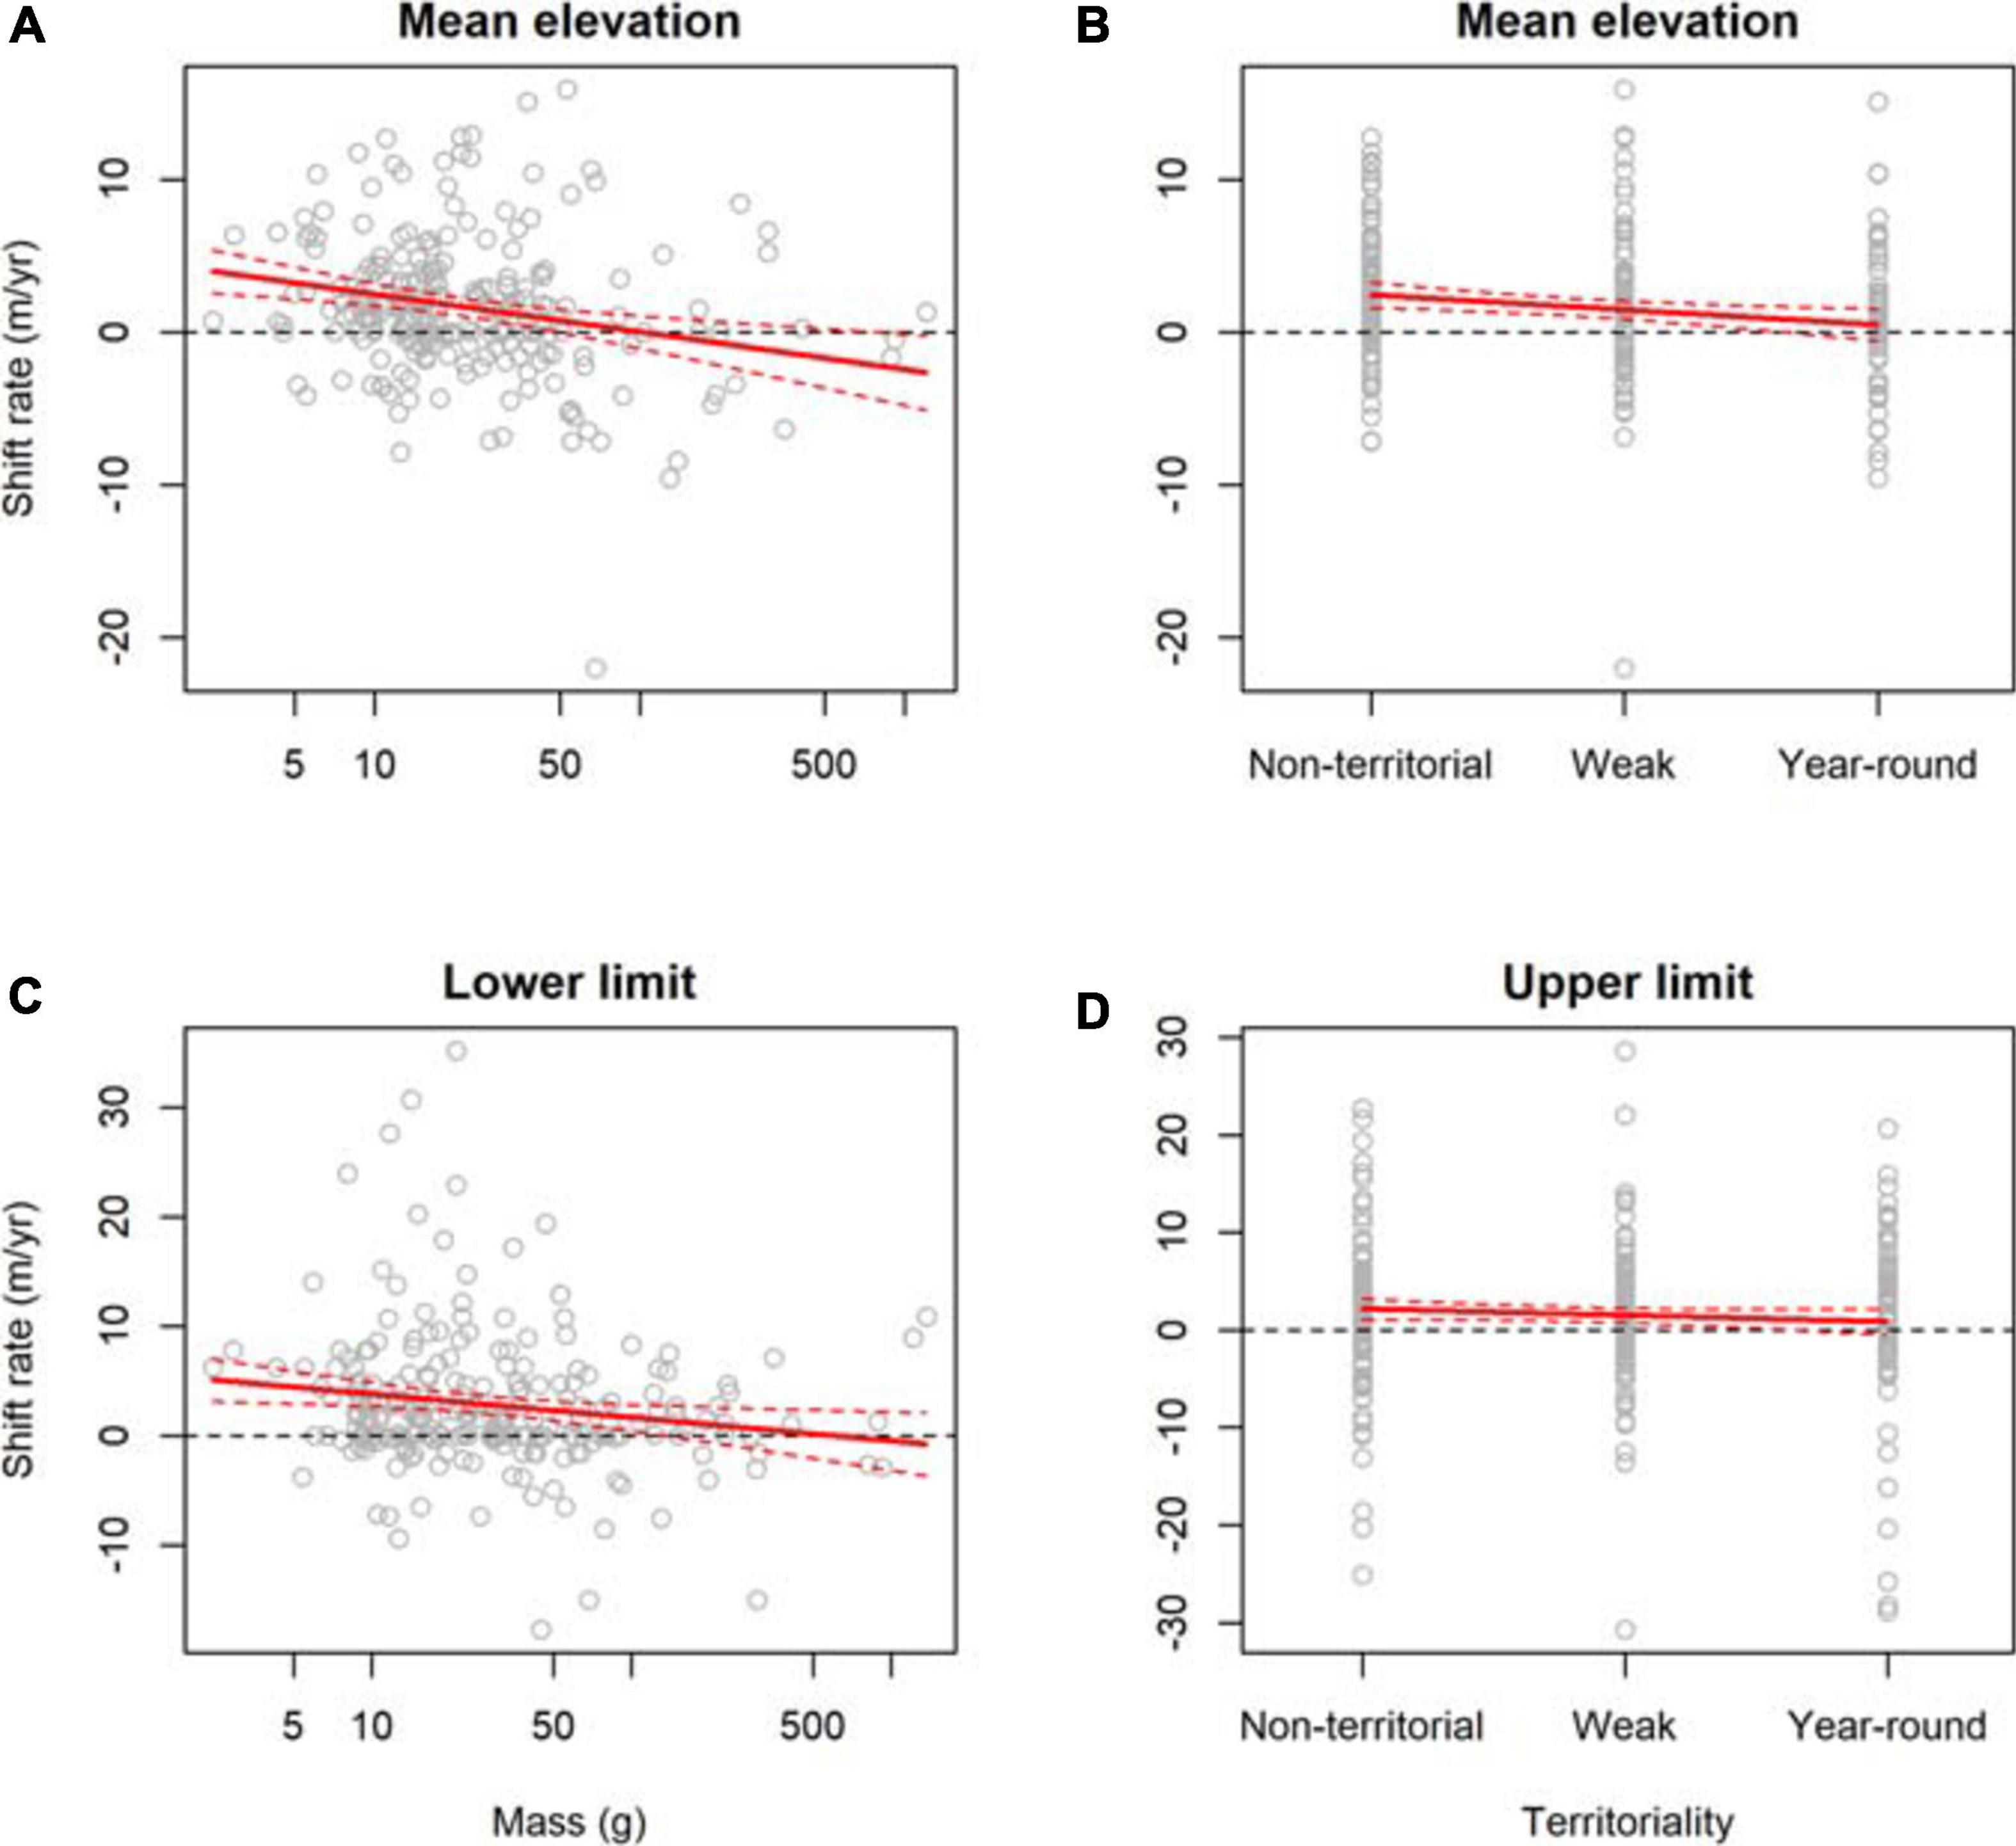
Figure 3. Ecological traits associated with the elevational shift rates of 421 bird species from eight study sites across the tropics. Mean elevation shift rates were associated with (A) body mass and (B) territoriality. Lower limit shift rates were associated with (C) body mass. Upper limit shift rates were associated with (D) territoriality.
Excluding shifts = 0, 29.9% of shifts were downslope which was significantly different from 50% (p < 0.001). There was little difference in this proportion (χ22 = 0.75, p = 0.69; Figure 2B) among species’ mean elevations (nshifts = 215, 31.6%), lower limits (nshifts = 211, 28.4%), and upper limits (nshifts = 319, 29.8%). The top model for mean elevation shift proportions contained body mass and territoriality, with high support for both covariates across models (Table 2, Supplementary Table 7). Species were more likely to shift their mean elevation downslope if they were larger and more territorial (Table 2). The top model for lower limit shift proportions contained location only (Figure 2B), with medium support across models (Table 2, Supplementary Table 8). The top model for upper limit shift proportions contained mass, territoriality, and location, with the highest support for location (Table 2, Supplementary Table 9). Species were more likely to shift their upper limit downslope if they were larger and more territorial (Table 2).
The top model for absolute mean elevation shift rates contained HWI, elevational range, foraging strata, and location, with high support for all covariates across models (Table 2, Supplementary Table 10). Shift rates in mean elevation were faster for species with higher HWI (Figure 4A), wider elevational ranges (Figure 4B), and lower foraging strata (Figure 4C; Table 2). The top model for absolute lower limit shift rates contained HWI and elevational range, with highest support for HWI (Table 2, Supplementary Table 11). Shift rates in lower limits were faster for species with higher HWI (Figure 4D) and wider elevational ranges (Table 2). Finally, the top model for absolute upper limit shift rates contained HWI, foraging strata, body mass, and location, with high support for foraging strata, HWI, and location (Table 2, Supplementary Table 12). Shift rates in upper limits were faster for species with higher HWI (Figure 4E), lower foraging strata (Figure 4F), and greater body mass (Table 2).
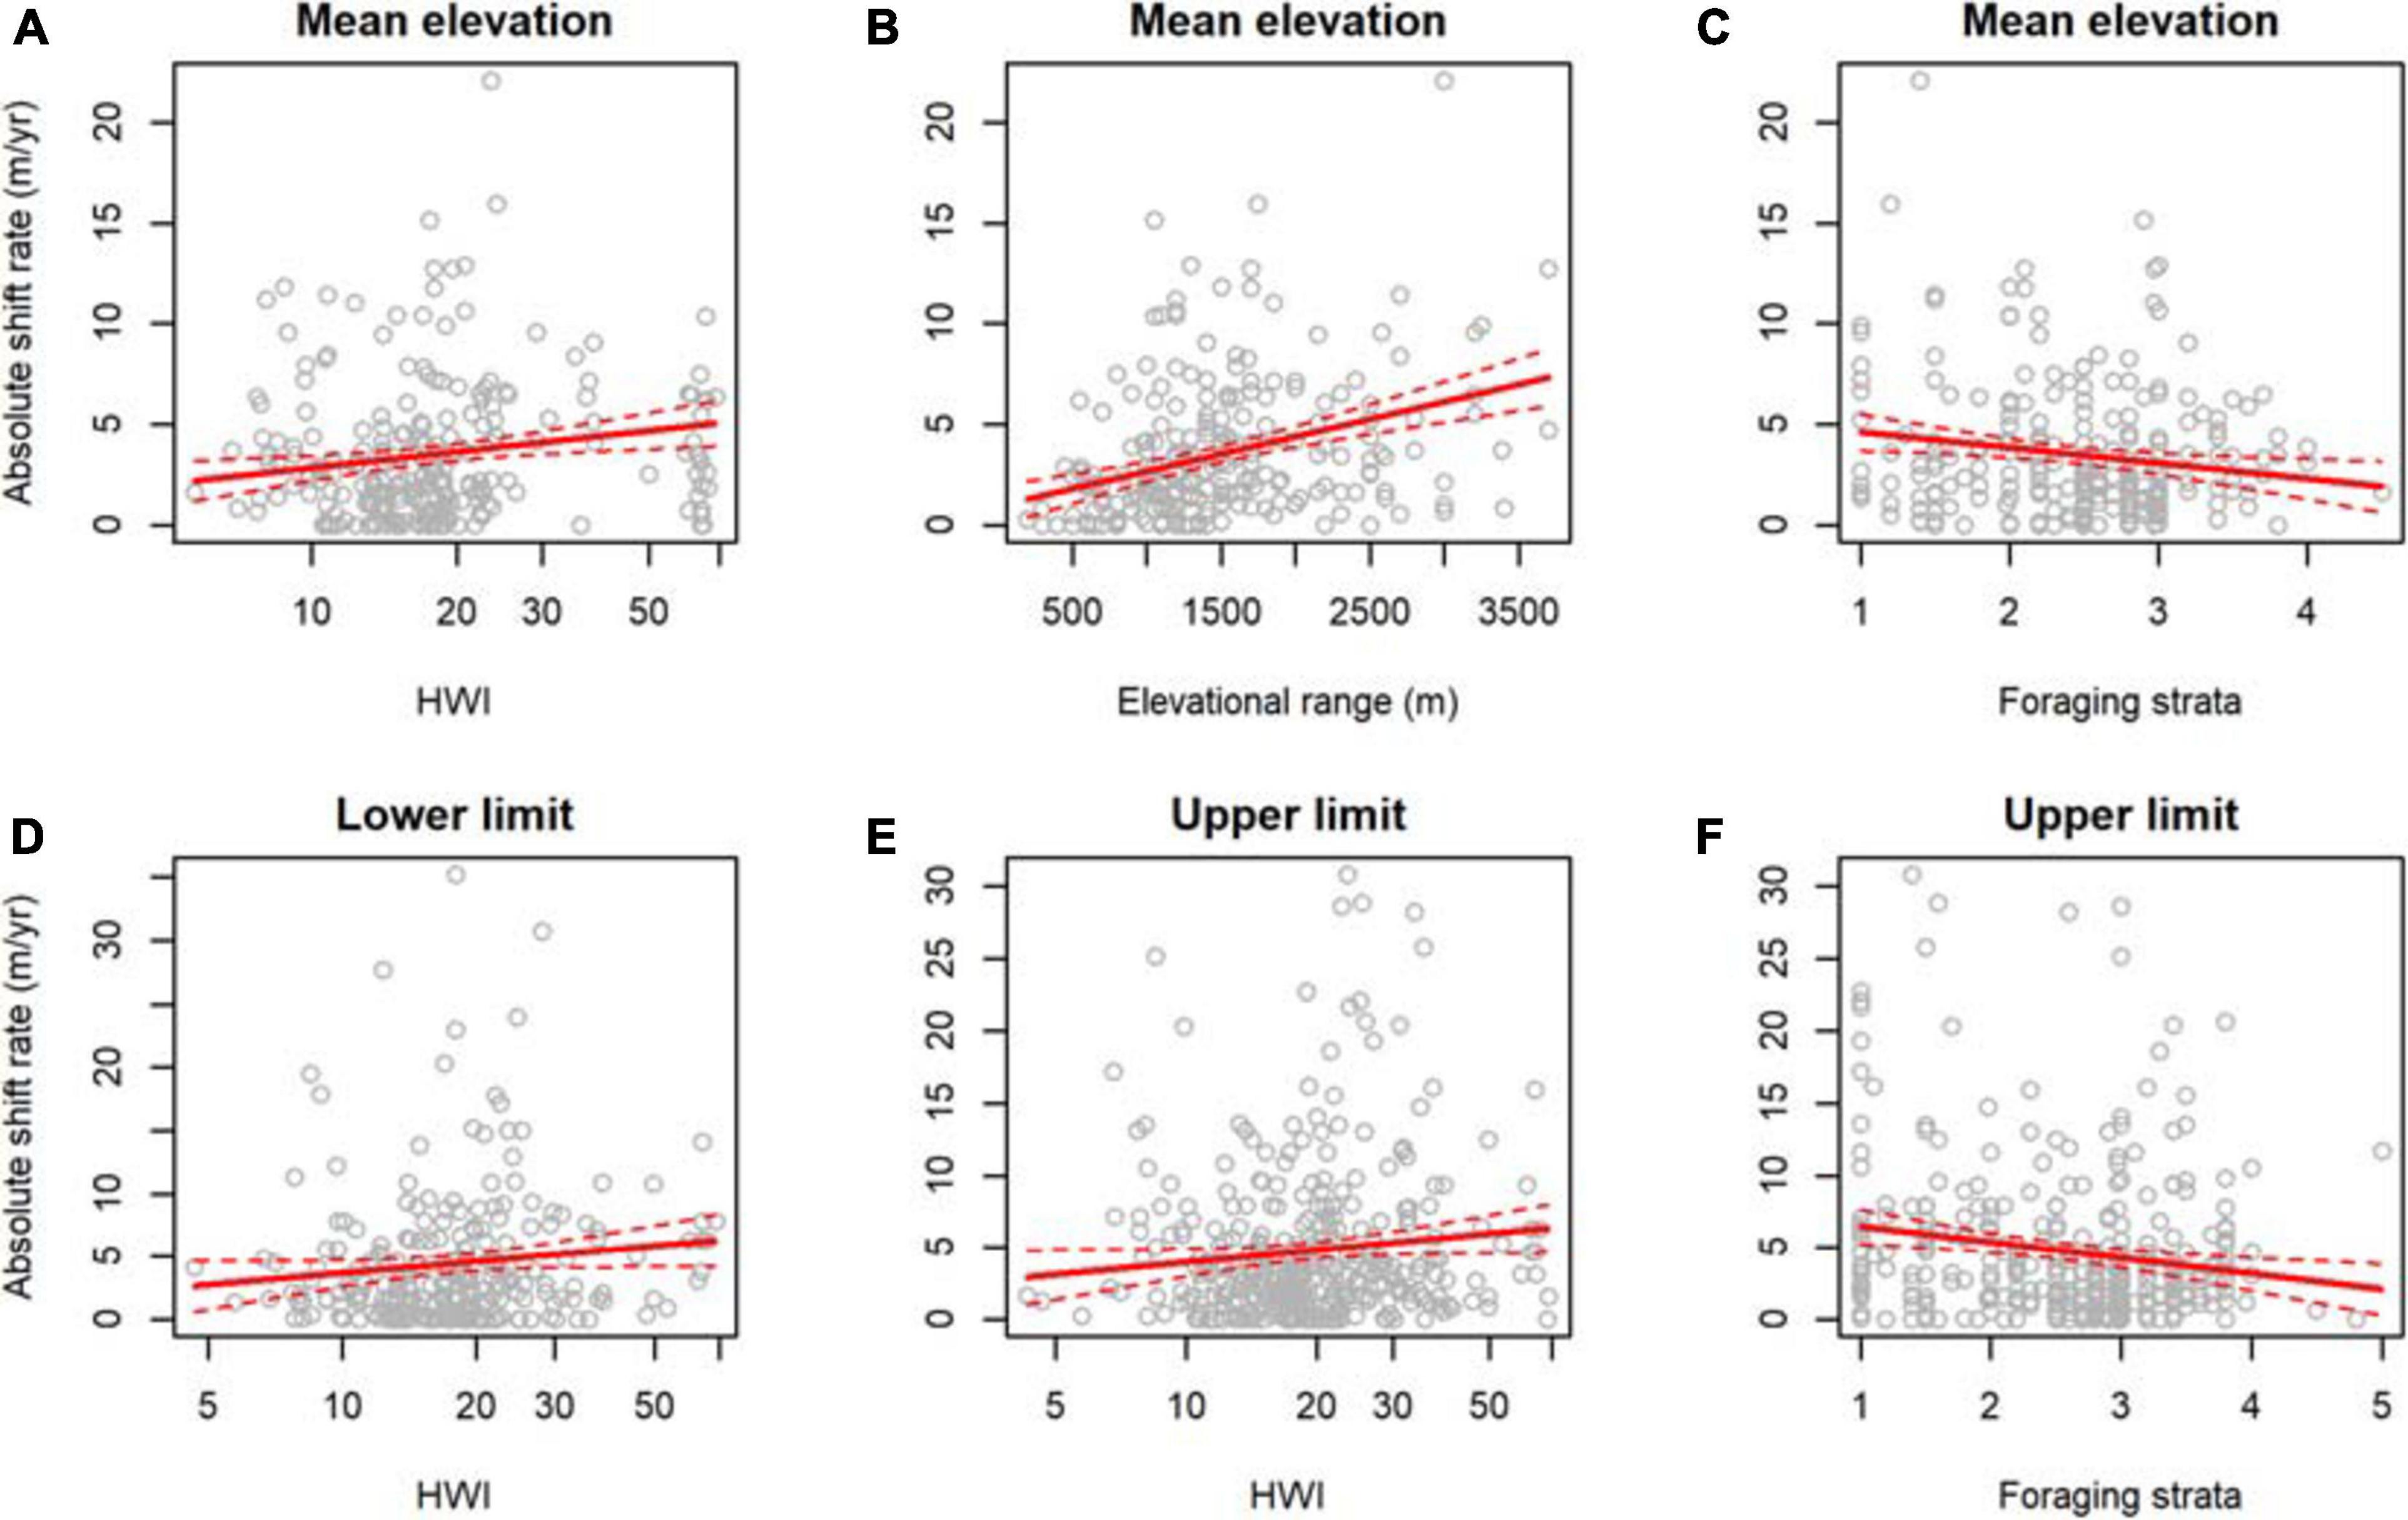
Figure 4. Ecological traits associated with the absolute elevational shift rates of 421 bird species from eight study sites across the tropics. Mean elevation shift rates were associated with (A) hand-wing index (HWI), (B) elevational range size, and (C) foraging strata. Lower limit shift rates were associated with (D) HWI. Upper limit shift rates were associated with (E) HWI and (F) foraging strata.
Shift rates differed significantly between expansions and contractions at species’ upper and lower limits (χ23 = 283, p < 0.001). Lower limits shifted upslope (nshifts = 151, 5.65 ± 0.48 m/yr) faster than upper limits did (nshifts = 224, 4.92 ± 0.31 m/yr), while upper limits shifted downslope (nshifts = 95, 5.71 ± 0.72 m/yr) faster than lower limits did (nshifts = 60, 3.18 ± 0.49 m/yr), indicating that range contractions were on average greater than range expansions. The top model for upper limit expansions contained HWI, foraging strata, forest dependency, body mass, and location, with high support for HWI, foraging strata, and location across models (Table 3, Supplementary Table 13). Upper limits expanded faster for species with higher HWI (Figure 5A), lower foraging strata (Figure 5B), lower forest dependency and larger body size (Table 3). The top model for lower limit expansions contained body mass and location, with highest support for location (Table 3, Supplementary Table 14). Lower limits expanded faster for larger-bodied species (Table 3). The top model for upper limit contractions contained foraging strata, territoriality, elevational range, and location, with high support for foraging strata and location across models (Table 3, Supplementary Table 15). Upper limits contracted faster for species with lower foraging strata (Figure 5C), higher territoriality, and wider elevational ranges (Table 3). Finally, the top model for lower limit contractions contained forest dependency, HWI, and location, with high support for forest dependency and location (Table 3, Supplementary Table 16). Lower limits contracted faster for species with lower forest dependency (Figure 5D) and higher HWI (Table 3).
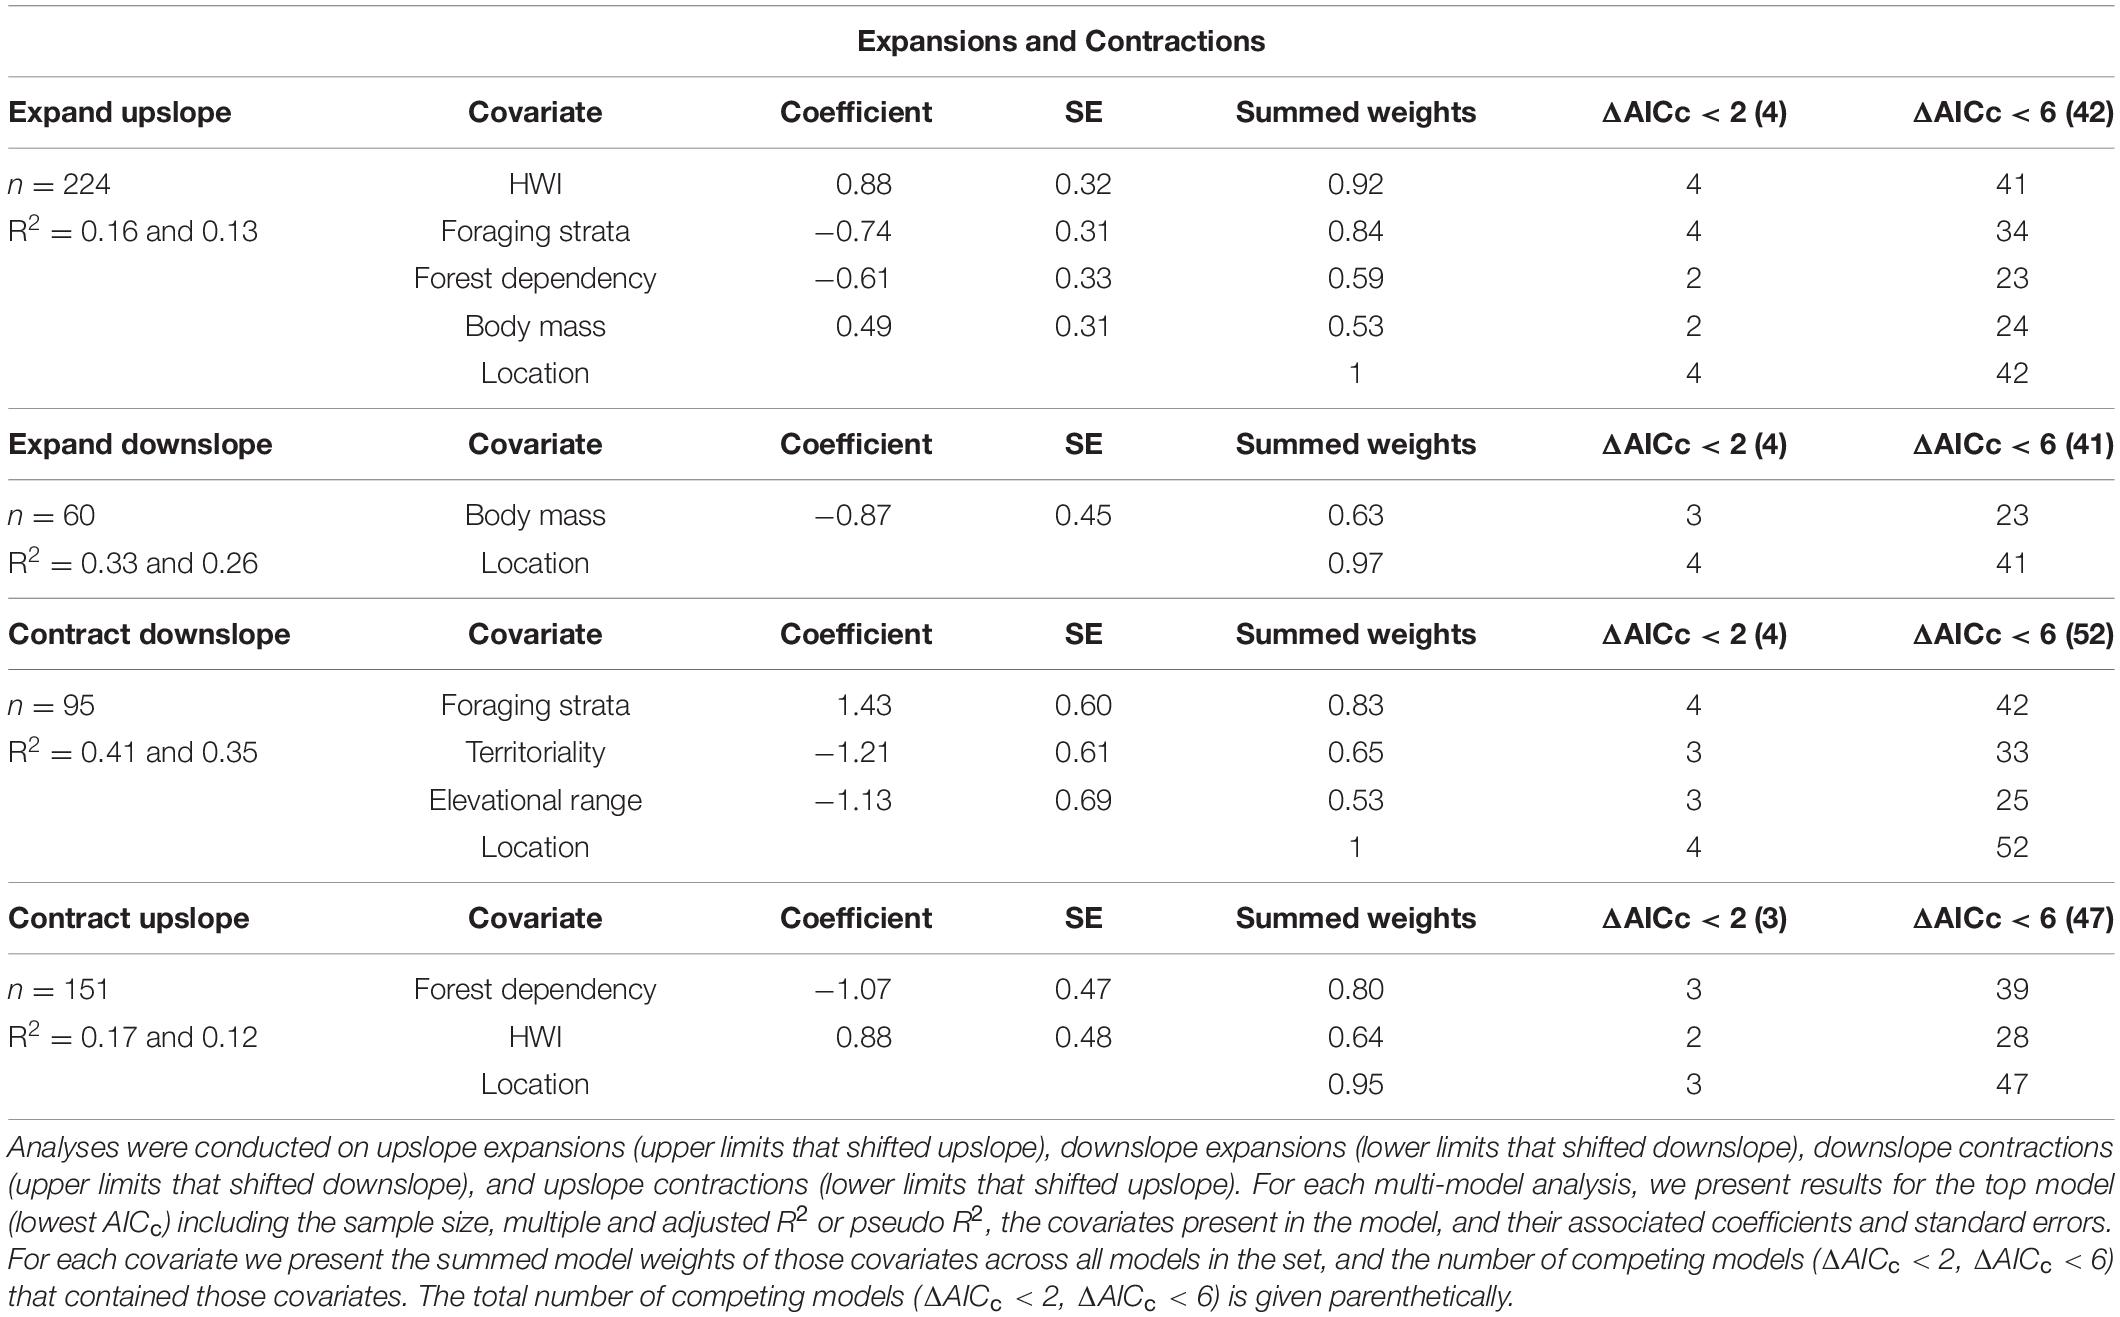
Table 3. Results from multi-model comparison of the effects of ecological traits on the rate of elevational range expansion and contraction for tropical birds.
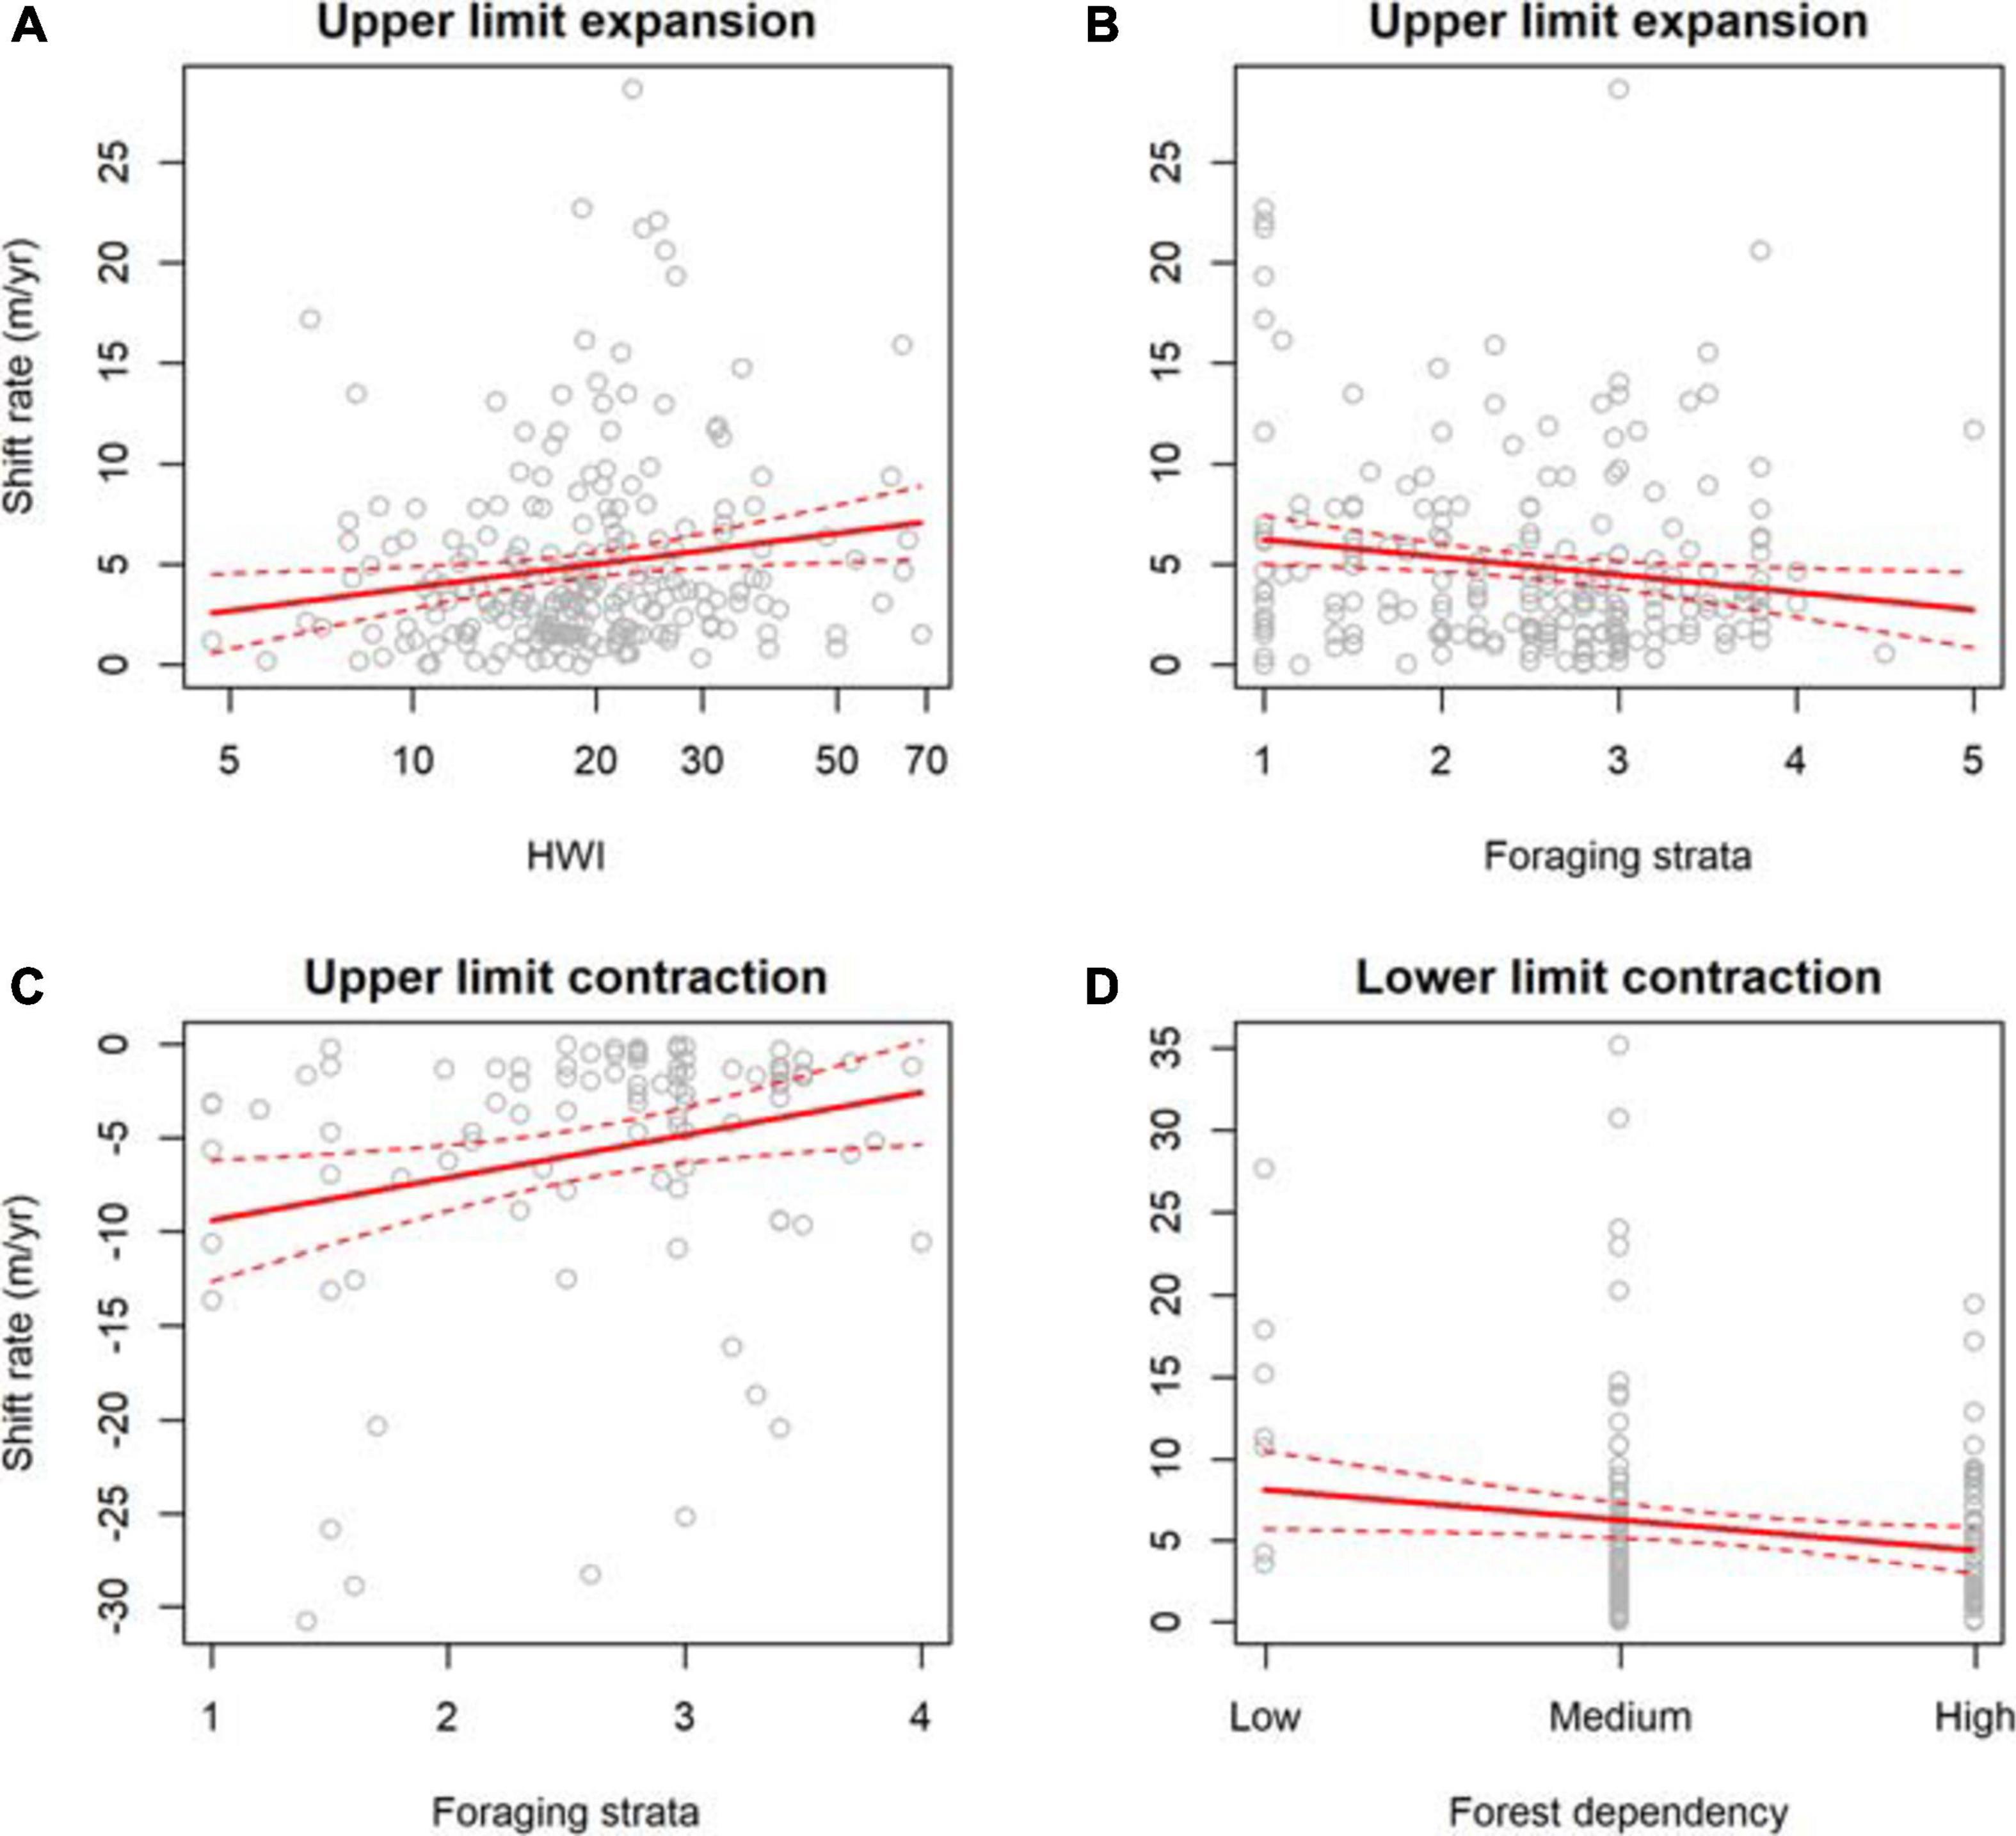
Figure 5. Ecological traits associated with elevational range expansions and contractions of bird species from eight study sites across the tropics. Upslope shifts in upper limits were associated with (A) hand-wing index (HWI) and (B) foraging strata. Downslope shifts in upper limits were associated with (C) foraging strata. Upslope shifts in lower limits were associated with (D) forest dependency.
We used a meta-analysis of range-shift data from across the tropics to explore the ecological predictors of elevational range shifts in tropical forest birds. We show that species distributed along eight tropical elevational gradients have, on average, shifted upslope at a rate of 1.6 m/yr, but that rates and directions were highly variable. Shift rates were faster at species’ lower elevational limits (2.8 m/yr) compared to their upper limits (1.6 m/yr) and consequently, the elevational ranges of many species contracted. While these shift rates may appear small on an annual basis, over decades such shifts may become biologically important. For example, a shift rate of 2.0 m/yr in the lower limits of species on Mount Karimui (Freeman and Class Freeman, 2014) becomes 110 m over the 55 years since the begininning of that study, and for many species, the total shifts observed were much greater. Our results highlight important correlates of variation in these shifts across the tropics, with elevational shift rates best predicted by several ecological traits including body size, territoriality, and dispersal ability (hand-wing index).
Overall, the lower limits of species’ elevational ranges shifted almost twice as fast as their upper limits and this pattern held when only considering upslope shifts. Furthermore, when we were able to make direct comparisons, we found that lower limits shifted faster than upper limits at over two-thirds of the study sites. This result contrasts with studies that show similar shift rates at species’ lower and upper limits (Rumpf et al., 2019). One possible explanation for this disparity between upper and lower range limit shift rates is that our ability to estimate shifts at upper limits is constrained either by the highest elevation of the sampling transect, or by the peaks of the mountains themselves (Jankowski et al., 2010; Freeman et al., 2018a). At the simplest level, a species will be unable to move upslope beyond the summit of a mountain, therefore placing a hard limit on the maximum elevation of the species range (Neate-Clegg et al., 2020b). Similarly, if the highest elevation survey site on a transect is 2500 m, and a species occurs at 2500 m at both time points, we cannot determine whether or not that species shifted upslope. However, both Freeman et al. (2018b) and Neate-Clegg et al. (2021) excluded species from their analyses that occurred at the maximum elevation at both time points. Thus, while survey or topographic constraint may explain some of the asymmetry in shift rates at species’ lower and upper limits, other factors also appear to be involved.
Another possible explanation is that different processes affect range shifts at species upper limits versus their lower limits (Jarzyna et al., 2015; Rumpf et al., 2019). Upslope shifts are more limited by dispersal and colonization at species’ upper limits than lower limits (Angert et al., 2011). Colonization assumes that there is suitable habitat at higher elevations, which may not be the case if plant communities are themselves slow to shift (Dullinger et al., 2004; Feeley et al., 2011). Colonization could also be prevented wherever habitat loss or fragmentation reduces the ability of tropical species with low dispersal ability to move through the landscape (Şekercioǧlu, 2002; Lees and Peres, 2009; Forero-Medina et al., 2011a; Newmark et al., 2017), particularly where upper elevations are more fragmented, e.g., by cattle farming at the tree-line. Indeed, we found that the greatest disparity between shift rates in lower and upper limits was in the Usambara Mountains, where the forest is more extensively fragmented across the elevational gradient, whereas the remaining studies are from largely intact gradients.
Alternatively, this pattern may be more related to differences in the rates of extirpation at lower elevations than a direct effect of dispersal disparity. Loss of populations at lower elevations could result from changes in biotic interactions such as increases in predators (Boyle, 2008; Jankowski et al., 2012), disease (Paxton et al., 2016) or competition (Alexander et al., 2015). In addition, climate change and habitat loss may have stronger effects at lower elevations, particularly in combination, leading to the extirpation of many species from the lower slopes of montane regions as these become increasingly degraded by agricultural expansion and human settlement (Harris et al., 2014; Guo et al., 2018; Neate-Clegg et al., 2018; Rumpf et al., 2019). These results stress the importance of maintaining continuously forested gradients to accommodate species range shifts in response to changing climate (Tobias et al., 2013; Newmark et al., 2017).
In general, shift rates were fairly consistent across study sites (Figure 2). For example, shift rates were similar between Peru (Forero-Medina et al., 2011b; Freeman et al., 2018b), Tanzania (Neate-Clegg et al., 2021), and New Guinea (Freeman and Class Freeman, 2014). Each of these studies was based on multi-decadal resurveys (32–47 years) of transects where it is possible that, over longer durations, shift rates were more reliably estimated. By contrast, shift rates in Cusuco, Honduras (Neate-Clegg et al., 2018) and Nyungwe, Rwanda (Neate-Clegg et al., 2020b) were more variable, with higher proportions of downslope shifts. Notably, lower limits tended to shift downslope in Honduras while in Nyungwe upper limits tended to shift downslope. In these two studies, shift rates were calculated over shorter time periods (12 and 15 years, respectively) where changes in elevational ranges could be more reflective of short-term fluctuations than long-term trends. However, these two studies used annual data and so had high temporal resolution relative to resurvey data. Therefore, shifts were calculated from trends over time rather than being based on single-season snapshots. To date, we lack long-term datasets (>20 year) with high temporal resolution along elevational gradients in the tropics, and we have limited studies from which to draw biogeographical or location-level inferences. Further studies focusing on a wider sample of elevational gradients, particularly in Indomalaya/Oceania, are required to disentangle the roles of biogeography and survey methodology. Moreover, the continuation and analysis of consistent survey efforts along these gradients are required to understand the role of annual range fluctuations (Neate-Clegg et al., 2020b).
At the species level, upslope shift rates of mean elevation and of lower limits were greatest for small-bodied species (Figures 3A,C). Body size has long been linked to environmental gradients by Bergmann’s rule (Bergmann, 1847) which states that larger-bodied species tend to be found in colder environments. If smaller-bodied species were in some way limited to lower elevations (directly or indirectly) (Blackburn et al., 1999), increasing temperatures may provide a release, allowing those species to move upslope. However, evidence for the existence of Bergmann’s rule is variable (Blackburn and Ruggiero, 2001; Meiri and Dayan, 2003; Freeman, 2017) and tends to be applied more to intraspecific variation in body mass or variation among closely related species, particularly along latitudinal gradients. Alternatively, body size may be linked to life-history strategy, in turn affecting shift rates (Lenoir et al., 2008; Moritz et al., 2008). For example, smaller-bodied species also have shorter lifespans and larger clutch sizes (Jetz et al., 2008; Valcu et al., 2014). As shifts at species’ leading edges should be positively related to both dispersal and fecundity (Angert et al., 2011; MacLean and Beissinger, 2017), it follows that species with faster life histories should also be able to shift faster.
An important behavioral factor predicting shifts in species’ mean elevations and upper elevational limits was territoriality (Figures 3B,D). Species that defend year-round territories lead more sedentary lifestyles with long-term pair bonds (Tobias et al., 2016), potentially slowing the rate at which they can colonize elevations above their upper limits (Jones et al., 2019). By contrast, species that do not hold territories theoretically move more freely throughout the landscape, often in pursuit of patchily distributed resources (Levey and Stiles, 1992; Saracco et al., 2004; Lees and Peres, 2009), and thus more readily colonize elevations above their typical limits in the face of changing climates. Even so, elevational shifts in the shorter-term may still occur in these species by the incremental increase in “exploration” at the edges of elevational ranges by non-territory holding individuals (Neate-Clegg et al., 2018).
Shift rates can be broken down into two parts, shift direction and shift magnitude, and doing so tended to enhance model fit. Almost a third of shifts in this study were downslope shifts, regardless of elevational position, corroborating another meta-analysis of range shifts (Mamantov et al., 2021), but contradicting the prediction that species will track preferred thermal envelopes upslope with rising temperatures (Şekercioǧlu et al., 2008). This assumption is, however, likely an oversimplification, because elevational ranges are determined by multiple abiotic and biotic factors (Jankowski et al., 2012). For example, changing precipitation regimes and concurrent vegetation patterns may cause downslope movements, as species track specific ecological requirements (Tingley et al., 2012; Neate-Clegg et al., 2020b). Alternatively, species may shift downslope following the extirpation of more dominant competitors (competitor release; Jankowski et al., 2010; Lenoir et al., 2010). In this study, larger-bodied species were more likely to shift downslope and expanded their lower limits faster. Many of these species are large, mobile frugivores (e.g., pigeons, turacos, toucans) which are known to have high dispersal ability (Holbrook et al., 2002; Corlett, 2009; Lees and Peres, 2009). The movements of frugivores are dictated largely by the occurrence of ephemeral, patchily distributed food resources (Saracco et al., 2004; van Schaik et al., 2010). Fruiting phenology and abundance, in turn, result from the complex interaction of precipitation, temperature, and irradiance (Chapman et al., 2005; Dunham et al., 2018; Potts et al., 2020). Downslope shifts may therefore result from the pursuit of food resources based on plants that are not tracking rising temperatures upslope.
When considering the absolute speed of shifts (ignoring shift direction) as well as expansions in species’ upper limits, the most important predictor was HWI (Figures 4, 5A). Of all the covariates considered in this study, HWI was the most direct predictor of dispersal ability (Sheard et al., 2020), suggesting that shift rates were faster for species with greater dispersal ability. Dispersal ability can be used as a proxy for the likelihood that a species disperses or the distance that it is able to move. The more freely a species moves, the more likely it is to reach a new, more optimal location (Lees and Peres, 2009; Jarzyna et al., 2015). Similarly, juveniles of more vagile species may disperse and settle farther from their natal territory (Dawideit et al., 2009). Species that can move more freely may also be more likely to adjust their position if they find themselves in a suboptimal location (Van Houtan et al., 2007; Anderson et al., 2012) because it is less costly for them to move. Elevational shifts are an emergent property of thousands of individual decisions. If those decisions involve greater dispersal, then this is likely to add up to greater shifts over time.
We hypothesized that species with narrower elevational ranges and smaller realized niches would be more sensitive to changes in temperature. However, we found that mean elevations and lower limits shifted faster for species with larger elevational ranges. One explanation is that species with larger elevational ranges may be more adaptable because they encounter a larger breadth of abiotic and biotic factors thus making upslope colonization easier (Angert et al., 2011; MacLean and Beissinger, 2017). Alternatively, contractions at species’ upper limits were also associated with wider elevational ranges so it is also possible that large ranges allow for more reduction in range size. Finally, species with lower foraging strata showed faster shift rates at mean elevations and upper limits (Figures 4C,F). This was a suprising result as canopy species were predicted to shift faster due to their vagility (Lees and Peres, 2009; Salisbury et al., 2012; Smith et al., 2014). At least part of this trend was driven by the contractions in species’ upper limits (Figure 5C). Similarly, contractions were faster in more territorial species. Territorial understory and terrestrial species are typically the most vulnerable to anthropogenic change (Newmark, 2006; Stouffer et al., 2009, 2020) so their ranges may be contracting in general.
Overall, our results show that the response of elevational distributions to climate change are more complex than bird species simply tracking thermal envelopes (Şekercioǧlu et al., 2008; Pollock et al., 2020), and instead are influenced by a range of factors including species’ dispersal ability, body size, foraging strata, and territoriality. Beyond these predictor variables, there is still substantial noise in our data and our R2 values are fairly low. Low model fit is to be expected in such large comparative studies and our results are necessarily pantropical generalizations that can mask fine-scale, idiosyncratic responses to climate change. However, model fit improved when parsing out shifts into different components, suggesting different processes affect shifts at different positions in a species’ elevational range. Non-etheless, it is impossible to account for all of the ways in which species ranges and range shifts are determined (Jankowski et al., 2012). Shift rates may be influenced by various biotic factors not considered here such as prey availability (Schumm et al., 2020), interspecific competition (Jankowski et al., 2010; Freeman et al., 2019) or natural enemies (Paxton et al., 2016), for which we currently lack both fine scale understanding and comprehensive global datasets.
In addition, location was an important covariate in most models, suggesting high variation in shift rates between sites (Mamantov et al., 2021). Shift rates may be affected by landscape characteristics such as topography (Elsen and Tingley, 2015) or forest configuration (Harris et al., 2014; Guo et al., 2018), demonstrating the need for surveys in a wider variety of study systems. There are also important differences in the methods employed to survey birds and estimate shift rates. Birds can be sampled by mist nets, point counts, audio recordings, or combinations thereof. Surveys can be annual or snapshot resurveys, standardized or exhaustive. Many of these methodological differences are unavoidable; often researchers must make use of the data available regardless of how they were gathered. Differences in survey methods also lead to differences in the statistical approach used to estimate shifts and control for biases in the data. These caveats aside, our results also display the critical value in the tropics of long-term monitoring, resurvey data, and establishing baselines for future comparisons (Harris et al., 2011; Şekercioǧlu, 2012; Tobias et al., 2013; Neate-Clegg et al., 2020a). Similar studies will likely deepen our understanding of the observed relationships, but we also suggest that future research agrees upon similar protocols in order maximize the standardization between study sites.
The variable responses to global climate change and the rapid contraction of lower elevational range limits we present emphasize the importance of conserving extensive intact elevational gradients and corridors in tropical protected areas to sustain viable populations at range edges and to facilitate the movements of populations (Harris et al., 2011; Wormworth and Şekercioǧlu, 2011; Tobias et al., 2013; Newmark et al., 2017). Failure to implement these actions will lead to reductions in elevational and geographical range sizes, and therefore to smaller population sizes (Shoo et al., 2005a, b; Harris and Pimm, 2008). This will potentially result in species extinction at local or even global scales (Şekercioǧlu et al., 2008; Freeman et al., 2018b), with implications for associated ecological processes on tropical mountains (Şekercioǧlu et al., 2004, 2016). Furthermore, we likely underestimate the shrinkage of species’ ranges, as our study could not incorporate many species restricted to mountaintops (Freeman et al., 2018b). Species occurring at low densities in narrow, ridgeline bands of habitat such as elfin forest are some of the most at-risk species, but often lack the sample sizes to feature in such broad multi-species analyses (Freeman et al., 2018a; Neate-Clegg et al., 2018). Such species should be the greatest focus of conservation attention. Taken together, our results suggest that forecasting which species will be the fastest to ride the “escalator to extinction” (Şekercioglu, 2007; Freeman et al., 2018b) requires a complex and nuanced understanding of the specific factors that drive community composition along elevational gradients in the tropics.
The original contributions presented in the study are included in the article/Supplementary Material, further inquiries can be directed to the corresponding author/s.
MN-C and SJ conceptualized and designed the study. MN-C performed the analyses and wrote the first draft. ÇŞ supervised the project and provided intellectual insights. All authors collected and curated the data and contributed substantially to revisions.
The authors declare that the research was conducted in the absence of any commercial or financial relationships that could be construed as a potential conflict of interest.
For their help in collecting ecological data for BirdBase we thank Melissa Avalos, Alex Bennett, David Blount, Evan Buechley, Grant Doxey, Cara Drane, Shantell Garrett, Kayla Godfrey, Russelle Hansen, Jordan Herman, John Jackson, Maddie Nelson, Burak Över, Jason Socci, Natasha Velasquez, Rory Weeks, Ashley Wiltsie, and Sara Wiscombe. This research was supported by a University of Utah Graduate Research Fellowship. We thank Operation Wallacea for facilitating long-term fieldwork in Honduras. Lastly, we are grateful for the support of the JRS Biodiversity Foundation grant (#60708_TAWIRI).
The Supplementary Material for this article can be found online at: https://www.frontiersin.org/articles/10.3389/fevo.2021.621749/full#supplementary-material
Alexander, J. M., Diez, J. M., and Levine, J. M. (2015). Novel competitors shape species’ responses to climate change. Nature 525, 515–518. doi: 10.1038/nature14952
Anderson, A. S., Reside, A. E., Vanderwal, J. J., Shoo, L. P., Pearson, R. G., and Williams, S. E. (2012). Immigrants and refugees: the importance of dispersal in mediating biotic attrition under climate change. Glob. Chang. Biol. 18, 2126–2134. doi: 10.1111/j.1365-2486.2012.02683.x
Angert, A. L., Crozier, L. G., Rissler, L. J., Gilman, S. E., Tewksbury, J. J., and Chunco, A. J. (2011). Do species’ traits predict recent shifts at expanding range edges? Ecol. Lett. 14, 677–689. doi: 10.1111/j.1461-0248.2011.01620.x
Aragón, P., Lobo, J. M., and Olalla-Tárraga, M. Á, and Rodríguez, M. Á (2010). The contribution of contemporary climate to ectothermic and endothermic vertebrate distributions in a glacial refuge. Glob. Ecol. Biogeogr. 19, 40–49. doi: 10.1111/j.1466-8238.2009.00488.x
Bartoń, K. (2015). MuMIn: Model Selection and Model Averaging Based on Information Criteria (AICc and Alike). Available online at: https://cran.r-project.org/web/packages/MuMIn/index.html (accessed December 3, 2020).
Bergmann, C. (1847). Über die verhältnisse der wärmeökonomie der thiere zu ihrer grösse. Gottinger. Stud. 3, 595–708.
Billerman, S. M., Keeney, B. K., Rodewald, P. G., and Schulenberg, T. S. (2020). Birds of the World. Ithaca: Cornell Laboratory of Ornithology. Available online at: https://birdsoftheworld.org/bow/home (accessed October 6, 2020).
Birdlife International. (2020). BirdLife Data Zone. Available online at: http://datazone.birdlife.org/species (accessed March 14, 2020) Google Scholar
Blackburn, T. M., Gaston, K. J., and Loder, N. (1999). Geographic gradients in body size: a clarification of Bergmann’s rule. Divers. Distrib. 5, 165–174.
Blackburn, T. M., and Ruggiero, A. (2001). Latitude, elevation and body mass variation in Andean passerine birds. Glob. Ecol. Biogeogr. 10, 245–259. doi: 10.1046/j.1466-822X.2001.00237.x
Boyle, W. A. (2008). Can variation in risk of nest predation explain altitudinal migration in tropical birds? Oecologia 155, 397–403. doi: 10.1007/s00442-007-0897-6
Boyle, W. A., Shogren, E. H., and Brawn, J. D. (2020). Hygric niches for tropical endotherms. Trends Ecol. Evol. 35, 938–952. doi: 10.1016/j.tree.2020.06.011
Burnham, K. P., and Anderson, D. R. (2002). Model Selection and Multimodel Inference: A Practical Information-Theoretic Approach. New York, NY: Springer.
Campos-Cerqueira, M., Arendt, W. J., Wunderle, J. M., and Aide, T. M. (2017). Have bird distributions shifted along an elevational gradient on a tropical mountain? Ecol. Evol. 7, 9914–9924. doi: 10.1002/ece3.3520
Chapman, C. A., Chapman, L. J., Struhsaker, T. T., Zanne, A. E., Clark, C. J., and Poulsen, J. R. (2005). A long-term evaluation of fruiting phenology: importance of climate change. J. Trop. Ecol. 21, 31–45. doi: 10.1017/S0266467404001993
Corlett, R. T. (2009). Seed dispersal distances and plant migration potential in tropical East Asia. Biotropica 41, 592–598. doi: 10.1111/j.1744-7429.2009.00503.x
Dawideit, B. A., Phillimore, A. B., Laube, I., Leisler, B., and Böhning-Gaese, K. (2009). Ecomorphological predictors of natal dispersal distances in birds. J. Anim. Ecol. 78, 388–395. doi: 10.1111/j.1365-2656.2008.01504.x
del Hoyo, J., Elliott, A., Sargatal, J., Christie, D. A., and de Juana, E. (2019). Handbook of the Birds of the World Alive. Available online at: https://www.hbw.com (accessed July 30, 2018) Google Scholar
Dormann, C. F., Elith, J., Bacher, S., Buchmann, C., Carl, G., Carré, G., et al. (2013). Collinearity: a review of methods to deal with it and a simulation study evaluating their performance. Ecography 36, 27–46. doi: 10.1111/j.1600-0587.2012.07348.x
Dullinger, S., Dirnböck, T., and Grabherr, G. (2004). Modelling climate change-driven treeline shifts: relative effects of temperature increase, dispersal and invasibility. J. Ecol. 92, 241–252.
Dunham, A. E., Razafindratsima, O. H., Rakotonirina, P., and Wright, P. C. (2018). Fruiting phenology is linked to rainfall variability in a tropical rain forest. Biotropica 50, 396–404. doi: 10.1111/btp.12564
Elsen, P. R., and Tingley, M. W. (2015). Global mountain topography and the fate of montane species under climate change. Nat. Clim. Chang. 5, 772–776. doi: 10.1038/nclimate2656
Elsen, P. R., Tingley, M. W., Kalyanaraman, R., Ramesh, K., and Wilcove, D. S. (2017). The role of competition, ecotones, and temperature in the elevational distribution of Himalayan birds. Ecology 98, 337–348. doi: 10.1002/ecy.1669
Fadrique, B., Báez, S., Duque, Á, Malizia, A., Blundo, C., Carilla, J., et al. (2018). Widespread but heterogeneous responses of Andean forests to climate change. Nature 564, 207–212. doi: 10.1038/s41586-018-0715-9
Feeley, K. J., Silman, M. R., Bush, M. B., Farfan, W., Cabrera, K. G., Malhi, Y., et al. (2011). Upslope migration of Andean trees. J. Biogeogr. 38, 783–791. doi: 10.1111/j.1365-2699.2010.02444.x
Forero-Medina, G., Joppa, L., and Pimm, S. L. (2011a). Constraints to species’ elevational range shifts as climate changes. Conserv. Biol. 25, 163–171. doi: 10.1111/j.1523-1739.2010.01572.x
Forero-Medina, G., Terborgh, J., Socolar, S. J., and Pimm, S. L. (2011b). Elevational ranges of birds on a tropical montane gradient lag behind warming temperatures. PLoS One 6:e28535. doi: 10.1371/journal.pone.0028535
Freeman, B. G. (2016). Thermal tolerances to cold do not predict upper elevational limits in New Guinean montane birds. Divers. Distrib. 22, 309–317. doi: 10.1111/ddi.12409
Freeman, B. G. (2017). Little evidence for Bergmann’s rule body size clines in passerines along tropical elevational gradients. J. Biogeogr. 44, 502–510. doi: 10.1111/jbi.12812
Freeman, B. G., and Class Freeman, A. M. (2014). Rapid upslope shifts in New Guinean birds illustrate strong distributional responses of tropical montane species to global warming. Proc. Natl. Acad. Sci. U.S.A. 111, 4490–4494. doi: 10.1073/pnas.1318190111
Freeman, B. G., Lee-Yaw, J. A., Sunday, J. M., and Hargreaves, A. L. (2018a). Expanding, shifting and shrinking: the impact of global warming on species’ elevational distributions. Glob. Ecol. Biogeogr. 27, 1268–1276. doi: 10.1111/geb.12774
Freeman, B. G., Scholer, M. N., Ruiz-Gutierrez, V., and Fitzpatrick, J. W. (2018b). Climate change causes upslope shifts and mountaintop extirpations in a tropical bird community. Proc. Natl. Acad. Sci. U.S.A. 115, 11982–11987. doi: 10.1073/pnas.1804224115
Freeman, B. G., Tobias, J. A., and Schluter, D. (2019). Behavior influences range limits and patterns of coexistence across an elevational gradient in tropical birds. Ecography 42, 1832–1840. doi: 10.1111/ecog.04606
Gasner, M. R., Jankowski, J. E., Ciecka, A. L., Kyle, K. O., and Rabenold, K. N. (2010). Projecting the local impacts of climate change on a Central American montane avian community. Biol. Conserv. 143, 1250–1258. doi: 10.1016/j.biocon.2010.02.034
Guo, F., Lenoir, J., and Bonebrake, T. C. (2018). Land-use change interacts with climate to determine elevational species redistribution. Nat. Commun. 9:1315. doi: 10.1038/s41467-018-03786-9
Harris, G., and Pimm, S. L. (2008). Range size and extinction risk in forest birds. Conserv. Biol. 22, 163–171. doi: 10.1111/j.1523-1739.2007.00798.x
Harris, J. B. C., Dwi Putra, D., Gregory, S. D., Brook, B. W., Prawiradilaga, D. M., Sodhi, N. S., et al. (2014). Rapid deforestation threatens mid-elevational endemic birds but climate change is most important at higher elevations. Divers. Distrib. 20, 773–785. doi: 10.1111/ddi.12180
Harris, J. B. C., Şekercioǧlu, ÇH., Sodhi, N. S., Fordham, D. A., Paton, D. C., and Brook, B. W. (2011). The tropical frontier in avian climate impact research. IBIS 153, 877–882. doi: 10.1111/j.1474-919X.2011.01166.x
Harrison, X. A., Donaldson, L., Correa-Cano, M. E., Evans, J., Fisher, D. N., Goodwin, C. E. D., et al. (2018). A brief introduction to mixed effects modelling and multi-model inference in ecology. PeerJ 6:e4794. doi: 10.7717/peerj.4794
Holbrook, K. M., Smith, T. B., and Hardesty, B. D. (2002). Implications of long-distance movements of frugivorous rain forest hornbills. Ecography 25, 745–749. doi: 10.1034/j.1600-0587.2002.250610.x
Ibarra-Macias, A., Robinson, W. D., and Gaines, M. S. (2011). Experimental evaluation of bird movements in a fragmented Neotropical landscape. Biol. Conserv. 144, 703–712. doi: 10.1016/j.biocon.2010.08.006
Jankowski, J. E., Londońo, G. A., Robinson, S. K., and Chappell, M. A. (2012). Exploring the role of physiology and biotic interactions in determining elevational ranges of tropical animals. Ecography 36, 1–12. doi: 10.1111/j.1600-0587.2012.07785.x
Jankowski, J. E., Merkord, C. L., Rios, W. F., Cabrera, K. G., Revilla, N. S., and Silman, M. R. (2013). The relationship of tropical bird communities to tree species composition and vegetation structure along an Andean elevational gradient. J. Biogeogr. 40, 950–962. doi: 10.1111/jbi.12041
Jankowski, J. E., Robinson, S. K., and Levey, D. J. (2010). Squeezed at the top: Interspecific aggression may constrain elevational ranges in tropical birds. Ecology 91, 1877–1884. doi: 10.1890/09-2063.1
Jarzyna, M. A., Zuckerberg, B., Porter, W. F., Finley, A. O., and Maurer, B. A. (2015). Spatial scaling of temporal changes in avian communities. Glob. Ecol. Biogeogr. 24, 1236–1248. doi: 10.1111/geb.12361
Jetz, W., Sekercioglu, C. H., and Böhning-Gaese, K. (2008). The worldwide variation in avian clutch size across species and space. PLoS Biol. 6:e303. doi: 10.1371/journal.pbio.0060303
Jetz, W., Thomas, G. H., Joy, J. B., Hartmann, K., and Mooers, A. O. (2012). The global diversity of birds in space and time. Nature 491, 444–448. doi: 10.1038/nature11631
Jones, S. E. I., Tobias, J. A., Freeman, R., and Portugal, S. J. (2019). Weak asymmetric interspecific aggression and divergent habitat preferences at an elevational contact zone between tropical songbirds. Ibis 162, 814–826. doi: 10.1111/ibi.12793
La Sorte, F. A., and Jetz, W. (2010). Projected range contractions of montane biodiversity under global warming. Proc. R. Soc. B Biol. Sci. 277, 3401–3410. doi: 10.1098/rspb.2010.0612
Laurance, S. G. W., Stouffer, P. C., and Laurance, W. F. (2004). Effects of road clearings on movement patterns of understory rainforest birds in central Amazonia. Conserv. Biol. 18, 1099–1109. doi: 10.1111/j.1523-1739.2004.00268.x
Lees, A. C., and Peres, C. A. (2009). Gap-crossing movements predict species occupancy in Amazonian forest fragments. Oikos 118, 280–290. doi: 10.1111/j.1600-0706.2008.16842.x
Lenoir, J., Gégout, J. C., Guisan, A., Vittoz, P., Wohlgemuth, T., Zimmermann, N. E., et al. (2010). Going against the flow: potential mechanisms for unexpected downslope range shifts in a warming climate. Ecography 33, 295–303. doi: 10.1111/j.1600-0587.2010.06279.x
Lenoir, J., Gégout, J. C., Marquet, P. A., De Ruffray, P., and Brisse, H. (2008). A significant upward shift in plant species optimum elevation during the 20th century. Science 320, 1768–1771. doi: 10.1126/science.1156831
Levey, D. J., and Stiles, F. G. (1992). Evolutionary precursors of long-distance migration: resource availability and movement patterns in Neotropical landbirds. Am. Nat. 140, 447–476.
Lister, B. C., and Garcia, A. (2018). Climate-driven declines in arthropod abundance restructure a rainforest food web. Proc. Natl. Acad. Sci.U.S.A. 115, E10397–E10406. doi: 10.1073/pnas.1722477115
Londońo, G. A., Chappell, M. A., Jankowski, J. E., and Robinson, S. K. (2017). Do thermoregulatory costs limit altitude distributions of Andean forest birds? Funct. Ecol. 31, 204–215. doi: 10.1111/1365-2435.12697
MacLean, S. A., and Beissinger, S. R. (2017). Species’ traits as predictors of range shifts under contemporary climate change: a review and meta-analysis. Glob. Chang. Biol. 23, 4094–4105. doi: 10.1111/gcb.13736
Mamantov, M. A., Gibson-Reinemer, D. K., Linck, E. B., and Sheldon, K. S. (2021). Climate-driven range shifts of montane species vary with elevation. Glob. Ecol. Biogeogr. 30, 784–794. doi: 10.1111/geb.13246
McCain, C. M., and Colwell, R. K. (2011). Assessing the threat to montane biodiversity from discordant shifts in temperature and precipitation in a changing climate. Ecol. Lett. 14, 1236–1245. doi: 10.1111/j.1461-0248.2011.01695.x
McFadden, I. R., Sandel, B., Tsirogiannis, C., Morueta-Holme, N., Svenning, J. C., Enquist, B. J., et al. (2019). Temperature shapes opposing latitudinal gradients of plant taxonomic and phylogenetic β diversity. Ecol. Lett. 22, 1126–1135. doi: 10.1111/ele.13269
Meiri, S., and Dayan, T. (2003). On the validity of Bergmann’s rule. J. Biogeogr. 30, 331–351. doi: 10.1046/j.1365-2699.2003.00837.x
Moritz, C., Patton, J. L., Conroy, C. J., Parra, J. L., White, G. C., and Beissinger, S. R. (2008). Impact of a century of climate change on small-mammal communities in Yosemite National Park. USA. Science 322, 261–264. doi: 10.1126/science.1163428
Myers, N., Mittermeier, R. A., Mittermeier, C. G., da Fonseca, G. A. B., and Kent, J. (2000). Biodiversity hotspots for conservation priorities. Nature 403, 853–858. doi: 10.1038/35002501
Nagelkerke, N. J. D. (1991). A note on a general definition of the coefficient of determination. Biometrika 78, 691–692.
Neate-Clegg, M. H. C., Horns, J. J., Adler, F. R., and Kemahlı Aytekin, M. Ç, and Şekercioǧlu, ÇH. (2020a). Monitoring the world’s bird populations with community science data. Biol. Conserv. 248:108653. doi: 10.1016/j.biocon.2020.108653
Neate-Clegg, M. H. C., Jones, S. E. I., Burdekin, O., Jocque, M., and Şekercioǧlu, ÇH. (2018). Elevational changes in the avian community of a Mesoamerican cloud forest park. Biotropica 50, 805–815. doi: 10.1111/btp.12596
Neate-Clegg, M. H. C., O’Brien, T. G., Mulindahabi, F., and Şekercioǧlu, ÇH. (2020b). A disconnect between upslope shifts and climate change in an Afrotropical bird community. Conserv. Sci. Pract. 2, 1–11. doi: 10.1111/csp2.291
Neate-Clegg, M. H. C., Stuart, S. N., Mtui, D., Şekercioǧlu, ÇH., and Newmark, W. D. (2021). Afrotropical montane birds experience upslope shifts and range contractions along a fragmented elevational gradient in response to global warming. PLoS One e0248712. doi: 10.1371/journal.pone.0248712
Newmark, W. D. (2006). A 16-year study of forest disturbance and understory bird community structure and composition in Tanzania. Conserv. Biol. 20, 122–134. doi: 10.1111/j.1523-1739.2006.00273.x
Newmark, W. D., Jenkins, C. N., Pimm, S. L., McNeally, P. B., and Halley, J. M. (2017). Targeted habitat restoration can reduce extinction rates in fragmented forests. Proc. Natl. Acad. Sci.U.S.A. 114, 9635–9640. doi: 10.1073/pnas.1705834114
Newmark, W. D., Mkongewa, V. J., and Sobek, A. D. (2010). Ranging behavior and habitat selection of terrestrial insectivorous birds in north-east Tanzania: implications for corridor design in the Eastern Arc Mountains. Anim. Conserv. 13, 474–482. doi: 10.1111/j.1469-1795.2010.00366.x
Orme, C. D. L., Davies, R. G., Burgess, M., Eigenbrod, F., Pickup, N., Olson, V. A., et al. (2005). Global hotspots of species richness are not congruent with endemism or threat. Nature 436, 1016–1019. doi: 10.1038/nature03850
Paxton, E. H., Camp, R. J., Gorresen, P. M., Crampton, L. H. Jr., Leonard, D. L., and Vanderwerf, E. A. (2016). Collapsing avian community on a Hawaiian island. Sci. Adv. 2:e1600029. doi: 10.1126/sciadv.1600029
Pigot, A. L., Sheard, C., Miller, E. T., Bregman, T. P., Freeman, B. G., Roll, U., et al. (2020). Macroevolutionary convergence connects morphological form to ecological function in birds. Nat. Ecol. Evol. 4, 230–239. doi: 10.1038/s41559-019-1070-4
Pollock, H. S., Brawn, J. D., and Cheviron, Z. A. (2020). Heat tolerances of temperate and tropical birds and their implications for susceptibility to climate warming. Funct. Ecol. 35, 93–104. doi: 10.1111/1365-2435.13693
Potts, K. B., Watts, D. P., Langergraber, K. E., and Mitani, J. C. (2020). Long-term trends in fruit production in a tropical forest at Ngogo, Kibale National Park, Uganda. Biotropica 52, 521–532. doi: 10.1111/btp.12764
Pounds, J., Fogden, M., and Campbell, J. (1999). Biological response to climate change on a tropical mountain. Nature 398, 611–615. doi: 10.1038/19297
Quintero, I., and Jetz, W. (2018). Global elevational diversity and diversification of birds. Nature 555, 246–250. doi: 10.1038/nature25794
R Core Team (2020). R: A Language and Environment for Statistical Computing. Vienna: R Foundation for Statistical Computing.
Rahbek, C., Borregaard, M. K., Antonelli, A., Colwell, R. K., Holt, B. G., Nogues-Bravo, D., et al. (2019a). Building mountain biodiversity: geological and evolutionary processes. Science 365, 1114–1119. doi: 10.1126/science.aax0151
Rahbek, C., Borregaard, M. K., Colwell, R. K., Dalsgaard, B., Holt, B. G., Morueta-Holme, N., et al. (2019b). Humboldt’s enigma: what causes global patterns of mountain biodiversity? Science 365, 1108–1113. doi: 10.1126/science.aax0149
Reif, J., and Flousek, J. (2012). The role of species’ ecological traits in climatically driven altitudinal range shifts of central European birds. Oikos 121, 1053–1060. doi: 10.1111/j.1600-0706.2011.20008.x
Revell, L. J. (2012). phytools: an R package for phylogenetic comparative biology (and other things). Methods Ecol. Evol. 3, 217–223. doi: 10.1111/j.2041-210X.2011.00169.x
Román-Palacios, C., and Wiens, J. J. (2020). Recent responses to climate change reveal the drivers of species extinction and survival. Proc. Natl. Acad. Sci. U. S. A. 117, 4211–4217. doi: 10.1073/pnas.1913007117
Rumpf, S. B., Hülber, K., Zimmermann, N. E., and Dullinger, S. (2019). Elevational rear edges shifted at least as much as leading edges over the last century. Glob. Ecol. Biogeogr. 28, 533–543. doi: 10.1111/geb.12865
Salisbury, C. L., Seddon, N., Cooney, C. R., and Tobias, J. A. (2012). The latitudinal gradient in dispersal constraints: ecological specialisation drives diversification in tropical birds. Ecol. Lett. 15, 847–855. doi: 10.1111/j.1461-0248.2012.01806.x
Saracco, J. F., Collazo, J. A., and Groom, M. J. (2004). How do frugivores track resources? Insights from spatial analyses of bird foraging in a tropical forest. Oecologia 139, 235–245. doi: 10.1007/s00442-004-1493-7
Schumm, M., White, A. E., Supriya, K., and Price, T. D. (2020). Ecological limits as the driver of bird species richness patterns along the east himalayan elevational gradient. Am. Nat. 2:60637. doi: 10.5061/dryad.hmgqnk9bx
Şekercioglu, Ç. H. (2007). Global Warming Creates a Atairway to Heaven. Scitizen. Available online at: http://scitizen.com/climate-change/global-warming-creates-a-stairway-to-heaven_a-13-1283.html (accessed September 27, 2020).
Şekercioǧlu, Ç. H. (2011). Functional extinctions of bird pollinators cause plant declines. Science 331, 1019–1020.
Şekercioǧlu, Ç. H. (2012). Promoting community-based bird monitoring in the tropics: conservation, research, environmental education, capacity-building, and local incomes. Biol. Conserv. 151, 69–73. doi: 10.1016/j.biocon.2011.10.024
Şekercioǧlu, Ç. H., Daily, G. C., and Ehrlich, P. R. (2004). Ecosystem consequences of bird declines. Proc. Natl. Acad. Sci. U. S. A. 101, 18042–18047.
Şekercioǧlu, Ç. H., Mendenhall, C. D., Oviedo-Brenes, F., Horns, J. J., Ehrlich, P. R., and Daily, G. C. (2019). Long-term declines in bird populations in tropical agricultural countryside. Proc. Natl. Acad. Sci.U.S.A. 116, 9903–9912. doi: 10.1073/pnas.1802732116
Şekercioǧlu, Ç. H., Schneider, S. H., Fay, J. P., and Loarie, S. R. (2008). Climate change, elevational range shifts, and bird extinctions. Conserv. Biol. 22, 140–150. doi: 10.1111/j.1523-1739.2007.00852.x
Şekercioǧlu, Ç. H. Wenny, D. G., Whelan, C. J. (eds). (2016). Why Birds Matter: Avian Ecological Function and Ecosystem Services. Chicago: University of Chicago Press.
Sheard, C., Neate-Clegg, M. H. C., Alioravainen, N., Jones, S. E. I., Vincent, C., Macgregor, H. E. A., et al. (2020). Ecological drivers of global gradients in avian dispersal inferred from wing morphology. Nat. Commun. 11:2463. doi: 10.1038/s41467-020-16313-6
Shoo, L. P., Williams, S. E., and Hero, J. M. (2005a). Climate warming and the rainforest birds of the Australian Wet Tropics: using abundance data as a sensitive predictor of change in total population size. Biol. Conserv. 125, 335–343. doi: 10.1016/j.biocon.2005.04.003
Shoo, L. P., Williams, S. E., and Hero, J. M. (2005b). Potential decoupling of trends in distribution area and population size of species with climate change. Glob. Chang. Biol. 11, 1469–1476. doi: 10.1111/j.1365-2486.2005.00995.x
Smith, B. T., McCormack, J. E., Cuervo, A. M., Hickerson, M. J., Aleixo, A., Cadena, C. D., et al. (2014). The drivers of tropical speciation. Nature 515, 406–409. doi: 10.1038/nature13687
Srinivasan, U., Elsen, P. R., Tingley, M. W., and Wilcove, D. S. (2018). Temperature and competition interact to structure himalayan bird communities. Proc. R. Soc. B Biol. Sci 285, 20172593. doi: 10.1098/rspb.2017.2593
Stouffer, P. C., Jirinec, V., Rutt, C. L., Bierregaard, R. O., Hernández-Palma, A., Johnson, E. I., et al. (2020). Long-term change in the avifauna of undisturbed Amazonian rainforest: ground-foraging birds disappear and the baseline shifts. Ecol. Lett. 24, 186–195. doi: 10.1111/ele.13628
Stouffer, P. C., Strong, C., and Naka, L. N. (2009). Twenty years of understorey bird extinctions from Amazonian rain forest fragments: Consistent trends and landscape-mediated dynamics. Divers. Distrib. 15, 88–97. doi: 10.1111/j.1472-4642.2008.00497.x
Tingley, M. W., Koo, M. S., Moritz, C., Rush, A. C., and Beissinger, S. R. (2012). The push and pull of climate change causes heterogeneous shifts in avian elevational ranges. Glob. Chang. Biol. 18, 3279–3290. doi: 10.1111/j.1365-2486.2012.02784.x
Tobias, J. A., Şekercioǧlu, ÇH., and Vargas, F. H. (2013). “Bird conservation in tropical ecosystems: challenges and opportunities,” in Key Topics in Conservation Biology 2, eds D. W. Macdonald and K. J. Willis (New York, NY: John Wiley & Sons), 258–276. doi: 10.1002/9781118520178.ch15
Tobias, J. A., Sheard, C., Seddon, N., Meade, A., Cotton, A. J., and Nakagawa, S. (2016). Territoriality, social bonds, and the evolution of communal signaling in birds. Front. Ecol. Evol. 4:74. doi: 10.3389/fevo.2016.00074
Valcu, M., Dale, J., Griesser, M., Nakagawa, S., and Kempenaers, B. (2014). Global gradients of avian longevity support the classic evolutionary theory of ageing. Ecography 37, 930–938. doi: 10.1111/ecog.00929
Van Houtan, K. S., Pimm, S. L., Halley, J. M., Bierregaard, R. O., and Lovejoy, T. E. (2007). Dispersal of Amazonian birds in continuous and fragmented forest. Ecol. Lett. 10, 219–229. doi: 10.1111/j.1461-0248.2007.01004.x
van Schaik, C., Terborgh, S., and Wright, S. (2010). The phenology of tropical forests: adaptive significance and consequences for primary consumers. Annu. Rev. Ecol. Syst. 24, 353–377.
Wilman, H., Belmaker, J., Simpson, J., de la Rosa, C., Rivadeneira, M. M., and Jetz, W. (2014). EltonTraits 1.0: species-level foraging attributes of the world’s birds and mammals. Ecology 95, 2027–2027. doi: 10.1890/13-1917.1
Wormworth, J., and Şekercioǧlu, ÇH. (2011). Winged Sentinels: Birds and Climate Change. New York, NY: Cambridge University Press.
Keywords: body mass, climate change, dietary guild, dispersal ability, functional traits, range limits, territoriality, tropical mountains
Citation: Neate-Clegg MHC, Jones SEI, Tobias JA, Newmark WD and Şekercioǧlu ÇH (2021) Ecological Correlates of Elevational Range Shifts in Tropical Birds. Front. Ecol. Evol. 9:621749. doi: 10.3389/fevo.2021.621749
Received: 26 October 2020; Accepted: 22 March 2021;
Published: 12 April 2021.
Edited by:
Orsolya Valkó, Centre for Ecological Research, Hungarian Academy of Sciences, HungaryReviewed by:
Trevor Price, The University of Chicago, United StatesCopyright © 2021 Neate-Clegg, Jones, Tobias, Newmark and Şekercioǧlu. This is an open-access article distributed under the terms of the Creative Commons Attribution License (CC BY). The use, distribution or reproduction in other forums is permitted, provided the original author(s) and the copyright owner(s) are credited and that the original publication in this journal is cited, in accordance with accepted academic practice. No use, distribution or reproduction is permitted which does not comply with these terms.
*Correspondence: Montague H. C. Neate-Clegg, bW9udGVuZWF0ZWNsZWdnQGdtYWlsLmNvbQ==
Disclaimer: All claims expressed in this article are solely those of the authors and do not necessarily represent those of their affiliated organizations, or those of the publisher, the editors and the reviewers. Any product that may be evaluated in this article or claim that may be made by its manufacturer is not guaranteed or endorsed by the publisher.
Research integrity at Frontiers
Learn more about the work of our research integrity team to safeguard the quality of each article we publish.