 Helen A. White
 John K. Scott
 Raphael K. Didham
95% of researchers rate our articles as excellent or good
Learn more about the work of our research integrity team to safeguard the quality of each article we publish.
Find out more
ORIGINAL RESEARCH article
Front. Ecol. Evol. , 18 June 2021
Sec. Biogeography and Macroecology
Volume 9 - 2021 | https://doi.org/10.3389/fevo.2021.605951
This article is part of the Research Topic Predicting and Managing Climate-Driven Range Shifts in Plants View all 12 articles
Riparian corridors are thought to form hydrological refugia that may buffer species and communities against regional climate changes. In regions facing a warming and drying climate, however, the hydrological regime driving riparian communities is also under threat. We examined recruitment in response to streamflow declines for species inhabiting the riparian zone in southwest Western Australia, testing the extent to which the riparian system has buffered riparian communities from the drying climate. We stratified 49 vegetation transects across the >600 mm per annum regional rainfall gradient encompassed by the Warren River Catchment. Local hydrological conditions were estimated over two 10-year periods; 1980–1989, and 2001–2010, to quantify changes in the flood regime. Mixed effects models tested the relationship between rainfall and flooding on the relative frequency of immature to mature individuals of 17 species of trees and shrubs common to the riparian zones. At the low-rainfall extent of their geographic range, the relative frequency of immature riparian species decreased with declining flow, whereas at the high-rainfall extent of their geographic range the relative frequency of immature individuals increased with declining flow. These results suggest that the geographic ranges of riparian species may be contracting at the low-rainfall margin of their range, while at the high-rainfall margin of their geographic range, reduced flooding regimes appear to be opening up new habitat suitable for recruitment and narrowing the river corridor. No such patterns were observed in upland species, suggesting the river may be buffering upland species. We discuss these findings and their implications for ongoing management and species conservation in a region projected to face further, significant rainfall declines.
For many species, survival over the coming decades will depend on their ability to adapt to the new climatic conditions in situ, or shift geographic range to maintain their climatic optimum (Parmesan, 2006; Aitken et al., 2008). In stark contrast to mobile organisms where analyses of distributional shifts have been shown to match climatic shifts (Chen et al., 2011; Lenoir et al., 2020), sessile organisms, particularly those with longer generation times, can be much more constrained in their responses to climate change (Lenoir and Svenning, 2015; but see Ström et al., 2011).
In a strict sense, determination of range shifts in response to climate change requires temporally replicated data (Bertrand et al., 2011; Feeley et al., 2011; Telwala et al., 2013). In lieu of such datasets, range shifts in plant species have been inferred by examining the skew in abundance distributions (Breshears et al., 2008; Murphy et al., 2010), or by exploiting the long generation times and comparing the distribution of seedlings relative to the adult population (Lenoir et al., 2009; Zhu et al., 2012, 2014; Fei et al., 2017). The assumption is made that the range inhabited by new recruits is representative of the optimal climatic envelope within current climate space, while the distribution of adults represents a climate envelope characteristic of former conditions (Lenoir et al., 2009).
Species range expansion is typically observed as the establishment of seedlings beyond the former adult range (Galiano et al., 2010; Vitasse et al., 2012). While range contraction can manifest as recruitment failure at range margins (Zhu et al., 2012; Bell et al., 2014), adult mortality events are typically taken as more ‘conclusive’ evidence. These mortality events can be evident for long-lived species following catastrophic disturbance events (Allen et al., 2010; Brouwers et al., 2013; Matusick et al., 2013; Harris et al., 2018), or as more gradual declines in growth and crown dieback (Stella et al., 2013). Juvenile recruitment within an existing range, however, can be much more sensitive to incremental changes in environmental conditions and provide an early indication of a site becoming unsuitable (Lloret et al., 2009; Bell et al., 2014; Garssen et al., 2014).
There is a growing body of evidence that topographic and hydrological features in the landscape may reduce exposure to regional climate changes and buffer organisms from broader environmental changes (Dobrowski, 2011; Lenoir et al., 2017; McLaughlin et al., 2017). Riparian zones are predicted to buffer the suboptimal climatic conditions in regions experiencing a warming and drying climate, affording species more time to adapt to the new environmental conditions. The buffering effect of riparian systems in the face of climate warming hinges on the resilience of the hydrological processes under changed climatic conditions (Davis et al., 2019). In regions with warming and drying climates, the hydrological regime driving water availability in riparian systems is also under threat (Barron et al., 2012), placing specialist riparian species under stress from both hydrological conditions and increasing competition from upland species (Garssen et al., 2014).
Here, we test the ecological impacts of multidecadal streamflow declines on the riparian plant communities of south-west Western Australia (SWWA). We examine the relative frequency of immature versus mature individuals of riparian and upland species inhabiting the riparian zones in response to recent changes in local hydrological conditions. We hypothesize, first, that riparian species that are restricted to near-channel habitats, due to their higher sensitivity to surface water availability, will show a contracted geographic range of immature individuals relative to the observed geographic range of the adult population. Second, we hypothesize that less moisture-demanding upland species will be buffered from regional declines if they inhabit the riparian zone, and therefore the distribution of immature individuals is likely to match the distribution of mature individuals for upland species.
The Warren River, and its major tributaries the Tone River and Murrin Brook of the SWWA are cumulatively about 275 km in length (Figure 1A) and transect a shallow topographical gradient to a maximum elevation of 385 m asl (Geoscience Australia, 2016). Native vegetation, in either reserves or indigenous forestry, is the dominant land cover across approximately two-thirds of the catchment (Figure 1A) (DPIRD, 2020). A few sub-catchments in the lower Warren are important agricultural regions and withhold water in dammed gullies for irrigation. In these sub-catchments, water abstraction limits are set to ensure a sustainable ecological flow (Department of Water, 2012).
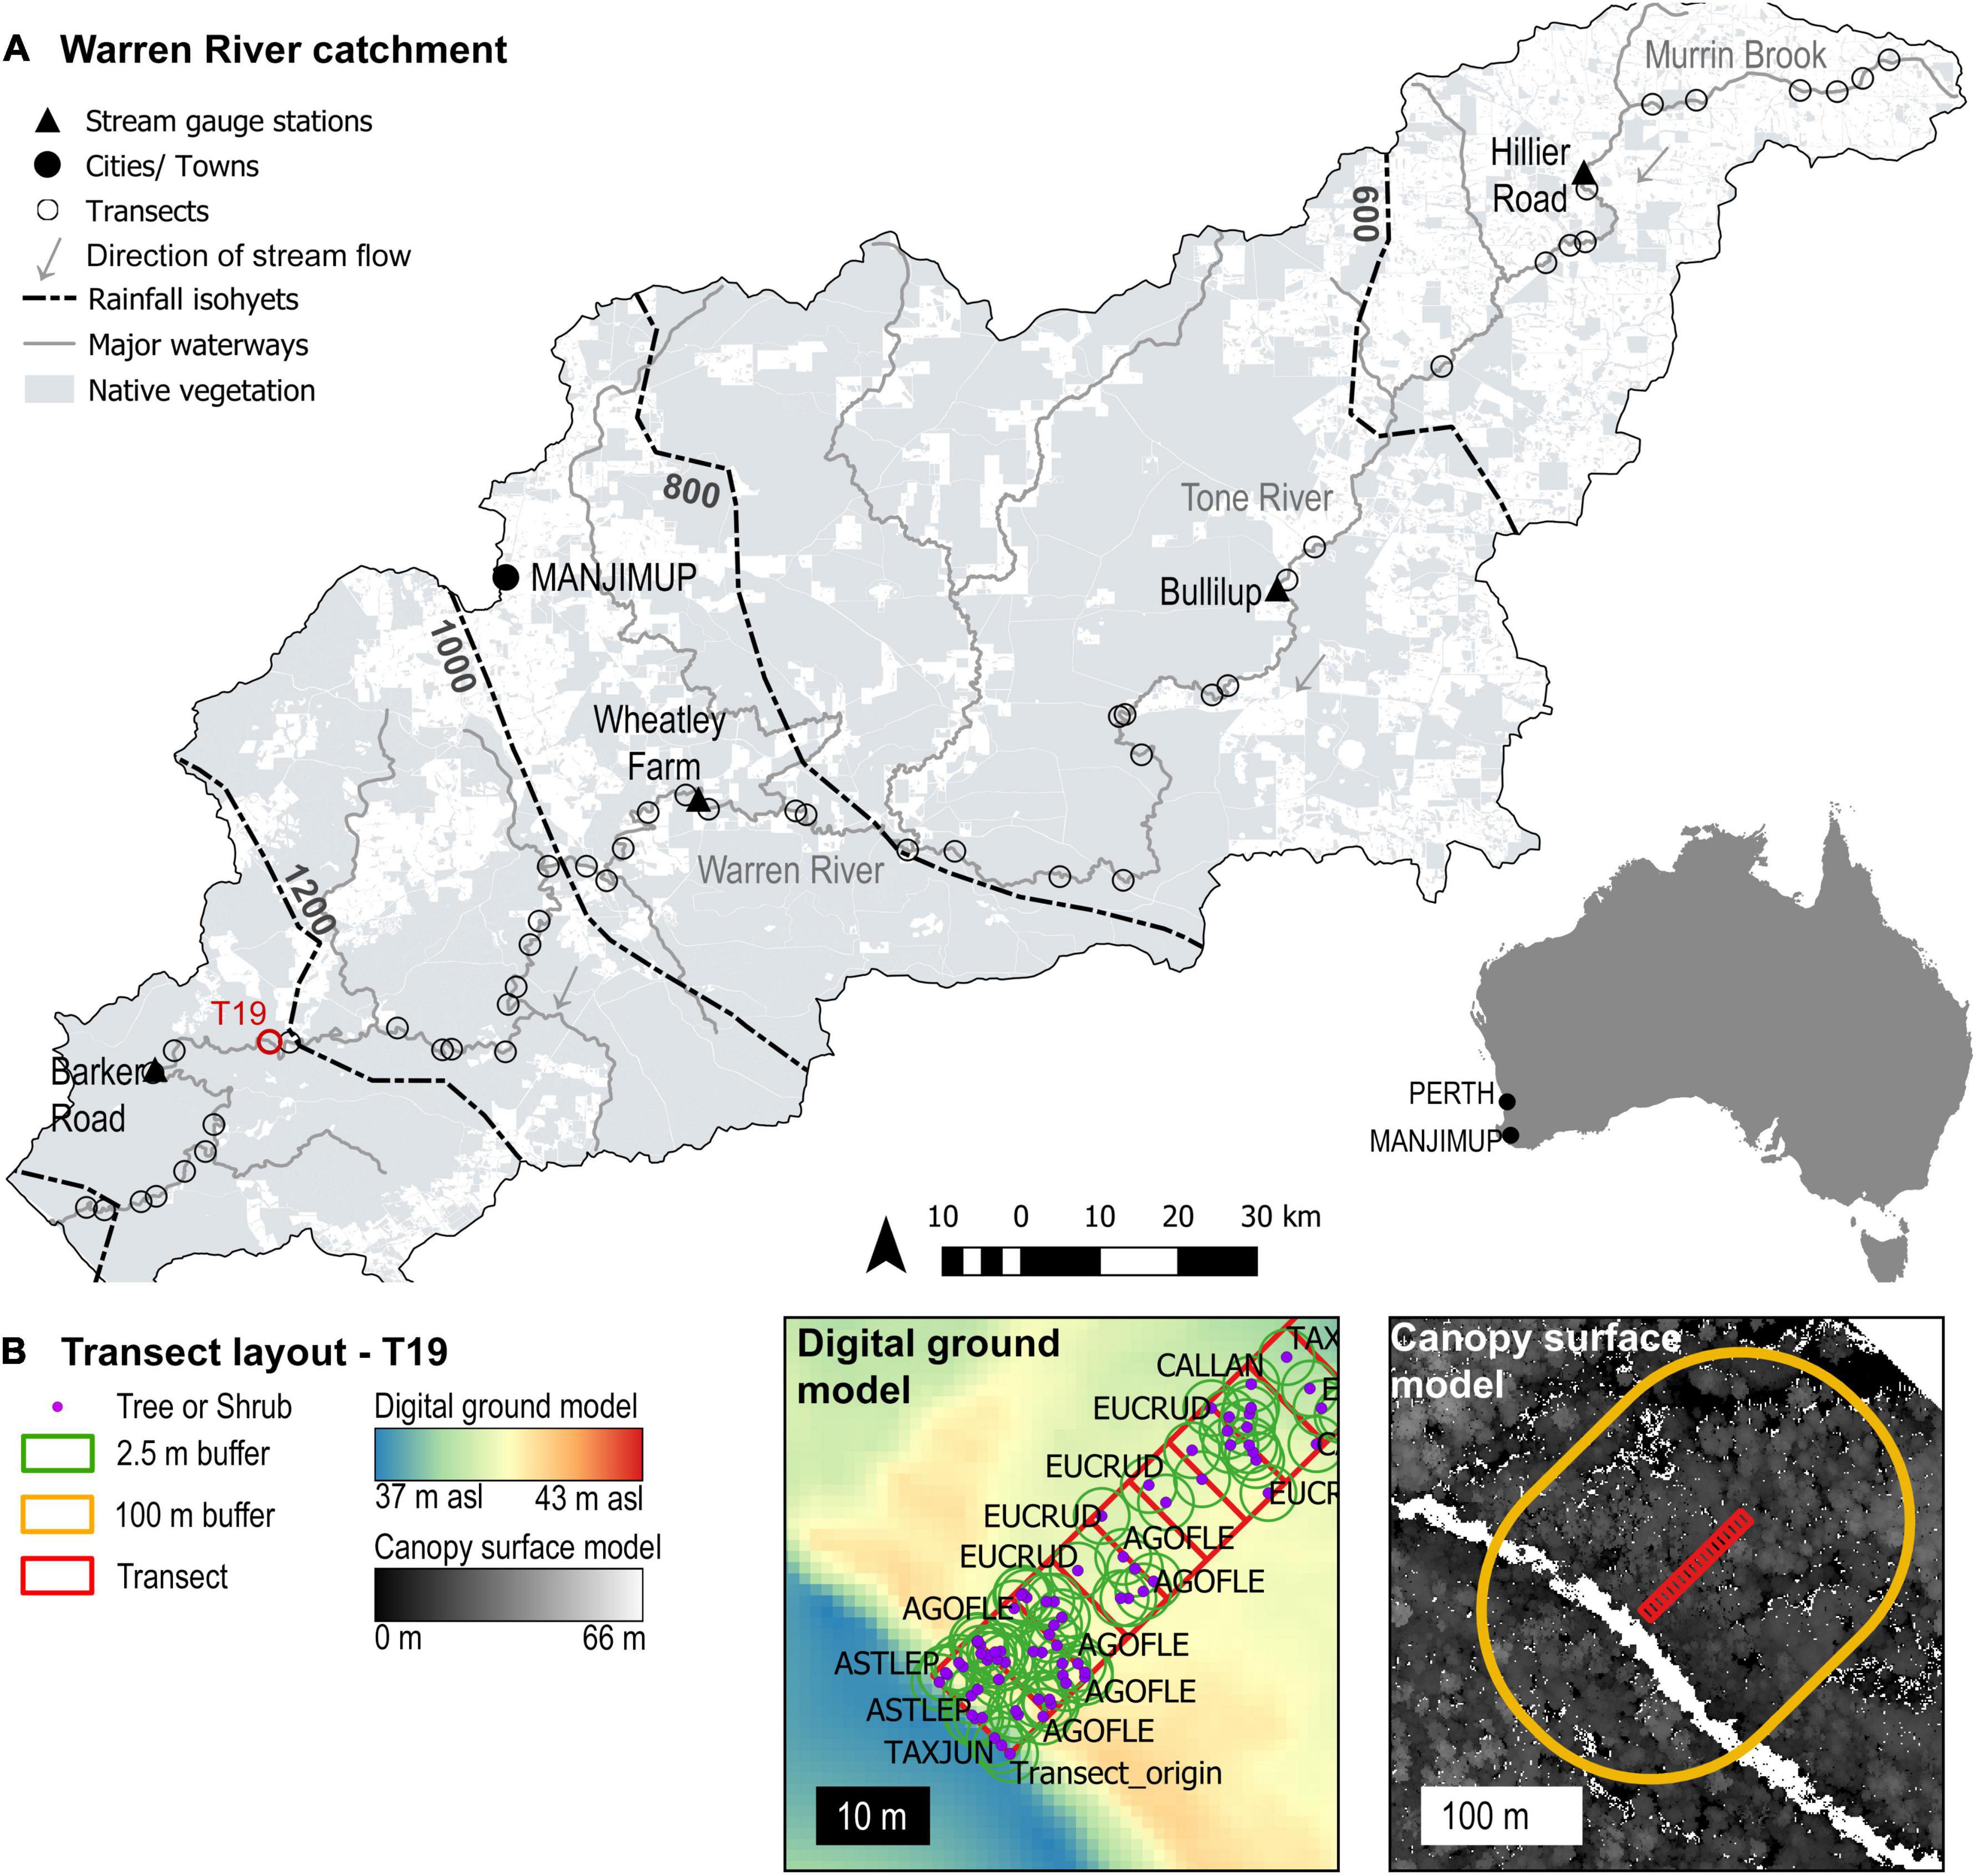
Figure 1. The Warren River Catchment and vegetation survey design. (A) The Warren River Catchment in the south-west of Western Australia marking the locations of vegetation transects, the Department of Water Gauge stations (Department of Water and Environmental Regulation, 2016), and the coverage of native vegetation (DPIRD, 2020), on basemaps sourced from Geoscience Australia (2016). (B) The layout of vegetation transects, demonstrated with T19, where transects were rectified using aerial imagery, field photographs and digital elevation models. The elevation of each tree was calculated relative to transect origin. Forest structure was quantified within buffer zones of 2.5 m for individual plants, and 100 m for transects. Note that the river in the canopy surface model is white, where no vegetation points were recorded.
Mean annual temperatures vary little across the catchment (between 14.3 and 15.7°C). By contrast, mean annual rainfall ranges from over 1200 mm per annum (mm pa) at the mouth of the river, to less than 550 mm pa in the headwaters (between 1901 and 1960, Bureau of Meteorology, 2010). A significant decline in the frequency and magnitude of wet weather systems has been observed in SWWA since the 1970’s (Hope et al., 2006), resulting in a 16% decline in rainfall, and culminating in reductions of over 50% in surface runoff in some rivers and water storage dams (Petrone et al., 2010). This trend in declining rainfall is predicted to continue under modeled future climate scenarios (Barron et al., 2012; Silberstein et al., 2012; Hope et al., 2015). As the major climatic driver of vegetation types across the region, rainfall declines are predicted to shift optimal climatic envelopes for vegetation communities (Hamer et al., 2015; Ramalho et al., 2017).
Accurate spatial quantification of topography and vegetation structure running the length of the Warren River was obtained using an aerial LiDAR (light detecting and ranging) survey. A 500 m wide band, spanning the length of the Warren and its tributaries was carried out from the 13th to the 16th of January 2015 by AAM Geospatial Pty Ltd from a fixed wing aircraft using a Q780 laser system with a pulse rate frequency of 180 kHz. The laser returns had a horizontal accuracy of 0.55 m and vertical accuracy of 0.30 m, and were supplied as point clouds, comprised of x: longitude, y: latitude, and z: elevation meters above sea level. The point clouds were classified algorithmically by AAM into ground, infrastructure and vegetation points, and a 1 × 1 m resolution digital ground model (DGM) was interpolated from the ground points. The LiDAR survey was conducted during summer when the river had ceased to flow and much of the upper half of the catchment was dry. This enabled us to capture elevation across the dry river bed or water level of permanent water bodies.
Vegetation sampling sites were stratified by rainfall isohyet, defining five strata, ≤600, 600–800, 800–1000, 1000–1200 and >1200 mm (Figure 1A). Within each stratum, 20 potential survey locations, spaced at least 1 km apart and randomly assigned to the true left or true right bank, were randomly generated in ArcGIS 10.3.1 (ESRI Inc.). The feasibility of sampling at each of these locations was assessed during site visits, aiming to survey 10 sites per zone. Sites were rejected if: (1) the area was disturbed by human infrastructure such as roads or bridges or the site was visibly impacted by (2) herbicide use; or (3) recent fire. Vegetation survey sites were classified into flood plains or steep banks. Once five sites of either landform had been selected within a zone, all further sites of that landform were rejected to ensure surveys covered a representative range of geomorphic habitats. Difficult access (e.g., steep granite cliffs) within the 1000–1200 mm pa zone meant that only eight sites were sampled in this zone. An additional site was sampled in the <600 mm pa zone to increase the total area sampled across the narrow riparian zones of the upper catchment. A total of n = 49 sites (≤ 600 mm, n = 11; 600–800 mm, n = 10; 800–1000 mm, n = 10; 1000–1200 mm, n = 8; > 1200 mm, n = 10) were surveyed once each, during one of two consecutive summers, December 2013 to April 2014, and November 2014 to May 2015.
A 10 m wide transect was run at each site from the water’s edge (the edge of the dry river bed in the upper catchment) to the end of the riparian zone. Transect length was determined by site geomorphology, and a change in the dominant vegetation type, varying in length from 5 to 90 m (Figure 1B). The coordinates at the ends of each transect were marked using a GPS unit (GPSMAP® 62s, Garmin) and the location of each plant rooted within the transect recorded. The position of each plant relative to the transect line was recorded to the nearest 0.5 m. All trees and shrubs were identified to species level following the nomenclature of the Western Australian Herbarium (Western Australian Herbarium FloraBase, 1998).
As the majority of the trees and woody shrubs in the region (predominantly Fabaceae, Myrtaceae, and Proteaceae; Table 1) retain a woody capsule/fruit after seed set, each plant was searched for the presence of fruit or flowers to assess whether an individual was reproductively immature or mature, as a binary response. Agonis flexuosa was the only species observed to sucker and reproduce vegetatively, but without a means to identify an immature individual decisively as the product of sexual or vegetative reproduction both were included and the results treated with added caution. Astartea leptophylla and, less often, Eucalyptus rudis were observed to layer where a branch had been damaged, or coppice from the base of mature individuals, and these were considered part of the parent plant. In these low-power systems (Pettit and Froend, 2001b), layering and coppicing seemed to serve as an adaptation to extend the life of a single diseased or damaged individual, rather than as a means to replicate (H. White personal observation). A binary response of reproductive status was used as opposed to size-class structure based on heights or stem diameters for two reasons: first, to estimate broad ‘recruitment’ trends and reduce the temporal bias of the single time point sample; and second, a size-based age classification could not be consistently applied across the length of the catchment due to the variation in growth rates imposed by the rainfall gradient.
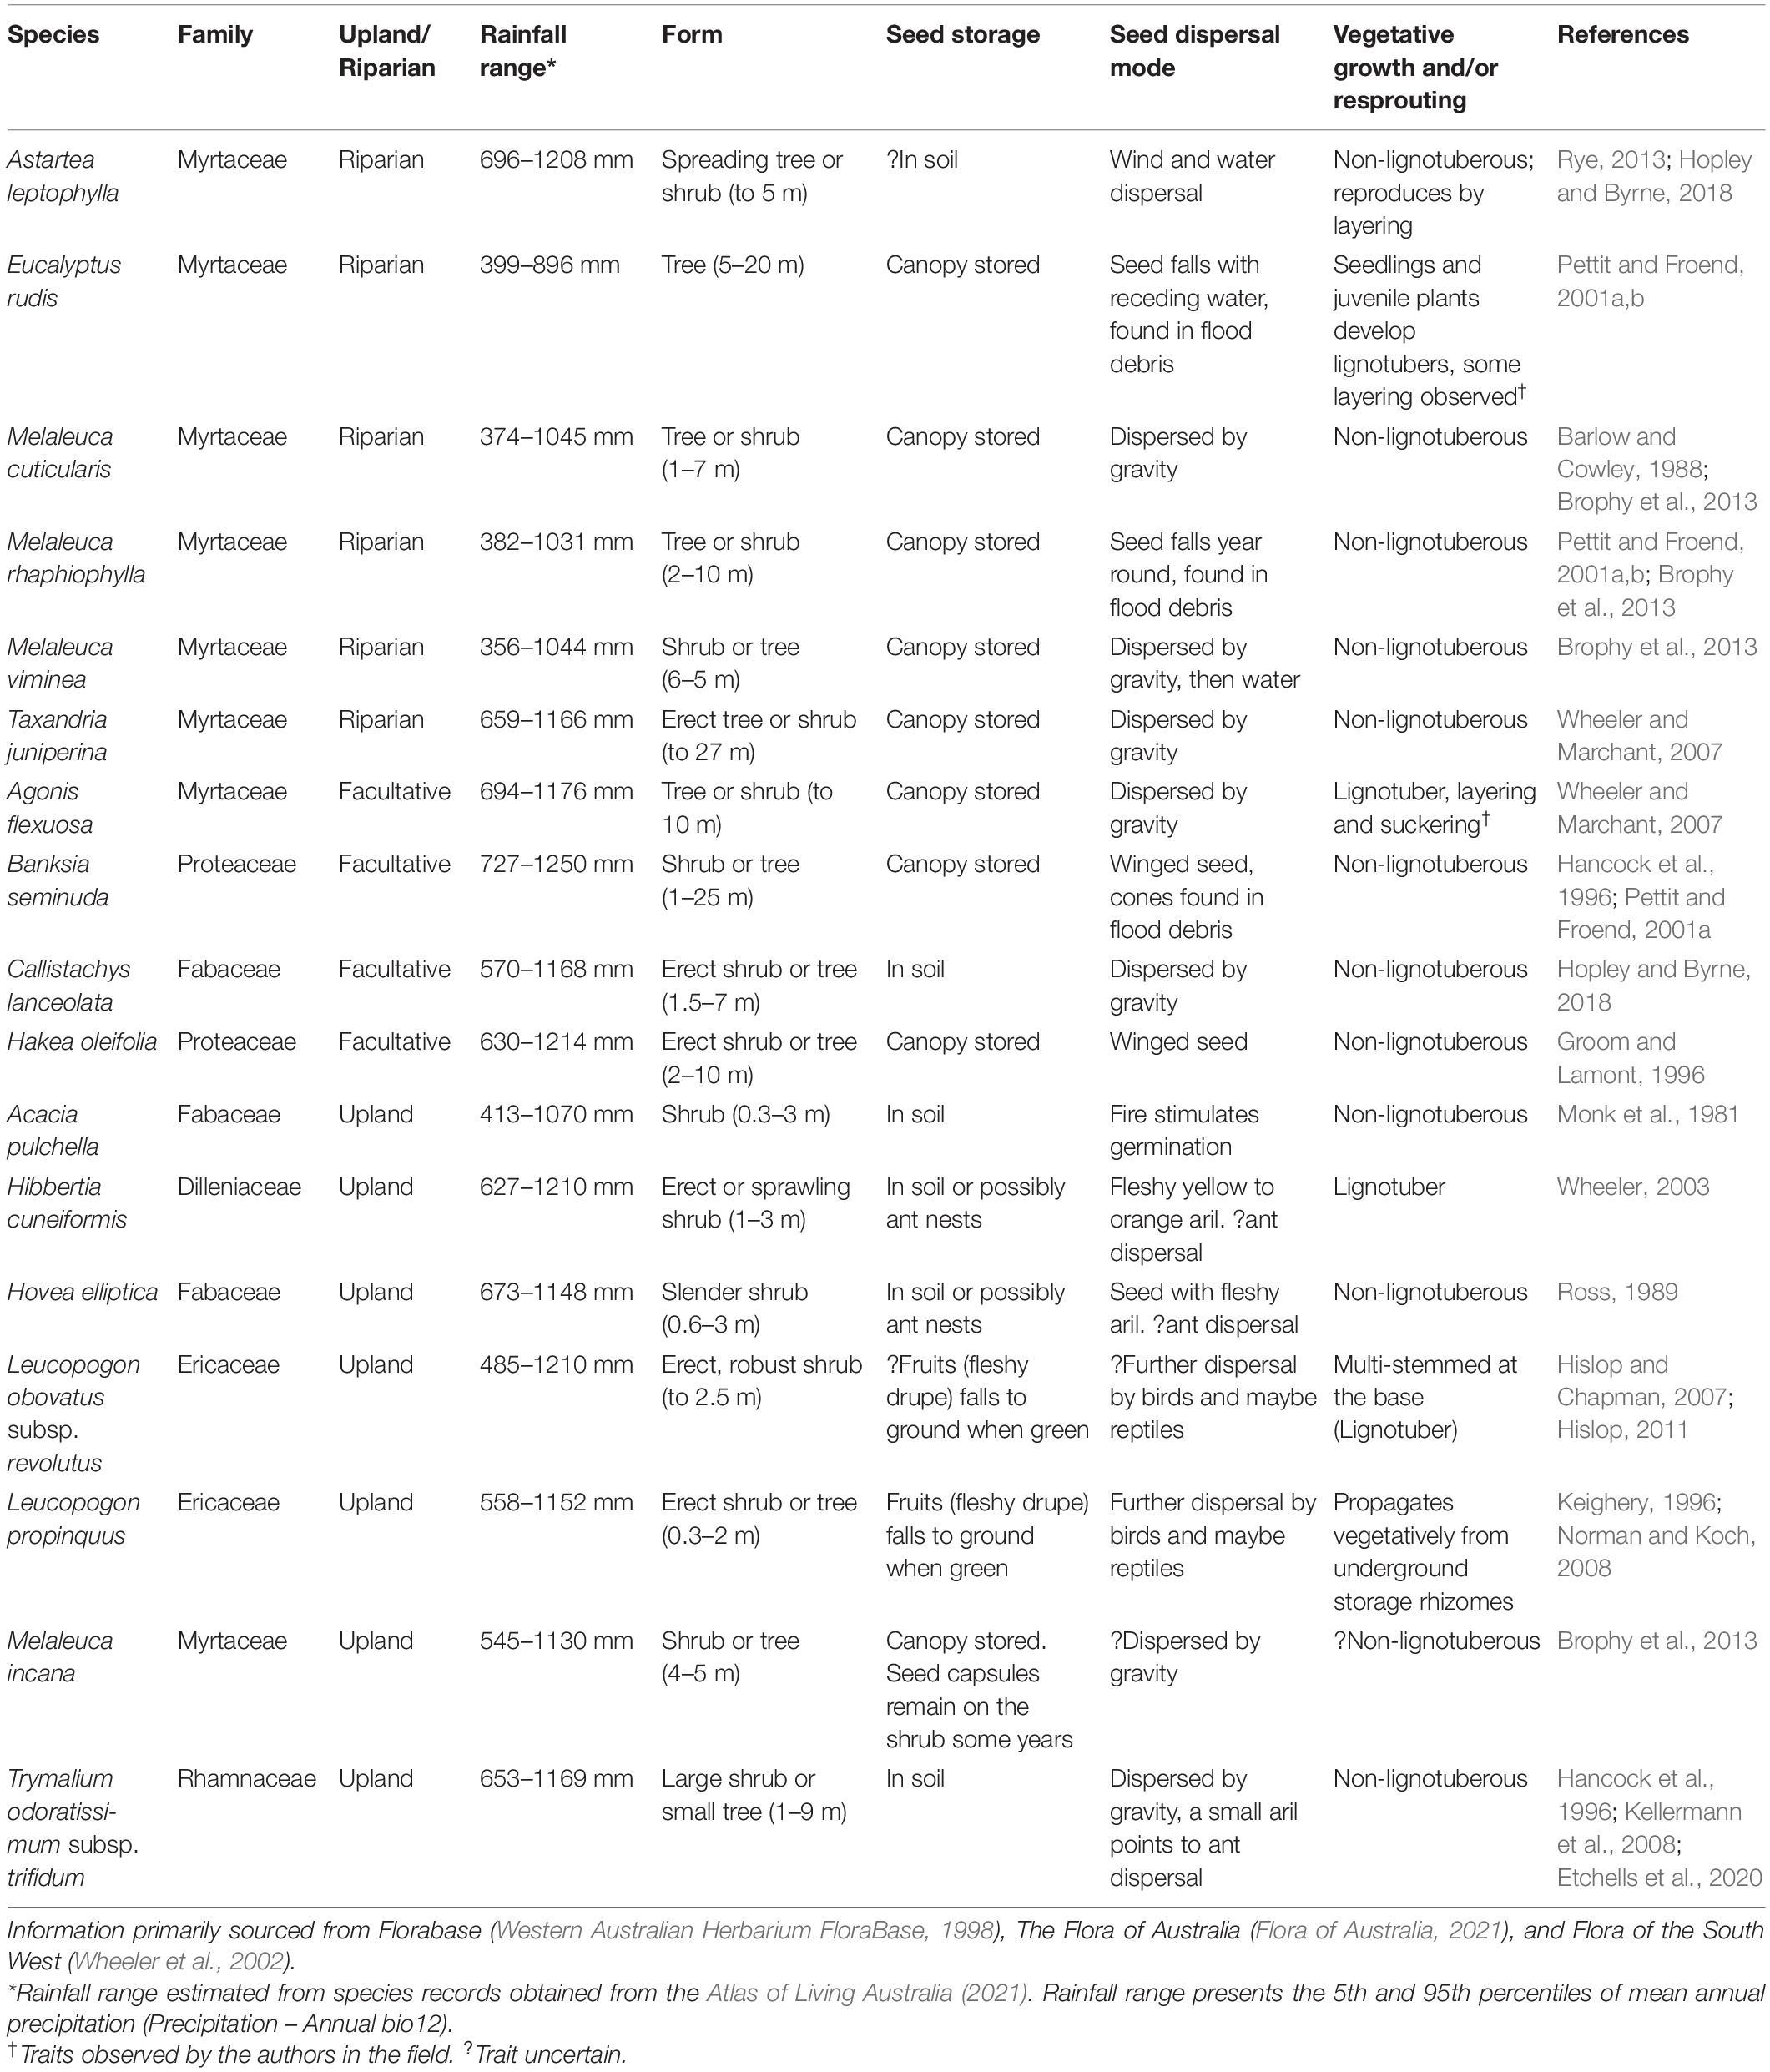
Table 1. Habitat and reproductive traits of the woody trees and shrubs common to the riparian zone of the Warren River Catchment.
The transect coordinates were spatially rectified to the DGM, LiDAR vegetation point clouds and field photographs in ArcGIS 10.3.1 to account for field GPS error. The position of each plant within a transect was spatially adjusted to the rectified transect position to obtain corrected geographic coordinates. The absolute elevation (m asl) and elevation relative to the transect origin (i.e., above base flow) for each plant was extracted from the DGM and used to calculate hydrological parameters.
To investigate species distribution patterns in relation to surface water and flood regime, parameters describing ecologically important aspects of flow were estimated using the DGM and maximum daily stage height data obtained from the West Australian Department of Water and Environmental Regulation (DWER) for four gauging stations situated in the main channel along the Warren and Tone Rivers (Figure 1A, Hiller Road, Bullilup, Wheatley Farm and Barker Road Crossing, Department of Water and Environmental Regulation, 2016). Past and recent flow conditions were estimated by selecting two 10-year periods. 1980 to 1989 represents a past condition and was selected as the first decade where three of the gauges on the main channel were in place (Barker Road was established April 1966, Wheatley Farm in 1970 and Bullilup in 1978). The second period, 2001 to 2010, was selected to represent recent conditions based on the availability of data from the Hiller Road gauge station, which was established in June 2000, but was then offline from 2013 to 2015 (Figure 2). Unfortunately, continuous flow records are not available for periods predating the 1970s ‘step decline’ in precipitation, so the selected periods are likely to underestimate overall flow reduction. However, there is likely to have been a lag period between rainfall change and subsequent ecological impacts of flow reduction, therefore we assume that the 1980s period reflects ‘low’ impacts of flow reduction, while the 2000s period reflects ‘high’ impacts of flow reduction. Importantly, further significant shifts have been observed in streamflow since the 1980s (Figure 2; Petrone et al., 2010).
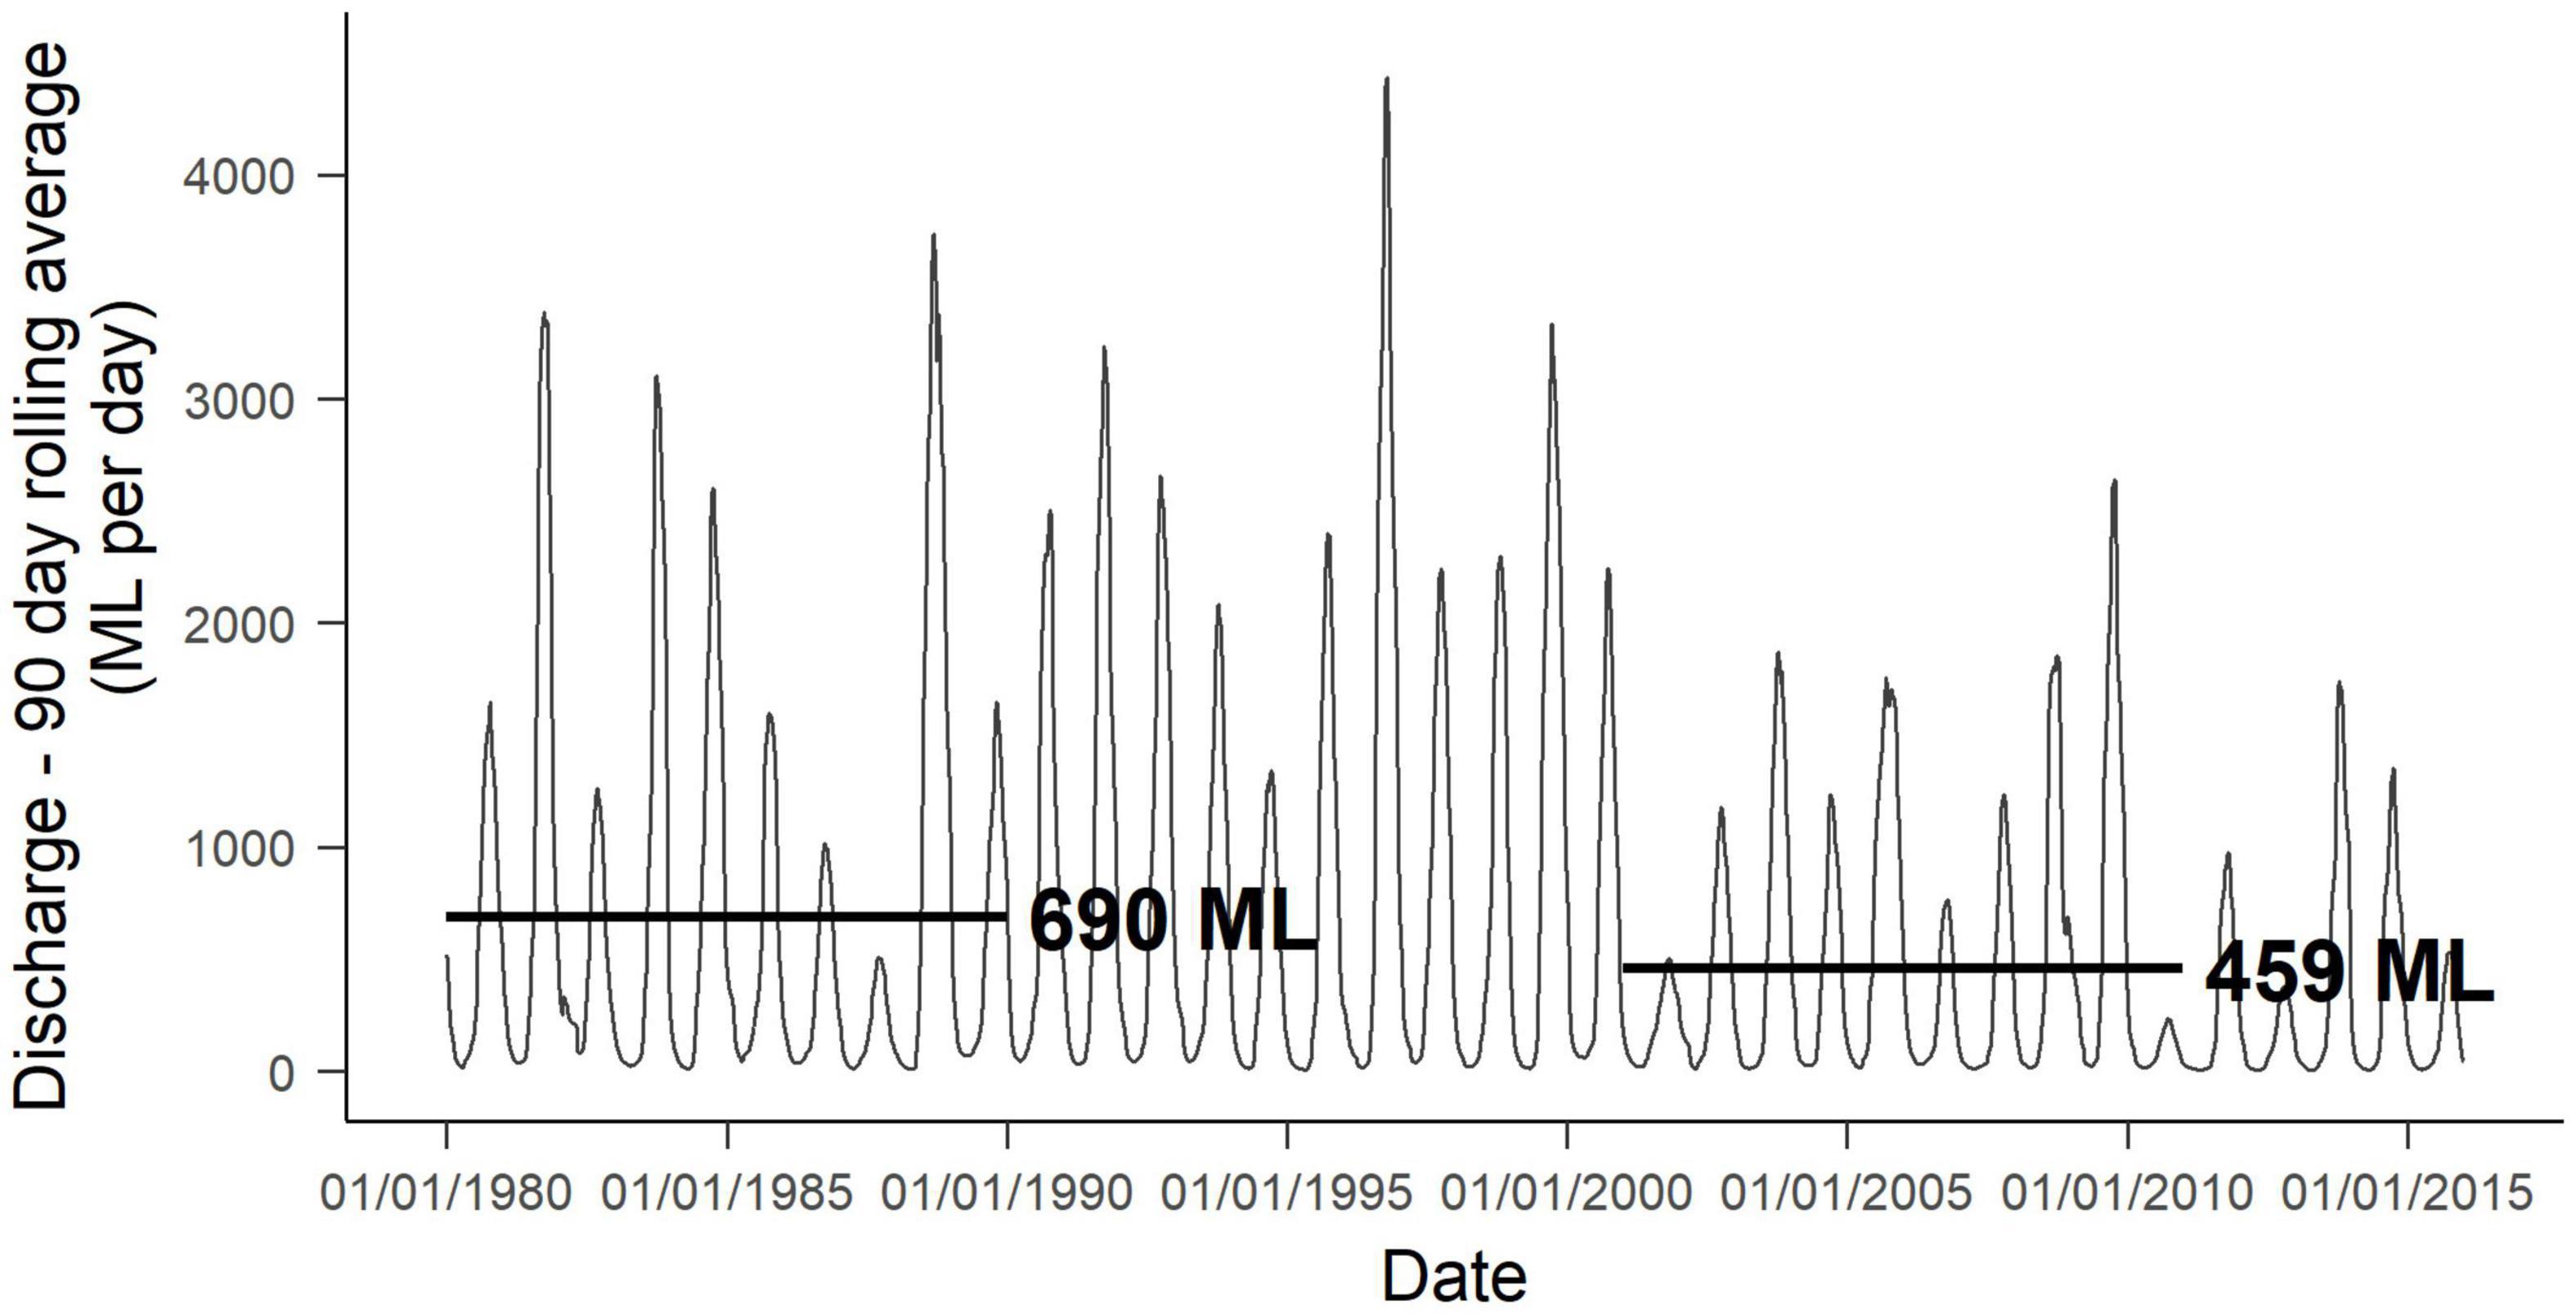
Figure 2. Ninety day rolling mean daily discharge at Barker Road Gauge Station from 1980 to 2016. Black lines indicate mean daily discharge for the two, 10-year periods, 1980 to 1989 and 2001 to 2010 (Department of Water and Environmental Regulation, 2016).
To measure the change in the flooding regime between these two periods, linear models were constructed modeling the maximum daily stage height above baseflow at the four gauge stations, as a function of elevation (m asl) for each day of the two 10-year periods (see Supplementary Material 1 for detailed methods). Then, taking the lowest absolute elevation of each vegetation sampling transect (i.e., the dry river channel or summer water level as baseflow) the estimated maximum stage height was interpolated (or extrapolated) at each transect elevation to generate a time-series for each transect site (Supplementary Figure S1.2).
These time-series were used to estimate the frequency and duration of inundation events experienced by each plant based on its elevation to the nearest 0.1 m from 0.5 m above baseflow. Frequency (F) describes the estimated frequency of inundation presented as a value between 0 and 1: where 0 indicates that the individual plant was not inundated during the 10 years period; and 1 indicates that the water level equaled or exceeded the elevation at least once a year for each year of the 10 years period. Duration (D) indicates the mean number of days a plant is estimated to have been inundated per year over the 10-year period, calculated as the mean number of days per calendar year that the water level was estimated to equal or exceed the elevation of an individual plant. The differences in frequency and duration between the historical and recent rainfall periods were calculated, and the resultant differences, ΔF (change in frequency) and ΔD (change in duration), were retained alongside recent frequency and recent duration, respectively, as predictors in statistical models.
To control for variation in surrounding land use and microclimate on seedling establishment (Davis et al., 2019), we used the LiDAR vegetation point clouds to quantify habitat structure using LAStools (Isenburg, 2017) and ArcGIS 10.3.1. The forest structure was described at two scales, the landscape scale was described by an area encompassing a transect and a 100 m buffer, and the microclimate of individual plants was approximated using a 2.5 m buffer around the point location of each tree or shrub (Figure 1B). Metrics describing forest structure were calculated from ground normalized point clouds and a 1 × 1 m resolution canopy surface model (CSM) describing the maximum canopy height in each pixel (see Supplementary Material 1 for detailed methods). At the transect scale, we obtained the following metrics for each transect and its surrounding 100 m buffer: the maximum point height, and the laser penetration rates through six vertical height strata: the penetration rate to 24 m; penetration through 24 to 16 m; 16 to 8 m; 8 to 3 m; 3 to 0.5 m and penetration to ground level (≤0.5 m) from the point clouds. A further four metrics were obtained from the CSM: the range, mean, coefficient of variation (CV) and variance (var) in maximum canopy height across each transect and buffer zone. At the scale of each individual, we obtained the laser penetration rates through the six vertical height strata, and the mean and the maximum height from the CSM around each tree.
To manage collinearities and reduce the number of predictors, a principal component analyses (PCA) was run for each of the transect and individual variable sets in the ‘vegan’ package (Version 2.4-2; Oksanen et al., 2017). The resultant PC1 and PC2 axes, T_PC1 and T_PC2 (accounting for 73 and 16% of the variation, respectively) at the transect level, and I_PC1 and I_PC2 (accounting for 52 and 18% of the variation, respectively) at the individual tree level, were incorporated as covariates in the following analyses (see Supplementary Material 1 for detailed methods).
We selected 17 species of trees and woody shrubs that were sufficiently abundant (>50 individuals) to investigate the effects of rainfall and shifts in hydrological regime on recruitment. Of the 17 species, six were classed as obligate riparian species, four as facultative riparian species and seven were classed as upland species (Table 1 and Figure 3). As information on the flood ecology of many of these species is limited to just the original taxonomic descriptions in several cases, classification of life history classes was necessarily based on limited published information supplemented by field observations of the authors, adapting definitions by Rood et al. (2010).
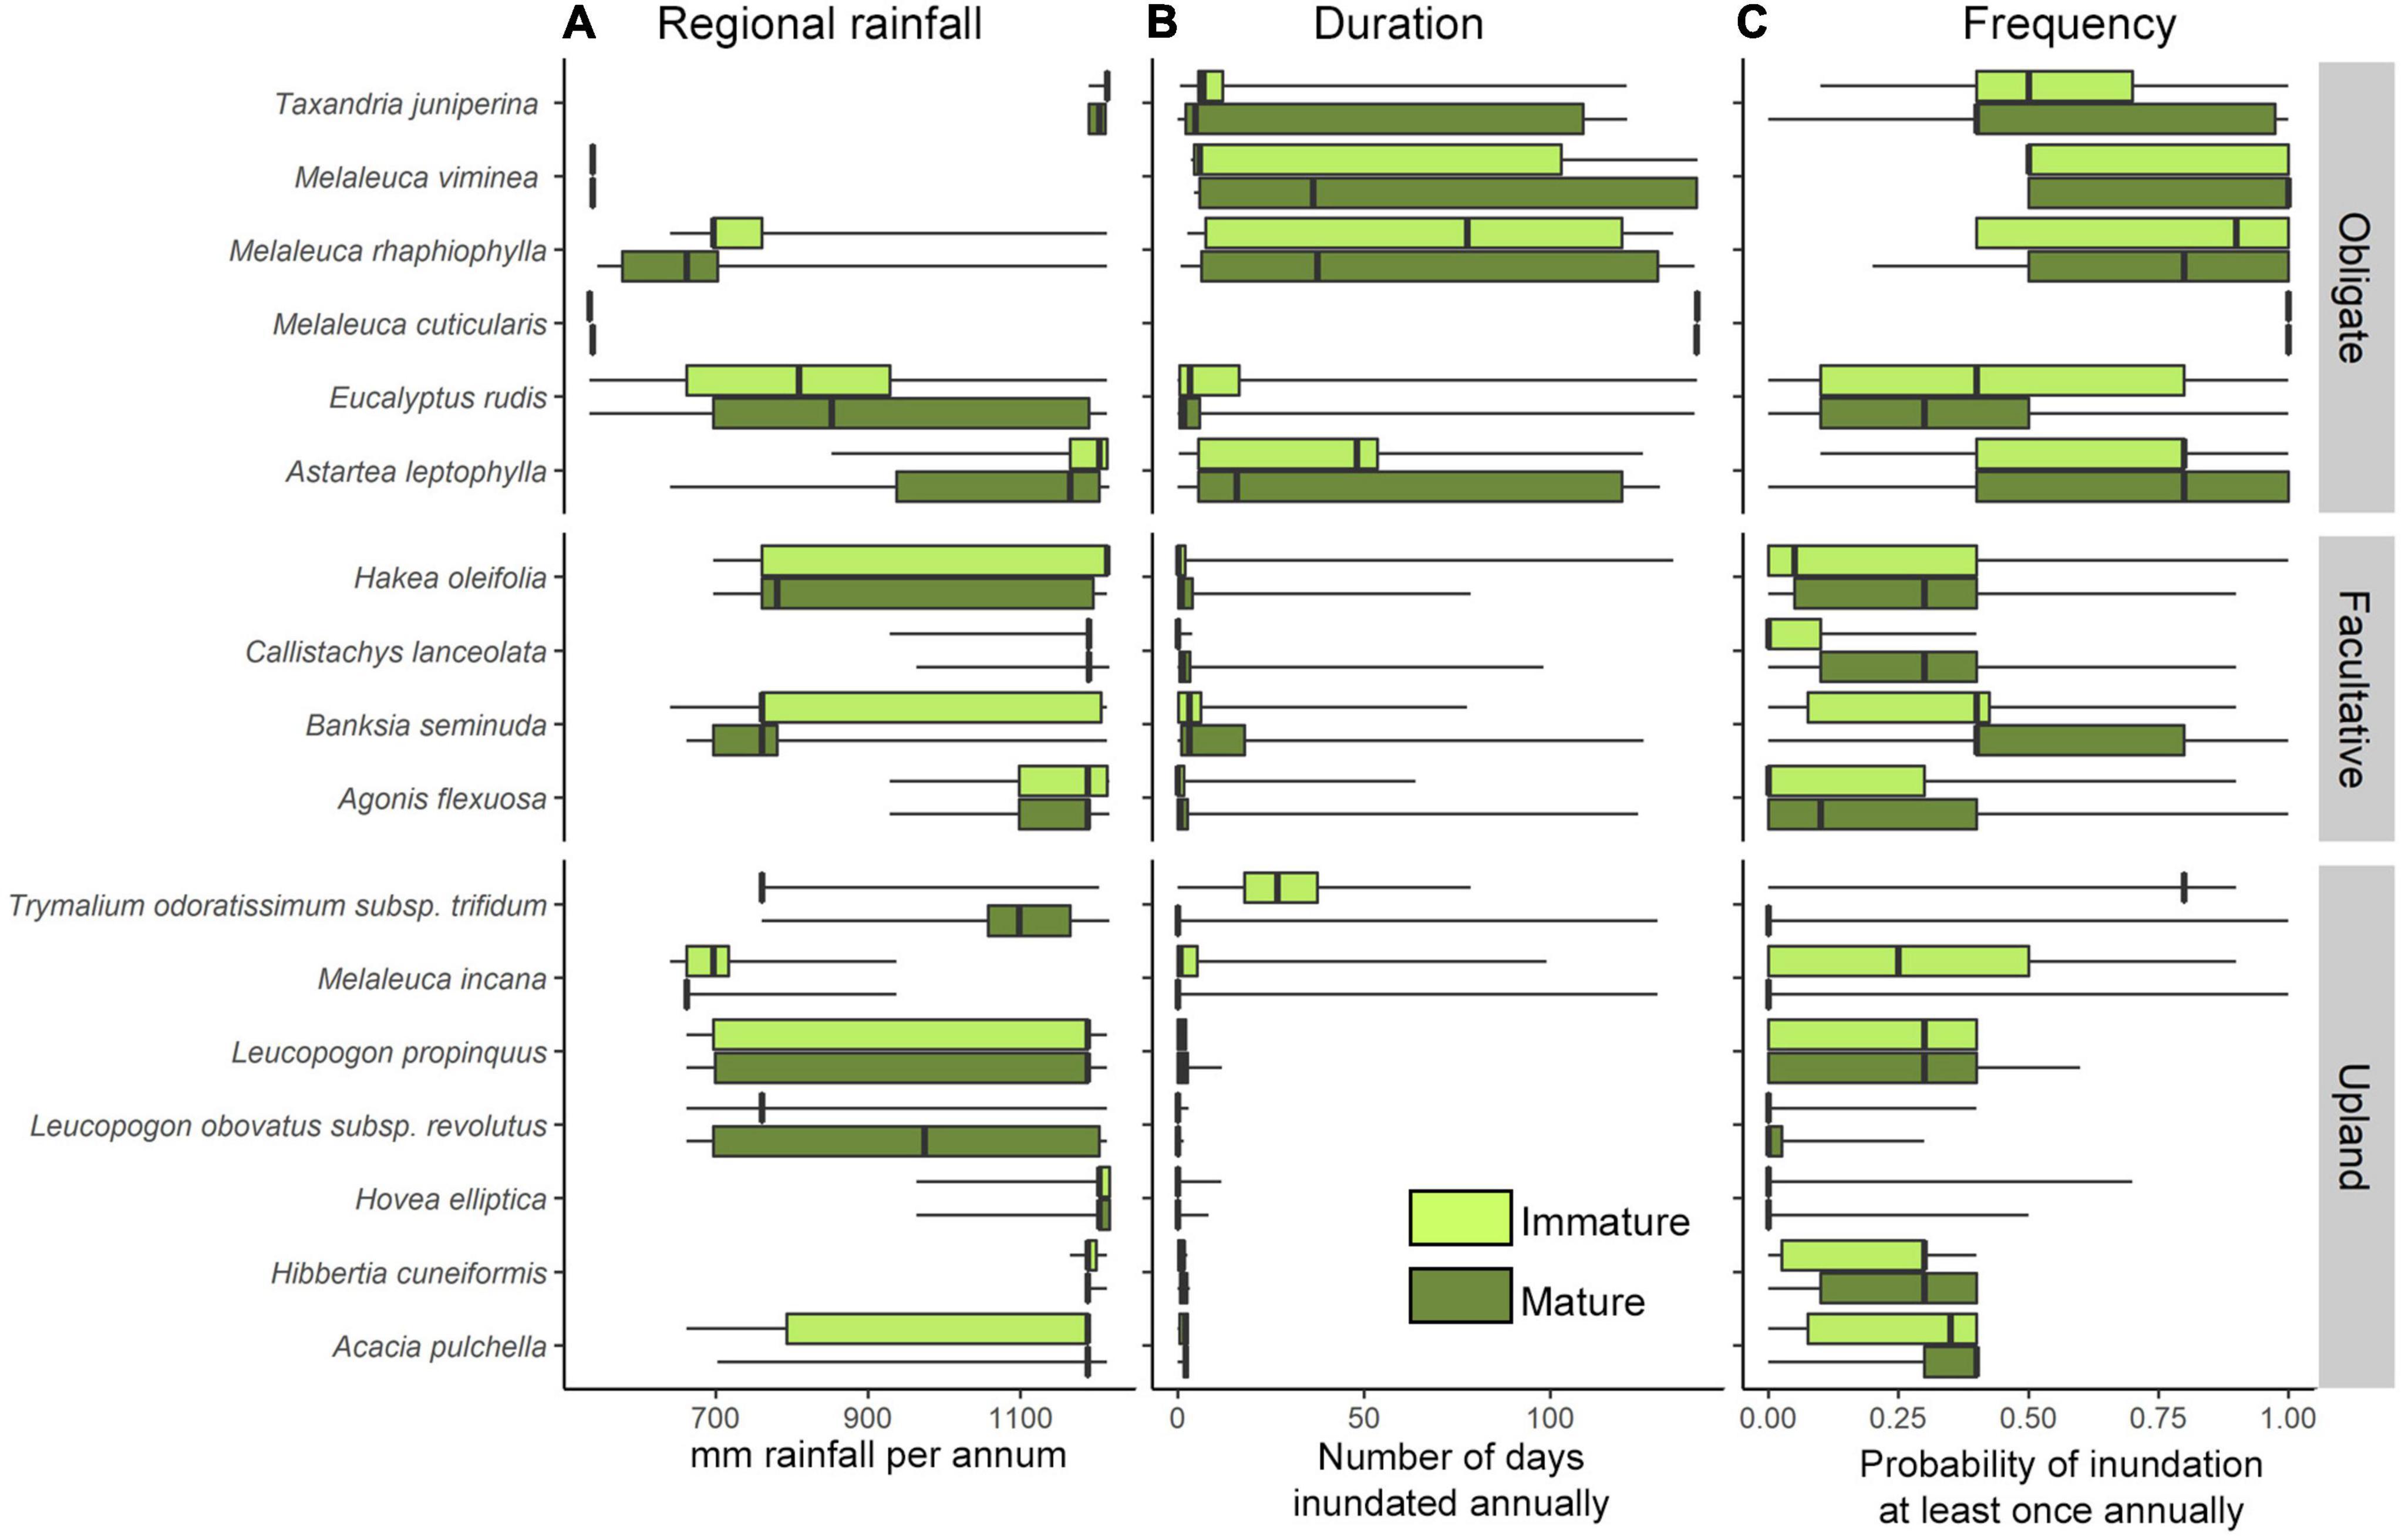
Figure 3. Range of hydrological conditions estimated for mature and immature individuals inhabiting the riparian zone of the Warren River Catchment. Estimated hydrological parameters are (A) mean annual rainfall (mm), and river flow metrics flood (B) duration, and (C) frequency estimated as the recent conditions (from 2001 to 2010). The limits of boxes mark the lower and upper quartiles (25%, 75%) centered around the median (bold center line) of the species distribution. Whiskers indicate the min and max (range).
A generalized linear mixed model (GLMM) was fitted for each species using a binomial distribution and a logit link (Bolker et al., 2009) in the ‘lme4’ package (Version, 1.1-23; Bates et al., 2015) in R version 4.0.2 (R Core Team, 2020). The response variable indicates the probability (the ‘log odds’) that a given plant is immature (coded as ‘1’) rather than mature (coded as ‘0’), as predicted by the set of modeled environmental covariates described below. For clarity of graphical display, model predictions calculated using the predict.lme function in lme4 were back-transformed on to a ‘proportion’ scale, rather than log-odds ratios. Values approaching 1 indicate a largely immature population, with few adult individuals and many recruits. Conversely, values approaching 0 indicate a largely mature population, with few recruits, and a low probability of encountering an immature individual (Figure 4A).
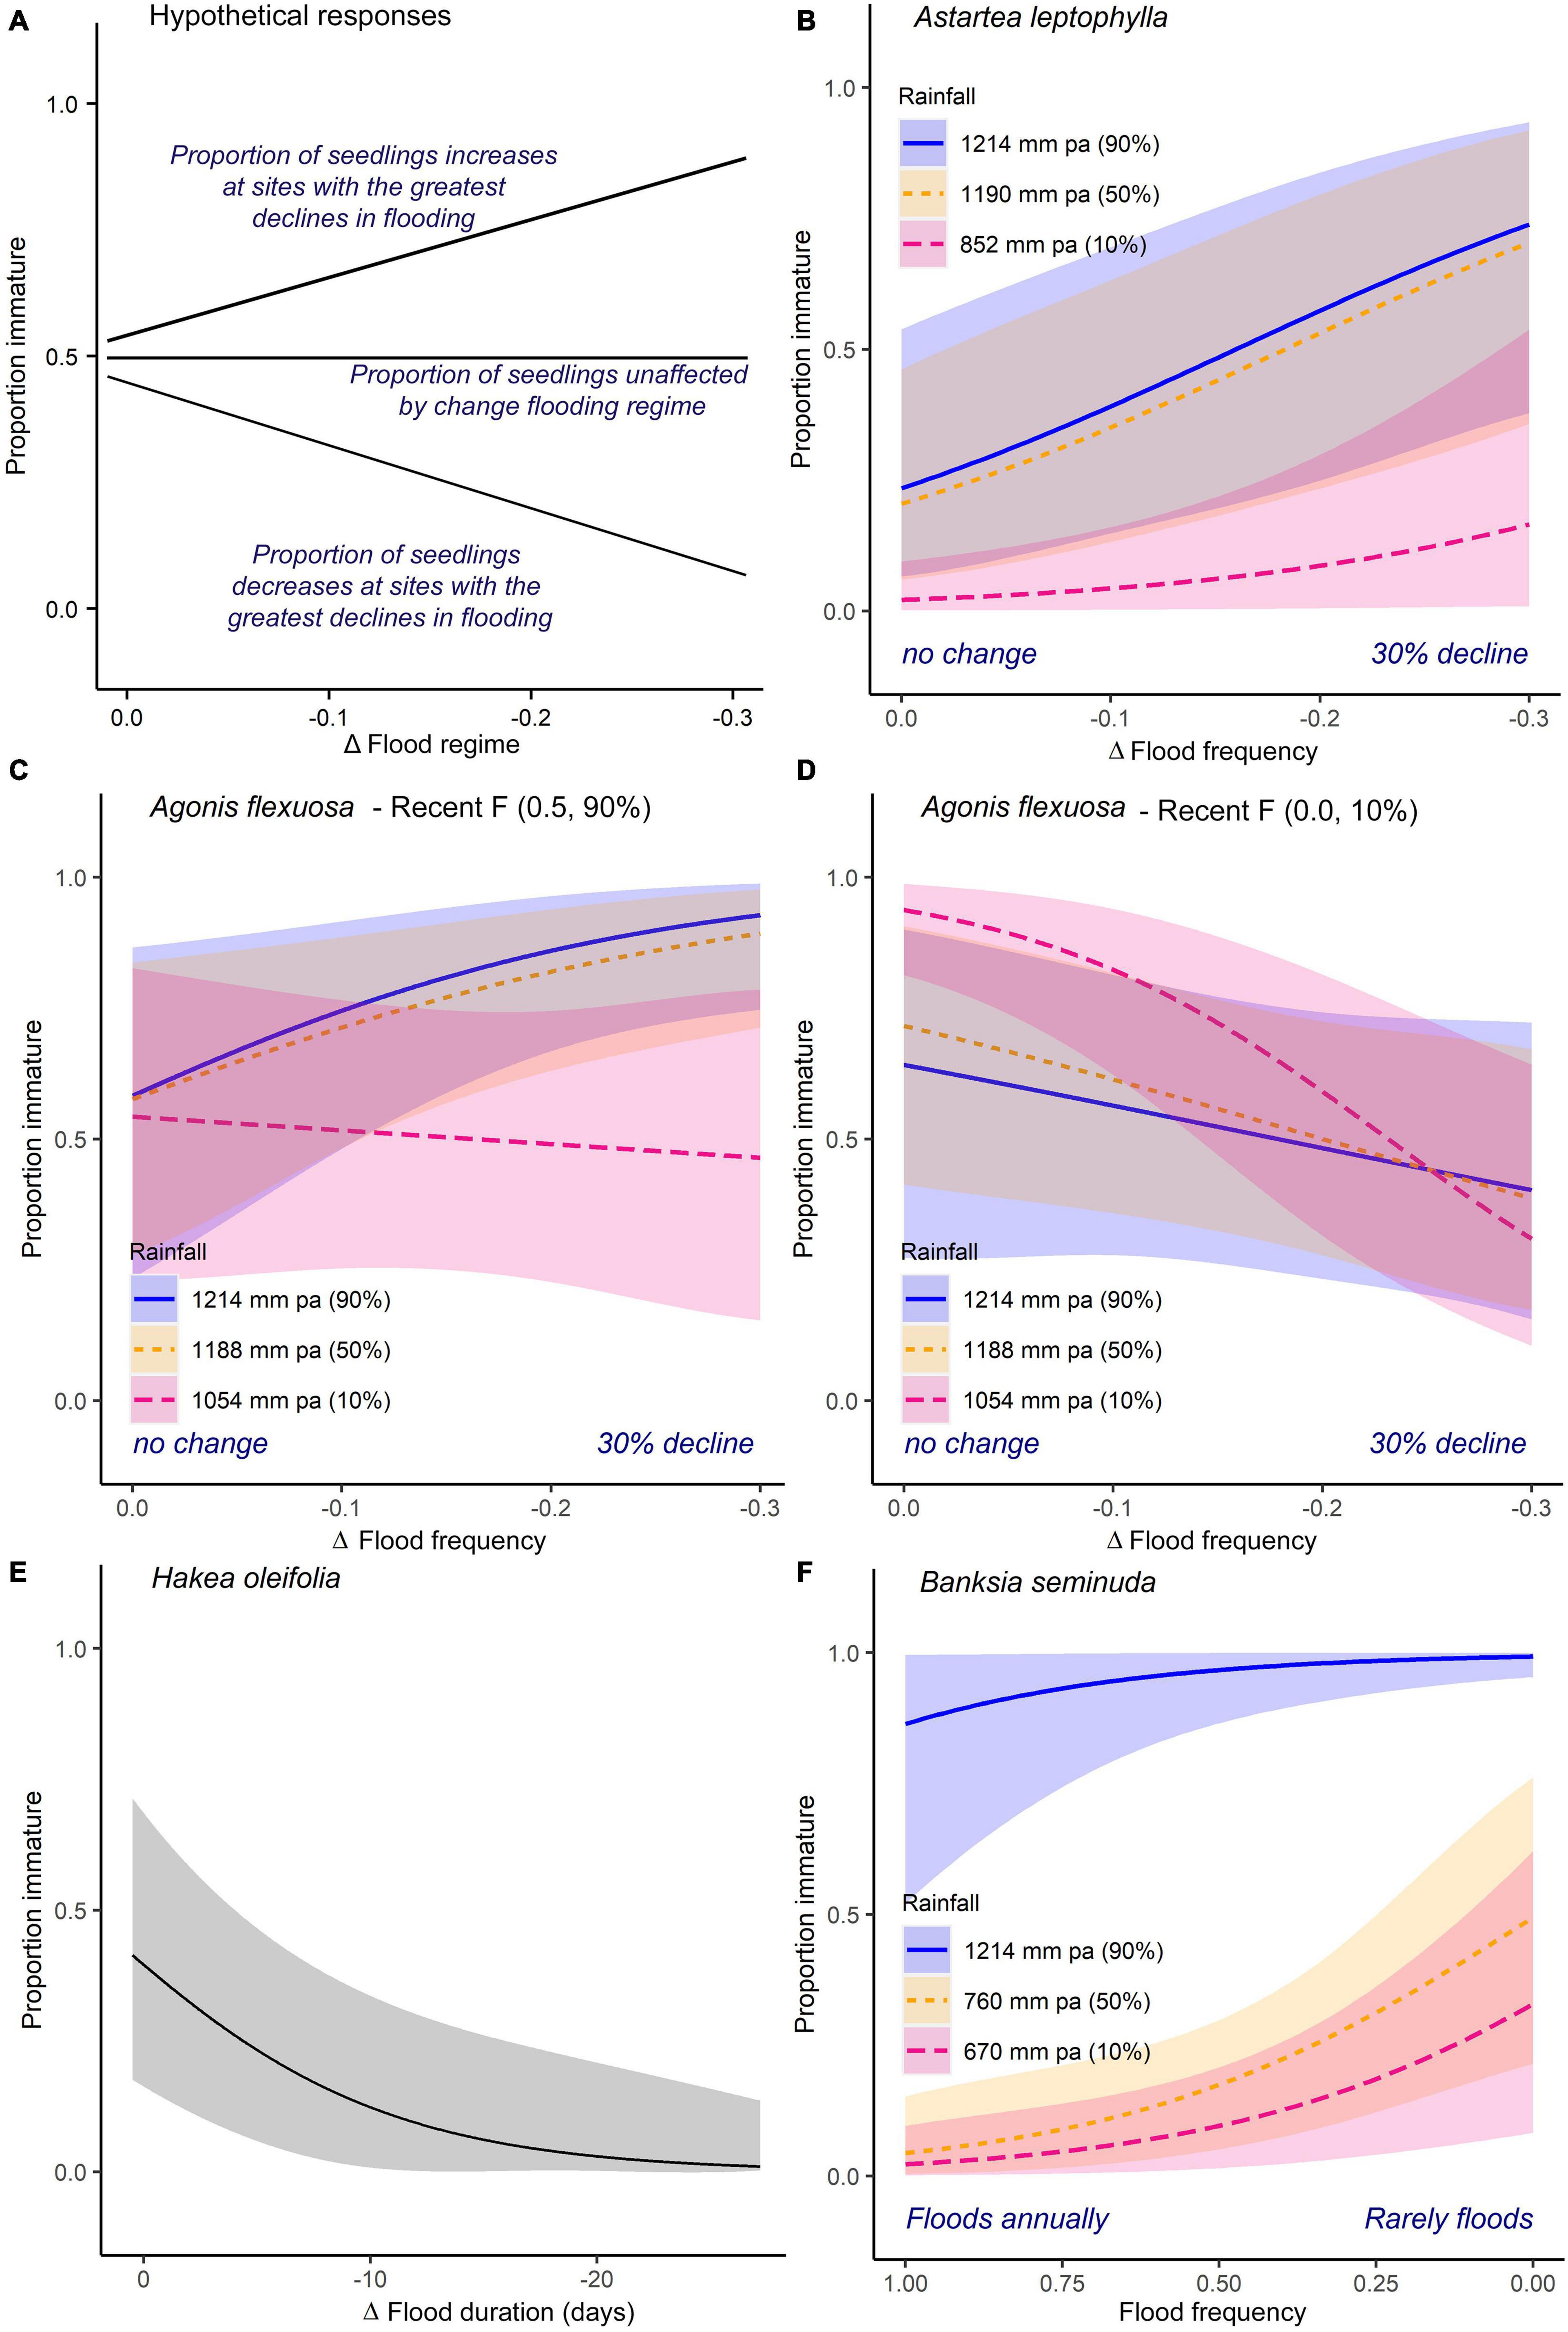
Figure 4. Variation in the relative frequency of immature to mature individuals of riparian tree and shrub species modeled as a function of their hydrological conditions. A positive slope indicates an increasing likelihood of immature individuals being found at sites experiencing a greater decline in flooding; conversely, a negative slope indicates a decreasing likelihood of immature individuals being found at sites experiencing a greater decline in flooding. Hydrological parameters examined include mean annual rainfall (mm pa, percentiles), recent flood frequency (for the period 2001 to 2010), and the change in flood frequency (between two the ten-year periods 1980 to 1989 and 2001 to 2010). Flood frequency is presented as the probability that individuals are likely to be inundated at least once in any one calendar year, where 1 indicates annual flooding and 0 indicates individuals were never flooded. The fitted lines (±95% confidence intervals) represent the 10th, 50th, and the 90th percentiles of model predictions from binomial generalized linear mixed effects models (see methods for details). Note that percentiles for each predictor vary between species because each species is distributed over a distinct rainfall or hydrological range. (A) Presents hypothetical responses of a plant species to declining flooding regimes. Models are presented for (B) the riparian shrub Astartea leptophylla; the canopy tree Agonis flexuosa under (C) the 90th percentile and (D) the 10th percentile of the recent flood frequency; (E) the facultative riparian trees, Hakea oleifolia and (F) Banksia seminuda.
The variables describing transect level (T_PC1 and T_PC2) and individual level (I_PC1 and I_PC2) variation in forest structure were included as fixed covariates to control for variation in land use, and microclimatic conditions independent of the hydrological parameters. To account for non-independence of individuals sampled within a transect, a random intercept was included for transect identity.
Hydrological conditions were defined using combinations of five fixed predictors F, ΔF, D, ΔD, and historic rainfall, and their interactions (Supplementary Material 2). Rainfall was included as historic rainfall only, rather than a measure of change in rainfall, because the two variables were highly correlated, and historic rainfall is more easily interpreted (Supplementary Material 1). Moreover, F and D were also highly correlated (Pearson’s r = 0.78, p < 0.05), indicating individuals that were regularly inundated were also inundated for longer durations annually. Rather than discarding one set of the collinear parameters, a two-phase model selection approach was used to identify the parameter set which best fitted each species.
Initially, global models were constructed to test the effects of estimated flood duration (D, ΔD, rainfall inclusive of all two- and three-way interactions) and estimated flood frequency (F, ΔF, rainfall inclusive of all two- and three-way interactions) separately. The global models were simplified using model selection procedures comparing Akaike Information Criterion for small sample sizes (AICc) in the ‘MuMIn’ package (Version 1.15.6; Barton, 2016). For each parameter set, the most parsimonious model within 2 AIC units of the top model was selected as the ‘best fit’ model (Arnold, 2010). Subsequently, the AIC of the best flood frequency model was compared to the best model fitted for flood duration, and the final model was taken as the model with the lowest AIC out of either model set. A complete list of candidate models and resultant AIC values are presented in Supplementary Material 2.
Prior to analysis, all of the continuous predictors and covariates were centered and scaled by 2 standard deviations (Gelman, 2008). Models were assessed for over-dispersion, however no adjustment was necessary. Model fit was assessed using the Nakagawa and Schielzeth (2013) R2 approach.
Reliable models were obtained for three of the six obligate riparian species examined, Astartea leptophylla, Eucalyptus rudis, and Melaleuca rhaphiophylla (Table 2A). Of these, the relative frequency of immature to mature individuals only differed significantly along the examined hydrological gradients in A. leptophylla (Table 2A and Figure 4B). The relative frequency of immature A. leptophylla was greater within regions experiencing a greater decline in annual flood frequency (ΔF, Table 2A and Figure 4B), particularly in regions with medium to high rainfall. Populations at the low rainfall extent were less likely to be immature individuals (Figure 4B); no immature A. leptophylla were surveyed in regions drier than 850 mm pa, despite mature individuals ranging out to 640 mm pa (Figure 3). The relative frequency of immature M. rhaphiophylla differed with estimated duration of flooding, change in duration (ΔD) and their interaction, but with a total of 13 immature individuals of the 144 plants surveyed, the model was not statistically significant (Table 2A). The modeled co-variates did not explain variation in the relative frequency of immature to mature individuals in the common and wide-ranging E. rudis. Models failed to converge for the remaining three obligate riparian species, Melaleuca cuticularis, Melaleuca viminea, and Taxandria juniperina due to the narrow range of observed variation in responses to predictors (Supplementary Material 2).
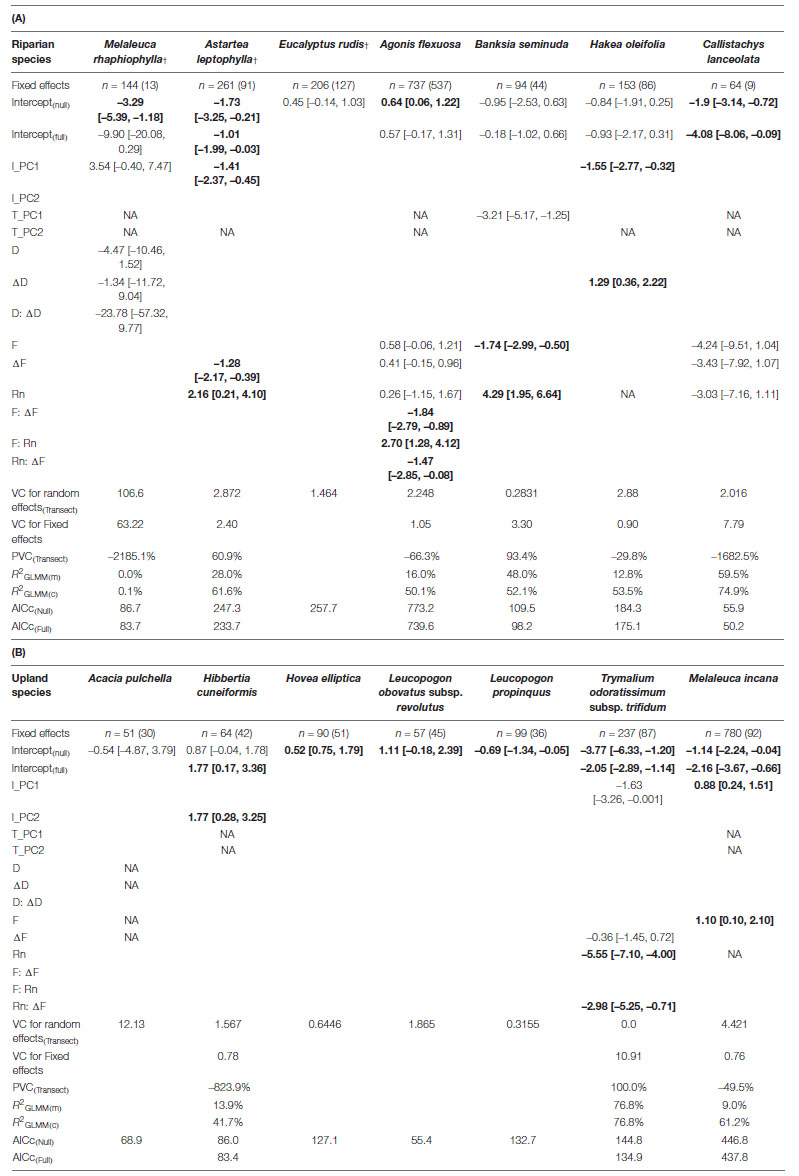
Table 2. Generalized linear mixed effects models testing the relative frequency of immature to mature individuals of (A) riparian and (B) upland species along the riparian zones of the Warren River as a function of mean annual rainfall (Rn), and either inundation duration (D) and change in duration (ΔD) or flood frequency (F) and change in flood frequency (ΔF). Variation in forest structure is described at transect and individual level as the covariates, T_PC1 and T_PC2, and I_PC1 and I_PC2, respectively. The proportional change in variance (PCV) for the random effect (transect identity) is calculated between the null and final models. The Akaike Information Criterion (AICc) is a relative measure of goodness of fit scaled to the number of parameters in the model. R2GLMM(m) is the marginal variance explained by all fixed factors and R2GLMM(c) is the conditional variance explained by both fixed and random factors (Nakagawa and Schielzeth, 2013). NA indicates a term was not tested due to collinearities within the fixed predictor set. In species where the model fit was not better than the null model, results are shown for the null model only. Model coefficients highlighted in bold indicate significant predictors. Note, some models failed to converge due to insufficient variation within the tested environmental variables or age classes, and are therefore not presented for Melaleuca cuticularis, M. viminea, and Taxandria juniperina. †denotes an obligate riparian species. A complete list of tested models is provided in Supplementary Material 2.
The four facultative riparian species, Banksia seminuda, Agonis flexuosa, Hakea oleifolia and to a lesser extent Callistachys lanceolata, revealed relationships with differing aspects of the estimated flow regime and the rainfall gradient (Table 2A). The relative frequency of immature B. seminuda was higher under high rainfall conditions, and immature individuals were more likely to be found in sites with low flood frequency across its entire range (Table 2A and Figure 4F). While the relative frequency of immature Agonis flexuosa, including both new recruits and immature individuals suckering off nearby plants, was higher under high regional rainfall, there were also significant interaction effects between rainfall, recent flood frequency and its change, indicating that high rainfall alone is insufficient to predict the occurrence of immature individuals (Table 2A and Figures 4C,D). As observed for A. leptophylla, the relative frequency of immature A. flexuosa individuals under high rainfall increased in floodplain zones that were undergoing declines in flood frequency, but only where sites still experienced a high probability of flooding (Table 2A and Figure 4C). By contrast, sites experiencing declining flood frequency at the low rainfall extent of the geographic range, particularly where flood frequency had declined to less than 0.1 (i.e., flooded once in the 10 years period), had low relative frequency of immature A. flexuosa (Table 2A and Figures 4C,D).
For Hakea oleifolia, the riparian zones that underwent the greatest declines in flood duration had the lowest relative frequency of immature H. oleifolia, regardless of rainfall zone or recent duration (Table 2A and Figure 4E). For Callistachys lanceolata, although the best fit models detected differences in the relative frequency of immature individuals with rainfall, flood frequency and change in flood frequency, there were very low frequencies of immature individuals (just 9 of 64 individuals) recorded in total (Table 2A), which severely limited the power of the analysis.
Recruitment varied significantly in relation to the examined hydrological or rainfall gradients in just two of the seven upland species, Trymalium odoratissimum subsp. trifidum and Melaleuca incana (Table 2B, Figure 5, and Supplementary Material 2). The relative frequency of immature individuals was higher in frequently flooded regions for both species (Figures 3, 5). In T. odoratissimum subsp. trifidum, this result was largely driven by the presence of 82 (of a total of 87) immature individuals recorded within a single, low rainfall transect, all of which were present at sites more frequently inundated than observed in the adult population (Figure 5A).
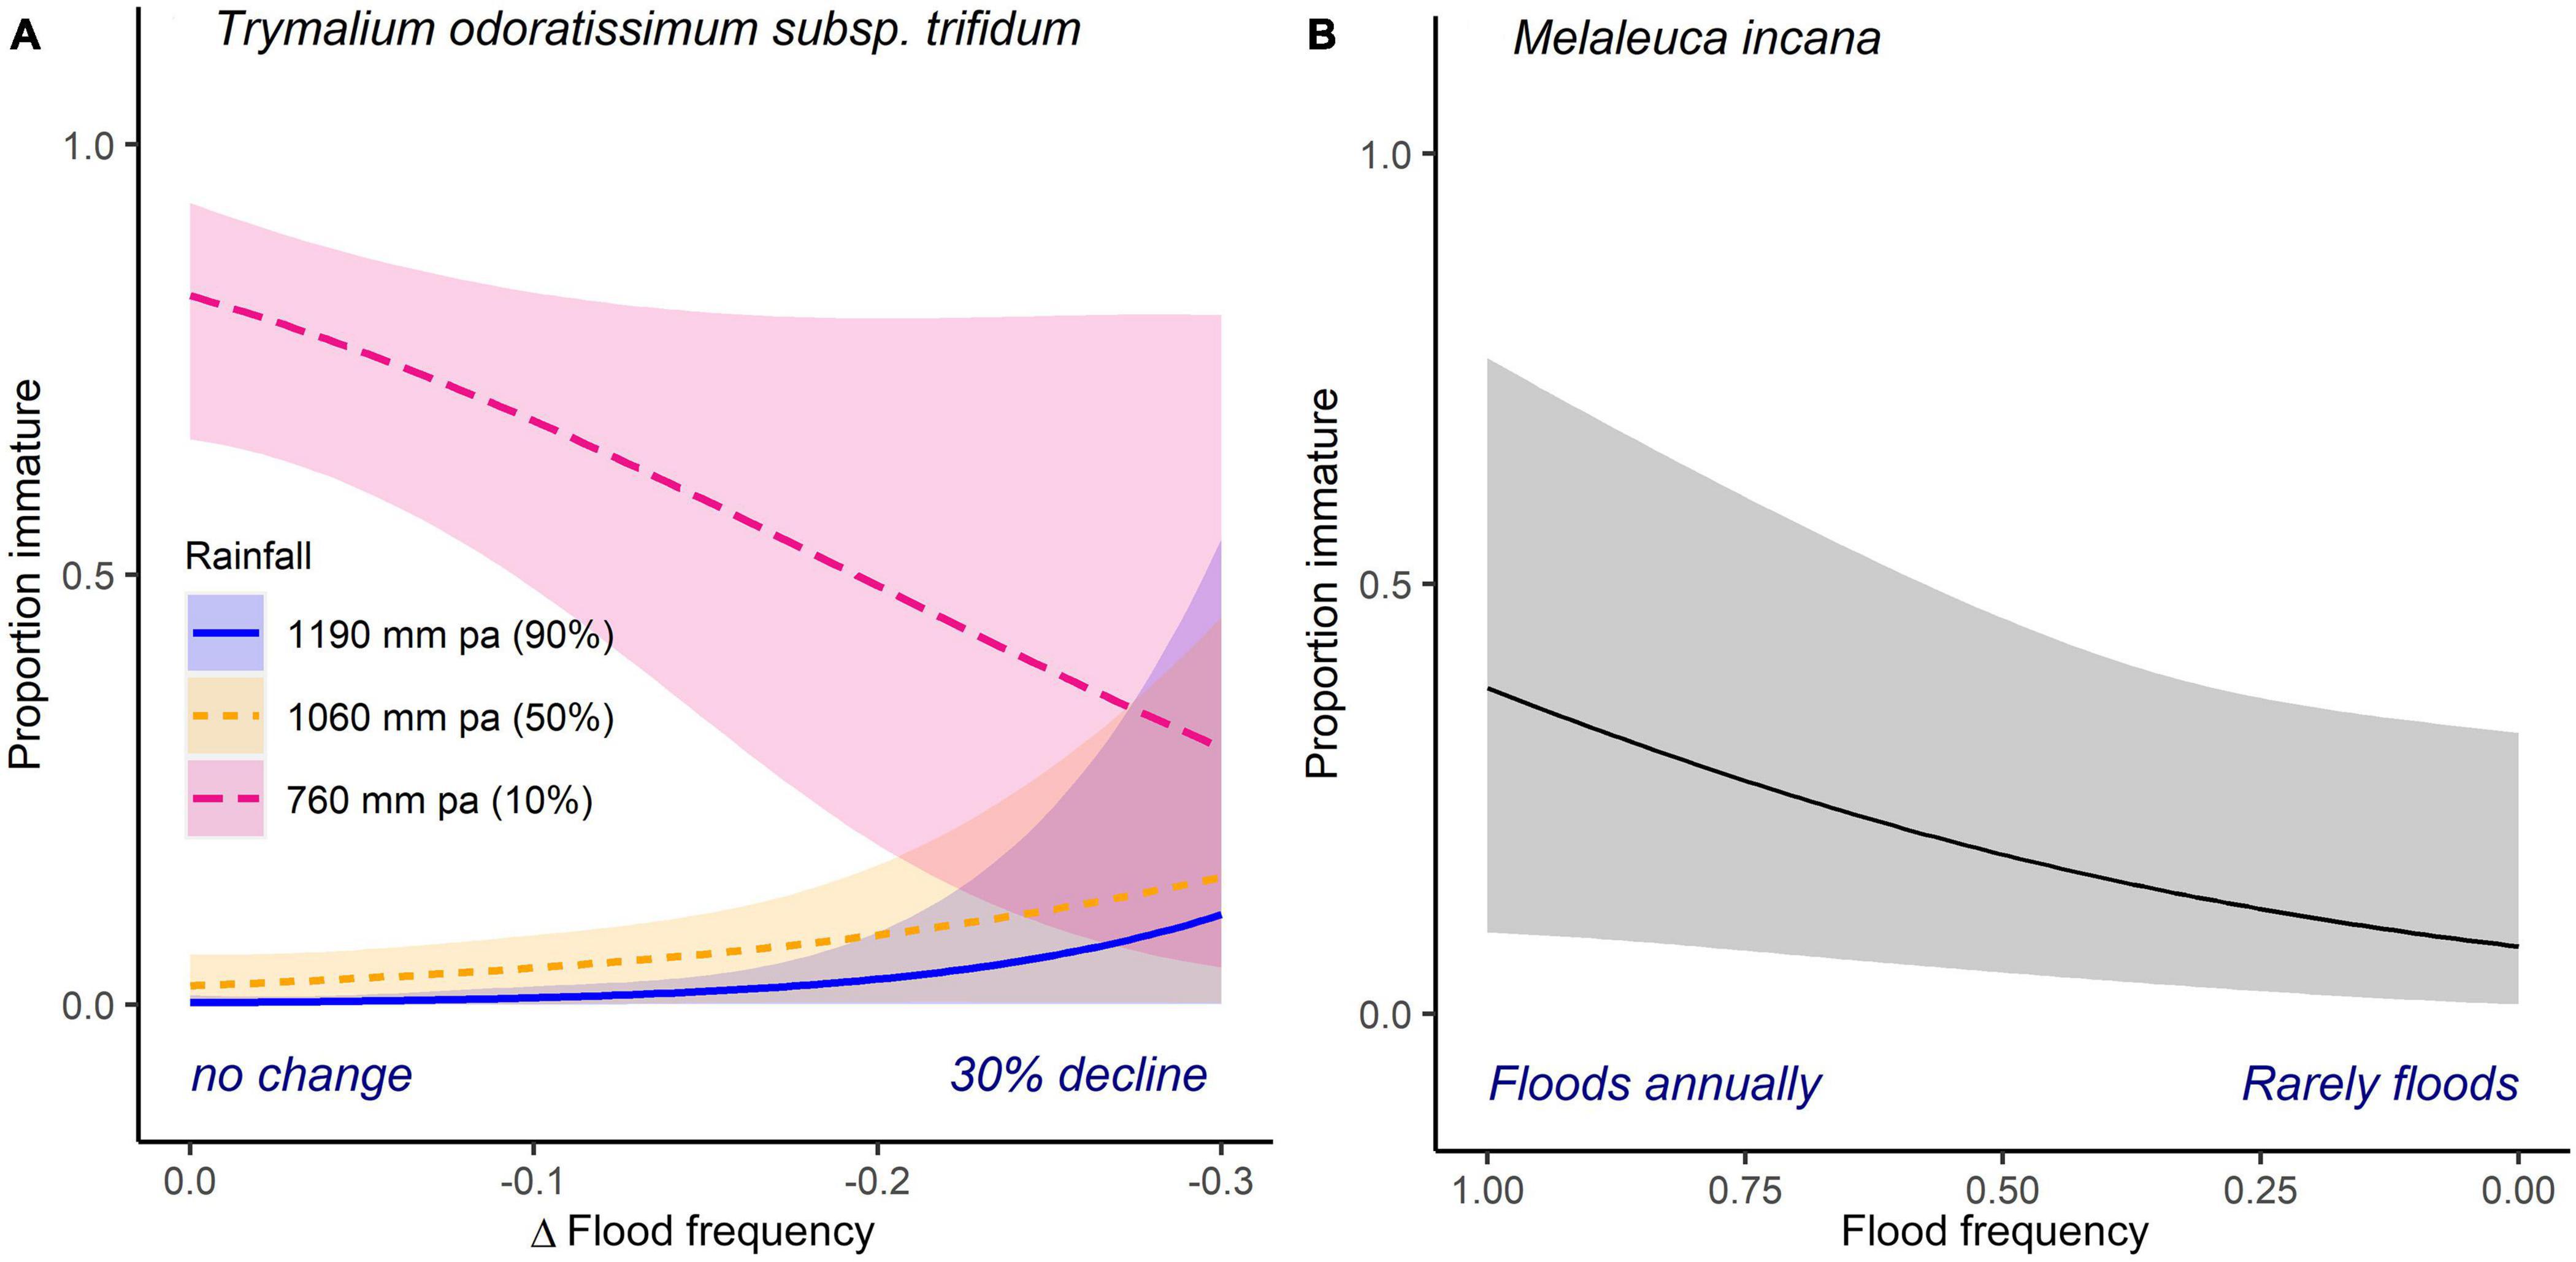
Figure 5. Variation in the relative frequency of immature to mature individuals of upland tree (A) Trymalium odoratissimum subsp. trifidum and shrub (B) Melaleuca incana modeled as a function their hydrological conditions. Flood frequency and rainfall are as described in Figure 3. The fitted line (±95% confidence intervals) represents model predictions from binomial generalized linear mixed effects models.
Recruitment failure at a species range margin can be indicative of a disconnect between the geographic and climatic ranges of a species and an advanced warning of an impending range shift. Utilizing one of the world’s most striking, geographically stratified rainfall gradients, that has undergone one of the greatest observed declines in rainfall, we tested the effect of streamflow decline on the riparian plant species in SWWA. We show that the relative frequencies of immature versus mature individuals of a number of riparian species differed significantly with the magnitude of divergence from the historical hydrological regime. At the drier, low rainfall, margins of species geographic ranges, declines in streamflow were a key driver of reduction in the frequency of immature individuals, indicative of recruitment failure and impending range contraction at the geographic range margins. At the higher rainfall margins of species geographic ranges, however, immature abundance increased in response to streamflow declines suggesting that riparian communities are expanding into habitats where historically they may have been excluded by high inundation regimes. In contrast to riparian species, the majority of the upland species examined showed little recruitment response to changing hydrological gradients or regional rainfall gradients. This consistency in recruitment could indicate that the river may be stabilizing recruitment processes across the current distributions of upland species despite regional rainfall declines. Here, we discuss these findings and their implications for ongoing management in a region projected to face further, significant rainfall declines.
The declines in streamflow observed over the past 30 years have resulted in a marked change in recruitment for a number of riparian species in response to declining frequency and duration of inundation. Declines in flood frequency interacted with rainfall for many species. The probability of immature occurrence was lower at the low rainfall extent of a species geographic range in the riparian species Agonis flexuosa, Astartea leptophylla, and B. seminuda. Although statistically insignificant, it is worth noting that in the sampled populations of a further species, riparian obligate M. rhaphiophylla and facultative riparian species, C. lanceolata, immature plants were observed at estimated relative frequencies of just 9 and 14% respectively. Cumulatively, the results presented here demonstrate lower occurrences of immature individuals at the drier extent of these species geographic ranges, which could precede a contraction in range or selection for a shift in their climatic optima.
The major assumption in examining distributions at a single time point to deduce range mismatch between immature and mature populations, is that differences are indicative of a shift in environmental conditions away from climatic optima rather than the natural divergence between the recruitment niche and the mature niche (Grubb, 1977; Máliš et al., 2016). This phenomena is particularly apparent in riparian systems, where early establishment is highly dependent on surface and shallow soil water until root systems gain access to permanent groundwater sources (Mahoney and Rood, 1998; Stella et al., 2010; Capon et al., 2016). Moreover, mature vegetation has the potential to significantly alter its own flow regime over its lifetime by redirecting currents and altering depositional processes (Corenblit et al., 2007; Osterkamp and Hupp, 2010). Here, by including estimates of recent frequency and duration of inundation as independent parameters from the observed changes over time, our results strongly suggest that it is the change in streamflow rather than (or in addition to) the absolute streamflow driving the range mismatch.
The relationship between occurrence of immatures and streamflow decline suggests species are failing to recruit under current conditions, be it through sexual reproduction or through vegetative reproduction as in the case of Agonis flexuosa. While in many riparian systems, a high variability in disturbance and flood regime are known to drive recruitment events, the high predictability and low interannual variance in the flood regime in these river systems has been suggested to drive a stable and continuous recruitment regime (Pettit and Froend, 2001b; Pettit et al., 2001). An examination of the reproductive phenology of the two obligate canopy trees, M. rhaphiophylla and E. rudis, indicates that phenological coupling has evolved to time seed fall with drying weather and the retreat of the river channel each summer (Pettit and Froend, 2001b). For most of the riparian species in this region, seed is stored in the canopy (Table 1) and release is triggered by environmental cues, namely, the desiccation of the seed capsule. In M. rhaphiophylla, this results in a continuous low level of seed fall throughout the year, which is similar in E. rudis except that E. rudis has a peak during the early summer coinciding with the summer decline in stream flow, exposing suitable germination sites (Pettit and Froend, 2001b). Astartea leptophylla is the only obligate riparian species which is not reported to store seed for any length of time, it flowers over summer and produces seed quickly (Rye, 2013). The reduction in winter rainfall, and subsequent stream flow in the SWWA has not been even; instead, the greatest change observed has been a reduction in rainfall in autumn and early winter which acts to extend the length of the summer period by delaying the onset of wet winter conditions (Silberstein et al., 2012; Hope et al., 2015). The observed decline in recruitment in the drier extent of species ranges could be due to drying conditions restricting seedling establishment, attributable to the lower rainfall itself, or to the greater intermittency of surface waters at the lower rainfall sites (Stromberg et al., 2005; Stella and Battles, 2010; Stella et al., 2010). In this case, the changing hydrological conditions could be acting differently for different species. For spring seeding species, a longer summer season could reduce survival in the first few summers before the roots have access to the water table, whereas for summer and autumn seeding species there may be a lack of suitable recruitment sites with an extension to the summer dry season. As coarse estimates of hydrology are used here, further investigation is required to fully understand the demography and recruitment requirements of these species, particularly for A. leptophylla where seed fall occurs during summer and autumn and does not seem to be triggered by environmental cues. The assumption here is that the change in environment is acting on seedling establishment, but equally a reduction in seed production or viability could also be driving the decline. Longer periods without surface waters could reduce seed production from stressed mature plants (Jensen et al., 2008), or lower reproductive success could also be attributed to poor pollination success from fragmentation, particularly in the upper catchment (Hopley and Byrne, 2018), changes to biotic interactions, or a number of these factors acting synergistically.
In contrast to the reductions observed in immature abundance under lower rainfall conditions, declining flood frequencies under higher rainfall conditions increased the relative frequency of immature to mature individuals in the examined riparian species. Previous examination of size-class distributions on the neighboring Blackwood River found no differences in the distributions of E. rudis or M. rhaphiophylla seedlings and mature trees in relation to elevation across the floodplain, and determined that these low-power river systems do not experience the destructive forces which can restrict succession on more powerful rivers (Pettit and Froend, 2001b) and can lead to a naturally high abundance of new recruits and saplings on the high flood frequency sites. Increases in riparian seedling abundances, as well as vegetation density and cover, are known to result from flow reduction due to damming or water extraction (Shafroth et al., 2002; Gordon and Meentemeyer, 2006; Kingsford, 2016), particularly within facultative riparian species (Rood et al., 2010). The initial increase in vegetation cover post-damming, is principally attributed to increases in germination sites with declining flood waters, i.e., moist, damp sediments, as well as a reduction in the erosive flows seasonally clearing establishing seedlings (Mahoney and Rood, 1998; Taylor et al., 1999; Johnson, 2000; Polzin and Rood, 2006). The increases in the frequency of immature individuals observed in the areas of greatest deficit, is a strong indicator that the riparian corridor may be beginning to narrow; a repeat survey of selected sites in the future would confirm this.
In five of the seven upland species examined, the distribution of immature and mature individuals did not differ with regard to metrics describing aspects of streamflow or regional rainfall. Notwithstanding the hydrological parameters, rainfall is considered one of, if not the most important, abiotic determinants of species distribution in the region (Hopper and Gioia, 2004). Consistency in the relative frequency of immature to mature individuals across the rainfall gradient indicates stable range margins within the riparian zones. In species where the surveyed area included the eastern-most limits of their distribution, such as the upland shrubs L. propinquus, L. obovatus subsp. revolutus, and H. elliptica (Western Australian Herbarium), these results may be indicative of the river buffering species from regional rainfall declines observed to date (Reside et al., 2014; McLaughlin et al., 2017). The ability of the riparian corridors to extend the range of a species outside normal climatic conditions has been demonstrated in SWWA. Trymalium odoratissimum subsp. trifidum (formerly known as T. floribundum; Hancock et al., 1996) is considered an upland species in the Warren Region, in lower rainfall forests to the north of the study region, however the northern subspecies T. odoratissimum subsp. odoratissimum is restricted to gullies (Hancock et al., 1996). Further examination of the relative frequencies of immature to mature across the non-riparian extent of their ranges is critical to understanding range change in the upland species.
Over the past 30 years, the riparian vegetation of the Warren Catchment has been subjected to reductions in mean estimated duration of inundation of up to 27 days per year and sites are becoming inundated over fewer winters. The results presented here demonstrate that these declines are affecting recruitment in the common riparian species. At the drier extent of species ranges, declines have resulted in a lower relative frequency of immature to mature individuals, potentially presenting early warnings of a longitudinal range contraction. Meanwhile at the higher rainfall extent of the catchment, increasing frequencies of immature plants on riparian floodplains experiencing declines in inundation frequency indicate the expansion of the riparian vegetation into areas that were previously uninhabitable, and potentially narrowing of the river channel. Downscaled climate models for the SWWA project declines of between 5 and 75 fewer flow-days per year by 2030, on top of the deficits already observed (Barron et al., 2012). Given the apparent shifts in climatic optima already observed here, further flow reductions are likely to significantly impact the riparian vegetation. How these impacts will manifest remains to be seen, but the results presented indicate that a geographical contraction of range of the riparian species is likely. The majority of the riparian species (both facultative and obligate) did not show an upper rainfall limit to their distribution, i.e., all species were observed within the lower reaches of the river, so there is almost no potential for compensatory range expansion.
Despite these observations, we do not anticipate a complete collapse of the riparian flora. First, the projections for summer rainfall are highly uncertain (Hope et al., 2015), but have the potential to drive selection away from the stable continuous recruitment pattern that currently exists to one which may be more episodic and dependent on environmental extremes. Sporadic summer storms could ease drought conditions for the first, critical summer of seeding establishment. As a number of these species exhibit a serotiny with varying degrees of environmental plasticity in seed release, a boom-bust style recruitment pattern could become more important in the future. For example, wide spread flooding resulting from a cyclonic depression in 1978 has been attributed with a mass recruitment event of E. rudis and M. rhaphiophylla (Pettit et al., 2001; Bureau of Meteorology, 2021). Second, even with significant reductions in river flows, the river is unlikely to cease to flow completely (Barron et al., 2012) thus habitat will continue to be available for riparian species, where soils are too saturated for upland species to survive, albeit over a smaller geographic range. Instead, we might expect to see a compositional shift to a greater proportion of mesic, facultative and upland species as further reductions in the inhibitory high flow events are observed (Froend and Sommer, 2010; Garssen et al., 2014). The results presented here suggest that in this river system, and likely others where rainfall is low in the upper catchment, riparian zones may have a limited capacity to buffer species from climate change induced range shifts. Rather, those species already dependent on the riparian zones as refugia in arid landscapes are actually at greater risk. A complementary study in a system with a contrasting rainfall gradient in which the majority of rain falls in the headwaters would provide a valuable insight into the ability of riparian zones to buffer species range movements under differing precipitation regimes. Understanding which features of the landscape have the potential to provide refugia in a changing climate is critical to advance our ability to predict range shifts and identify important sites for protection.
The raw data supporting the conclusions of this article will be made available by the authors, without undue reservation.
HW, JS, and RD conceived and designed the study, contributed to the preparation of the manuscript. HW collected the data. HW and RD analyzed the data. All the authors contributed to the article and approved the submitted version.
Funding for the LiDAR survey and project costs was provided by the Warren Catchments Council through the Australian Government’s Clean Energy Future – Biodiversity Fund. HW was supported by CSIRO, The Warren Catchments Council, and the Australian Government Research Training Program and the University of Western Australia.
The authors declare that the research was conducted in the absence of any commercial or financial relationships that could be construed as a potential conflict of interest.
Permission to access and survey sites was granted from numerous private landowners and the Western Australian Department of Biodiversity, Conservation and Attractions (DBCA). Access to disease risk areas was granted by DBCA under permit DON00243 held by HW. The collection of specimens by HW for identification was enabled under DBCA permits SW015930, SW016818, SW017712, CE004258, CE004742, and CE005178. AAM Geospatial generously provided the aerial LiDAR survey at cost, with in-kind support for LiDAR data processing. We thank the staff, past and present of the Warren Catchments Council for field support and their local knowledge. We acknowledge the inclusion of work presented HW’s Ph.D. thesis (White, 2018). We thank J. Coletti for invaluable discussions on river hydrology. L. Fontanini, J. Futter, J. Middleton, S. Robinson, A. Russel, D. Stevenson, S. Tomlinson, A. Watt, C. Wilson, and P. Yeeles volunteered their time to assist in the field. We also thank D. Ackerly, P. Vesk, J. Catford, and J. Lenoir for comments on an early draft of this manuscript.
The Supplementary Material for this article can be found online at: https://www.frontiersin.org/articles/10.3389/fevo.2021.605951/full#supplementary-material
Aitken, S. N., Yeaman, S., Holliday, J. A., Wang, T., and Curtis-McLane, S. (2008). Adaptation, migration or extirpation: climate change outcomes for tree populations. Evol. Appl. 1, 95–111. doi: 10.1111/j.1752-4571.2007.00013.x
Allen, C. D., Macalady, A. K., Chenchouni, H., Bachelet, D., McDowell, N., Vennetier, M., et al. (2010). A global overview of drought and heat-induced tree mortality reveals emerging climate change risks for forests. For. Ecol. Manage. 259, 660–684. doi: 10.1016/j.foreco.2009.09.001
Arnold, T. W. (2010). Uninformative parameters and model selection using Akaike’s Information Criterion. J. Wildl. Manage. 74, 1175–1178. doi: 10.2193/2009-367
Atlas of Living Australia (2021). Occurrence Download. Available online at: https://doi.org/10.26197/ala.f5a04899-30db-4f3b-91d4-da465a0037dd (accessed April 4, 2021).
Barlow, B. A., and Cowley, K. J. (1988). Contributions to a revision of Melaleuca (Myrtaceae):4-6. Aust. Syst. Bot. 1, 95–126. doi: 10.1071/sb9880095
Barron, O., Silberstein, R., Ali, R., Donohue, R., McFarlane, D. J., Davies, P. M., et al. (2012). Climate change effects on water-dependent ecosystems in south-western Australia. J. Hydrol. 475, 473–487. doi: 10.1016/j.jhydrol.2012.02.049
Bates, D., Mächler, M., Bolker, B. M., and Walker, S. C. (2015). Fitting linear mixed-effects models using lme4. J. Stat. Softw. 67, 1–48. doi: 10.18637/jss.v067.i01
Bell, D. M., Bradford, J. B., and Lauenroth, W. K. (2014). Early indicators of change: divergent climate envelopes between tree life stages imply range shifts in the western United States. Glob. Ecol. Biogeogr. 23, 168–180. doi: 10.1111/geb.12109
Bertrand, R., Lenoir, J., Piedallu, C., Riofrío-Dillon, G., de Ruffray, P., Vidal, C., et al. (2011). Changes in plant community composition lag behind climate warming in lowland forests. Nature 479, 517–520. doi: 10.1038/nature10548
Bolker, B. M., Brooks, M. E., Clark, C. J., Geange, S. W., Poulsen, J. R., Stevens, M. H. H., et al. (2009). Generalized linear mixed models: a practical guide for ecology and evolution. Trends Ecol. Evol. 24, 127–135. doi: 10.1016/j.tree.2008.10.008
Breshears, D. D., Huxman, T. E., Adams, H. D., Zou, C. B., and Davison, J. E. (2008). Vegetation synchronously leans upslope as climate warms. Proc. Natl. Acad. Sci. U.S.A. 105, 11591–11592. doi: 10.1073/pnas.0806579105
Brophy, J. J., Craven, L. A., and Doran, J. C. (2013). Melaleucas: Their Botany, Essential Oils and Uses. Canberra, ACT: Australian Centre for International Agricultural Research.
Brouwers, N. C., Mercer, J., Lyons, T., Poot, P., Veneklaas, E., and Hardy, G. (2013). Climate and landscape drivers of tree decline in a Mediterranean ecoregion. Ecol. Evol. 3, 67–79. doi: 10.1002/ece3.437
Bureau of Meteorology (2010). Climatological Gridded Data Information–Australian Maps. Available online at: http://www.bom.gov.au/climate/averages/climatology/gridded-data-info/gridded-climate-data.shtml (accessed March 12, 2010).
Bureau of Meteorology (2021). Severe Tropical Cyclone Alby. Available online at: http://www.bom.gov.au/cyclone/history/alby.shtml (accessed April 27, 2021).
Capon, S. J., James, C., and George, A. (2016). “Riverine trees and shrubs,” in Vegetation of Australian Riverine Landscapes: Biology, Ecology and Management, eds S. J. Capon, C. James, and M. Reid (Clayton South, VIC: CSIRO Publishing), 119–141.
Chen, I., Hill, J. K., Ohlemüller, R., Roy, D. B., and Thomas, C. D. (2011). Rapid range shifts of species of climate warming. Science 333, 1024–1026. doi: 10.1126/science.1206432
Corenblit, D., Tabacchi, E., Steiger, J., and Gurnell, A. M. (2007). Reciprocal interactions and adjustments between fluvial landforms and vegetation dynamics in river corridors: a review of complementary approaches. Earth Sci. Rev. 84, 56–86. doi: 10.1016/j.earscirev.2007.05.004
Davis, K. T., Dobrowski, S. Z., Holden, Z. A., Higuera, P. E., and Abatzoglou, J. T. (2019). Microclimatic buffering in forests of the future: the role of local water balance. Ecography 42, 1–11. doi: 10.1111/ecog.03836
Department of Water (2012). Warren–Donnelly Surface Water Allocation Plan Methods. Report No. 39. Perth, WA: Department of Water.
Department of Water and Environmental Regulation (2016). Monitoring and Data. Available online at: http://water.wa.gov.au/maps-and-data/monitoring (accessed November 7, 2016).
Dobrowski, S. Z. (2011). A climatic basis for microrefugia: the influence of terrain on climate. Glob. Chang. Biol. 17, 1022–1035. doi: 10.1111/j.1365-2486.2010.02263.x
DPIRD (2020). Native Vegetation Extent (DPIRD-005). Available online at: https://catalogue.data.wa.gov.au/dataset/native-vegetation-extent (accessed September 13, 2020).
Etchells, H., O’Donnell, A. J., McCaw, W. L., and Grierson, P. F. (2020). Fire severity impacts on tree mortality and post-fire recruitment in tall eucalypt forests of southwest Australia. For. Ecol. Manage. 459:117850. doi: 10.1016/j.foreco.2019.117850
Feeley, K. J., Silman, M. R., Bush, M. B., Farfan, W., Cabrera, K. G., Malhi, Y., et al. (2011). Upslope migration of Andean trees. J. Biogeogr. 38, 783–791. doi: 10.1111/j.1365-2699.2010.02444.x
Fei, S., Desprez, J. M., Potter, K. M., Jo, I., Knott, J. A., and Oswalt, C. M. (2017). Divergence of species responses to climate change. Sci. Adv. 3:e1603055. doi: 10.1126/sciadv.1603055
Flora of Australia (2021). Profile Collections. Available online at: https://profiles.ala.org.au/opus/foa (accessed April 27, 2021).
Froend, R., and Sommer, B. (2010). Phreatophytic vegetation response to climatic and abstraction-induced groundwater drawdown: examples of long-term spatial and temporal variability in community response. Ecol. Eng. 36, 1191–1200. doi: 10.1016/j.ecoleng.2009.11.029
Galiano, L., Martínez-Vilalta, J., and Lloret, F. (2010). Drought-induced multifactor decline of scots pine in the pyrenees and potential vegetation change by the expansion co-occurring oak species. Ecosystems 13, 978–991. doi: 10.1007/s10021-010-9368-8
Garssen, A. G., Verhoeven, J. T. A., and Soons, M. B. (2014). Effects of climate-induced increases in summer drought on riparian plant species: a meta-analysis. Freshw. Biol. 59, 1052–1063. doi: 10.1111/fwb.12328
Gelman, A. (2008). Scaling regression inputs by dividing by two standard deviations. Stat. Med. 27, 2865–2873. doi: 10.1002/sim
Geoscience Australia (2016). Geoscience Australia. Available online at: http://www.ga.gov.au/ (accessed May 23, 2016).
Gordon, E., and Meentemeyer, R. K. (2006). Effects of dam operation and land use on stream channel morphology and riparian vegetation. Geomorphology 82, 412–429. doi: 10.1016/j.geomorph.2006.06.001
Groom, P. K., and Lamont, B. B. (1996). Ecogeographical analysis of Hakea (Proteaceae) in south-western Australia, with special reference to leaf morphology and life form. Aust. J. Bot. 44, 527–542. doi: 10.1071/bt9960527
Grubb, P. J. (1977). The maintenance of species-richness in plant communities: the importance of the regeneration niche. Biol. Rev. 52, 107–145. doi: 10.1111/j.1469-185x.1977.tb01347.x
Hamer, J. J., Veneklaas, E. J., Poot, P., Mokany, K., and Renton, M. (2015). Shallow environmental gradients put inland species at risk: insights and implications from predicting future distributions of Eucalyptus species in south western Australia. Austral Ecol. 40, 923–932. doi: 10.1111/aec.12274
Hancock, C. N., Ladd, P. G., and Froend, R. H. (1996). Biodiversity and management of riparian vegetation in Western Australia. For. Ecol. Manage. 85, 239–250. doi: 10.1016/S0378-1127(96)03761-9
Harris, R. M. B., Beaumont, L. J., Vance, T. R., Tozer, C. R., Remenyi, T. A., Perkins-Kirkpatrick, S. E., et al. (2018). Biological reponses to the press and pulse of climate trends and extreme events. Nat. Clim. Chang. 8, 579–587. doi: 10.1038/s41558-018-0187-9
Hislop, M. (2011). A reinstatement and a new combination in Leucopogon (Ericaceae: Styphelioideae: Styphelieae). Nuytsia 21, 163–175.
Hislop, M., and Chapman, A. R. (2007). Three new and geographically restricted species of Leucopogon (Ericaceae: Styphelioideae: Styphelieae) from south-west Western Australia. Nuytsia 17, 165–184.
Hope, P., Abbs, D., Bhend, J., Chiew, F., Church, J. A., Ekström, M., et al. (2015). “Southern and south-western flatlands cluster report,” in Climate Change in Australia Projections for Australia’s Natural Resource Management Regions, eds M. Ekström, P. Whetton, C. Gerbing, M. Grose, L. Webb, and J. Risbey (Clayton South, VIC: CSIRO).
Hope, P. K., Drosdowsky, W., and Nicholls, N. (2006). Shifts in the synoptic systems influencing southwest Western Australia. Clim. Dyn. 26, 751–764. doi: 10.1007/s00382-006-0115-y
Hopley, T., and Byrne, M. (2018). Connectivity in riparian plants: influence of vegetation type and habitat fragmentation overrides water flow. Oecologia 188, 465–478. doi: 10.1007/s00442-018-4226-z
Hopper, S. D., and Gioia, P. (2004). The southwest Australian floristic region: evolution and conservation of a global hot spot of biodiversity. Annu. Rev. Ecol. Evol. Syst. 35, 623–650. doi: 10.1146/annurev.ecolsys.35.112202.130201
Isenburg, M. (2017). LAStools: Award Winning Software for Rapid LiDAR Processing. Available online at: http://www.cs.unc.edu/∼isenburg/lastools/(accessed January 1, 2017).
Jensen, A. E., Walker, K. F., and Paton, D. C. (2008). The role of seedbanks in restoration of floodplain woodlands. River Res. Appl. 24, 632–649. doi: 10.1002/rra
Johnson, W. C. (2000). Tree recruitment and survival in rivers: influence of hydrological processes. Hydrol. Process. 14, 3051–3074. doi: 10.1002/1099-1085(200011/12)14:16/17<3051::aid-hyp134>3.0.co;2-1
Keighery, G. J. (1996). Phytogeography, biology and conservation of Western Australian Epacridaceae. Ann. Bot. 77, 347–355. doi: 10.1006/anbo.1996.0042
Kellermann, J., Rye, B. L., and Thiele, K. R. (2008). Nomenclatural notes, typifications and name changes in Trymalium (Rhamnaceae: Pomaderreae). Trans. R. Soc. South Aust. 132, 18–28. doi: 10.1080/03721426.2008.10887089
Kingsford, R. (2016). “Flow alteration and its effects on Australia’s riverine vegetation,” in Vegetation of Australian Riverine Landscapes: Biology, Ecology and Management, eds S. J. Capon, C. James, and M. Reid (Clayton South, VIC: CSIRO Publishing), 261–271.
Lenoir, J., Bertrand, R., Comte, L., Bourgeaud, L., Hattab, T., Murienne, J., et al. (2020). Species better track climate warming in the oceans than on land. Nat. Ecol. Evol. 4, 1044–1059. doi: 10.1038/s41559-020-1198-2
Lenoir, J., Gégout, J.-C., Pierrat, J.-C., Bontemps, J.-D., and Dhôte, J.-F. (2009). Differences between tree species seedling and adult altitudinal distribution in mountain forests during the recent warm period (1986-2006). Ecography 32, 765–777. doi: 10.1111/j.1600-0587.2009.05791.x
Lenoir, J., Hattab, T., and Pierre, G. (2017). Climatic microrefugia under anthropogenic climate change: implications for species redistribution. Ecography 40, 253–266. doi: 10.1111/oik.02629
Lenoir, J., and Svenning, J.-C. (2015). Climate-related range shifts–a global multidimensional synthesis and new research directions. Ecography 38, 15–28. doi: 10.1111/ecog.00967
Lloret, F., Peñuelas, J., Prieto, P., Llorens, L., and Estiarte, M. (2009). Plant community changes induced by experimental climate change: seedling and adult species composition. Perspect. Plant Ecol. Evol. Syst. 11, 53–63. doi: 10.1016/j.ppees.2008.09.001
Mahoney, J. M., and Rood, S. B. (1998). Streamflow requirements for cottonwood seedling recruitment–an integrative model. Wetlands 18, 634–645. doi: 10.1007/bf03161678
Máliš, F., Kopeck’y, M., Petřík, P., Vladovič, J., Merganič, J., and Vida, T. (2016). Life stage, not climate change, explains observed tree range shifts. Glob. Chang. Biol. 22, 1904–1914. doi: 10.1111/gcb.13210
Matusick, G., Ruthrof, K. X., Brouwers, N. C., Dell, B., and Hardy, G. S. J. (2013). Sudden forest canopy collapse corresponding with extreme drought and heat in a mediterranean-type eucalypt forest in southwestern Australia. Eur. J. For. Res. 132, 497–510. doi: 10.1007/s10342-013-0690-5
McLaughlin, B., Ackerly, D. D., Klos, P. Z., Natali, J., Dawson, T. E., and Thompson, S. E. (2017). Hydrologic refugia, plants and climate change. Glob. Chang. Biol. 23, 2941–2961. doi: 10.1111/gcb.13629
Monk, D., Pate, J., and Loneragan, W. (1981). Biology of Acacia pulchella R.Br. with special reference to symbiotic nitrogen fixation. Aust. J. Bot. 29, 579–592. doi: 10.1071/bt9810579
Murphy, H. T., VanDerWal, J., and Lovett-Doust, J. (2010). Signatures of range expansion and erosion in eastern North American trees. Ecol. Lett. 13, 1233–1244. doi: 10.1111/j.1461-0248.2010.01526.x
Nakagawa, S., and Schielzeth, H. (2013). A general and simple method for obtaining R2 from generalized linear mixed-effects models. Methods Ecol. Evol. 4, 133–142. doi: 10.1111/j.2041-210x.2012.00261.x
Norman, M. A., and Koch, J. M. (2008). The effect of in situ seed burial on dormancy break in three woody-fruited species (Ericaceae and Proteaceae) endemic to Western Australia. Aust. J. Bot. 56, 493–500. doi: 10.1071/bt07175
Oksanen, J., Blanchet, F. G., Kindt, R., Legendre, P., Minchin, P. R., O’Hara, R. B., et al. (2017). vegan: Community Ecology Package. R Package Version 2.4-2.
Osterkamp, W. R., and Hupp, C. R. (2010). Fluvial processes and vegetation–glimpses of the past, the present, and perhaps the future. Geomorphology 116, 274–285. doi: 10.1016/j.geomorph.2009.11.018
Parmesan, C. (2006). Ecological and evolutionary responses to recent climate change. Annu. Rev. Ecol. Evol. Syst. 37, 637–669. doi: 10.2307/annurev.ecolsys.37.091305.30000024
Petrone, K. C., Hughes, J. D., Van Niel, T. G., and Silberstein, R. P. (2010). Streamflow decline in southwestern Australia, 1950-2008. Geophys. Res. Lett. 37, 1–7. doi: 10.1029/2010GL043102
Pettit, N. E., and Froend, R. H. (2001a). Availability of seed for recruitment of riparian vegetation: a comparison of a tropical and a temperate river ecosystem in Australia. Aust. J. Bot. 49, 515–528. doi: 10.1071/bt00059
Pettit, N. E., and Froend, R. H. (2001b). Variability in flood disturbance and the impact on riparian tree recruitment in two contrasting river systems. Wetl. Ecol. Manag. 9, 13–25.
Pettit, N. E., Froend, R. H., and Davies, P. M. (2001). Identifying the natural flow regime and the relationship with riparian vegetation for two contrasting Western Australian rivers. Regul. Rivers Res. Manag. 17, 201–215. doi: 10.1002/rrr.624
Polzin, M. L., and Rood, S. B. (2006). Effective disturbance: seedling safe sites and patch recruitment of riparian cottonwoods after a major flood of a mountain river. Wetlands 26, 965–980. doi: 10.1672/0277-5212(2006)26[965:edsssa]2.0.co;2
R Core Team (2020). R: A Language and Environment for Statistical Computing. Vienna: R Foundation for Statistical Computing.
Ramalho, C. E., Byrne, M., and Yates, C. J. (2017). A climate-oriented approach to support decision-making for seed provenance in ecological restoration. Front. Ecol. Evol. 5:95. doi: 10.3389/fevo.2017.00095
Reside, A. E., Welbergen, J. A., Phillips, B. L., Wardell-Johnson, G. W., Keppel, G., Ferrier, S., et al. (2014). Characteristics of climate change refugia for Australian biodiversity. Austral Ecol. 39, 887–897. doi: 10.1111/aec.12146
Rood, S. B., Braatne, J. H., and Goater, L. A. (2010). Responses of obligate versus facultative riparian shrubs following river damming. River Res. Appl. 26, 102–117. doi: 10.1002/rra
Rye, B. L. (2013). A revision of the south-western Australian genus Astartea (Myrtaceae: Chamelaucieae). Nuytsia 23, 189–269.
Shafroth, P. B., Stromberg, J. C., and Patten, D. T. (2002). Riparian vegetation response to altered disturbance and stress regimes. Ecol. Appl. 12, 107–123. doi: 10.2307/3061140
Silberstein, R. P., Aryal, S. K., Durrant, J., Pearcey, M., Braccia, M., Charles, S. P., et al. (2012). Climate change and runoff in south-western Australia. J. Hydrol. 475, 441–455. doi: 10.1016/j.jhydrol.2012.02.009
Stella, J. C., and Battles, J. J. (2010). How do riparian woody seedlings survive seasonal drought? Oecologia 164, 579–590. doi: 10.1007/s00442-010-1657-6
Stella, J. C., Battles, J. J., McBride, J. R., and Orr, B. K. (2010). Riparian seedling mortality from simulated water table recession, and the design of sustainable flow regimes on regulated rivers. Restor. Ecol. 18, 284–294. doi: 10.1111/j.1526-100X.2010.00651.x
Stella, J. C., Riddle, J., Piégay, H., Gagnage, M., and Trémélo, M. L. (2013). Climate and local geomorphic interactions drive patterns of riparian forest decline along a Mediterranean Basin river. Geomorphology 202, 101–114. doi: 10.1016/j.geomorph.2013.01.013
Ström, L., Jansson, R., Nilsson, C., Johansson, M. E., and Xiong, S. (2011). Hydrologic effects on riparian vegetation in a boreal river: an experiment testing climate change predictions. Glob. Chang. Biol. 17, 254–267. doi: 10.1111/j.1365-2486.2010.02230.x
Stromberg, J. C., Bagstad, K. J., Leenhouts, J. M., Lite, S. J., and Makings, E. (2005). Effects of stream flow intermittency on riparian vegetation of a semiarid region river (San Pedro River, Arizona). River Res. Appl. 21, 925–938. doi: 10.1002/rra.858
Taylor, J. P., Wester, D. B., and Smith, L. M. (1999). Soil disturbance, flood management, and riparian woody plant establishment in the Rio Grande floodplain. Wetlands 19, 372–382. doi: 10.1007/BF03161769
Telwala, Y., Brook, B. W., Manish, K., and Pandit, M. K. (2013). Climate-induced elevational range shifts and increase in plant species richness in a Himalayan biodiversity epicentre. PLoS One 8:e57103. doi: 10.1371/journal.pone.0057103
Vitasse, Y., Hoch, G., Randin, C. F., Lenz, A., Kollas, C., and Körner, C. (2012). Tree recruitment of European tree species at their current upper elevational limits in the Swiss Alps. J. Biogeogr. 39, 1439–1449. doi: 10.1111/j.1365-2699.2012.02697.x
Western Australian Herbarium FloraBase (1998). The Western Australian Flora. Department of Biodiversity, Conservation and Attractions. Available online at: https://florabase.dpaw.wa.gov.au/ (accessed July 2017).
Wheeler, J. (2003). Hibbertia cuneiformis: Dilleniaceae. Curtiss Bot. Mag. 20, 66–68. doi: 10.1111/1467-8748.00373
Wheeler, J. R., and Marchant, N. G. (2007). A revision of the Western Australian genus Agonis (Myrtaceae) and two new segregate genera Taxandria and Paragonis. Nuytsia 16, 393–433.
Wheeler, J. R., Marchant, N. G., and Lewington, M. (2002). The Flora of the South West: Bunbury, Augusta, Denmark, Vol. 2. Canberra, ACT: Australian Biological Resources Study.
White, H. A. (2018). Resistance, Resilience and Adaptation to Climate Change in Riparian Ecosystems. Ph.D. Thesis, University of Western Australia.
Zhu, K., Woodall, C. W., and Clark, J. S. (2012). Failure to migrate: lack of tree range expansion in response to climate change. Glob. Chang. Biol. 18, 1042–1052. doi: 10.1111/j.1365-2486.2011.02571.x
Keywords: climate change, environmental flows, LiDAR, Mediterranean climate, range contraction, recruitment, riparian vegetation, stream flow decline
Citation: White HA, Scott JK and Didham RK (2021) Evidence of Range Shifts in Riparian Plant Assemblages in Response to Multidecadal Streamflow Declines. Front. Ecol. Evol. 9:605951. doi: 10.3389/fevo.2021.605951
Received: 14 September 2020; Accepted: 11 May 2021;
Published: 18 June 2021.
Edited by:
Emily V. Moran, University of California, Merced, United StatesReviewed by:
Kai Zhu, University of California, Santa Cruz, United StatesCopyright © 2021 White, Scott and Didham. This is an open-access article distributed under the terms of the Creative Commons Attribution License (CC BY). The use, distribution or reproduction in other forums is permitted, provided the original author(s) and the copyright owner(s) are credited and that the original publication in this journal is cited, in accordance with accepted academic practice. No use, distribution or reproduction is permitted which does not comply with these terms.
*Correspondence: Helen A. White, aGVsZW5hbXl3aGl0ZUBnbWFpbC5jb20=
†Present address: Helen A. White, Greater Wellington Regional Council, Wellington, New Zealand
Disclaimer: All claims expressed in this article are solely those of the authors and do not necessarily represent those of their affiliated organizations, or those of the publisher, the editors and the reviewers. Any product that may be evaluated in this article or claim that may be made by its manufacturer is not guaranteed or endorsed by the publisher.
Research integrity at Frontiers
Learn more about the work of our research integrity team to safeguard the quality of each article we publish.