 Rob Klinger
 Emma C. Underwood2,3
- 1Western Ecological Research Center, United States Geological Survey, Oakhurst, CA, United States
- 2Department of Environmental Science & Policy, University of California, Davis, Davis, CA, United States
- 3Centre for Biological Sciences, University of Southampton, Southampton, United Kingdom
- 4Earth Resources Observation and Science (EROS) Center, United States Geological Survey, Sioux Falls, SD, United States
The extent and frequency of fire has increased in many arid systems over the last century, with a large proportion of area in some regions undergoing transitions to novel conditions. Portions of the Mojave Desert in southwestern North America have undergone such transitions, most often from woody to herbaceous-dominated systems. These transitions have often been attributed to the proliferation of invasive annual grasses that promote more frequent fire, but recent evidence indicates that transitions can also occur independent of fire frequency if burn severity is high. In addition, high probability of ignition (i.e., potentially high fire frequency) and high burn severity may not always be geographically related. Therefore, our goals were to: (1) map potential burn severity, fire frequency, and probability of ignition across the Mojave; and, (2) evaluate spatial association among predicted burn severity, fire frequency and probability of ignition. We first mapped perimeters of 250 wildfires > 405 ha that occurred from 1972 to 2010, then extracted data on fire frequency (number of times burned from 1972 to 2010), burn severity (the difference Normalized Burn Ratio), and 15 predictor variables representing physiography, climate, ignition, and vegetation. Maximum entropy was used to predict probability of ignition and Random Forest models were used to predict dNBR and fire frequency. Areas with high burn severity and high ignition probability had opposite spatial trends; areas with high burn severity were predicted to predominantly be in the northwest part of the region whereas areas with high ignition probability were predicted to be in the northeast. The models indicate the existence of a number of spatially structured but temporally dynamic fire regimes throughout the Mojave Desert. Two prevalent and ecologically significant regimes include one with frequent fires of low to moderate severity and another with infrequent fire of high severity. Areas with high fire frequency are currently limited in extent (<1% total area). However, cover of invasive grasses can remain high decades after a burn of high or moderate severity, so grass-fire cycles could develop in areas where there may be expectations of infrequent fire as well as those with relatively high fire frequency.
Introduction
Fire in the North American deserts was historically characterized as a regime of relatively small, infrequent, and patchy burns (Wright and Bailey, 1982). This perspective has gradually evolved with increasing recognition that it applied mainly to lower elevations where productivity is low and vegetation discontinuous (Brooks et al., 2018). Moreover, an interplay between elevation, latitude and topography results in significant climatic variation both among and within the four major North American deserts (Great Basin, Mojave, Sonoran, and Chihuahuan; MacMahon and Wagner, 1985; Hereford et al., 2006; Brooks and Chambers, 2011). These physiographic-climatic interactions potentially result in not just one but multiple fire regimes both within and among the desert regions of North America (Tagestad et al., 2016; Brooks et al., 2018; Chambers et al., 2019).
Interest in fire in the North American deserts has been increasing (Brooks and Pyke, 2001; Abatzoglou and Kolden, 2011, Brooks and Chambers, 2011), but appreciation of how variation in vegetation, topography, and climate shapes desert fire regimes has been slow to take hold. There have been a number of recent studies on wildfire activity in the western United States, especially in forests and shrublands (Collins et al., 2006; Westerling et al., 2006; Littell et al., 2009; Miller et al., 2012; Abatzoglou and Kolden, 2013; Dennison et al., 2014). Deserts were integrated into some of these studies, but the criteria used to delimit them differed considerably among the studies. In some the boundaries were based on administrative or management borders, while others pooled or split the deserts irrespective of fundamentally different ecological characteristics. Thus, from a bioregional perspective, the delineations made little ecological sense. Moreover, not accounting for the extensive physiognomic heterogeneity among and within the deserts implied they were represented by one fire regime. As a result, while the studies reported an increase in numbers of fires and area burned in the western United States, inferring that those trends are representative of the deserts is problematic. This becomes especially apparent when studies that were focused on a specific desert report patterns markedly different from the patterns reported in the large-scale studies (Brooks and Matchett, 2006; Syphard et al., 2017; Klinger et al. unpublished).
Despite these problems, it would be inappropriate to think that the factors generally regarded as being responsible for increased fire activity in forests and shrublands do not also influence fire regimes in the deserts. These include shifts in climate (Westerling et al., 2003; Littell et al., 2009), the buildup of woody vegetation (often because of historic fire suppression by humans), and promotion of high ignition rates by invasive annual grasses (D’Antonio and Vitousek, 1992; Brooks et al., 2004). These factors rarely act in isolation though. Rather, their interactions are the critical elements of both fire activity and dynamics in post-fire vegetation (Abatzoglou and Kolden, 2013; Overpeck, 2013). Moreover, both the magnitude and direction of their interactions can be modified by the complex physiography of the deserts (Klinger and Brooks, 2017).
The amount and seasonality of precipitation are recognized as the most important large-scale drivers of fire in the deserts (Brooks and Chambers, 2011; Tagestad et al., 2016). Precipitation is influenced greatly by elevation, latitude and longitude, so rainfall patterns among and within the deserts have high heterogeneity (MacMahon and Wagner, 1985; Hereford et al., 2006). Because vegetation biomass is strongly related to precipitation in arid ecosystems it varies greatly along gradients of elevation and latitude (Chambers et al., 2019). This results in fire activity potentially being limited by fuel at lower elevations and latitudes and by ignition at higher elevations and latitudes (Brooks and Matchett, 2006). The interplay between fuel and ignition can be altered by invasive annual grasses though. They produce a fuel layer that is continuous and easily ignited, which can lead to more frequent ignitions as well as communities where they are the dominant species (Brooks and Pyke, 2001). In some instances impacts from invasive annual grasses can be localized and diminish over time (Klinger and Brooks, 2017), but in others they can result in the transformation of entire ecosystems (Brooks et al., 2004; Zouhar et al., 2008).
The grass-fire cycle (GFC) is a conceptual representation of the positive feedback between fire regimes and post-fire vegetation communities (D’Antonio and Vitousek, 1992; Brooks et al., 2004). Most research has focused on how the GFC increases fire frequency (i.e., shortens fire return intervals), resulting over time in conversion of woody-dominated communities to invasive grass-dominated communities. Frequency is only one component of a fire regime though. A recent chronosequence study throughout the Mojave Desert (Mojave from hereon) reported long-term (30–40 years) conversions occurred following single fires that were of moderate to high burn severity (Klinger and Brooks, 2017). High fire frequency also resulted in long-term shifts in herbaceous communities independent of burn severity, indicating the existence of two pathways for fire-driven transformation of vegetation communities (Klinger and Brooks, 2017).
The GFC has been reported to occur in the Mojave for more than 20 years (Brooks, 1999; Brooks and Esque, 2002; Brooks and Matchett, 2006). A large portion of the region has suitable habitat for several invasive grass species (Underwood et al., 2019) and fire frequency tends to be high where habitat for invasive annual grass species is suitable (Balch et al., 2013; Underwood et al., 2019). This suggests the GFC could potentially occur throughout a very large portion of the Mojave (Brooks and Matchett, 2006; Klinger and Brooks, 2017; Fusco et al., 2019; Underwood et al., 2019). However, its occurrence has only been substantiated in specific elevation zones and regions (Brooks et al., 2018).
Theoretically, a combination of high burn severity and high fire frequency would have the highest expectation for establishment of a GFC. This is likely to be very uncommon though, because heavy woody fuel is sparse when an area burns repeatedly in a relatively short period of time (Steel et al., 2015). In a region such as the Mojave, where physiography and climate have such high heterogeneity (Tagestad et al., 2016; Klinger et al., 2019), there is potential for spatial structuring in both fire regimes and post-fire vegetation communities (Brooks et al., 2018). In some parts of the region fire could be a relatively frequent event but of low to moderate severity, resulting in largely herbaceous post-fire plant communities dominated by invasive annual grass. In other parts fire could be considerably less frequent, but when it did occur a large portion of the area that burned would likely be of high or very high severity. These high severity sites would be predisposed to greater establishment of invasive annual grass, and whether they underwent long-term conversion or not would depend on distribution and abundance of invasive annual grasses in the area (Brooks and Berry, 2006; Underwood et al., 2019). If sites did become dominated by invasive annual grasses, the possibility of a GFC developing would increase greatly.
Prior studies of spatio-temporal patterns of fire in the Mojave either focused on the number of fires and area burned (Brooks and Matchett, 2006; Tagestad et al., 2016) or were restricted in spatial and/or temporal extent (Hegeman et al., 2014). Therefore, we undertook this study to address five main questions:
(1) How did fire frequency and burn severity interact to shape fire regimes across the Mojave along gradients of latitude, longitude, and elevation?
(2) What were the predicted spatial patterns of probability of ignition fire frequency, and burn severity across the Mojave along gradients of latitude, longitude, and elevation?
(3) What were the most important climate, physiographic, and vegetation variables related to predicted patterns of ignition, fire frequency and burn severity?
(4) What was the spatial association between predicted probability of ignition and burn severity?
(5) How extensive was the grass-fire cycle in the Mojave and where was it most likely to occur?
Our objectives were to: (1) map and evaluate the spatial patterns of large (>405 ha) wildfires across the Mojave from 1972 through 2010, especially in regard to fire frequency; (2) model the probability of ignition, fire frequency, and level of burn severity across the Mojave and evaluate the contribution of variables related to climate, physiography, and vegetation to the models; and, (3) evaluate spatial relationships among probability of ignition, fire frequency and burn severity to identify what fire regimes occurred in the Mojave and where those driven predominantly by fire frequency occurred and where those driven predominantly by burn severity occurred.
Materials and Methods
The Mojave Desert
The Mojave is the smallest of the four major North American deserts (≈152,000 km2) and considered transitional in climate between the colder Great Basin Desert to the north and the warmer Sonoran Desert to the south/southeast. Winter temperatures range from −20°C at higher elevations to −5°C at lower elevations, while summer temperatures range from 30°C (high elevation) to 50°C (low elevation). It is the driest of the four major North American deserts, but there is substantial geographic variability in precipitation patterns (Hereford et al., 2006; Tagestad et al., 2016). The total annual amount tends to be greater at higher latitudes and elevations, while the proportion occurring in the summer monsoon season is generally greater in the eastern and southeastern parts of the region (≈24% to 29% vs. 13% to 18% in more westerly areas). This strong variability in precipitation, as well as temperature, topography, and vegetation, has led to the designation of six subregions within the Mojave (Figure 1; Webb et al., 2009).
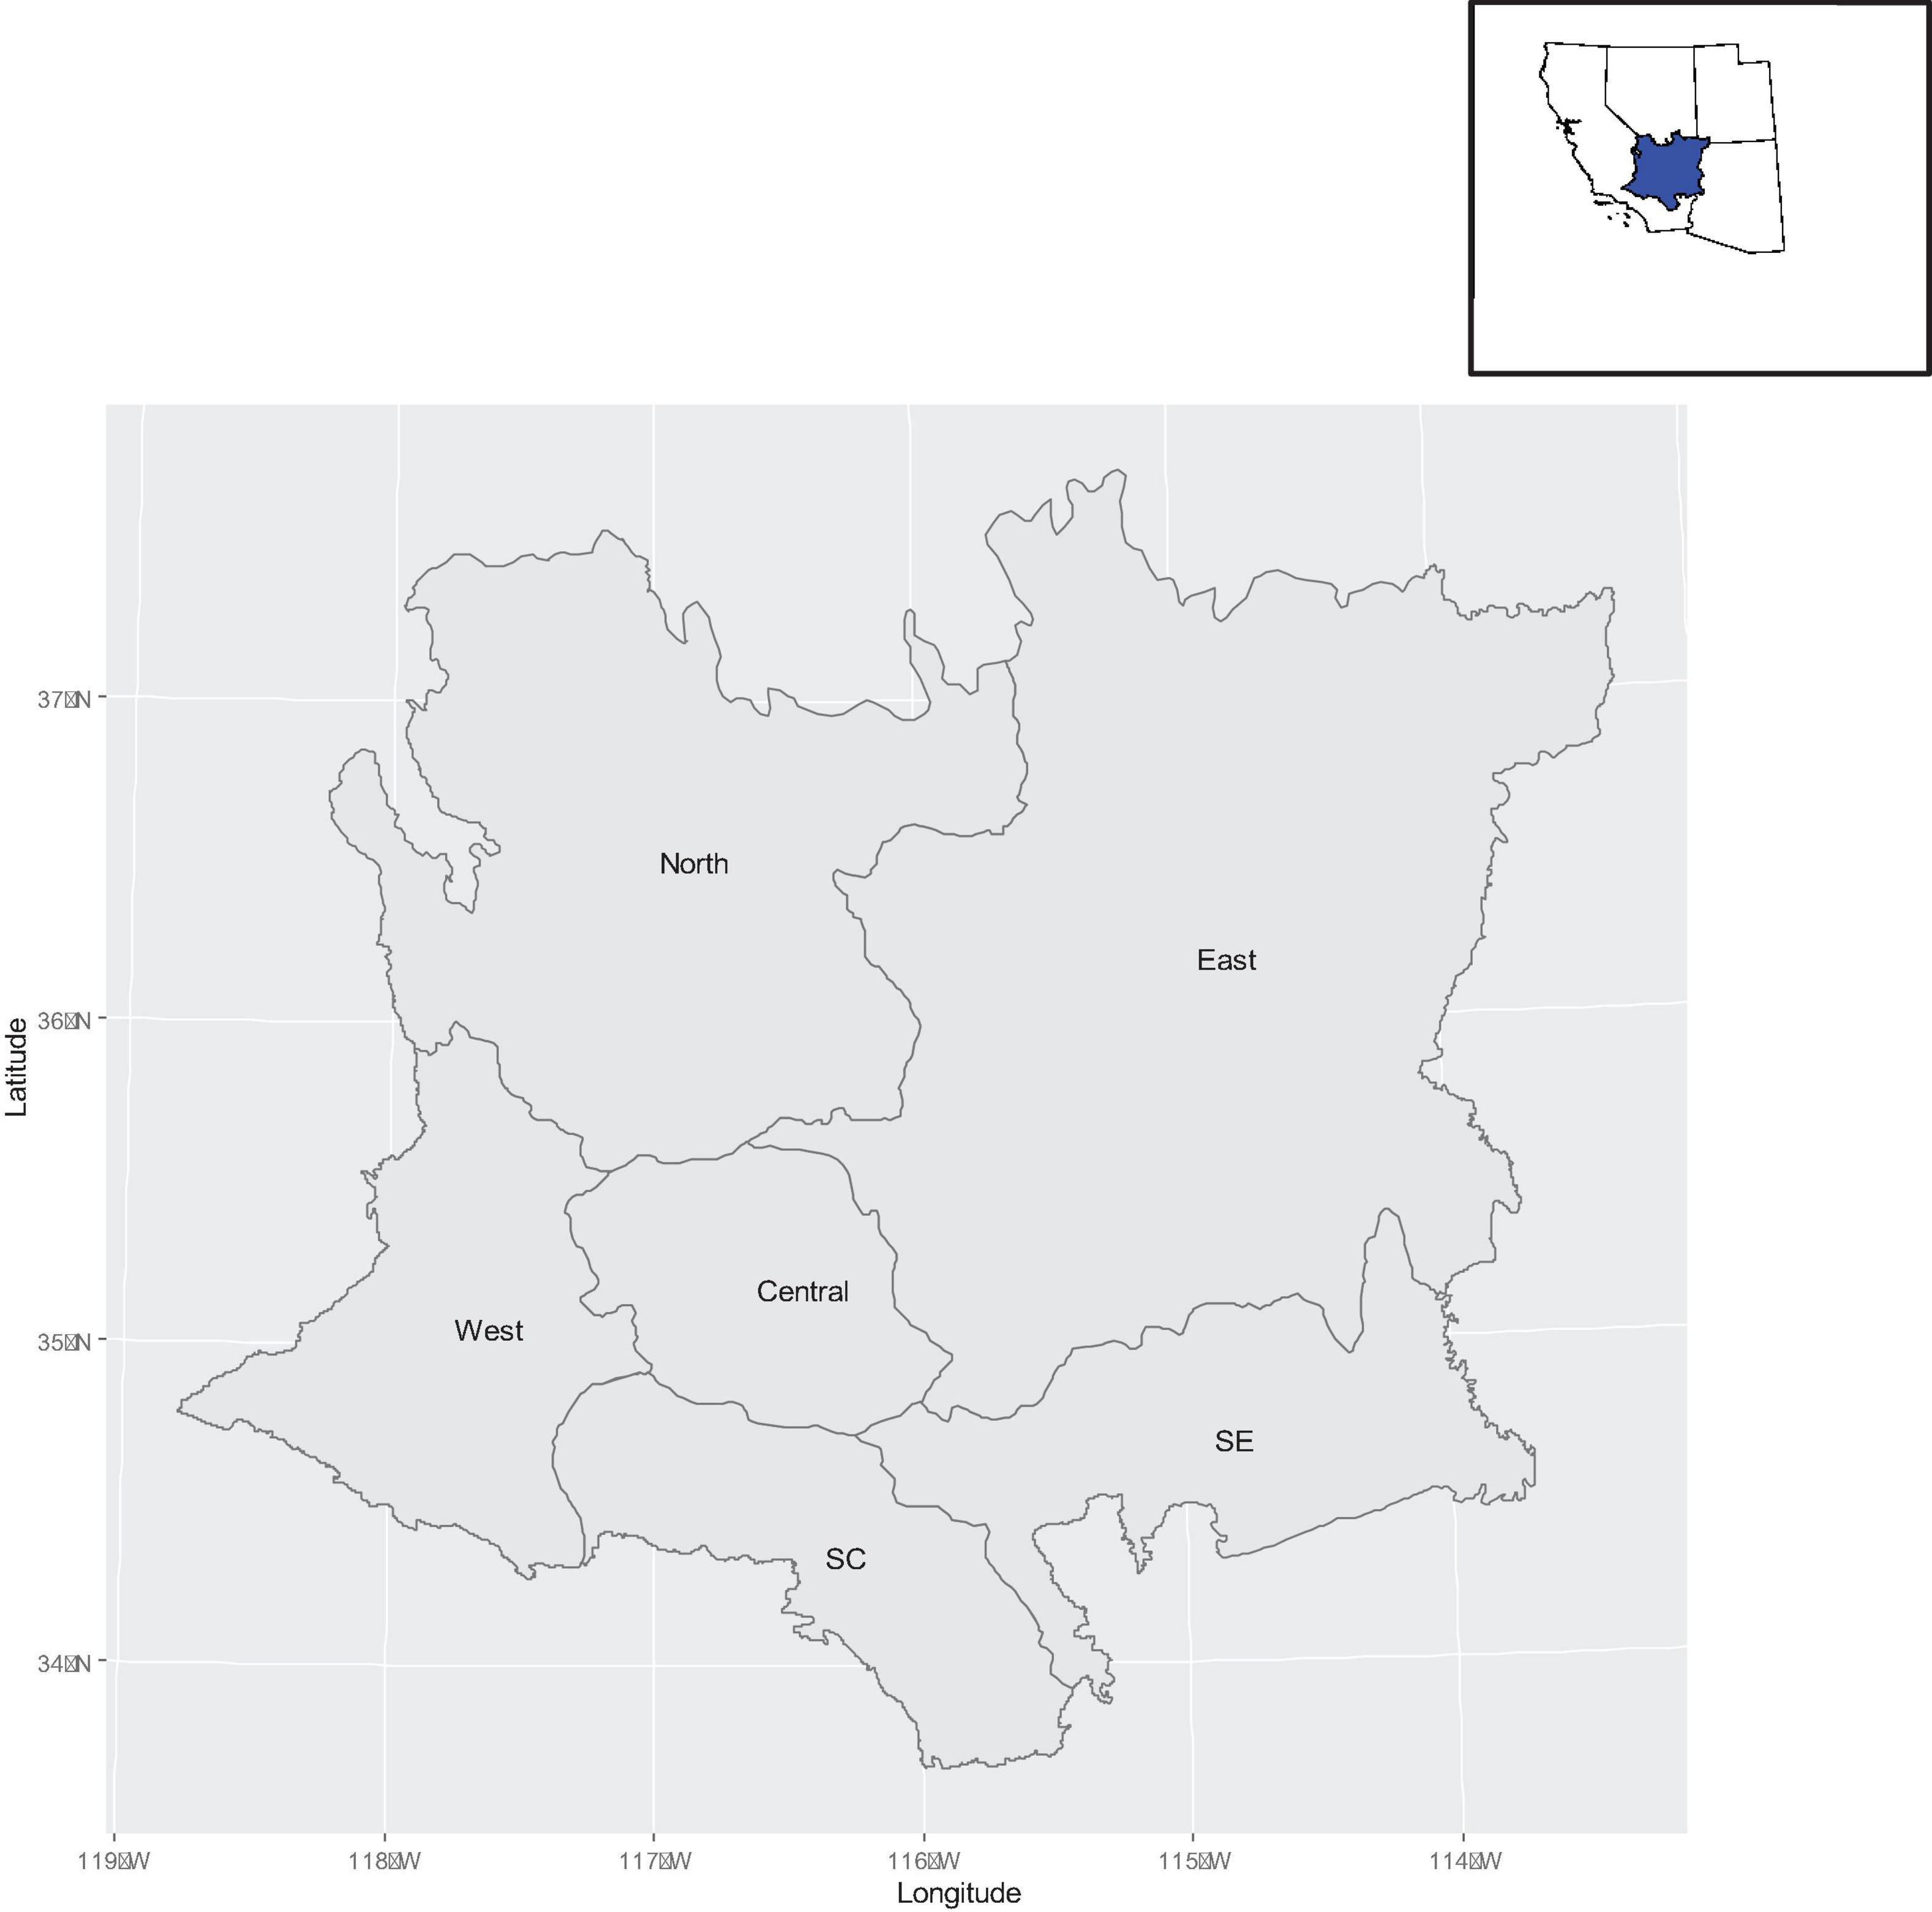
Figure 1. The Mojave Desert of North America. SE, southeastern subregion; SC, southcentral subregion.
The Mojave is bounded by the Sierra Nevada range to the west, the Colorado Plateau to the east, and the San Bernardino, San Gabriel, and Tehachapi ranges along its southwestern margins. Dozens of small mountain ranges are interspersed throughout the region, resulting in complex topography where elevations range from -85 m to 3,633 m. The mountain ranges bordering the Mojave create a rain shadow effect on west/northwest originating winter storms and are a major reason why the region is so arid. Monsoon season (July–September) precipitation results largely from the influence of the Colorado Plateau and the interior mountain ranges on moist southerly airflows. This pattern creates localized thunderstorms with numerous lightning strikes, which are the main source of ignition for the majority of large fires in the region (Brooks and Matchett, 2006; Tagestad et al., 2016; Brooks et al., 2018).
Vegetation in the Mojave is assembled primarily along an elevation gradient, although soils contribute to structure and composition as well (Brooks et al., 2018; Klinger et al., 2019). Native-dominated communities in the lower elevations (≈<1,200 m) are comprised primarily of sparse shrub cover (≈7–10%) of low stature (0.5–1.5 m). Native-dominated communities in the mid-elevations (≈1,200–1,800 m) are also dominated by shrubs, but cover is generally greater (≈15–20%) and stature of the shrubs tends to be higher (1–2 m) than in the lower elevations. Higher elevation communities are a mix of shrubs and trees [e.g., junipers (Juniperus spp.) and pines (Pinus spp.)]; woody cover typically ranges from ≈25–40%. Native forb and perennial grass species are common in all communities along the elevation gradient. Their cover is generally low (<≈3%), but during wet years it can increase 10–20×.
There are few widespread non-native species in the Mojave Desert (Abella, 2010), although cover of three annual grass [Mediterranean split grass (Schismus barbatus and Schismus Arabicus), red brome (Bromus rubens), cheatgrass (Bromus tectorum)] and one annual forb species [red-stemmed filaree (Erodium cicutarium)] can be high in burned areas, especially in the initial 5–10 years after fire (Brooks, 1999; Klinger and Brooks, 2017; Underwood et al., 2019). The three grasses are generally considered to be transformer species (Richardson et al., 2000) in the North American deserts because they can alter fire regimes and dominate post-fire communities (Brooks, 1999; Chambers et al., 2007; Bradley et al., 2018). In the Mojave these grasses sort along an elevation gradient, with split-grass being most abundant at lower elevations, red brome in mid-elevations, and cheatgrass in upper elevations (Underwood et al., 2019). The distribution of red-stemmed filaree is similar to that of red brome, but while it can dominate post-fire communities it is not a significant fine fuel component and thus does not have any meaningful effect on fire regimes (Brooks et al., 2018; Underwood et al., 2019).
Fire Atlas
Data on fire perimeters and burn severity across the Mojave from 1984 to 2010 were acquired from the Monitoring Trends in Burn Severity (MTBS) database1. MTBS uses Landsat satellite data to delineate the perimeters and burn severity indices for fires >405 ha (1,000 acres) on all public and private lands across the western United States. Perimeters are identified by comparing pre and post-fire images of the Normalized Burn Ratio (NBR; Key and Benson, 2006; Eidenshink et al., 2007), then burn severity indices (30 m resolution) based on NBR are derived. The indices include the difference Normalized Burn Ratio (dNBR), relativized dNBR (RdNBR), and an ordinal scale (unburned, low, moderate, high, and very high). Non-disturbance related differences between pre and post fire Landsat images can bias comparisons of severity among fires. Therefore, we used an offset to calibrate the dNBR layers to a more equivalent baseline, thereby improving comparisons among multiple individually mapped burn areas (Klinger et al., 2019). The offset (a plus or minus shift to the dNBR values) was based on the mean unchanged pixel value contained within individual MTBS metadata files (identified there as the “RdNBR offset”) and comes from a sample of unchanged pixels outside of the fire perimeter.
Monitoring Trends in Burn Severity data are not available prior to 1984 but Landsat imagery is available back to 1972. Therefore, we extended our time period an additional decade (1972–1983) by accessing Landsat 4/5 Multispectral Scanner (MSS) imagery and then using methods similar to those of the MTBS program to delineate fire perimeters. We selected one high-quality scene for the spring (April, May, and June) and one for the late summer/early fall (August, September, and October) of each year, corresponding to the beginning and end of the Mojave’s fire season. Scenes were selected to minimize cloud cover (<10%) and other anomalies (e.g., missing data and bad lines) that occur sometimes in older Landsat images. Although the images we selected were of high quality, MSS lacks the shortwave infrared (SWIR) spectral band required to derive dNBR and its resolution is coarser (79 m) than that of later Landsat satellites (30 m). Nevertheless, MSS bands do allow the calculation of the difference Normalized Difference Vegetation Index (dNDVI; Petorelli, 2013), which provides comparable estimates of severity as dNBR (Zhu et al., 2006; Hudak et al., 2007). We integrated dNDVI with other geospatial data (digital elevation models, topographic maps, etc.) to identify fire perimeters, and in so doing found the difference in resolution to be a trivial issue for delineating perimeters of the burns.
We calculated fire frequency by using the raster package (Hijmans, 2020) in R (R Core Team, 2019) to overlay the fire perimeters (1972–2010) and sum their overlap. We used dNBR to index burn severity (1984–2010) because it relates very well with changes in ground-based measures of severity (woody cover and density) in the Mojave and has a more direct ecological interpretation than either RdNBR or the ordinal scale (Klinger et al., 2019). Wildfires in the Mojave occur as a result of human and natural ignitions (Hegeman et al., 2014; Brooks et al., 2018), but virtually all large ones (>405 ha) are due to lightning strikes (Brooks et al., 2018). Thus, our atlas of large Mojave wildfires represents those resulting exclusively from natural ignitions.
Environmental Predictor Variables
We identified 15 variables as potential predictors of probability of ignition and frequency of fire, and 13 as predictors of burn severity (Table 1). Topography variables were derived from a digital elevation model2 (30 m resolution) and included elevation, slope, an index of terrain ruggedness (TRI; Wilson et al., 2007), aspect (cosine transformed), and hillshade (an index of localized heating). Five climate variables were derived from the ClimSurf climate surface (Alvarez et al., 2013), including mean wet (October–March 1949–2010) and monsoon season precipitation (July – September 1950–2010), proportion of monsoon season precipitation, mean minimum January temperature (1950–2010), and mean maximum July temperature (1950–2010). Vegetation variables included habitat suitability values for two brome grasses (B. rubens and B. tectorum), habitat suitability values for two Mediterranean split grass species (S. arabicus and S. barbatus), and mean growing season NDVI (March – June 1990 – 2010). In a previous study, we found habitat suitability values of the three invasive grass taxa had strong positive correlations with their cover values (Underwood et al., 2019). Therefore, we extracted the suitability values from maps developed in that study as a region wide proxy to their abundance. Although peak cover values of the grasses diverge with elevation, the bromes overlap from ≈1,400—2,000 m and distributions of the split grass species are almost indistinguishable (Underwood et al., 2019). However, overlap between the bromes and split grass species is limited (Underwood et al., 2019). This suggested that it was appropriate to combine bromes together (Bromes) and split grass together (Schismus), but these two variables should be separate predictors (Table 1). NDVI values were derived from the USGS Analysis Ready Data (ARD) database (Dwyer et al., 2018). ARD are produced from Landsat 4–8 satellite images that have been accurately georegistered, calibrated, and pre-processed (top of atmosphere and atmospheric correction).
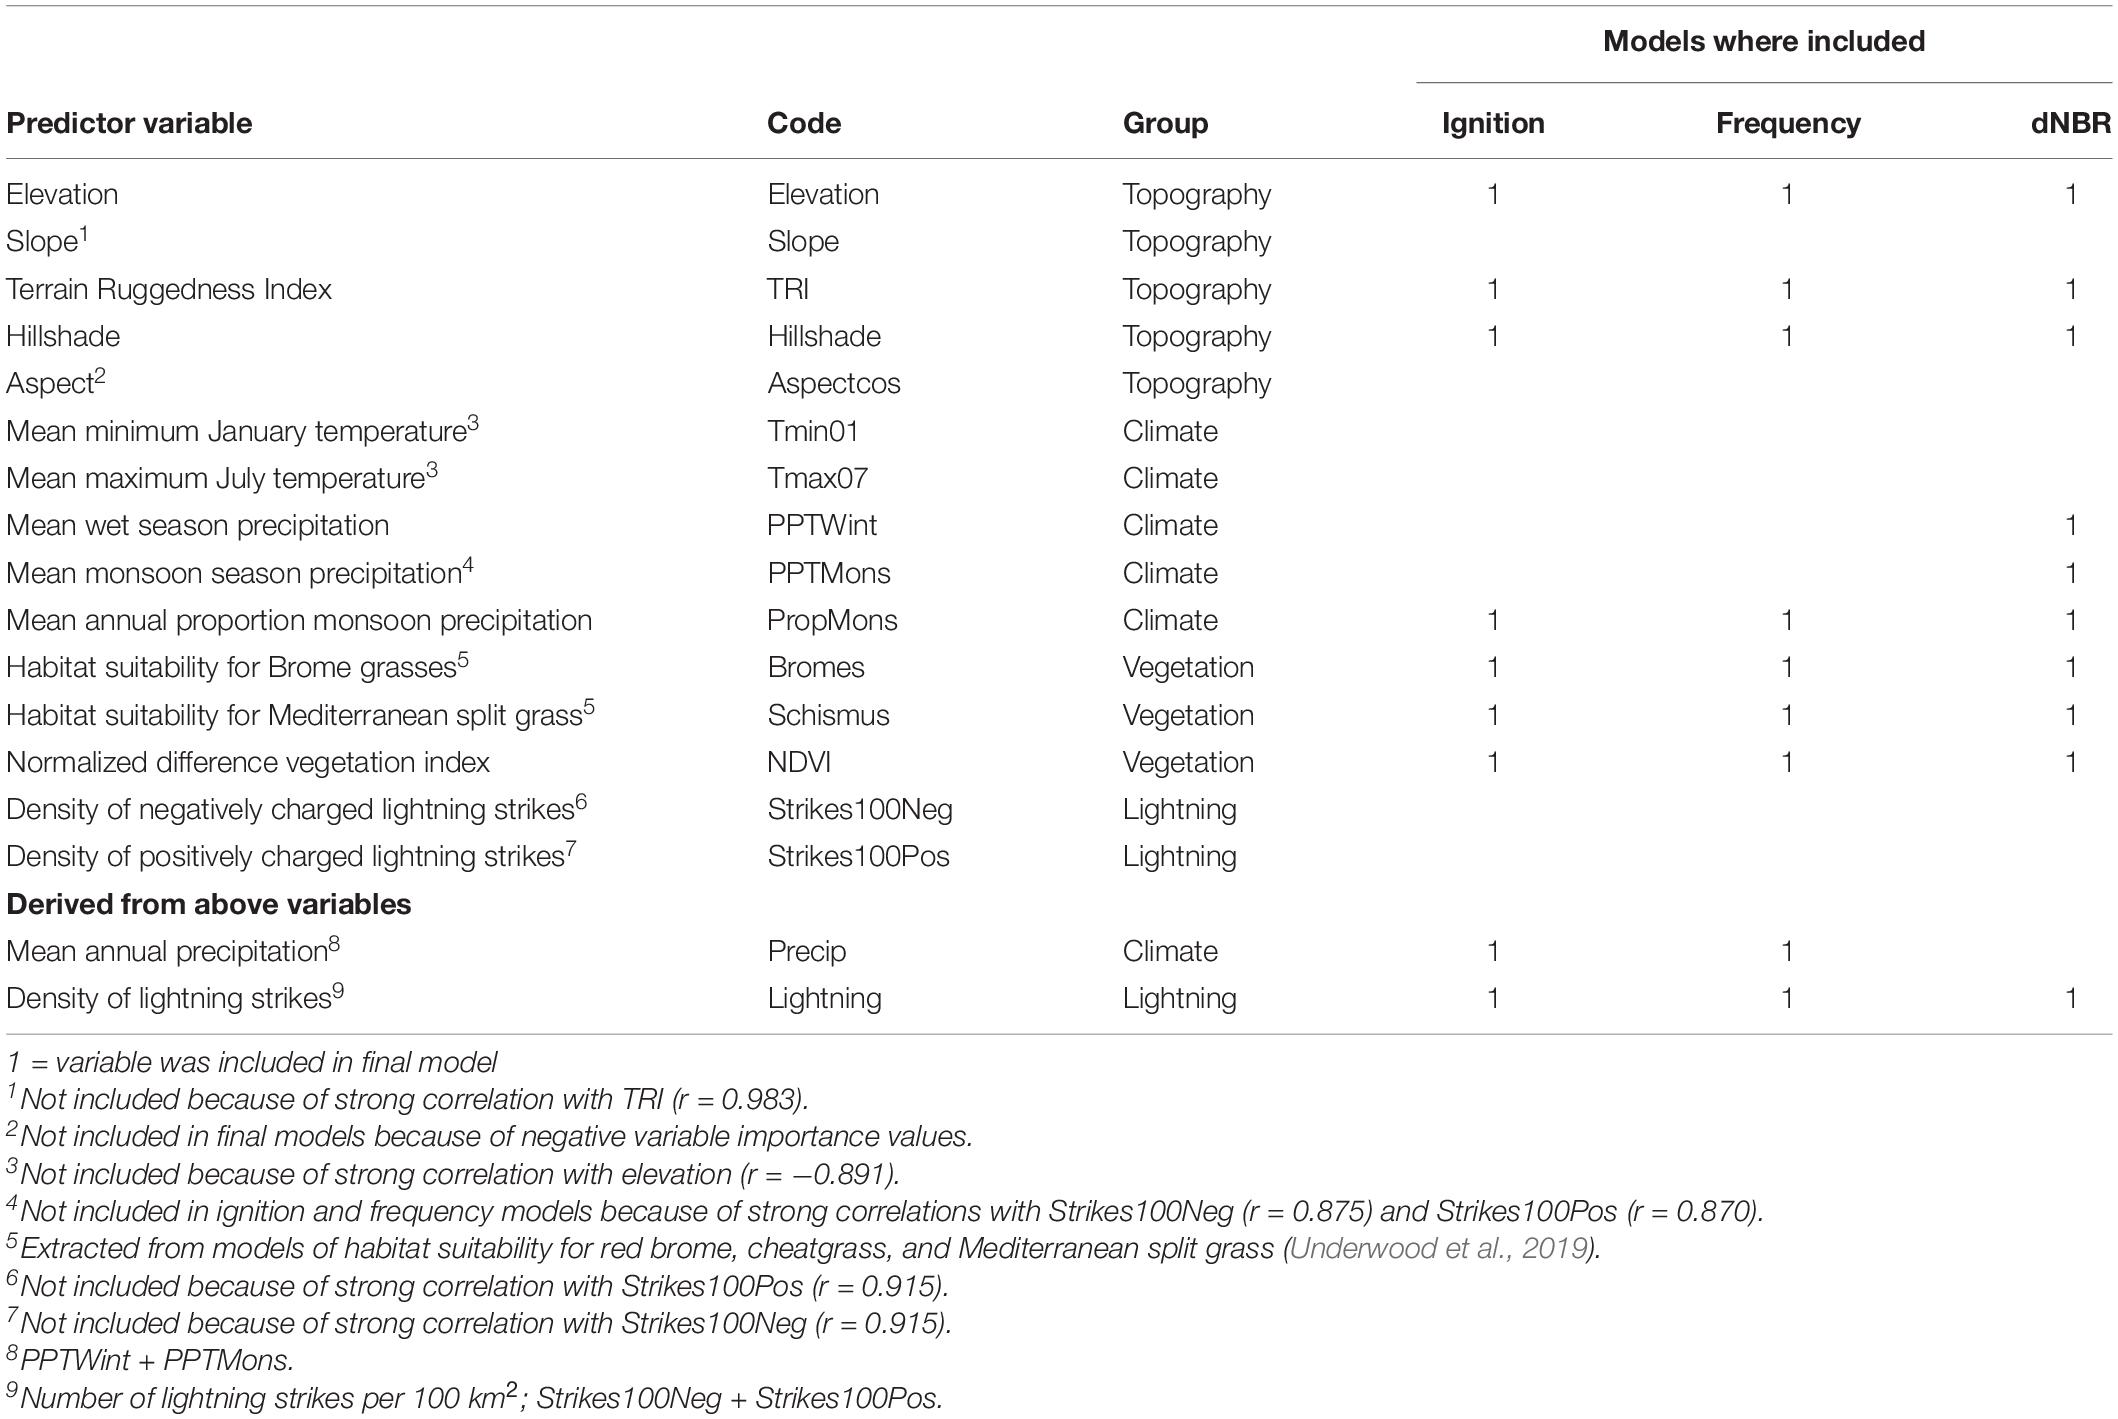
Table 1. Potential predictor variables in models of probability of ignition, fire frequency, and burn severity (difference normalized burn ratio; dNBR) in the Mojave Desert of North America.
We acquired lightning strike point data beginning in January 1990 and ending in December 2010 from the National Lightning Detection Network (NLDN) accessed through NOAA-NCEI3. Data included the geographic coordinates of the strikes, the date, and polarity (amperes with positive or negative charge). We calculated the density of strikes by dividing the region into 10 km × 10 km blocks, summed the number of positive and negative strikes in each 100 km2 block, and then calculated the mean per block (1990–2010). We calculated positive and negative strike densities separately because negative strikes are 10–20× more frequent than positive strikes, but positive strikes have 1–2 orders magnitude greater energy than negative strikes. This creates the potential for lightning regimes differing in strike intensity and energy.
All processing of the environmental variables was done in R. We used the raster package to derive the topographic variables, the greenbrown package (Forkel et al., 2013, 2015) to derive mean growing season values for NDVI, and the spatstat package to calculate lightning density (Baddeley et al., 2015). The climate and lightning rasters were resampled to a resolution of 30 m.
Spatial Analysis of Fire Frequency 1972–2010
We used point process models (PPMs) to analyze the spatial distribution of fire frequency. PPMs are a regression approach for modeling point data (i.e., geographic coordinates) for an event, which in our case was how frequently a local area (30 m pixel) had burned between 1972 and 2010. PPMs are closely related to generalized linear models (GLMs) but differ in that they model the intensity of points (i.e., points per unit area) rather than the level of a random response variable (Baddeley et al., 2015). Models can be specified that assume a Poisson process where intensity is constant across a study area (homogenous point process) or, much more typically, where intensity varies because environmental conditions are not uniform (inhomogenous point process). Thus, the relationship that intensity (λ) has with geographic position (spatial trend) and/or environmental variables can be modeled as in regression, with predicted values having a direct interpretation as a measure of points per unit area.
When points are assigned attributes they are known as marked. We converted our raster data to points by calculating the centroid of each pixel and assigned each point one of three marks f based on the number of times it had burned from 1972 through 2010: once (=1), twice (=2), or >2 times (=3). We then specified and compared five models of λf: (1) an interaction between λf, spatial trend, and the second-order effect of elevation; (2) an interaction between λf, spatial trend, and the linear effect of elevation; (3) the interaction of λf, and spatial trend; (4) the interaction of λf, and the second-order effect of elevation; and, (5) the interaction of λf, and the linear effect of elevation. The models were based on a non-stationary Gibbs process, where λf, was a log-linear function with spatial dependence among points. We included the second-order effect of elevation because previous studies had reported fire activity was greatest in the mid elevation zone of the Mojave (Brooks and Matchett, 2006; Tagestad et al., 2016). PPMs are computationally intensive and large values can prevent them from converging, therefore we rescaled the spatial coordinates (Universal Transverse Mercator) and elevation values by subtracting their mean and dividing by their SDs (standardization).
It was computationally prohibitive to use all of the fire frequency data points (>7 × 10⁷) in one analysis, so we used non-parametric bootstrapping for parameter estimation. We randomly selected 10,000 points without replacement in each of 200 bootstrap samples and ran each model for each sample. We used Akaike’s Information Criterion (AIC) to compare models and selected the one whose AIC weight (wAIC) was >0.90 (Burnham and Anderson, 2002). Final parameter estimates and 95% CIs were based on the mean of the 200 bootstrap samples and the 2.5 and 97.5% quantiles of the distribution of parameter values, respectively. We used the R package spatstat (Baddeley et al., 2015) to conduct the PPMs.
We used a modification of resource selection ratios (Manly et al., 2002) to evaluate the occurrence of fire relative to the area of three elevation zones: low (≤1,200 m), mid (1,201–1,700 m), and high (>1,700 m). The analysis used the proportion of area in each elevation zone z throughout the Mojave (“available”) and the proportion of area in each elevation zone that burned to construct a ratio Wz = burnedz/availablez. We used an omnibus log-ratio test to first determine if fire occurred disproportionally across the zones, followed by z-tests for each zone to evaluate those that had disproportionally more or less fire activity. A second index B was constructed as Bz = Wz/ΣWz, which allowed us to compare fire occurrence in a given zone relative to a “baseline” zone. The zones corresponded to the major vegetation types in the Mojave (Brooks et al., 2018; Klinger et al., 2019): low elevation shrubland typically dominated by creosote bush (Larrea tridentata) and burroweed (Ambrosia dumosa); mid-elevation shrubland dominated by blackbrush (Coleogyne ramosissima), snakeweed (Gutierrezia sarothrae), Mormon tea (Ephedra nevadensis and Ephedra viridis), and turpentine broom (Thamnosma montana); high elevation woodland and shrubland dominated by sagebrush (Artemisia tridentata), antelope bush (Purshia tridentata), juniper tree (Juniperus osteosperma), and single-leaf pinyon (Pinus monophylla). We reasoned that if fire occurred more than expected in an elevation zone this was consistent with there being higher fuels, greater rates of ignition, or both. If fire was less than expected this was consistent with a zone having sparser fuels, lower ignition rates, or both. If fire occurred proportional to the area of a zone this would be consistent with burning being area dependent more so than strong effects from either fuels or ignition. We used a similar approach as we did with the PPMs, with 10,000 random samples drawn without replacement for each of 500 bootstrap samples.
Modeling Probability of Ignition
While it would be reasonable to expect that probability of ignition (i.e., the likelihood of a fire starting) and fire frequency would have a positive correlation, this may not always be so in the Mojave because of the high heterogeneity in topography and, especially, fuel type (Brooks et al., 2018). Therefore, we developed separate models for probability of ignition and fire frequency.
Maximum Entropy (Maxent) modeling was used to calculate the probability of ignition across the Mojave. Maxent is a machine learning algorithm that contrasts the conditions at locations where an event is known to have occurred with those at background locations (Phillips et al., 2006). It is one of the most widely used predictive modeling algorithms for studies in the environmental sciences, especially those focused on species distributions (Elith et al., 2011). Over the last decade it has seen increasing use in studies examining how vegetation, climate, and human activities influence fire activity (Parisien and Moritz, 2009; Batllori et al., 2013; Syphard et al., 2013; Parisien et al., 2016; Martin et al., 2019). Maxent iteratively adjusts the probabilities of a uniform (null) distribution based on the predictor variables at each location. The iterations stop when the distribution becomes one with maximum entropy, which is the best approximation of how the predictor variables change the null distribution (Elith et al., 2006). The final output is an exponential function that assigns a predicted value proportional to the probability of occurrence to each site or cell of a map (Renner and Warton, 2013). Maxent has several beneficial features, including the ability to model complex functional relationships between response and predictor variables, quantification of the relative importance of the predictor variables, and the capability to adjust calculations to avoid overfitting (regularization; Phillips and Dudik, 2008).
To implement the Maxent model we used the dismo package in R (Hijmans et al., 2017) as an interface to the MAXENT package (Phillips and Dudik, 2008). Fire occurrence was the response variable and there were 15 potential predictor variables (Table 1). We randomly selected a total of 10,000 points separated by ≥90 m and sampled proportional to the area of the fire perimeters, then extracted the values of the predictor variables at each point. We did a preliminary analysis of the pairwise correlation among the predictor variables and removed one of each pair with a correlation (r) ≥ 0.70, resulting in N = 10 standardized predictor variables (Table 1).
We used 10-fold cross-validation to partition the response variable into training and test data sets and then calculated the mean and SD of the Area Under the Curve of the Receiver Operator Characteristic (AUC from hereon) as a threshold independent measure of model performance. Because there is potential for AUC to be biased (Lobo et al., 2007), we evaluated the values in our partitions using point-wise distance sampling (Hijmans, 2012). We used 10,000 randomly selected background points in each model partition. The response and background points were divided into training (70%) and test sets for each fold.
Two approaches were used to evaluate importance of the predictor variables. The first was calculated as the increase in prediction gain when the coefficient for each variable was changed. The amount of change is summed for each variable and expressed as a percentage of the total gain (Phillips and Dudik, 2008). The second approach consisted of jackknifing to calculate: (1) the decrease in training and test gain when a variable was removed from a model; and, (2) the highest training and test gain when a variable was the only one in a model (Phillips and Dudik, 2008).
Modeling Fire Frequency and Burn Severity
We used Random Forests (RF from hereon; Breiman, 2001) to evaluate how effectively the environmental variables predicted fire frequency and burn severity. RF is a supervised machine learning algorithm that extends the capabilities of classification and regression trees (CART; Olden et al., 2008). It recursively creates many trees from bootstrap samples of the dataset and compares the predictions of each tree to the data not in that bootstrap sample (the validation or “out-of-bag” sample). In effect, this creates numerous internally cross-validated models. Unlike CART the trees are not “pruned”; instead, each develops to its full extent. Variable importance is calculated by randomly permuting the values of each variable one at a time within each recursive run and calculating change in model performance. Final predictions and accuracy estimates are calculated by averaging the predictions of all the trees. Prediction values are the probability of belonging to a particular class (fire frequency = 1, 2, etc.) or, for continuous response variables (dNBR), an estimate of the response variables value.
Random Forests has many strengths. Each of the realizations of the recursions not only uses a different random subset of the data but also a different random subset of the predictor variables, which inherently makes it an ensemble modeling procedure. The algorithm processes high-dimensional data efficiently and it avoids overfitting data, outliers and spatial autocorrelation have much less influence on predictions than in parametric models, and complex non-linear relationships can be revealed. There are tradeoffs though relative to parametric models. It is non-parametric so there are no regression coefficients with measures of uncertainty, which is one of the principal issues in criticisms of using RF (or machine learning in general) for explanatory models (Humphries et al., 2018). Individual trees cannot be examined, which gives a perception of the algorithm being a black box. Despite these concerns, RF has become increasingly recognized as one of the most useful and effective machine learning algorithms when prediction is the primary goal of a study (Cutler et al., 2007; Crisci et al., 2012).
Our data consisted of a random selection of 20,000 points each within and outside the fire perimeters, with a minimum distance between sample points ≥90 m. Samples from within the perimeters were stratified by the area of the polygons. We split the points into training (75%) and test (25%) data sets. The training data were then partitioned with 10-fold cross-validation, with model runs for each partition k split into training (70%) and out-of-bag (OOB from hereon) sets. Fire frequency was divided into four classes based on the number of times a pixel had burned between 1972 and 2010: Unburned (=0), 1 burn (=1), 2 burns (=2), and more than 2 burns (>2). We used the same set of potential predictor variables in the fire frequency models as we did with the probability of ignition models (Table 1). We did not include lightning in the models for dNBR because it would have little if any effect on burn severity, and only data from within the fire perimeters were used in the dNBR model runs.
Model development consisted of three steps. We first tuned a model to determine the total number of trees and the optimal number of predictor variables to include at each split in the trees. We then ran an initial model using all of the predictor variables and evaluated it based on three criteria: (1) stability of the model mean squared error (MSE) as the number of trees increased; (2) the minimum MSE of the cross-validations for models with N variables; and, (3) the sign (positive or negative) of the variable importance values. Variable importance was evaluated by the proportional increase in MSE when a variable was not included in the models. If the sign of the importance value was negative this indicated the variable should be removed. The third step for the fire frequency models consisted of running a model with the optimal number of variables. The third step for dNBR models was comparing the pseudo-R2 (1 − [MSE/σ2dNBR]) values for those without topography variables, without climate variables, and without vegetation variables to the pseudo-R2 for models with topography, climate, and vegetation variables.
We used three sets of information to evaluate the performance of the fire frequency model: (1) the OOB error rate; (2) classification success from a confusion matrix of the observed and predicted frequency classes in the training and test datasets; and, (3) AUC values for pairwise classification of frequency classes (e.g., Unburned vs. 1 burn, Unburned vs. 2 burns) in training and test datasets. dNBR models were evaluated with: (1) pseudo-R2; (2) the absolute differences in observed and predicted dNBR values in the training and test datasets; and, (3) proportional differences calculated from the log-ratios of observed and predicted dNBR values in the training and test datasets. The randomForest package in R was used to develop and evaluate the models (Liaw and Wiener, 2002).
Association of Burn Severity With Probability of Ignition and Fire Frequency
We used two approaches to examine the association between probability of ignition and dNBR. First, a PPM was developed that enabled us to contrast the spatial trends in the predicted values of the two variables. We classified the continuous predicted variables into five evenly spaced quantiles, then specified an interaction model with the classes as marks and the spatial coordinates as predictor variables. We estimated the coefficients and their SEs from 250 non-parametric bootstrapped samples (N = 500 per sample), then compared the sign and magnitude of the coefficients between the probability of ignition and dNBR model runs. The models were based on a non-stationary Gibbs process and the spatial coordinates were standardized.
Next, we used a combination of redundancy analysis (RDA; Legendre and Legendre, 1998) and permutational multivariate analysis of variance (PERMANOVA; Anderson, 2001) to evaluate variation in probability of ignition and dNBR among the six Mojave subregions (Webb et al., 2009). RDA is a constrained form of Principal Components Analysis (PCA) that relates the variation among multiple response variables to a set of predictor variables. PERMANOVA is a non-parametric multivariate technique that compares both the centroids and dispersion among different groups. Conceptually, RDA and PERMANOVA are related in a similar way as linear discriminant analysis (LDA) and multivariate analysis of variance (MANOVA). However, LDA and MANOVA are least squares methods where group differences are tested against probability distributions. In contrast, RDA and PERMANOVA are based on distance matrices and group differences are evaluated by Monte Carlo permutation tests, freeing them from the restrictive assumptions of least squares-based methods.
For the PERMANOVA we specified probability of ignition and dNBR as response variables and subregion (North, East, Southeast, Southcentral, West, and Central) as the predictor variable. We randomly selected 500 points in each subregion and then extracted the probability of ignition and dNBR values for each point. We derived a Euclidean distance matrix and tested if there were differences among the subregions with Monte Carlo permutation tests (N = 999). PERMANOVA is sensitive to differences among groups in location (group centroids) and dispersion (variance; Anderson, 2001), therefore we conducted a permutation-based test of multivariate homogeneity of group dispersions and a post hoc Tukey test to help interpret patterns of difference among the subregions. We then performed the RDA to visualize positions of the subregions in multivariate space. We tested the significance of the RDA with Monte Carlo permutation tests (N = 999) and derived centroids for the subregions as well as ellipses of the centroid SEs and 95% confidence bounds to evaluate the interplay between location and dispersion among subregions. The vegan package in R (Oksanen et al., 2020) was used to conduct the PERMANOVA and RDA.
We used ordinary least-squares (OLS) regression to model the relationship between predicted values of dNBR and fire frequency along an elevation gradient. We selected 1,000 random points in each frequency class (1, 2, and >2 burns from 1972 through 2010) and used the raster package in R to extract values of dNBR, frequency, and elevation at each point. We specified dNBR as the response variable and an interaction between the frequency classes and the 2nd-order effect of elevation as the predictor variables.
Results
Spatial Pattern of Burning
We identified 250 fires (>405 ha) totaling 753,288 ha that occurred between 1972 and 2010 (Figure 2). This comprised 5.8% of the total area of the Mojave, with the vast majority burning only once; <1% of the total area of the Mojave had burned two or more times (Table 2). The distribution of area burned among the fires was highly skewed, with 83% occurring from fires between 412 and 5,000 ha (Figure 3). However, three fires > 50,000 ha each occurred in 2005, comprising 29% of the total area burned between 1972 and 2010.
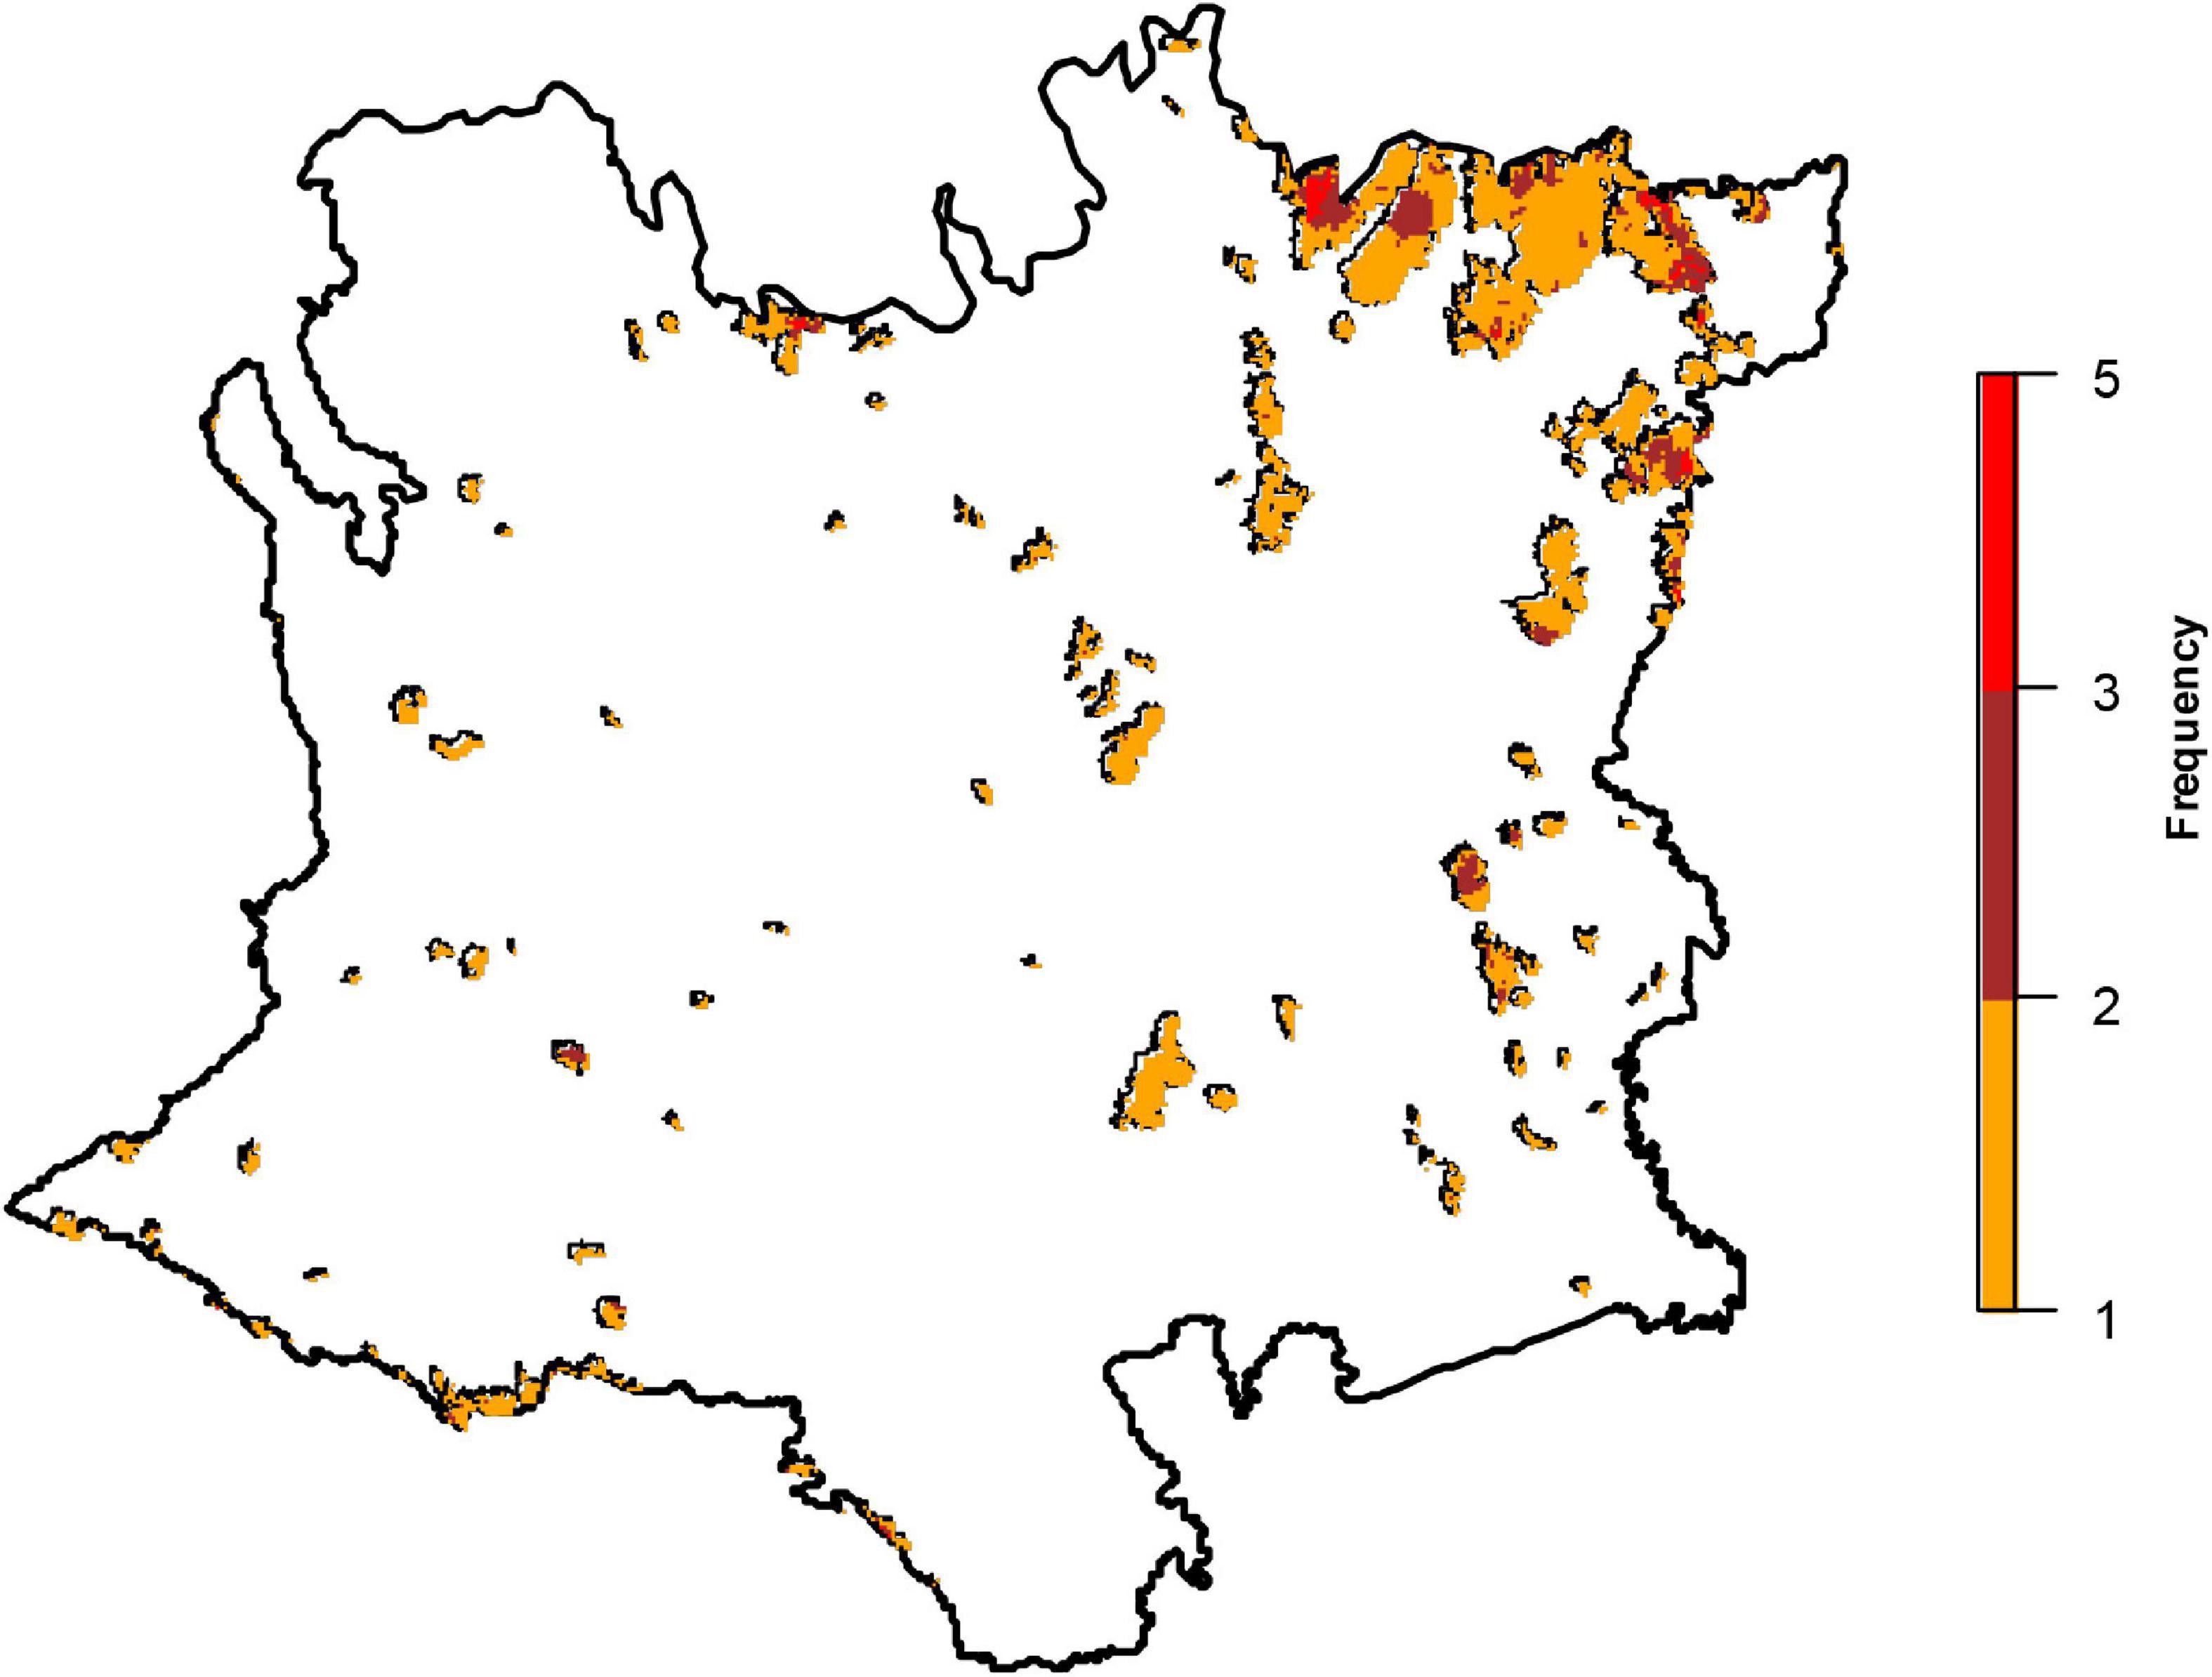
Figure 2. Fire perimeters classified by fire frequency (number of times burned from 1972 to 2010; 1, 2, and >2) for 250 fires >405 ha in the Mojave Desert of North America.
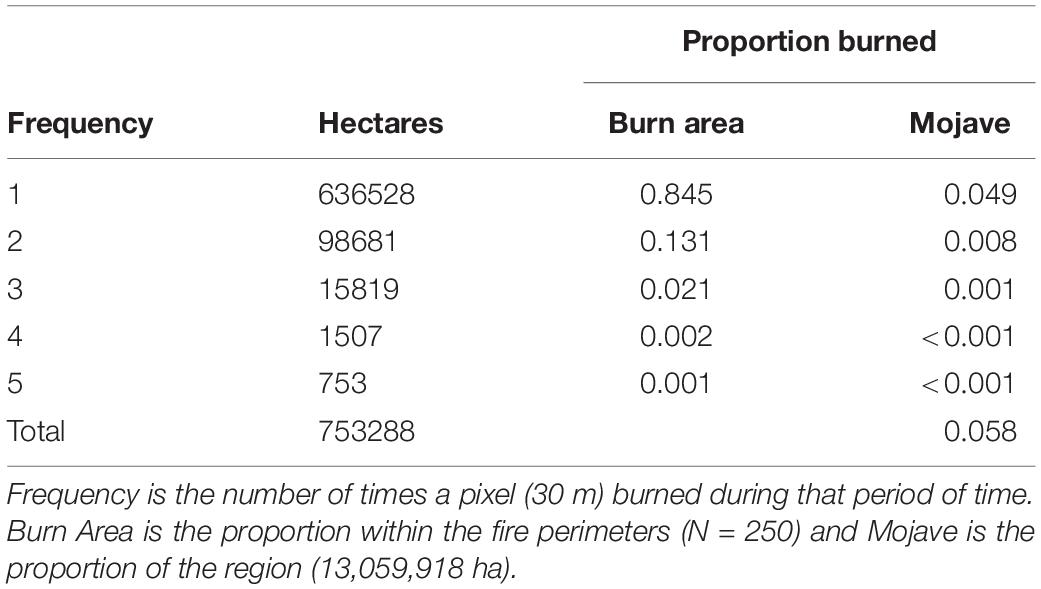
Table 2. The number and proportion of hectares burned in fires >405 ha in the Mojave Desert of North America, 1972 – 2010.
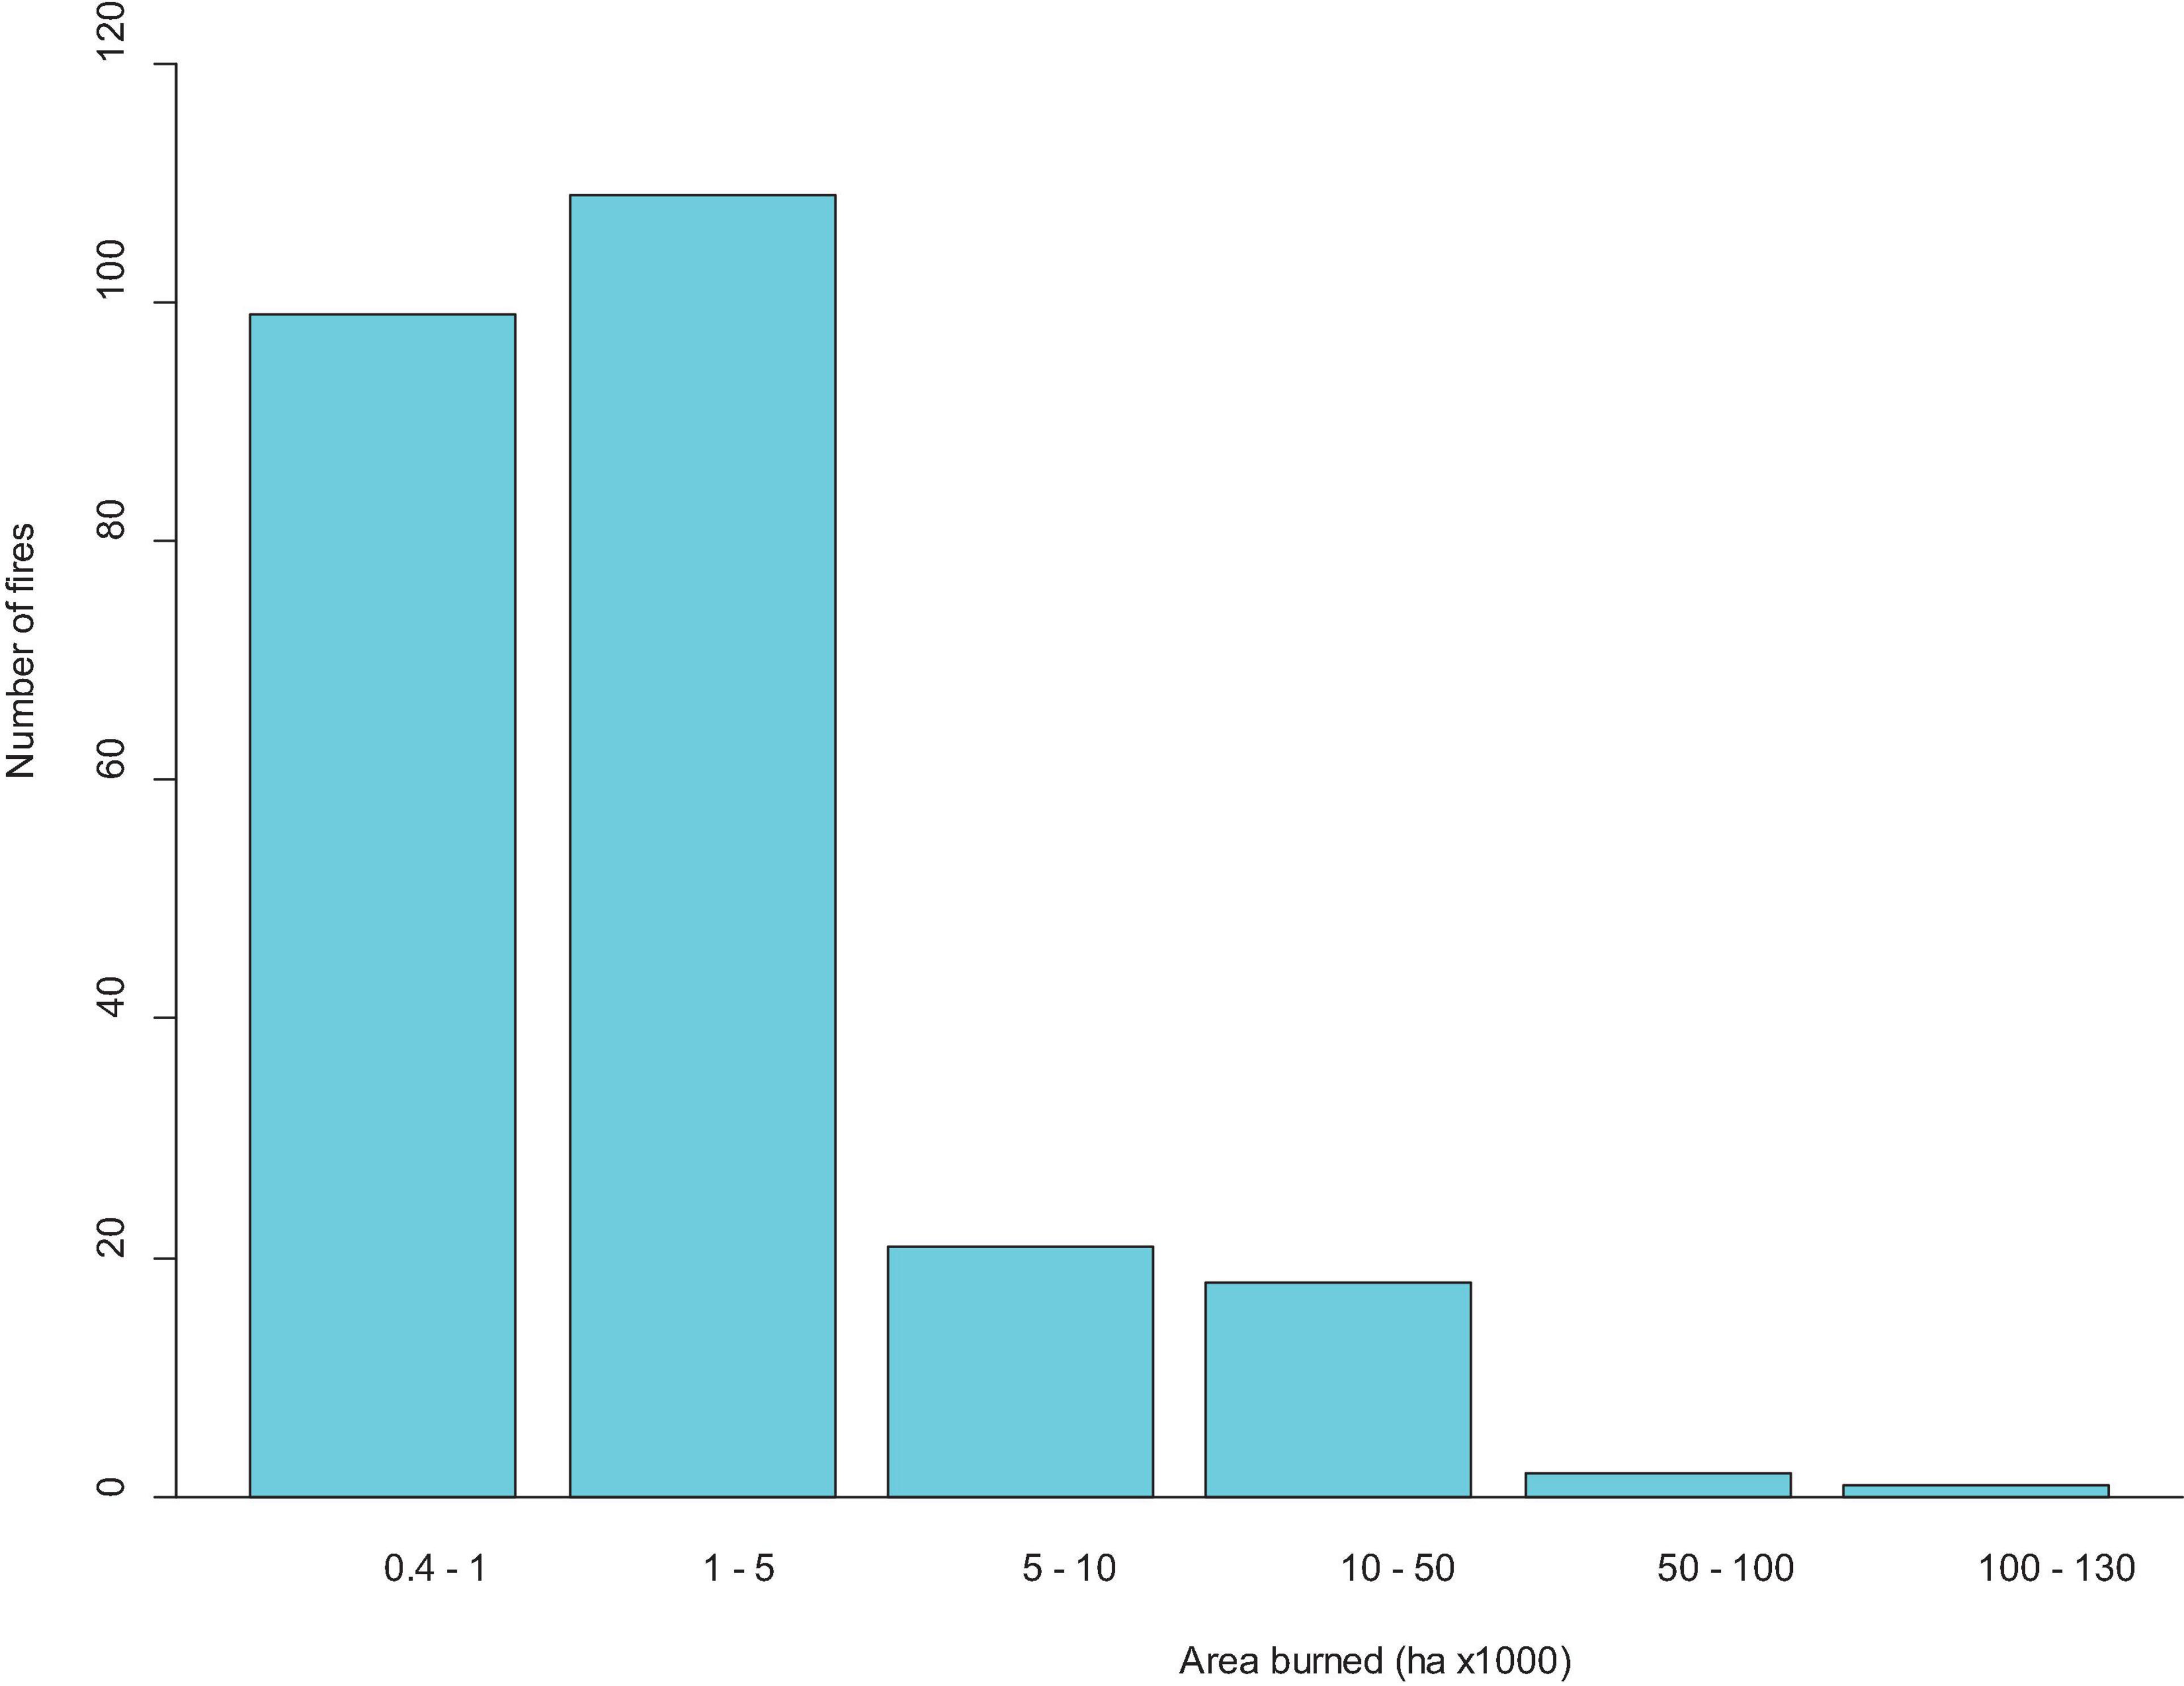
Figure 3. Distribution of the area within the perimeters of 250 wildfires that burned in the Mojave Desert of North America from 1972 through 2010.
The PPM that included the interaction between λf, spatial trend, and the second-order effect of elevation had complete support; it was the highest ranked model in each bootstrap sample (N = 200), wAIC = 1 in each sample, and none of the parameters overlapped zero (Supplementary Table 1). The model indicated clear structuring in the spatial distribution of the fires (Figure 4). There was a distinct increasing southwest to northeast trend for all three frequency classes, especially when fire frequency ≥ 2. An overwhelming majority of pixels that burned twice and virtually all that burned three or more times clustered in the Eastern subregion. Intensity of pixels that had burned once also clustered strongly in the Eastern subregion, but clusters of similar intensity occurred in mountain ranges in the Western, Southern, and Central subregions as well. Intensity of burned pixels peaked at mid-elevations for all three frequency classes (Figure 5). Fire occurred 1.4 and 2.7× more than expected in the high and mid elevation zones, respectively, but was 1.8× less than expected in the low elevation zone (Supplementary Table 2). Relative to the low elevation zone, fire was 3–5× greater in the high and mid elevation zones, respectively (Supplementary Table 2).
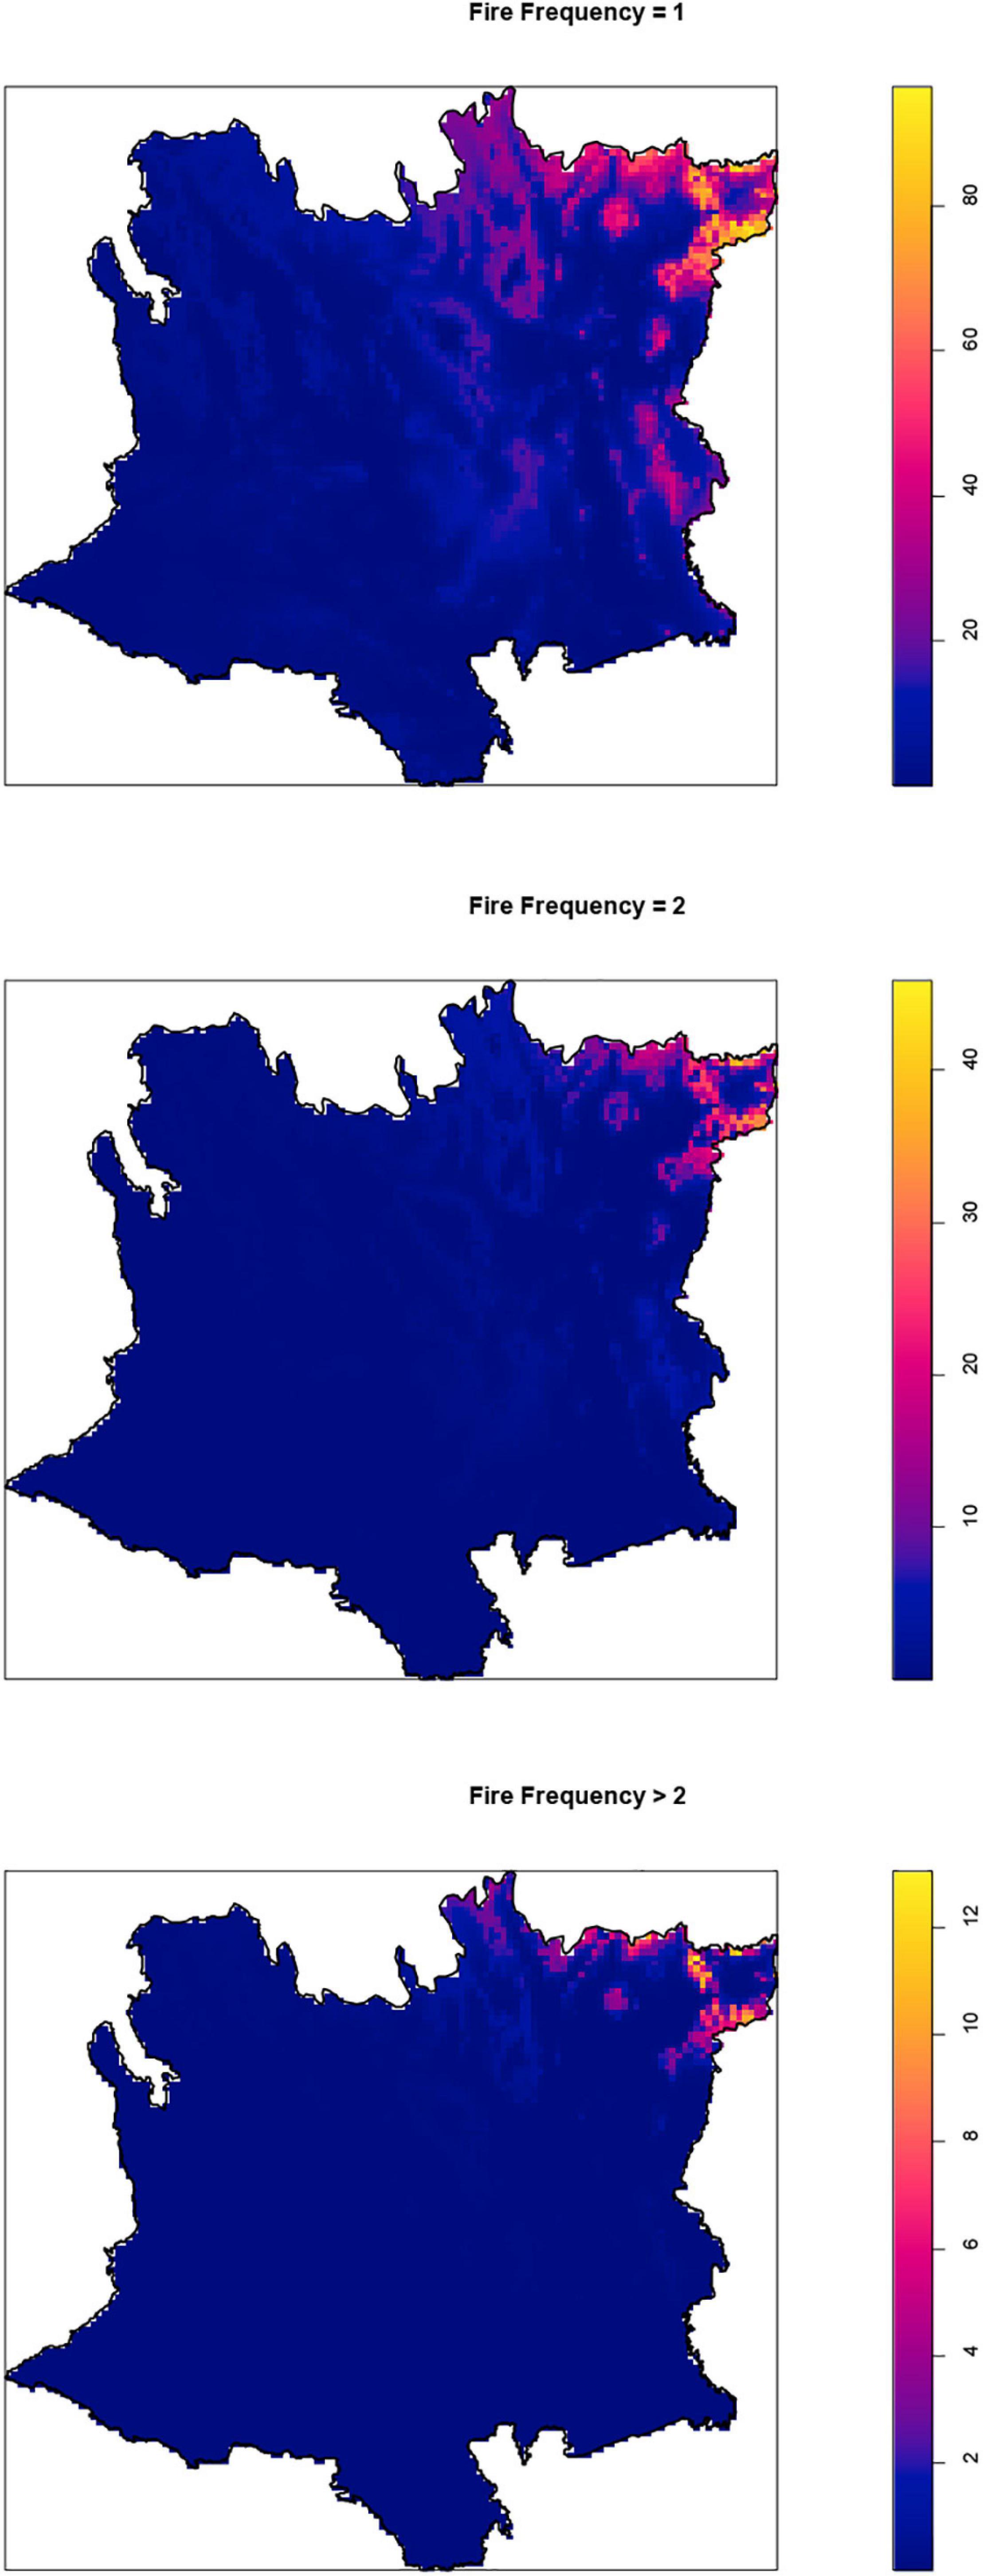
Figure 4. Predicted density of fire occurrence (number of burned pixels 100 km2) in three fire frequency classes (number of times burned from 1972 to 2010) in the Mojave Desert of North America. Density was estimated with a point process model of 250 wildfires.
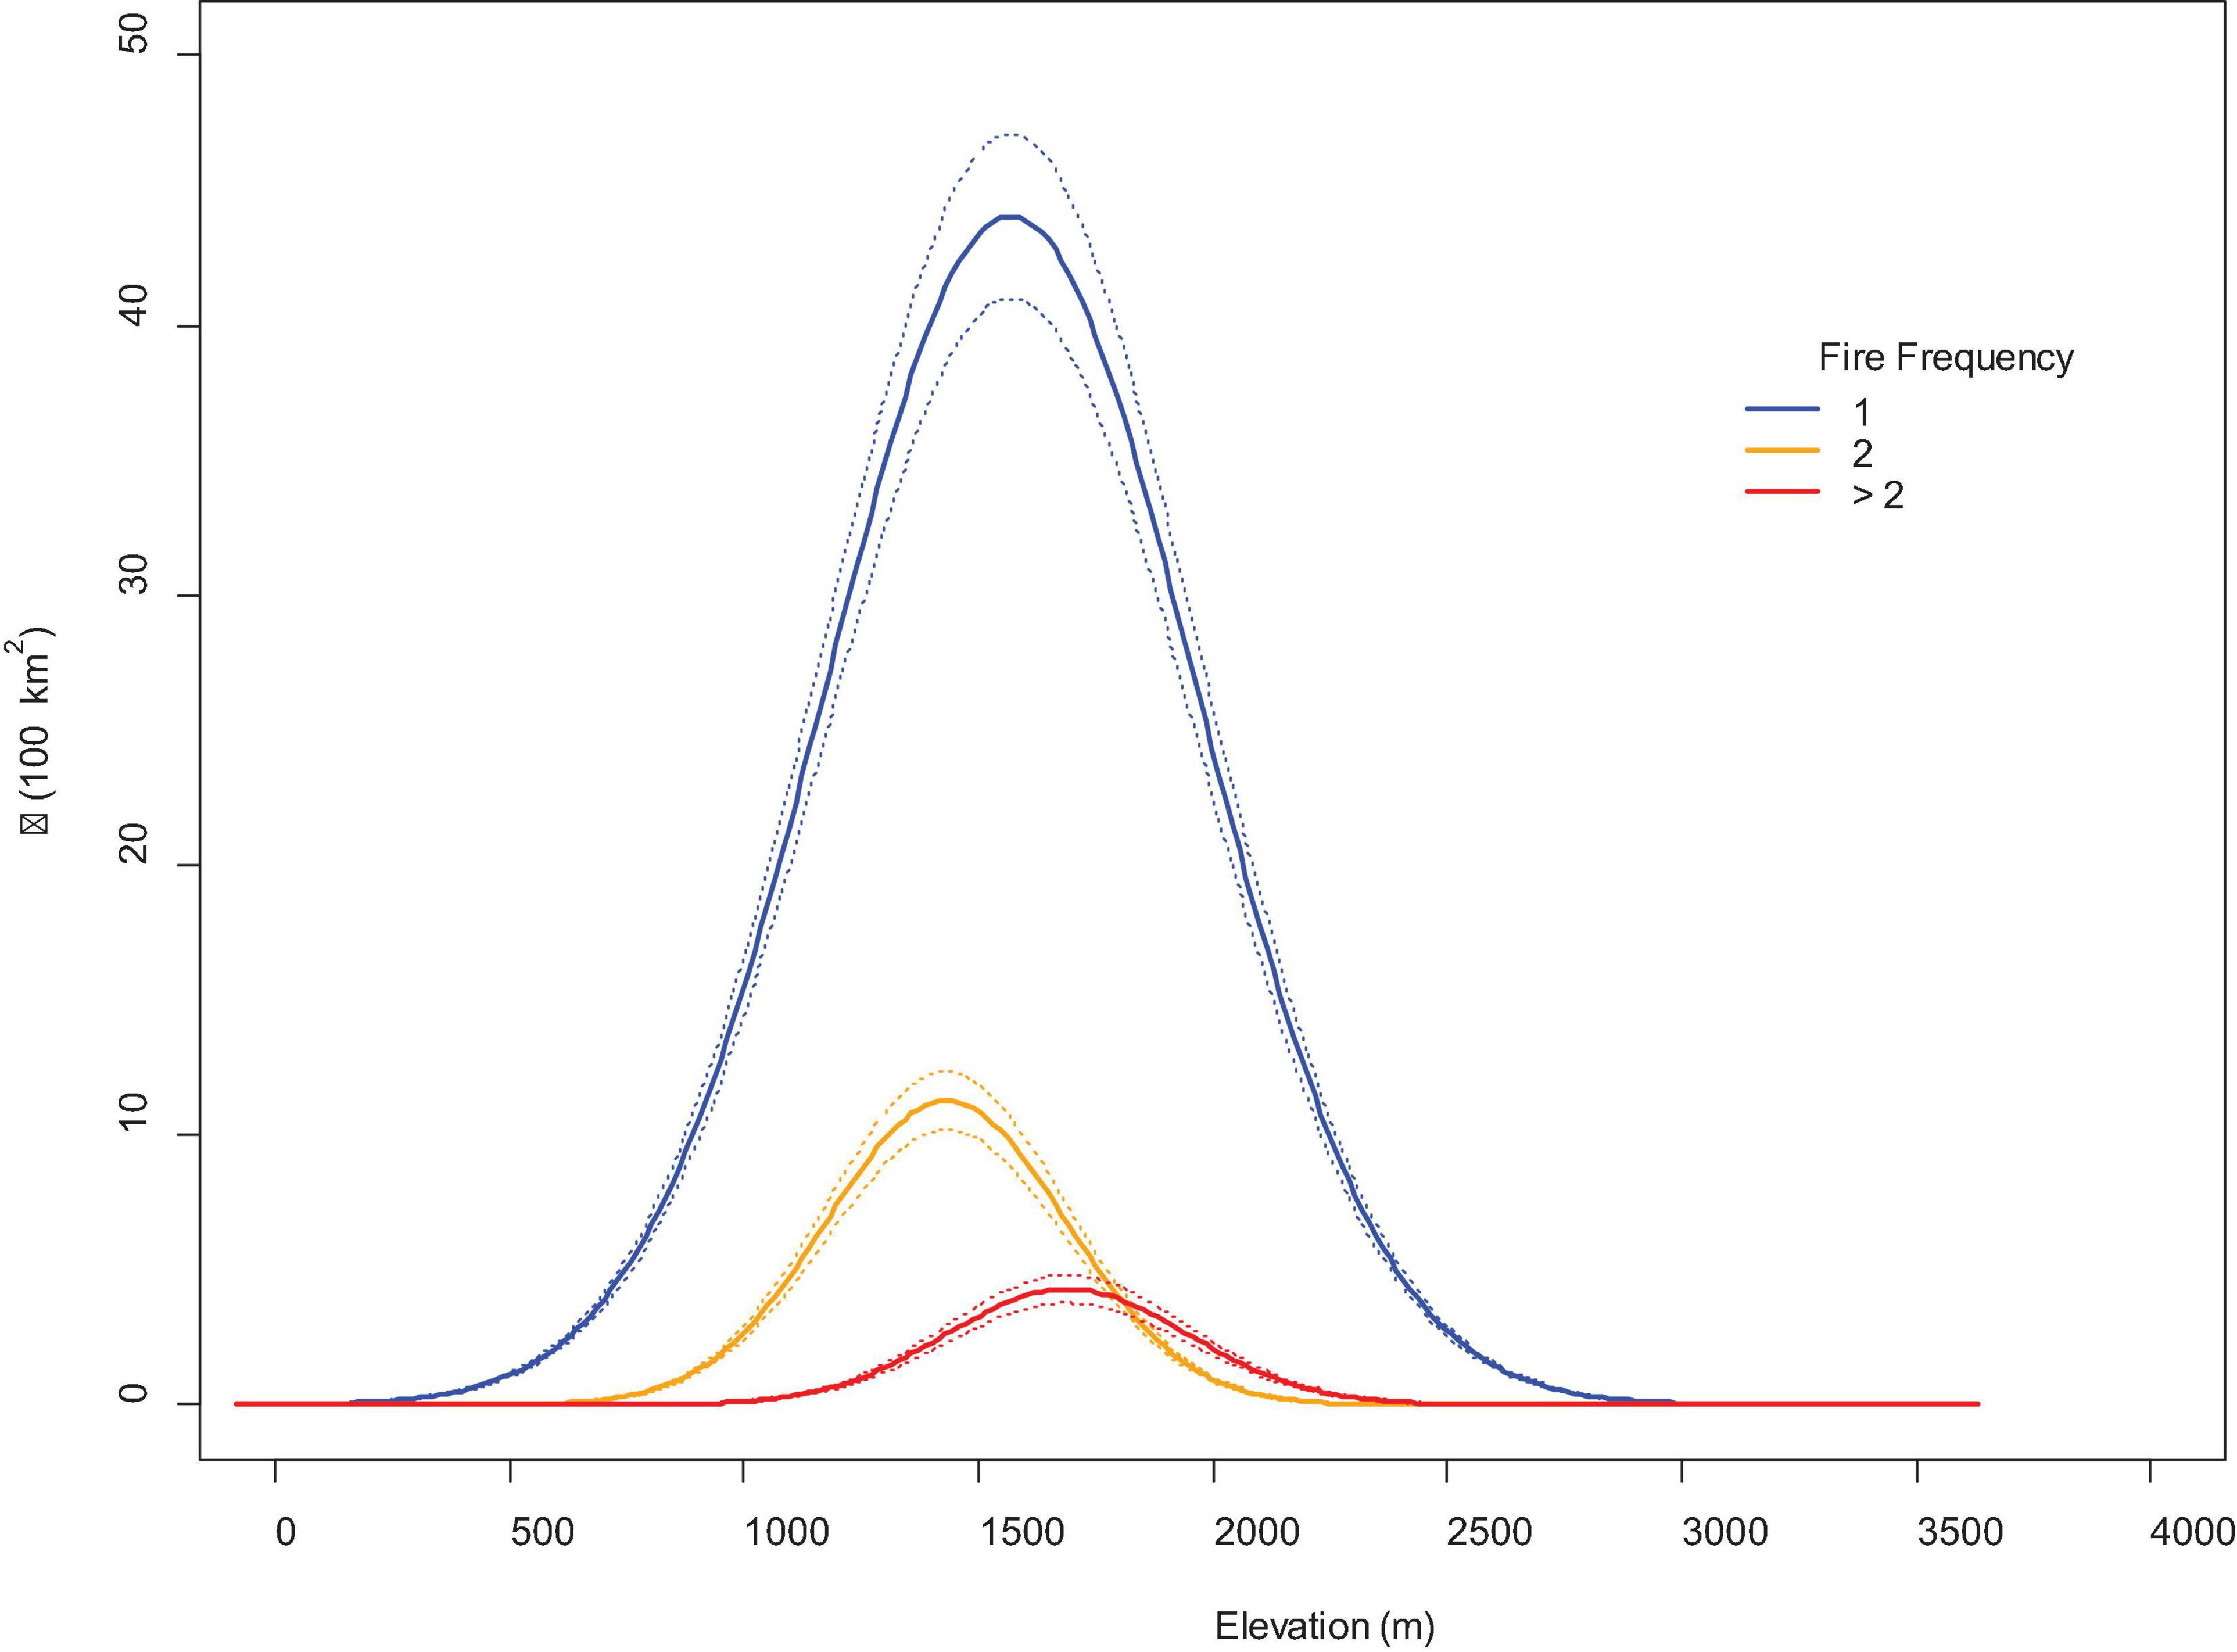
Figure 5. Density (λ; ± 95% CIs) of pixels in three classes of fire frequency (number of times burned from 1972 to 2010) along an elevation gradient in the Mojave Desert of North America.
Probability of Ignition
The AUC values were 0.967 (SD = 0.001) for the Maxent training data model and 0.964 (SD = 0.002) for the test data model (Supplementary Figure 1). Bromes, lightning, NDVI, and Schismus comprised 96% of the contribution to predictions in the training data model and 94% in the test data model (Supplementary Table 3). Bromes alone accounted for 63% of the contribution to predictions in both the training and test data (Supplementary Table 3). There was little measurable influence on either training or test gain when variables were individually removed from the models, but meaningful increases in both training and test gain occurred when Bromes, lightning, NDVI, or precipitation were the only variables in a model (Supplementary Table 3).
The pattern of predicted probability of ignition was one of high heterogeneity (Figure 6). A large portion (68%) of the Mojave had ignition probabilities > 0.20, but these areas varied in size and continuity throughout the region. Consistent with the variable importance rankings, values of probability of ignition were highest in the more mountainous parts of the region, especially in the East subregion (Figure 6). Other than the fringing mountain ranges, extensive parts of the West, Central and North subregions had low to moderate predicted values (Figure 6).
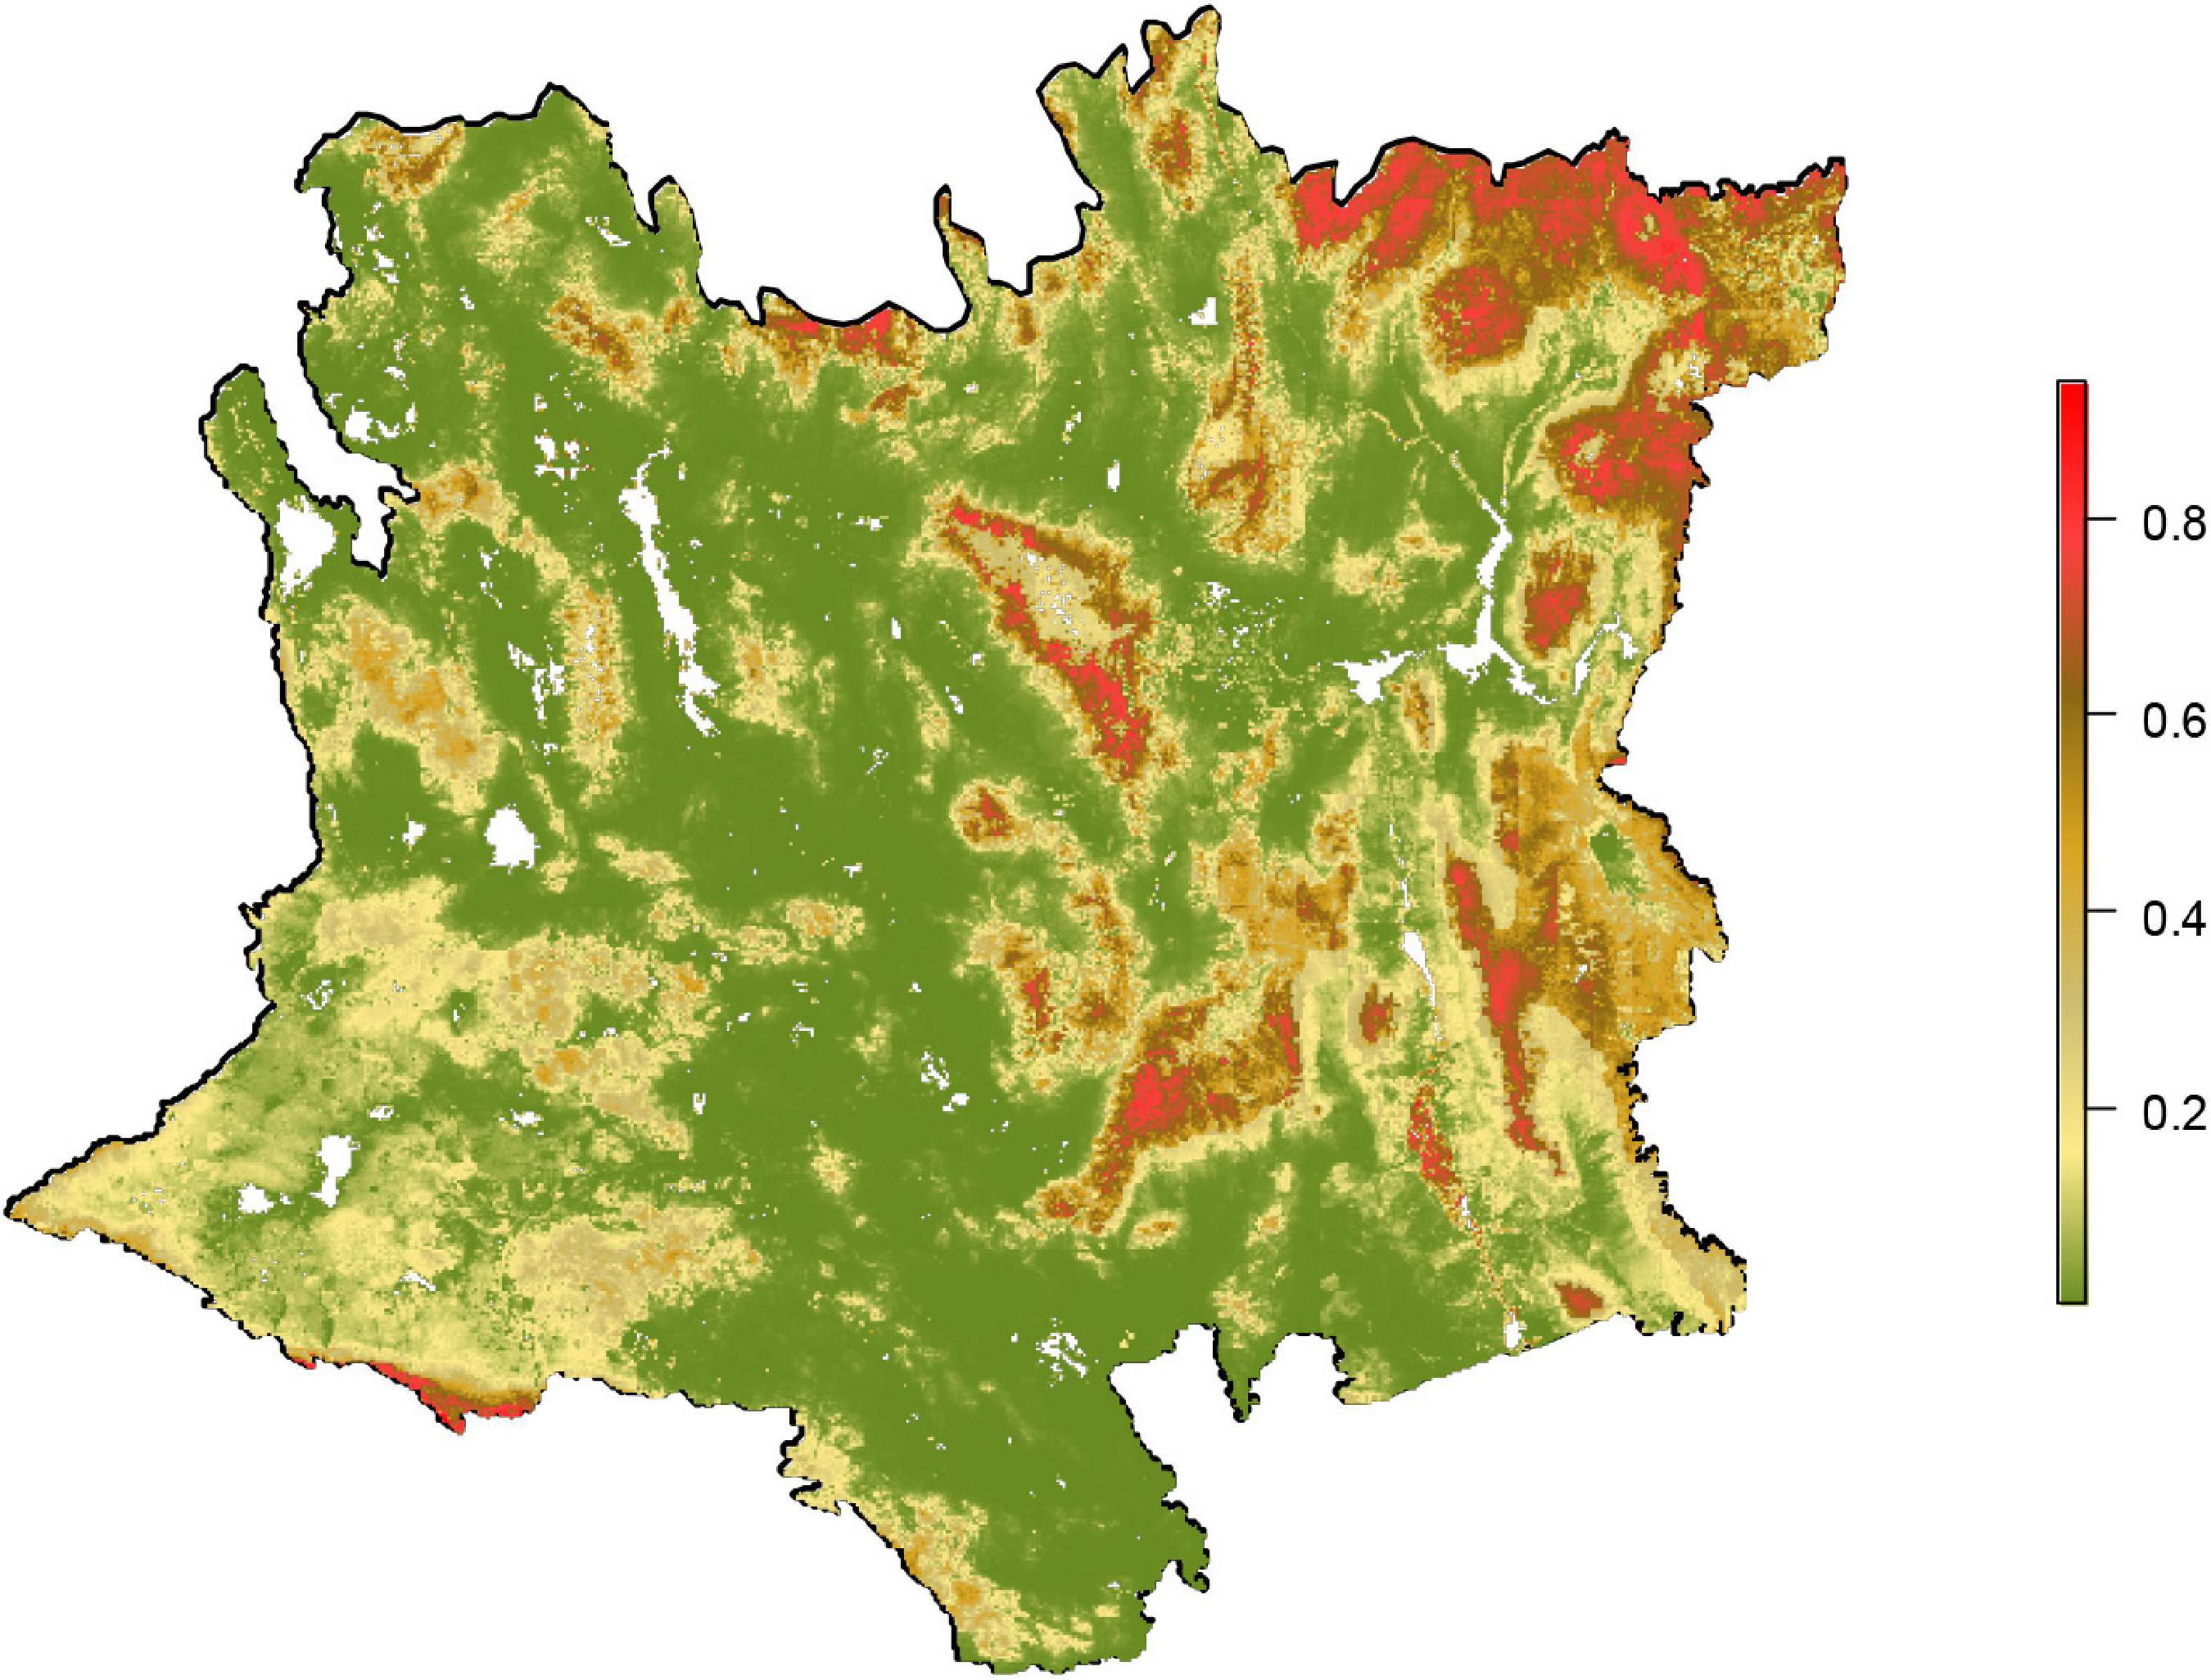
Figure 6. Predicted probability of ignition in the Mojave Desert of North America. Predicted values were derived from a Maxent model (AUC = 0.967 for a test dataset) with 10 variables representing variability in topography, climate, vegetation, and lightning. Because the model was based on background and not true absence data, the predicted values are proportional to true probabilities.
Fire Frequency
Tuning of the RF model of fire frequency resulted in 250 trees with 6 predictor variables at each split in the trees (Supplementary Figure 2A). Overall classification accuracy of the fire frequency classes was 0.851 for the training data and 0.842 for the test data. Classification accuracy in the training and test datasets > 0.92 for unburned and 1 burn classes and was approximately 0.80 for the >2 burn class (Table 3). Classification accuracy for 2 burns was the lowest of the four classes in both training and test datasets, with most misclassifications occurring in the 1 burn class (Table 3).
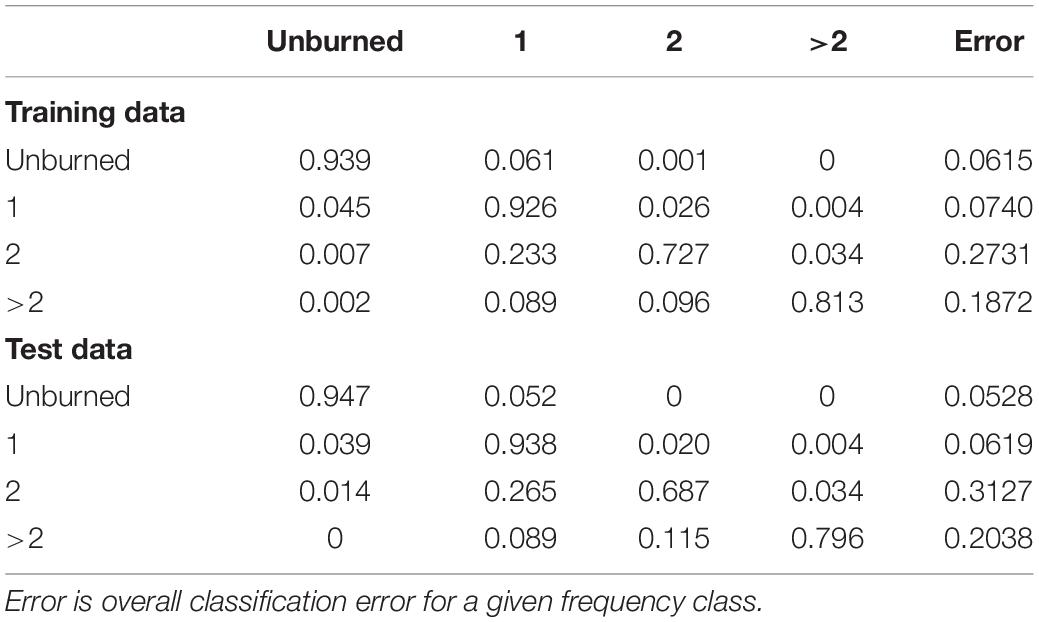
Table 3. Confusion matrix of the proportional classification accuracy for four fire frequency classes (number of fires from 1972 to 2010) in the Mojave Desert of North America.
Seven of the predictor variables had markedly more importance than the remaining three (Figure 7): proportion of monsoon precipitation, Bromes, lightning strikes, NDVI, elevation, total annual precipitation, and Schismus. None of the predictor variables had negative values, but the three with the lowest importance were all topographic variables (Figure 7). The 10-fold cross validation indicated that there was little difference in mean-squared error for models with ≥4 predictor variables (Supplementary Figure 3), therefore we selected a final model consisting of the test data and the seven predictor variables with the highest importance values. Pairwise AUC values for the predicted fire frequency classes were all ≥0.885 (Supplementary Table 4), with overall AUC = 0.963.
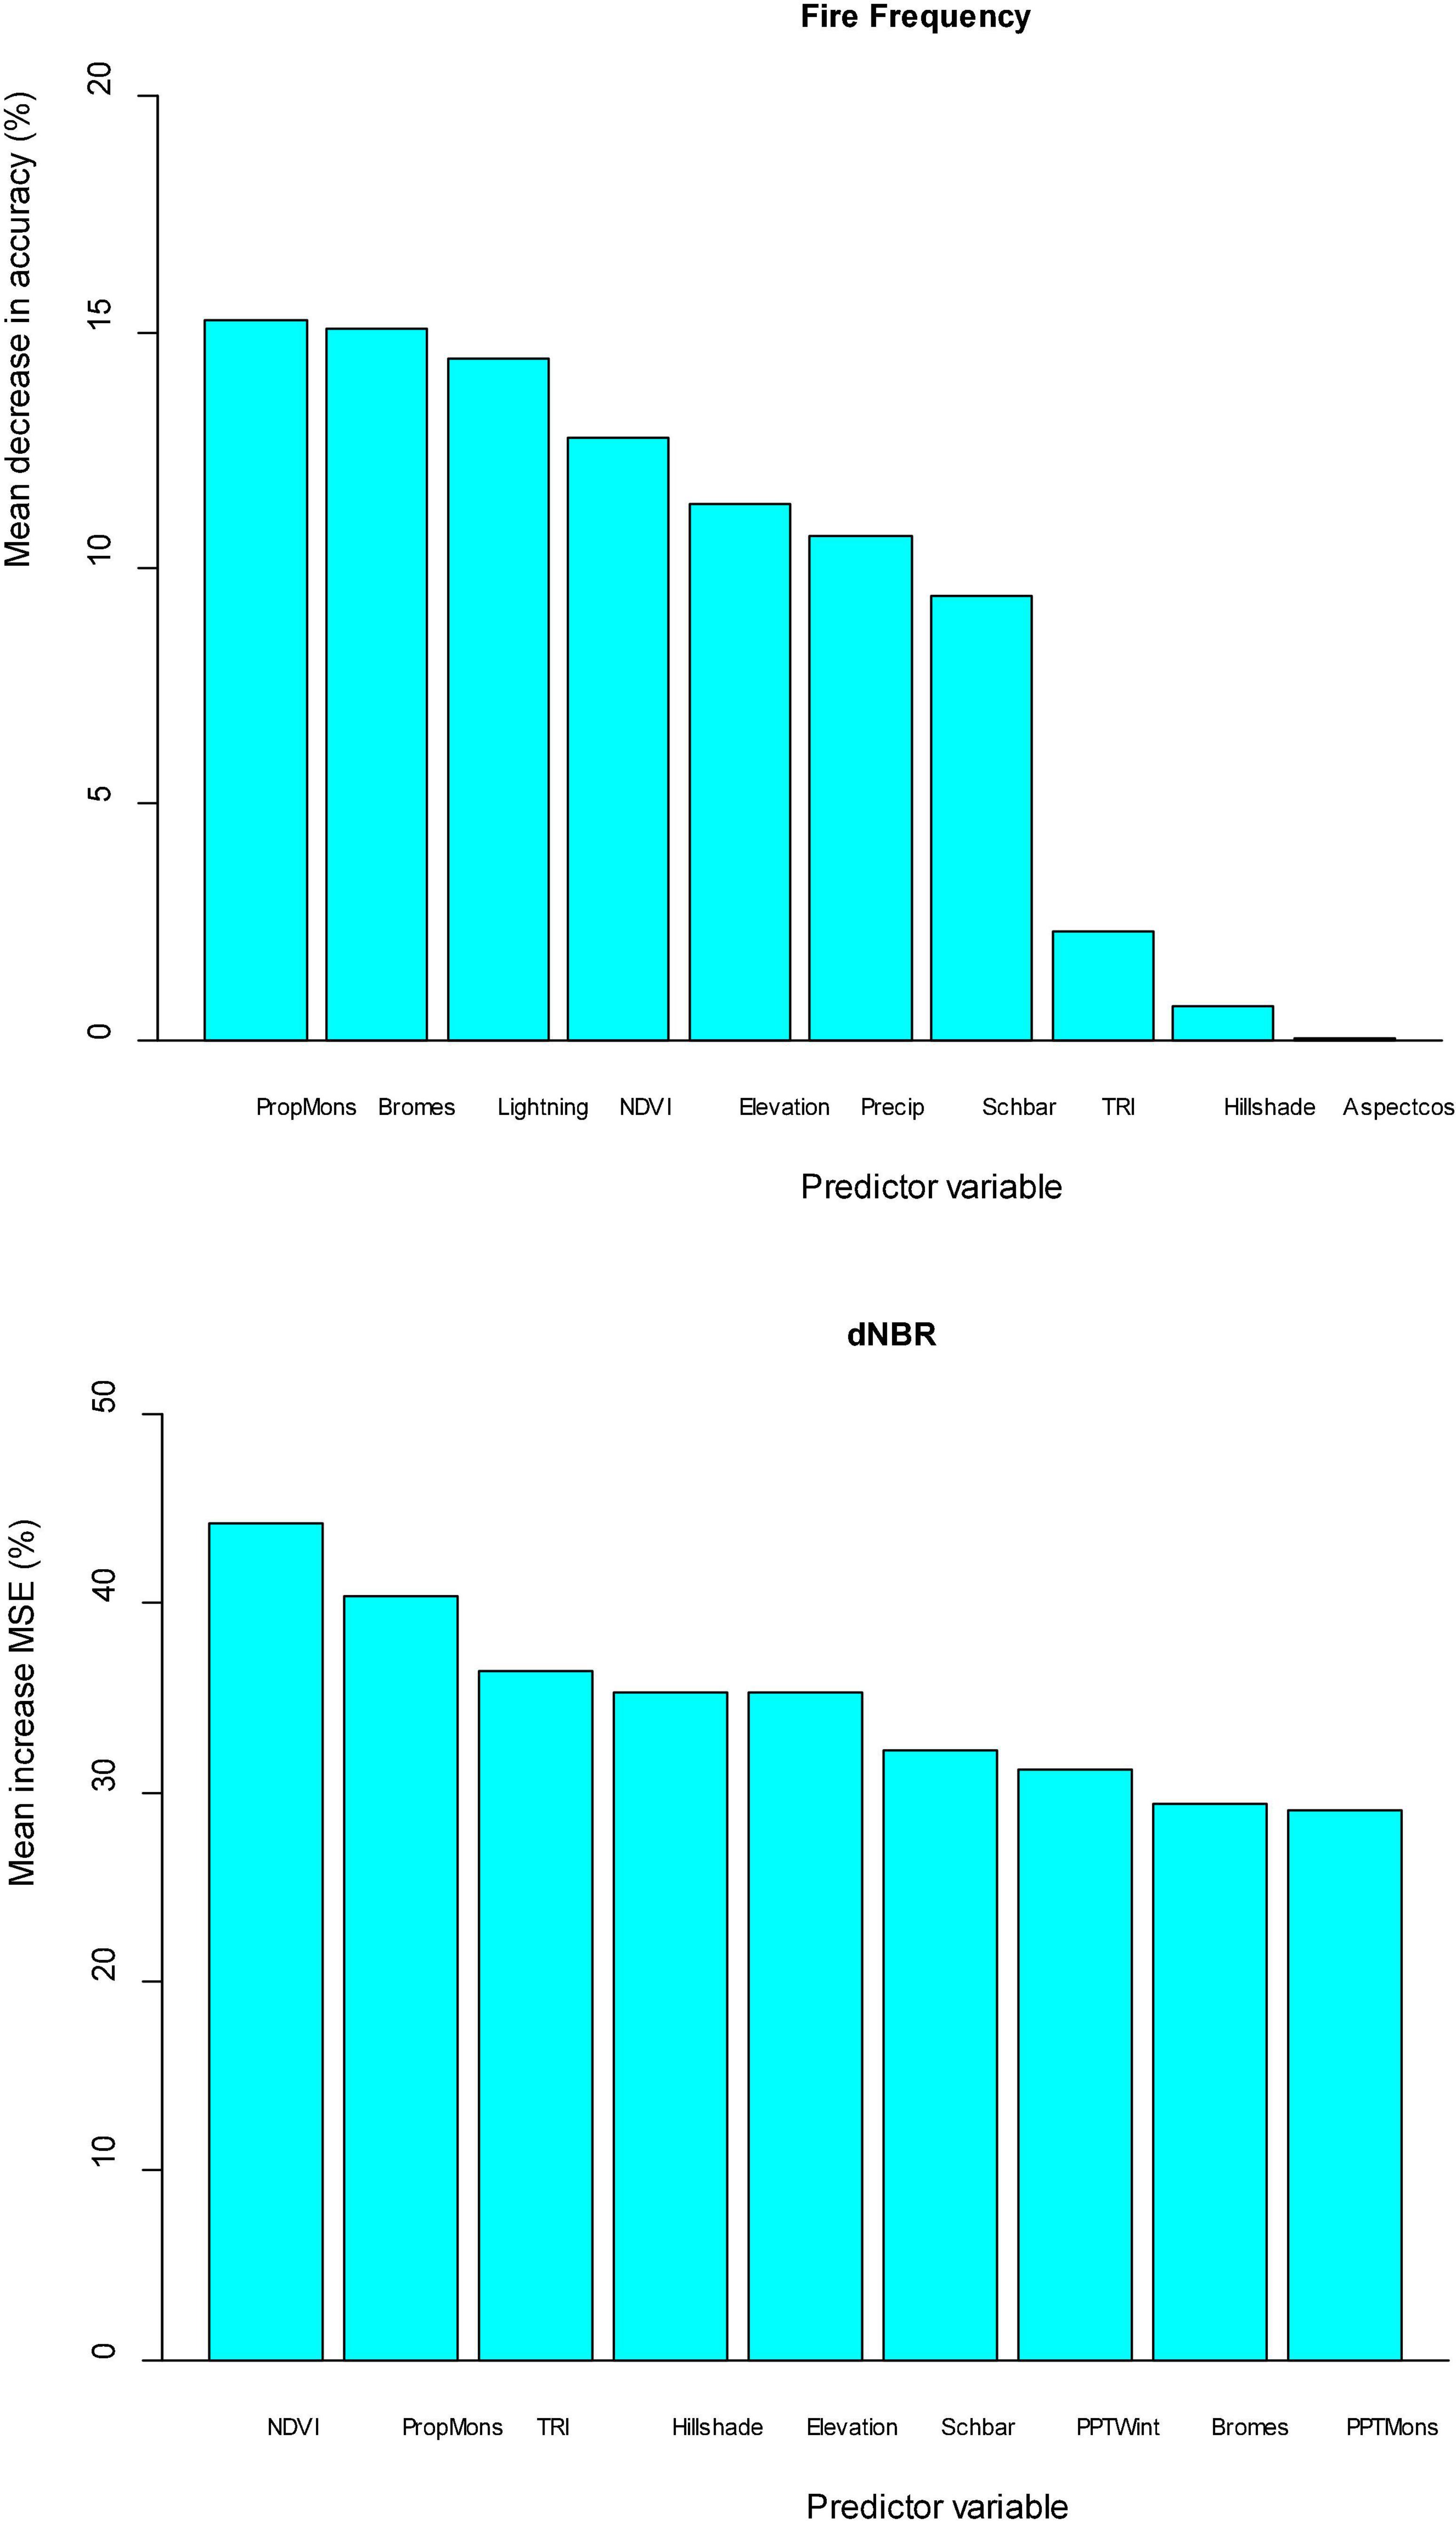
Figure 7. Relative importance values of predictor variables in Random Forest models of fire frequency (number of times burned 1972–2010) and burn severity (dNBR) in the Mojave Desert of North America. Full names and definitions of predictor variables are given in Table 1.
Fire frequency was predicted to be highly heterogenous throughout the Mojave (Figure 8). Notably, many areas where frequency was predicted to be high had not actually burned since at least 1972. This resulted in the area predicted to be susceptible to burning being considerably greater than what actually occurred between 1972 and 2010 (compare Figures 2, 8). Although areas predicted to have high fire frequency occurred patchily throughout the region, large areas where fire frequency >1 were clustered primarily in the East subregion (Figure 8).
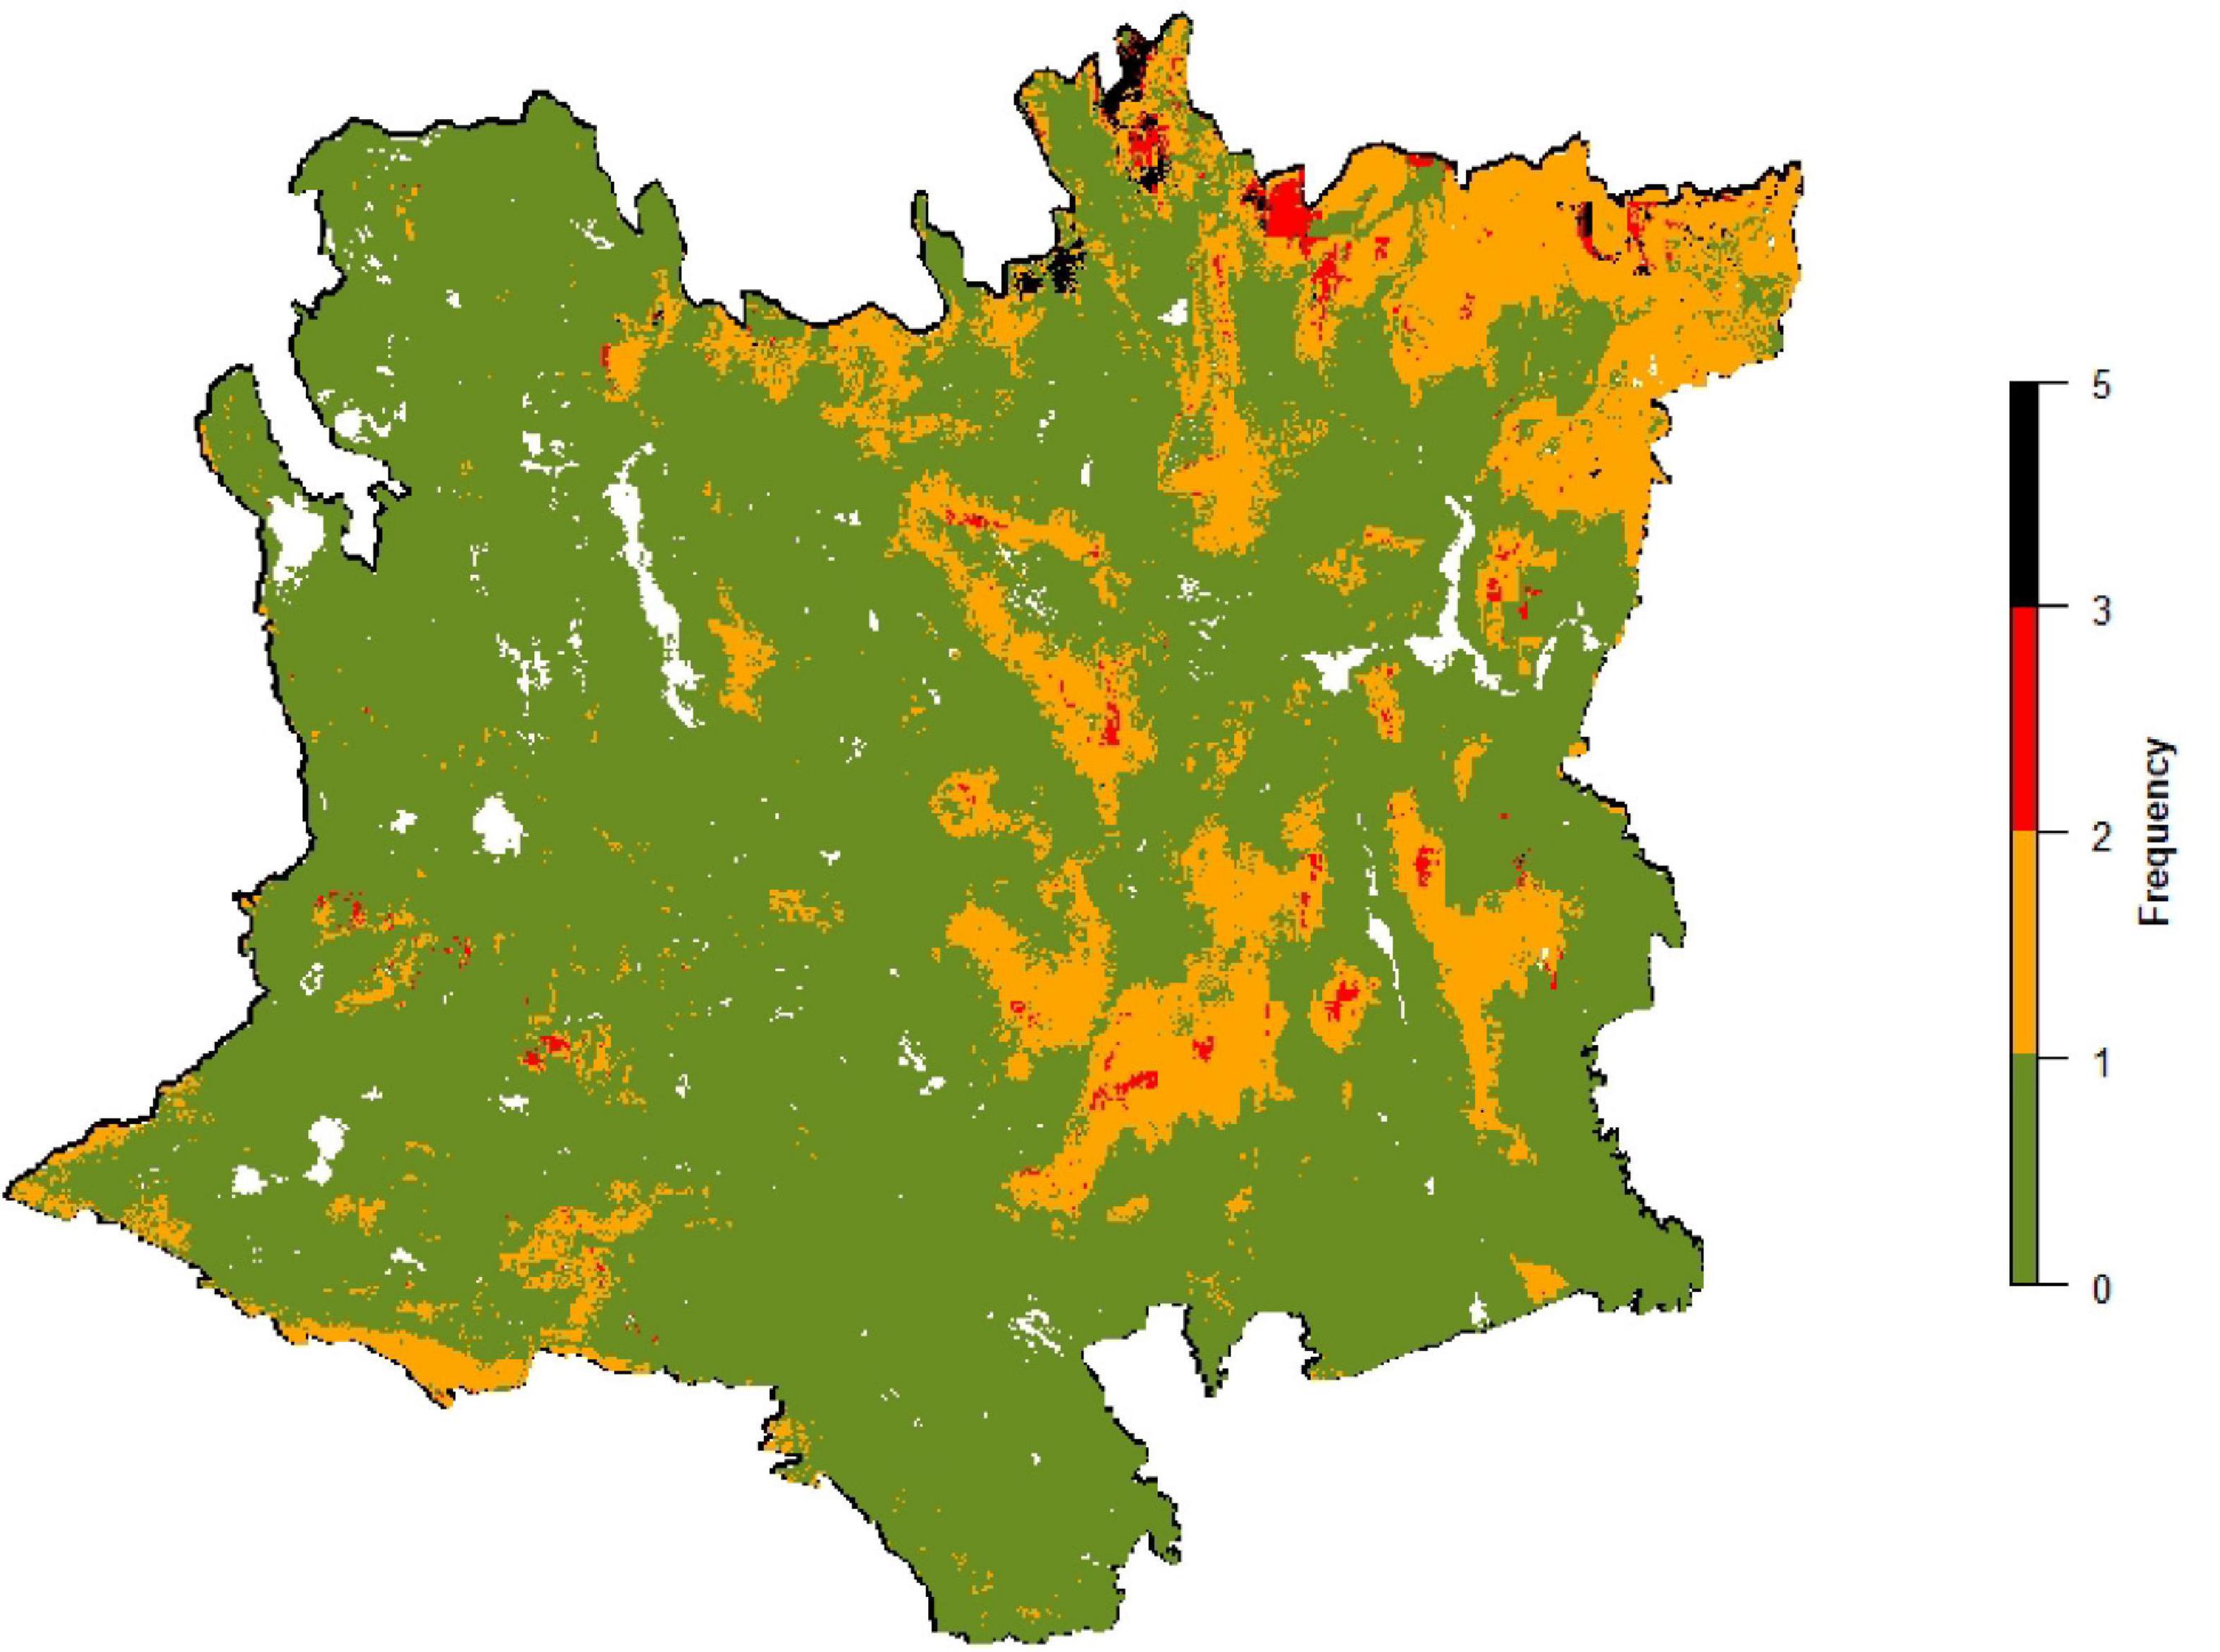
Figure 8. Predicted distribution of fire frequency (Unburned, 1, 2, and >2) resulting from large wildfires in the Mojave Desert of North America. Predictions were derived from a Random Forest model with 10 variables representing variability in topography, climate, vegetation, and lightning.
Burn Severity
Tuning of the RF model of dNBR resulted in 250 trees with 3 predictor variables at each split in the trees (Supplementary Figure 2B). Pseudo-R2 values were higher for models that included variables from the topography, climate, and vegetation groups as opposed to models where variables from one of the groups were omitted (Supplementary Table 5). The importance value for aspect in the initial model runs was negative, therefore it was removed from subsequent model runs. The remaining variables all increased prediction success, with NDVI and the proportion of monsoon precipitation having the highest importance values (Figure 7).
The mean differences between observed and predicted dNBR values were −3 in the training dataset and −4 in the test dataset (median = −7 in both training and test datasets). Proportionally, the mean differences were within 6% of the actual values (median = −3% in both training and test datasets). Half of the predicted values occurred between −39 and 30 in the training dataset and 38 and 30 in the test dataset (Supplementary Figure 4); proportionally this was equal to being within −24 to 14% of actual values in both training and test datasets (Supplementary Figure 5). 95% of the predicted values were between −91 and 107 in the training dataset and −90 and 99 in the test dataset; proportionally this was equal to being within −68 to 33% of actual values in both the training and test datasets.
Approximately 75% of the Mojave was predicted to have low to moderate levels of burn severity (Table 4 and Figure 9). Higher levels of dNBR were predicted to occur principally in mountainous parts of the region, especially in the North subregion (Figure 9).
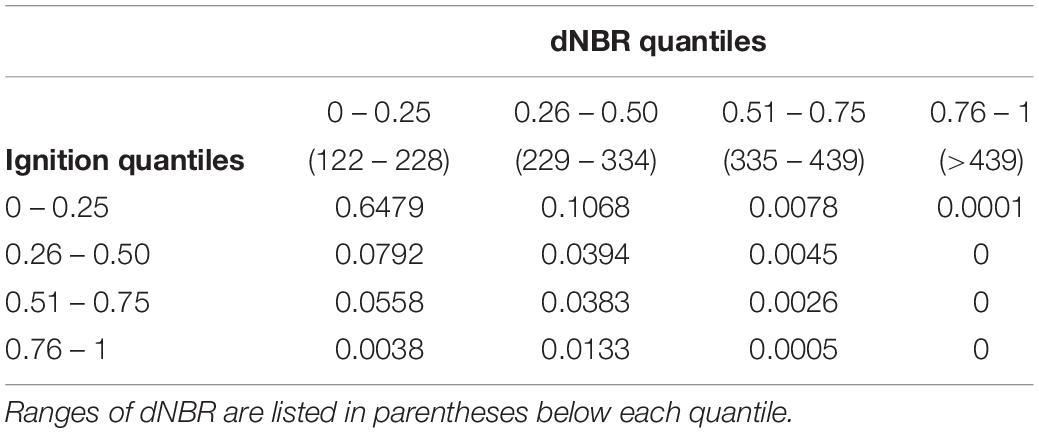
Table 4. Proportion of area in the Mojave Desert in combinations of predicted quantiles of burn severity (difference normalized burn ratio; dNBR) and ignition probability.
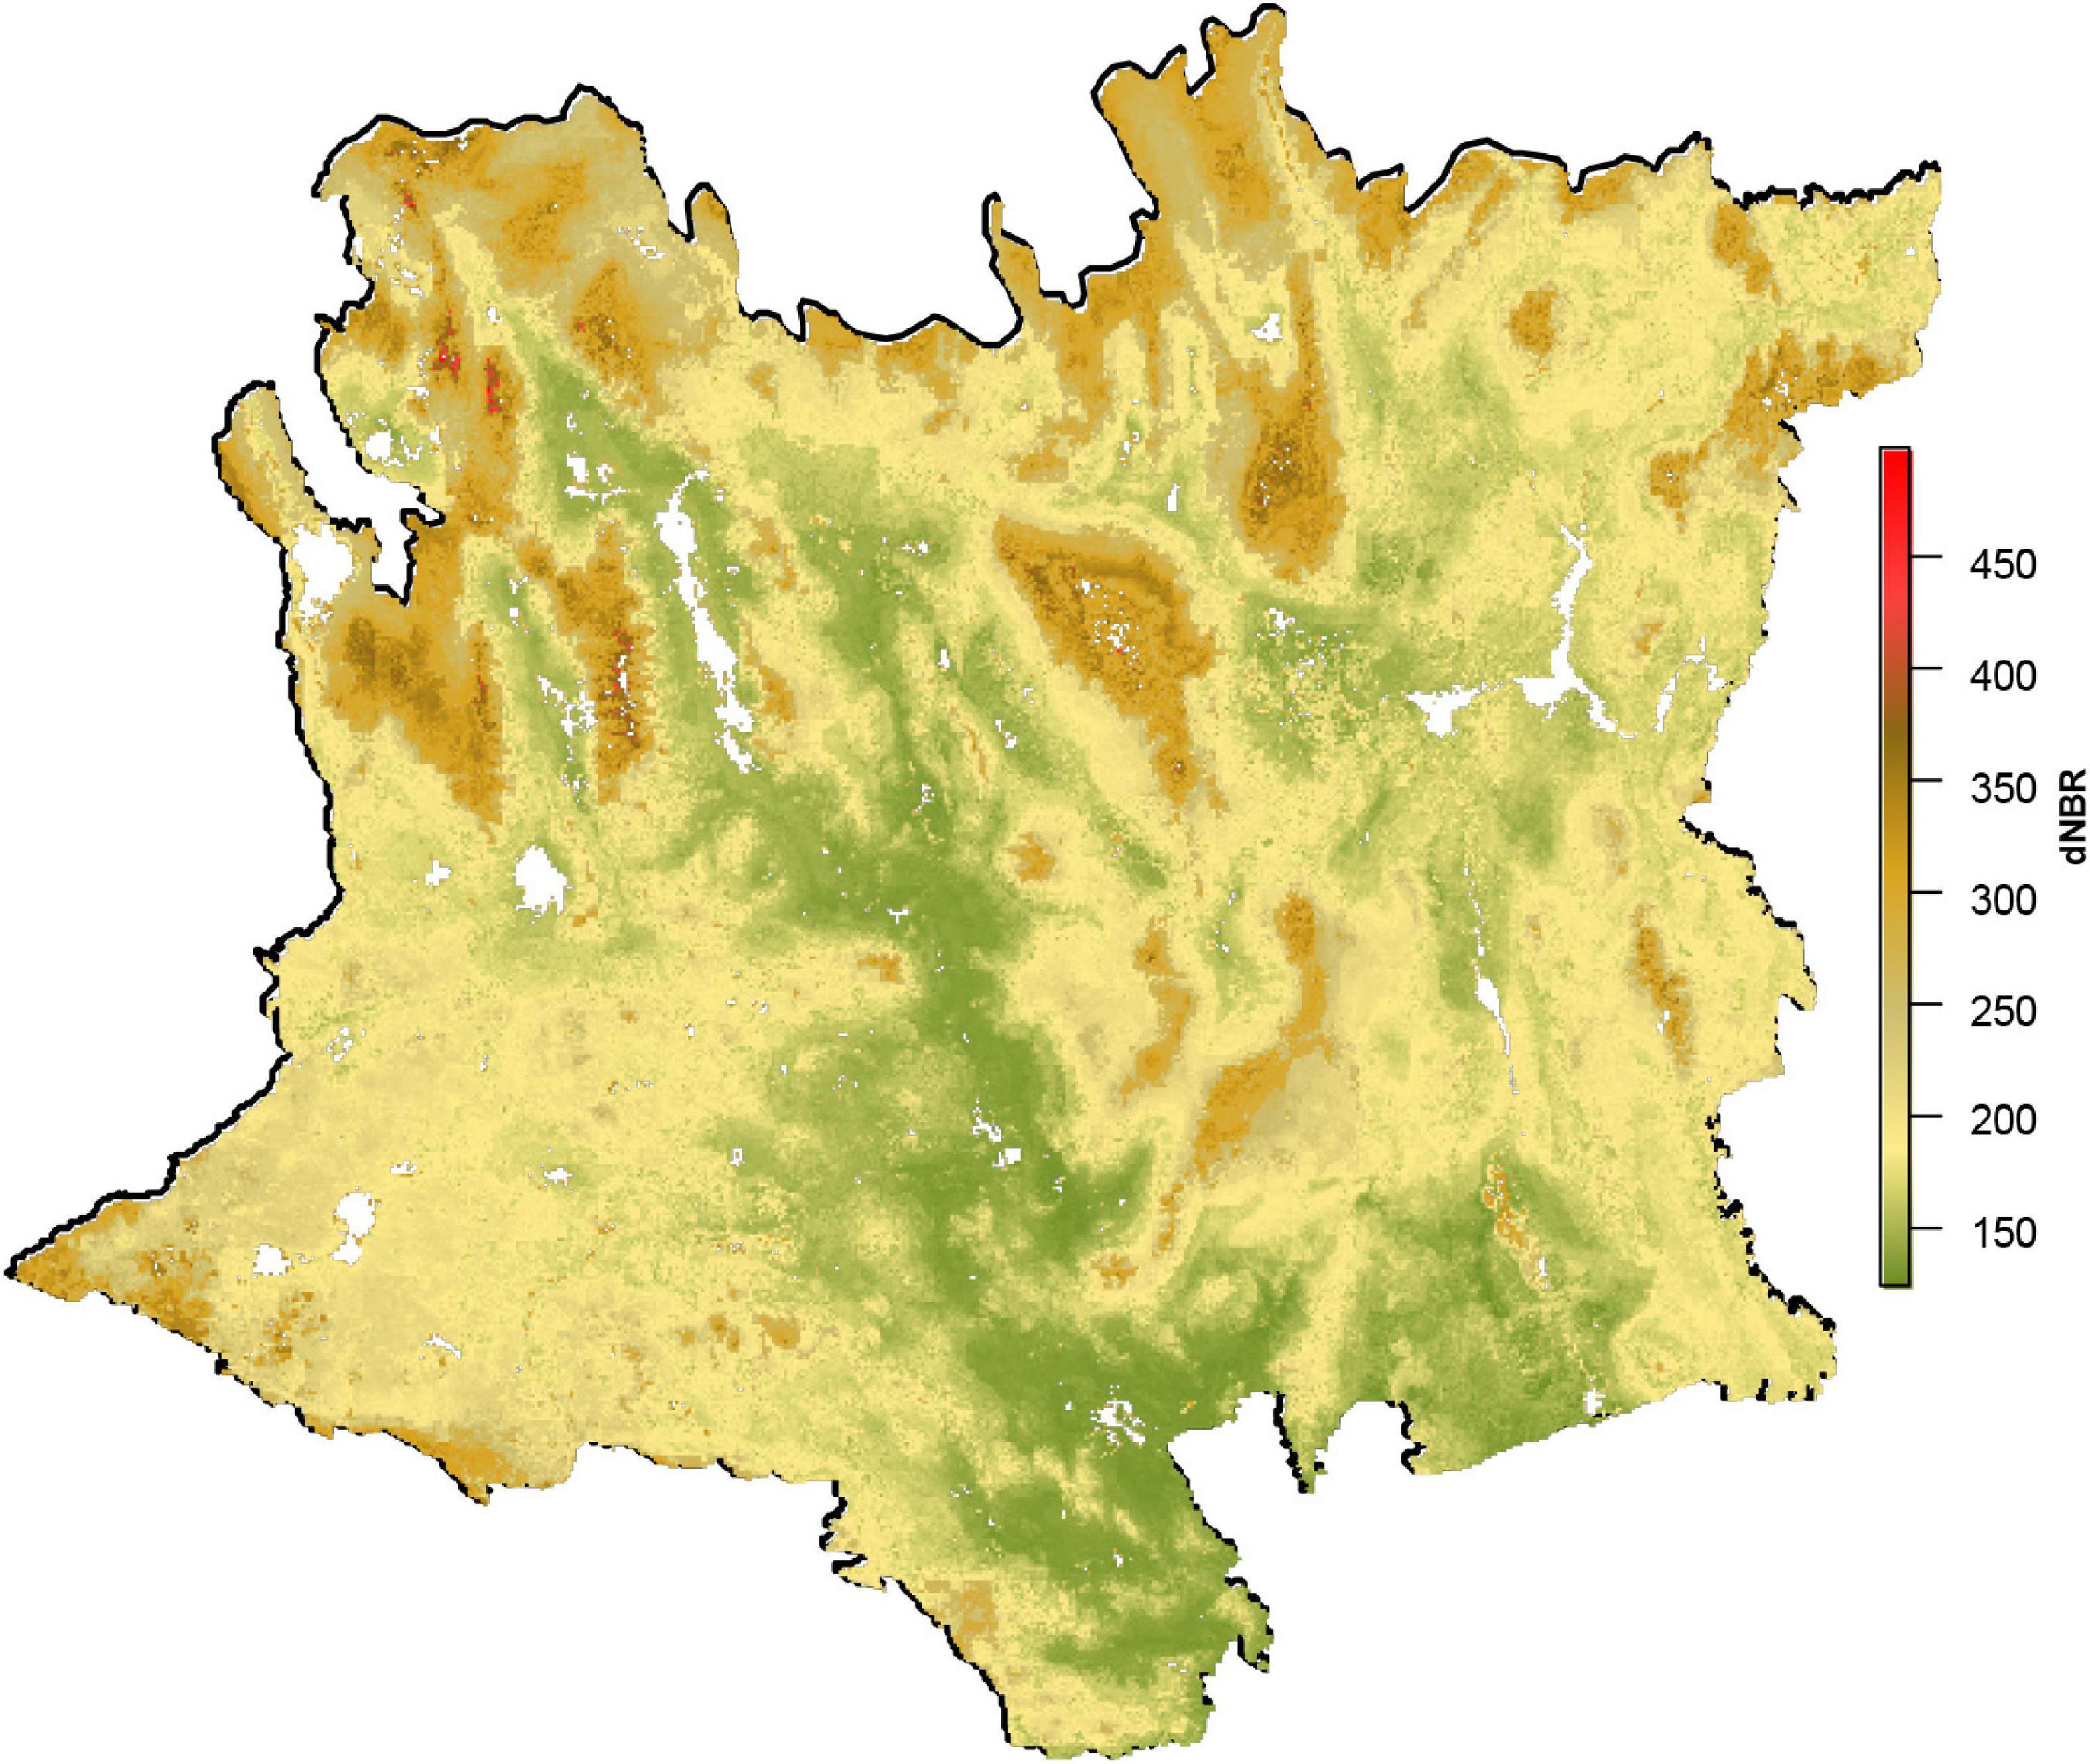
Figure 9. Predicted values for an index of burn severity (difference normalized burn ratio; dNBR) in the Mojave Desert of North America. Predictions were derived from a Random Forest model with 9 variables representing variability in topography, climate, and vegetation.
Associations Among Burn Severity, Probability of Ignition and Fire Frequency
There was a moderately high level of correlation between probability of ignition and fire frequency (r = 0.785). Mean probability of ignition in the 1-burn frequency class was 0.082 (SE = 0.005), while those in the 2-burn and >2-burn classes were 0.450 and 0.648, respectively (SE = 0.005 and 0.007).
Almost two-thirds of the Mojave was predicted to have low fire frequency and burn severity (Table 4). Areas with moderate to high predicted burn severity comprised 11.5% of the area of the Mojave when probability of ignition was low (quantile = 0–0.25; Table 4). This was 2.5× greater than the proportion of area when probability of ignition was in a moderate range (quantile = 0.26–0.50; Table 4). Areas where probability of ignition and burn severity were predicted to be high comprised <1% of the region, and areas where probability of ignition and burn severity were predicted to be very high were virtually non-existent (Table 4).
The PPMs indicated that probability of ignition and dNBR had distinctly different spatial trends (Supplementary Table 6). The sign of the coefficients for longitude differed between ignition probability and dNBR, as did those for the interaction of longitude and the two highest quantiles of ignition and dNBR (Supplementary Table 6). Density of ignitions had an increasing southwest to northeast spatial trend, especially for the highest quantile of predicted values (Figure 6 and Supplementary Table 6). In contrast, there was a strong increasing southeast-to-northwest trend in dNBR (Figure 9). Overlap in areas where there were higher predicted values of ignition and dNBR occurred principally in the North subregion and several of the interior mountain ranges (Figures 6, 9).
The subregions differed in their positions in ordination space (PERMANOVA F = 122.31, df = 5, P = 0.001). The Tukey HSD test pointed toward most differences resulting from separation of the Northern and Eastern subregions from the others (Supplementary Table 7). The Southcentral and Central subregions also differed from one another, but there was no meaningful divergence among them and the West subregion (Supplementary Table 6). The dispersion test indicated that heterogeneity in variance contributed to differences among the subregions (F = 130.88, df = 5, P = 0.001). This was also apparent in the RDA, where the 95% confidence ellipses of the Northern and Eastern subregions were markedly larger than those in other subregions (Figure 10). The first RDA axis accounted for 71% of the variation among the subregions (P = 0.001) and represented a gradient in dNBR, while the second axis represented a gradient in ignition. The 95% confidence ellipses overlapped among the subregions but the ellipses for their SEs were completely separate. In tandem with the dispersion test, this indicated that the subregions differed in both location and variance. The first axis separated the East, West, and North subregions from the others, with the East having lower dNBR and higher ignition probability values than the West and North subregions (Figure 10). The other subregions had lower values for both probability of ignition and dNBR.
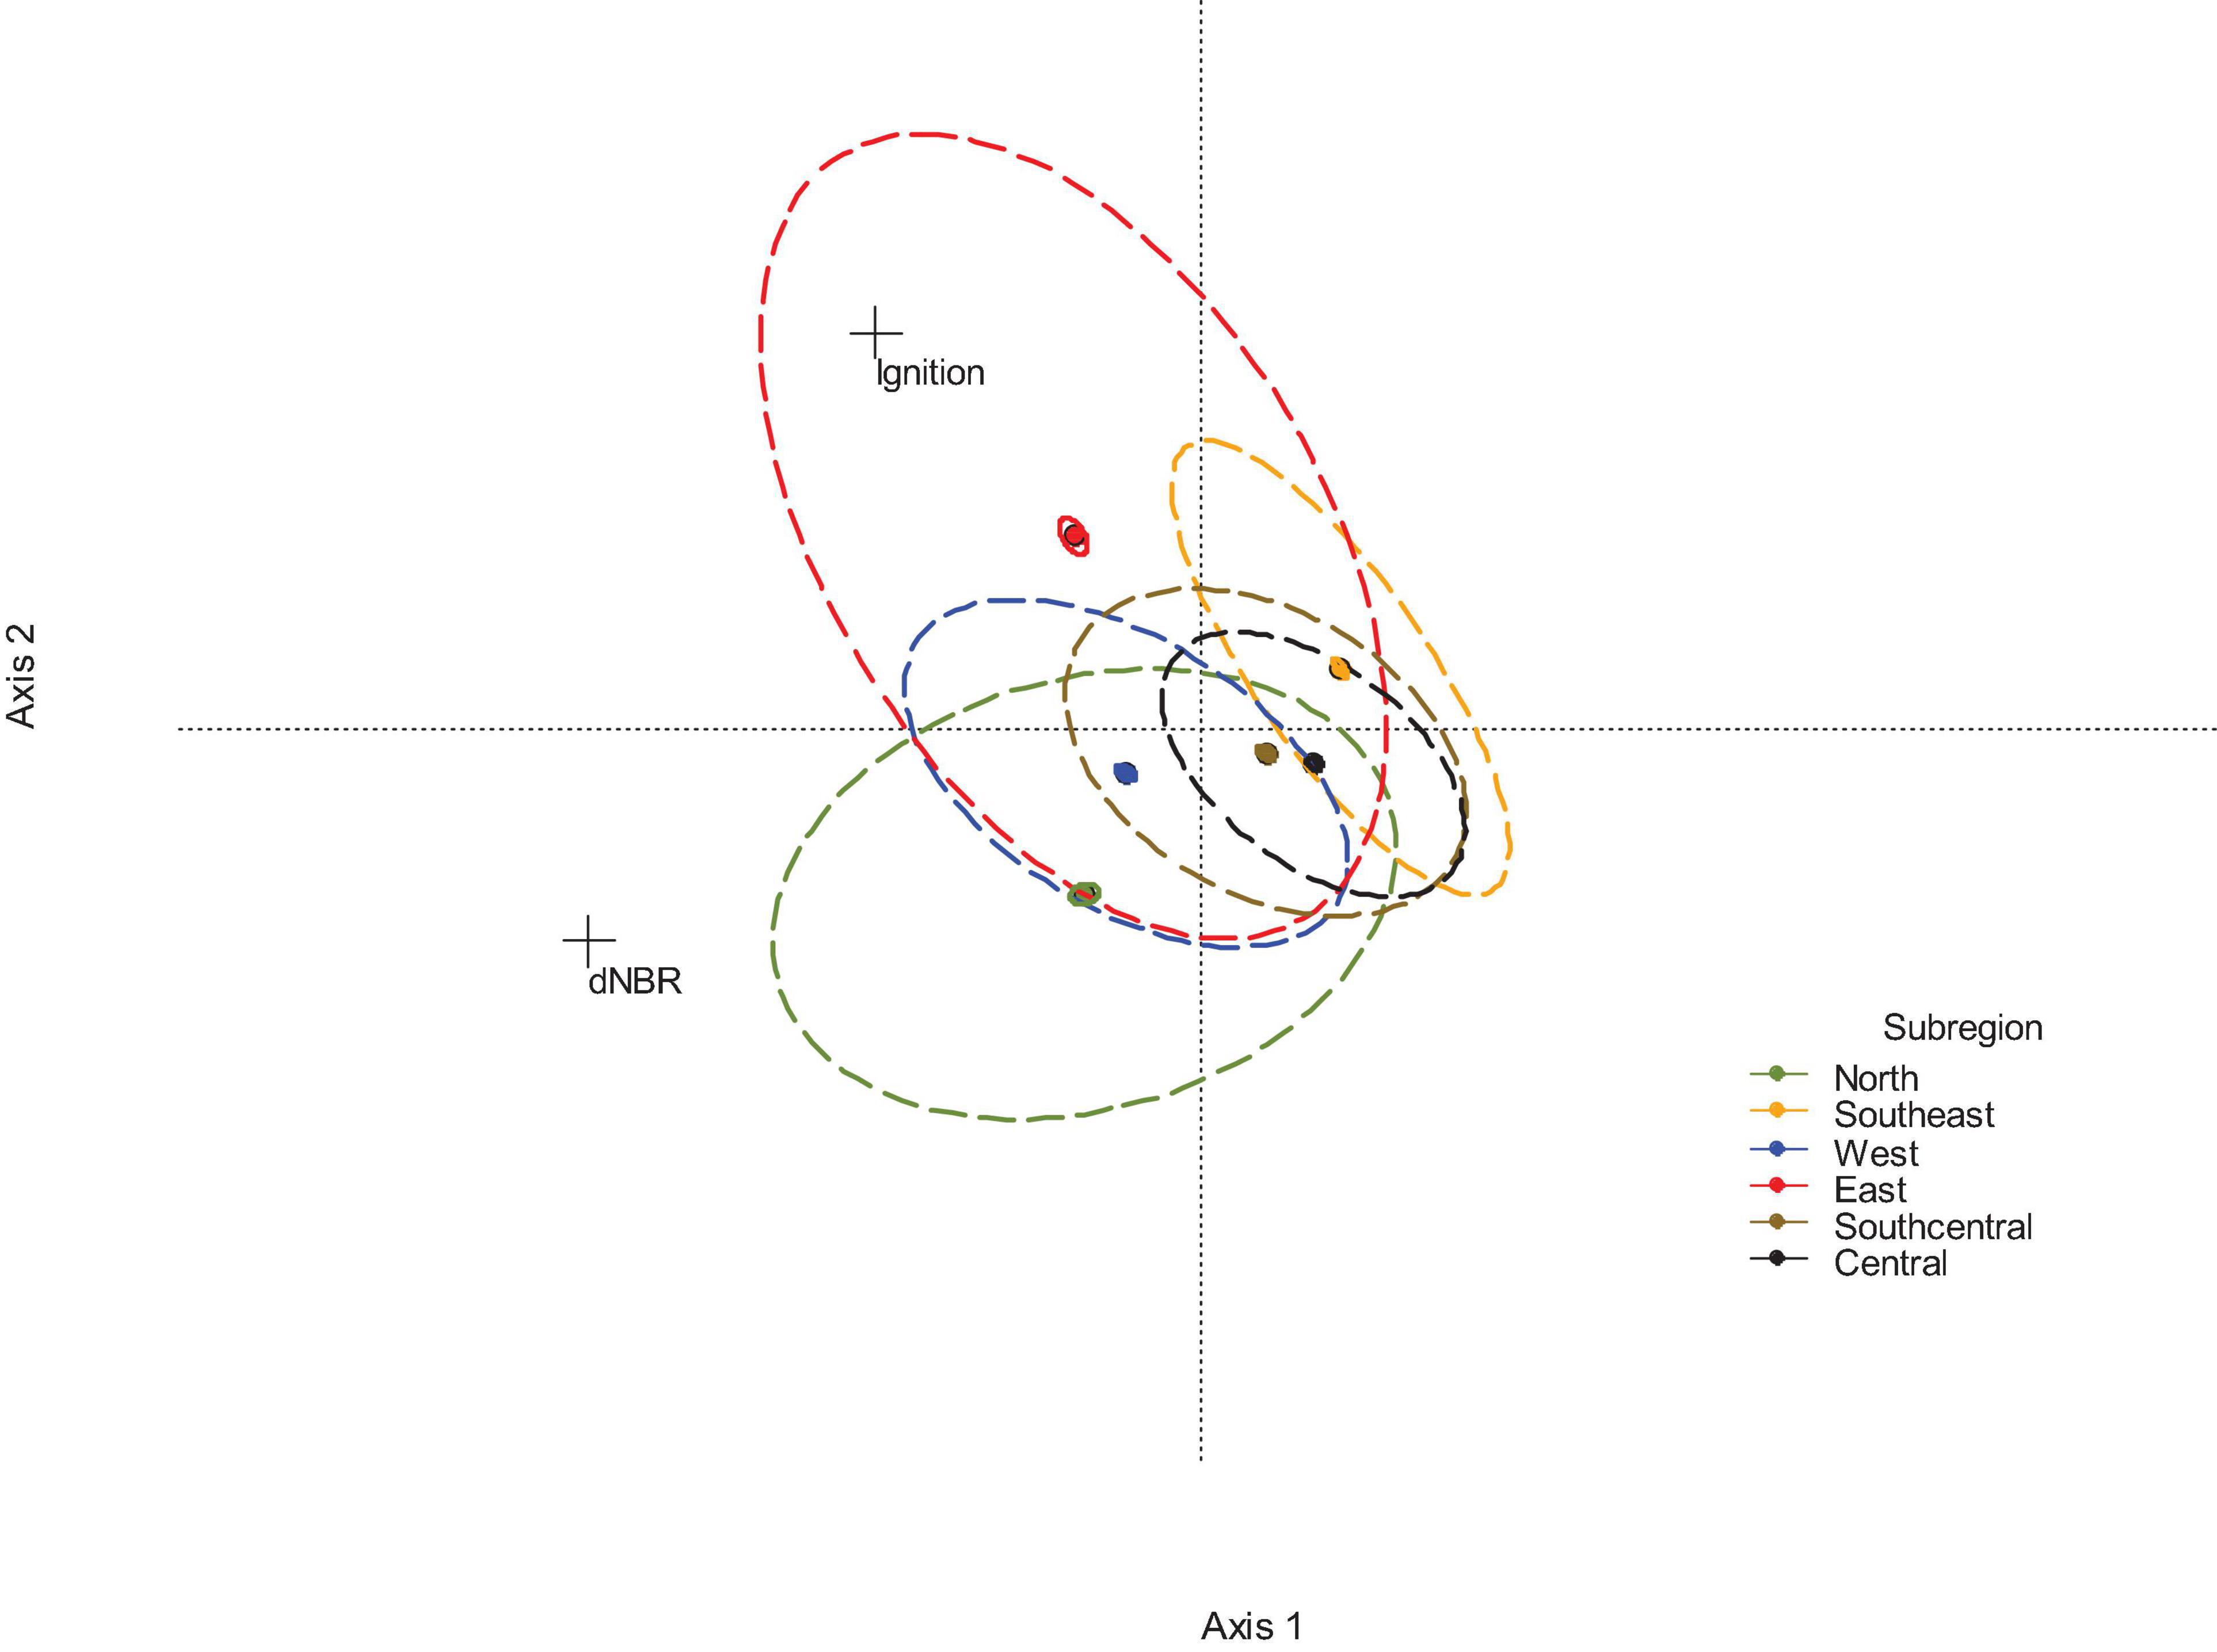
Figure 10. Centroids and ellipses of SEs (solid lines) and 95% confidence bounds (dashed lines) for six subregions of the Mojave Desert along gradients of predicted burn severity (difference normalized burn ratio; dNBR) and probability of ignition. The centroids and ellipses were derived from a Redundancy Analysis with 500 randomly selected points in each subregion from which values of dNBR and ignition probability were extracted. Monte Carlo permutation tests (N = 999) and Tukey HSD contrasts indicated the subregions differed in both location (centroids) and dispersion (variance).
The OLS model accounted for 79% of the variation in dNBR due to the interactive influences of fire frequency and elevation (Supplementary Table 8). Predicted values of dNBR were consistently higher in the 1-burn class than the 2-burn and >2-burn classes, though the differences were larger at lower and mid elevations than at higher elevations (Figure 11). dNBR values in the 1-burn and 2-burn classes increased monotonically with elevation, while those in the >2-burn class peaked at mid-elevations (Figure 11).
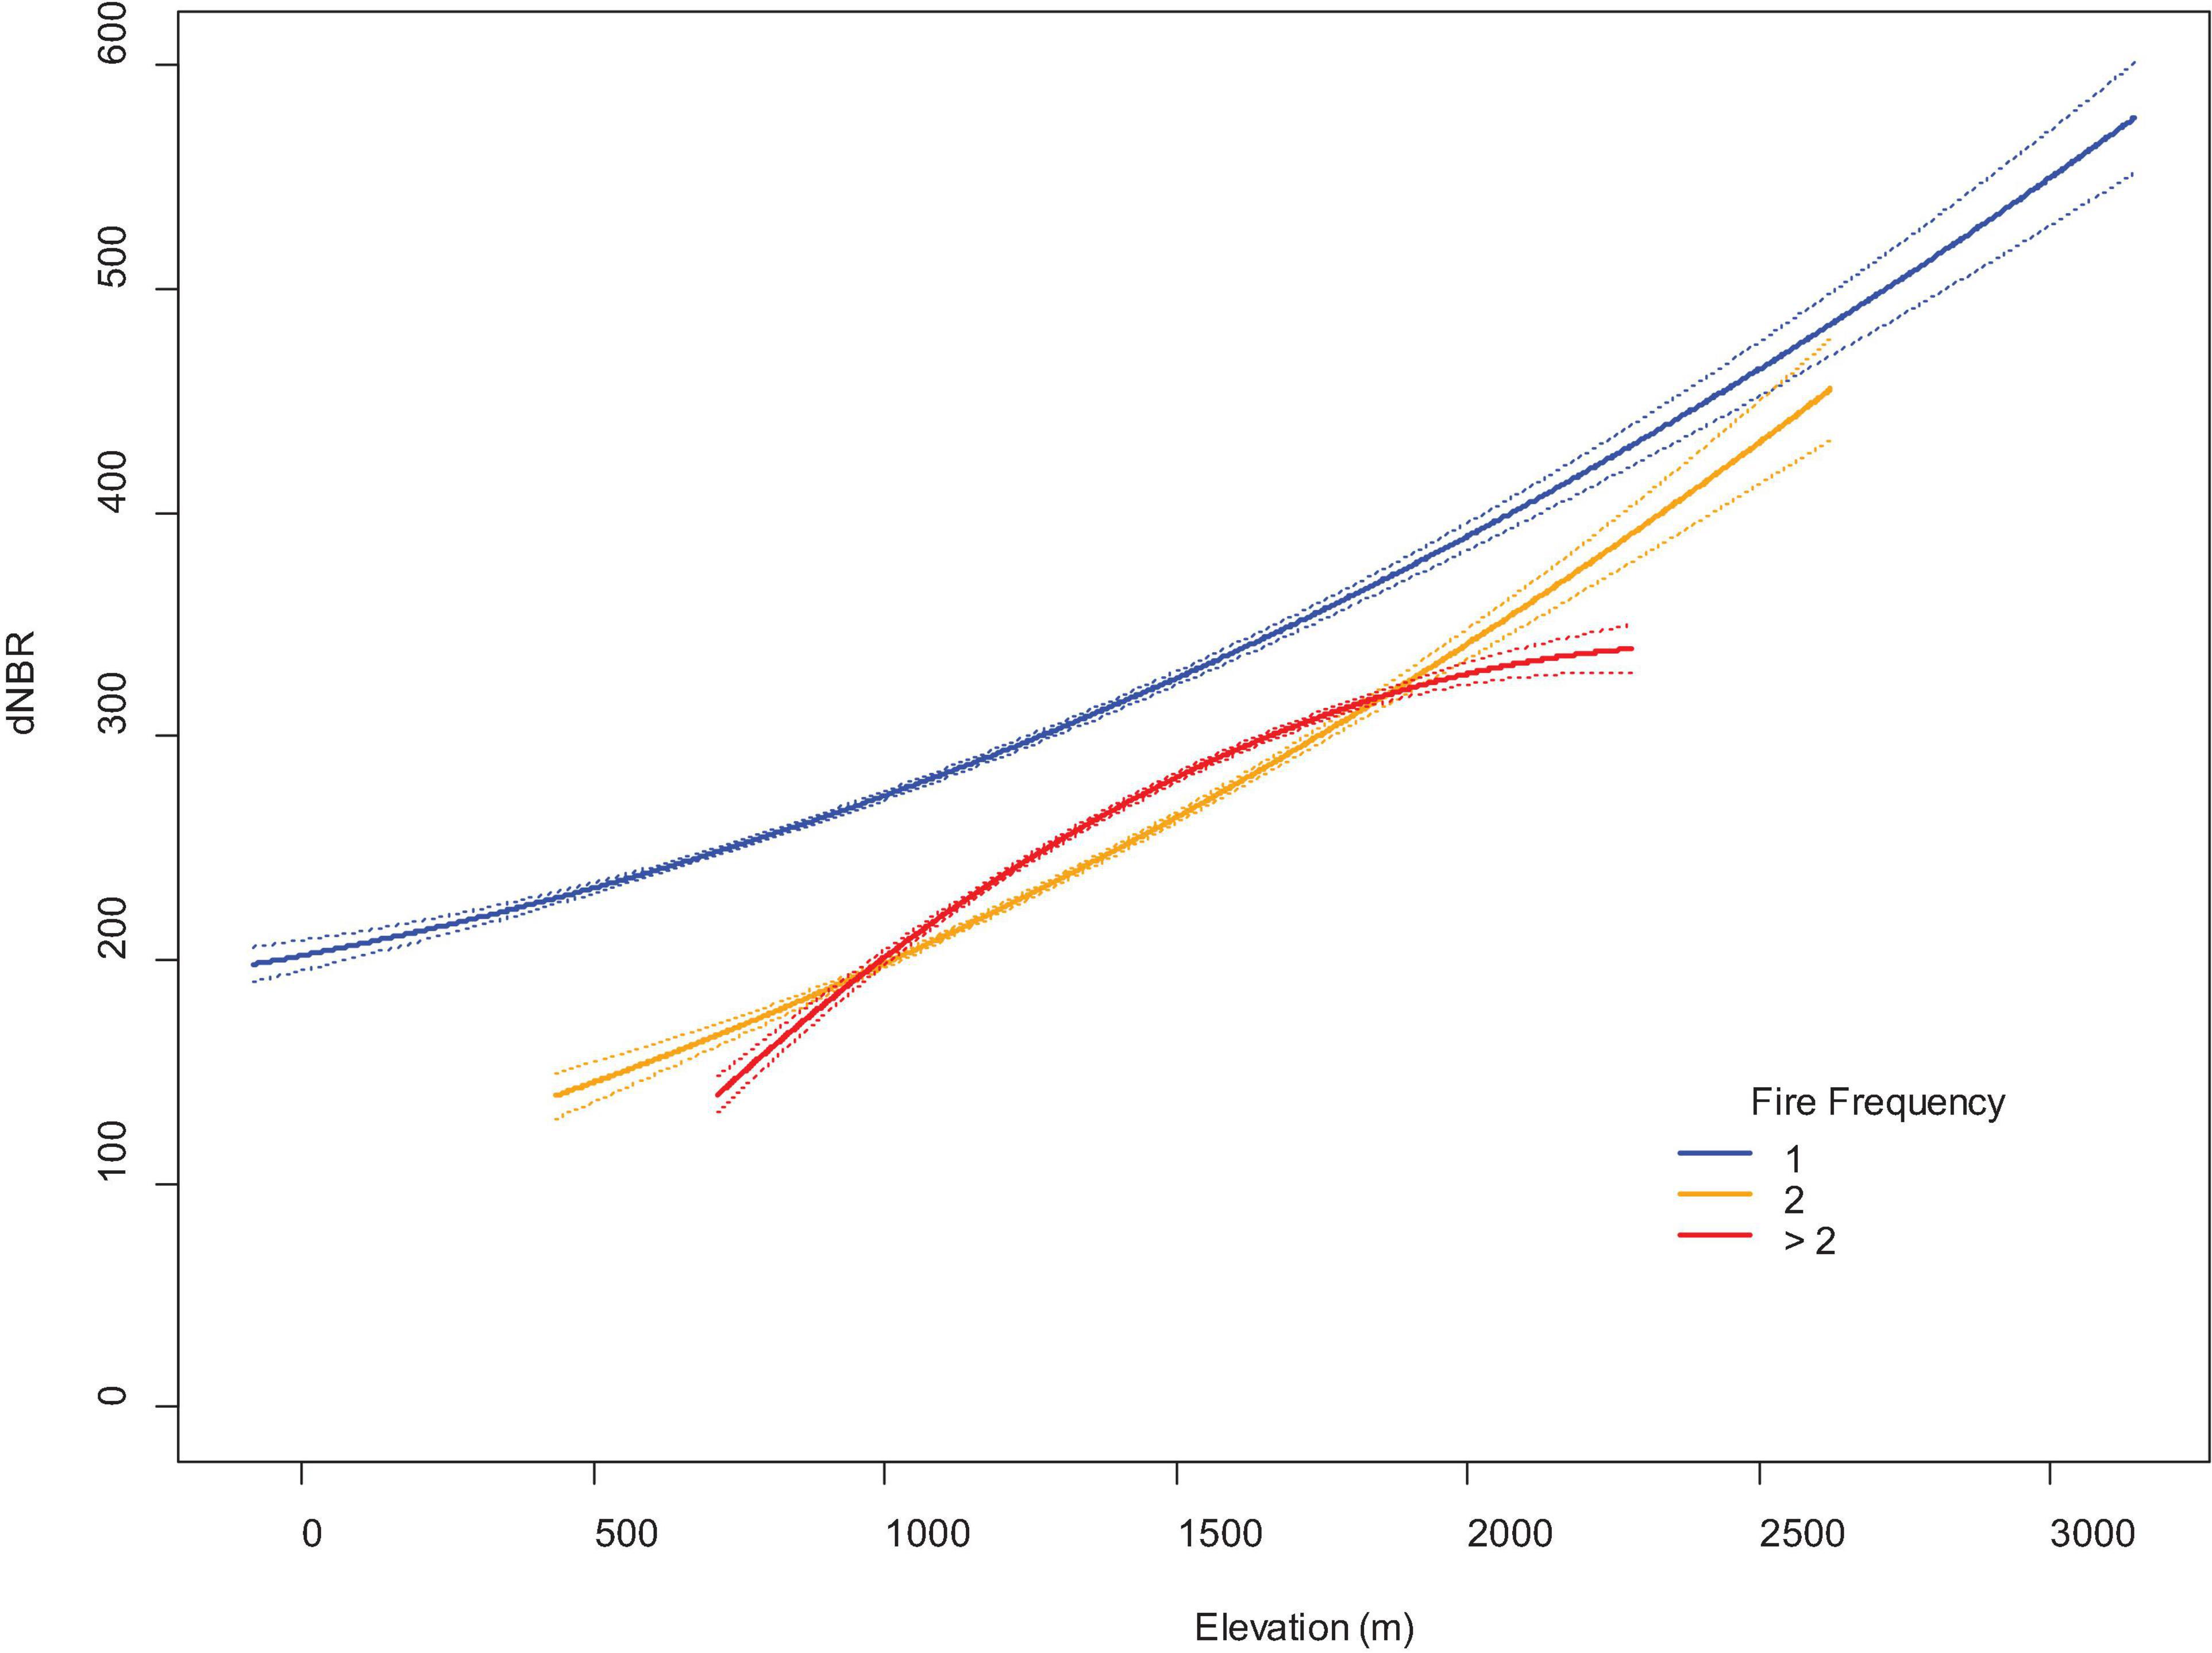
Figure 11. Relationship of predicted values (±95% CI) of burn severity (difference normalized burn ratio; dNBR) and fire frequency (number of times burned from 1972 to 2010) along an elevation gradient in the Mojave Desert of North America. Estimates were derived by ordinary least-squares regression from 1,000 randomly selected points in each fire frequency class.
Discussion
The observed and predicted patterns for fire frequency, burn severity and probability of ignition indicated the occurrence of multiple spatially structured fire regimes throughout the Mojave Desert. The regimes were characterized by an interaction between fire frequency and the degree of burn severity, with the interaction strengths of the two factors being largely opposite each other. Variables that were related to climate and vegetation were important predictors of both frequency and severity, while variables related to topography had importance principally in predicting burn severity. The extent of the GFC is currently limited, but there appears to be great potential for it to become far more widespread.
Two of the most ecologically significant regimes included one characterized by frequent fire (two or more burns every 40–50 years) primarily of low to moderate severity, and another by infrequent fire (one burn every 50–100 years or more) but of high severity. The high frequency regime appears most likely to occur in the northeast part of the region, and, to a lesser degree, in some of the interior mountain ranges. In contrast, the high severity regime appears most likely to occur in the north and northwest, though it is predicted to occur in some interior mountain ranges as well. Two other regimes of ecological importance are one with relatively high fire frequency and burn severity and another with low fire frequency and burn severity. The high frequency and severity regime is very limited in extent, occurring patchily in some interior mountain ranges as well as some of the ranges fringing the Mojave. In contrast, the low frequency and burn severity regime is the most extensive one in the region, especially in the southern and western parts.
The importance values of the predictor variables provided insight into the spatial structure of fire in the Mojave. Intuitively, probability of ignition and fire frequency would be expected to have positive relationships with sources of ignition and fuels. This was generally the case in the models; Bromes, lightning, NDVI, Schismus, and monsoon precipitation were the highest ranked variables for the probability of ignition model while monsoon precipitation, Bromes, lightning, and NDVI were the highest ranked variables for the fire frequency model. Both monsoon storm activity and biomass of woody vegetation are high in mountainous parts of the region, especially in the east and northeast. Moreover, cover of Brome grasses is high in these areas (Klinger and Brooks, 2017), as is the predicted suitability of their habitat (Underwood et al., 2019). We suspect that the importance of monsoon precipitation has less to do with precipitation than the lightning and high winds that typically occur with the storms (Tagestad et al., 2016). In combination with high woody fuel loads and flammable invasive grasses, lightning and wind dramatically increase ignition, spread and frequency of fires in the eastern and northeastern parts of the Mojave. The south and southeastern parts of the Mojave experience considerable monsoon storm activity but elevations tend to be lower. Thus, the sparser fuels reduce ignitions and limit spread of fire. Fuel loads in the western Mojave can be as high as those in the east and northeast, especially in the mountain ranges bordering the region. Lightning activity is less than in the eastern parts of the region though, limiting ignition probabilities and frequency of fire.
NDVI and the proportion of monsoon precipitation were also important predictor variables in the burn severity model. Their importance makes intuitive sense because burn severity would be expected to be greater in areas with large amounts of biomass available to be removed and where high winds could lead to high fire intensity. However, in contrast with models of probability of ignition and frequency, topography variables had considerable importance in the severity model. The influence of TRI, elevation, and hillshade likely reflects several interactive effects, including local ones of terrain (TRI and hillshade) on fire intensity and spread as well as a larger scale one of elevation on fuel loads and fire spread. There is a strong positive correlation between TRI and slope, and fuel loads and steeper terrain tend to be greater in high than low elevation areas. Steep slopes promote intensity and spread of fire because vegetation is more exposed to both radiant and convective heat. This effect likely compounds at larger scales as biomass becomes greater in high elevation areas with steep terrain. A potential exception is in low elevation areas with high biomass of Schismus spp. Predictions of dNBR were substantively improved with Schismus as a predictor variable, which we attribute to interspaces among shrubs being filled in by Schismus spp. (Brooks, 1999). This increase in Schismus biomass would result in higher dNBR values. We stress though that this interpretation is provisional because dNBR tends to be in low to moderate ranges at lower elevations of the Mojave (Klinger et al., 2019).
Brooks and Matchett (2006) hypothesized that fire activity in the Mojave is an outcome of opposing gradients, with lower elevations being largely fuel limited and higher elevations largely ignition limited. Our findings and those of two other studies (Hegeman et al., 2014; Tagestad et al., 2016) are generally consistent with their hypothesis. Nevertheless, it may need to be modified to account for spatial location. The potential for widespread, albeit patchy, high severity fire is considerable due to the mountain ranges that occur throughout the interior of the region. The southeast-to-northwest spatial trend in dNBR values and distribution of wildfires over the last 40–50 years are compelling indications though that this potential has, for the most part, not been realized. This implies spatial structuring in burn severity results mainly from ignitions rather than the distribution of conditions conducive to high severity burns, such as high vegetation biomass. Thus, depending on location, the relative importance of ignition vs. fuel could shift due to local conditions (e.g., low elevation communities with relatively high biomass of invasive grasses or high elevation communities in areas of abundant lightning).
A tradeoff with predictor variables in machine learning models is that they account for non-linear effects and complex interactions better than parametric models do but, because they are non-parametric, their interpretation is less direct. Given this caveat, the importance rankings of the predictor variables in our models generally made ecological sense. Nevertheless, the complex interactions make it inappropriate to infer that statistical rankings translated directly to ecological rankings. For instance, precipitation is known to be one of the most important influences on fire in the North American deserts (Brooks and Matchett, 2006; Balch et al., 2013; Hegeman et al., 2014; Tagestad et al., 2016; Chambers et al., 2019; Underwood et al., 2019), but in our models it had intermediate or even low rankings. It would be wrong though to think this was an indication that precipitation was of lesser importance for fire activity in the Mojave. First, its effects on fire are expressed indirectly through mediation of vegetation biomass. This was well represented in our models by NDVI and, to a lesser degree, by the Bromus and Schismus variables (Balch et al., 2013; Underwood et al., 2019). Second, our focus was on predicting patterns that were integrated over time rather than year-to-year. Had our focus been on year-to-year patterns as in some prior studies (Brooks and Matchett, 2006; Hegeman et al., 2014), then the importance rankings would likely have been higher. Broadly though, this provides a useful example of why interpretation of variable rankings from machine learning models needs to be done carefully and in a meaningful context.
Perhaps the most valuable insight from the variable rankings was that predictions of the models were improved by combined effects of the variables more so than any overriding effects of just one or two of them. Pseudo-R2 values must be interpreted very cautiously because they are not a measure of explained variance, nor do they range between 0 and 1 (McFadden, 1974). They can be useful for comparing models though, and in this context they gave a clear indication that the most accurate dNBR model included topography, climate, and vegetation variables. The removal of any one variable from the model of probability of ignition did little to change gain in prediction accuracy, and while topography was of minimal importance in the ignition probability and fire frequency models, combined effects of vegetation and climate variables had the greatest effect on prediction accuracy in those models. Moreover, the most important predictor variables in our ignition model compared well with those from a parametric model of ignition probability developed for a limited area of the Mojave (Hegeman et al., 2014). Interpreting our models is best done within a more predictive than explanatory framework, but the predictions were consistent with current understanding of how different environmental factors influence fire in the Mojave (Tagestad et al., 2016; Brooks et al., 2018; Underwood et al., 2019). As a result, they provide the theoretical foundation for parametric models of ignition and severity that have a more explicit explanatory purpose.
Interactions among climate, fuel load, and invasive annual grasses have been a major factor in a large proportion of the Great Basin Desert undergoing conversion from native dominated shrubland to invasive dominated grassland (Whisenant, 1990; Pilliod et al., 2017; Bradley et al., 2018; Chambers et al., 2019). Similar conversions have occurred in the other three North American deserts, but they have not been as extensive or were transient (Klinger and Brooks, 2017). There remains considerable concern though that the other deserts might follow a similar trajectory as the Great Basin (Brooks and Pyke, 2001; Chambers et al., 2019; Fusco et al., 2019). Climate shifts could increase future fire activity, with the magnitude of change likely structured by fuel loads along gradients of elevation and latitude (Abatzaglou and Williams, 2016; Tagestad et al., 2016). However, it is unlikely changes in climate and fuel load alone will bring about large-scale and long-term fire-mediated transformations in the Mojave. Rather, most evidence suggests that invasive annual grasses will be the key factor in these transformations, especially in regard to how ubiquitous the GFC becomes (Balch et al., 2013; Fusco et al., 2019; Underwood et al., 2019). The fire regime and composition of post-fire vegetation are the two fundamental components of the GFC, and our findings suggest these can be meaningfully evaluated from two perspectives: their current extent and magnitude and predicted extent and magnitude.
Currently, the proportion of the Mojave that has experienced wildfire over the last 40–50 years is low. In addition, the spatial extent of areas that have experienced multiple wildfires is extremely limited and largely restricted to one part of the region. There is evidence that GFCs have become established in some areas where multiple wildfires occurred (Klinger and Brooks, 2017; Underwood et al., 2019), but our findings indicate they do not occur extensively outside of those areas. Furthermore, even when areas in the Mojave burn two times over several decades and are dominated by invasive grasses in the initial years after burning, this does not mean they will remain so (Klinger and Brooks, 2017). It may take several decades to re-establish, but shrub cover can be resilient, and even if herbaceous cover remains higher than it would if a site was unburned the dominant species may be native (Klinger and Brooks, 2017). When looked at from this viewpoint, a reasonable assessment is the extent and magnitude of changes in fire regimes and post-fire vegetation communities in the Mojave have been limited. Thus, the likelihood of the GFC becoming widespread is low, as is the potential for vegetation communities to undergo extensive, long-term transformations following fire.
A different assessment can be reached when looking at the predicted patterns of probability of ignition, fire frequency, and burn severity. A conspicuous distinction between the actual fire perimeters and predicted pattern of ignition is that there are extensive areas with moderate to high probabilities of ignition where wildfires have not occurred in the last 40–50 years. This is especially apparent in the northern and western parts of the region, including mountain ranges where wildfires have either not occurred or been of very limited extent. The contrast between potential and actual occurrence is also apparent for fire frequency and dNBR; areas predicted to have multiple wildfires are present in most of the interior mountain ranges and large portions of the central, western and northern parts of the region are predicted to have moderate to high burn severity. From a plant community perspective, the predicted frequency and burn severity patterns have important implications. Broader extent of areas that burn multiple times over the course of approximately a half-century undoubtedly means that the GFC would become more prevalent in the Mojave, especially when these areas have favorable habitat conditions for invasive grasses (Underwood et al., 2019). There is virtually no resilience in shrub cover when woody-dominated areas burn more than twice in a half-century (Klinger and Brooks, 2017), hence transformations to invasive-dominated herbaceous communities would become more widespread. In addition, because woody-dominated communities can be transformed to invasive dominated communities following high or moderate severity burns (Klinger and Brooks, 2017), transitions could occur even when fire is infrequent. Moreover, such areas could act as large-scale nascent foci (Moody and Mack, 1988) from which invasive grasses could spread into adjacent unburned areas. Shifts in precipitation patterns could further contribute to altered fire regimes and plant communities in the next 50–100 years (Tagestad et al., 2016), but widespread changes might occur even sooner. Our findings indicate that conditions for the GFC to become more common already exist, and it is just a matter of time before it does. Moreover, the rate at which this occurs could be greatly exacerbated by human-caused fires (Syphard et al., 2007, 2017; Hegeman et al., 2014; Balch et al., 2017). Thus, based on potential effects, a justifiable assessment would be that the likelihood of the GFC becoming widespread and vegetation communities undergoing extensive, long-term transformations following fire are high.
Conclusion
Reconciling the opposing perspectives on the degree to which fire regimes and composition of post-fire vegetation communities in the Mojave might be altered may depend on an interplay between spatial and temporal dynamics of wildfire. Two studies using an ecologically sensible delineation of the Mojave have analyzed the annual number of wildfires and area burned, and both found no evidence of a trend in either variable (Brooks and Matchett, 2006; Klinger et al., unpublished). What was perhaps their most important finding was that relatively few or even no large wildfires (i.e., >405 ha) occurred in most years, but then those periods would be punctuated at 10–15-year intervals by a year (“pulse years”) when larger than normal numbers of wildfires and area burned occurred. Moreover, there were uncommon but highly exceptional years when the number of wildfires and amount of area burned were orders of magnitude greater than normal or pulse years (“mega years”). An example of a mega year was 2005, when 25% of the wildfires between 1972 and 2010 occurred and the area burned was 176% that of the total area burned between 1972 and 2004. In addition to the unusually large number of fires and area burned that year, there was a conspicuous spatial pattern of the fires occurring primarily in the eastern part of the region. This suggests a possibility that the distribution of wildfire in the Mojave is temporally dynamic. Areas with disproportionally high fire frequency, occurrence of the GFC, and altered vegetation communities might remain concentrated in a few specific parts of the region for many decades. The pattern could abruptly shift though because of an uncommon but abnormally high magnitude wildfire event in another part of the region. This event would shape trajectories in the structure and composition of post-fire vegetation communities for many decades, with both the GFC and altered communities becoming more prevalent in parts of the region where they had been uncommon for long periods of time. If this dynamic did occur, then the GFC would likely appear to have a limited spatial distribution when viewed over a few decades. But when viewed over many decades or more, the occurrence of the GFC would likely appear more widespread.
Data Availability Statement
Data deposited at USGS (https://doi.org/10.5066/P99YGHSJ).
Author Contributions
RK, EU, RM, and MB conceived and designed the study. RM developed the fire atlas. RK developed the PPM and RF models. EU and RK developed the Maxent model. RK wrote the manuscript with contributions from RM, EU, and MB. All authors contributed to the article and approved the submitted version.
Conflict of Interest
The authors declare that the research was conducted in the absence of any commercial or financial relationships that could be construed as a potential conflict of interest.
Acknowledgments
We thank Otto Alvarez and Qinghua Guo of the University of California, Merced (UCM) for providing us with the climate data, and Jerry Tagestad (Pacific Northwest National Laboratory - PNNL) for providing us with the lightning data. Janelle Downs, (PNNL), Jerry Tagestad, Steven Lee (USGS), and Jennifer Chase (USGS) gave us hours of productive discussion on dynamics of fire in arid ecosystems. Any use of trade, firm, or product names is for descriptive purposes only and does not imply endorsement by the U.S. Government.
Supplementary Material
The Supplementary Material for this article can be found online at: https://www.frontiersin.org/articles/10.3389/fevo.2021.593167/full#supplementary-material
Footnotes
- ^ http://www.mtbs.gov/
- ^ https://www.sciencebase.gov/catalog/item/4f70aa71e4b058caae3f8de1
- ^ https://www.ncdc.noaa.gov/data-access/severe-weather/lightning-products-and-services
References
Abatzaglou, J. T., and Williams, A. P. (2016). Impact of anthropogenic climate change on wildfire across western US forests. Proc. Natl. Acad. Sci. U.S.A. 113, 11770–11775. doi: 10.1073/pnas.1607171113
Abatzoglou, J. T., and Kolden, C. A. (2011). Climate change in western US deserts: potential for increased wildfire and invasive annual grasses. Rangeland Ecol. Manag. 64, 471–478. doi: 10.2111/rem-d-09-00151.1
Abatzoglou, J. T., and Kolden, C. A. (2013). Relationships between climate and macroscale area burned in the western United States. Inter. J. Wildland Fire 22, 1003–1020. doi: 10.1071/WF13019
Abella, S. (2010). Disturbance and plant succession in the Mojave and Sonoran deserts of the American Southwest. Int. J. Environ. Res. Public Health 7, 1248–1284. doi: 10.3390/ijerph7041248
Alvarez, O., Guo, Q., Klinger, R. C., Li, W., and Doherty, P. (2013). Comparison of elevation and remote sensing derived products as auxiliary data for climate surface interpolation. Intern. J. Climatol. 34, 2258–2268. doi: 10.1002/joc.3835
Anderson, M. J. (2001). A new method for non-parametric multivariate analysis of variance. Austr. Ecol. 26, 32–46. doi: 10.1111/j.1442-9993.2001.01070.pp.x
Baddeley, A., Rubak, E., and Turner, R. (2015). Spatial Point Patterns: Methodology and Applications with R. London: CRC Press.
Balch, J. K., Bradley, B. A., Abatzoglou, J. T., Nagy, R. C., Fusco, E. J., and Mahood, A. L. (2017). Human-started wildfires expand the fire niche across the United States. Proc. Natl. Acad. Sci. U.S.A. 114, 2946–2951. doi: 10.1073/pnas.1617394114
Balch, J. K., Bradley, B. A., D’Antonio, C. M., and Gómez-Dans, J. (2013). Introduced annual grass increases regional fire activity across the arid western USA (1980-2009). Glob. Change Biol. 19, 173–183. doi: 10.1111/gcb.12046
Batllori, E., Parisien, M. A., Krawchuk, M. A., and Moritz, M. A. (2013). Climate change-induced shifts in fire for Mediterranean ecosystems. Glob. Ecol. Biogeogr. 22, 1118–1129. doi: 10.1111/geb.12065
Bradley, B. A., Curtis, C. A., Fusco, E. J., Abatzoglou, J. T., Balch, J. K., Dadashi, S., et al. (2018). Cheatgrass (Bromus tectorum) distribution in the intermountain western United States and its relationship to fire frequency, seasonality, and ignitions. Biol. Invas. 20, 1493–1506. doi: 10.1007/s10530-017-1641-8
Brooks, M. L., and Berry, K. H. (2006). Dominance and environmental correlates of alien annual plants in the Mojave Desert, USA. J. Arid Environ. 67, 100–124. doi: 10.1016/j.jaridenv.2006.09.021
Brooks, M. L., and Chambers, J. (2011). Resistance to invasion and resilience to fire in desert shrublands of North America. Rangeland Ecol. Manag. 64, 431–438. doi: 10.2111/rem-d-09-00165.1
Brooks, M. L., D’Antonio, C. M., Richardson, D. M., Grace, J. B., Keeley, J. E., DiTomaso, J. M., et al. (2004). Effects of invasive alien plants on fire regimes. Bioscience 54, 677–688. doi: 10.1641/0006-3568(2004)054[0677:eoiapo]2.0.co;2
Brooks, M. L., and Esque, T. C. (2002). Alien plants and fire in desert tortoise (Gopherus agassiz) habitat of the Mojave and Colorado deserts. Chelon. Conserv. Biol. 4, 330–340.
Brooks, M. L., and Matchett, J. R. (2006). Spatial and temporal patterns of wildfires in the Mojave Desert, 1980-2004. J. Arid Environ. 67, 148–164. doi: 10.1016/j.jaridenv.2006.09.027
Brooks, M. L., Minnich, R., and Matchett, J. R. (2018). “Southeastern deserts bioregion,” in Fire in California’s Ecosystems, 2nd Edn, eds J. W. Van Wagtendonk, N. G. Sugihara, S. L. Stephens, A. E. Thode, K. E. Shaffer, and J. Fites-Kaufman (Berkeley, CA: University of California Press).
Brooks, M. L., and Pyke, D. (2001). “Invasive plants and fire in the deserts of North America,” in Proceedings of the Invasive Species Workshop: The Role of Fire In the Control and Spread of Invasive Species. Fire Conference 2000: The First National Congress on Fire Ecology, Prevention and Management, eds K. Galley and T. Wilson (Tallahassee, FL: Tall Timbers Research Station), 1–14.
Burnham, K. P., and Anderson, D. R. (2002). Model Selection and Multimodel Inference. A Practical Information-Theoretic Approach. Cham: Springer.
Chambers, J. C., Brooks, M. L., Germino, M. J., Maestas, J. D., Board, D. I., Jones, M. O., et al. (2019). Operationalizing resilience and resistance concepts to address invasive grass-fire cycles. Front. Ecol. Evol. 7:185. doi: 10.3389/fevo.2019.00185
Chambers, J. C., Roundy, B. A., Blank, R. R., Meyer, S. E., and Whittaker, A. (2007). What makes great basin sagebrush ecosystems invasible by Bromus tectorum? Ecol. Monogr. 77, 117–145. doi: 10.1890/05-1991
Collins, B. M., Omi, P. N., and Chapman, P. L. (2006). Regional relationships between climate and wildfire-burned area in the Interior West, USA. Can. J. For. Res. 36, 699–709. doi: 10.1139/X05-264
Crisci, C., Ghattasb, B., and Pererac, G. (2012). A review of supervised machine learning algorithms and their applications to ecological data. Ecol. Model. 240, 113–122. doi: 10.1016/j.ecolmodel.2012.03.001
Cutler, D. R., Edwards, T. C. J., Beard, K., Cutler, A., Hess, K. T., Gibson, J., et al. (2007). Random forest for classification in ecology. Ecology 88, 2783–2792.
D’Antonio, C. M., and Vitousek, P. M. (1992). Biological invasions by exotic grasses, the grass/fire cycle, and global change. Annu. Rev. Ecol. Syst. 23, 63–87. doi: 10.1146/annurev.es.23.110192.000431
Dennison, P. E., Brewer, S. C., Arnold, J. D., and Moritz, M. A. (2014). Large wildfire trends in the western United States, 1984-2011. Geophys. Res. Lett. 41, 2928–2933. doi: 10.1002/2014GL059576
Dwyer, J. L., Roy, D. P., Sauer, B., Jenkerson, C. B., Zhang, H. K., and Lymburner, L. (2018). Analysis ready data: enabling analysis of the landsat archive. Remote Sens. 10:1363. doi: 10.3390/rs10091363
Eidenshink, J., Schwind, B., Brewer, K., Zhu, Z.-L., Quayle, B., and Howard, S. (2007). A project for monitoring trends in burn severity. Fire Ecol. 3, 3–21. doi: 10.4996/fireecology.0301003
Elith, J., Graham, C. H., Anderson, R. P., Dudik, M., Ferrier, S., Guisan, A., et al. (2006). Novel methods improve prediction of species’ distributions from occurrence data. Ecography 29, 129–151.
Elith, J., Phillips, S. J., Hastie, T., Dudık, M., Chee, Y. E., and Yates, C. J. (2011). A statistical explanation of MaxEnt for ecologists. Divers. Distribut. 17, 43–57. doi: 10.1111/j.1472-4642.2010.00725.x
Forkel, M., Carvalhais, N., Verbesselt, J., Mahecha, M. D., Neigh, C., and Reichstein, M. (2013). Trend change detection in NDVI time series: effects of inter-annual variability and methodology. Remote Sens. 5, 2113–2144. doi: 10.3390/rs5052113
Forkel, M., Migliavacca, M., Thonicke, K., Reichstein, M., Schaphoff, S., Weber, U., et al. (2015). Co-dominant water control on global inter-annual variability and trends in land surface phenology and greenness. Glob. Chang. Biol. 21, 3414–3435. doi: 10.1111/gcb.12950
Fusco, E. J., Finn, J. T., Balch, J. K., Nagy, R. C., and Bradley, B. A. (2019). Invasive grasses increase fire occurrence and frequency across US ecoregions. Proc. Natl. Acad. Sci. U.S.A. 116, 23599–23599.
Hegeman, E. E., Dickson, B. G., and Zachmann, L. J. (2014). Probabilistic models of fire occurrence across National Park Service units within the Mojave desert network, USA. Landscape Ecol. 29, 1587–1600. doi: 10.1007/s10980-014-0078-z
Hereford, R., Webb, R. H., and Longpre, C. I. (2006). Precipitation history and ecosystem response to multidecadal precipitation variability in the Mojave Desert region, 1893-2001. J. Arid Environ. 67, 13–34. doi: 10.1016/j.jaridenv.2006.09.019
Hijmans, R. J. (2012). Cross-validation of species distribution models: removing spatial sorting bias and calibration with a null-model. Ecology 93, 679–688. doi: 10.1890/11-0826.1
Hijmans, R. J. (2020). raster: Geographic Data Analysis and Modeling. R Package Version 3.0-12. Available online at: https://CRAN.R-project.org/package=raster (accessed May 2020).
Hijmans, R. J., Phillips, S., Leathwick, J., and Elith, J. (2017). dismo: Species Distribution Modeling. R Package Version 1.1-4. Available online at: https://CRAN.R-project.org/package=dismo (accessed May 2020).
Hudak, A. T., Morgan, P., Bobbitt, M. J., Smith, A. M. S., Lewis, S. A., Lentile, L. B., et al. (2007). The relationship of multispectral satellite imagery to immediate fire effects. Fire Ecol. 31, 64–90. doi: 10.4996/fireecology.0301064
Humphries, G. R. W., Magness, D. R., and Huettmann, F. (2018). Machine Learning for Ecology and Sustainable Natural Resource Management. Berlin: Springer.
Key, C. H., and Benson, N. C. (2006). “Landscape Assessment (LA): sampling and analysis methods,” in FIREMON: Fire Effects Monitoring and Inventory System, eds D. C. Lutes, R. E. Keane, N. C. Caratti, C. H. Key, and S. Sutherland (Fort Collins, CO: Rocky Mountain Research Station), 1–55.
Klinger, R. C., and Brooks, M. L. (2017). Alternative pathways to landscape transformation: invasive grasses, burn severity and fire frequency in arid ecosystems. J. Ecol. 105, 1521–1533. doi: 10.1111/1365-2745.12863
Klinger, R. C., McKinley, R., and Brooks, M. L. (2019). An evaluation of remotely sensed indices for quantifying burn severity in arid ecoregions. Intern. J. Wildland Fire 28, 951–968. doi: 10.1071/wf19025
Littell, J. S., McKenzie, D., Peterson, D. L., and Westerling, A. L. (2009). Climate and wildfire area burned in western U.S. ecoprovinces, 1916-2003. Ecol. Appl. 19, 1003–1021. doi: 10.1890/07-1183.1
Lobo, J. M., Jimenez-Valverde, A., and Real, R. (2007). AUC: a misleading measure of the performance of predictive distribution models. Glob. Ecol. Biogeogr. 17, 145–151. doi: 10.1111/j.1466-8238.2007.00358.x
MacMahon, J. A., and Wagner, F. H. (1985). “The Mojave, Sonoran, and Chihuahuan deserts of North America,” in Hot deserts and Arid Shrublands, eds M. Evanari, I. Noy-Meir, and D. W. Goodall (Amsterdam: Elsevier), 105–202.
Manly, B. F., McDonald, L., Thomas, D., McDonald, T. L., and Erickson, W. P. (2002). Resource Selection by Animals: Statistical Design and Analysis for Field Studies. Berlin: Springer.
Martin, Y., Zuniga-Anton, M., and Mimbreror, M. R. (2019). Modelling temporal variation of fire-occurrence: towards the dynamic prediction of human wildfire ignition danger in northeast Spain. Geomat. Nat. Hazards Risk 10, 385–411. doi: 10.1080/19475705.2018.1526219
McFadden, D. (1974). “Conditional logit analysis of qualitative choice behavior,” in Frontiers in Econometrics, ed. P. Zarembka (Cambridge, MA: Academic Press), 105–142.
Miller, J. D., Skinner, C. N., Safford, H. D., Knapp, E. E., and Ramirez, C. M. (2012). Trends and causes of severity, size, and number of fires in northwestern California, USA. Ecol. Applic. 22, 184–203. doi: 10.1890/10-2108.1
Moody, M. E., and Mack, R. N. (1988). Controlling the spread of plant invasions: the importance of nascent foci. J. Appl. Ecol. 25, 1009–1021. doi: 10.2307/2403762
Oksanen, J., Blanchet, F. G., Friendly, M., Kindt, R., Legendre, P., McGlinn, D., et al. (2020). vegan: Community Ecology Package. R Package Version 2.5-7. Available online at: https://CRAN.R-project.org/package=vegan
Olden, J. D., Lawler, J. J., and Poff, N. L. (2008). Machine learning methods without tears: a primer for ecologists. Q. Rev. Biol. 83, 171–193. doi: 10.1086/587826
Overpeck, J. T. (2013). Climate science: the challenge of hot drought. Nature 503, 350–351. doi: 10.1038/503350a
Parisien, M.-A., Miller, C., Parks, S. A., DeLancey, E. R., Robinne, F. N., and Flannigan, M. D. (2016). The spatially varying influence of humans on fire probability in North America. Environ. Res. Lett. 11:75005.
Parisien, M.-A., and Moritz, M. A. (2009). Environmental controls on the distribution of wildfire at multiple spatial scales. Ecol. Monogr. 79, 127–154. doi: 10.1890/07-1289.1
Phillips, S. J., Anderson, R. P., and Schapire, R. E. (2006). Maximum entropy modeling of species geographic distributions. Ecol. Model. 190, 231–259. doi: 10.1016/j.ecolmodel.2005.03.026
Phillips, S. J., and Dudik, M. (2008). Modeling of species distributions with Maxent: new extensions and a comprehensive evaluation. Ecography 31, 161–175. doi: 10.1111/j.0906-7590.2008.5203.x
Pilliod, D. S., Welty, J. L., and Arkle, R. S. (2017). Refining the cheatgrass-fire cycle in the Great Basin: precipitation timing and fine fuel composition predict wildfire trends. Ecol. Evol. 7, 8126–8151. doi: 10.1002/ece3.3414
R Core Team (2019). R: A Language and Environment for Statistical Computing. Vienna: R Foundation for Statistical Computing.
Renner, I. W., and Warton, D. I. (2013). Equivalence of MAXENT and poisson point process models for species distribution modeling in ecology. Biometrics 69, 274–281. doi: 10.1111/j.1541-0420.2012.01824.x
Richardson, D. M., Pysek, P., Rejmánek, M., Barbour, M. G., Panetta, F. D., and West, C. J. (2000). Naturalization and invasion of alien plants: concepts and definitions. Divers. Distribut. 6, 93–107. doi: 10.1046/j.1472-4642.2000.00083.x
Steel, Z. L., Safford, H. D., and Viers, J. H. (2015). The fire frequency-severity relationship and the legacy of fire suppression in California forests. Ecosphere 6:8.
Syphard, A. D., Keeley, J. E., and Abatzoglou, J. T. (2017). Trends and drivers of fire activity vary across California aridland ecosystems. J. Arid Environ. 144, 110–122. doi: 10.1016/j.jaridenv.2017.03.017
Syphard, A. D., Massada, A. B., Butsic, V., and Keeley, J. E. (2013). Land use planning and wildfire: development policies influence future probability of housing loss. PLoS One 8:e71708. doi: 10.1371/journal.pone.0071708
Syphard, A. D., Radeloff, V. C., Keeley, J. E., Hawbaker, T. J., Murray, I., Clayton, K., et al. (2007). Human influence on California fire regimes. Ecol. Appl. 17, 1388–1402. doi: 10.1890/06-1128.1
Tagestad, J., Brooks, M. L., Cullinan, V., Downs, J., and McKinley, R. (2016). Precipitation regime classification for the Mojave desert: implications for fire occurrence. J. Arid Environ. 124, 388–397. doi: 10.1016/j.jaridenv.2015.09.002
Underwood, E. C., Klinger, R. C., and Brooks, M. L. (2019). Effects of invasive plants on fire regimes and post-fire vegetation diversity in an arid ecosystem. Ecol. Evol. 9, 1–15. doi: 10.1002/ece3.5650
Webb, R. H., Fenstermaker, L. F., Heaton, J. S., Hughson, D. L., McDonald, E. V., and Miller, D. M. (eds) (2009). The Mojave Desert: Ecosystem Processes and Sustainability. Reno, NV: University of Nevada Press.
Westerling, A. L., Brown, T. J., Gershunov, A., Cayan, D. R., and Dettinger, M. D. (2003). Climate and wildfire in the western United States. Bull. Am. Meteorol. Soc. 84, 595–604. doi: 10.1175/BAMS-84-5-595
Westerling, A. L., Hidalgo, H. G., Cayan, D. R., and Swetnam, T. W. (2006). Warming and earlier spring increases western US forest wildfire activity. Science 313, 940–943. doi: 10.1126/SCIENCE.1128834
Whisenant, S. G. (1990). “Changing fire frequencies on Idaho’s Snake River plains: Ecological and management implications,” in Proceedings of the Symposium Cheatgrass Invasion, Shrub Die-off, and Other Aspects of Shrub Biology and Management, General Technical Report INT 276, eds E. D. McArthur, E. M. Romney, S. D. Smith, and P. T. Tueller (Ogden, UT: US Department of Agriculture), 4–10.
Wilson, M. F. J., O’Connell, B., Brown, C., Guinan, J. C., and Grehan, A. J. (2007). Multiscale terrain analysis of multibeam bathymetry data for habitat mapping on the continental slope. Mar. Geodesy 30, 3–35. doi: 10.1080/01490410701295962
Wright, H. A., and Bailey, A. W. (1982). Fire Ecology: United States and Southern Canada. New York, NY: John Wiley and Sons, Inc.
Zhu, Z., Key, C., Ohlen, D., and Benson, N. (2006). Evaluate Sensitivities of Burn-Severity Mapping Algorithms for Different Ecosystems and Fire Histories in the United States. Final Report to the Joint Fire Science Program, Project: JFSP 01-1-4-12. Sioux Falls, SD: USGS EROS.
Keywords: fire regimes, gradients, heterogeneity, invasive species, grass-fire cycle, machine learning, point process models, spatial dynamics
Citation: Klinger R, Underwood EC, McKinley R and Brooks ML (2021) Contrasting Geographic Patterns of Ignition Probability and Burn Severity in the Mojave Desert. Front. Ecol. Evol. 9:593167. doi: 10.3389/fevo.2021.593167
Received: 09 August 2020; Accepted: 01 February 2021;
Published: 29 March 2021.
Edited by:
Aaron Greenville, The University of Sydney, AustraliaReviewed by:
Rheinhardt Scholtz, University of Nebraska–Lincoln, United StatesOwen Francis Price, University of Wollongong, Australia
Copyright © 2021 Klinger, Underwood, McKinley and Brooks. This is an open-access article distributed under the terms of the Creative Commons Attribution License (CC BY). The use, distribution or reproduction in other forums is permitted, provided the original author(s) and the copyright owner(s) are credited and that the original publication in this journal is cited, in accordance with accepted academic practice. No use, distribution or reproduction is permitted which does not comply with these terms.
*Correspondence: Rob Klinger, cmNrbGluZ2VyQHVzZ3MuZ292