 Adam J. Eichenwald
 Arjun Amar
 Peter Tyrrell4,5
 Evan R. Buechley
 Munir Z. Virani
95% of researchers rate our articles as excellent or good
Learn more about the work of our research integrity team to safeguard the quality of each article we publish.
Find out more
ORIGINAL RESEARCH article
Front. Ecol. Evol. , 11 March 2021
Sec. Conservation and Restoration Ecology
Volume 9 - 2021 | https://doi.org/10.3389/fevo.2021.590073
This article is part of the Research Topic Modern Conservation: Critical Lessons from Birds of Prey View all 9 articles
As with many areas in Africa, Kenya has witnessed rapid human development in recent decades, including an increase in urbanization and an intensification of agriculture. The impact of these land use changes on wildlife populations have, however, rarely been examined. The Augur Buzzard is a widespread raptor species, thought to adapt relatively well to human alterations of habitat. In this study, we explore trends in Augur Buzzard (Buteo augur) territory occupancy over nearly two decades around Lake Naivasha, Kenya, in relation to land-use changes, particularly expansion in human housing and flower farms. We hypothesized that these changes would cause population declines in this species within our study area. Using remote-sensed satellite imagery, we found that human development (agriculture and human settlement) increased from 9 to 24% of the study area from 1995 to 2014. We found a 47% decline in active territories over this same time period, representing an annualized decline of 3.1%. Based on the length of three generations this would qualify this species to be uplisted to at least Vulnerable in our study area, raising our concerns that the same pattern may be occurring across the species’ range. We then explored whether abandonment of individual territories was associated with either (i) the current amount or (ii) the change in human development within a range of buffer circles of varying radii (0.1–5.0 km). Contrary to our expectations, no associations were found between human development and territorial abandonment, and thus we could not attribute specific territorial abandonment to these broad scale anthropogenic land cover changes. We encourage further research to investigate whether territorial abandonment may be associated with either finer resolution (habitat specific) changes, or sources of direct mortality, for example human persecution or electrocutions. These factors might explain the decline in this population better than broader scale increases in anthropogenic land cover.
Anthropogenic development is a key driver in ongoing global defaunation (Dirzo et al., 2014), with far-reaching consequences for not only species loss, but also ecosystem function and service (Säterberg et al., 2013). It is one of the main threats facing bird populations across the globe (Loss et al., 2015; McClure et al., 2018). Understanding how species cope with such changes is therefore of critical concern to conservationists (McKinney, 2002).
Raptors may be particularly sensitive to such development and many are known to be threatened by changes in land use, such as urbanization and intensification of agriculture (McClure et al., 2018). Some raptors, however, have been shown to be more adaptable than others to different forms of land use change. For example, some species thrive in urban habitats (Boal and Mannan, 1998; Suri et al., 2017; Kettel et al., 2018; Muller et al., 2020), while others are resilient to agricultural change (Cardador et al., 2011; Murgatroyd et al., 2016).
The Augur Buzzard (Buteo augur) is a relatively common raptor found throughout East and southwestern Africa. The species is considered of low conservation concern by the IUCN Redlist of Endangered Species (BirdLife International, 2012), and is thought to adapt well to cultivated land and fairly dense human habitation (Fry et al., 1988; Muhweezi, 1990). However, high rates of mortality have also been observed in areas with high human presence (Virani and Harper, 2009) and other research has identified lower densities in areas with increased human development (Virani, 1999). These studies suggest that the species may be negatively impacted by changes in land use within their distributional range. However, despite their relative abundance and large distribution, the species has received relatively little research attention (Virani and Watson, 1998; Amar et al., 2018; Buechley et al., 2019).
In this study, we explore trends in territorial occupancy in an Augur Buzzard population around Lake Naivasha, Kenya, which to our knowledge is the only population which has been monitored long-term (Virani and Harper, 2004, 2009; Virani, 2006a). This area is believed to have undergone rapid anthropogenic development in recent decades and we hypothesize that these changes may have driven declines in the population. We predict that: (1) within the study area there will have been increases in anthropogenic development at the expense of more natural habitats; (2) Augur Buzzards would have abandoned territories in the study area, and that (3) territorial abandonment will be associated with anthropogenic development. To test this, we used remotely sensed data to quantify levels of land use change in the study area over this same period, with a focus on human development (including both agriculture and human settlements). We explored Augur Buzzard territory occupancy from surveys carried out in 1995–97, 2010, and 2014 to examine changes in territory occupancy rates over a 20 years period. Then, for each territory in our study area, we quantified the levels of human development (including both agriculture and human settlements) at different radii buffers surrounding these territories and tested whether territorial abandonment was associated with levels of human development or changes in human development over the 20 years period (Krüger et al., 2015).
Our research was conducted around Lake Naivasha, located in the eastern Rift Valley of Kenya. The slopes of the Rift Valley above Lake Naivasha are covered by tropical Setaria spp. Grassland, which transitions into the Tarchonanthus camphoratus bushland typical of the Rift Valley floor (Litterick et al., 1979). Upland Acacia spp. woodland is common in the area surrounding the lake (Pratt et al., 1966; Virani and Harper, 2009). The land has a high economic value and accounts for 75% of Kenya’s horticultural exports (Litterick et al., 1979; Harper et al., 1990, 2011). This intensive agricultural production is made possible by readily available irrigation water, good quality volcanic soil, and a tropical climate. There have also been large increases in development in the Hell’s Gate National Park south of the lake beginning at the end of the twentieth century for geothermal energy (Harper et al., 1990, 2011).
We explored how land cover has changed in our general study area and how it had changed in areas surrounding Augur Buzzard territories. To do this we created maps of land cover for the same three periods that territorial occupancy monitoring occurred (i.e., 1995–1996, 2010, and 2014). The classification of the study area into distinct categories of land cover was conducted using a random forest algorithm, which is based on ensemble decision tree classification (Breiman, 2002) and is widely used for land use and land cover mapping (Haas and Ban, 2014; van Beijma et al., 2014). The water category was defined as “areas covered by water,” the human category was defined as “all areas covered by human development, agriculture and settlements,” the open category was defined as “savannah and low shrublands,” and the closed category was defined as “forests, dense shrubs, and brush.”
Classification used 30 m resolution Landsat 5 (L5) Thematic Mapper (TM) images and Landsat 8 (L8) Operational Land Imager (OLI), downloaded from Earth Explorer [U.S. Geological Survey (2015) “Earth Explorer”1 ]. Landsat Surface reflectance products from both L8 (OLI) and L5 (TM) missions were used. These products have been pre-processed, removing atmospheric and sensor effects (U.S. Geological Survey, 2015). Bands 1–7 were used for the L8 images, and bands 1–5 and 7 for the L5 images. During each sampling period, we used these bands from two cloud free images for processing: 21st Jan 1995 and 4th December 1994 for the first period; 30st January 2010 and 1st January 2011 for the second; and 4th July 2014 and 12th January 2015 for the final period (4th July was the only cloud free image for 2014). The final sampling period used L8 images, while the others all used L5 images. All bands were processed at a 30 m resolution. The Landsat 5 Thematic Mapper was no longer operational by 2014, which necessitated the use of L8 images for the final survey period.
Supervised classification using the random forest algorithm was implemented using the package randomForest (Liaw and Wiener, 2002) in R V3.3.1 (R Core Team, 2016). Polygons were drawn around areas of known land cover type for all sampling periods and were used to select training pixels for the random forest algorithm. The process classified land cover into one of four categories, and we selected training data from each: (1) human development (including greenhouses, agriculture and urban development); (2) open natural vegetation; (3) water; and (4) closed forested or thick bush habitats. Using the training polygons, 100 training pixels per land cover type were selected, selecting 100 random training pixels from each type should reduce misclassification through both spatial autocorrelation and selection bias (Millard and Richardson, 2015). One thousand trees were fitted per classification process, in which a majority of votes among decision trees assigns the class. The number of variables to be selected and tested for the best fit when growing trees (Mtry), was set automatically by randomForest in R. The random forest algorithm uses a bootstrap sample of the data to train the model. This allows for the creation of an out-of-the-bag-error (OOB Error), using cross-validation of samples not selected during the bootstrap sample process. The OOB error provides an assessment of test set accuracy (Supplementary Table 1). After classification, accuracy of classification was assessed using several methods; the OOB error estimate; the proportion of votes for the correct class for each training pixel; and through visual validation of the classification product, overlaid on Google Earth.
Training polygons and training pixel selection was refined over several attempts for each land cover mapping period. Following the creation of the land cover products, we used a 5 × 5 focal smoother, which calculated the average value for each 5 × 5 raster neighborhood to reduce the variation in local land cover. Finally, all rasters were clipped using the 2014 lake high water level; the Naivasha lake level changes over time depending on various environmental conditions, and the lake was at its highest in 2014. Clipping the area allowed us to remove land from consideration that may have been covered by water due to rising lake levels in 2014.
Using the four land cover categories produced from the above process, land cover around nesting territories was then calculated between 1995 and 2014 at several scales. Within our study area, the center locations of active buzzard pair territories were on average 0.86 ± 0.33 km apart from each other (where 0.86 is the mean value of the Nearest Neighbor Distance; Virani, 1999), suggesting home range sizes with radii that ranged between 0.25 and 0.6 km. However, the home range size of raptors are correlated with their body size, and holarctic raptors with similar body sizes to buzzards can have much larger home range sizes (Peery, 2000). Therefore, we quantified human development at the five different radii: 0.1, 0.5, 1, 2.5, and 5 km; allowing for conditions where we under and overestimate the buzzard’s home range size. To allow us to further explore whether territorial occupancy or abandonment was related to increases in human development within a pairs home range, the change in land cover between the first and last survey period was calculated. For each radii, we calculated the percentage of pixels belonging to each land cover classification at each survey period. Change in human development was then calculated as the difference in percentage of that land cover type between the survey periods.
We monitored Augur Buzzards in order to count the number of active territories per study year in five areas in the Lake Naivasha region (Figure 1): (1) Hell’s Gate National Park (Hell’s Gate) characterized by large cliffs, which are important nesting areas for raptors (Lester, 1991), (2) Olkaria Geothermal Power Station, located on higher ground in the southwest part of Hell’s Gate with numerous steam vents. While power has been generated here for decades, recent years have seen large increases in construction of the station into three separate facilities. (3) Mundui area to the west of Lake Naivasha, which consists of Acacia woodland with tall, open-canopy Acacia xanthophloea trees intermixed with open grasslands. Agricultural activities are limited to subsistence use, domestic livestock grazing is minimal to moderate, and human settlement is moderate. (4) Sulmac, and (5) Oserian areas have considerable horticultural activity (flower farms) and higher human settlement levels. There are several small open and closed canopy woodlands dominated by Acacia xanthophloea in residential areas and around the lake edge.
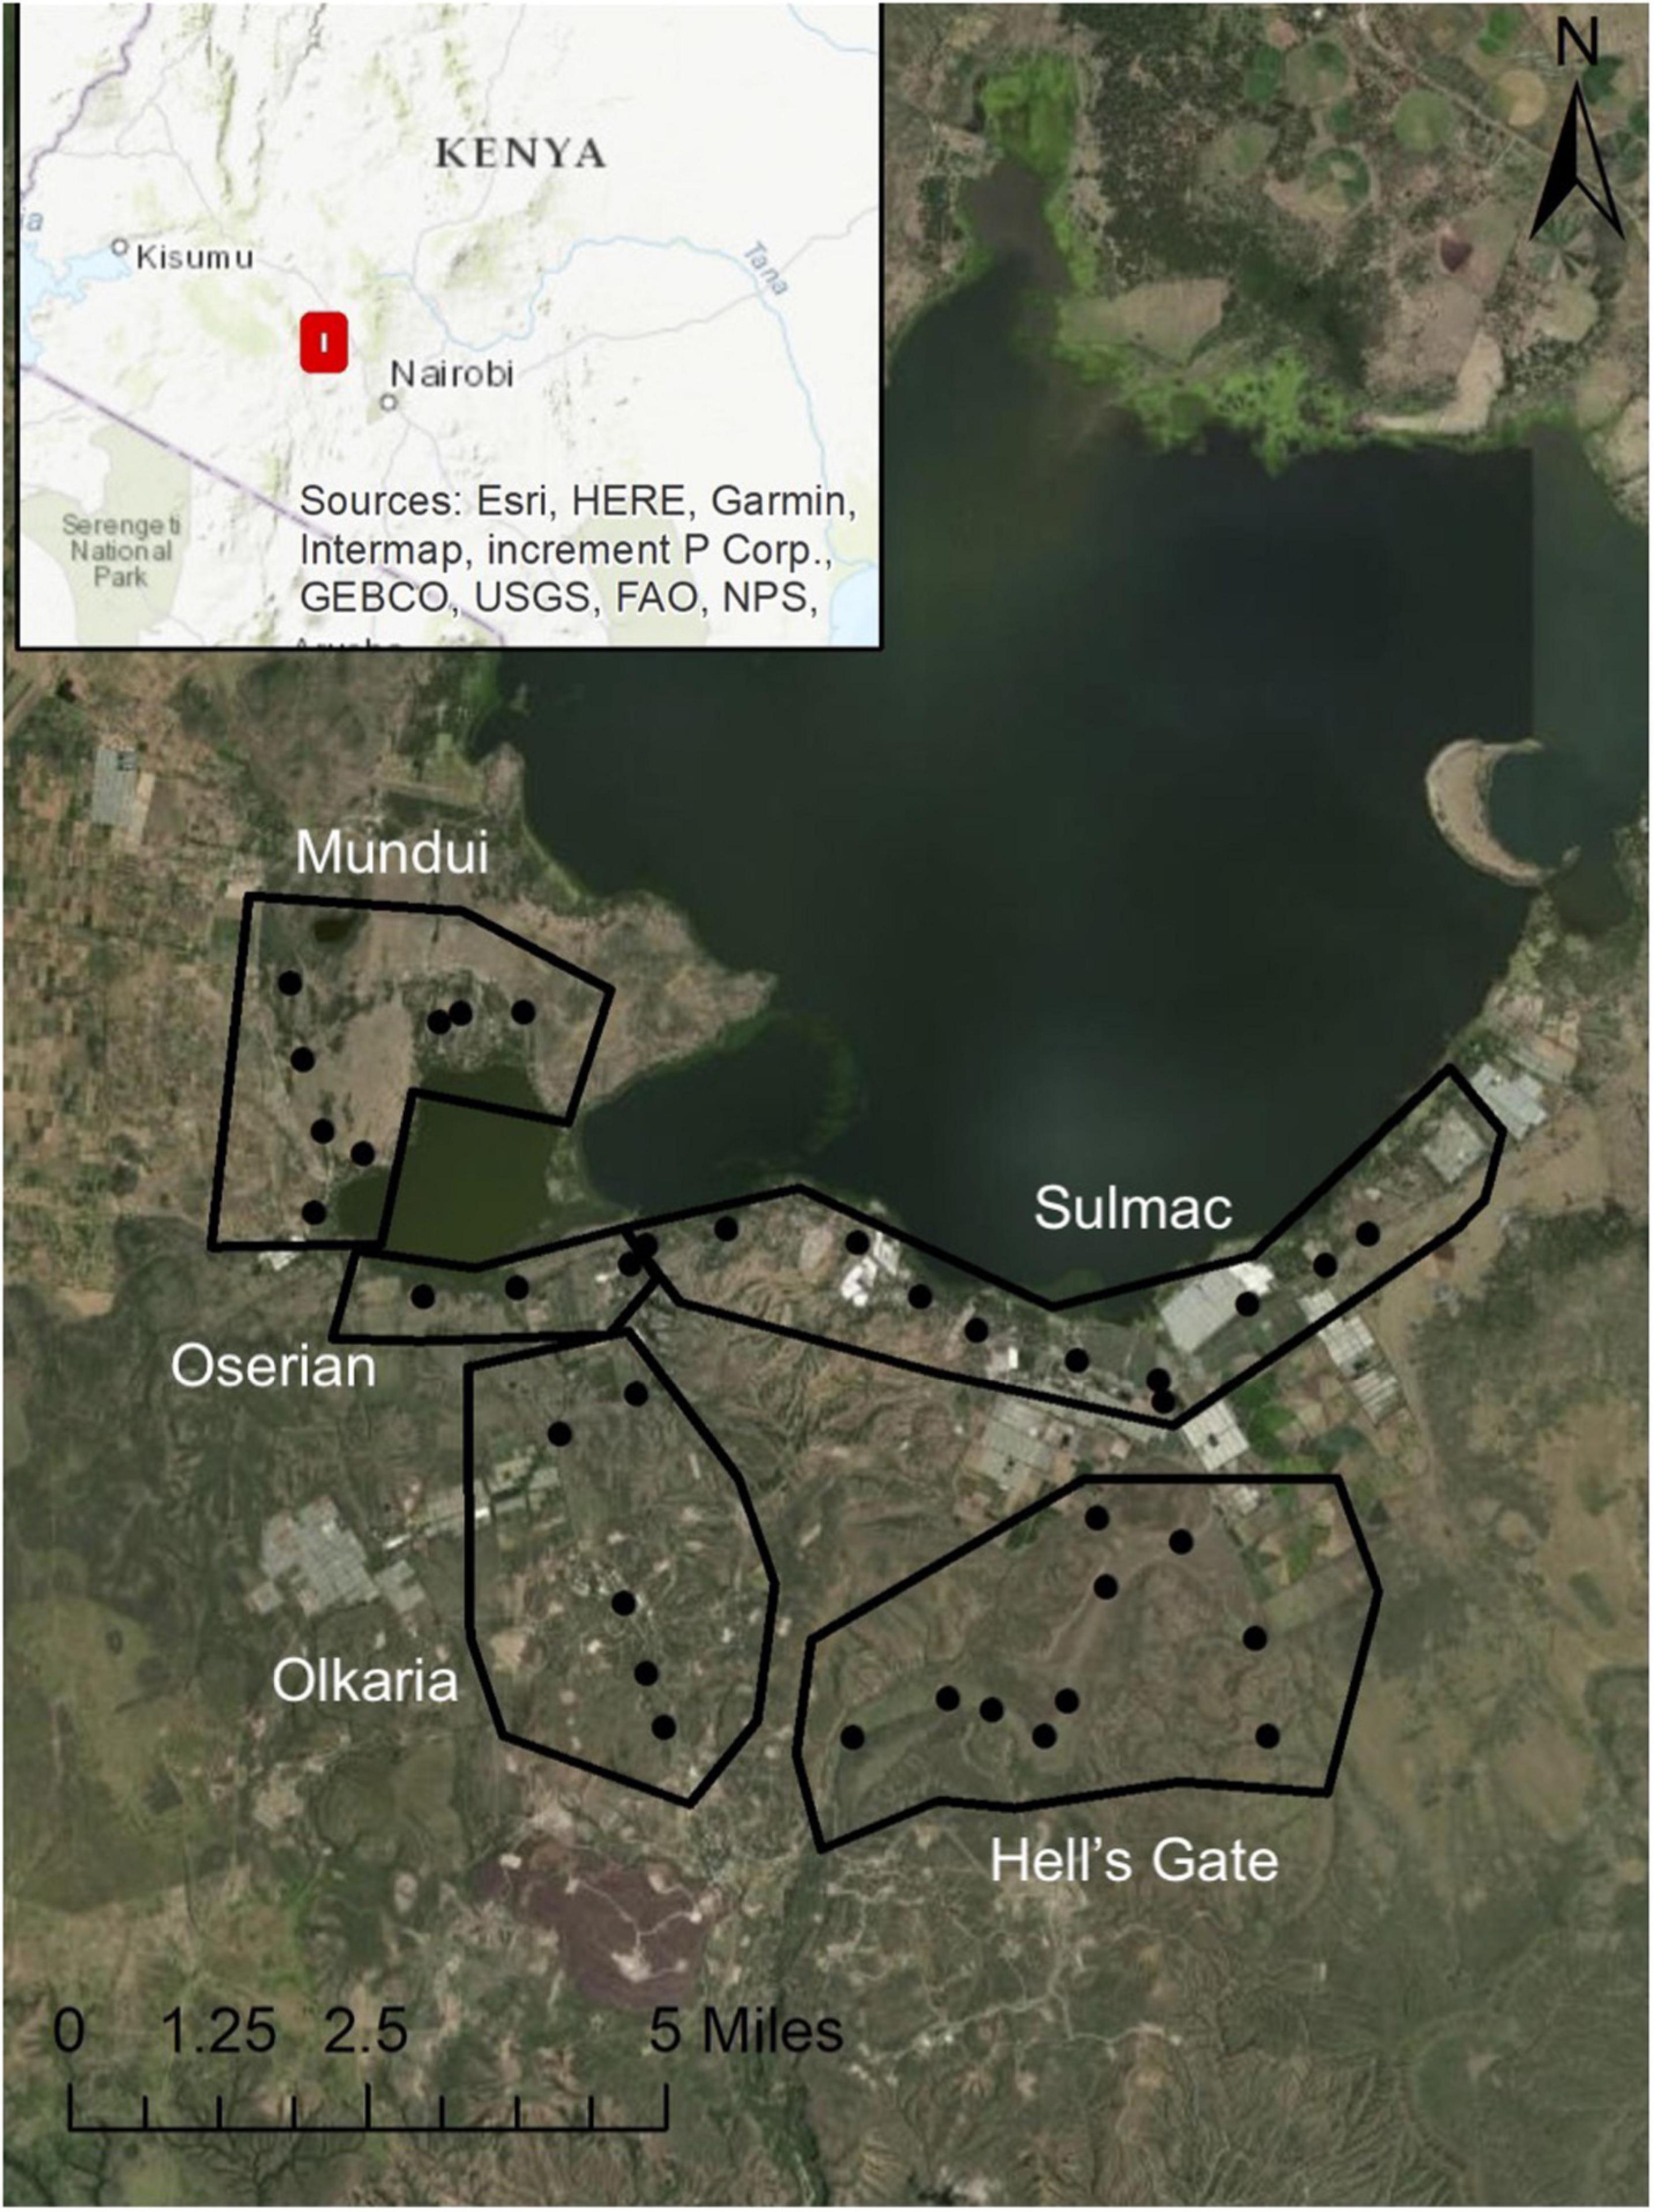
Figure 1. A map of the southern Lake Naivasha region, with polygons showing the general locations of each study area and points showing centers of buzzard territories as found in 1995. Esri, Maxar, Earthstar Geographics, USDA FSA, USGS, Aerogrid, IGN, IGP, and the GIS User Community.
Augur Buzzard breeding surveys were conducted for a cumulative total of 5 non-consecutive years between 1995 and 2014. Surveys from 1995 to 1997 from April–July provided a comprehensive baseline of territories in the region. These territories were revisited more than a decade later from April–July 2010, and then again in May–July 2014. Additionally, to ensure no new territories were missed, we also conducted a full census for potential new occupied territories (occupied with at least one buzzard) within the entire study area in each of the two later re-survey periods.
Surveys were conducted via bike or foot during all daylight hours, although primarily in the morning. Observations were mainly conducted from existing roads, with routine stops being made approximately every 200 m (depending on habitat type and visibility) to scan for Augur Buzzards. Whenever an Augur Buzzard was sighted, the time and specific location was recorded, plumage patterns were documented (e.g., morph), legs were checked for bands, and if possible, a photo of the individual was taken. With subsequent re-sightings of birds, plumage patterns were cross-referenced to existing photos and descriptions, and location, direction of travel, and perch data assisted in the delineation of territories. Distinct plumage patterns from the species’ polymorphism led to a high level of confidence in recognizing individuals within breeding territories (Krüger et al., 2001). Territorial pairs were often seen in pair flight. In many cases, Augur Buzzards were observed that did not belong to an established pair. This was determined by closely monitoring behavior. Evidence that individuals were non-residents included high, directional flight through multiple territories, having no re-sightings of the individual in a location, and/or having sightings of multiple unique individuals in an area. These birds were not counted to be part of an occupied territory.
We explore whether human development was linked to abandonment of territories using a Generalized Linear Model (GLM), implemented in R version 3.3.1 (R Core Team, 2016). The response variable in these analyses was territorial abandonment between our first (1995–1996) and last survey period (2014), which was fitted as a binary response variable, where 1 = occupied and 0 = abandoned. We explored whether changes in human development between 1995 and 2014 were associated with abandonment. For this analysis, our explanatory variables were: (1) the initial % of human development, (2) the % of change in human development and (3) the five-level categorical “location” term. We fitted the initial levels of human development, since we thought it was potentially important to control for this term before fitting the levels of change. For example, 20% change might be important in driving abandonment if initially there is already considerable human development surrounding a territory but may be less important in more pristine areas. Again, we ran this analysis separately for the five different radii.
We explored the evidence for an association between territorial abandonment and the explanatory variables at each radii using an information theoretic approach (Anderson et al., 1998), ranking all possible models by their AICc scores. In this way all variables, singularly and in combination with all other variables were examined. When there were competing models, we calculated their model average estimates and 95% confidence limits for the plausible models (<2ΔAICc) using the MuMIn package (Barton, 2020). We then assessed their relative importance scores, and whether their model average parameter estimates overlapped zero.
Total land cover use within the study area changed considerably over the course of the study (Figures 2, 3). Human development had the largest change, increasing from 9 to 24% between 1995 and 2014 (Figures 3, 4). Sulmac had the largest increase in human development, increasing from 21.5 to 34.6%, while Hell’s Gate National Park had the lowest increase in human development across the study period (0.1–0.8%). Much of this land change occurred in the beginning of the twenty-first century, before the second re-surveys in 2010. At the territory scale change in human development within 1 km varied considerably, but the majority of sites (62.2%) showed an increase, with 43.4% showing an increase of > 10% (Figure 5).
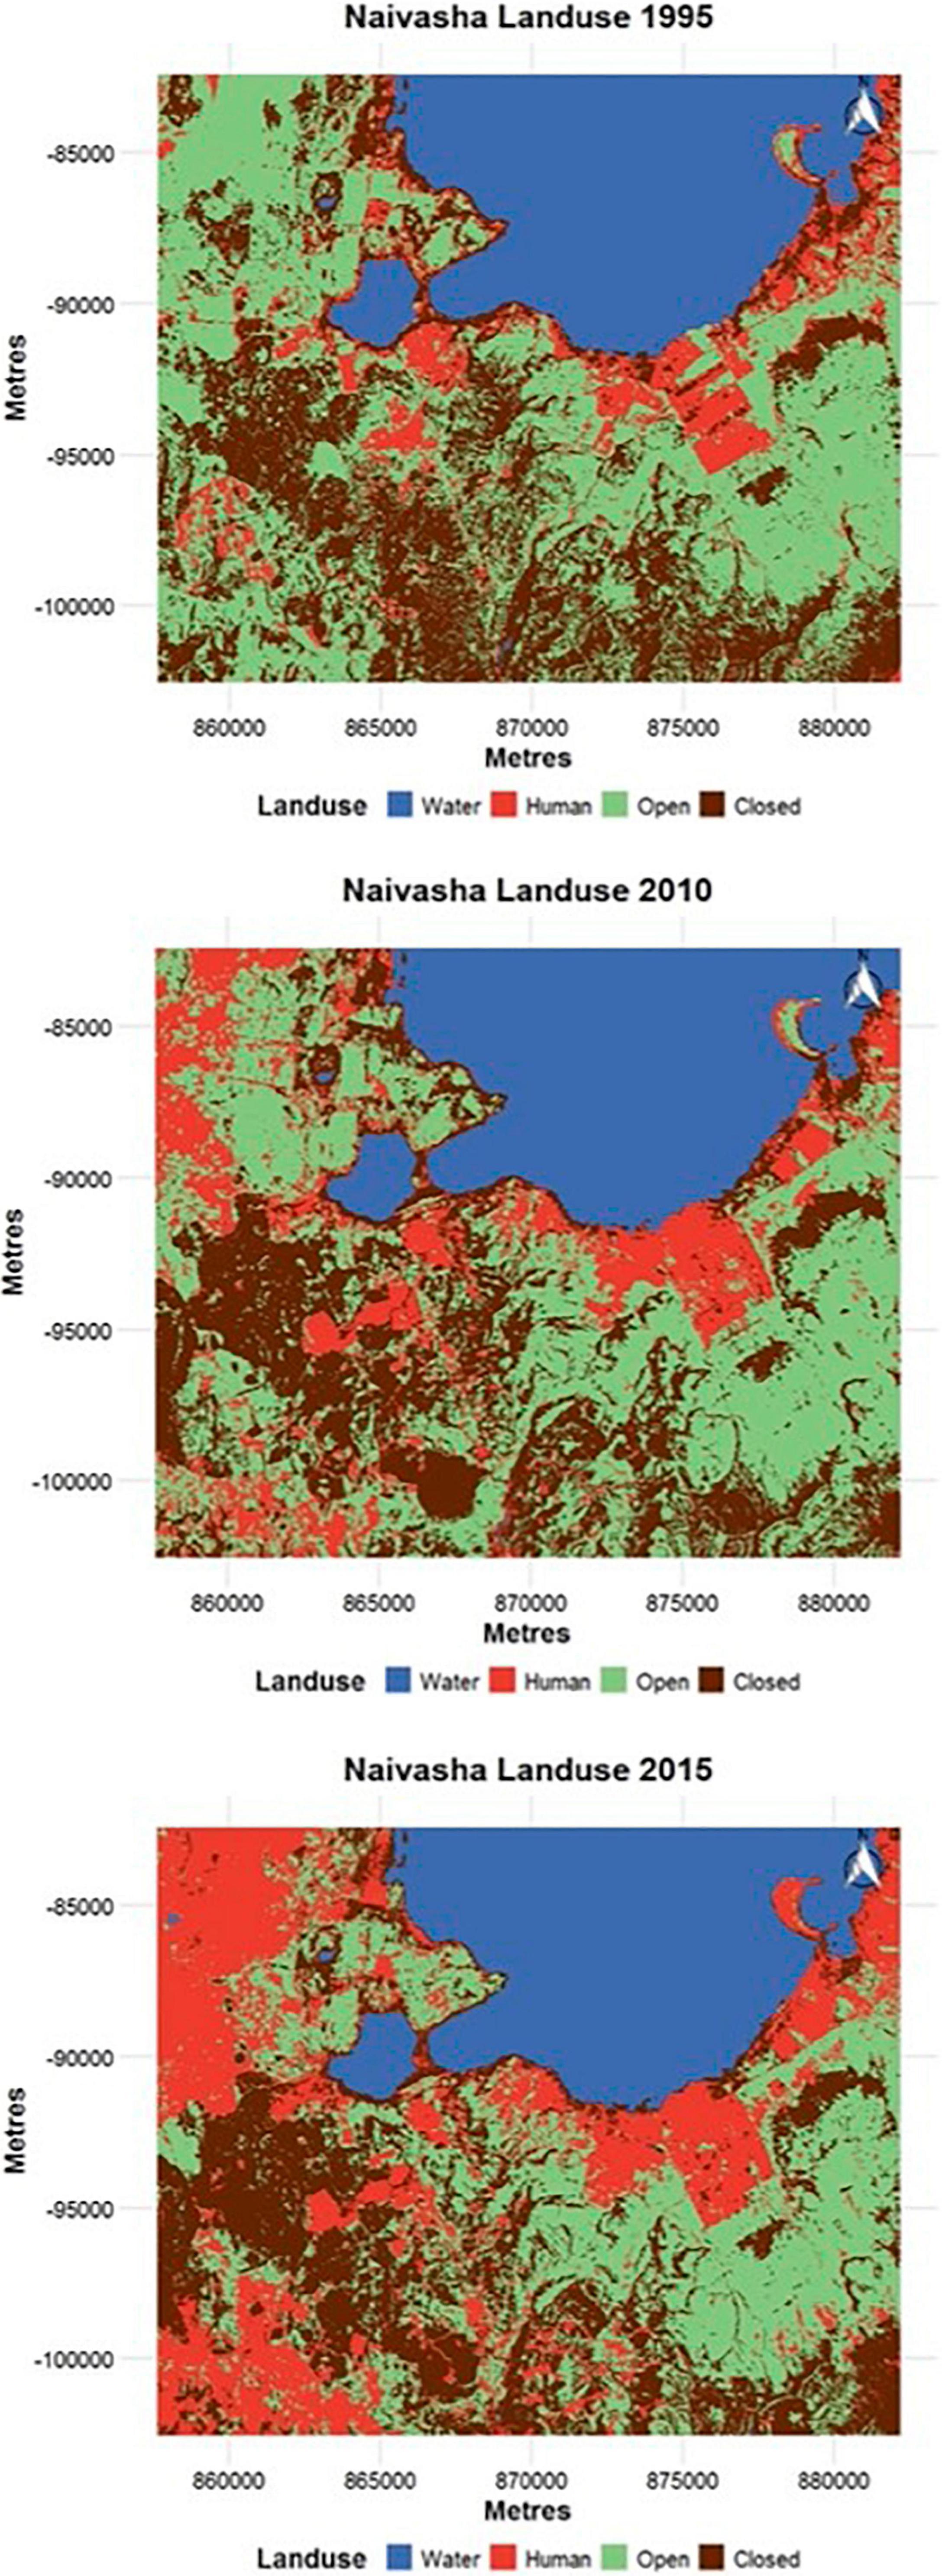
Figure 2. Land use change in the region south of Lake Naivasha from 1995 to 2010. The water class refers to all areas covered by water, the human class refers to all areas covered by human development, agriculture and settlements, the open class refers to savannah and low shrublands, and the closed class refers to forests and dense shrubs and brush. Human development, agriculture and settlements increased by a large degree over the course of the study period, particularly to the west of Lake Naivasha.
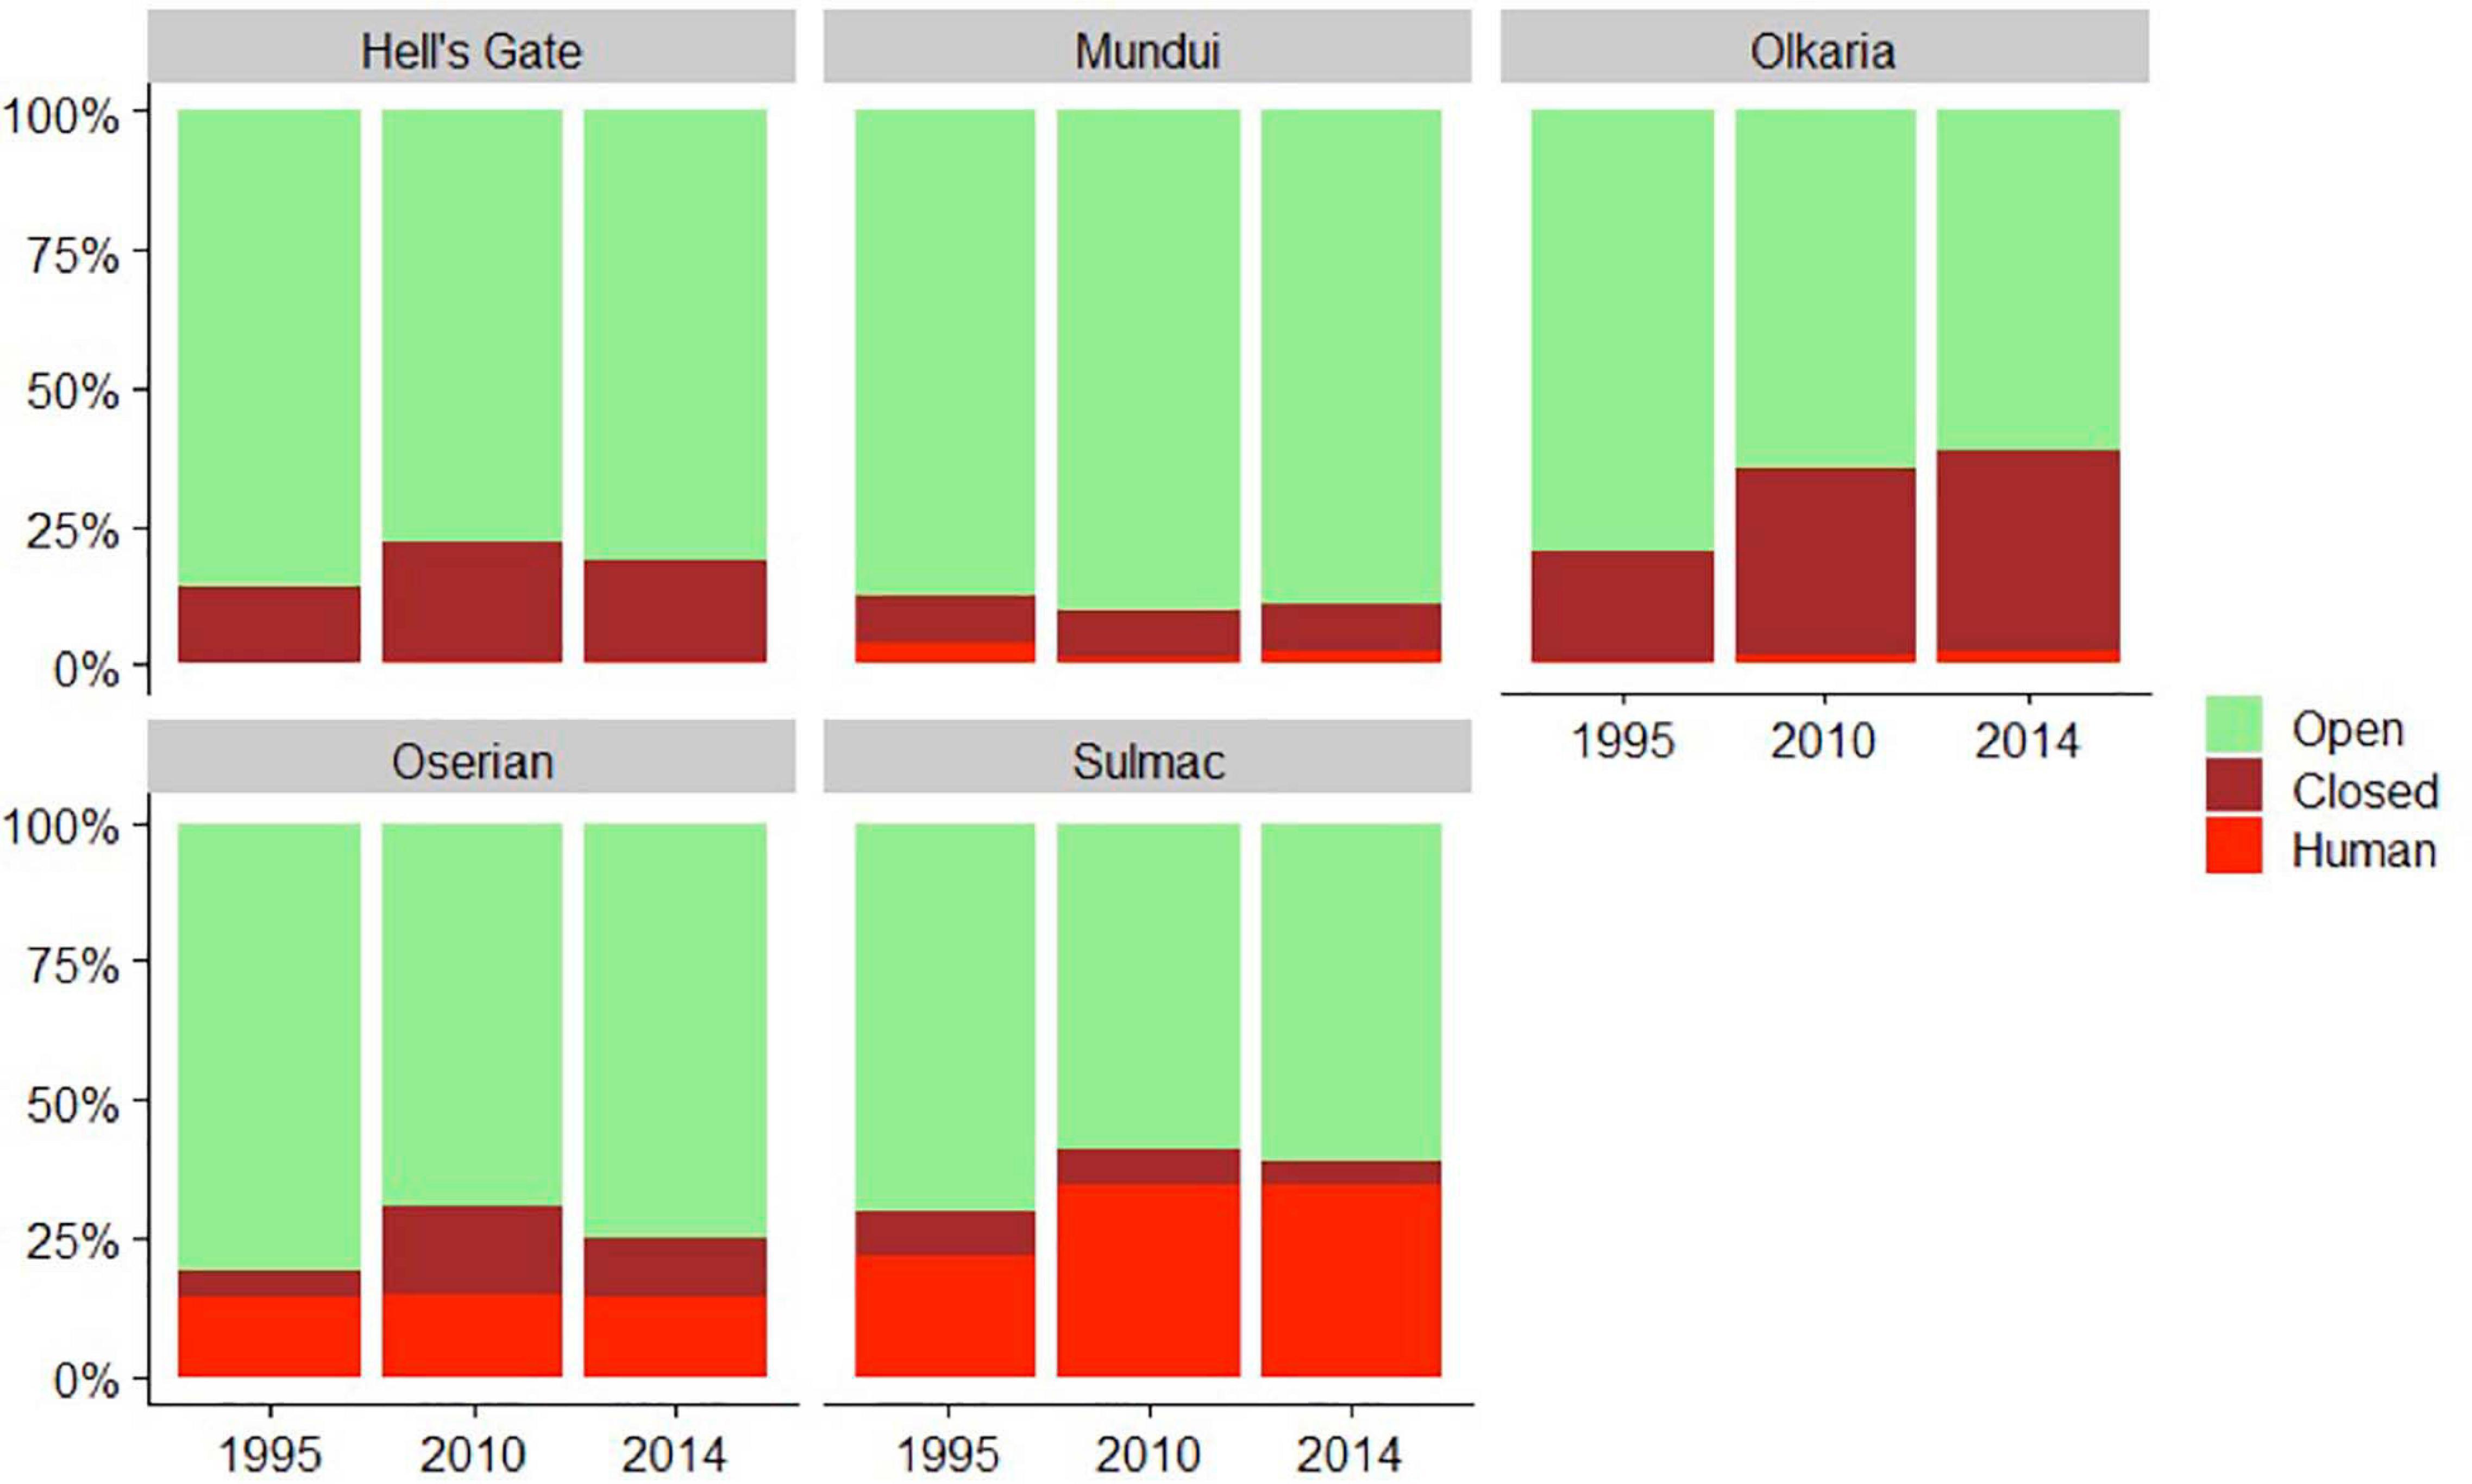
Figure 3. Percent coverage of open, closed, and human development land types in each region of our study, split across 1995, 2010, and 2014.
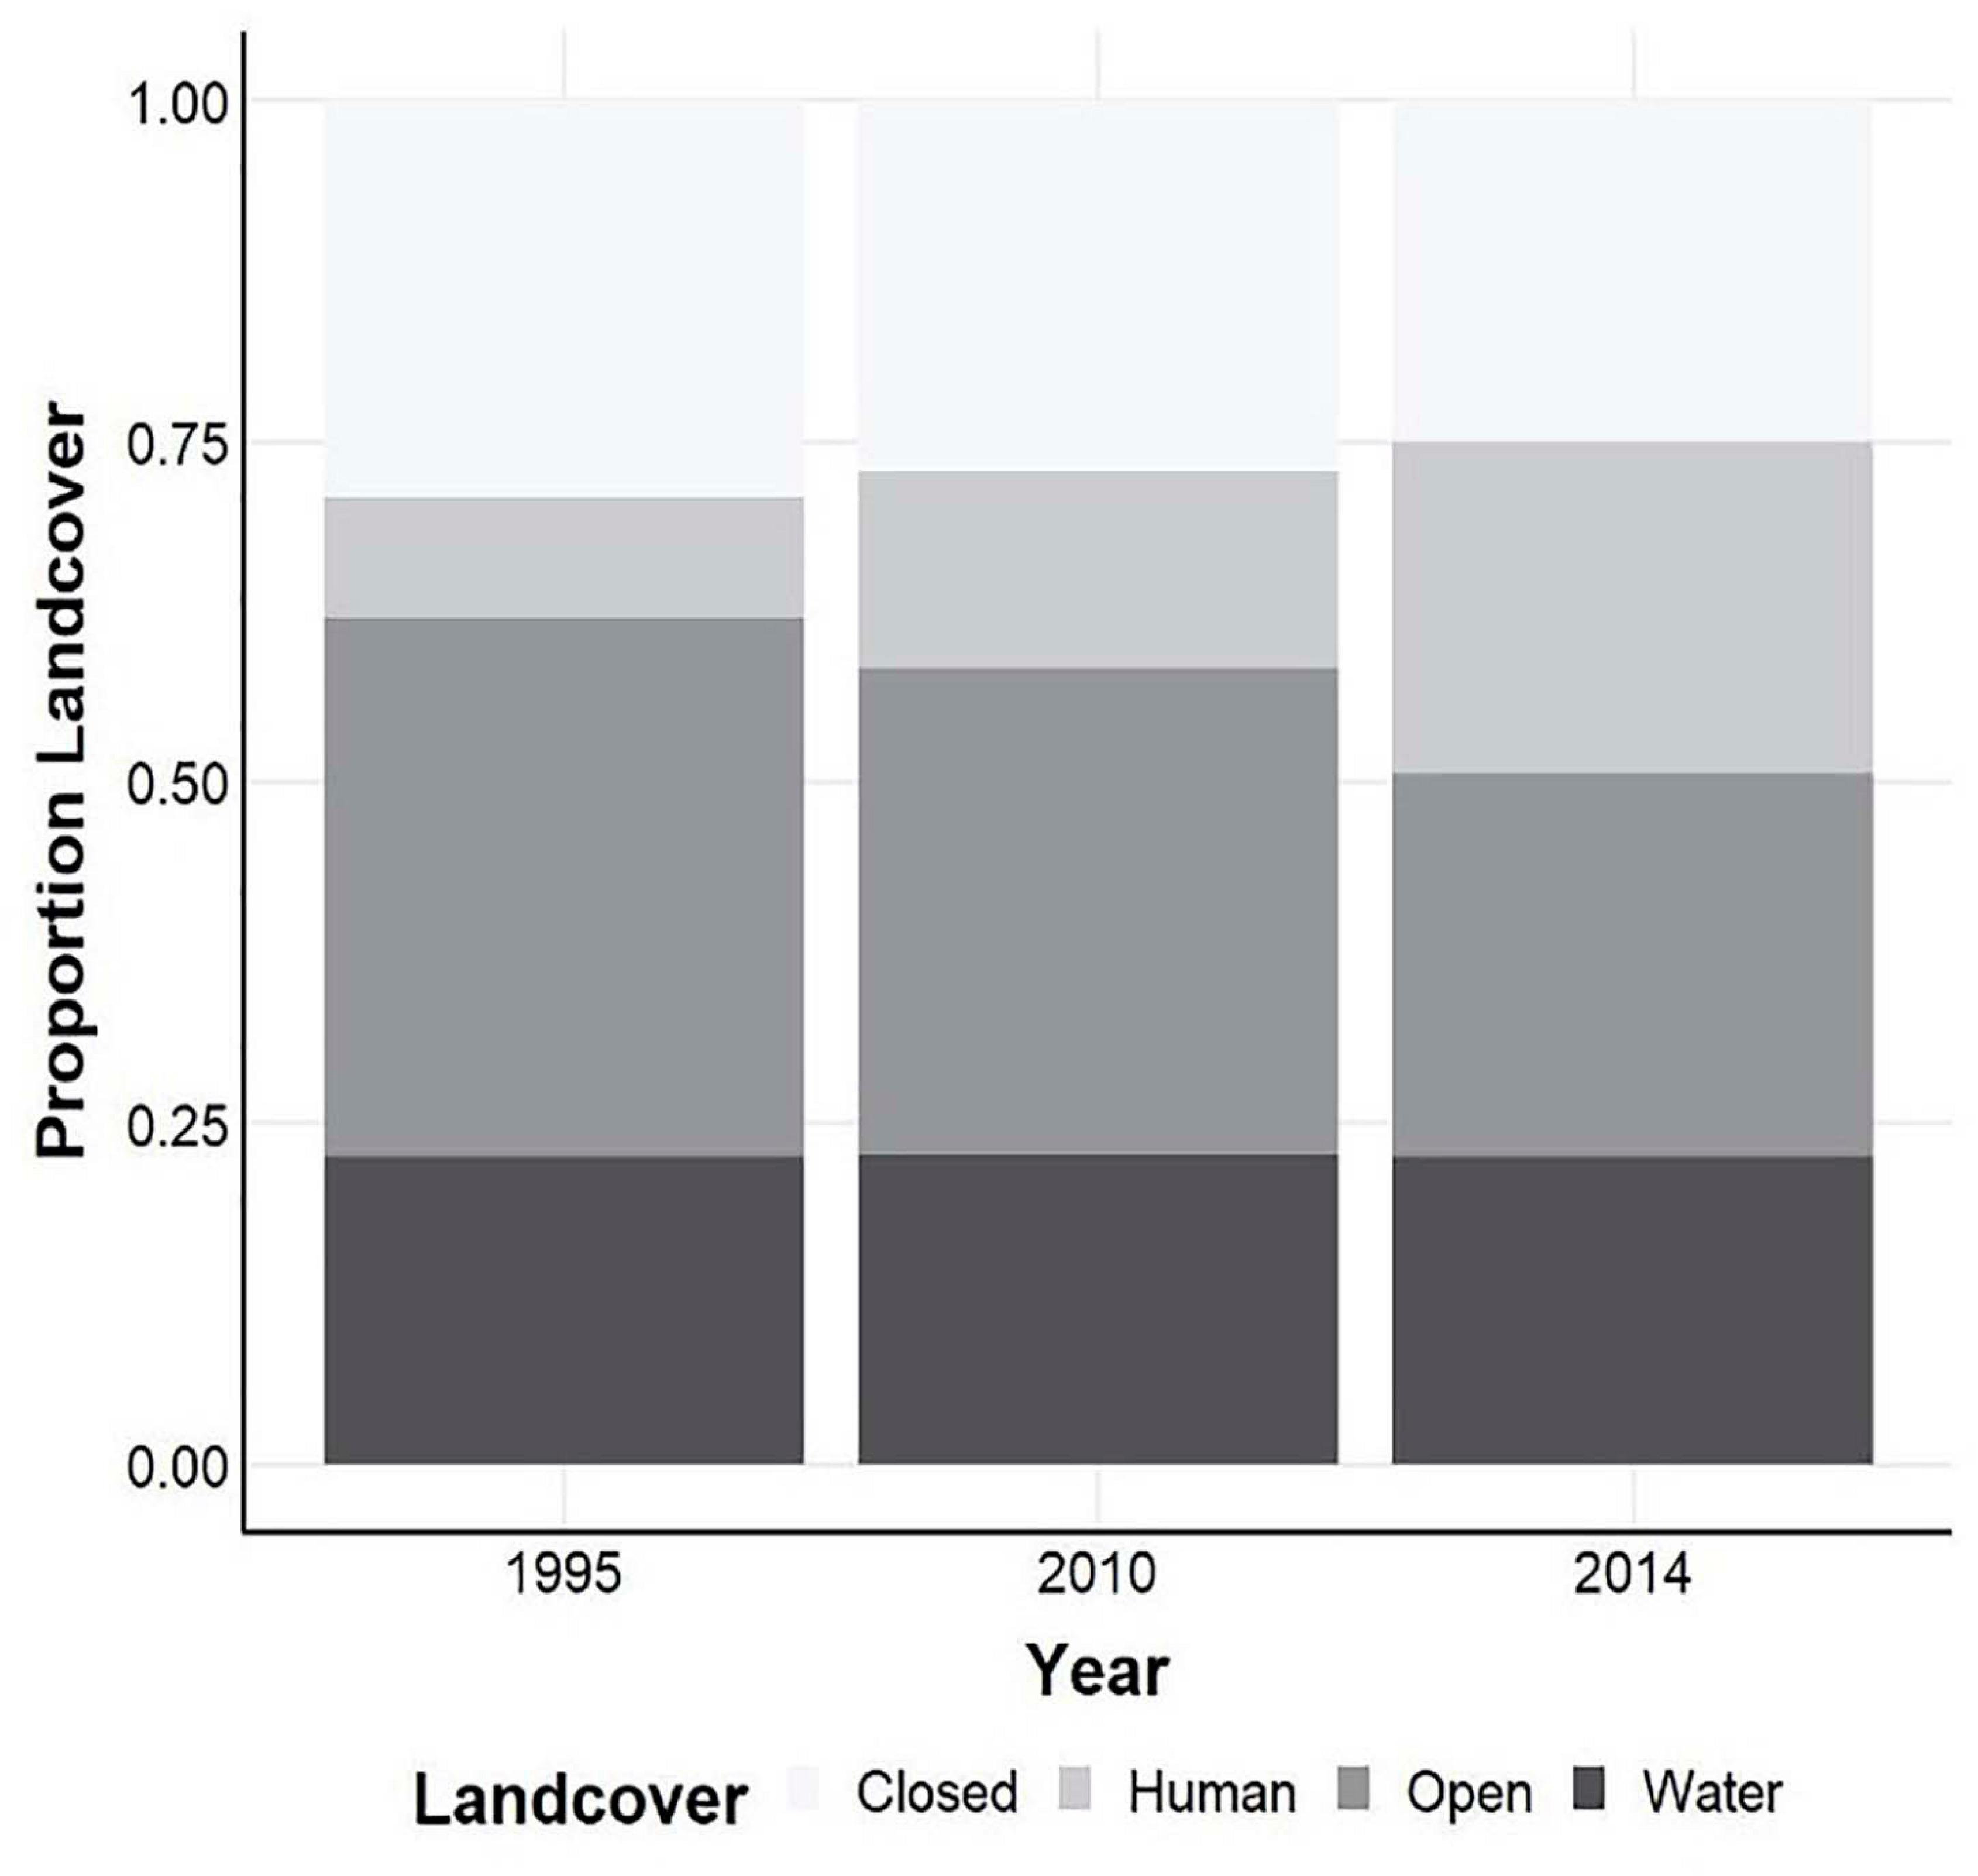
Figure 4. Estimates of landcover for classifications of 1995, 2010, and 2014.
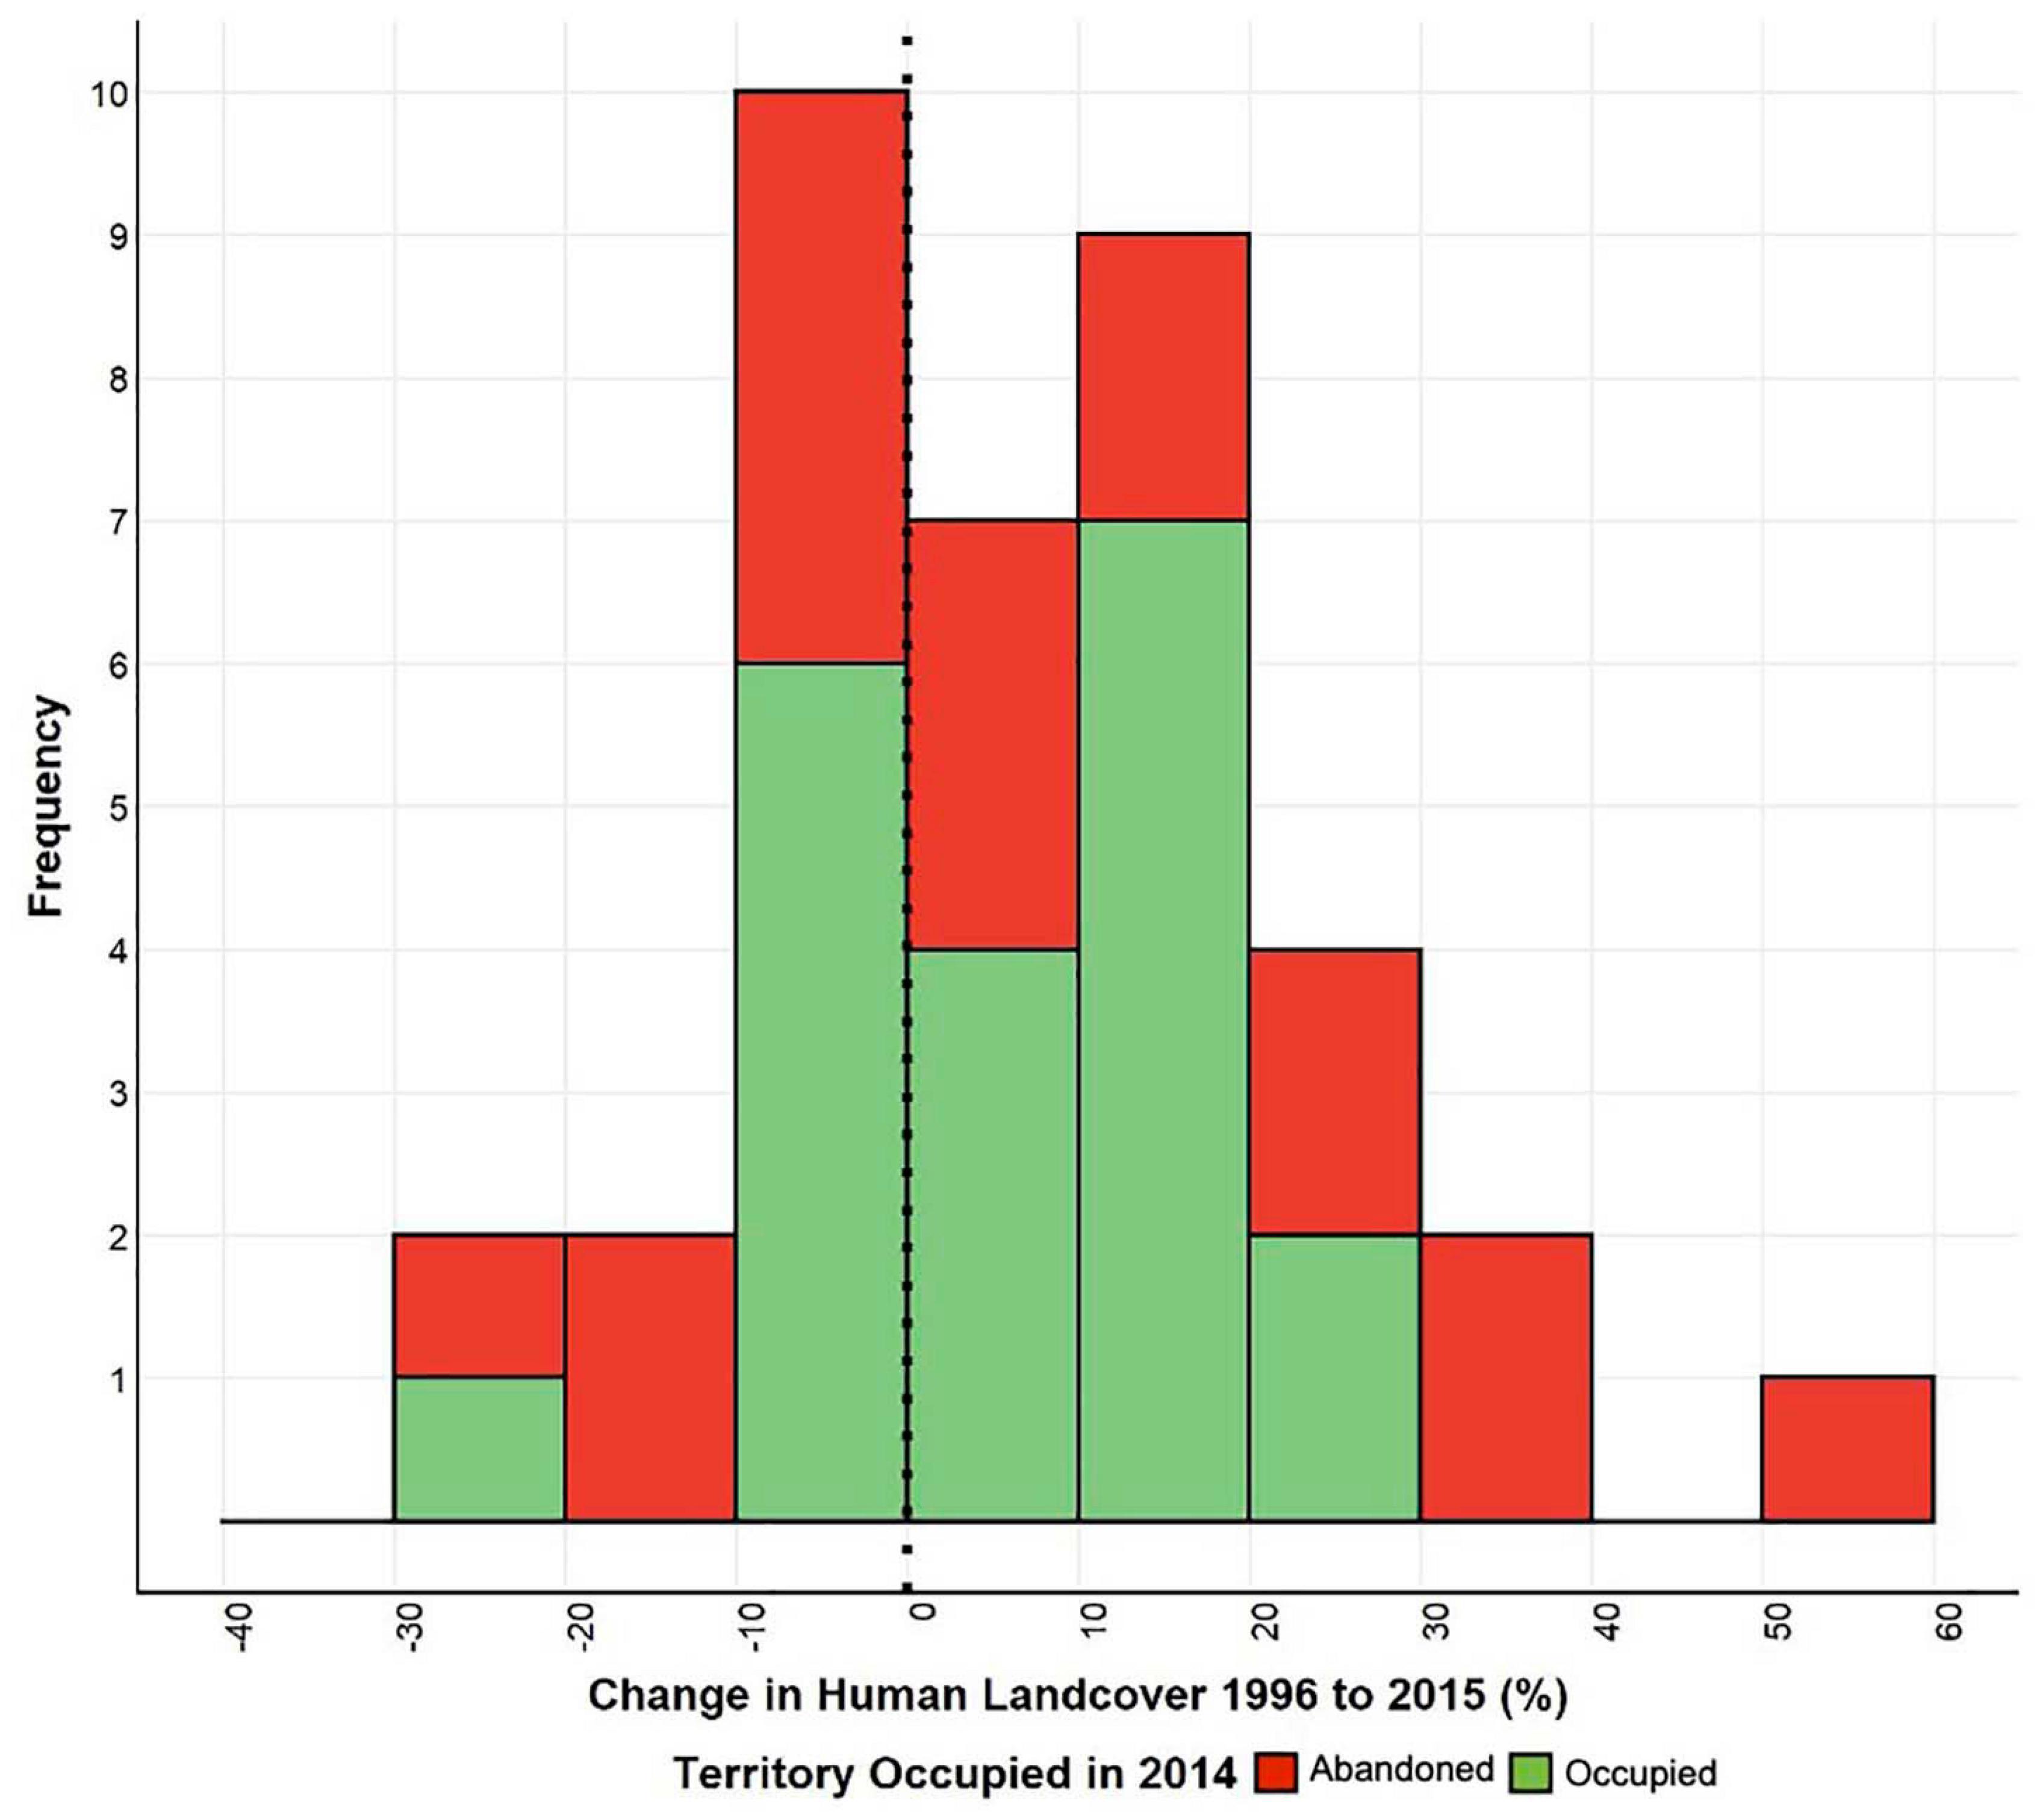
Figure 5. Histogram of changes in total percent human development for each buzzard territory at 1 km.
A total of 38 occupied territories were found in the study area in 1995. This had declined to 24 occupied territories in 2010, and by 2014, only 20 territories remained occupied. This equates to a decline of 47% in the number of occupied territories over a 19 years period from 1995 to 2014 (Figure 6), or an annualized decline of 3.1%. This would translate over three generations time period (24.3 years) to a decline of 54%, generally in areas with greatest change in land cover. Between 1995 and 2014, declines were evident at all of the 5 areas. The greatest declines occurred in the Sulmac region, where the numbers of occupied territories declined from 11 to 3 and human development had the largest increase. However, even in the protected area of Hell’s Gate National Park, the number of occupied territories declined from 10 to 6, while Mundui Estates fluctuated in the number of occupied territories, dropping from 8 to 6 and then rising to 7 (Figure 6).
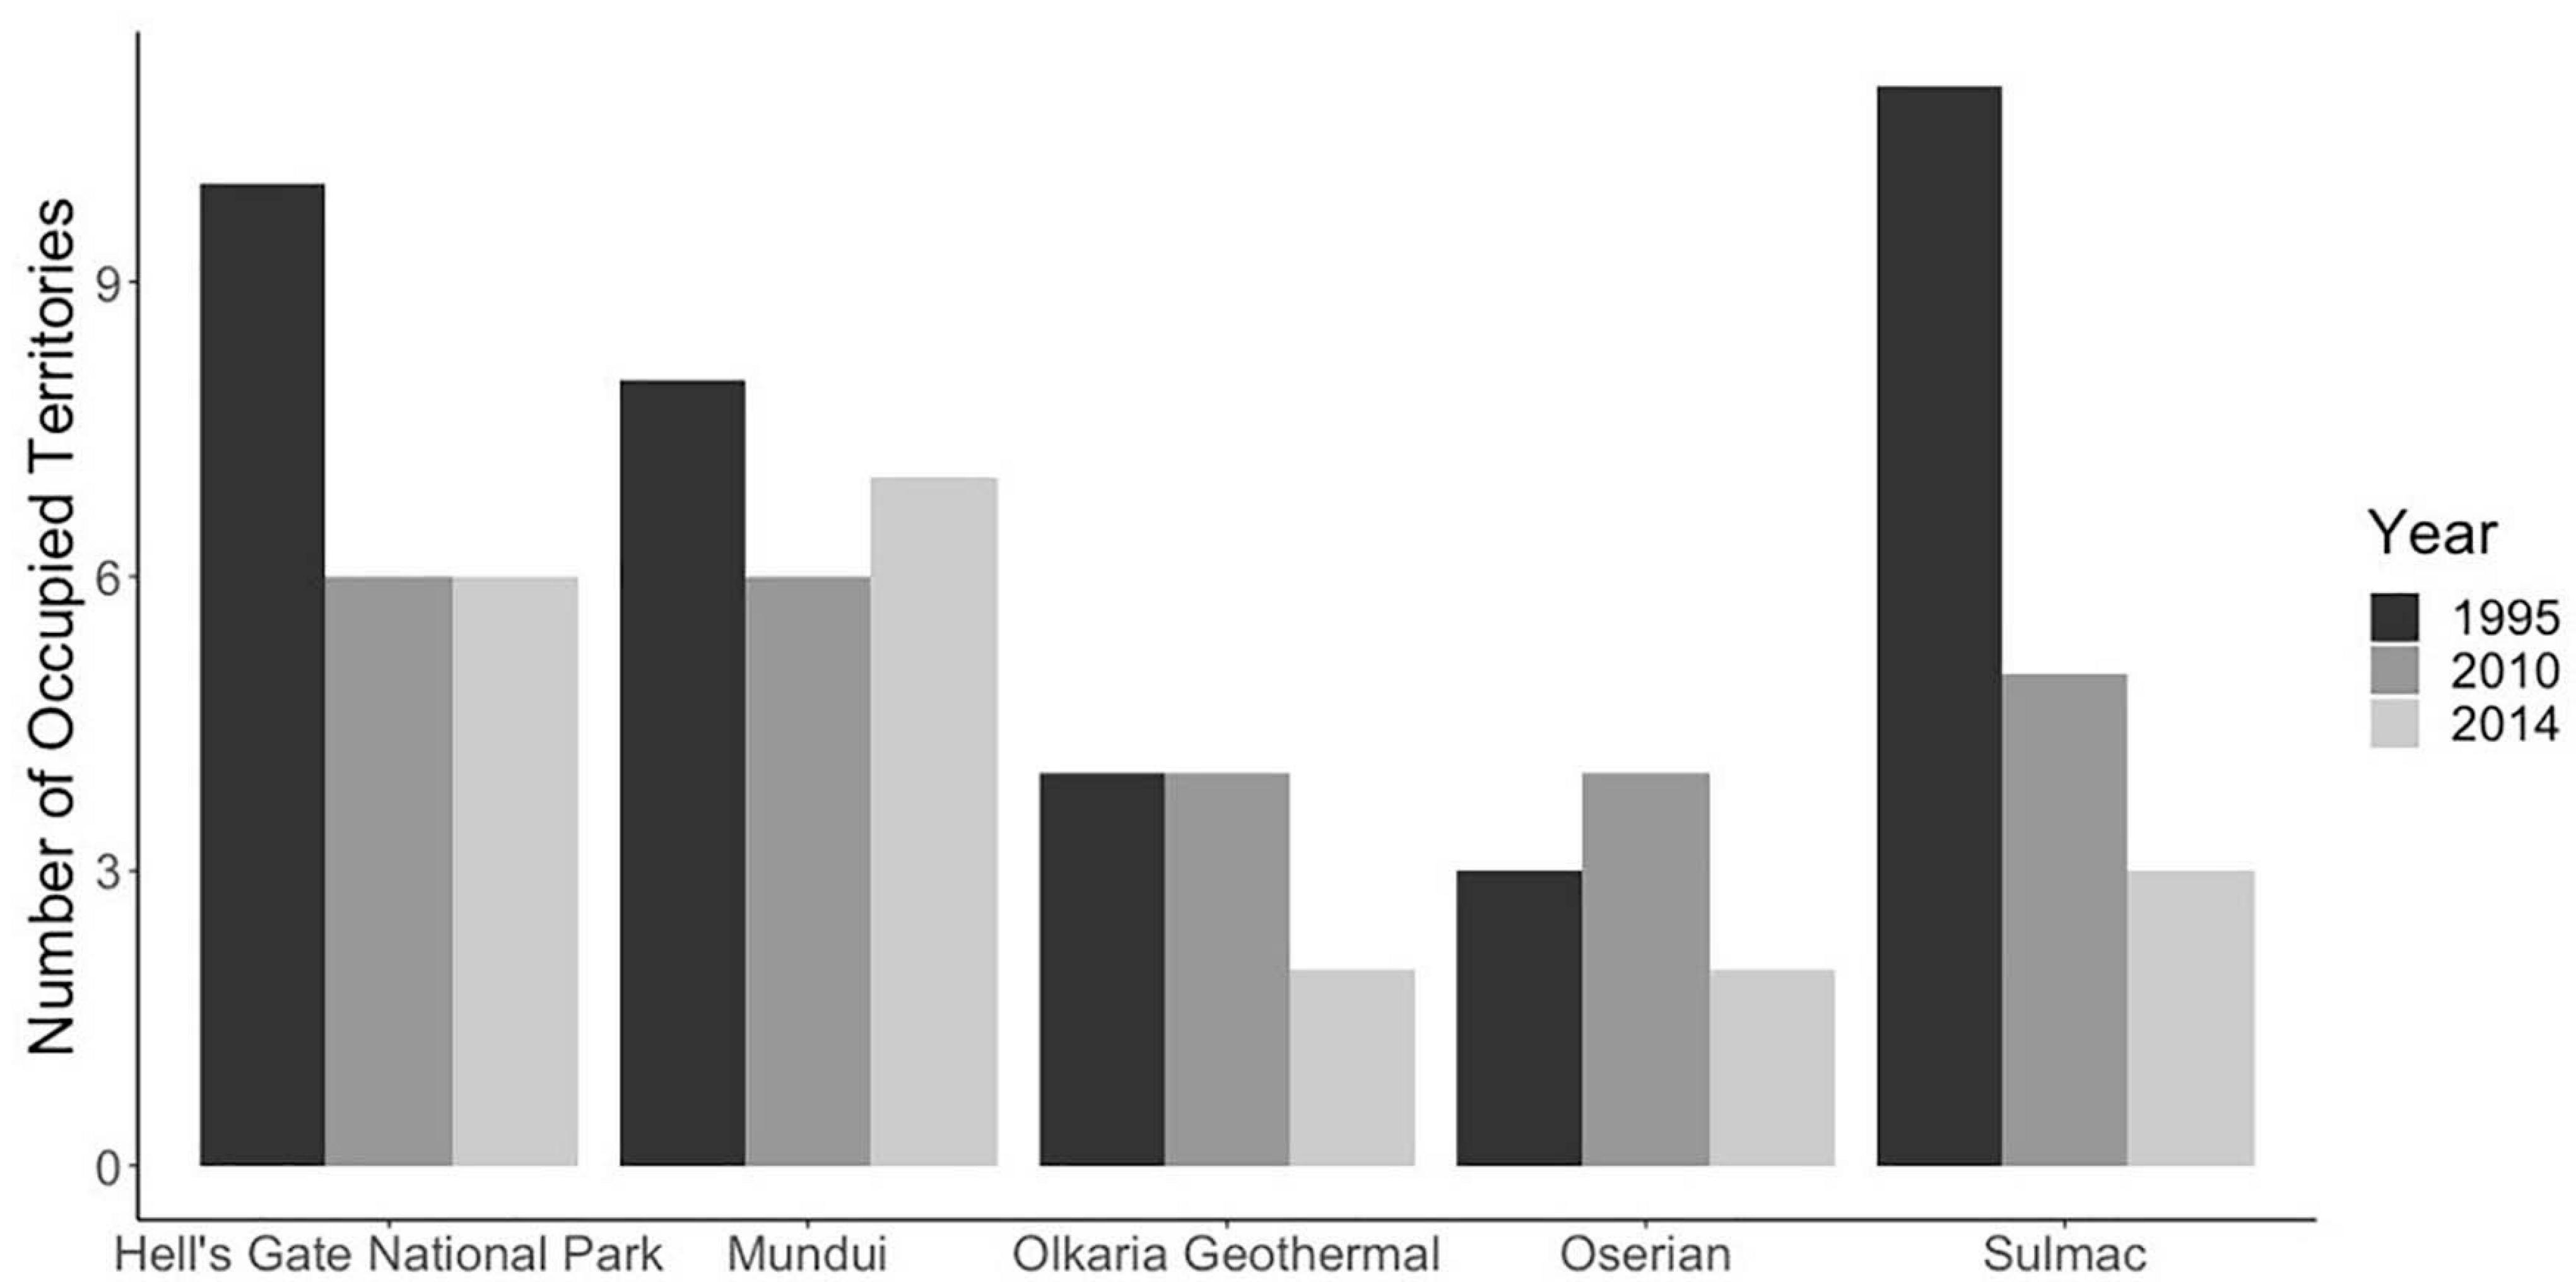
Figure 6. Numbers of occupied territories over in 1995, 2010, and 2014s in five study areas around the south of Lake Naivasha. Overall numbers declined from 38 occupied territories in 1995 to only 20 occupied territories in 2014, a decline of 47%.
The current levels of human development (Human) appeared in all plausible models (with ΔAICc < 2) for the radii of 500 m to 2.5 km. The best fitting model (i.e., lowest AICc) from all the analyses was for a linear negative association between current human development and probability of occupancy at the 1 km radii. This term was also the variable with the highest relative importance weighting (0.69) (Figure 7 and Supplementary Table 3). However, in all models the confidence limits of the human development variable overlapped zero (Supplementary Table 3), and in all models the null model was within ΔAICc < 2. For models exploring the 5 km radius, the human development term became uninformative, not featuring in any of the plausible models. Location did not appear in any of the plausible models (Supplementary Table 2).
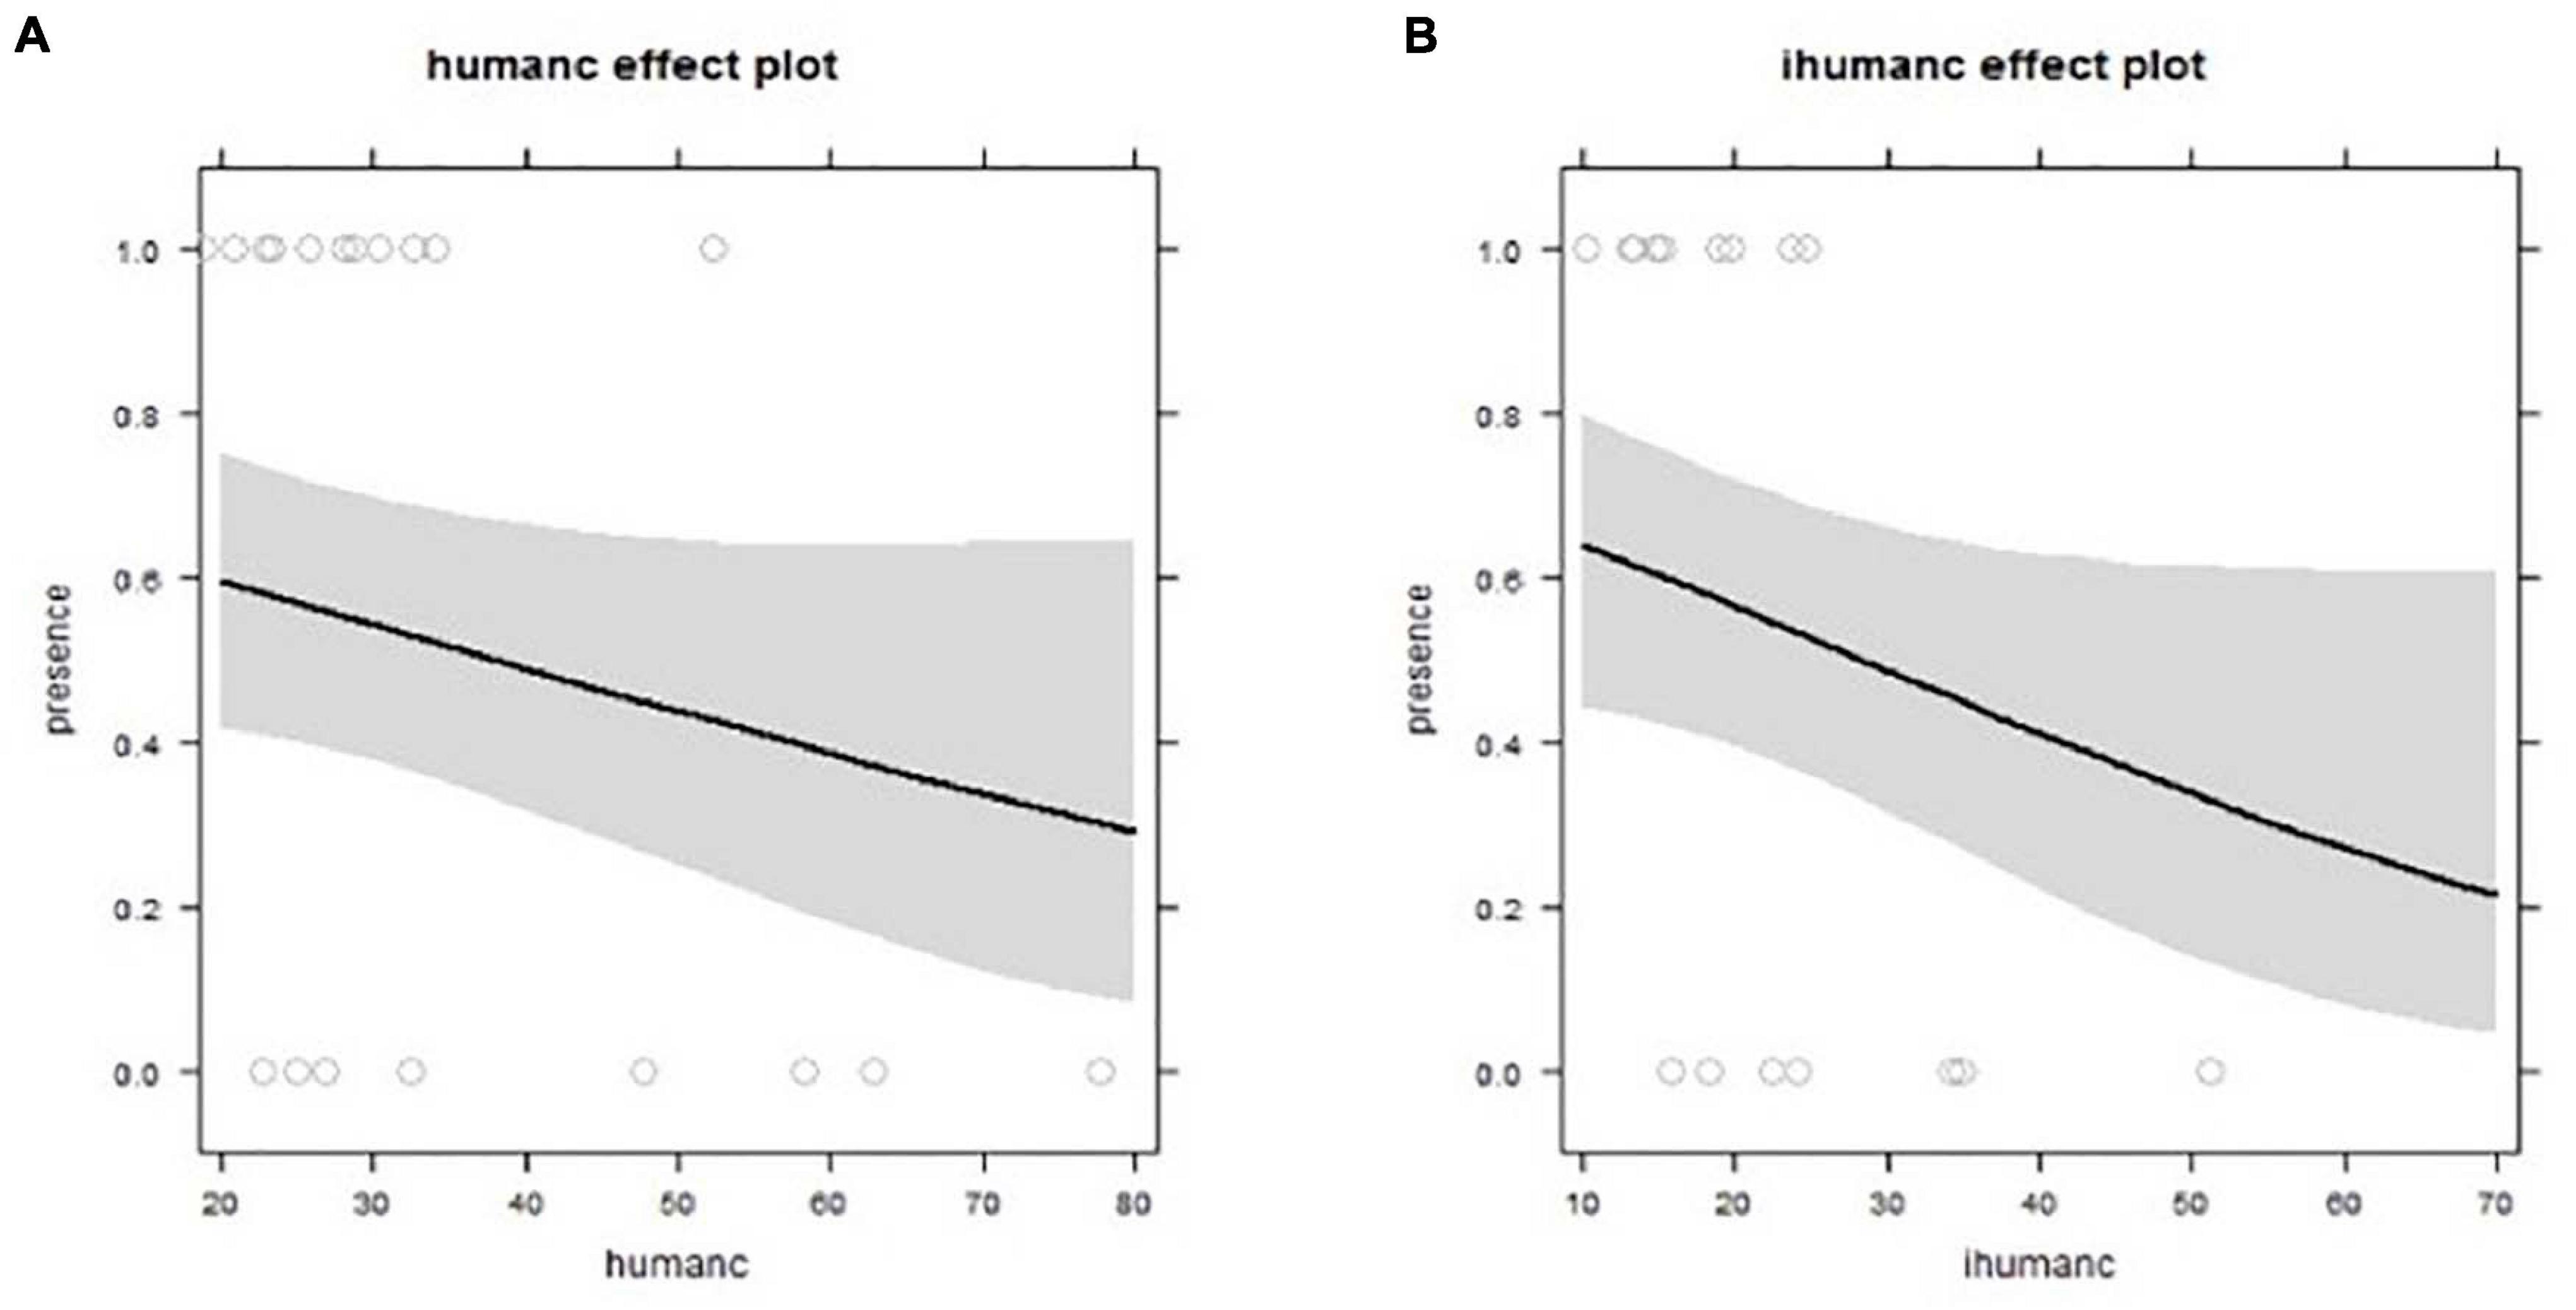
Figure 7. Relationship between territorial abandonment in relation to (A) current human development (humanc), from best fitting model (1 km radii); and in relation to (B) longer term percentage change in human development (ihumanc), from the best fitting model (0.1 km radii).
We found little evidence supporting the hypothesis that changes in percentage of human development between 1995 and 2014 surrounding a territory influenced the probability of its abandonment (Supplementary Table 2). Indeed, this change term only featured in plausible models at two radii (2.5 and 5 km), and even in these models, the terms had a relatively low importance score (0.14 and 0.44, respectively) with parameter estimates that overlapped zero. Initial human development featured in all top plausible models (<2ΔAICc) for all radii. The best fitting model with the lowest AICc was the linear effect of initial human development at the smallest radius (0.1 km). However, again in all models the parameter estimates overlapped zero, suggesting that the term was only weakly informative (Supplementary Table 2).
During our survey period, remotely sensed data showed substantial changes in land use within our study area around Lake Naivasha, with human development showing the largest increases in area. Such increases are not unique to this area in Kenya, as 30% of the land-cover in East Africa has been converted for use by humans (Jacobson et al., 2015). During this same time period, we found that Augur Buzzards in the region south of Lake Naivasha had declined by 47% or an annualized decline rate of 3.1% per annum. Based on a generation length of 8.2 years (Bird et al., 2020), this translates into a decline of 54% over three generations. Thus, if this rate of change was representative of declines for the species across their distributional range, it would qualify the species to be up-listed from Least Concern to Vulnerable (Butchart et al., 2004; BirdLife International, 2020).
Although we confirmed our hypothesized changes in land cover and buzzard occupancy, we found that at the level of individual territories, territorial abandonment were not associated with current or increased levels of human development. This survey only represents a small portion of the species range, and therefore more studies are needed to see if these trends can be generalized. However, the lack of a clear association between territorial abandonment and human development surrounding a territory does not necessarily mean that human development is not responsible for the overall decline in the number of occupied Augur Buzzard territories. We found that Sulmac had both the largest amount of human development and the largest increase in human development (21.5–34.6% over the course of the study period), and prior published mark-and-recapture research from 1995 to 2009 in these same study areas showed that Augur Buzzards in Sulmac had a mortality rate of 20.8% (Virani and Harper, 2009). On the other hand, Oserian had the second-largest amount of human development but did not increase in said development over the course of the study, lost a net total of 1 territory, and was found to have 3.3% buzzard mortality in prior research (Virani and Harper, 2009).
Although our models do not directly support the idea that human development is responsible for buzzard declines, our observations of abandonment in the Sulmac region coupled with prior mark-and-recapture results suggest that humans activities may still be responsible for declines. There are several possible alternate explanations for why our models did not support this conclusion. For example, the horticulture company in Oserian operates a wildlife sanctuary next to their farm, which may have altered the effect of human development or infrastructure on buzzards in this region. Furthermore, it is possible that abandonment is a relatively poor proxy for buzzard mortality. Overall increased human numbers in the region could have resulted in an increase in persecution of the species more generally, or an increase in collision within energy infrastructure, including immature and non-breeding floaters. Any such increase could have led to a unsustainable rates of adult mortality and ultimately to a decline in the overall population. Persecution of buzzards is known to occur in this region, with local people actively cutting down nest trees or killing adults (Virani and Harper, 2009). If persecution is responsible for ongoing buzzard abandonment, we would expect to see more abandoned nests at closer proximity to human settlements, which we examined. Indeed, our best fitting model describing buzzard loss was with increasing human development at the 0.1 km scale, which weakly supports the notion that proximity to human infrastructure is a driver of abandonment. Furthermore, most of the electricity distribution pole designs used in the Lake Naivasha area pose high electrocution risks for raptors (Smallie and Virani, 2010). An increasing number of buzzards are being electrocuted by distribution lines and associated transformer utility poles in the Naivasha region (Thomsett, in prep). Ten raptors were reported killed over a 20 years period between 1970 and 1999, 5 cases over an 11 years period between 2000 and 2010, and 20 cases in only a 3 years period between 2015 and 2017 (six in 2017 alone). At least 75% of all the electrocuted birds were Augur Buzzards (Thomsett, S. in prep). It is unclear, however, whether this is associated with an increase in the number of distribution lines being established to service the growing Geothermal Power originating from Hell’s Gate National Park, or whether it is an artifact of increased monitoring of the area. Finally, while traditional grazing by livestock can make mammalian prey more accessible to buzzards in this region through reduced grass cover (Virani, 2006a), overgrazing of grass and pest control is correlated with lowered buzzard productivity due to the subsequent lowered abundance of rodent prey (Virani and Harper, 2009). In many cases, farms employ staff for the sole purpose of killing these rodents (Virani, 2006a, b).
Our data show that Augur Buzzards are not necessarily pushed out of an area by anthropogenic development, which could lead to the conclusion that they have the potential to be successful in human-altered environments. However, our data also show that the species is showing large declines in Naivasha, with an increase in territory abandonment in regions that Virani and Harper (2009) discovered had high mortality. We encourage further research to investigate whether human persecution, electrocutions, and/or other causes of acute mortality may be driving population declines.
Our observations of buzzard decline within our study area are particularly concerning given McClure et al. (2018) conclusion that more than half of the world’s raptor species are in decline, with Least Concern species experiencing the greatest decline rates. Indeed, augur buzzards were once considered a common species, and our observations of the species’ decline in our study area raise concerns that this species is following the pattern outlined by McClure et al. (2018). We encourage greater conservation focus not only on augur buzzards across their range, but also on all raptor species of Least Concern.
The raw data supporting the conclusions of this article will be made available by the authors, without undue reservation.
Ethical review and approval was not required for the animal study because the animal subjects were only observed in the wild from a distance.
AJE wrote the manuscript, collected field data, and analyzed field data. AA co-wrote the manuscript and analyzed field data. PT edited the manuscript and analyzed GIS data. EB edited the manuscript, collected field data, and analyzed field data. MZV developed the project, collected field data, analyzed field data, and edited the manuscript. All authors contributed to the article and approved the submitted version.
The authors declare that the research was conducted in the absence of any commercial or financial relationships that could be construed as a potential conflict of interest.
We would like to thank N. Paprocki for his comments on this piece, as well as the Elsamere Field Study Centre for their support. We would also like to thank The Peregrine Fund for their financial support and continued involvement, as well the University of Leicester (U.K.) and particularly Dr. David M. Harper for his leadership and supervision. We are grateful to Simon Thomsett of the Kenya Birds of Prey Trust for his counsel and to the management of Mundui, Oserian, Kenya Wildlife Service, National Museums of Kenya, KenGen and the staff of Hell’s Gate National Park for allowing us to continue our research on their land. Many Earthwatch Institute and other volunteers helped during this study and we are thankful to all of them.
The Supplementary Material for this article can be found online at: https://www.frontiersin.org/articles/10.3389/fevo.2021.590073/full#supplementary-material
Amar, A., Buij, R., Suri, J., Sumasgutner, P., and Virani, M. Z. (2018). “Conservation and ecology of African raptors,” in Birds of Prey, eds J.H. Sarasola, J. M. Grande, and J. J. Negro (Berlin: Springer), 419–455. doi: 10.1007/978-3-319-73745-4_18
Anderson, D., Burnham, K., and White, G. (1998). Comparison of Akaike information criterion and consistent Akaike information criterion for model selection and statistical inference from capture-recapture studies. J. Appl. Stat. 25, 263–282. doi: 10.1080/02664769823250
Barton, K. (2020). MuMIn: Multi-Model Inference. R Package Version 1.43.17. https://CRAN.R-project.org/package=MuMIn
Bird, J. P., Martin, R., Akçakaya, H. R., Gilroy, J., Burfield, I. J., Garnett, S. T., et al. (2020). Generation lengths of the world’s birds and their implications for extinction risk. Conserv. Biol. 34:1252–1261. doi: 10.1111/cobi.13486
BirdLife International (2012). Buteo Augur. The IUCN Red List of Threatened Species. Version 2014.2. Cambridge, UK: IUCN Redlist.
Boal, C. W., and Mannan, R. W. (1998). Nest-site selection by Cooper’s Hawks in an urban environment. J. Wildl. Manage. 62, 864–871. doi: 10.2307/3802537
Breiman, L. (2002). Manual on Setting Up, Using, and Understanding Random Forests v3. 1. Berkeley, CA: Statistics Department University of California, 1.
Buechley, E. R., Santangeli, A., Girardello, M., Neate-Clegg, M. H., Oleyar, D., McClure, C. J., et al. (2019). Global raptor research and conservation priorities: tropical raptors fall prey to knowledge gaps. Divers. Distrib. 25, 856–869. doi: 10.1111/ddi.12901
Buechley, E. R., and Şekercioğlu, ÇH. (2016). The avian scavenger crisis: looming extinctions, trophic cascades, and loss of critical ecosystem functions. Biol. Conserv. 198, 220–228. doi: 10.1016/j.biocon.2016.04.001
Butchart, S. H. M., Stattersfield, A. J., Bennun, L. A., Shutes, S. M., Akçakaya, H. R., Baillie, J. E. M., et al. (2004). Measuring global trends in the status of biodiversity: red list indices for birds. PLoS Biol. 2:e383. doi: 10.1371/journal.pbio.0020383
Cardador, L., Carrete, M., and Mañosa, S. (2011). Can intensive agricultural landscapes favour some raptor species? The Marsh harrier in north-eastern Spain. Anim. Conserv. 14, 382–390. doi: 10.1111/j.1469-1795.2011.00449.x
Dirzo, R., Young, H. S., Galetti, M., Ceballos, G., Isaac, N. J. B., and Collen, B. (2014). Defaunation in the anthropocene. Science 345, 401–406. doi: 10.1126/science.1251817
Fry, C. H., Stuart, K., and Urban, E. K. (1988). The Birds of Africa Vol III. London: Academic Press.
Haas, J., and Ban, Y. (2014). Urban growth and environmental impacts in Jing-Jin-Ji, the Yangtze, River Delta and the Pearl River Delta. Int. J. Appl. Earth Obs. Geoinf. 30, 42–55. doi: 10.1016/j.jag.2013.12.012
Harper, D. M., Mavuti, K. M., and Muchiri, S. M. (1990). Ecology and management of Lake Naivasha, Kenya, in relation to climatic change, alien species’ introductions, and agricultural development. Environ. Conserv. 17, 328–336. doi: 10.1017/s037689290003277x
Harper, D. M., Morrison, E. H. J., Macharia, M. M., Mavuti, K. M., and Upton, C. (2011). Lake Naivasha, Kenya: ecology, society and future. Freshw. Rev. 4, 89–114. doi: 10.1608/frj-4.2.149
Jacobson, A., Dhanota, J., Godfrey, J., Jacobson, H., Rossman, Z., Stanish, A., et al. (2015). A novel approach to mapping land conversion using Google Earth with an application to East Africa. Environ. Model. Softw. 72, 1–9. doi: 10.1016/j.envsoft.2015.06.011
Kettel, E. F., Gentle, L. K., Quinn, J. L., and Yarnell, R. W. (2018). The breeding performance of raptors in urban landscapes: a review and meta-analysis. J. Ornithol. 159, 1–18. doi: 10.1007/s10336-017-1497-9
Krüger, O., Lindström, J., and Amos, W. (2001). Maladaptive mate choice maintained by heterozygote advantage. Evolution 55, 1207–1214. doi: 10.1554/0014-3820(2001)055[1207:mmcmbh]2.0.co;2
Krüger, S. C., Simmons, R. E., and Amar, A. (2015). Anthropogenic activities influence the abandonment of Bearded Vulture (Gypaetus barbatus) territories in southern Africa. The Condor 117, 94–107. doi: 10.1650/condor-14-121.1
Litterick, M. R., Gaudet, J. J., Kalff, J., and Melack, J. M. (1979). The Limnology of an African Lake. Lake Naivasha, Kenya. SIL-UNEP Workshop on African Limnology, Nairobi, Kenya. Kenya: National Fisheries Resources Research Institute.
Loss, S. R., Will, T., and Marra, P. (2015). “Direct mortality of birds from anthropogenic causes,” in Annual Review of Ecology, Evolution, and Systematics, Vol 46, ed. D. J. Futuyma (Santa Clara, CA: Palo Alto), 99–120. doi: 10.1146/annurev-ecolsys-112414-054133
McClure, C. J., Westrip, J. R., Johnson, J. A., Schulwitz, S. E., Virani, M. Z., Davies, R., et al. (2018). State of the world’s raptors: distributions, threats, and conservation recommendations. Biol. Conserv. 227, 390–402. doi: 10.1016/j.biocon.2018.08.012
McKinney, M. L. (2002). Urbanization, biodiversity, and conservation: the impacts of urbanization on native species are poorly studied, but educating a highly urbanized human population about these impacts can greatly improve species conservation in all ecosystems. Bioscience 52, 883–890.
Millard, K., and Richardson, M. (2015). On the importance of training data sample selection in random forest image classification: a case study in peatland ecosystem mapping. Remote Sens. 7, 8489–8515. doi: 10.3390/rs70708489
Muhweezi, A. (1990). The Ecology of Raptors in and Around the Impenetrable Forest, South Western Uganda. MSc. thesis, Makerere University, Kampala.
Muller, R., Amar, A., Sumasgutner, P., McPherson, S. C., and Downs, C. T. (2020). Urbanization is associated with increased breeding rate, but decreased breeding success, in an urban population of near-threatened African Crowned Eagles. The Condor 122:duaa024.
Murgatroyd, M., Underhill, L. G., Rodrigues, L., and Amar, A. (2016). The influence of agricultural transformation on the breeding performance of a top predator: Verreaux’s Eagles in contrasting land use areas. The Condor 118, 238–252. doi: 10.1650/condor-15-142.1
Peery, M. Z. (2000). Factors affecting interspecies variation in home-range size of raptors. Auk 117, 511–517. doi: 10.1093/auk/117.2.511
Pratt, D. J., Greenway, P. J., and Gwynne, M. D. (1966). A classification of East African rangeland with appendix on terminology. J. Appl. Ecol. 3, 369–379. doi: 10.2307/2401259
R Core Team (2016). “R: a language and environment for statistical computing,” in R Foundation for Statistical Computing. (Vienna, Austria). https://www.R-project.org/
Säterberg, T., Sellman, S., and Ebenman, B. (2013). High frequency of functional extinctions in ecological networks. Nature 499, 468–470. doi: 10.1038/nature12277
Smallie, J., and Virani, M. Z. (2010). A preliminary assessment of the potential risks from electrical infrastructure to large birds in Kenya. Scopus 30, 32–39.
Suri, J., Sumasgutner, P., Hellard, É, Koeslag, A., and Amar, A. (2017). Stability in prey abundance may buffer Black Sparrowhawks Accipiter melanoleucus from health impacts of urbanization. Ibis 159, 38–54. doi: 10.1111/ibi.12422
U.S. Geological Survey (2015). Landsat Surface Reflectance Data.in U.S. Department of the Interior, Editor. Reston, VA: USGS.
van Beijma, S., Comber, A., and Lamb, A. (2014). Random forest classification of salt marsh vegetation habitats using quad-polarimetric airborne SAR, elevation and optical RS data. Remote Sens. Environ. 149, 118–129. doi: 10.1016/j.rse.2014.04.010
Virani, M., and Watson, R. T. (1998). Raptors in the east African tropics and western Indian Ocean islands: state of ecological knowledge and conservation status. J. Raptor Res. 32, 28–39.
Virani, M. Z. (1999). The Breeding Ecology and Behaviour of the Augur Buzzard Buteo Augur in Relation to Different Land-Uses in the Southern Lake Naivasha Area, Kenya. Leicester: University of Leicester.
Virani, M. Z. (2006a). Factors Affecting the Availability of Yellow-Toothed Mole-Rats Tachyorectes Splendens as Prey for Augur Buzzards Buteo Augur in the Southern Lake Naivasha Area, Kenya. Crumblin: Gabar, 6–15.
Virani, M. Z. (2006b). In Steep Decline: Conditions Around the Lake Do Not Augur Well for Naivasha’s Buzzards. Nairobi: SWARA, 20–22.
Virani, M. Z., and Harper, D. M. (2004). A comparitive study of the breeding behaviour of the Augur Buzzard, Buteo augur, in the two different land-use areas in southern Lake Naivasha, Kenya. Ostrich 75, 11–19. doi: 10.2989/00306520409485406
Keywords: raptor, Africa, GIS, habitat destruction, endangered species, remote sensing, IUCN
Citation: Eichenwald AJ, Amar A, Tyrrell P, Buechley ER and Virani MZ (2021) Declines in an Augur Buzzard Buteo augur Population in a Region of Increasing Human Development. Front. Ecol. Evol. 9:590073. doi: 10.3389/fevo.2021.590073
Received: 31 July 2020; Accepted: 09 February 2021;
Published: 11 March 2021.
Edited by:
Virginia Morandini, Oregon State University, United StatesReviewed by:
Javier Balbontin, University of Seville, SpainCopyright © 2021 Eichenwald, Amar, Tyrrell, Buechley and Virani. This is an open-access article distributed under the terms of the Creative Commons Attribution License (CC BY). The use, distribution or reproduction in other forums is permitted, provided the original author(s) and the copyright owner(s) are credited and that the original publication in this journal is cited, in accordance with accepted academic practice. No use, distribution or reproduction is permitted which does not comply with these terms.
*Correspondence: Adam J. Eichenwald, QWRhbS5laWNoZW53YWxkQHR1ZnRzLmVkdQ==
Disclaimer: All claims expressed in this article are solely those of the authors and do not necessarily represent those of their affiliated organizations, or those of the publisher, the editors and the reviewers. Any product that may be evaluated in this article or claim that may be made by its manufacturer is not guaranteed or endorsed by the publisher.
Research integrity at Frontiers
Learn more about the work of our research integrity team to safeguard the quality of each article we publish.