 Żaneta Kaszta
 Samuel A. Cushman
 Rob Slotow
94% of researchers rate our articles as excellent or good
Learn more about the work of our research integrity team to safeguard the quality of each article we publish.
Find out more
ORIGINAL RESEARCH article
Front. Ecol. Evol., 27 April 2021
Sec. Conservation and Restoration Ecology
Volume 9 - 2021 | https://doi.org/10.3389/fevo.2021.553263
This article is part of the Research TopicAdvances in the Behavioral Ecology and Movement Ecology of ElephantsView all 4 articles
Effective conservation and land management require robust understanding of how landscape features spatially and temporally affect population distribution, abundance and connectivity. This is especially important for keystone species known to shape ecosystems, such as the African elephant (Loxodonta africana). This work investigates monthly patterns of elephant movement and connectivity in Kruger National Park (KNP; South Africa), and their temporal relationship with landscape features over a 12-month period associated with the occurrence of a severe drought. Based on elephant locations from GPS collars with a short acquisition interval, we explored the monthly patterns of spatial-autocorrelation of elephant movement using Mantel correlograms, and we developed scale-optimized monthly path-selection movement and resistant kernel connectivity models. Our results showed high variability in patterns of autocorrelation in elephant movements across individuals and months, with a preponderance of directional movement, which we believe is related to drought induced range shifts. We also found high non-stationarity of monthly movement and connectivity models; most models exhibited qualitative similarity in the general nature of the predicted ecological relationships, but large quantitative differences in predicted landscape resistance and connectivity across the year. This suggests high variation in space-utilization and temporal shifts of core habitat areas for elephants in KNP. Even during extreme drought, rainfall itself was not a strong driver of elephant movement; elephant movements, instead, were strongly driven by selection for green vegetation and areas near waterholes and small rivers. Our findings highlight a potentially serious problem in using movement models from a particular temporal snapshot to infer general landscape effects on movement. Conservation and management strategies focusing only on certain areas identified by temporarily idiosyncratic models might not be appropriate or efficient as a guide for allocating scarce resources for management or for understanding general ecological relationships.
With increasingly negative synergies between changing climate and expanding anthropogenic impacts on ecosystems, land management and conservation face serious challenges to sustain viable populations of many species in many parts of the world. Effective conservation in this era of rapid global change requires, more than ever, understanding the complex spatial and temporal effects of landscape components on population abundance, distribution and connectivity (Cushman, 2006).
Species ecology is simultaneously influenced by both fine- and broad-scale environmental attributes (Wiens, 1976; Johnson et al., 1992; Levin, 1992), and no single scale is typically sufficient to elucidate species-habitat relationships. Thus, investigations into habitat selection and movement should be conducted at multiple, ecologically relevant scales (Wiens, 1989; Goodwin and Fahrig, 1998; McGarigal et al., 2016b). The failure to do so can undermine the performance of habitat selection and movement models and their interpretation (Wasserman et al., 2012; Mateo Sanchez et al., 2014; Shirk et al., 2014), potentially leading to errors of inference and application (McGarigal and Cushman, 2002). Reliable knowledge about the multi-variate and multi-scale effects of environmental heterogeneity on organism distribution, abundance and movement can be acquired through robust multi-scale analytical methods supported by empirical data (Cushman et al., 2013; Zeller et al., 2018a).
Recent technological advancements in satellite telemetry are providing large quantities of data on animal locations for many species. However, these new data have characteristics that present both opportunities and challenges to statistical analysis of movement behavior and habitat selection. For example, although new satellite technology provides high frequency and highly accurate information on animal location, these large amount of data are often difficult to process and they introduce temporal autocorrelation that violates the assumptions of many statistical methods (Cagnacci et al., 2010; Patterson et al., 2017). To provide clear guidance to ecological researchers and conservation practitioners, it is essential to understand how stable the methods to derive habitat suitability or movement models are over time, and among study areas.
Although spatial and temporal autocorrelation are often considered as a statistical nuisance (e.g., Legrande, 1993; Segurado et al., 2006; Valcu and Kempenaers, 2010), one way to investigate the spatial behavior of animals is to actually use the patterns of autocorrelation provided by the telemetry data (Rooney et al., 1998; Otis and White, 1999; Cushman et al., 2005; Elliot et al., 2014a). Methods, such as moving window Mantel correlograms, can provide a detailed picture of temporal variability in animal movement patterns (Cushman et al., 2005; Elliot et al., 2014a), which can then be linked to temporarily changing environmental attributes. This kind of analysis can help clarify the ecological processes affecting animal behavior across different time periods, as well as detect anomalies in movement patterns, serving as a potentially important indicator of perturbation or change in ecological processes in an ecosystem.
To acquire a more complete picture of the drivers of animal movement, patterns of spatial autocorrelation alone are insufficient, as they are incomplete and often not clearly associated with particular behavioral or resource selection patterns (Elliot et al., 2014a). One alternative approach that uses the full spatial information in high-frequency telemetry data to understand animal space use and selection, is path-selection functions (Cushman, 2010; Cushman et al., 2010; Cushman and Lewis, 2010). Path-selection functions, like step-selection functions, employ a “used” vs. “available” design to estimate relationships between species and its habitat (Zeller et al., 2016), representing a form of Johnson’s third order of habitat selection (Johnson, 1980). However, the main difference between step and path selection functions lies in the sampling unit, which in step-selection is represented by a single step between two consecutive locations, and for path-selection the sample constitutes a movement path built from a set of sequential locations of a length predefined by a selected time lag.
Zeller et al. (2016) showed that, for the purpose of developing movement models, path-selection functions may be superior to the widely used step- and point- selection functions. Path-selection functions more effectively control for spatial autocorrelation and allow optimization of selection across a range of scales, not just the observed distribution of sequential step lengths. Movement and habitat suitability models should also account for spatial scaling of animals’ response to landscape elements, as quantification of habitat selection and movement strongly depend on the scales at which environmental context is considered (e.g., Wiens, 1989; Levin, 1992; Zeller et al., 2014, 2016). Path selection functions have the particular advantage of being able to optimize across multiple-scales of environmental response (e.g., Cushman and Lewis, 2010; Elliot et al., 2014a), which traditional step-selection functions do not.
Path selection models are “movement” models, in that they can be used to predict the relationship between environmental variables and movement choices. Connectivity models (sensu Rudnick et al., 2012; Cushman et al., 2013) use the outputs of movement models, such as resistance surfaces, as inputs into connectivity algorithms, e.g., resistant kernels (Compton et al., 2007), to predict rates and patterns of movement, core areas, corridors and fracture zones. Both movement and connectivity models have become important tools to address various problems in research, biodiversity conservation and management (Rudnick et al., 2012; Cushman et al., 2013), such as delineating functional dispersal corridors and core habitats (e.g., Elliot et al., 2014b, Almasieh et al., 2016; Kaszta et al., 2020a, b), restoration planning (e.g., McRae et al., 2012; Tambosi et al., 2014; Kaszta et al., 2019), evaluating animal road crossings (e.g., Lewis et al., 2011; Cushman et al., 2014; Zeller et al., 2018b), and even disease transmission (e.g., Kaszta et al., 2018; Merkle et al., 2018). Models explaining the complexity and variability of species space use patterns across the year provide insight into the functionality of different parts of a landscape. They are therefore especially important for decisions regarding threatened species (e.g., due to the risk of poaching or shrinking habitats), or those that play an important biotic role in shaping the ecosystem.
Movement and connectivity models are usually often developed from GPS (Global Positioning System) data covering a time period of at least a season, and often a year or even several years (Cushman et al., 2010; Hooten et al., 2017; Patterson et al., 2017). Cushman and Lewis (2010) used multi-scale path-selection models to show high quantitative and qualitative differences between two seasonal movement models for American black bear (Ursus americanus). Significant seasonal differences in movement patterns were also found using step-selection functions (Zeller et al., 2019) and when investigating specific behavioral state of animals using Markov-chain models (Buderman et al., 2018). Osipova et al. (2019) found a significant variability in African elephant (Loxodonta africana) seasonal resistance surfaces, leading to substantial seasonal changes in landscape connectivity and predicted elephants movement corridors. Furthermore, Cushman et al. (2005) showed that elephant movement autocorrelation patterns were highly variable at a scale of 15–30 days and non-stationary across the year.
The results of these and other studies strongly suggest non-stationarity of movement and connectivity models across seasonal periods, due to resource fluctuations and changes in the behavior and distribution of population at different times of the year. However, fine-scale, sub-seasonal temporal variability of movement models and landscape connectivity has been rarely investigated. In this paper we consider the term “non-stationarity” as instability of statistical parameters (variables influencing movement, their sign, their scale, their coefficient) in movement models caused by a temporal change in animal movements (selection and avoidance of resources) as a response to change in ecological relationships. This is different from strict non-stationarity, which focuses explicitly on changes in statistical probability distributions of a measured parameter in space or time, as discussed in the context of animal movement by Benhamou (2014).
Temporal non-stationarity in animal movement patterns in relation to resources and landscape structure has important implications for generalizing animal movement behavior and producing connectivity surfaces based on such generalizations. Specifically, if there is substantial temporal non-stationarity in movement behavior, then generalizing to annual, or even seasonal models, without accounting for finer-scale temporal variation in movement and space use behavior, can lead to misleading conclusions (Cushman et al., 2011; Osipova et al., 2019). Temporal variation in ecological relationships is also species specific. Therefore, in addition to considering the effects of spatial scale, evaluating temporal variability in ecological pattern-process relationships is an important frontier in ecology (McGarigal et al., 2016a, b).
The African elephant (Loxodonta africana) is a keystone species that plays a major role in structuring semi-arid ecosystems by driving dominant patterns of vegetation (e.g., Barnes, 2001; Brits et al., 2002; De Beer et al., 2006) and the location and availability of seasonal waterholes (Kerley et al., 2008). The elephant is also a species of high charisma value (Macdonald et al., 2017), receiving attention from the global public, making it an ambassador for conservation. At the same time, however, the species suffers from catastrophic population declines in parts of its range driven by an immense increase in poaching in the past two decades (Burn et al., 2011; Wittemyer et al., 2014), coupled with accelerating land use change across its range (De Boer et al., 2013; Roever et al., 2013; Fitzgerald, 2015). In some protected areas, notably Kruger National Park, South Africa, African elephant populations have increased, and the management challenge in those locations is how to regulate and manage an over-abundant local elephant population to avoid degradation of habitat for other species (Ferreira et al., 2017).
From a research point of view, the African elephant is an ideal species to study temporal dynamics of movement patterns in relation to vegetation, seasonal climate, and human impacts given its high mobility and large size, which allows instrumentation with GPS devices that can record a high frequency of detections over long periods. Furthermore, the species has been the focus of several early studies of temporal variability in movement (e.g., Cushman et al., 2005; Wato et al., 2018), and was the focal species in the original work developing path selection functions (Cushman et al., 2010). These studies have shown complex, long-range, and seasonally varying patterns of movement rate, pattern and autocorrelation in relation to water and other critical resources, making them a good species to evaluate sensitivity of movement and connectivity models to temporal non-stationarity.
In this paper, we investigated the fine-scale temporal patterns of African elephant movement and connectivity in Kruger National Park (KNP), South Africa. Our goal was to investigate how these patterns are related to landscape features, and how relationships between landscape features and elephant movement pattern change over a 12 month period, associated with the occurrence of a severe drought. Cushman et al. (2005) found that elephants in northern Botswana expressed long-term and complex patterns of autocorrelation that changed seasonally with water availability, such that, when water was widely available in the wet season, elephants moved randomly within large home ranges, while in the dry season elephants combined long distance displacements with periodic movement patterns to reach and move between few, scattered water holes. Based on this pattern we expected that in the wetter part of our study period elephants would likewise exhibit random movement patterns in fixed home ranges. We expected that in wetter months path selection functions would produce weak associations with landscape features, particularly water, and primarily reflect selection for optimal foraging areas. This change in resource selection is expected due to the relaxation of water as a limiting factor (Smit et al., 2007; De Beer and van Aarde, 2008; Birkett et al., 2012), which would allow elephants to maximize movement in areas with highest forage quality (Woolley et al., 2009). A similar pattern has been seen in African buffalo (Syncerus caffer) foraging in this same system (Kaszta et al., 2016). Conversely, in the dry part of the study period, we expected an increase in long-distance directional movement, and periodic movement patterns, following Cushman et al. (2005), as elephants shift seasonal ranges in response to water and forage limitations, which we expected would be associated with stronger path selection with distance to water and forage quality a primary drivers.
Our objectives in this study were to test: (1) whether the pattern (directional, periodic, or random) of elephant movement varied as a function of rainfall or seasonality, (2) if path-selection functions and connectivity surfaces were stable across time, (3) what were the main drivers affecting elephant movement path selection and their variation through time, and finally (4) what observed differences in movement pattern and path selection functions imply for conservation and management planning.
The study area is centered on the southern sectors of Kruger National Park (KNP) (Orpen/Skukuza, Satara/Nhlanguleni/Muzandzeni, Satara, Skukuza, and Lower Sabie complexes) South Africa, including several private and provincial reserves bordering KNP to the west (Sabi Sands, Balule, Klaserie, Timbavati, Umbabat, and Manyaleti) (Figure 1). Elephants can freely move between KNP and these private game reserves, and only the western boundary of the protected areas is separated from the neighboring communal lands by a fence. The area is primarily covered by semi-arid to arid wooded savanna (Mucina and Rutherford, 2006) with a strongly seasonal climate characterized by pronounced wet (from October to March) and dry (from April to September) seasons, with an average annual rainfall of approximately 500–700 mm. Two transitional periods with intermediate rainfall can be also distinguished (April/May and October/November). During the time elephant movement data used in this study were recorded, Kruger National Park experienced an extreme drought. The rainy season of 2014/2015 received only 65% of the long-term average rainfall. The intervening dry season received almost no precipitation. The following rainy season of 2015/2016 received even less rain (52% of the long-term average across the park; South African National Parks [SANParks], 2020; Supplementary Figure 1).
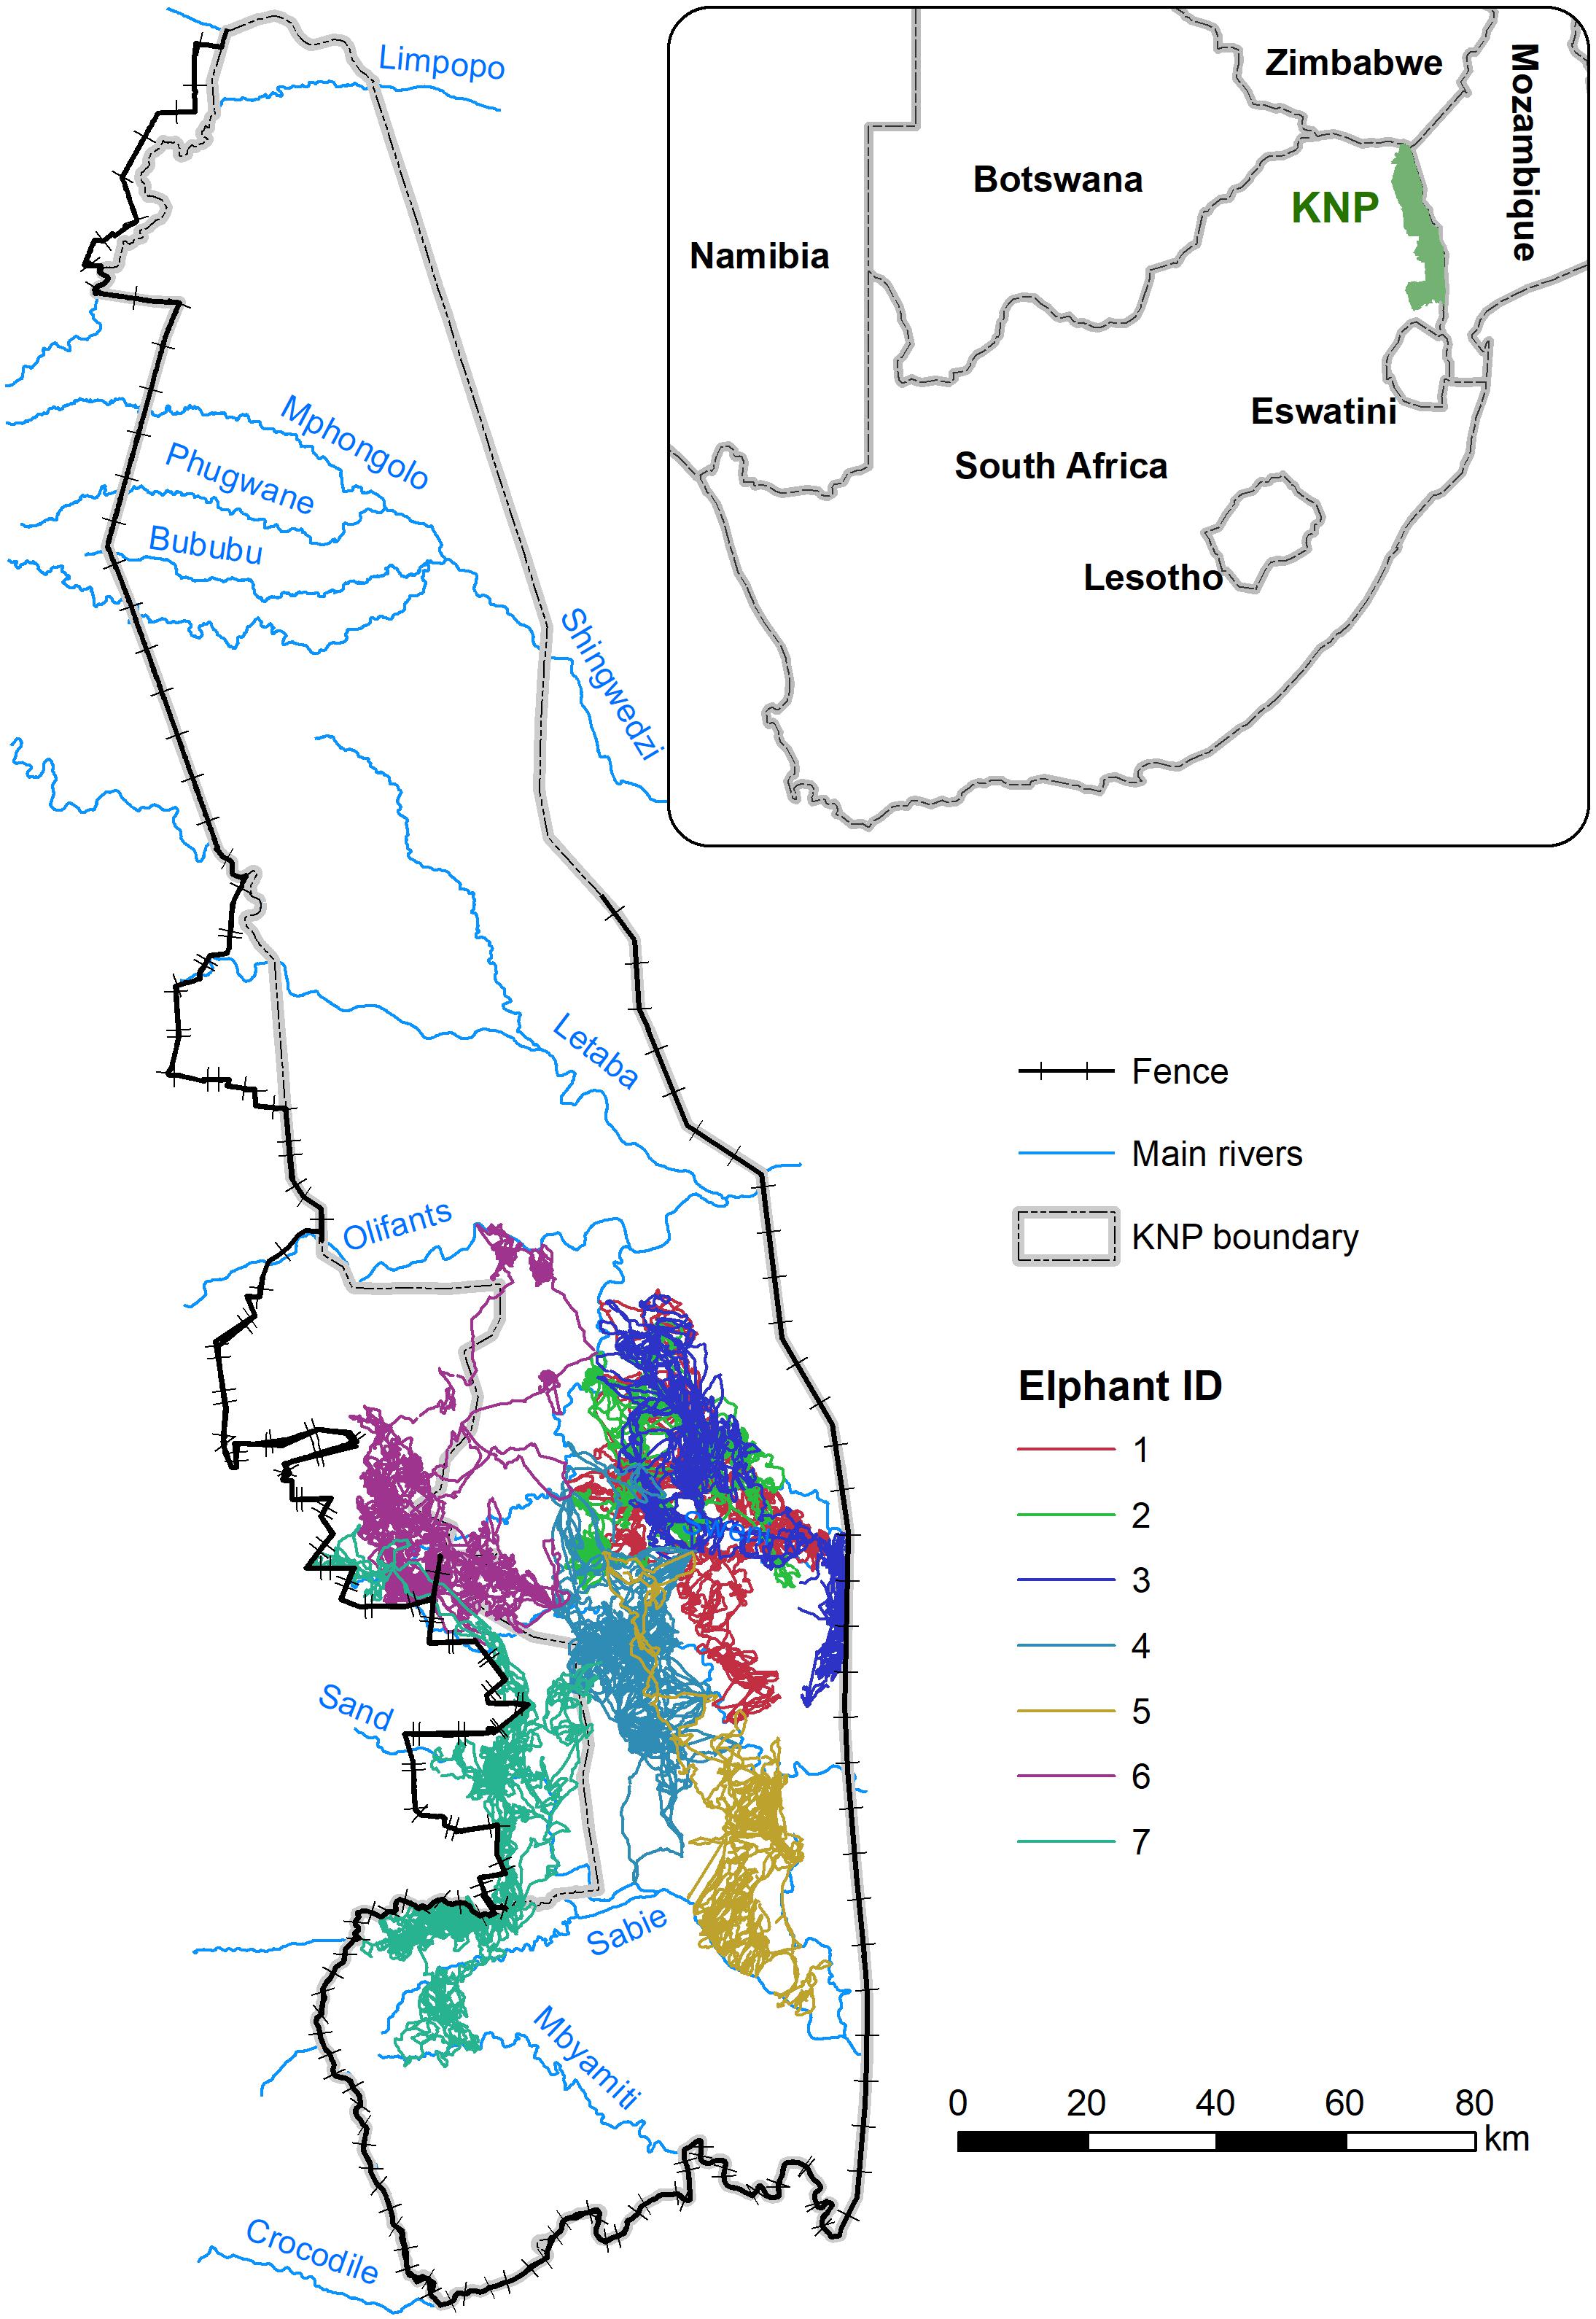
Figure 1. Study area with movement trajectories of seven tracked elephants.
We used movement data of seven prime adult female elephants (age between 25 and 40 years) associated with different social groups/clans. To ensure that the studied elephants were unrelated and spatially independent in their movements, KNP was divided into seven different spatial clusters (Delsink et al., 2013) and each animal was sourced from a different cluster. A single female in each herd was selected and collared, representing the movement behavior of the breeding herd to which they belong. The collared animals were not directly observed throughout the study period due to the large extent of the study area, thus we assumed that the behavior of the collared females is similar to other elephants in their family group, and would join and leave other family groups, but not those of other collared females given the distances between them. We confirmed that no collared females were traveling together in combined fission-fusion groups during the period of this study.
The animals were fitted with GPS (Global Positioning System) satellite collar collecting locations at 30-min intervals. The data were collected between September 2015 and August 2016, covering in total a period of 12 months. Data from one collar ended in February 2016, and another in June 2016. The number of fixes across the individuals varied between 10,289 and 16,608 (Supplementary Table 1).
Ethics approval for the capture, collaring and handling of elephants was obtained from the University of KwaZulu-Natal Animal Ethics Committee (Ref: 009/10/Animal). This project was also approved by the South African National Parks (Ref: SLOR660).
To investigate patterns of elephant movement in space and time, quantified the variability of spatial and temporal autocorrelation of the elephant GPS locations. We used Mantel correlograms, which were first introduced in ecological research by Burgman and Williams (1995). Cushman et al. (2005) first applied Mantel correlograms to describe temporal patterns of animal movement; it is in this sense and application that we are using it in this study. The Mantel correlogram was tested and recommended by Borcard and Legendre (2012), who demonstrated its high power and reliability to quantify autocorrelation patterns in distance-based questions such as we test here. In our application, Mantel correlograms provide a correlation of distance between locations for a given elephant in geographical space, against distance between locations in time across different time lag distances. The shape of the correlograms depict the nature of spatio-temporal autocorrelation of locations. Distinct correlogram shapes can identify random use of fixed home ranges, directional movement and periodic movement (Cushman, 2010; Elliot et al., 2014a). Previous work has shown associations of the shape of Mantel correlograms with seasonal water availability (Cushman et al., 2005), and with demography-dependent movement modes (Elliot et al., 2014a).
To minimize the effects of temporal non-stationarity we split the GPS locations of each elephant individual into full-month windows, representing each month between September 2015 and August 2016. The monthly temporal window was selected for two reasons. First, to reduce the frequency of “mixed-patterns,” that result when long temporal windows include a mixture of distinct movement patterns, and to eliminate the spurious directional patterns seen in very short time-windows with sequential locations going farther apart. Second, to compare the monthly path-selection movement models and monthly data on the rainfall patterns we needed to use a time unit that was consistent between them (rainfall data is reported by month).
For each of these temporal windows, we calculated two matrices: (1) geographical distance between each pair of locations, and (2) the temporal distance (in decimal days) between them. Using the R package ecodist (Goslee and Urban, 2007), we then computed Mantel correlograms assessing levels of spatial autocorrelation in elephant movement across time lags. Following Cushman et al. (2005), we classified each correlogram into three types of movement: directional migration, periodic (cyclical) use of focal areas when animal repeatedly and sequentially visits the same location, or random use of temporary home ranges. These are commonly considered the most distinctive and important patterns that are depicted in the shapes of correlograms (Legrande, 1993; Fortin and Dale, 2005; Legendre and Legendre, 2012). Cushman (2010) showed using simulation modeling that these characteristic shapes are highly distinctive and reliable indicators of these three main categories of movement pattern. The type of movement was assigned to the most apparent and dominant form of correlogram.
We computed chi-square tests to evaluate if the frequency of each type of movement exhibited by the seven elephants was associated with months or seasonality. In the case of seasonality, we evaluated four (wet, transition I, dry, transition II) or three (wet, dry, and transition I and II combined) seasons.
Furthermore, to assess whether movement patterns were associated with variation in rainfall or NDVI (Normalized Difference Vegetation Index; also referred to as vegetation greenness or productivity index), we performed ANOVA analysis with Tukey HSD test to examine whether these variables were different for months associated with each type of movement pattern. Elephant movement behavior might be affected by the current rainfall or previous rainfall (e.g., Cushman et al., 2005), therefore we tested total rainfall for current month, previous month, and sum of current and previous month.
To examine temporal differences in how elephants select movement paths, we developed a multi-scale path-selection model (e.g., Zeller et al., 2016) for each month from September 2015 to August 2016.
We tested a set of environmental factors, which, based on previous studies (Cushman et al., 2005; Young et al., 2009; De Knegt et al., 2011; Wato et al., 2018), are known to influence elephant habitat use. These included percentage of tree cover, monthly NDVI, monthly rainfall, distance to waterholes, distance to large perennial rivers, and distance to small perennial rivers and non-perennial rivers. The percentage of tree cover was based on 30 m resolution using the Hansen (2013) global tree cover layer. For each month, we also calculated the mean of the two 16-day NDVI layers from MODIS (MODerate-resolution Imaging Spectroradiometer) for each month at 250 m resolution. We used KNP meteorological records (South African National Parks, SANParks) of total monthly rainfall from 23 monitoring stations within KNP to create continuous spatial layers of rainfall for each month, using Inverse Distance Interpolation in ArcGIS 10.3.1. Data on active water points, including dams and boreholes, were provided by SANParks and were visually verified using Google Earth Imagery. Additionally, we mapped waterholes to the west of Kruger up to the boundary fence by visually identifying and digitalizing dams and boreholes using Google Earth Imagery. We classified the river layer (South Africa environmental information database ENPAT, 2002) into two categories: large rivers (perennial rivers of class 1 or 2 and small perennial rivers of class 3), and small rivers (non-perennial rivers and perennial rivers of class 3). We then calculated Euclidean distance from water points, small, and large rivers. All layers were resampled to 20 m resolution with bilinear interpolation.
The elephant GPS locations were divided into monthly subsets. For each month and individual, we converted the series of sequential locations into separate daily movement path segments. We then used these data to develop monthly path-selection movement models. The “used” data for our path-selection model were acquired by extracting the mean value of each covariate along each daily path segment. To generate “available” paths in a multi-scale framework, we applied a Gaussian density kernel around each path, varying the smoothing parameter across 250 m, 500 m, 1 km, 2 km, 4 km, 8 km (Zeller et al., 2016, 2018a). Our choice of scales was based on the scales of environmental heterogeneity and the rate of elephant movement. The use of density kernels around the used path provides multi-scale quantification of available environmental factors, sampling the environment in a continuous manner within a given distance (Zeller et al., 2016). Importantly, it enables multi-scale optimization, which is essential for reliable inference in habitat selection and movement modeling (McGarigal et al., 2016a, b).
Our path selection analysis involved three steps. First, for each month we developed a univariate conditional mixed-effect logistic regression model (Duchesne et al., 2010) for each variable at each scale, with elephant ID as a random factor (sensu Elliot et al., 2014a) using the coxme package in R (Therneau, 2017). This enabled us to identify the best scale for each variable individually (McGarigal et al., 2016a), while also accounting for variation among individuals (e.g., Elliot et al., 2014b). To determine the best scale for each environmental covariate, we first ran a set of univariate mixed-effect conditional logistic regression models across all considered scales for each variable. We used the Akaike’s Information Criterion (AIC) to identify the variable’s scale of strongest response (Burnham and Anderson, 2002).
In the second step of path selection function analysis, from all the covariates at their best scales we excluded those with p > 0.01, and we further checked for multicollinearity between the remaining covariates by calculating Pearson’s correlation, and excluding correlated variables with a correlation threshold of | 0.7| (Nettleton, 2014). For each pair of correlated variables we kept the one with the lower AIC value.
In the final step of path selection function modeling, all the remaining variables were used to assemble a global model, with each variable at its most supported scale (e.g., Elliot et al., 2014b; Zeller et al., 2016). To identify the most parsimonious model we employed all subsets mixed-effect conditional logistic regression with model averaging (ΔAIC < 4), using the function “dredge” of the R package MuMIN (Bartoń, 2018).
The monthly movement models developed in the previous step provide quantitative information on selection or avoidance of landscape features and environmental resources by elephants traversing the landscape. This information can be used directly to parametrize the surface of landscape resistance to elephant movement. Typically, resistance surfaces are derived either based on expert opinion or, most commonly, by inverting habitat suitability model predictions from point selection functions, assigning low movement cost to highly suitable areas. However, recent studies have shown that movement models based on either genetic data or GPS locations are superior in deriving landscape resistance surface (Mateo-Sánchez et al., 2015; Ziółkowska et al., 2016; Zeller et al., 2018a). Therefore, we used the results of the monthly movement models described in the previous section to produce resistance surfaces for each month, by calculating z = β1V1 + β2V2 + … + βnVn, where βi is the coefficient for variable Vi, and then inverting and rescaling the z values such that max z = 1 and min z = 100. These resistance surfaces (outputs of “movement models”) constituted the base for connectivity modeling.
To compare the monthly resistance surfaces and to evaluate potential non-stationarity of relationships between landscape features and elephant path selection, we calculated Pearson’s spatial correlation between these 12 monthly resistance surfaces. We used Mantel tests to evaluate whether there was a relationship between the strength of the correlation between monthly resistance surfaces and difference in rainfall between months (current year month and long-term average for a month), as well as time interval between months.
We compared all the monthly movement models by quantifying the consistency of variables in these models over time. We generated a histogram of variable frequency, showing presence of each variable in the path selection model, and the sign of its coefficient. We then tested the influence of each variable on the performance of the monthly models by calculating the difference in predicted resistance to elephant movement when the variable increases from the 10th to 100th percentile, and holding all other variables constant at their medians.
We also examined relationships between rainfall and the strength of elephant preference/avoidance of resources across the 12-month period of study. For each variable we fitted logistic regression, and calculated Pearson’s correlation between monthly models’ coefficients and total monthly rainfall (current, previous month, previous plus current month, long-term averaged total for a previous and current month) to determine if there were relationships between the sign and magnitude of model coefficients and amount of rain.
To compare connectivity surfaces across months, we evenly distributed 4,500 source points across the study area, with distance between points of circa 1.5 km. This represents approximately 25% of the park’s elephant population, which was estimated in 2015 to be approximately 17,000 individuals (Ferreira et al., 2017). We explicitly controlled the distribution of source points to only show the effect on connectivity given the same set of points, and to separate the effect of habitat suitability. Furthermore, a lower number of source points in comparison to the total population size does not impact the results which are interpreted relatively and are proportionally comparable across months, and it significantly decreases the processing time of cumulative resistance kernels analyses. We used the source point layer, and the 12 resistance surfaces from each months’ path selection function as inputs to resistant kernel analysis (Compton et al., 2007) in UNICOR (Landguth et al., 2012). The cumulative resistant kernel generates a prediction of the total movement density across the landscape to identify the main pattern of synoptic connectivity, reflecting the connectivity of every location relative to every other location in the landscape (Cushman et al., 2013; Kaszta et al., 2018). This is done by summing all individual least-cost kernels from all dispersal source points (Compton et al., 2007). The real dispersal threshold for elephants, as for a majority of species, is unknown. Therefore, for a sensitivity analyses we tested two dispersal distance thresholds, 250,000 and 500,000 cost units (dispersal distance in cost units), which in our analysis represent movement of 25 and 50 km in the uniform landscape of resistance equal to 10 (10% of the maximum resistance value = 100).
To investigate similarity between the resistant kernel connectivity surfaces produced for each month, we calculated Pearson’s correlation and absolute average difference between them (e.g., Hearn et al., 2018a). As in our comparison of resistance surfaces, we also ran Mantel tests to quantify the relationship between the correlation of kernel connectivity surfaces and difference in rainfall and time.
The monthly Mantel correlograms for seven elephants showed high variation in movement pattern across months, and between individuals (Supplementary Table 2 and Supplementary Material 2). Based on the shape of Mantel correlograms, we distinguished three main patterns of autocorrelation: a gradient-like pattern associated with directional movement, periodic autocorrelation linked to cyclical use of focal areas, and an irregular pattern associated with random use of temporary home ranges (Supplementary Figure 2 and Supplementary Material 2). Almost half of the monthly correlograms (47%) were classified as directional movement. Periodic and random movement constituted 27 and 26% of all correlograms, respectively. The Chi-square test indicated significant differences between these movement type frequencies (p < 0.05), with significantly more directional correlograms than expected by chance.
However, the Chi-square tests showed no significant association between movement types and month or season (Supplementary Table 3). Likewise, ANOVA and Tukey HSD test showed no significant relationship between elephant movement pattern (directional, random, or periodic) and average monthly rainfall across the study area for the current, previous and sum of previous and current month (Supplementary Table 4). However, there was a significant relationship between elephant movement patterns and averaged monthly NDVI for the whole study area (Supplementary Table 4). The Tukey test revealed that this relationship was significant between random and directional movement, with random movement occurring when NDVI was higher in comparison to directional movement, which predominated when NDVI was low (difference in NDVI equal 0.07 and p = 0.05).
Scale-optimization of variables showed that the majority of variables across all 12 models were selected at largest scales of 4 or 8 km (Table 1 and Figure 2). Furthermore, the 12 movement models were mainly consistent in the model structure represented by the final set of variables (Table 1 and Figure 2). Specifically, four out of six tested variables were present in every model (distance to waterholes, distance to small rivers, NDVI, and tree cover), and distance to large rivers was present in a majority of models (Figure 2). The signs of these variables’ coefficients were mainly consistent across the models, with distance to waterholes and small rivers negatively associated to path selection across all 12 models, and NDVI positively associated across 11 models (Table 1 and Figure 2). Furthermore, rainfall, although the least frequent variable across all models, exhibited a positive impact on elephant path selection (Figure 2).
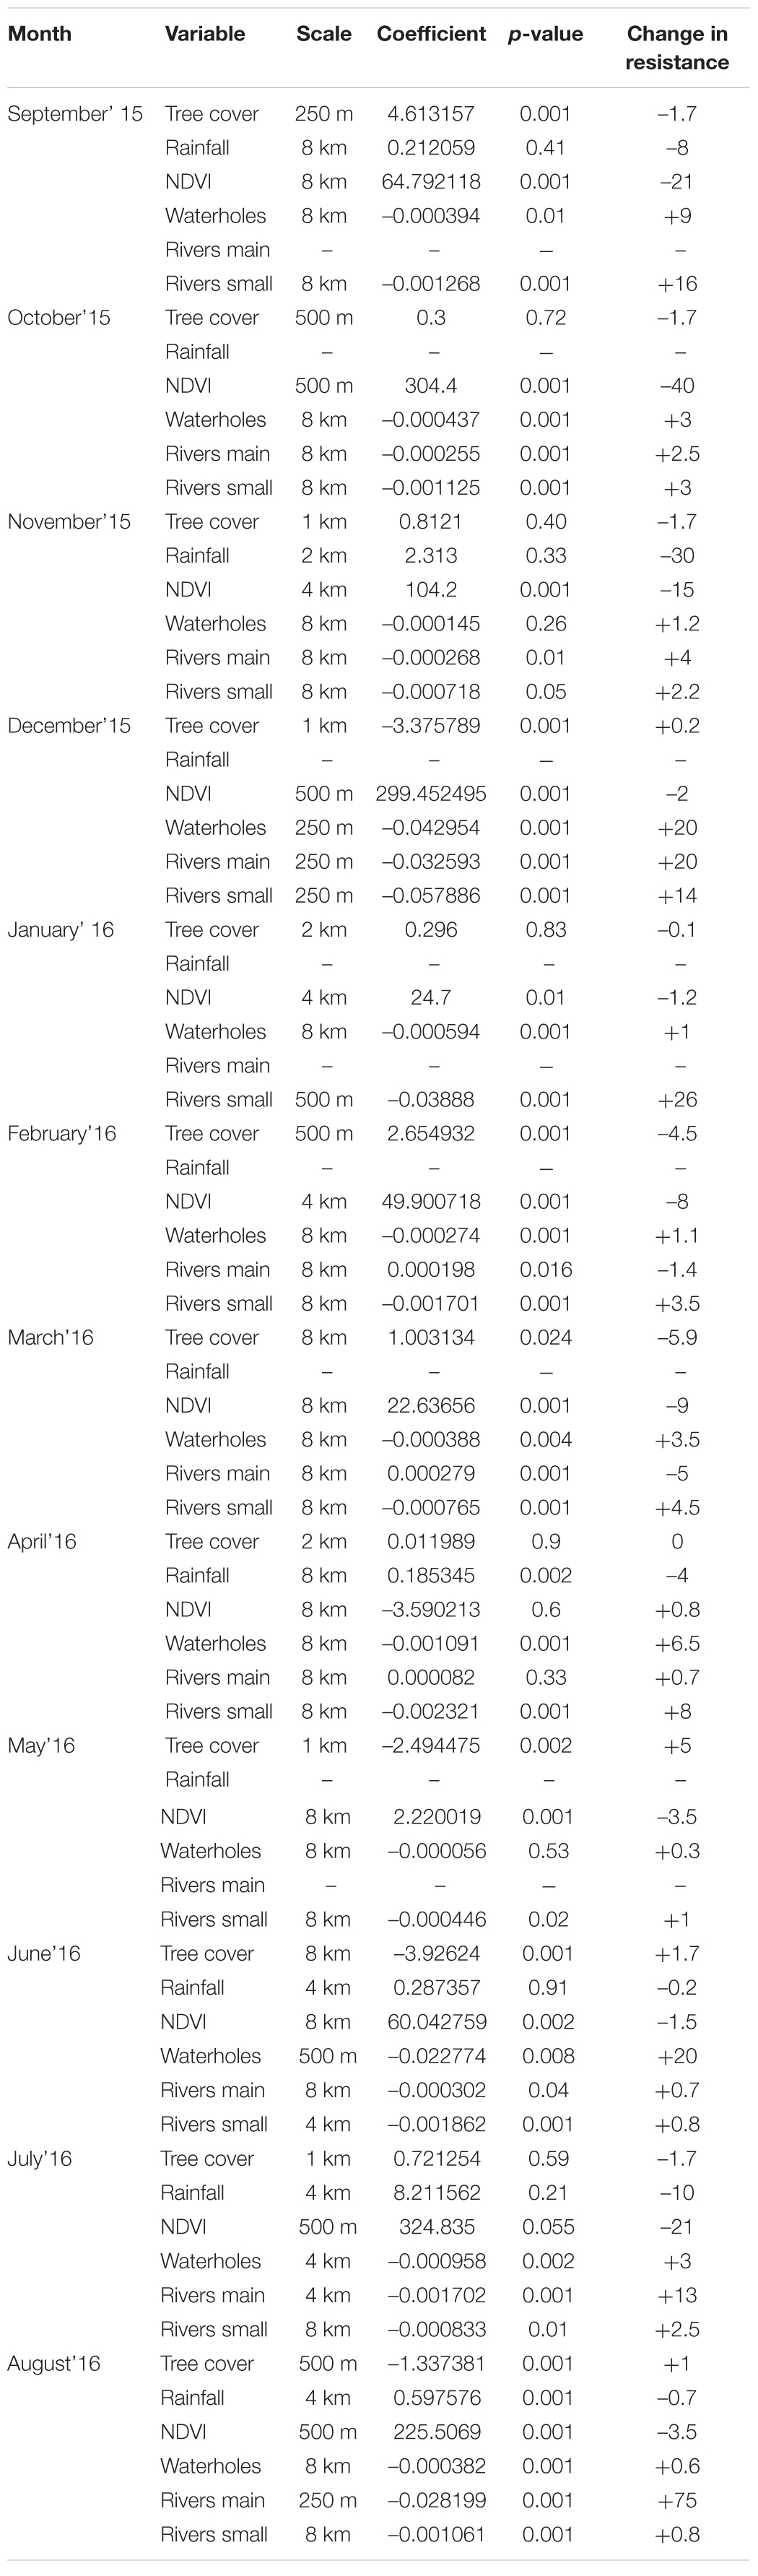
Table 1. Monthly movement models, with coefficients, best scales selected through scale-optimization process, and a variable importance measured by change in resistance value when a variable changes from 10th percentile to 100th percentile.
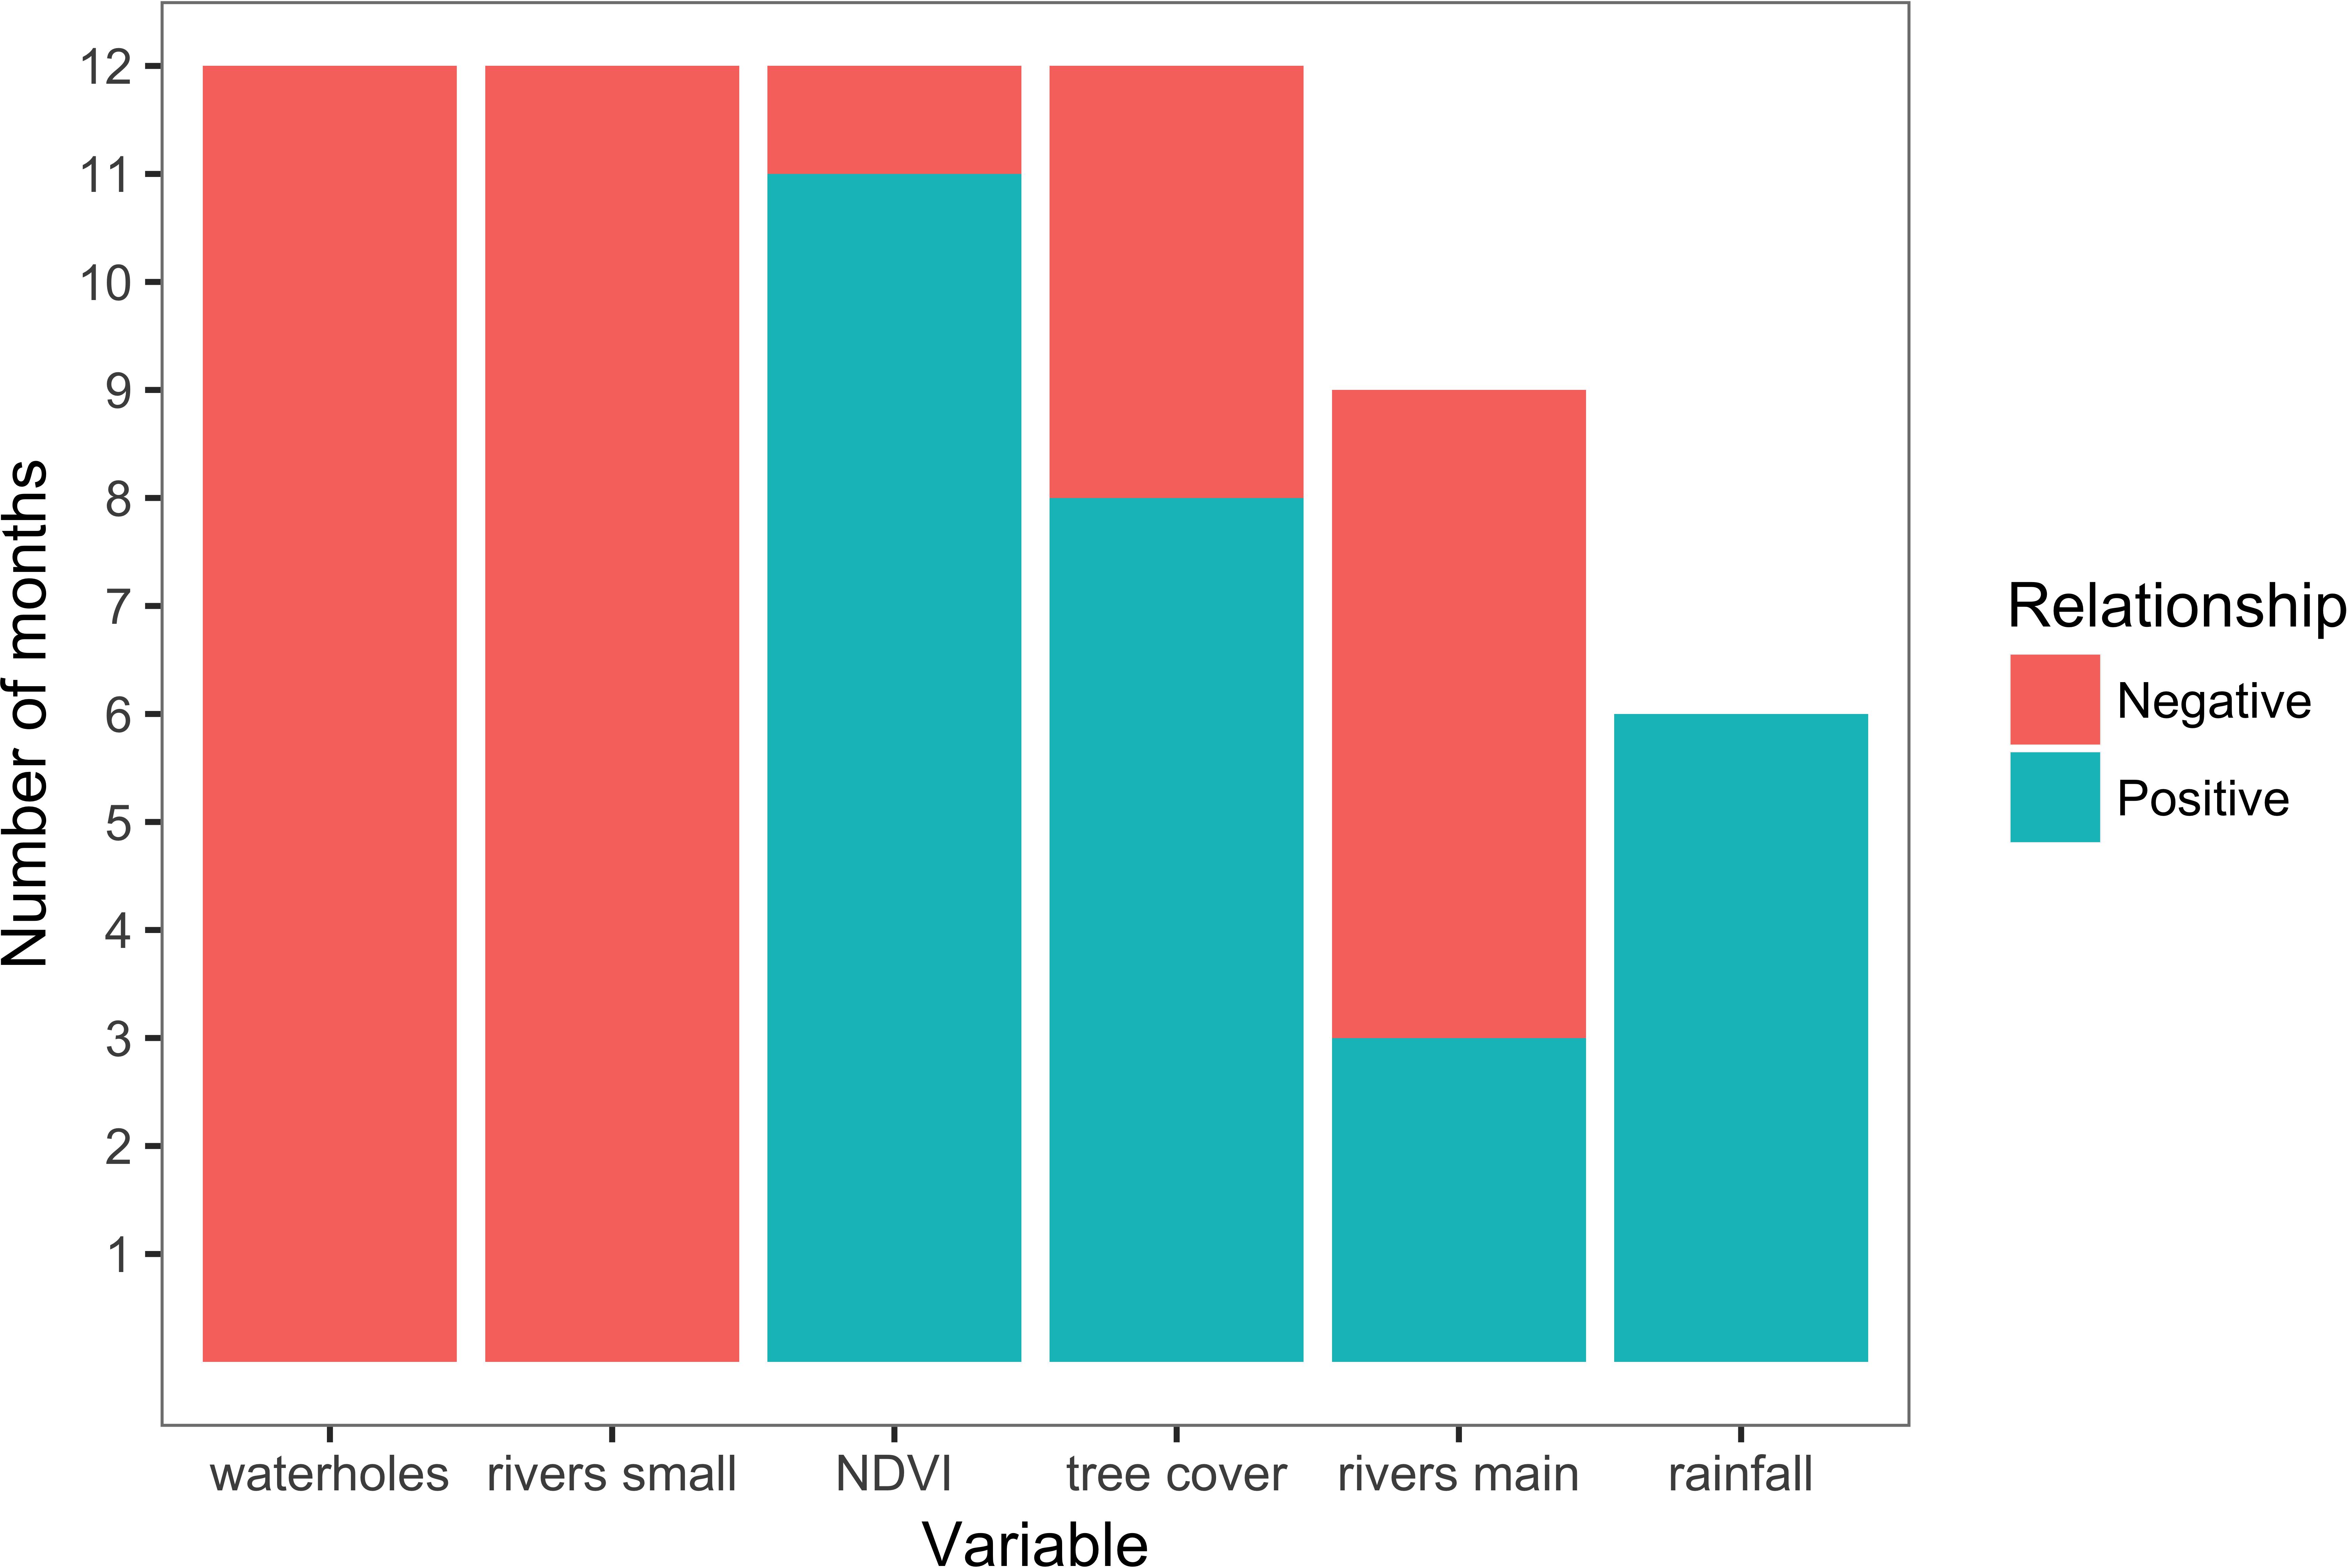
Figure 2. Variables presence and coefficient sign across monthly path-selection models. NDVI was negative only in April 2016, tree cover in December 2015 and May-June 2016, main rivers in October-December 2015 and June-August 2016.
The analysis of variables’ effect size in driving the values of the predicted resistance surfaces also revealed a relatively high level of variability across months (Table 1). All months, distance to water, either to waterholes or rivers, had a large effect on resistance value. Specifically, at the end of the dry season, in July and August, increasing distance to large rivers from the 10th to 100th percentile increased the resistance value by 13 (July) and 75 (August), reflecting strong avoidance of areas far from water sources in these months, which indicates strong selection of areas near rivers in these periods. The strong selection of areas near main rivers is also highlighted by the change of scale for this variable from 4 km in July to 250 m in August. In contrast, change in NDVI values from the 10th to 100th percentile at the end of the dry season and beginning of the wet season, in September, October and November, strongly decreased the resistance by 21, 40, and 30, respectively (Table 1), indicating strong selection for green vegetation in this time period.
We did not find any correlation between monthly variable coefficients and averaged rainfall in the study area (current month, previous month, sum of current and previous months, and long-term monthly average). However, a weak correlation (r = –0.5; linear regression p = 0.09 and R2 = 0.25) was found between the coefficients of distance to small rivers and long-term average rainfall for current month (Supplementary Material 1 and Supplementary Table 4).
The spatial patterns of predicted landscape resistance were highly variable across months (Figure 3). The correlations between monthly resistance surfaces were generally quite low. Often, but not always, surfaces from adjacent months were more correlated with each other than months that were not temporally proximate (Table 2). This was also supported by the Mantel test, where correlation between monthly resistances was significantly negatively correlated with difference in long-term average rainfall from previous month, and a time lag between months (Table 2). Furthermore, landscape resistance in September was somewhat correlated with 8 other months (r ≥ 0.54), and strongly correlated with 6 months (r ≥ 0.62), also exhibiting relatively small absolute average difference in resistance values between the other surfaces (<30 for 9 months).
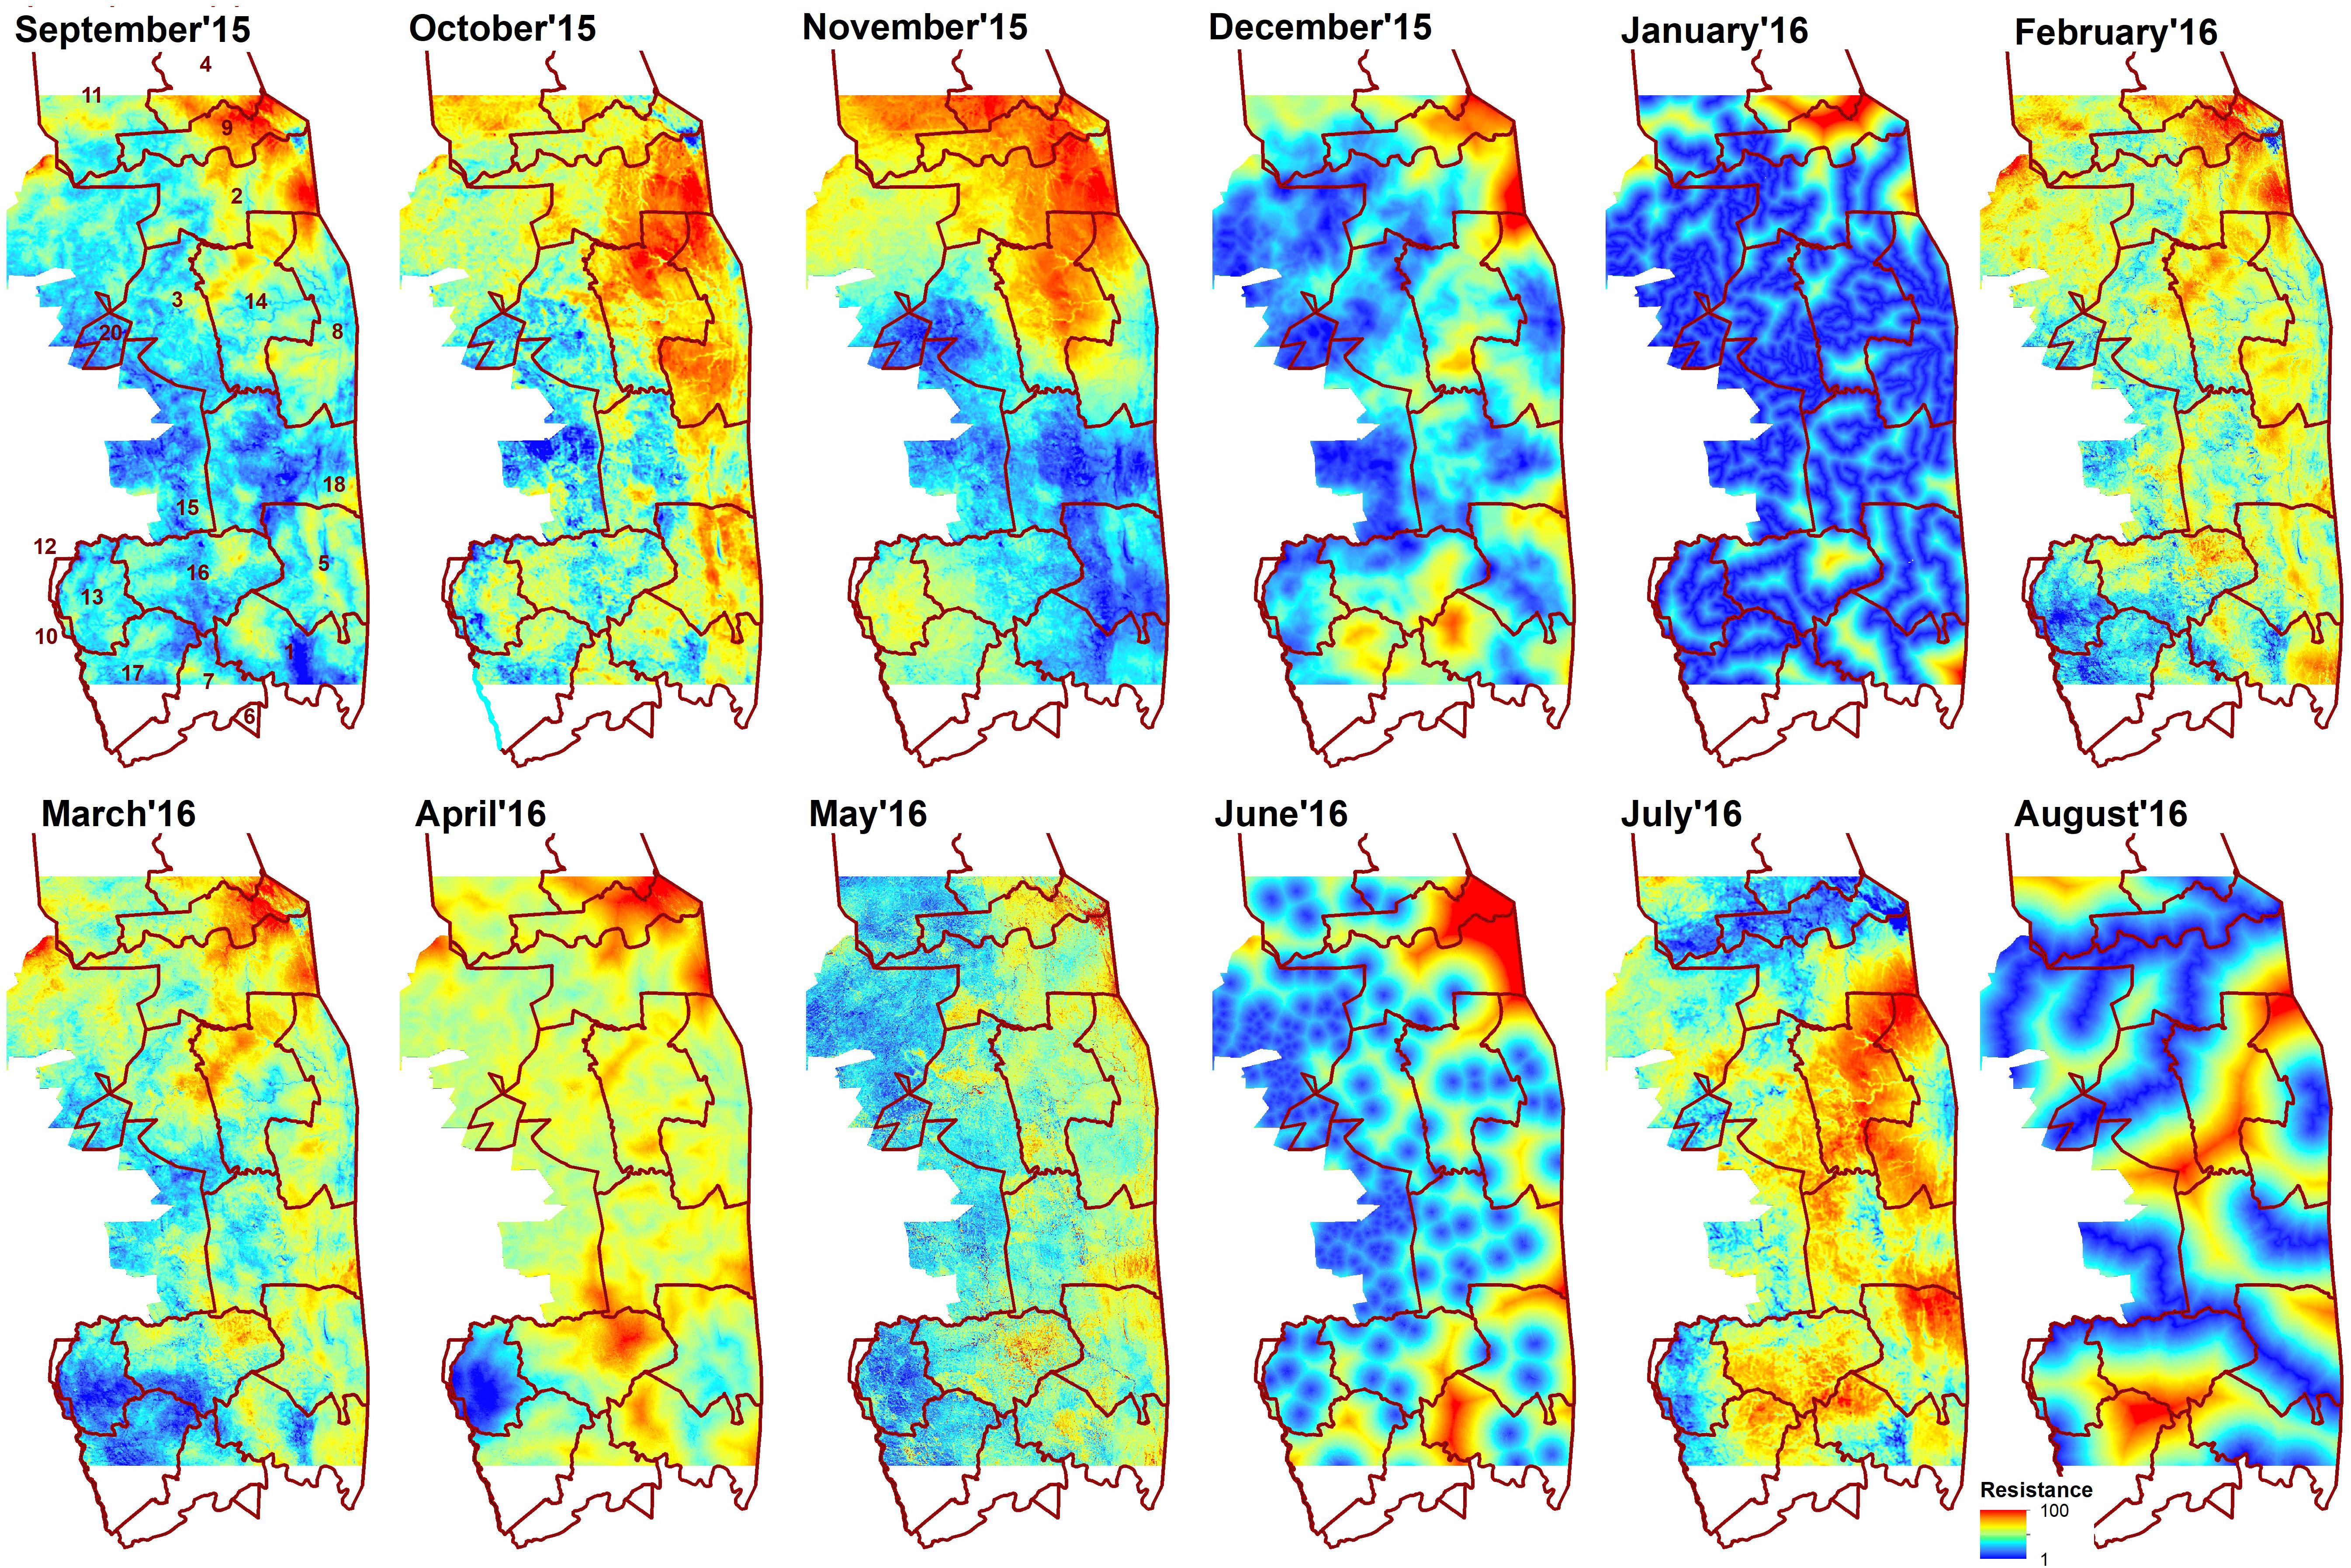
Figure 3. Resistance surfaces developed in multi-scale framework for each month from September 2015 to August 2016. Brown line indicates sections of Kruger National Park: 1- Crocodile Bridge; 2- Houtboschrand; 3- Kingfisherspruit; 4- Letaba; 5- Lower Sabie; 6- Mjejane Contractural; 7- Malelane; 8- N’wanetsi;9- Olifants; 10- Pretoriuskop; 11- Phalaborwa; 12- Pretoriuskop (outside KNP); 14- Satara; 15- Skukuza/private reserves (outside KNP); 16- Skukuza; 17- Stolsnek; 18- Tshokwane. Red color indicates high resistance (elephants repelled) and blue low resistance (elephants attracted).
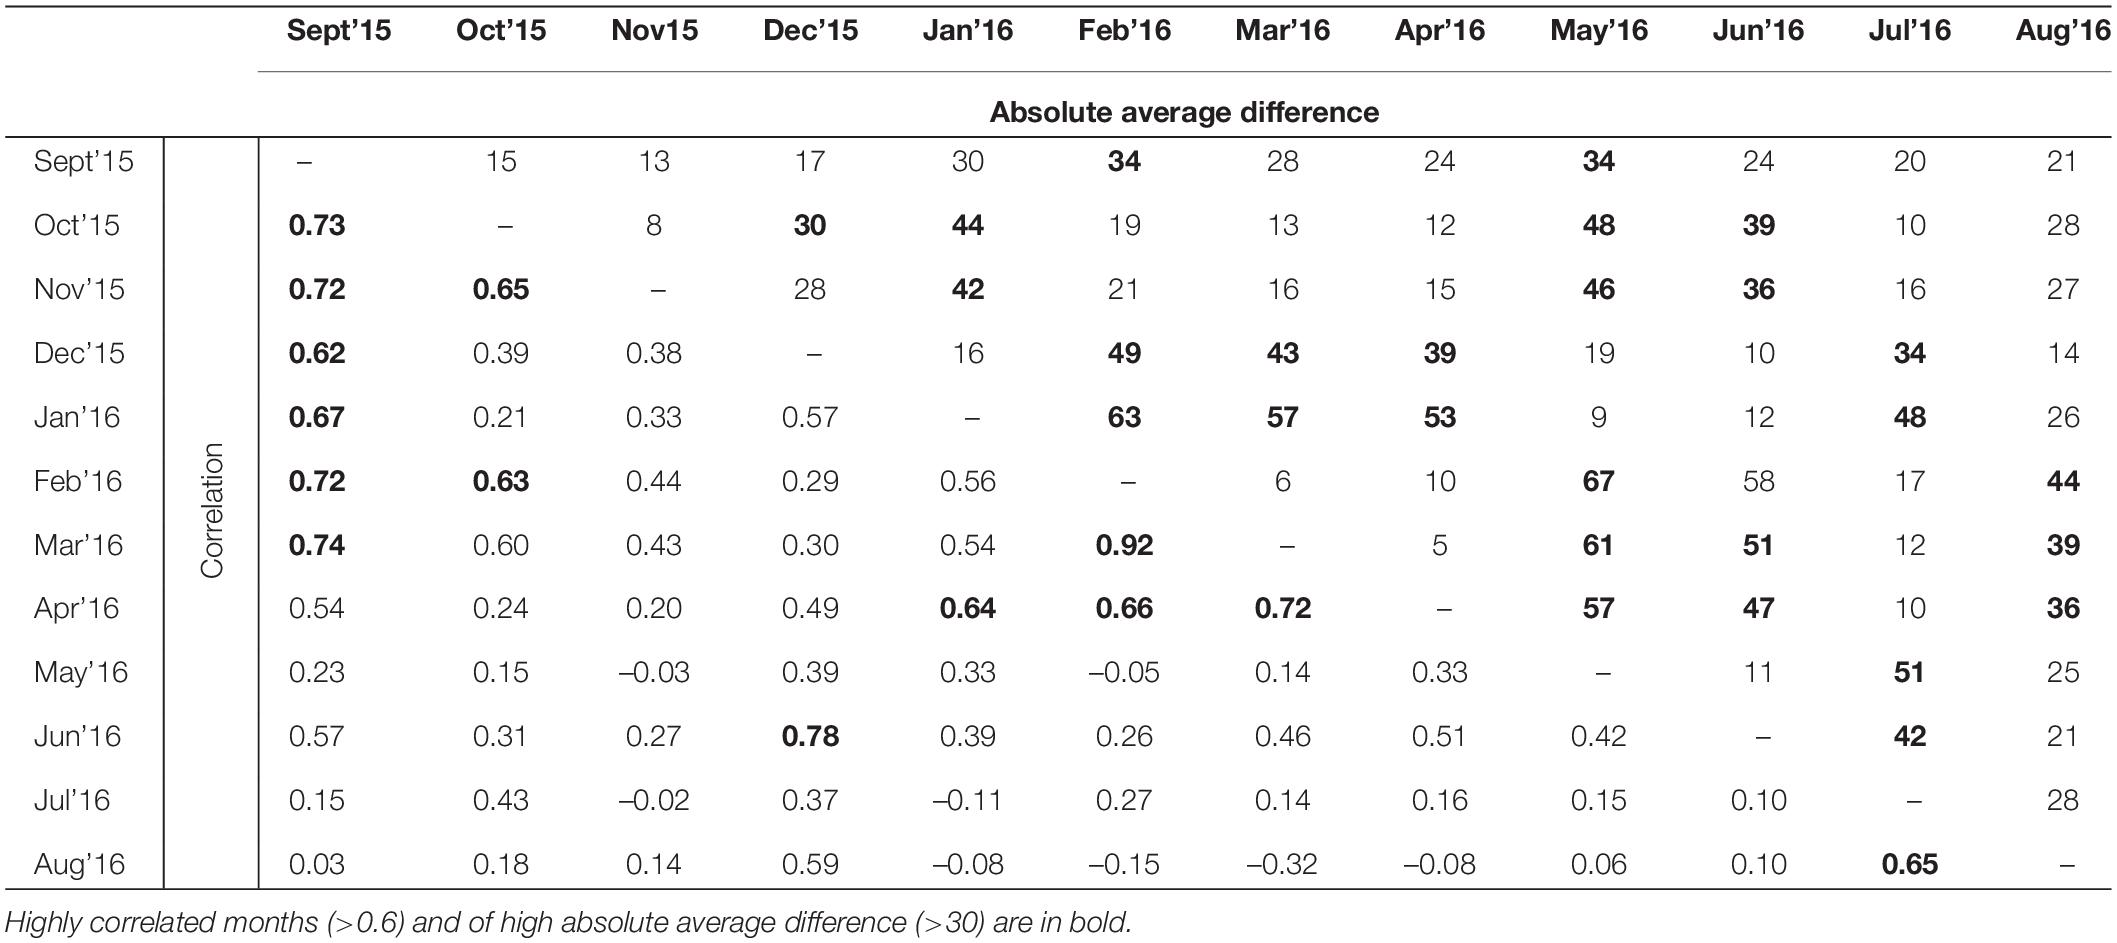
Table 2. Pearson’s correlation and absolute average difference between 12 resistance surfaces representing 12 months from September 2015 to December 2016.
The cumulative resistant kernel surfaces (connectivity surfaces) for each month varied greatly in their spatial pattern across months, with core areas of high density elephant movement shifting across the landscape (Figure 4).
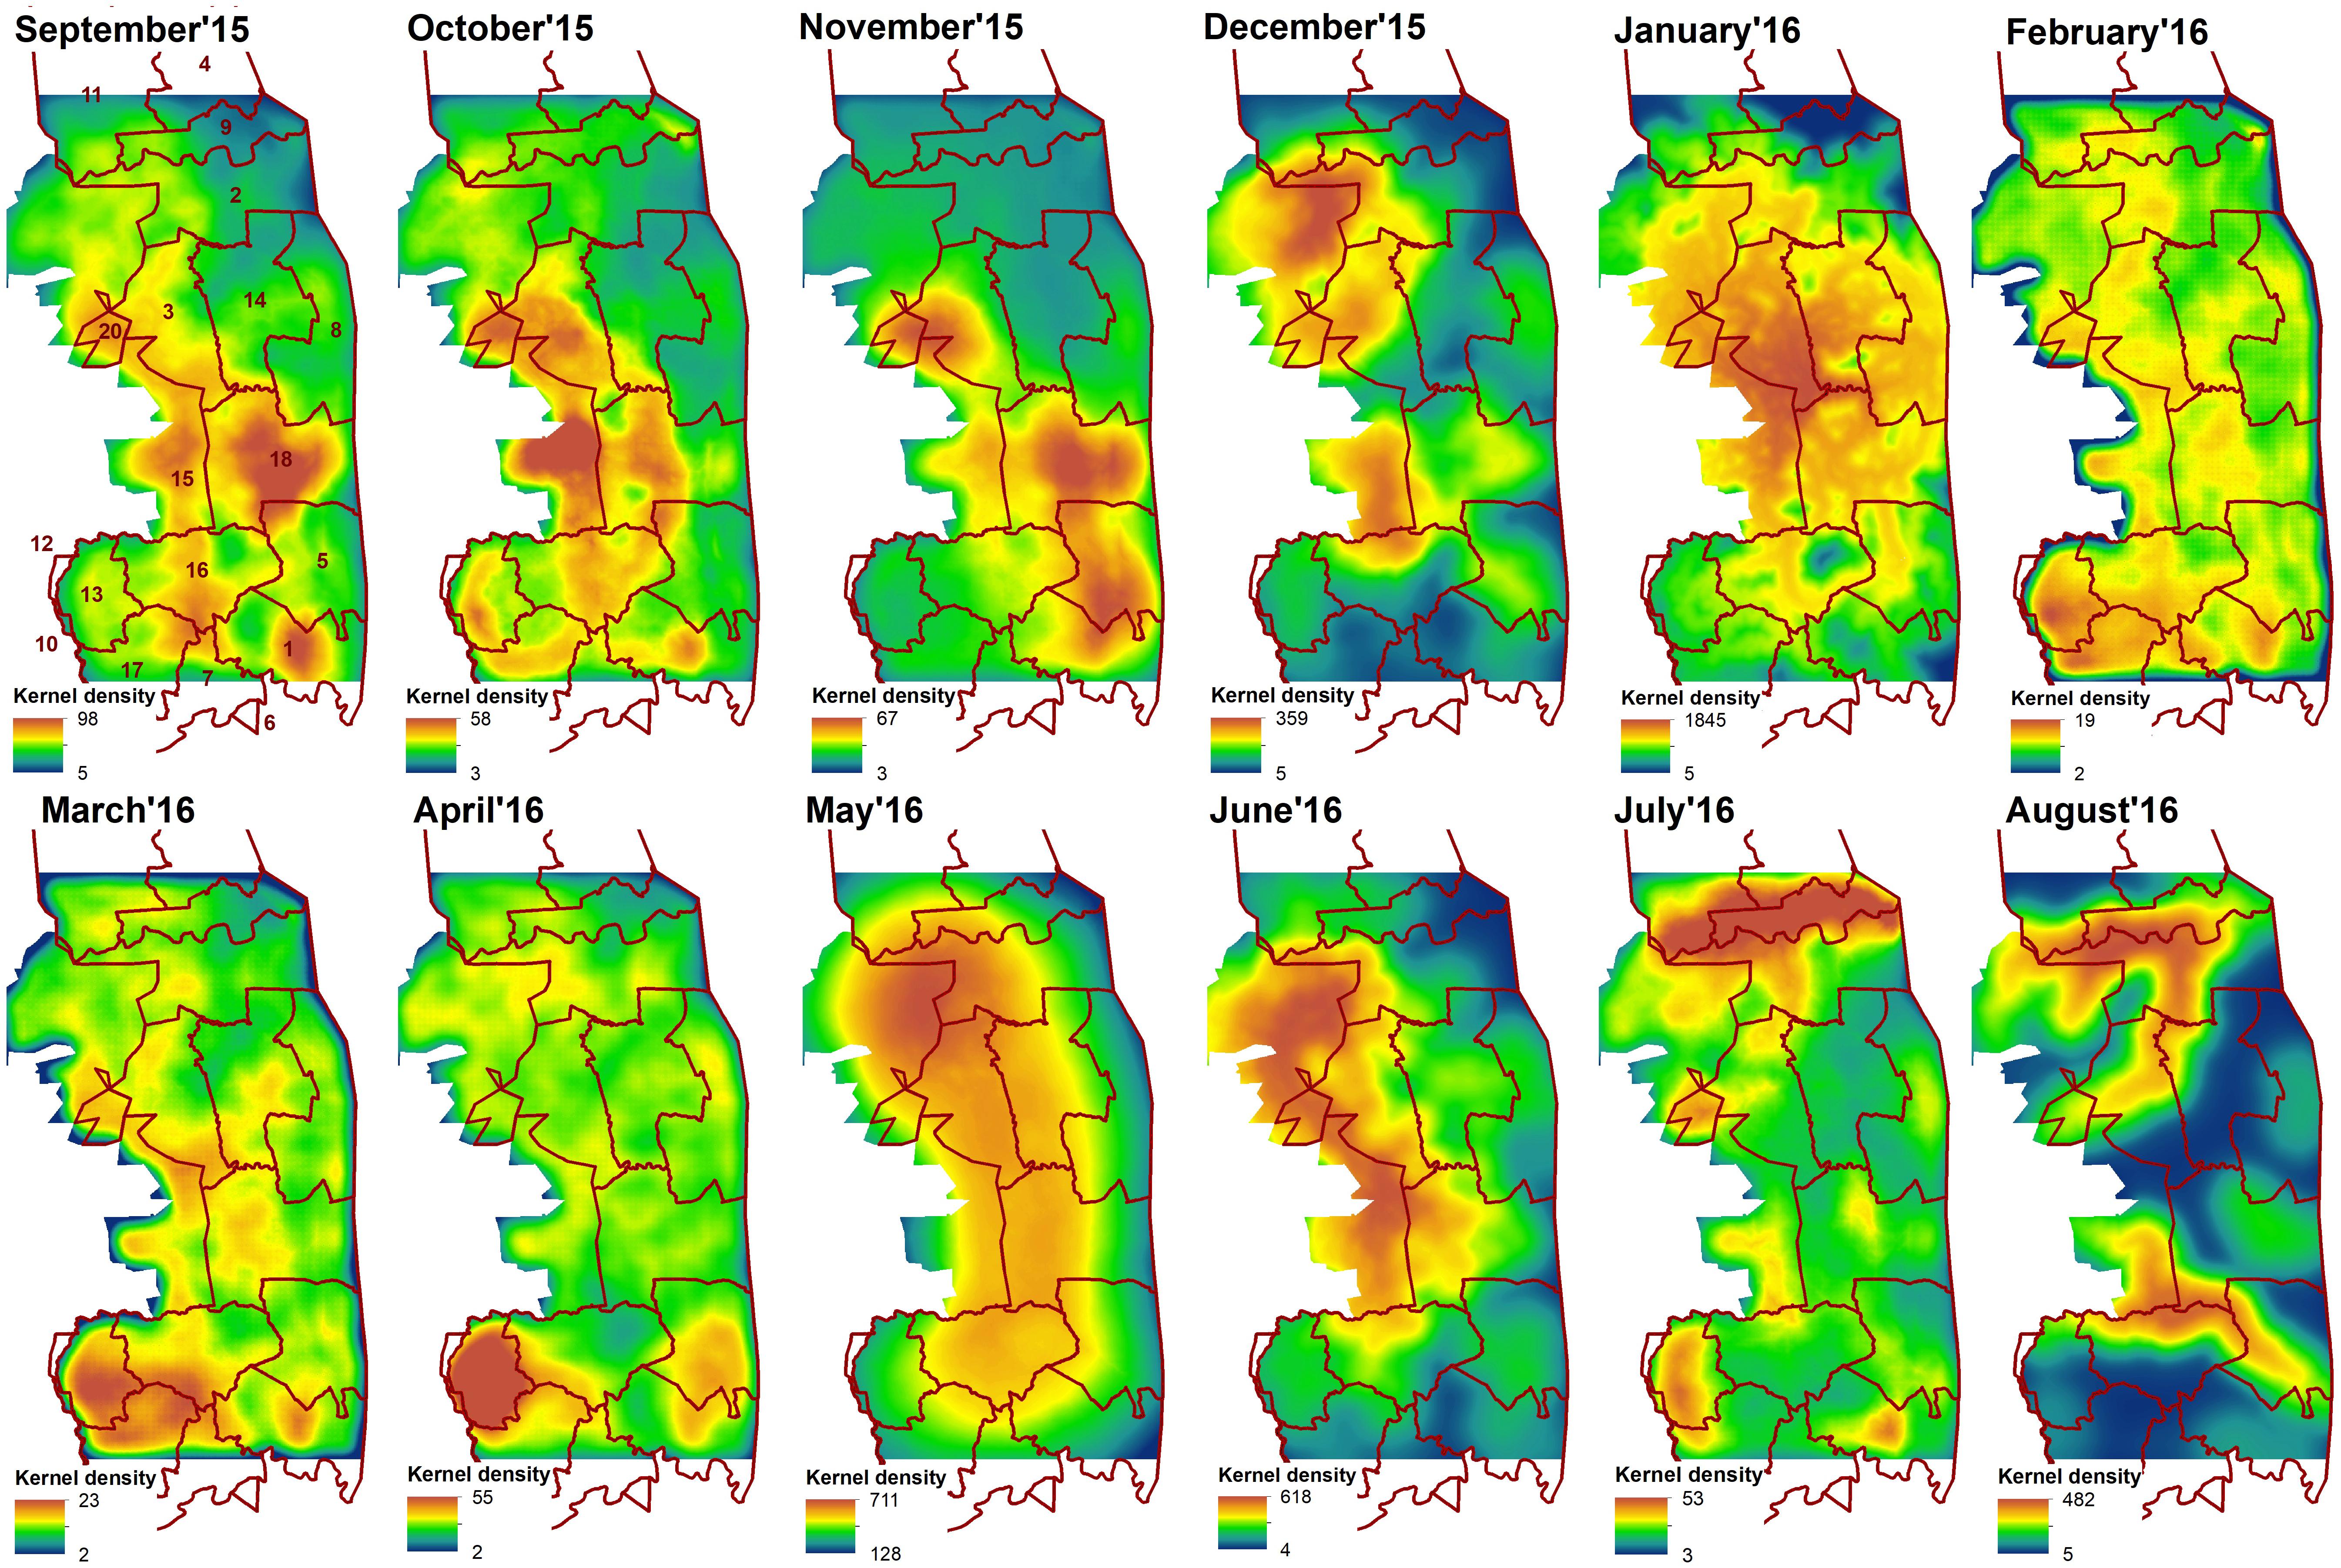
Figure 4. Cumulative resistant kernels surfaces developed for each month from September 2015 to August 2016. Red line indicate sections of Kruger National Park: 1- Crocodile Bridge; 2- Houtboschrand; 3- Kingfisherspruit; 4- Letaba; 5- Lower Sabie; 6- Mjejane Contractural; 7- Malelane; 8- N’wanetsi;9- Olifants; 10- Pretoriuskop; 11- Phalaborwa; 12- Pretoriuskop (outside KNP); 14- Satara; 15- Skukuza/private reserves (outside KNP); 16- Skukuza; 17- Stolsnek; 18- Tshokwane. Dark blue indicates areas of low density elephants’ movement and dark red—areas of high density movement.
The Pearson’s correlation and average absolute difference between connectivity surfaces for both tested dispersal thresholds did not exhibit strong temporal patterns (Table 2). In general, adjacent months exhibited higher correlation (r > 0.61) and lower average absolute difference of kernel values (<400; Table 2). Results of Mantel test of association between the correlation of monthly connectivity surfaces and time lag between months supports this pattern for both tested dispersal thresholds (r = –0.3 and p < 0.05; Table 3). The highest correlation between connectivity surfaces was for February and March for both dispersal thresholds (r > 0.90 and absolute average difference of kernels values < 6; Table 4). Mantel tests also revealed significant negative association between correlation between connectivity surfaces for dispersal threshold 500,000, and difference in total monthly rainfall from previous and current month (r = –0.27 and p = 0.04; Table 3).
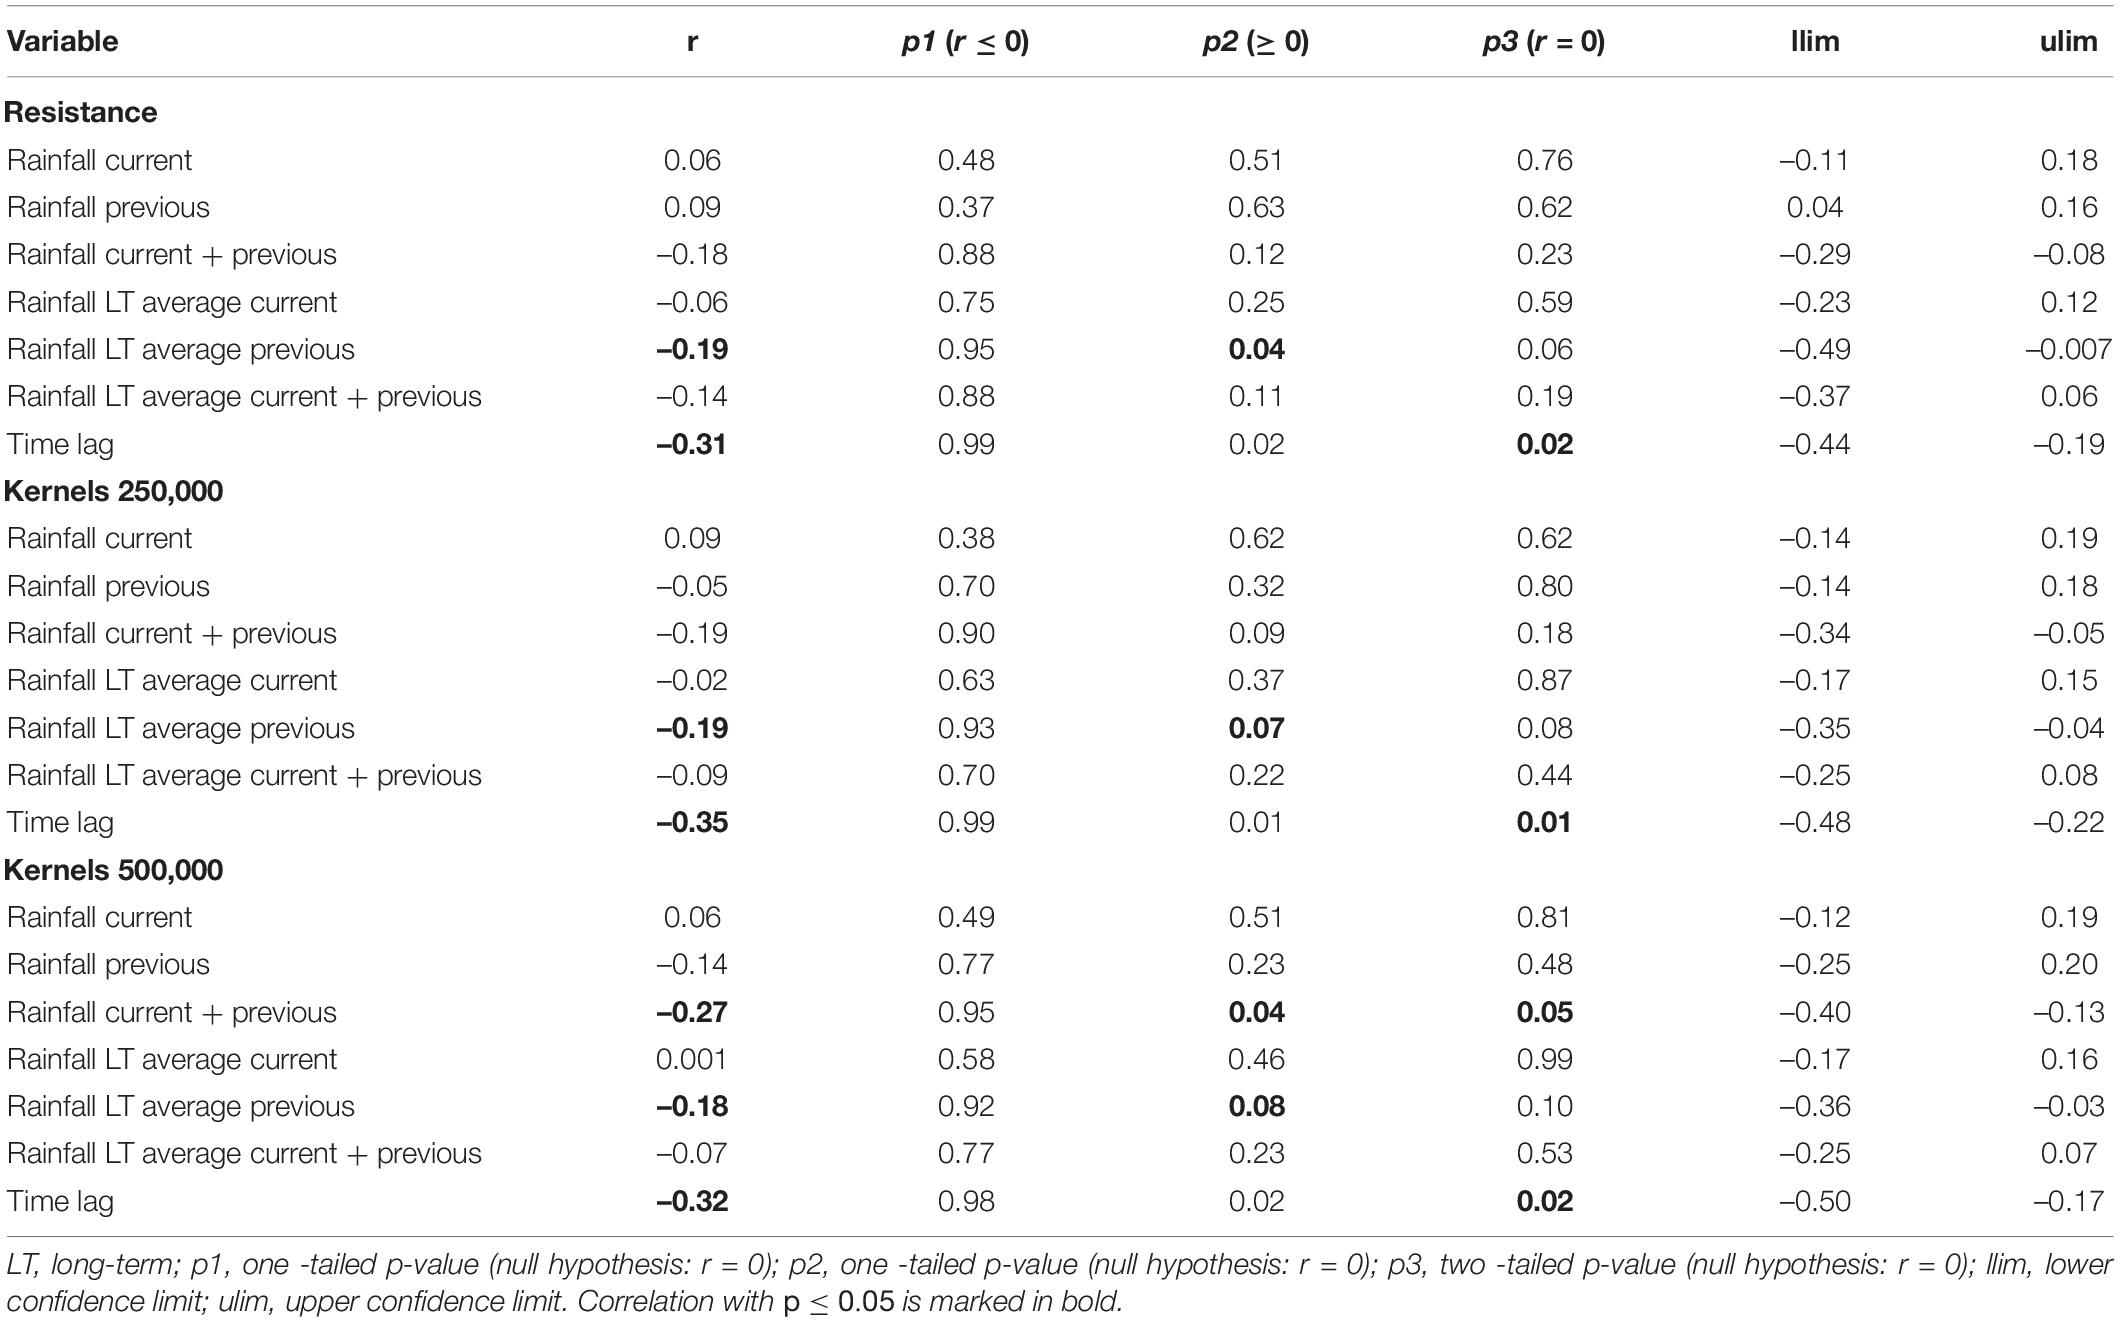
Table 3. Mantel test between correlation of monthly resistances/cumulative resistance kernels and difference in rainfall across months (current month, previous month, current plus previous month, long-term average for a month, long-term average for a previous month and long- term average for current plus previous month) and time lag between months.
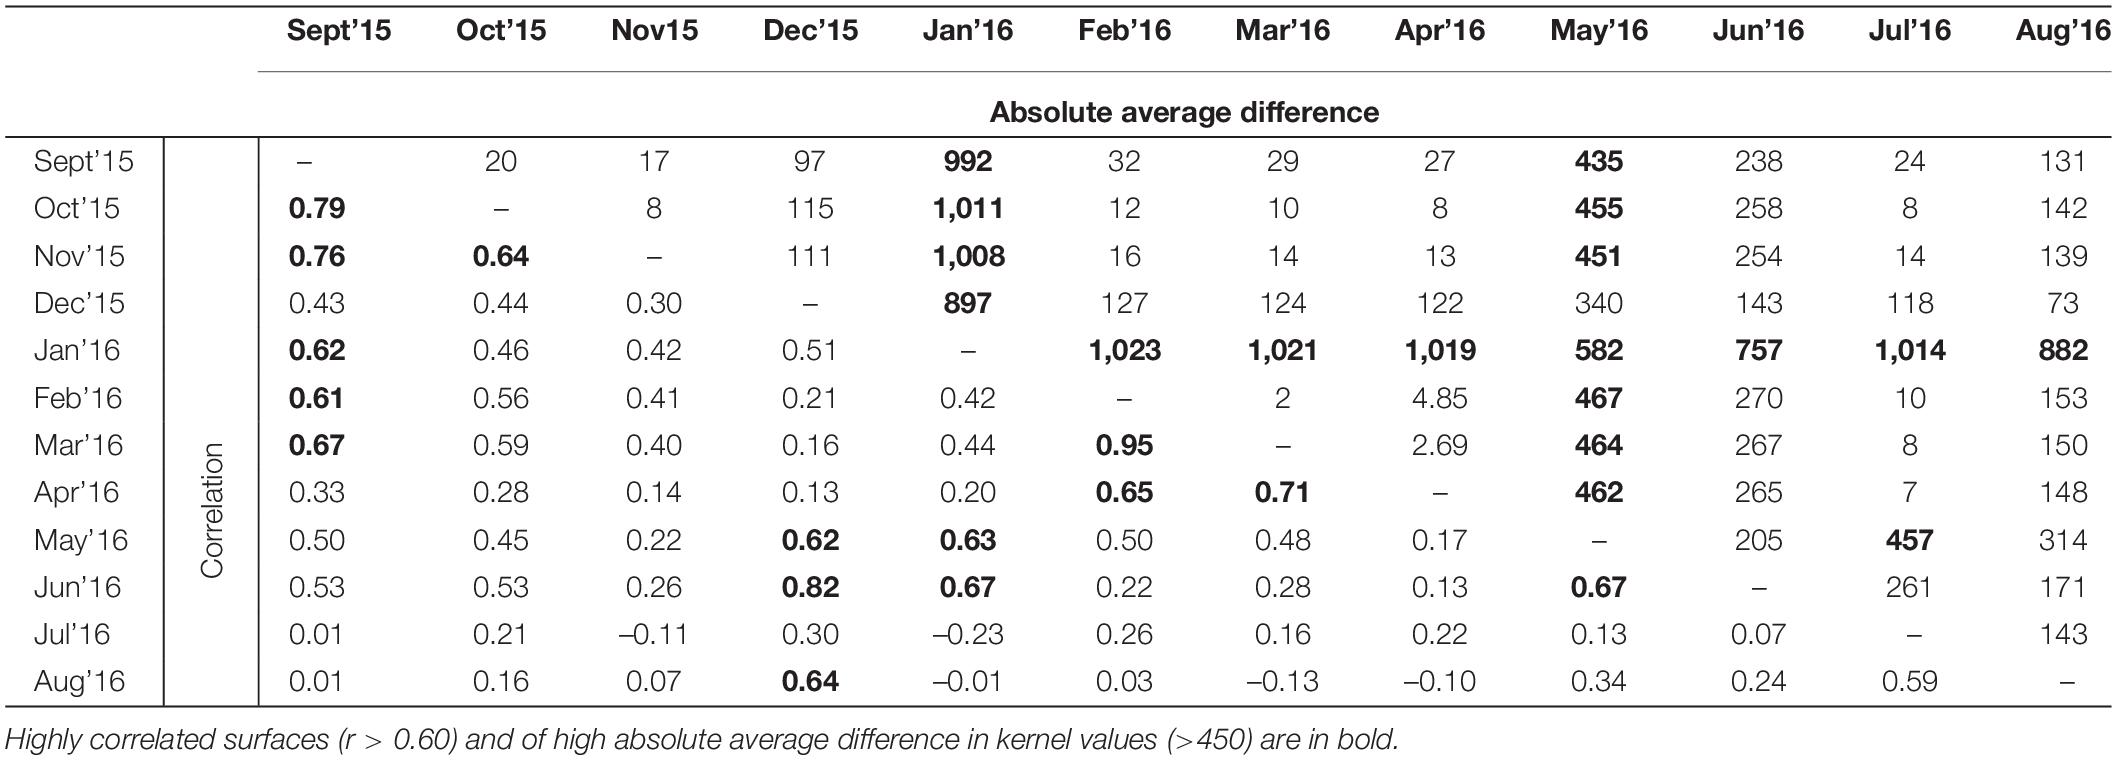
Table 4. Pearson’s correlation and absolute average difference between cumulative kernels resistance surfaces at dispersal threshold 500,000.
This paper evaluated monthly movement patterns of female elephants in Kruger National Park, South Africa, over a period of 12 months to quantify the degree to which movement pattern, factors driving path selection, predicted landscape resistance, and predicted landscape connectivity were stable through time, and the degree to which their variability was related to seasonality, forage quality, water available, rainfall, and their interactions. We found high variability in patterns of autocorrelation in elephant movements across individuals and months, and high non-stationarity of path-level movement models and connectivity surfaces developed based on them. Our results also indicate that even during a severe drought, rainfall itself was not a strong driver of elephant movement. Instead, our results indicate that elephants were primarily selecting areas with green vegetation, near waterholes and small rivers, likely attracted by riparian vegetation along the drainages. Finally, our findings suggest that conservation and management strategies developed based on temporarily idiosyncratic models might not be appropriate or efficient as a guide to identify crucial areas for allocating scarce resources.
Our results showed that the patterns of autocorrelation in monthly elephant movements were highly variable and complex, as also seen by Cushman et al. (2005). Cushman (2010) used simulation modeling to show that three distinct behavioral movement patterns (directional random and periodic) could be reliably distinguished from the shape of Mantel correlograms. Nearly half of the monthly correlograms in this study were identified as directional trend, significantly more than expected by chance, which we believe was an effect of a prolonged drought, and substantially more than reported for elephants in Botswana in a non-drought year (Cushman et al., 2005). Cushman et al. (2005) and Wato et al. (2018) found that directional movement in African elephants is usually associated with dry season orientation toward water sources or areas of quality forage that persist in the dry season. Furthermore, Thaker et al. (2019) showed that thermoregulation is a strong driver of elephants movement to water. However, in a drought period, availability of forage might be even a stronger limiting factor than the water itself (De Beer and van Aarde, 2008; Woolley et al., 2009; Birkett et al., 2012), which is suggested by our movement models showing overall a strong attraction to areas of high vegetation productivity. Importantly, supporting this conclusion, we found a significant association between NDVI and frequency of directional and random movement patters, with directional movement more frequent when NDVI is low and random movement when it is high. Our results showed that, during the months with higher average NDVI, associated with more abundant and widespread forage, elephants randomly used temporary home ranges. This appears to be consistent with the pattern reported by Cushman et al. (2005) for elephants in Botswana, which were more likely to have random movement patterns (as judged by correlogram shape) in wetter periods when forage would be greener, and hence NDVI would be higher. Elephants, as mixed-feeders, respond spatially to variable resources during the drought by changing their normal movement patterns, and adopt longer distance movements in search for water and forage (Smit et al., 2020). Therefore, the preponderance of directional long-distance movement in our study might reflect the need to move from water sources to distant areas with forage, as in the dry periods vegetation near waterholes becomes highly overgrazed (Kaszta et al., 2016). Despite the drought, vegetation productivity was characterized by higher intra-annual and spatial variability than rainfall. The significantly elevated frequency of random movement in times of high NDVI suggests that when foraging is not limiting (high NDVI) elephants move randomly to maximize foraging efficiency in local areas, while when NDVI is low elephants engage in directed, long-distance movement, presumably seeking quality forage or water.
Surprisingly, however, we did not find any significant relationships between the type of movement and seasonality or rainfall. Cushman et al. (2005) found such relationships in elephant movements in Botswana, specifically that the correlation of movement patterns was highly associated with rainfall across current and prior months. The lack of strong association of movement pattern and rain in this study could be, again, related to the effects of the extreme drought. Specifically, during the normal pattern of seasonality, with clearly pronounced wet and dry season, rainfall has been reported to be a limiting factor for elephants’ spatial behavior (Cushman et al., 2005; De Beer and van Aarde, 2008; Birkett et al., 2012). However, the unusually severe drought with very low rainfall throughout our entire study period (Supplementary Figure 1) could have perturbed the expected relationship between elephant movement patterns and typical patterns of rainfall and seasonality. Additionally, rainfall might have not been a limiting driver in this system because of the provision of artificial water holes in Kruger National Park. These provide water throughout the year even in a drought. Dependence on these scattered water sources, however, likely leads to intense local grazing pressure in their proximity, requiring longer and longer foraging bouts to reach quality forage as the drought period continues. Our results show this pattern both in the selection of forage quality and increasingly directional and long-distance movements in the dry periods of the study.
Perhaps the most important finding of this study is the high temporal non-stationarity of movement models developed based on path-selection functions. Although the monthly models largely included the same variables with the same sign (e.g., qualitative similarity among months), they varied quantitatively across the 12 months. Furthermore, we found that the correlations between resistance surfaces across 12 months were generally low, and the absolute average difference between them was high. This highlights a potentially serious problem in using movement models in general, and path selection functions in particular, to infer landscape effects on movement and to use these interpretations to develop conservation plans.
Movement models are widely used in conservation planning (Squires et al., 2013; Elliot et al., 2014a, b; Carvalho et al., 2016; Hearn et al., 2018b; Kaszta et al., 2019, 2020a, 2020b; Osipova et al., 2019). These studies often extrapolate results from analysis of data collected over a short period of time. However, if fine-scale temporal non-stationarity is often as high as we observed it in this study, then pooled seasonal or yearly movement or connectivity models may not be reliable, especially when they are developed to inform ecological understanding and to guide conservation planning over different time periods.
Fine-scale temporal variation in animal movement has not been widely investigated. To our knowledge there have been few past studies that focus on temporal non-stationarity of movement patterns and resource selection, and almost no published studies have addressed temporal variation in path-level analysis or connectivity, especially when also accounting for variability in spatial scale of movement and resource use. The non-stationarity of temporal scale-optimized path-selection models has been reported previously (e.g., Cushman and Lewis, 2010). In that study the authors found that two seasonal bear movement models qualitatively and quantitatively differed in response to changing seasonal limiting factors. Similarly, Cushman et al. (2011) found differences in resistance models from path-selection functions for American marten (Martes americana) in a pre-harvest landscape and the same landscape after it experienced extensive and highly fragmenting timber harvest. As in the Cushman and Lewis (2010) study, the difference was explained based on dramatic changes in limiting factors that affected movement differently between the two temporal periods compared.
Seasonal non-stationarity of movement models has also been reported in step-selection analysis (Osipova et al., 2019; Zeller et al., 2019). For example, Osipova et al. (2019) used single scale step-selection models and found large differences in seasonal movement models and corridors predicted from them for African elephants in the borderland area between Kenya and Tanzania. The authors stressed that movement corridors for elephant designated without accounting for seasonal resource fluctuations do not protect elephant movement across the full scope of space and time relevant for conservation. In contrast, Squires et al. (2013), modeling step-selection and connectivity of Canada lynx (Lynx canadensis) in the Northern Rocky Mountains, found only small seasonal variation. However, even when seasonal models appear to be stationary, there may be, as in our study, highly variable movement patterns at finer temporal scales that limit the general utility of the seasonal models. This suggests that movement and resource selection models should be jointly optimized for both spatial and temporal scale, as suggested by McGarigal et al. (2016a, b).
Our study evaluated the effects of finer temporal and scale-dependent variation in animal movement than typically has been studied. Most published studies report annual or seasonal models, whereas we compared 12 adjacent monthly periods, which allowed us to evaluate temporal non-stationarity at a scale finer than seasons. Finding very high temporal non-stationarity within years and within seasons suggests that more attention should be paid to temporal non-stationarity, and to optimization of temporal scale in resource selection and movement modeling.
We found nearly universal and strong non-stationarity in the predictions of path-selection functions, and the connectivity surfaces we developed based on them, and this high non-stationarity was generally not associated with the expected effects of limiting factors. For example, we did not see greater similarity in resistance and connectivity models as a function of similarity in rainfall. We did see a weak association in resistance and connectivity as a function of proximity in time, suggesting the models developed near in time are likely to be more similar than those developed at more different periods. This association was, however, only significant for adjacent months and was not particularly strong. We also found a significant association between resistance and connectivity predictions and similarity in NDVI between months, suggesting that, for elephants, forage seems to be the one factor among those we studied that has a consistent effect on resistance and connectivity. This is in accordance with a study of Smit et al. (2020) investigating effects of the 2015–2016 drought in KNP on megaherbivores. The authors suggest that food rather than water is a limiting factor for elephants during the drought and increased water provisions of artificial water does not increase megaherbivores survival during drought. Our results, for the same species, in the same system, at the same time, are fully consistent with this and suggest that forage quality and how it changes in accessibility during drought periods is the primary limiting driver of elephant movement in KNP. Our findings are also consistent with Loarie et al. (2009), who showed that African elephants consistently selected greener vegetation across 6 years of data, despite the season, by utilizing vegetation with different phenologies, and by selecting landscapes when they are greener than their surroundings. Similarly, our findings show that elephants have strong attraction to green vegetation in times of drought, as well as frequent long distance directional movements from waterholes and rivers to areas provisioning high quality forage during these periods of resource scarcity.
We found that monthly path selection by elephants in Kruger National Park was dependent on the spatial scales at which environmental context was considered. Although, in general, elephants selected resources in relation to broad scales of their availability (especially those related to water accessibility), the spatial context of selection/avoidance of habitat components was not temporarily consistent. Several previous studies have shown the critical importance of spatial scale when investigating species-environment relationships (e.g., De Knegt et al., 2010; McGarigal et al., 2016a, b). De Knegt et al. (2011) explicitly evaluated the spatial scaling of habitat selection by African elephants in Kruger National Park, supporting our finding that quantification of resource use is scale dependent, and that optimizing scale relationships increases the predictive ability of habitat suitability models. Likewise, Cushman et al. (2010), in the introductory publication describing the path-selection approach, found that elephant movement path selection in Botswana was highly scale dependent. Furthermore, similar to our results, Cushman and Lewis (2010) found that the two investigated seasonal path-level movement models for American black bear varied in spatial scales at which same landscape features were represented in each model. However, the fine-scale temporal variability of functional scale at which landscape variables are most related to the selection of movement paths has never been investigated before.
Our results show that the most important and consistent factors affecting elephant movement across nearly all months was access to high quality and quantity of forage, as well as proximity to waterholes and small rivers. The importance of forage and water availability for elephants was previously reported by De Knegt et al. (2011), who suggested that elephants optimize efficiency of movement and foraging by selecting areas sufficiently close to water and of high forage availability. Furthermore, Smit et al. (2020) found that during the 2015–2016 drought in KNP elephants exhibited regional movement patterns and were attracted to higher water provision densities. The same general pattern was reported by Loarie et al. (2009). However, we also found that the extent to which water and forage availability impacted elephant movement and the resistance surfaces generated by path-selection functions greatly varied across months. NDVI, a proxy for vegetation quality and quantity, seemed to have the highest impact on resistance surface during the transition period ending the dry period and starting the wet season (September, October, and November). This is the time when females and weaned calves are susceptible to stress caused by the decreased nutritional value of forage (Woolley et al., 2009). We also found that proximity to main rivers, although present in nine models, had disproportionally high impact on resistance values at the end of the dry season (July and August) when other water sources might have dried up.
We expected that elephant resource selection would be strongly driven by spatial and temporal patterns of rainfall in the study area. However, rainfall appeared to be one of the weakest and universal abundant predictors across all path-selection models. Similar results were found by MacFadyen et al. (2019), showing that density of elephant herds in KNP across three decades of census records collected during dry seasons was not driven by spatial pattern of rainfall, but by proximity to water sources and forage quality. Here, we confirm this, and our results emphasize the importance of green vegetation as a driver of movement, in relation to its distance from water sources. Furthermore, the study of Ndlovu et al. (2018), points out that during the drought period water quality might be a far more important factor driving elephant preference across waterholes than water availability.
The fact that the path-level movement models we developed showed very high temporal non-stationarity of their predictions has important implications for future studies investigating resistance to movement and connectivity, as well as for conservation and management actions. Traditionally, the design of movement modeling studies has not accounted for temporal non-stationarity, unless it was related to questions of seasonal movement patterns (e.g., Cushman and Lewis, 2010; Osipova et al., 2019; Zeller et al., 2019) or pre-post landscape change (e.g., Cushman et al., 2011). The investigation of an appropriate time-window for developing a movement model should constitute a necessary step in order to account for behavioral variation in animal space use patterns, so as to produce stable, reliable, and useful predictions of landscape resistance and connectivity that can inform conservation (McGarigal et al., 2016a, b). This especially applies to African elephants, which are subjected to often intensive management due to their role in shaping ecosystems, potential to drive habitat degradation, and their exposure to poaching. In Kruger National Park, where the current elephant population is presumed to have negative effect on vegetation (Seloana et al., 2017; Robson and van Aarde, 2018), there is growing interest in managing the elephants by restricting the availability and distribution of water sources.
The high intra-annual variability of resistance and connectivity surfaces we produced suggests high variation in space-utilization and temporal shifts of core habitat areas for elephants in Kruger National Park. This information is important for managers, as conservation and management strategies focusing only on certain areas identified by temporarily idiosyncratic models might not be appropriate or efficient as a guide for allocating scarce resources. For example, our approach, expanded by additional data from other collaring projects in KNP, can be used to identify specific areas where elephants respond to green vegetation and waterholes most strongly during drought, and to identify specific waterholes to be closed to promote natural demographic processes, such as weaned calf mortality, to play out in regulating the KNP elephant population (Hilbers et al., 2015). This may be especially important in the private reserves to the west of Kruger, which have a very high density of waterholes, and where waterholes have not been closed (Mwakiwa et al., 2013). In other parts of the elephant range, where the management goals are not population reduction, understanding temporally varying patterns of elephant movement in relation to water and forage quality could be used to guide conservation strategies to maximize resource complementation and supplementation to increase the landscape-scale carrying capacity for the elephant population and to increase its connectivity to facilitate recolonization.
We strongly advocate that conservation and management actions of any species of interest should be informed by rigorous models that account for scale dependence, both spatial and temporal (McGarigal et al., 2016a, b), landscape-dependent limiting factors (Cushman et al., 2011), and, following the results of this paper, that account for and explain temporal variation in space use. Furthermore, we urge researchers studying other species or ecosystems to evaluate temporal variability and non-stationarity to quantify how general are the patterns we observed in this study. If movement patterns do not strongly and stably reflect how landscapes affect movement at spatial and temporal scales relevant to population processes and conservation decisions, then other approaches that have more temporal stability, such as landscape genetics (Balkenhol et al., 2015) might be needed. However, methods such as landscape genetics typically substitute long time lag effects, which often result in non-equilibrium between current landscape conditions and inferences of landscape resistance (e.g., Landguth et al., 2010), for short-term temporal non-stationarity.
The ability of researchers to reliably use empirical data on species occurrence and movement to infer the factors that drive patterns of occurrence and movement is the foundation of data-driven conservation science. Our results suggest more attention must be paid to how stable and reliable these predictions are, and what methods, sampling designs, and analytical frameworks produce the most reliable and stable predictions of landscape resistance and connectivity.
In this work, we investigated a time window of a month, to be consistent with previous elephant autocorrelation (Cushman et al., 2005) and path selection function studies (Cushman et al., 2010). Our observation of high non-stationarity of the movement models and connectivity predictions is within this temporal scale of analysis. It is unknown how the stability of resistance and connectivity models changes with changing temporal scale of analysis. Further study should evaluate models based on varying time-windows, such as 2-weeks (Elliot et al., 2014a) to 1 year (Cushman et al., 2010). In particular, McGarigal et al. (2016b) noted that almost no published habitat selection studies address temporal scale, and none that they reviewed optimized models to the best temporal scale for prediction. They suggest that in addition to optimizing spatial scale in habitat and movement modeling, researchers should also and simultaneously optimize temporal scale. The observation of high temporal non-stationarity in this and other studies that have assessed it highlights the importance of addressing and accounting for temporal scale and temporal variability in animal movement and resource selection functions. To reliably associate observed results with known drivers we suggest that multi-temporal and multi-spatial scale optimization studies should be evaluated through a controlled process by applying agent-based simulations.
Our study was limited to a 12-month period during an extreme drought. It would be informative to extend the study period to observe changes in movement behavior in this system in non-drought periods. Furthermore, it is possible to extend study period extent, which will enable better quantification of temporal stationarity, through improved collar technology or by setting the location fix rate to a lower frequency. In our study we used a 30 min frequency. Setting the frequency to 1 h would nearly double the temporal extent of the study. However, as Zeller et al. (2016) has shown, movement models, such as path selection functions, are highly sensitive to the temporal grain (fix rate) of movement data and care must be taken in evaluating the tradeoff between temporal grain (fix rate) and extent (collar life).
The raw data supporting the conclusions of this article will be made available by the authors, without undue reservation.
The animal study was reviewed and approved by the University of KwaZulu-Natal Animal Ethics Committee (Ref: 009/10/Animal) and the South African National Parks (Ref: SLOR660).
ŻK, SC, and RS conceived and designed the project and wrote the manuscript. ŻK performed the data analysis. All authors contributed to the article and approved the submitted version.
This study was financially supported by AESOP (An European and South African Partnership on Heritage and Past) Erasmus Mundus Programme.
The authors declare that the research was conducted in the absence of any commercial or financial relationships that could be construed as a potential conflict of interest.
We thank Markus Hofmeyer and the SANParks veterinary team for the collaring of elephants and Amarula Trust for funding for the collars. We also thank Audrey Delsink and Abi Vanak for assistance with collar management and data curation.
The Supplementary Material for this article can be found online at: https://www.frontiersin.org/articles/10.3389/fevo.2021.553263/full#supplementary-material
Almasieh, K., Kaboli, M., and Beier, P. (2016). Identifying habitat cores and corridors for the Iranian black bear in Iran. Ursus 27, 18–30. doi: 10.2192/URSUS-D-15-00032.1
Balkenhol, N., Cushman, S., Storfer, A., and Waits, L. (2015). Landscape Genetics: Concepts, Methods, Applications. Hoboken, NJ: John Wiley & Sons.
Barnes, M. E. (2001). Effects of large herbivores and fire on the regeneration of Acacia erioloba woodlands in Chobe National Park, Botswana. Afr. J. Ecol. 39, 340–350. doi: 10.1046/j.1365-2028.2001.00325.x
Bartoń, K. (2018). Multi-Model Inference (MuMIn). Comprehensive R Archive Network (CRAN), Version 1.40.4.
Benhamou, S. (2014). Of scales and stationarity in animal movements. Ecol. Lett. 17, 261–272. doi: 10.1111/ele.12225
Birkett, P. J., Vanak, A. T., Muggeo, V. M. R., Ferreira, S. M., and Slotow, R. (2012). Animal perception of seasonal thresholds: changes in elephant movement in relation to rainfall patterns. PLoS One 7:e038363. doi: 10.1371/journal.pone.0038363
Borcard, D., and Legendre, P. (2012). Is the mantel correlogram powerful enough to be useful in ecological analysis? A simulation study. Ecology 93, 1473–1481. doi: 10.1890/11-1737.1
Brits, J., Van Rooyen, M. W., and Van Rooyen, N. (2002). Ecological impact of large herbivores on the woody vegetation at selected watering points on the eastern basaltic soils in the Kruger National Park. Afr. J. Ecol. 40, 53–60. doi: 10.1046/j.0141-6707.2001.00344.x
Buderman, F. E., Hooten, M. B., Alldredge, M. W., Hanks, E. M., and Ivan, J. S. (2018). Time-varying predatory behavior is primary predictor of fine-scale movement of wildland-urban cougars. Mov. Ecol. 6, 1–16. doi: 10.1186/s40462-018-0140-6
Burgman, M. A., and Williams, M. R. (1995). Analysis of the spatial pattern of arthropod fauna of jarrah (Eucalyptus marginata) foliage using a Mantel correlogram. Aust. J. Ecol. 20, 455–457. doi: 10.1111/j.1442-9993.1995.tb00561.x
Burn, R. W., Underwood, F. M., and Blanc, J. (2011). Global trends and factors associated with the illegal killing of elephants: a hierarchical bayesian analysis of carcass encounter data. PLoS One 6:e024165. doi: 10.1371/journal.pone.0024165
Burnham, K. P., and Anderson, D. R. (2002). Model Selection and Multimodel Inference. New York, NY: Springer.
Cagnacci, F., Boitani, L., Powell, R. A., and Boyce, M. S. (2010). Animal ecology meets GPS-based radiotelemetry: a perfect storm of opportunities and challenges. Philos. Trans. R. Soc. B Biol. Sci. 365, 2157–2162. doi: 10.1098/rstb.2010.0107
Carvalho, F., Carvalho, R., Mira, A., and Beja, P. (2016). Assessing landscape functional connectivity in a forest carnivore using path selection functions. Landsc. Ecol. 31, 1021–1036. doi: 10.1007/s10980-015-0326-x
Compton, B. W., McGarigal, K., Cushman, S. A., and Gamble, L. R. (2007). A resistant-kernel model of connectivity for amphibians that breed in vernal pools. Conserv. Biol. 21, 788–799. doi: 10.1111/j.1523-1739.2007.00674.x
Cushman, S. A. (2006). Effects of habitat loss and fragmentation on amphibians: a review and prospectus. Biol. Conserv. 128, 231–240. doi: 10.1016/j.biocon.2005.09.031
Cushman, S. A. (2010). “Animal movement data: GPS telemetry, autocorrelation and the need for path-level analysis,” in Spatial Complexity, Informatics, and Wildlife Conservation, eds S. A. Cushman and F. Huettmann (Cham: Springer), 1–458. doi: 10.1007/978-4-431-87771-4
Cushman, S. A., Chase, M., and Griffin, C. (2005). Elephants in Space and Time in space and time. OIKOS 109, 331–341.
Cushman, S. A., Chase, M., and Griffin, C. (2010). “Mapping landscape resistance to identify corridors and barriers for elephant movement in southern Africa,” in Spatial Complexity, Informatics, and Wildlife Conservation, eds S. A. Cushman and F. Huettmann (Tokyo: Springer), 349–367.
Cushman, S. A., and Lewis, J. S. (2010). Movement behavior explains genetic differentiation in American black bears. Landsc. Ecol. 25, 1613–1625. doi: 10.1007/s10980-010-9534-6
Cushman, S. A., Lewis, J. S., and Landguth, E. L. (2014). Why did the bear cross the road? Comparing the performance of multiple resistance surfaces and connectivity modeling methods. Diversity 6, 844–854. doi: 10.3390/d6040844
Cushman, S. A., McRae, B., Adriaensen, F., Beier, P., Shirley, M., and Zeller, K. (2013). “Chapter 21: Biological corridors and connectivity,” in Key Topics in Conservation Biology 2, eds D. W. Macdonald and K. J. Willis (Hoboken, NJ: Wiley-Blackwell), 384–404.
Cushman, S. A., Raphael, M. G., Ruggiero, L. F., Shirk, A. S., Wasserman, T. N., and O’Doherty, E. C. (2011). Limiting factors and landscape connectivity: the American marten in the Rocky Mountains. Landsc. Ecol. 26, 1137–1149. doi: 10.1007/s10980-011-9645-8
De Beer, Y., Kilian, W., Versfeld, W., and Van Aarde, R. J. (2006). Elephants and low rainfall alter woody vegetation in Etosha National Park, Namibia. J. Arid Environ. 64, 412–421. doi: 10.1016/j.jaridenv.2005.06.015
De Beer, Y., and van Aarde, R. J. (2008). Do landscape heterogeneity and water distribution explain aspects of elephant home range in southern Africa’s arid savannas? J. Arid Environ. 72, 2017–2025. doi: 10.1016/j.jaridenv.2008.07.002
De Boer, W. F., van Langevelde, F., Prins, H. H. T., De Ruiter, P. C., Blanc, J., Vis, M. J. P., et al. (2013). Understanding spatial differences in African elephant densities and occurrence, A continent-wide analysis. Biol. Conserv. 159, 468–476. doi: 10.1016/j.biocon.2012.10.015
De Knegt, H. J., Van Langevelde, F., Coughenour, M. B., Skidmore, A. K., De Boer, W. F., Heitkönig, I. M. A., et al. (2010). Spatial autocorrelation and the scaling of species-environment relationships. Ecology 91, 2455–2465. doi: 10.1890/09-1359.1
De Knegt, H. J., Van Langevelde, F., Skidmore, A. K., Delsink, A., Slotow, R., Henley, S., et al. (2011). The spatial scaling of habitat selection by African elephants. J. Anim. Ecol. 80, 270–281. doi: 10.1111/j.1365-2656.2010.01764.x
Delsink, A., Vanak, A. T., Ferreira, S., and Slotow, R. (2013). Biologically relevant scales in large mammal management policies. Biol. Conserv. 167, 116–126. doi: 10.1016/j.biocon.2013.07.035
Duchesne, T., Fortin, D., and Courbin, N. (2010). Mixed conditional logistic regression for habitat selection studies. J. Anim. Ecol. 79, 548–555. doi: 10.1111/j.1365-2656.2010.01670.x
Elliot, N. B., Cushman, S. A., Loveridge, A. J., Mtare, G., and Macdonald, D. W. (2014a). Movements vary according to dispersal stage, group size, and rainfall: the case of the African lion. Ecology 95, 2860–2869. doi: 10.1890/13-1793.1
Elliot, N. B., Cushman, S. A., Macdonald, D. W., and Loveridge, A. J. (2014b). The devil is in the dispersers: predictions of landscape connectivity change with demography. J. Appl. Ecol. 51, 1169–1178. doi: 10.1111/1365-2664.12282
ENPAT (2002). Environmental Potential Atlas for South Africa (GIS Data). Pretoria: Department of Environmental Affairs and Tourism in Conjunction with the University of Pretoria.
Ferreira, S. M., Greaver, C., and Simms, C. (2017). Elephant population growth in Kruger National Park, South Africa, under a landscape management approach. Koedoe 59, 1–6. doi: 10.4102/koedoe.v59i1.1427
Fitzgerald, K. H. (2015). “The silent killer: habitat loss and the role of african protected areas to conserve biodiversity,” in Protecting the Wild: Parks and Wilderness, the Foundation for Conservation, eds G. Wuerthner, E. Crist, and T. Butler (Berlin: Springer), 170–188.
Fortin, M., and Dale, M. (2005). Spatial Analysis: a Guide for Ecologists. Cambridge: Cambridge University Press.
Goodwin, B. J., and Fahrig, L. (1998). “Spatial scaling and animal population dynamics,” in Ecological Scale: Theory and Applications, eds D. L. Peterson and V. T. Parker (New York, NY: Columbia University Press), 193–206.
Goslee, S. C., and Urban, D. L. (2007). The ecodist package for dissimilarity-based analysis of ecological data. J. Stat. Softw. 22, 1–19. doi: 10.18637/jss.v022.i07
Hansen, M. C. (2013). High-resolution global maps of 21st-century forest cover change. Proc. Natl. Acad. Sci. U.S.A. 850, 123–134. doi: 10.1126/science.1244693
Hearn, A. J., Cushman, S. A., Goossens, B., Macdonald, E., Ross, J., Hunter, L. T. B., et al. (2018a). Evaluating scenarios of landscape change for Sunda clouded leopard connectivity in a human dominated landscape. Biol. Conserv. 222, 232–240. doi: 10.1016/j.biocon.2018.04.016
Hearn, A. J., Cushman, S. A., Ross, J., Goossens, B., Hunter, L. T. B., and Macdonald, D. W. (2018b). Spatio-temporal ecology of sympatric felids on Borneo. Evidence for resource partitioning? PLoS One 13:e0200828. doi: 10.1371/journal.pone.0200828
Hilbers, J. P., Van Langevelde, F., Prins, H. H. T., Grant, C. C., Peel, M. J. S., Coughenour, M. B., et al. (2015). Modeling elephant-mediated cascading effects of water point closure. Ecol. Appl. 25, 402–415. doi: 10.1890/14-0322.1.sm
Hooten, M. B., Johnson, D. S., McClintock, B. T., and Morales, J. M. (2017). Animal Movement: Statistical Models for Telemetry Data. Boca Raton, FL: CRC press.
Johnson, A. R., Wiens, J. A., Milne, B. T., and Crist, T. O. (1992). Animal movements and population-dynamics in heterogeneous landscapes. Landsc. Ecol. 7, 63–75. doi: 10.1007/bf02573958
Johnson, D. H. (1980). The comparison of usage and availability measurements for evaluating resource preference. Ecology 61, 65–71. doi: 10.2307/1937156
Kaszta, Ż, Cushman, S. A., Hearn, A. J., Burnham, D., Macdonald, E. A., Goossens, B., et al. (2019). Integrating Sunda clouded leopard (Neofelis diardi) conservation into development and restoration planning in Sabah (Borneo). Biol. Conserv. 235, 63–76. doi: 10.1016/j.biocon.2019.04.001
Kaszta, Ż, Cushman, S. A., Htun, S., Naing, H., Burnham, D., and Macdonald, D. W. (2020a). Simulating the impact of Belt and road initiative and other major developments in Myanmar on an ambassador felid, the clouded leopard, Neofelis nebulosa. Landsc. Ecol. 35, 727–746.
Kaszta, Ż, Cushman, S. A., and Macdonald, D. W. (2020b). Prioritizing habitat core areas and corridors for a large carnivore across its range. Anim. Conserv. 23, 607–616. doi: 10.1111/acv.12575
Kaszta, Ż, Cushman, S. A., Sillero-Zubiri, C., Wolff, E., and Marino, J. (2018). Where buffalo and cattle meet: modelling interspecific contact risk using cumulative resistant kernels. Ecography 41, 1–11. doi: 10.1111/ecog.03039
Kaszta, Ż, Marino, J., Ramoelo, A., and Wolff, E. (2016). Bulk feeder or selective grazer: African buffalo space use patterns based on fine-scale remotely sensed data on forage quality and quantity. Ecol. Model. 323, 115–122. doi: 10.1016/j.ecolmodel.2015.12.006
Kerley, G. I. H., Landman, M., Kruger, L., Owen-Smith, N., Balfour, D., De Boer, W. F., et al. (2008). “Effects of elephants on ecosystems and biodiversity,” in Elephant Management; a Scientific Assessment for South Africa, eds R. J. Scholes and K. G. Mennell (Cambridge: Wits University Press), 146–205.
Landguth, E. L., Cushman, S. A., Schwartz, M. K., McKelvey, K. S., Murphy, M., and Luikart, G. (2010). Quantifying the lag time to detect barriers in landscape genetics. Mol. Ecol. 19, 4179–4191. doi: 10.1111/j.1365-294X.2010.04808.x
Landguth, E. L., Hand, B. K., Glassy, J., Cushman, S. A., and Sawaya, M. A. (2012). UNICOR: a species connectivity and corridor network simulator. Ecography 35, 9–14. doi: 10.1111/j.1600-0587.2011.07149.x
Levin, S. A. (1992). The problem of pattern and scale in ecology: the Robert H. MacArthur award lecture. Ecology 73, 1943–1967. doi: 10.2307/1941447
Lewis, J. S., Rachlow, J. L., Horne, J. S., Garton, E. O., Wakkinen, W. L., Hayden, J., et al. (2011). Identifying habitat characteristics to predict highway crossing areas for black bears within a human-modified landscape. Landsc. Urban Plan. 101, 99–107. doi: 10.1016/j.landurbplan.2011.01.008
Loarie, S. R., van Aarde, R. J., and Pimm, S. L. (2009). Elephant seasonal vegetation preferences across dry and wet savannas. Biol. Conserv. 142, 3099–3107. doi: 10.1016/j.biocon.2009.08.021
Macdonald, E. A., Hinks, A., Weiss, D. J., Dickman, A., Burnham, D., Sandom, C. J., et al. (2017). Identifying ambassador species for conservation marketing. Glob. Ecol. Conserv. 12, 204–214. doi: 10.1016/j.gecco.2017.11.006
MacFadyen, S., Hui, C., Verburg, P. H., and Van Teeffelen, A. J. A. (2019). Spatiotemporal distribution dynamics of elephants in response to density, rainfall, rivers and fire in Kruger National Park, South Africa. Divers. Distrib. 25, 880–894. doi: 10.1111/ddi.12907
Mateo Sanchez, M. C., Cushman, S. A., and Saura, S. (2014). Scale dependence in habitat selection: the case of the endangered brown bear (Ursus arctos) in the Cantabrian Range (NW Spain). Int. J. Geogr. Inf. Sci. 28, 1531–1546.
Mateo-Sánchez, M. C., Balkenhol, N., Cushman, S., Pérez, T., Domínguez, A., and Saura, S. (2015). A comparative framework to infer landscape effects on population genetic structure: are habitat suitability models effective in explaining gene flow? Landsc. Ecol. 30, 1405–1420. doi: 10.1007/s10980-015-0194-4
McGarigal, K., and Cushman, S. A. (2002). Comparative evaluation of experimental approaches to the study of habitat fragmentation effects. Ecol. Appl. 12, 335–345.
McGarigal, K., Wan, H. Y., Zeller, K. A., Timm, B. C., and Cushman, S. A. (2016a). Multi-scale habitat selection modeling: a review and outlook. Landsc. Ecol. 31, 1161–1175. doi: 10.1007/s10980-016-0374-x
McGarigal, K., Zeller, K. A., and Cushman, S. A. (2016b). Multi-scale habitat selection modeling: introduction to the special issue. Landsc. Ecol. 31, 1157–1160. doi: 10.1007/s10980-016-0388-4
McRae, B. H., Hall, S. A., Beier, P., and Theobald, D. M. (2012). Where to Restore ecological connectivity? detecting barriers and quantifying restoration benefits. PLoS One 7:e052604. doi: 10.1371/journal.pone.0052604
Merkle, J. A., Cross, P. C., Scurlock, B. M., Cole, E. K., Courtemanch, A. B., Dewey, S. R., et al. (2018). Linking spring phenology with mechanistic models of host movement to predict disease transmission risk. J. Appl. Ecol. 55, 810–819. doi: 10.1111/1365-2664.13022
Mucina, L., and Rutherford, M. C. (2006). The Vegetation of South Africa, Lesotho and Swaziland. South African National Biodiversity Institute.
Mwakiwa, E., de Boer, W. F., Hearne, J. W., Slotow, R., van Langevelde, F., Peel, M., et al. (2013). Optimization of wildlife management in a large game reserve through waterpoints manipulation: a bio-economic analysis. J. Environ. Manag. 114, 352–361. doi: 10.1016/j.jenvman.2012.10.029
Ndlovu, M., Pérez-Rodríguez, A., Devereux, E., Thomas, M., Colina, A., and Molaba, L. (2018). Water for African elephants (Loxodonta africana): faecal microbial loads affect use of artificial waterholes. Biol. Lett. 14:20180360. doi: 10.1098/rsbl.2018.0360
Nettleton, D. (2014). Commercial Data Mining: Processing, Analysis and Modeling for Predictive Analytics Projects. Amsterdam: Elsevier.
Osipova, L., Okello, M. M., Njumbi, S. J., Ngene, S., Western, D., Hayward, M. W., et al. (2019). Using step-selection functions to model landscape connectivity for African elephants: accounting for variability across individuals and seasons. Anim. Conserv. 22, 35–48. doi: 10.1111/acv.12432
Otis, D. L., and White, G. C. (1999). Autocorrelation of location estimates and the analysis of radiotracking data. J. Wildl. Manag. 63, 1039–1044.
Patterson, T. A., Parton, A., Langrock, R., Blackwell, P. G., Thomas, L., and King, R. (2017). Statistical modelling of individual animal movement: an overview of key methods and a discussion of practical challenges. Adv. Stat. Anal. 101, 399–438. doi: 10.1007/s10182-017-0302-7
Robson, A. S., and van Aarde, R. J. (2018). Changes in elephant conservation management promote density-dependent habitat selection in the Kruger National Park. Anim. Conserv. 21, 302–312. doi: 10.1111/acv.12393
Roever, C. L., van Aarde, R. J., and Leggett, K. (2013). Functional connectivity within conservation networks: delineating corridors for African elephants. Biol. Conserv. 157, 128–135. doi: 10.1016/j.biocon.2012.06.025
Rooney, S. M., Wolfe, A., and Hayden, T. J. (1998). Autocorrelated data in telemetry studies: time to independence and the problem of behavioural effects. Mamm. Rev. 28, 89–98.
Rudnick, D., Ryan, S. J., Beier, P., Cushman, S. A., Dieffenbach, F., and Trombulak, S. C. (2012). The role of landscape connectivity in planning and implementing conservation and restoration priorities. issues in ecology recommended citation. Issues Ecol. 16, 1–20.
Segurado, P., Araújo, M. B., and Kunin, W. E. (2006). Consequences of spatial autocorrelation for niche-based models. J. Appl. Ecol. 43, 433–444. doi: 10.1111/j.1365-2664.2006.01162.x
Seloana, M. Q., Kruger, J. W., Potgieter, M. J., and Jordaan, J. J. (2017). Elephant damage to Sclerocarya birrea on different landscapes. Int. J. Biodivers. Conserv. 9, 97–106. doi: 10.5897/ijbc2015.0912
Shirk, A. J., Raphael, M. G., and Cushman, S. A. (2014). Spatiotemporal variation in resource selection: insights from the American marten (Martes americana). Ecol. Appl. 24, 1434–1444. doi: 10.1890/13-1510.1
Smit, I. P., Peel, M. J., Ferreira, S. M., Greaver, C., and Pienaar, D. J. (2020). Megaherbivore response to droughts under different management regimes: lessons from a large African savanna. Afr. J. Range Forage Sci. 37, 65–80. doi: 10.2989/10220119.2019.1700161
Smit, I. P. J., Grant, C. C., and Whyte, I. J. (2007). Elephants and water provision: what are the management links? Divers. Distrib. 13, 666–669. doi: 10.1111/j.1472-4642.2007.00403.x
South African National Parks [SANParks] (2020). Available online at: www.sanparks.org (accessed February, 2020).
Squires, J. R., DeCesare, N. J., Olson, L. E., Kolbe, J. A., Hebblewhite, M., and Parks, S. A. (2013). Combining resource selection and movement behavior to predict corridors for Canada lynx at their southern range periphery. Biol. Conserv. 157, 187–195. doi: 10.1016/j.biocon.2012.07.018
Tambosi, L. R., Martensen, A. C., Ribeiro, M. C., and Metzger, J. P. (2014). A framework to optimize biodiversity restoration efforts based on habitat amount and landscape connectivity. Restor. Ecol. 22, 169–177. doi: 10.1111/rec.12049
Thaker, M., Gupte, P. R., Prins, H. H. T., Slotow, R., and Vanak, A. T. (2019). Fine-scale tracking of ambient temperature and movement reveals shuttling behavior of elephants to water. Front. Ecol. Evol. 7:4. doi: 10.3389/fevo.2019.00004
Valcu, M., and Kempenaers, B. (2010). Spatial autocorrelation: an overlooked concept in behavioral ecology. Behav. Ecol. 21, 902–905. doi: 10.1093/beheco/arq107
Wasserman, T. N., Cushman, S. A., Wallin, D. O., and Hayden, J. (2012). Multi Scale Habitat Relationships of Martes Americana in Northern Idaho, U.S.A. USDA Forest Service RMRS-RP. Fort Collins, CO: U.S. Department of Agriculture.
Wato, Y. A., Prins, H. H. T., Heitkönig, I. M. A., Wahungu, G. M., Ngene, S. M., Njumbi, S., et al. (2018). Movement patterns of African elephants (Loxodonta africana) in a Semi-arid Savanna suggest that they have information on the location of dispersed water sources. Front. Ecol. Evol. 6:167. doi: 10.3389/fevo.2018.00167
Wiens, J. (1976). Population responses to patchy environments. Annu. Rev. Ecol. Syst. 7, 81–120. doi: 10.1146/annurev.es.07.110176.000501
Wittemyer, G., Northrup, J. M., Blanc, J., Douglas-Hamilton, I., Omondi, P., and Burnham, K. P. (2014). Illegal killing for ivory drives global decline in African elephants. Proc. Natl. Acad. Sci. U.S.A. 111, 13117–13121. doi: 10.1073/pnas.1403984111
Woolley, L.-A., Millspaugh, J. J., Woods, R. J., van Rensburg, S. J., Page, B. R., and Slotow, R. (2009). Intraspecific strategic responses of african elephants to temporal variation in forage quality. J. Wildl. Manag. 73, 827–835. doi: 10.2193/2008-412
Young, K. D., Ferreira, S. M., and Van Aarde, R. J. (2009). Elephant spatial use in wet and dry savannas of southern Africa. J. Zool. 278, 189–205. doi: 10.1111/j.1469-7998.2009.00568.x
Zeller, K. A., Jennings, M. K., Vickers, T. W., Ernest, H. B., Cushman, S. A., and Boyce, W. M. (2018a). Are all data types and connectivity models created equal? Validating common connectivity approaches with dispersal data. Divers. Distrib. 24, 868–879. doi: 10.1111/ddi.12742
Zeller, K. A., Wattles, D. W., and DeStefano, S. (2018b). Incorporating road crossing data into vehicle collision risk models for moose (Alces americanus) in Massachusetts, USA. Environ. Manag. 62, 518–528. doi: 10.1007/s00267-018-1058-x
Zeller, K. A., McGarigal, K., Beier, P., Cushman, S. A., Vickers, T. W., and Boyce, W. M. (2014). Sensitivity of landscape resistance estimates based on point selection functions to scale and behavioral state: pumas as a case study. Landsc. Ecol. 29, 541–557. doi: 10.1007/s10980-014-9991-4
Zeller, K. A., McGarigal, K., Cushman, S. A., Beier, P., Vickers, T. W., and Boyce, W. M. (2016). Using step and path selection functions for estimating resistance to movement: pumas as a case study. Landsc. Ecol. 31, 1319–1335. doi: 10.1007/s10980-015-0301-6
Zeller, K. A., Wattles, D. W., Conlee, L., and Destefano, S. (2019). Black bears alter movements in response to anthropogenic features with time of day and season. Mov. Ecol. 7, 1–14. doi: 10.1186/s40462-019-0166-4
Keywords: non-stationarity, movement models, path-selection function, connectivity, resistance surface modeling, limiting factors, African elephant
Citation: Kaszta Ż, Cushman SA and Slotow R (2021) Temporal Non-stationarity of Path-Selection Movement Models and Connectivity: An Example of African Elephants in Kruger National Park. Front. Ecol. Evol. 9:553263. doi: 10.3389/fevo.2021.553263
Received: 18 April 2020; Accepted: 18 March 2021;
Published: 27 April 2021.
Edited by:
Matt W. Hayward, University of Newcastle, AustraliaReviewed by:
Ninon Meyer, The University of Newcastle, AustraliaCopyright © 2021 Kaszta, Cushman and Slotow. This is an open-access article distributed under the terms of the Creative Commons Attribution License (CC BY). The use, distribution or reproduction in other forums is permitted, provided the original author(s) and the copyright owner(s) are credited and that the original publication in this journal is cited, in accordance with accepted academic practice. No use, distribution or reproduction is permitted which does not comply with these terms.
*Correspondence: Żaneta Kaszta, emFuZXRhLmthc3p0YUB6b28ub3guYWMudWs=
Disclaimer: All claims expressed in this article are solely those of the authors and do not necessarily represent those of their affiliated organizations, or those of the publisher, the editors and the reviewers. Any product that may be evaluated in this article or claim that may be made by its manufacturer is not guaranteed or endorsed by the publisher.
Research integrity at Frontiers
Learn more about the work of our research integrity team to safeguard the quality of each article we publish.