 Vitalii V. Akimenko
- Faculty of Computer Science and Cybernetics, Taras Shevchenko National University of Kyiv, Kyiv, Ukraine
This article studies nonlinear n-resource-consumer autonomous system with age-structured consumer population. The model of consumer population dynamics is described by a delayed transport equation, and the dynamics of resource patches are described by ODE with saturated intake rate. The delay models the digestion period of generalist consumer and is included in the calorie intake rate, which impacts the consumer’s fertility and mortality. Saturated intake rate models the inhibition effect from the behavioral change of the resource patches when they react to the consumer population growing or from the crowding effect of the consumer. The conditions for the existence of trivial, semi-trivial, and non-trivial equilibria and their local asymptotic stability were obtained. The local asymptotic stability/instability of non-trivial equilibrium of a system with depleted patches is defined by new derived criteria, which relate the demographic characteristics of consumers with their search rate, growth rate of resource in patches, and behavioral change of the food resource when consumer population grows. The digestion period of a generalist consumer does not cause local asymptotical instabilities of consumer population at the semi-trivial and nontrivial equilibria. These theoretical results may be used in the study of metapopulation dynamics, desert locust populations dynamics, prey-predator interactions in fisheries, etc. The paper uses numerical experiments to confirm and illustrate all dynamical regimes of the n-resource-consumer population.
Introduction
Competition between several food patches and common consumers has been thoroughly studied in the ecological literature (Holt, 1977, 1984; Holt and Kotler, 1987; Martinez, 1991; Holt and Lawton, 1993; Holt et al., 1994; Wootton, 1997; Abrams et al., 1998; Křivan, 2003, 2014; Williams and Martinez, 2004; Křivan and Eisner, 2006; Vrkoc and Krivan, 2015; Becker and Hall, 2016). Here, increasing biomass of one food patch causes increases in generalist consumer population, thus a negative impact on other resource patches and vice versa. Thus, apparent competition is similar to exploitative competition (Levin, 1970) and can reduce the number of coexisting resource patches. In traditional unstructured Lotka-Volterra ODE models of population dynamics, many details of life history are neglected (de Ross and Persson, 2013). The more reasonable approach in population dynamics modeling is based on physiologically structured models (Von Foerster, 1959; Gurtin and MacCamy, 1979; Cushing and Saleem, 1982; Elderkin, 1985; Webb, 1985, 2008; Metz and Diekmann, 1986; Cushing, 1998; Bekkal-Brikci et al., 2007; Hritonenko and Yatsenko, 2007; de Ross and Persson, 2013; Mohr et al., 2014; Akimenko and Křivan, 2018). In this article, the apparent competition model of unstructured resource patches with age-structured consumer population is studied. This approach allows us to relate foraging to the life history and demographical characteristics of consumer population (fertility and mortality).
The dynamic interaction between resources and consumers in prey-predator models is described by the consumer’s functional response. Beddington (1975) and DeAngelis et al. (1975) introduced and analyzed the functional response with saturation, which is often used now in applied models providing the more realistic description of prey-predator interaction (Capasso and Serio, 1978; Qiu et al., 2004; Wang and Zhao, 2004; Han et al., 2017). The functional response of such “saturated incidence rate” was first introduced into SIR (susceptible-infected-recovered) epidemic models in a study of the cholera epidemic spread in Bari (Capasso and Serio, 1978) and was used later in various epidemic models (Wang and Zhao, 2004; Han et al., 2017) and ecological studies (Essington and Hansson, 2004). The feature of saturated incidence rate is that it tends to saturation when the population of predators (or infectives in epidemic models, parasites in parasite-host model, consumers in resource-consumer models, etc.) gets large and, as a consequence, it prevents the unboundedness of the contact rate between prey and predator. Since this functional response considers the behavioral change of prey (or hosts, susceptibles, resources in patches, etc.) as a reaction on the predator population growing or “crowding effect” of predator, the resource-consumer models with intake rates of such form are more reasonable in comparison with traditional Lotka-Volterra models. The resource consumption in biological and ecological models is often characterized also by the calorie intake rate, which depends linearly from the amount of food resource taken by one consumer per unit of time from all patches. This function depends on the handling time, i.e., the time a consumer needs to handle and digest a unit of resource. This time period is included in a model as a time delay parameter. Thus, the resulting model studied in this article consists of several unstructured resource patches and a single age-structured consumer population that forages in these patches including the saturated intake rate, calorie intake rate, and the digestion period of a generalist consumer as a time delay parameter. The model is formulated in Section “Model”.
The conditions of existence of the trivial, semi-trivial, and non-trivial equilibria of autonomous systems are studied in Section “Existence of Stationary Equilibria of the Autonomous System (1)–(5).” The local asymptotic stability of all equilibria is considered in Section “Local Asymptotic Stability of Equilibria of the Autonomous System (1)–(5).” Stability analysis is based on the traditional perturbation theory and linearization of autonomous system and includes the study of impact of the time delay parameter on the asymptotic stability of equilibria (Gourley and Kuang, 2004; Shi, 2013; Mohr et al., 2014; Akimenko, 2017a; Akimenko and Křivan, 2018; Martsenyuk et al., 2018; Liu et al., 2019).
Research shows that the stability indicator of non-linear autonomous age-structured models, partial derivative of basic reproduction number of consumer population by their density used earlier in Cushing (1998); Akimenko and Křivan (2018), can be applied only for non-trivial equilibria of system with non-depleted patches. Local asymptotic stability/instability of non-trivial equilibrium of system with depleted patches is defined in the paper by new derived criteria, which relate the demographic characteristics of consumers with their search rate, growth rate of resource in patches, and behavioral change of the food resource when consumer population grows. We show also that the digestion period of a generalist consumer does not cause local asymptotical instabilities of consumer population at the semi-trivial and nontrivial equilibria. These theoretical results may be used in study of metapopulation dynamics (Nakazawa, 2015; Becker and Hall, 2016), desert locust populations dynamics (Guttal et al., 2012; Akimenko and Piou, 2018), prey-predator interactions in fisheries (Essington and Hansson, 2004; Smith and Smith, 2020), and many others.
The numerical algorithms obtained in earlier works (Akimenko, 2017b,c, d) are used in the Section “Numerical Experiments” for numerical analysis of dynamical regimes of autonomous system that were considered in the previous sections. In the first and second groups of experiments the local asymptotic stability of the trivial and semi-trivial (i.e., resources can only exist at positive densities) equilibria for three resource patches with one generalist consumer is studied. Depending on the reproduction number of consumers, trajectories of system are unstable, oscillate in the vicinities of the trivial and semi-trivial equilibria, or converge asymptotically to the semi-trivial equilibrium. The further increasing of consumer’s basic reproduction number or time delay parameter leads to the consumer population outbreaks in the form of pulse sequence, which are classified in the quantitative population ecology as the populations with cyclical eruption dynamics (Abbott and Dwyer, 2007; Akimenko and Anguelov, 2017). The results of simulations illustrated the properties of the outbreak solutions are presented in Section “The Trivial and Semi-Trivial Equilibria.”
The next group of experiments focuses on the study of asymptotic behavior of solutions in the vicinity of the non-trivial equilibrium with one non-depleted and two depleted resource patches (1st–3rd experiments), three non-depleted resource patches (4th experiment), and one non-trivial consumer population. The results of simulations confirm and illustrate the statements of theorems and exhibit the different dynamical regimes of system with unstable and asymptotically stable trajectories for the selected parameters of the model. Several concluding remarks are given in Section “Conclusion and Discussion.”
Model
In this article, we study an apparent competition food web module that consists of n resource patches and consumers that move freely between these patches. Resource density of i-th patch is denoted as yi(t), i = 1,…,n. The resource dynamics in each patch is described by the logistic model with constant growth rate ri > 0, and environmental carrying capacity Ki > 0. The age-specific density of consumer population at age a and time t is denoted by w(a,t), the quantity of consumers in population is (where ad > 0 is the maximum consumer’s life-span), and a weighted quantity of consumers at the fixed time t is (where γ(a) is an age-specific consumer’s preferences in food resource). The interaction strength between resources and consumers is a product of the saturated intake rate , where evolves to a saturation level when gets large, i.e., . Functions have a form of the Beddington–DeAngelis type of functional responses (Beddington, 1975; DeAngelis et al., 1975; Qiu et al., 2004) under assumption that handling time of predator is effectively zero [Eq. (12) in Beddington, 1975]. Constant βi > 0 is a search rate of resource i = 1,…,n. Saturation coefficient αi≥0 is proportional to the rate of encounter between consumers, related both to their speed of movement and the range at which they sense each other and the time wasted by consumer per one encounter (Beddington, 1975). On the other hand, this coefficient can consider also the behavioral change of the food resource when consumer population grows [like in epidemic models for pair susceptibles-infectives (Capasso and Serio, 1978; Wang and Zhao, 2004; Han et al., 2017)]. The greater the coefficient αi, the greater the activity of the food resource in i-th patch and vice versa. When αi = 0 the saturated intake rate is a bilinear form of Lotka-Voltera functional response, which considers the inactive food resource without behavioral reaction on the consumer population changes. For our convenience we introduce the food resource classification: the higher activity resource with , the lower activity resource with and non-active resource with αi = 0. These assumptions lead to the following resource population dynamics.
Consumer population dynamics w(a,t) are governed by the delayed McKendrick-Von Foerster’s age-structured model (Von Foerster, 1959; Gurtin and Maccamy, 1974; Gurtin and MacCamy, 1979):
where Q = {(a,t)|a ∈ (0,ad],t ∈ (0,T]}, , t ∈ [0,T]. Eqs (1, 2) are completed by the following initial and boundary conditions:
where ar > 0 is an age of maturation, am > 0 is a maximum age of reproduction, and φ(a) is an initial density of consumers. Functions s(a,C(t−τ)) in Eq. (2) and θ(a,C(t−τ)) in Eq. (5) are age and calorie intake rate dependent consumer’s death and fertility rates, respectively. Consumption of food resources by one consumer per unit of time is measured by calorie intake rate C(t). This function is used in Eqs (2, 5) with the time delay parameter τ > 0, which is a handling time, i.e., the time a consumer needs to handle and digest a unit of resource. We assume that the calorie intake rate is a linear function of the amount of food resource taken by one consumer per unit of time from all patches and is defined through the resource intake rate:
where Ci≥0 is a calorie intake rate for i-th resource patch, ei > 0 is an efficiency with which the consumed resource i is transformed to energy. We impose the following natural restrictions on the consumer’s death and fertility rates, preferences in food resource:
where C1(X) is a space of continuously differentiable functions defined in domain X, L2([0,ad]) is a space of square-integrable functions on an interval [0,ad], R≥0 is a set of non-negative real numbers (Kolmogorov and Fomin, 1999).
Equations (7, 8) mean that decreasing of calorie intake rate corresponds to the critical foraging or starvation, and increasing it corresponds to the sufficient foraging and satiation with increasing resource intake rate. Increasing of calorie intake rate provides also maximum comfortable conditions for reproduction of consumers that corresponds to increasing of birth rate, and decreasing of calorie intake rate provides the most poor and unfavorable conditions for reproduction of consumers, decreasing birth rate.
The basic reproduction number of age-structured model of consumer population dynamics is a calorie intake rate depending function:
Derivation of Eq. (9) is traditional and is given in works (Hoppensteadt, 1975; Metz and Diekmann, 1986; Webb, 2008; de Ross and Persson, 2013; Akimenko and Křivan, 2018). The novelty of function (9) lies in using the calorie intake rate depending birth and death rates of consumer population in integral. This formal substitution of calorie intake rate emphasizes the foraging-depending demographical processes of consumer population.
Existence of Stationary Equilibria of the Autonomous System (1)–(5)
We consider the equilibria , w∗(a) of the autonomous system (1)–(5). Trivial equilibrium y∗ = (0,…,0), w∗(a)≡0 means that all food patches are depleted and consumer population is empty. Semi-trivial equilibrium y∗ = (K1,…,Kn), K = (K1,…,Kn), w∗(a)≡0 corresponds to the abundant food patches (with saturated food density) and empty consumer population. It is easy to verify that trivial and semi-trivial equilibria of autonomous system (1)–(5) with coefficients satisfied Eqs (7, 8) always exist.
Non-trivial equilibrium means that there exist a nonempty set of non-depleted food patches with positive and bounded equilibrium densities , i ∈ I+, while the remaining patches are depleted , i ∈ I0, and the consumer population is not empty with nonnegative equilibrium density w∗(a)≥0, positive equilibrium quantity and weighted quantity of consumers , . Symbols I0 and I+ denote here the bounded non-overlapping sets of integer indexes such that their union contains the indexes of all patches: I0∩I+ = ∅, I0∪I+ = {i|i ∈ N,i = 1,…,n}. This type of equilibria corresponds to the stationary state of system in which consumer population coexists with several or all non-depleted food patches. In this section we study the conditions of existence of such nontrivial equilibria. Equilibrium , i = 1,…,n, satisfies the equation:
Equation (10) has at most two nonnegative solutions:
Hence, the nontrivial equilibrium of food web contains the nonempty set of non-depleted patches that necessarily satisfy condition with indexes and the set (empty or not) of depleted patches that can satisfy or not the condition with indexes i∈I0.
From Eq. (11) we obtain the positive equilibria :
or
where n0 is a number of patches of set I+≠∅, 1≤n0≤n. Substituting Eqs (11) and (13) in Eq. (6) we obtain the equilibrium calorie intake rate C∗:
The second equation of equilibrium is obtained from Eqs (2, 5):
The general solution of Eq. (16) is . Substituting Eq. (17) in this solution yields the integral equation for the equilibrium density of consumer w∗(a):
Integrating Eq. (18) with respect to a from 0 to ad we obtain expression with the equilibrium quantity of consumers :
Multiplying both sides of Eq. (18) by γ(a), integrating them with respect to a from 0 to ad and substituting in obtained equation the left side of Eq. (19) we obtain :
By analogy with Theorem 1 from Hritonenko and Yatsenko (2007) formulated for harvesting problem, we obtain
Theorem 1. Let coefficients of system (1)–(5) satisfy conditions (7)–(8). System (11), (12), (18), possess a nontrivial equilibrium (i ∈ I+), (i ∈ I0), and w∗(a)≥0, , if and only if there exists the positive solution of equation with restrictions , i ∈ I+. The basic reproduction number R(C∗), equilibrium , i ∈ I+, equilibrium calorie intake rate C∗ and equilibrium quantity of consumers are given by Eqs (9, 11, 15, 20), respectively. The equilibrium distribution of consumer’s density w∗(a) ∈ C1([0,ad]) is defined by:
Proof. Multiplying both sides of Eq. (18) by θ(a,C∗), integrating them with respect to a from ar to am after a little algebra we arrive to the equation [see Eq. (9)]. If this equation has solution satisfied [i ∈ I+, see Eq. (11)], (i ∈ I0), we can obtain , i ∈ I+, [Eq. (11)], C∗ [Eq.(15)], and [Eq. (20)]. Conversely, if equation does not have solution satisfied , i ∈ I+, , i ∈ I0, the stationary solution of problem (11), (12), (18), (20) does not exist.
Substituting the left-hand side of Eq. (19) in Eq. (18) we obtain the equilibrium distribution of consumer’s density (21). Since coefficients of system (1)–(5) satisfy conditions (7)–(8) the equilibrium w∗(a) ∈ C1([0,ad]). Theorem 1 is proved.
Corollary 1. If some patches have higher activity resources with , condition holds for them and such patches always have positive equilibria defined by Eq. (11) (i.e., non-depleted patches).
Theorem 1 imposes the restriction on the basic reproduction number of consumer population at the equilibrium y∗, , taking into account the impact of foraging on the consumer fertility and mortality. The condition of existence of nontrivial balance between food resource growing and consumer demographical processes (nontrivial equilibrium) is given in the form of transcendental integral equation . Implementation of such condition in biological applications is difficult from the technical point of view. In the next theorem we provide the sufficient conditions for existence of the nontrivial equilibrium in the simpler form of restrictions on the coefficients of the system (1)–(5).
Theorem 2. Let the sets of indexes of the lower and higher activity resources of non-depleted patches are and , respectively, constant ,
and coefficients of system (1)–(5) satisfy Eqs (7, 8). Then, for existence of at least one non-trivial solution of stationary problem (11), (12), (18) equilibrium , i ∈ I+, (i ∈ I0), and w∗(a)≥0, w∗(a) ∈ C1([0,ad]), it is sufficient that and where the infimum and supremum of equilibrium calorie intake rate are:
The proof of Theorem 2 is given in Supplementary Appendix A.
Corollary 1. If all non-depleted patches have only lower activity resources with , when , from Eq. (23) it follows that the infimum of equilibrium intake rate , θ(a,0) = 0 [Eq.(7)] and, consequently, R(0) = 0. In this case condition is always satisfied and can be omitted in Theorem 2.
Local Asymptotic Stability of Equilibria of the Autonomous System (1)–(5)
The conditions of local asymptotic stability of the trivial and semi-trivial equilibria are addressed in Theorem 3.
Theorem 3.
(i) The trivial equilibrium , i = 1,…,n, w∗(a)≡0 of system (1)–(5) is unstable for all τ > 0.
(ii) The semi-trivial equilibrium , i = 1,…,n, w∗(a)≡0 is unconditionally (i.e., for all τ > 0) locally asymptotically stable if the consumer’s basic reproduction number R(K) < 1 whereas it is unstable for all τ > 0 if R(K)≥1.
The proof of Theorem 3 is given in Supplementary Appendix B.
Remark 1. If consumer population is fully extinct and cannot renew the reproduction, the Eq. (47) (Supplementary Appendix B) has only the trivial solution . The roots of Eq. (46) (Supplementary Appendix B) are always negative λ∗ = −ri < 0, that is the perturbations ζi(t)→0 and the semi-trivial equilibrium is locally asymptotically stable. The examples of the nonlinear age-structured models of population dynamics in the form of a single pulse–population outbreak with following extinction were obtained in works (Akimenko, 2017d; Akimenko and Anguelov, 2017).
The conditions of local asymptotic stability of the nontrivial equilibrium are addressed in Theorem 4.
Theorem 4. Let coefficients of the system (1)–(6) satisfy conditions (7), (8), the nontrivial equilibrium (i ∈ I+≠∅), (i ∈ I0), w∗(a)≥0, , of autonomous system (1)–(5) is a solution of the equation with restrictions (i ∈ I+) satisfied Eqs (11, 12, 20, 21).
This equilibrium is unstable for all τ > 0 if I0≠∅ and at least one of two following statements is true:
(i) ∃i ∈ I0 for which , or
(ii) for all i ∈ I0, and .
This equilibrium is unconditionally locally asymptotically stable (for all τ > 0) if one of two following statements is true:
(iii) I0≠∅, for all i ∈ I0 and , or
(iv) I0 = ∅.
Digestion period of generalist consumer τ does not cause local asymptotical instabilities of consumer population at the nontrivial equilibria.
The proof of Theorem 4 is given in Supplementary Appendix C.
Remark 1. According to the statement (iv) of Theorem 4 the nontrivial equilibrium with non-depleted food patches (I0 = ∅) is always locally asymptotically stable. That means that there exists a balance between resource growing, demographical process of consumer population and their consumption regime (within the framework of the considered model), which guarantees the steady coexistence of all non-depleted resource patches with non-empty consumer population. The local asymptotic stability of the nontrivial equilibria of nonlinear age-structured models with density dependent fertility and death rates is well predicted by the partial derivative of basic reproduction number (Cushing, 1998; Akimenko and Křivan, 2018). Such stability indicator of non-trivial equilibrium with non-depleted patches of system (1)–(5) has the form:
The negative value of this expression indicates the local asymptotic stability of the nontrivial equilibrium (see Cushing, 1998; Akimenko and Křivan, 2018) with non-depleted patches that confirms the statement (iv) of Theorem 4. On the other hand, this stability indicator cannot be used for analysis of local asymptotic stability of nontrivial equilibria with depleted patches [cases (i), (ii), (iii) of Theorem 4], because equilibrium calorie intake rate C∗ [Eq. (15)] depends only from the equilibrium of non-depleted patches and stability indicator (25) is negative for all non-trivial equilibria. That is why we will use in the next section the conditions of local asymptotic stability of non-trivial equilibria given in Theorem 4 instead of indicator (25).
Numerical Experiments
Parameterization of the Autonomous System (1)–(5)
We assume that the consumer fertility rate is increasing with a saturation monotone function and the death rate is a decreasing with extinction monotone function of calorie intake rate satisfied Eqs (7, 8). They are defined on the parametrized classes of algebraic functions:
where s0, θ0 are given constants. The generalist consumer population is partitioned into three age-structured groups with young, matured, and senile individuals with a number of individuals in each group , , and , respectively. We use the following piece-constant function of resource intake weighted coefficient among age-structured groups [γ(a) ∈ L2([0,ad]), Eq. (8)]:
where 0 < γr < γd < γm < 1 the set of constant dimensionless weights of resource intake for young, senile, and matured consumers, respectively. The biggest value of γm in comparison with γd and γr means that one matured consumer takes more resource biomass than young or senile consumer.
For illustration of theoretical results obtained in Theorems 3 and 4, we consider the minimal set of three food resource patches in all experiments in the vicinities of stationary equilibria. The values of coefficients of Eqs (1, 6), and initial values (3, 4) vary in each experiment depending on the conditions of Theorems 3, 4.
The Trivial and Semi-Trivial Equilibria
The numerical method based on the method of characteristics (Akimenko, 2017b,c, d) is used here for study the dynamical regimes of autonomous system (1)–(5) in the vicinities of all equilibria considered in “Local Asymptotic Stability of Equilibria of the Autonomous System (1)–(5).”
In the first group of experiments we study the asymptotic behavior of solutions in the vicinity of the trivial and semi-trivial equilibria with fixed small value of time delay τ = 0.001ad. The dynamics of mean resource density , the quantity of consumers , and the basic reproduction number R(t) are shown in Figure 1. The numerical simulations illustrate the results obtained in Theorem 3.
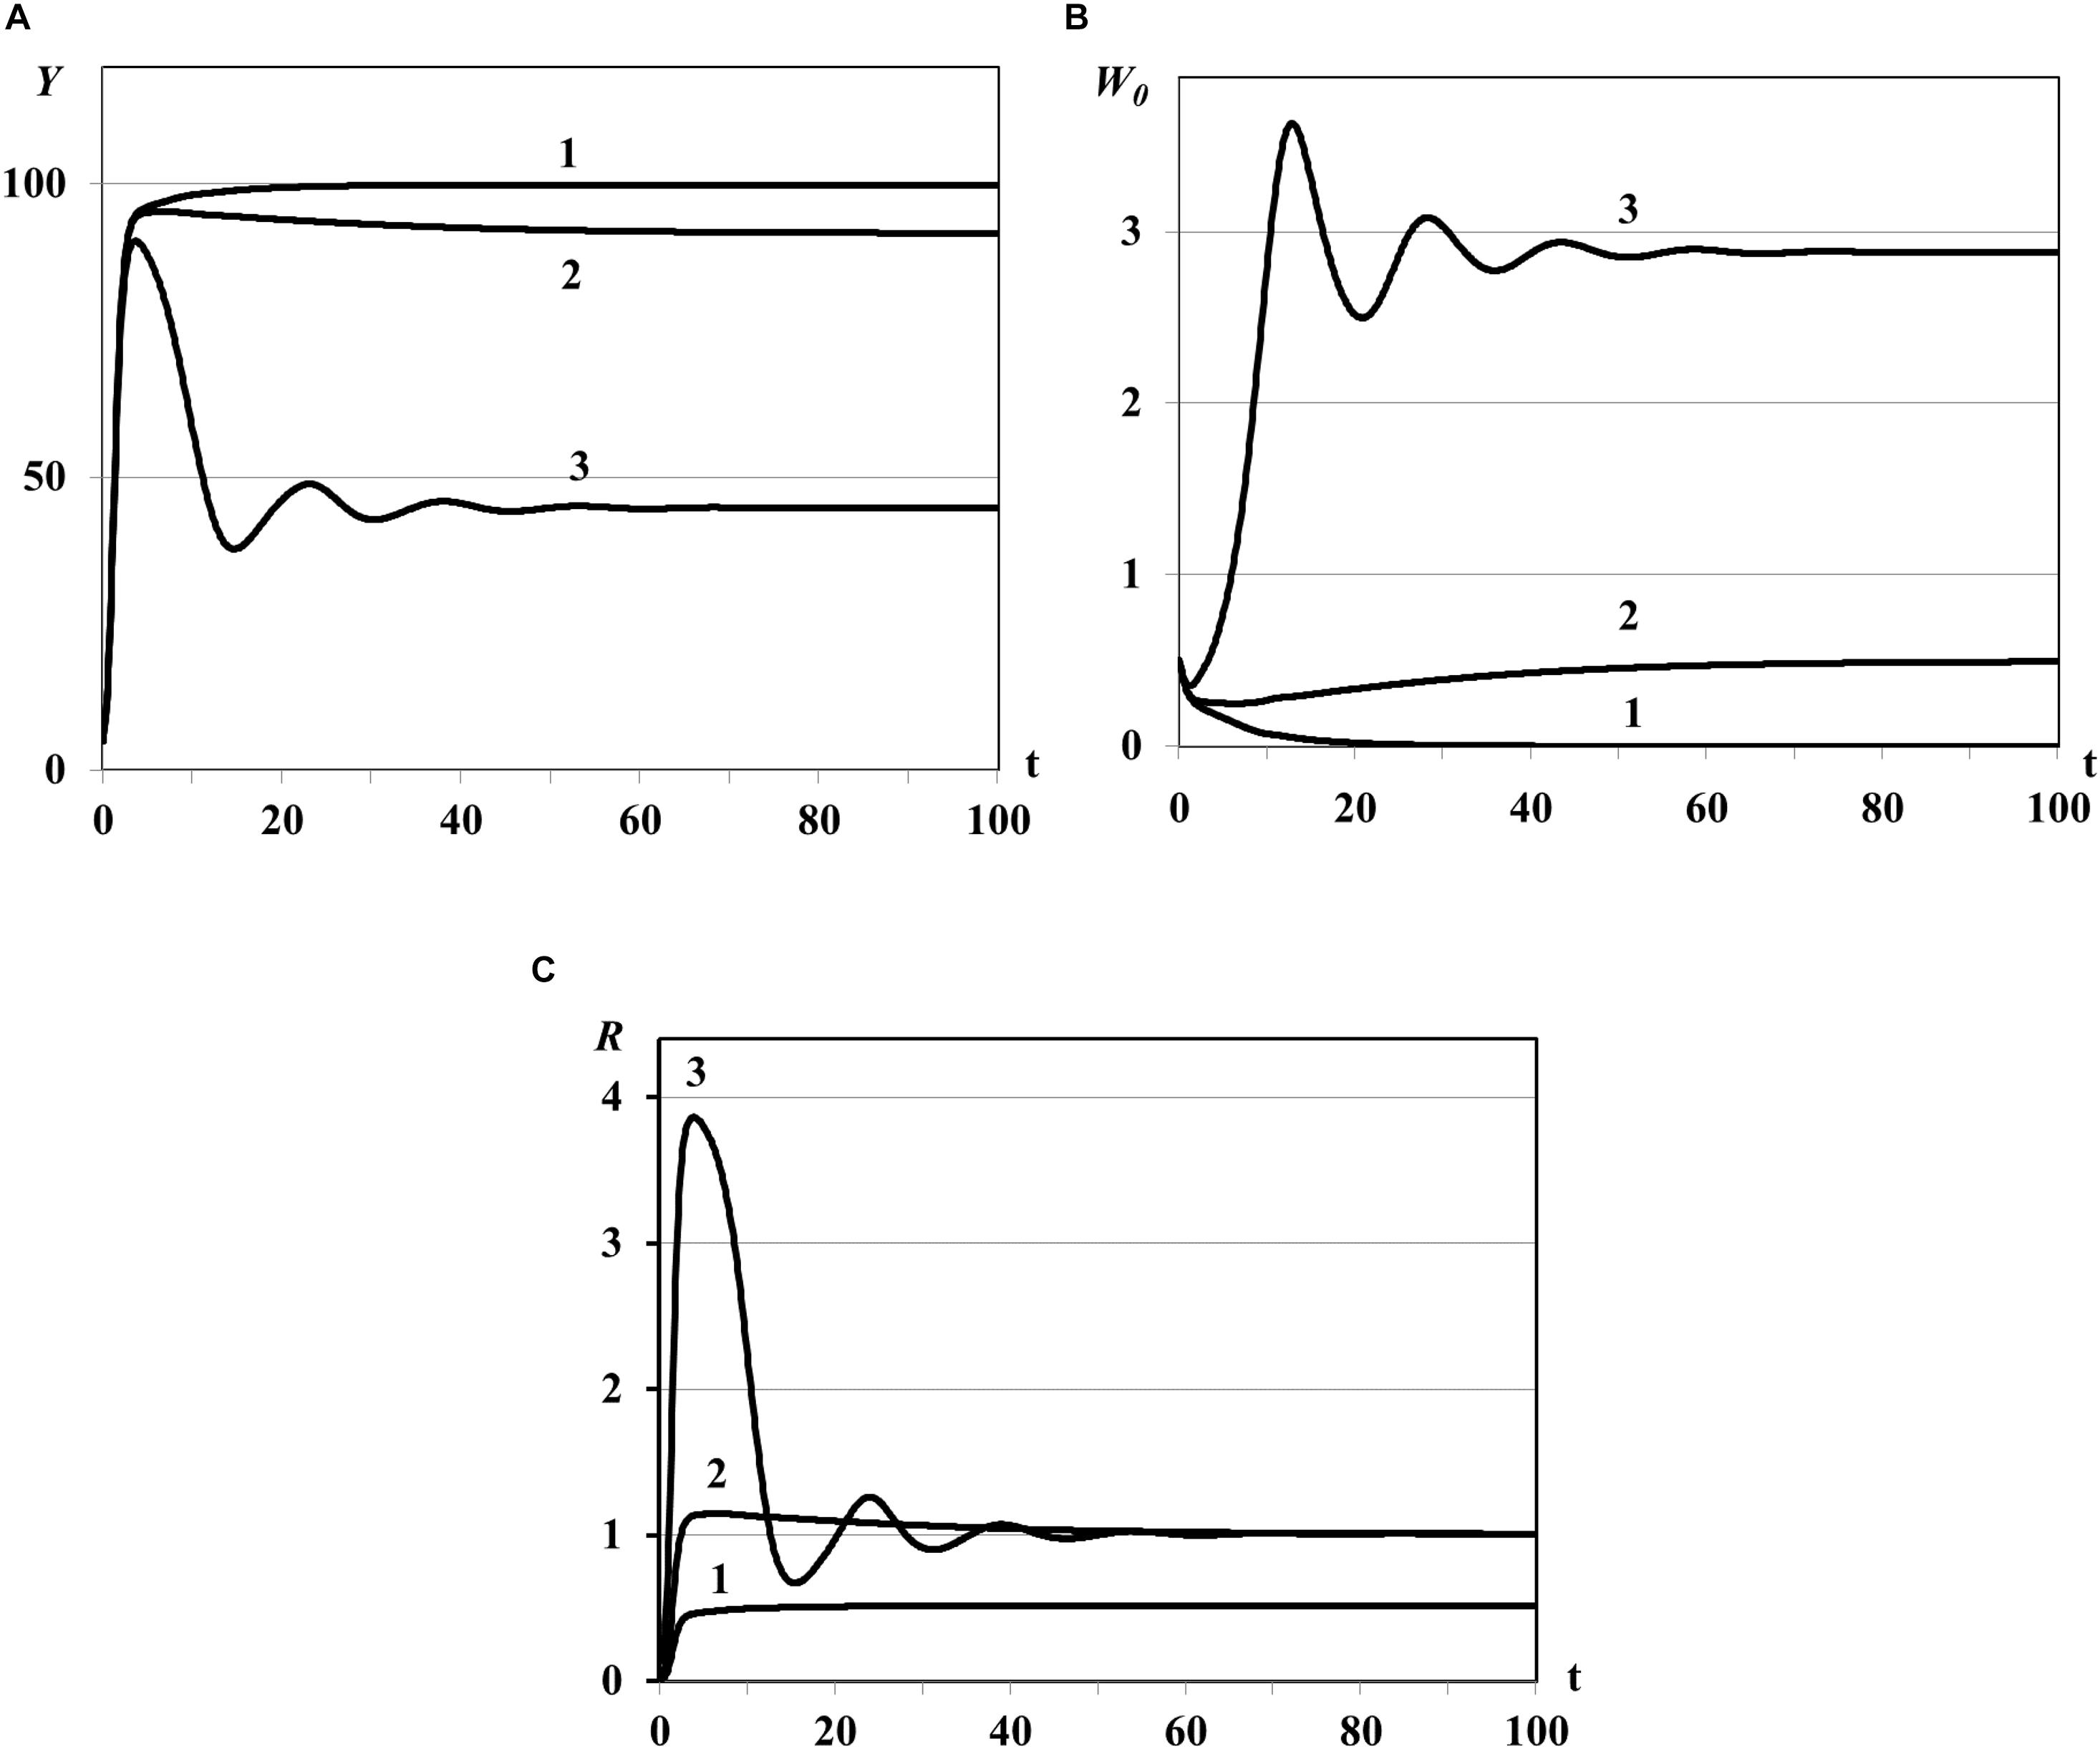
Figure 1. Graphs of asymptotic convergence of solutions with R(K) < 1 (curve 1), R(K) > 1 (curve 2), and R(K)≫1 (curve 3). Y(t) - mean resource density (A), W0(t) - quantity of consumers (B), R(t) - consumer’s basic reproduction number (C).
Case (i) of Theorem 3: in this experiment the trivial equilibrium is unstable (all curves in Figure 1), Y(t) and W0(t) evolve to the semi-trivial equilibrium (curves 1 in Figures 1A,B, consumer population becomes extinct while the resource biomass in all patches saturates, R(K) < 1) or evolve to the nontrivial equilibrium (curves 2 and 3 in Figures 1A,B, R(K) > 1).
Case (ii) of Theorem 3: in this experiment the semi-trivial equilibrium is asymptotically stable with R(K) < 1 (curves 1 in Figure 1) whereas it is unstable with R(K) > 1 (graphs 2 in Figure 1).
For the very large basic reproduction number R(K)≫1 obtained with large value of θ0 [Eq. (86)] we observe the oscillatory regime of the system with asymptotic convergence of solution to the steady state (curve 3 in Figure 1). The existence of such periodic solutions of some Lotka-Volterra prey-predator models was proved in theoretical work (Xu et al., 2004) and was observed in numerical experiments in Akimenko (2017d) and Akimenko and Anguelov (2017).
Further increasing of basic reproduction number by parameter θ0 causes the consumer population outbreaks (special dynamical regimes of population, see Abbott and Dwyer, 2007; Akimenko and Anguelov, 2017; Akimenko and Piou, 2018). The pulse sequence or sequence of outbreaks (Figure 2) of consumers population and resource densities describe the quasi-periodic dynamical regime in the vicinities of the trivial and semi-trivial equilibria. The fast growing of consumer population is accompanied by huge resource consumption, and as a consequence, by resource extinction and following decreasing of consumer population density to minimal but not critical values. Although this minimal value cannot be seen on the graphs due to their small scale, we observe a quasi-periodic recovery and renewal of customer population that would be impossible with the complete disappearance of reproductive individuals in the population.
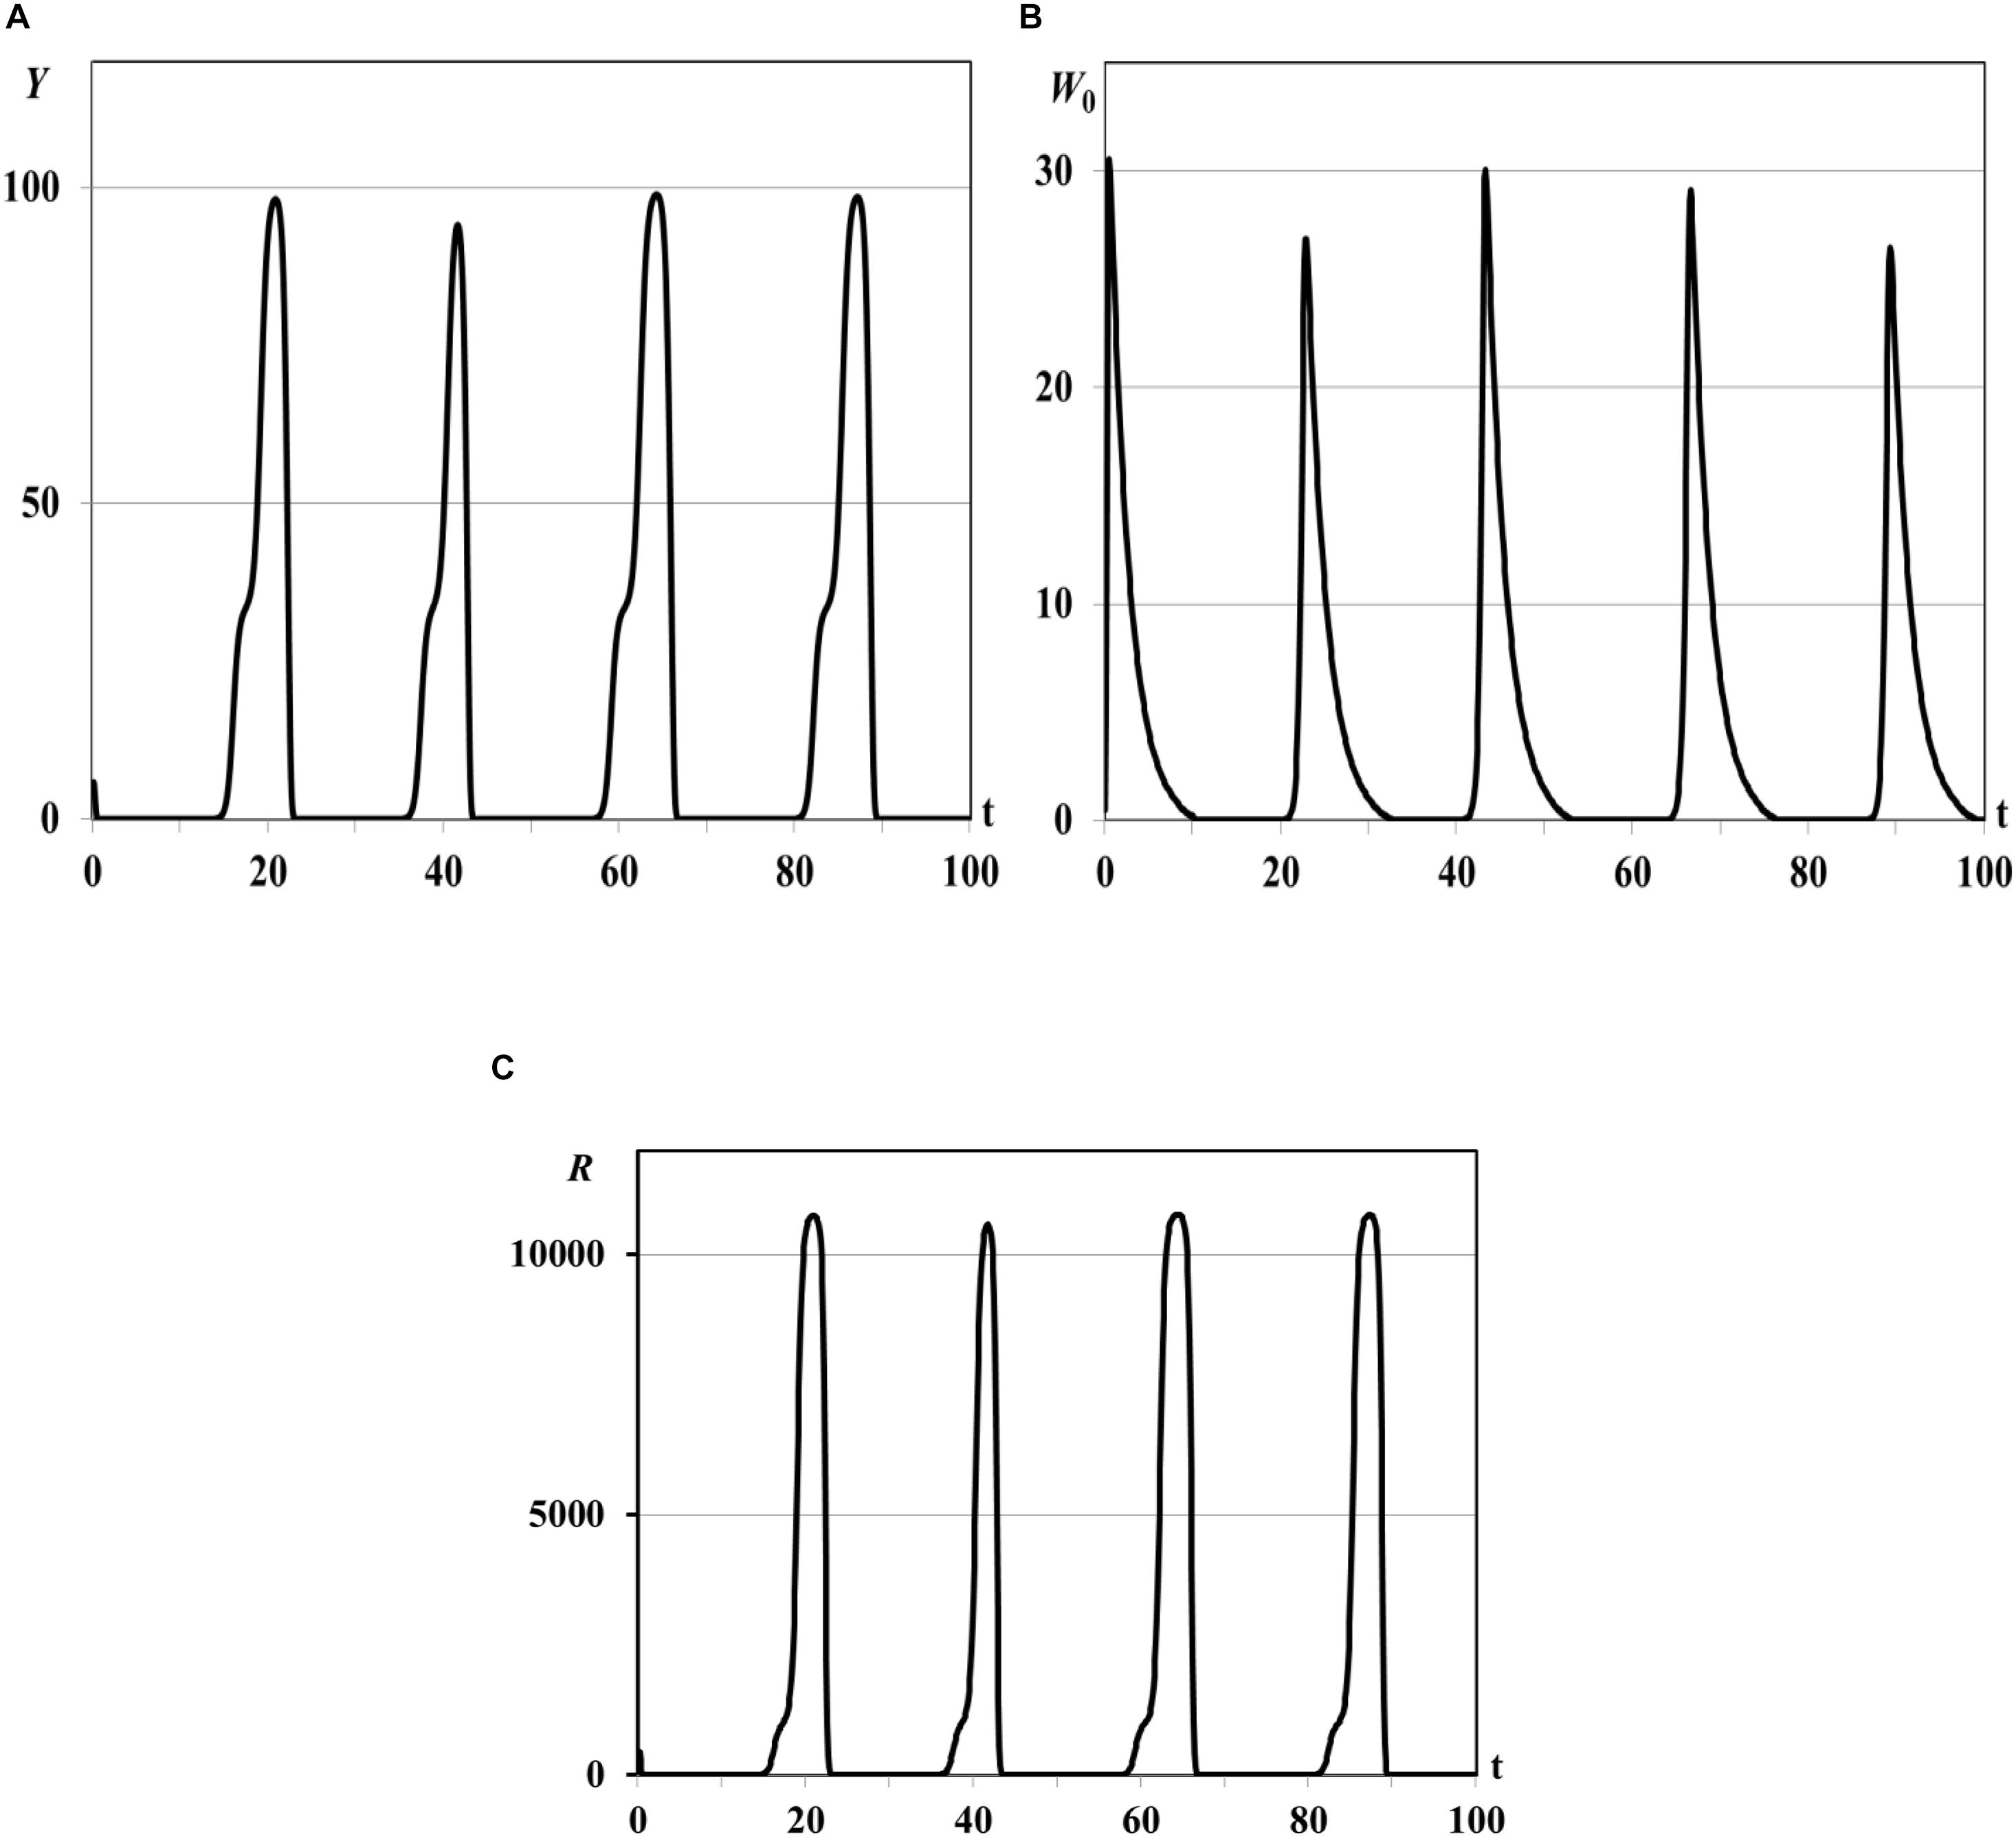
Figure 2. Graphs of periodic population outbreaks with R(K)≫1, τ = 0.001ad. Y(t) - mean resource density (A), W0(t) - quantity of consumers (B), R(t) - consumer’s basic reproduction number (C).
The system moves to the trivial equilibrium from the vicinity of unstable semi-trivial equilibrium (R(K)≫1, statement (ii) of Theorem 2). But, since the trivial equilibrium is unstable too (statement (i) of Theorem 2), and the minimal number of consumers is sufficient for the following renewal of population, system moves to the semi-trivial equilibrium again. This process is repeated at quasi-periodic time intervals and results in the pulse sequence of consumer population and resource densities. The same regimes were obtained in work (Akimenko, 2017d) for the nonlinear age-structured model of population dynamics with density-dependent delayed death rate only for the big values of delay parameter and/or for the periodic time-dependent death and fertility rates. Since in this experiment the impact of the time delay parameter is insignificant and all coefficients of the model are time-independent the dynamical regimes of periodic outbreaks are result of the repeating dynamical interaction between total resource consumption and its renewing from the one hand and consumer population growth and extinction from the other hand.
Further increasing of parameter θ0 leads to the consumer population outbreaks of the single pulse form (Figures 3A,B). The same rapid consumer population growth like in the previous experiment is accompanied by huge resource consumption and resource extinction but with following decreasing of consumer population density up to critical values when population is not able to renew the reproduction and becomes fully extinct (see Remark 1 to Theorem 3). The food resources in all patches saturate with time and system evolves eventually to the asymptotically stable semi-trivial equilibrium (Figure 3A).
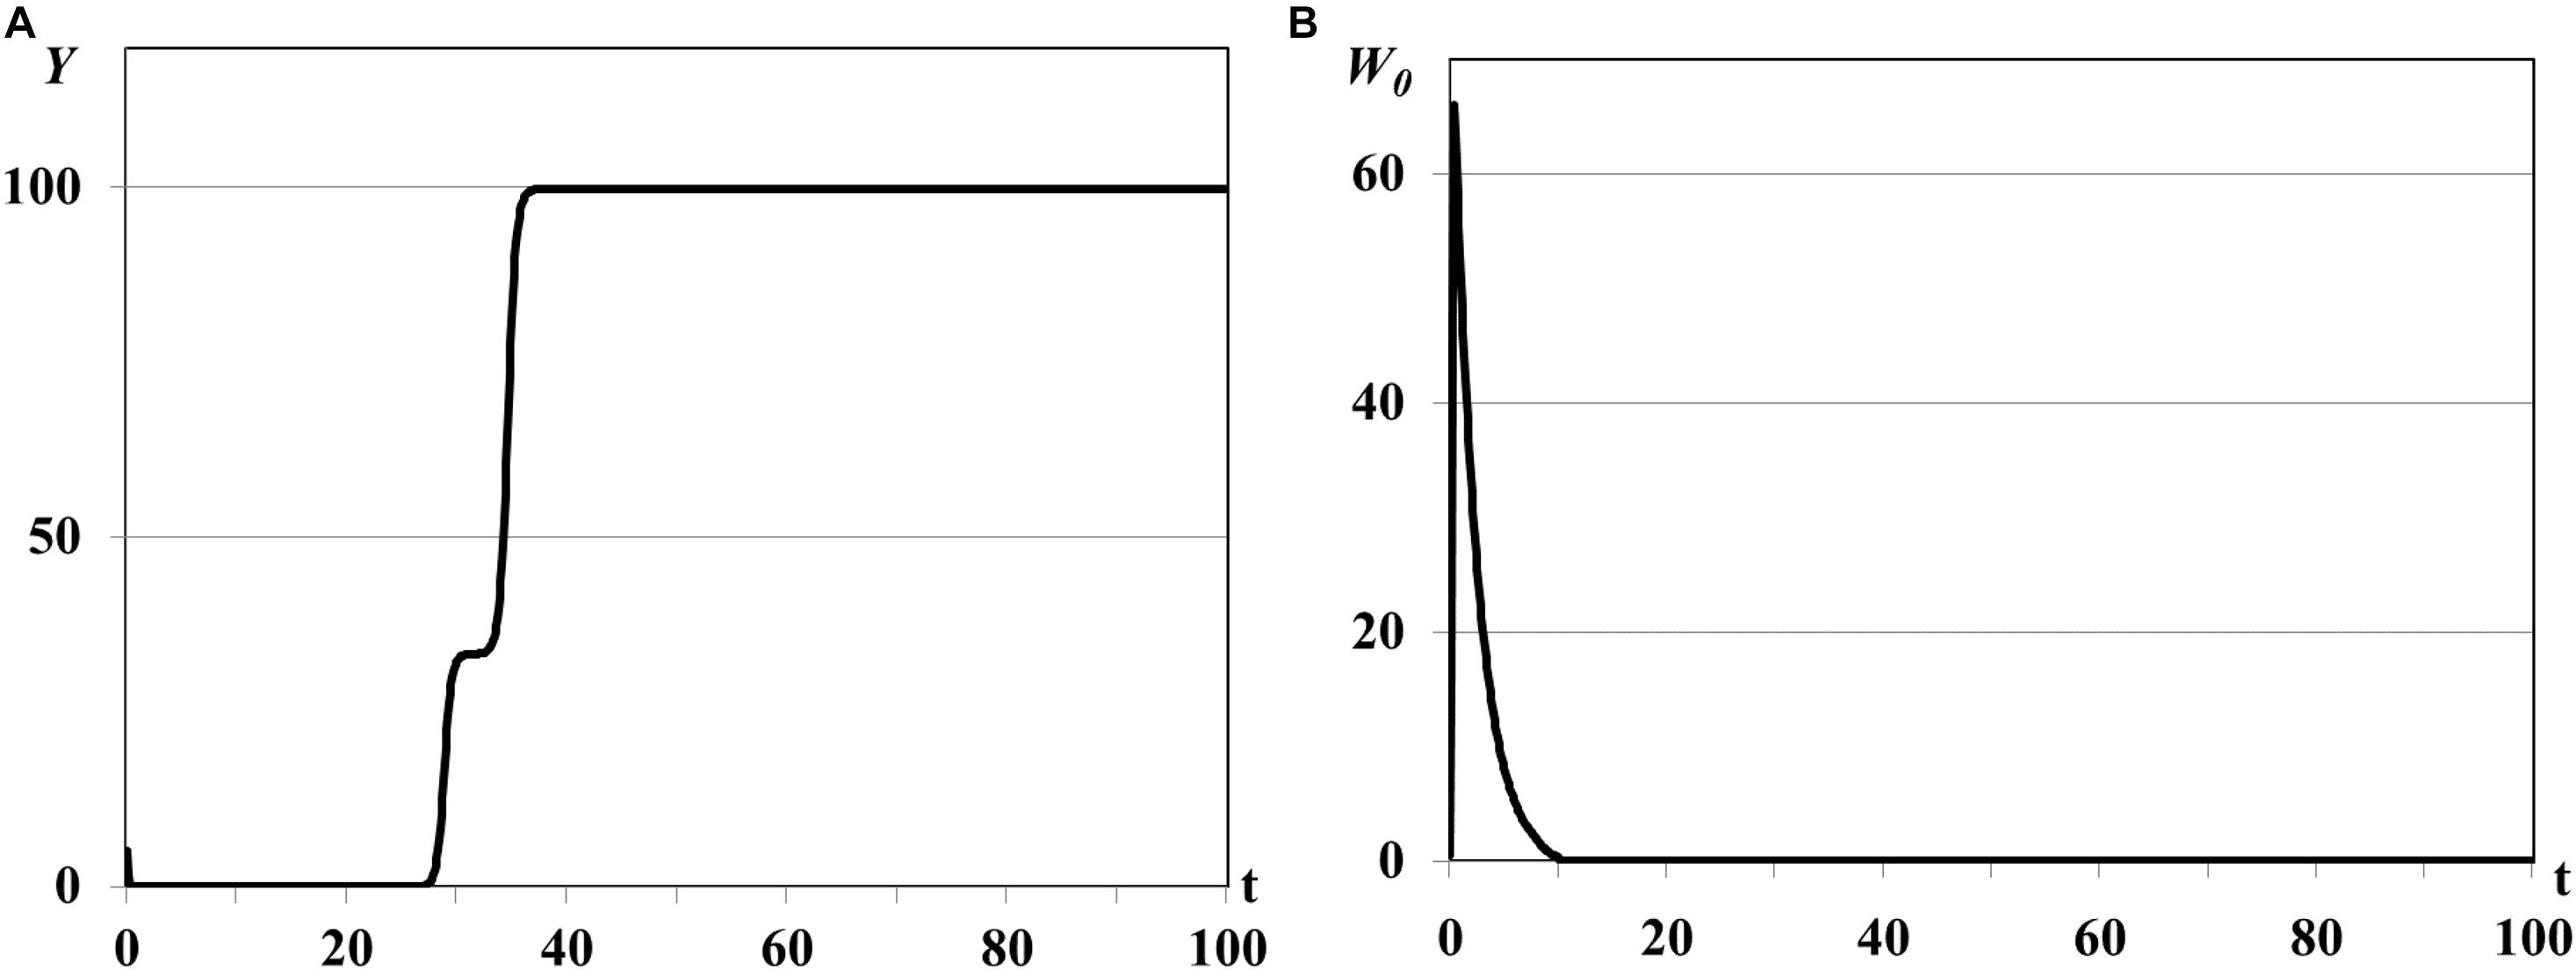
Figure 3. Graphs of population single outbreak and extinction, τ = 0.001ad. Y(t) - mean resource density (A), W0(t) - quantity of consumers (B).
In the second group of experiments we study the dynamical regimes of autonomous system (1)–(5) in the vicinity of the trivial and semi-trivial equilibria with different values of time delay from interval τ = 0.001ad, …, τ = 0.03ad, and large basic reproduction number R(K)≫1. Solution of the autonomous system (1)–(5) oscillates with bounded magnitude in the vicinity of the semi-trivial equilibrium in all experiments with different value of time delay (Figures 4–6). For the small value of τ = 0.001ad the trajectories of system have the magnitude with exctincted oscillations and converge to the positive equilibrium (curve 3 in Figure 1). The bigger value of τ = 0.005ad causes the periodic dynamics of Y(t) and W0(t) with bigger magnitudes, shown in Figure 4. Further increasing of time delay leads to the periodic outbreakes of Y(t) and W0(t) with τ = 0.015ad (Figure 5) and single outbreak of W0(t) with saturating Y(t) with τ = 0.03ad (Figure 6).
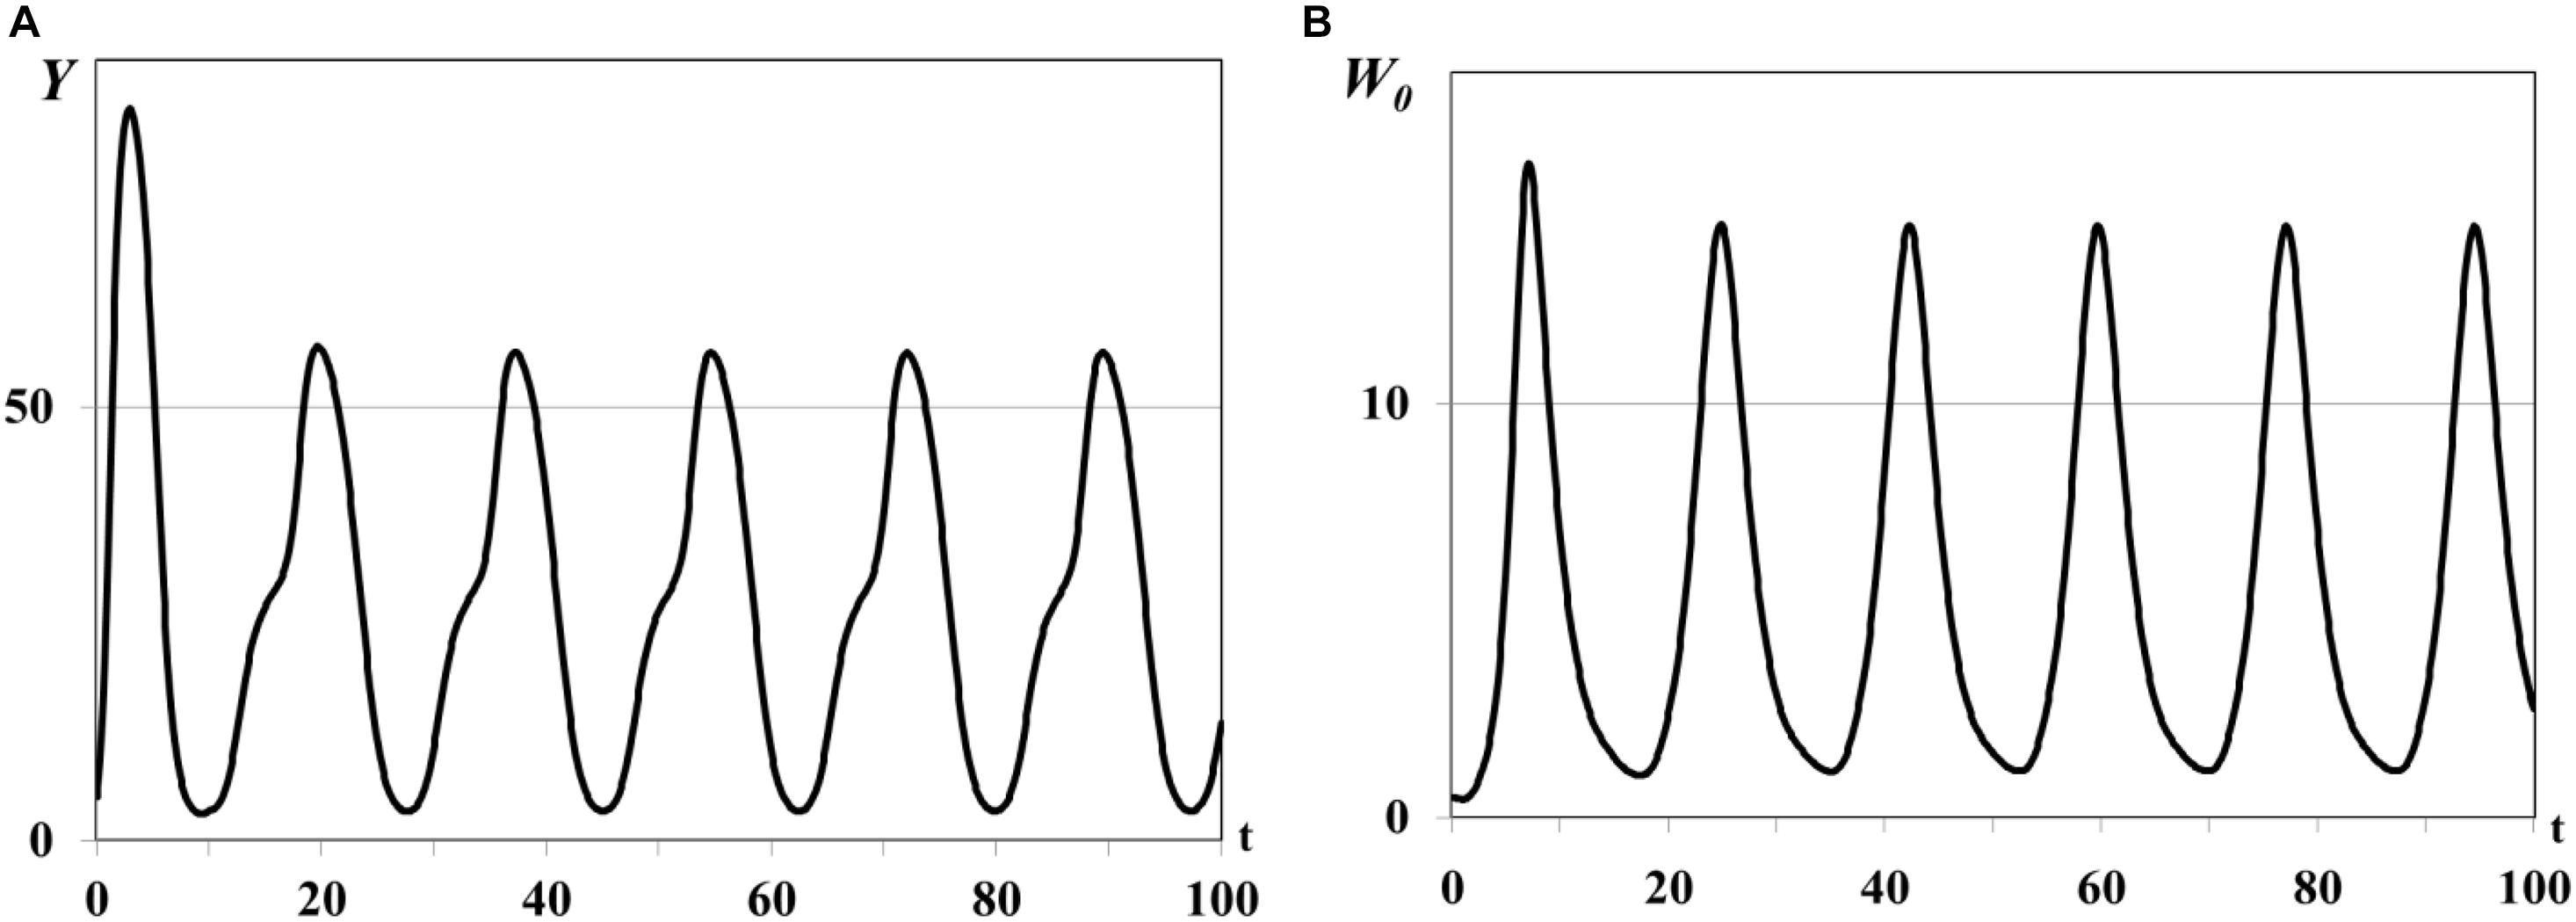
Figure 4. Graphs of periodic dynamics of Y(t) and W0(t), τ = 0.005ad. Y(t) - mean resource density (A), W0(t) - quantity of consumers (B).
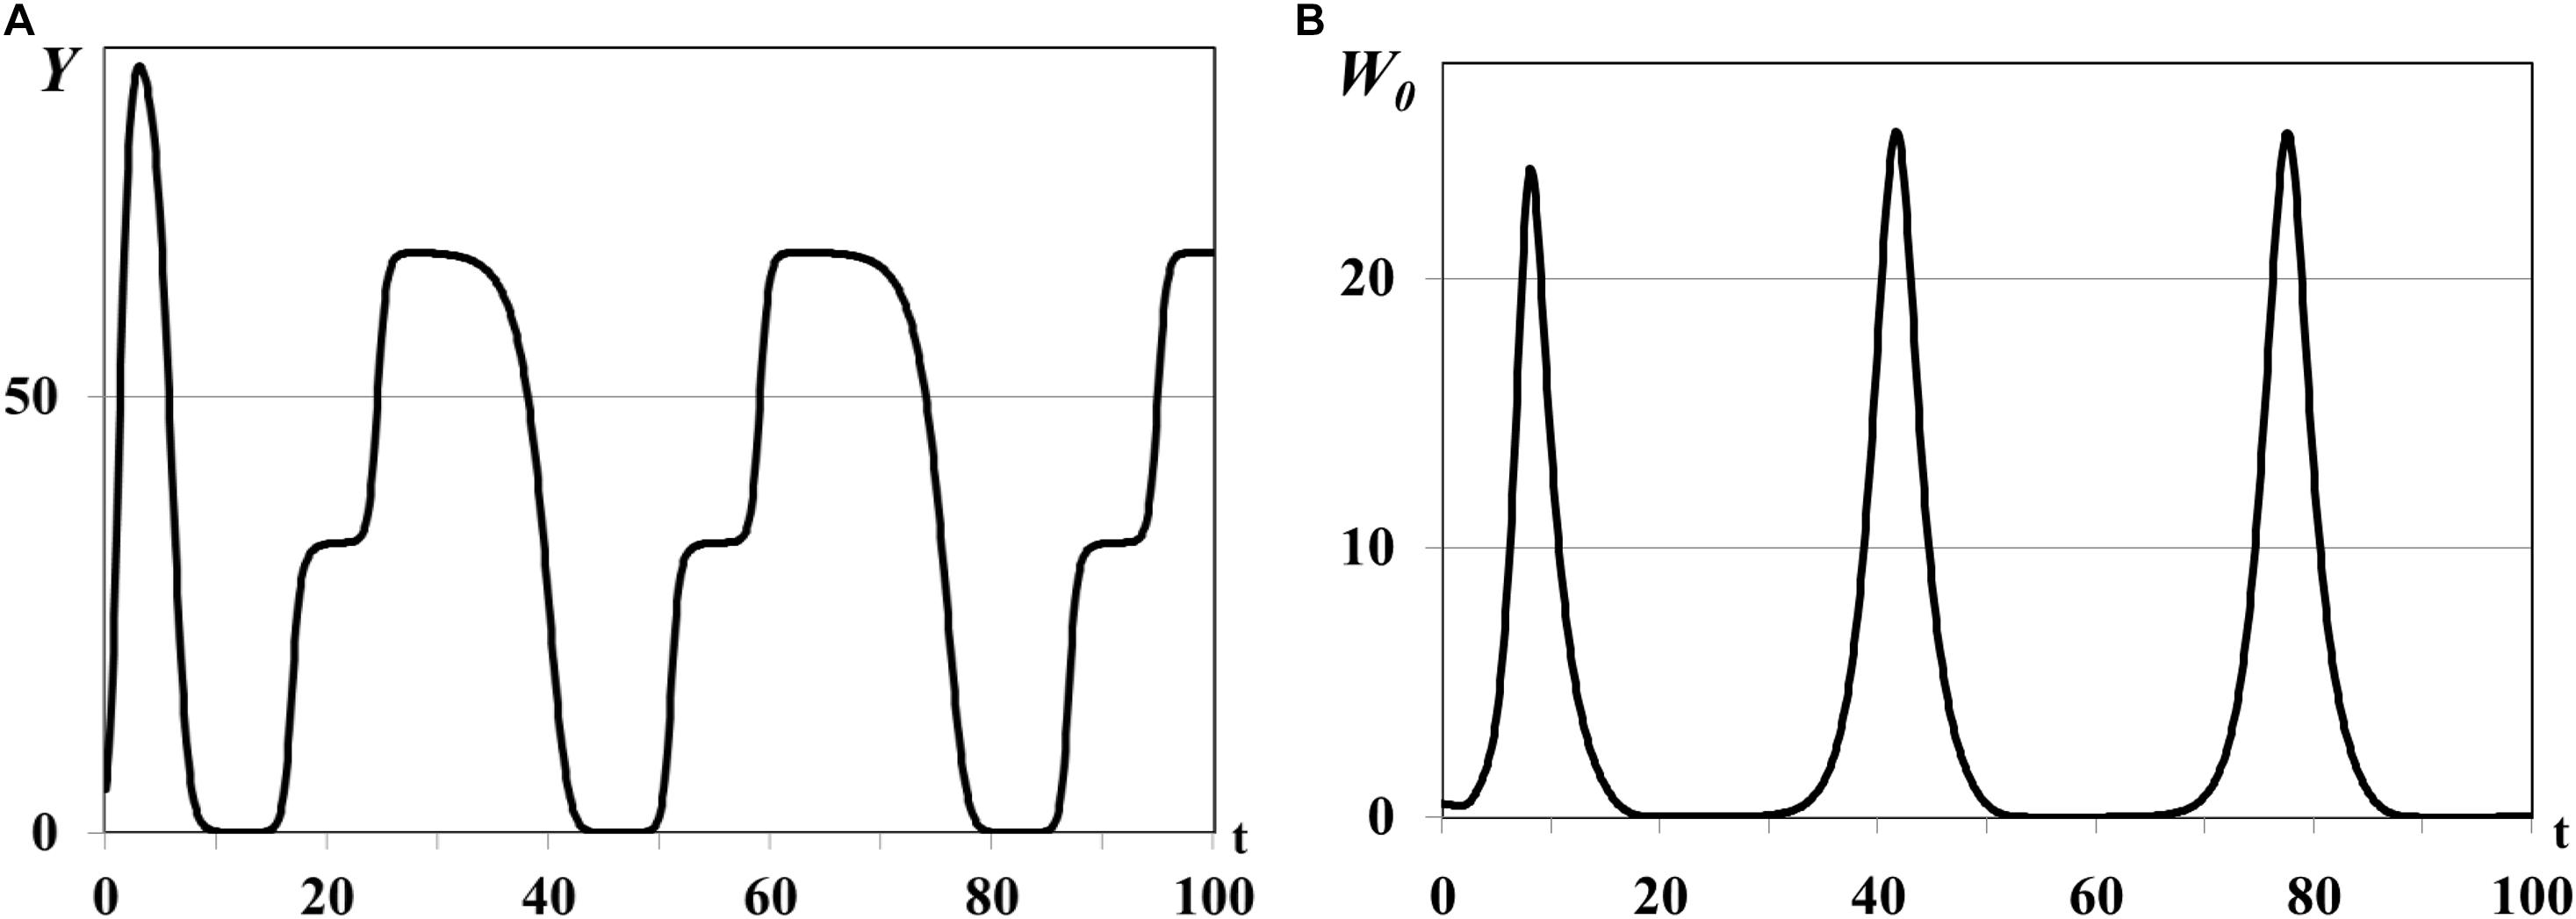
Figure 5. Graphs of periodic outbreaks of Y(t) and W0(t), τ = 0.015ad. Y(t) - mean resource density (A), W0(t) - quantity of consumers (B).
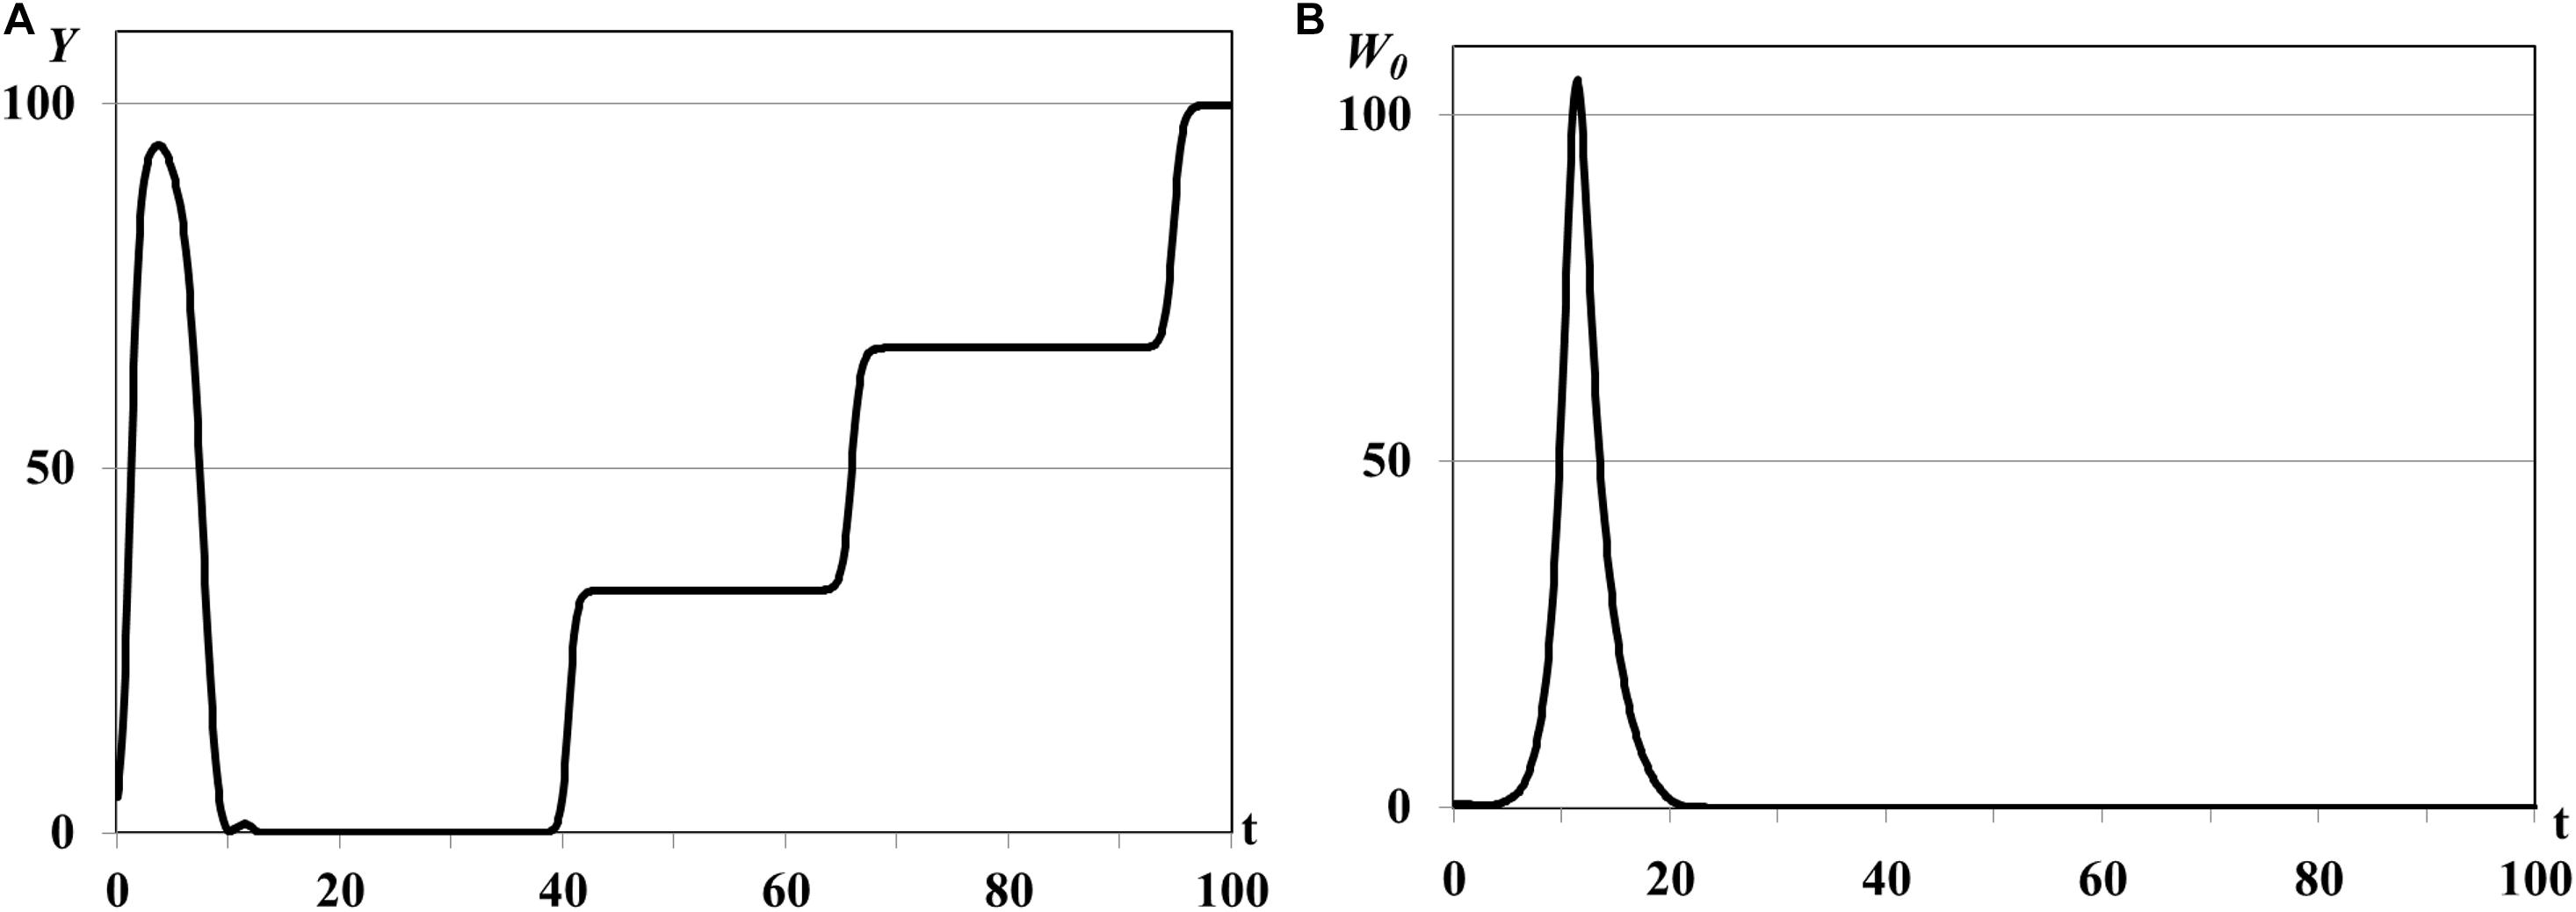
Figure 6. Graphs of asymptotic saturation of Y(t) (A), single outbreak of W0(t) (B), τ = 0.03ad.
In all experiments of the second group the graphs of mean resource density Y(t) and quantity of consumers W0(t) oscillate in antiphase. This is a traditional form of dynamics of prey-predator interaction. It means that increasing biomass of food patches stimulates the reproduction of consumers and decreasing of their mortality and leads to increasing size of consumer population. In this case resource consumption is rapidly increasing and, eventually, leads to the depletion of food patches. The growing deficit of food resource causes the decreasing consumer reproduction, increasing their mortality, and, eventually, decreasing size of consumer population up to the complete disappearance. Since the model considers the renewable food resource the food biomass in patches starts for growing again after consumer population decreasing or disappearance. The different growth rates ri and carrying capacities Ki in three food patches cause the rounded smooth steps on the graphs of Y(t) in Figures 4A, 5A, 6A. If the consumer population does not extinct this process repeats again and we obtain the quasiperiodical dynamics of consumer population [graphs of W0(t) in Figures 4B, 5B]. Otherwise we observe the consumer population outbreak in the form of single pulse with following extinction (Figure 6B). In some insect and animal populations the cannibalism can be a common response to nutritional deficiency when the food patches are limited in resources or depleted (Richardson et al., 2010; Guttal et al., 2012). For example, if some population of locusts cannot migrate to new food patch and suffers from the lack of food resource in depleted patches the gregarious locusts can cannibalize each other (Guttal et al., 2012). The survivor and solitarious locusts in this population eventually die of starvation. The graphs shown in Figures 4, 5 correspond to the regimes of population outbreaks obtained in the previous experiments (Figures 2, 3). Similar dynamical regimes were obtained and described in works (Akimenko, 2017d; Akimenko and Anguelov, 2017) for the age-structured model with density-dependent delayed death rate and discussed in work (Akimenko and Piou, 2018) for the two-compartment age-structured model of locust population dynamics.
Comparison of graphs of Y(t), W0(t) on Figures 4, 5 reveals that an increasing value of digestion period of generalist consumer τ leads to the growth of consumer population size and increase in the time period of its outbreaks. Consumers with bigger digestion periods extend the pause between foraging that allows patches to use this time to increase their resource up to satiation. Increasing of food resource in patches leads eventually to the growth in consumer population size and resource food consumption. Larger consumer population consumes more resource emptying food patches, resulting in nutritional deficiency and increasing in the mortality of the consumer population (starvation, cannibalism, etc.). If consumers of reproductive age survive, they recover and renew the consumer population with a larger time period (graphs of W0(t) in Figures 4B, 5B), otherwise consumer population cannot recover band extinct (graph of W0(t) in Figure 6B).
The results of this group of experiments illustrate also that digestion period of generalist consumer τ does not lead to the high-frequency oscillations of the solution in the vicinity of the semi-trivial equilibrium known as deterministic chaos.
The Nontrivial Equilibria
The third group of numerical experiments focuses on the study of asymptotic behavior of solutions in the vicinity of the non-trivial equilibrium where some patches are depleted, i.e., (i = 1,…,n0), (i = n0 + 1,…,n), n0≤n, w∗(a)≥0, . In all experiments n = 3, but n0 varies in each experiment depending from the condition of Theorem 4. For the fixed values of n, n0 the root of transcendental equation is defined numerically by the bisection method with restrictions , i ∈ I+. The equilibrium values , , w∗(a) are defined by Eqs (11, 20, 21) respectively. The value of is used also in figures for illustration of asymptotic convergence of trajectories to the equilibrium.
Case (i) of Theorem 4. In the first experiment we study the positive equilibrium with one non-depleted patch, less active and more active depleted patches: n0 = 1, , , . In equation we use , , , for which , , . The dynamics of resource densities yi(t) (i = 1,2,3) and consumer weighted quantity are shown in Figure 7. The density of first food patch y1(t) does not evolve to the equilibrium (curve 1 in Figure 7A), patches y2(t) and y3(t) are not depleted (curves 2 and 3 in Figure 7A), and consumer weighted quantity does not evolve to the equilibrium (Figure 7B), i.e., the nontrivial equilibrium is unstable.
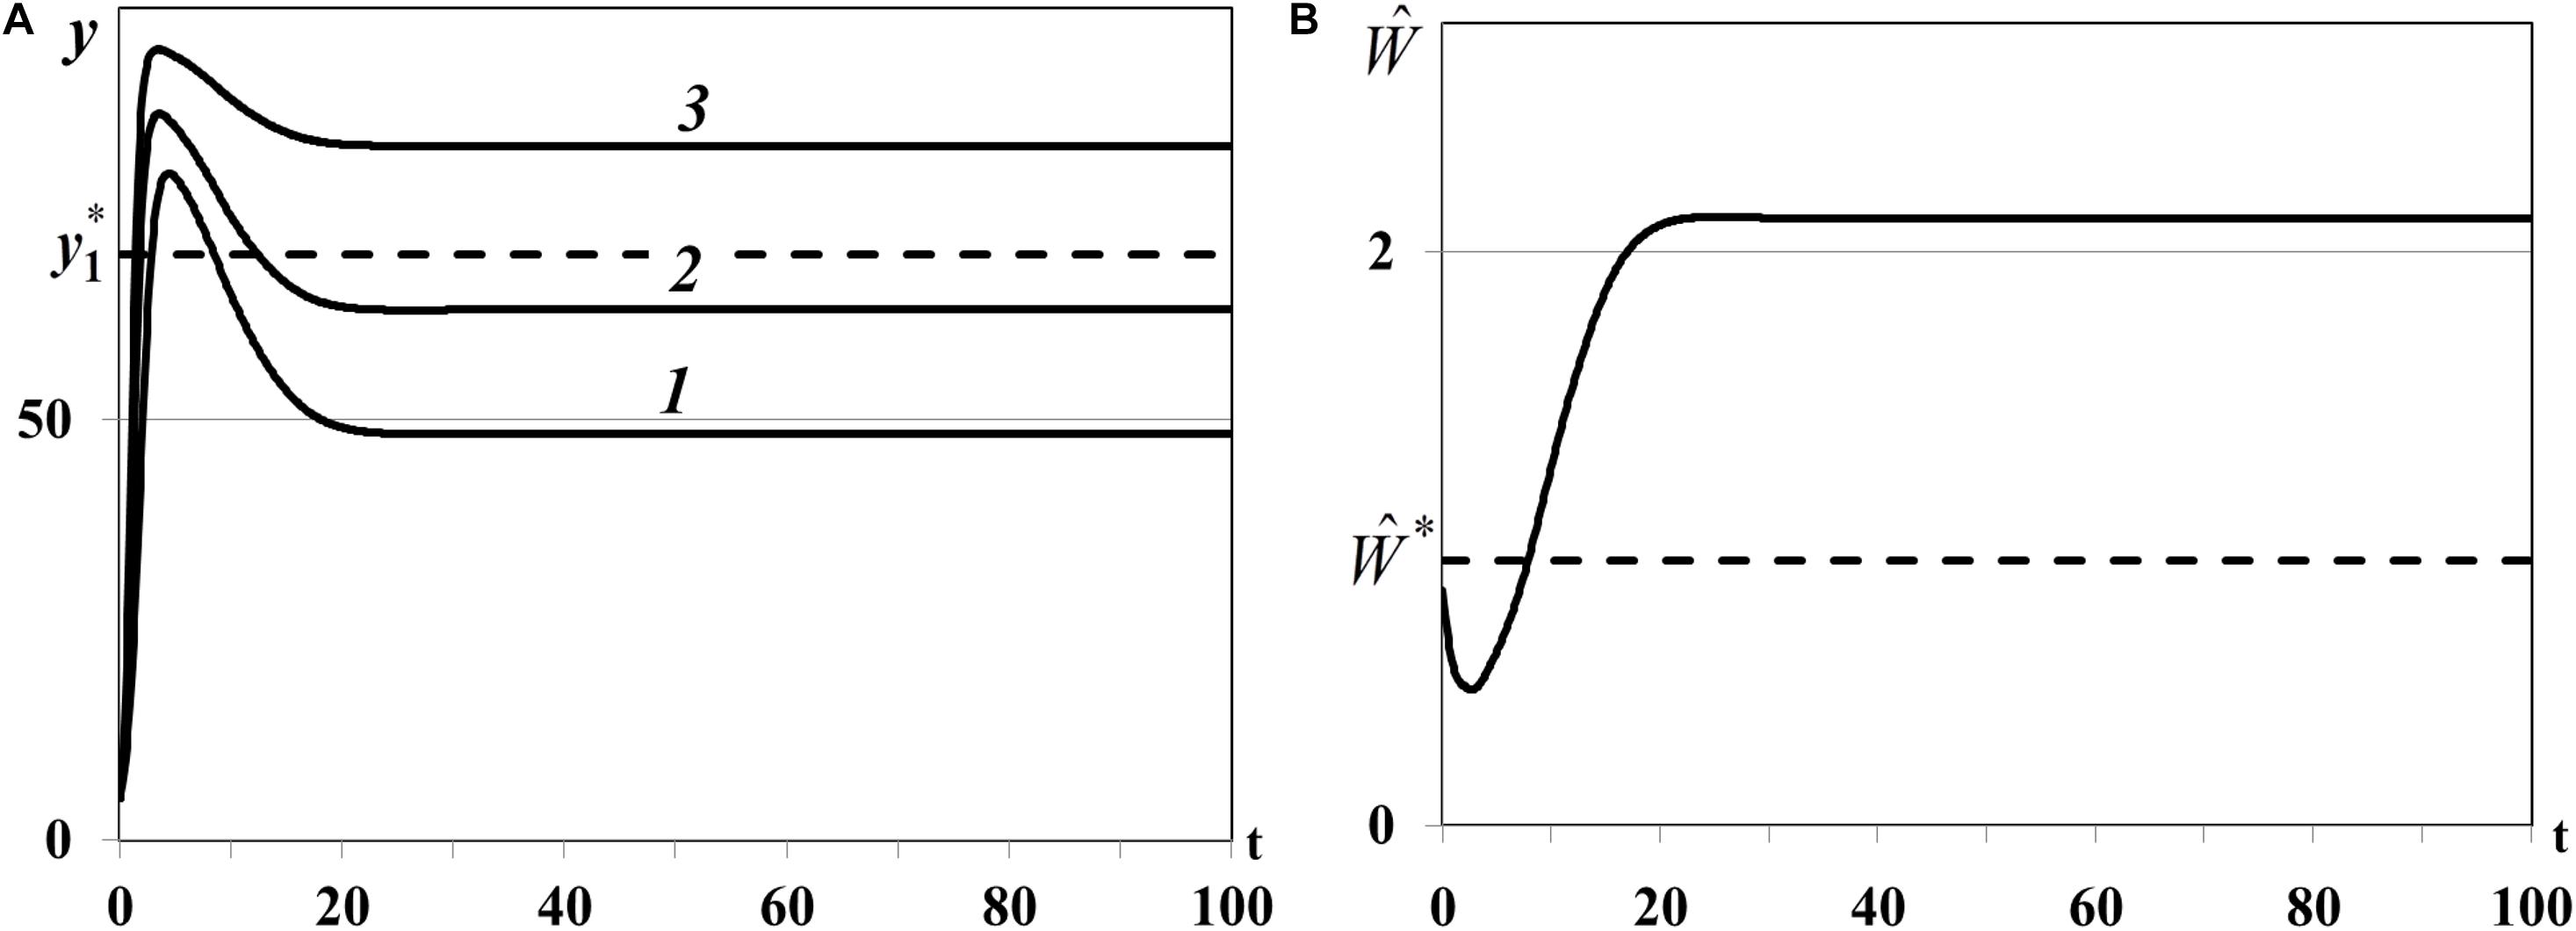
Figure 7. (A) Case (i). Resource densities yi(t) (i = 1,2,3). y_1* is a computed equilibrium of the first resource. (B) Weighted number of consumers . is a computed equilibrium of .
Case (ii) of Theorem 4. In the second experiment we study positive equilibrium with one non-depleted patch and two less active depleted patches with : n0 = 1, , , . In equation we use , , , for which , , . The density of first food patch y1(t) does not evolve to the equilibrium (curve 1 in Figure 8A), second patch is not depleted [y2(t), curve 2 in Figure 8A], y3(t) converges to the trivial equilibrium and becomes depleted [curve 3 in Figure 8A], and consumer weighted quantity does not evolve to the equilibrium (Figure 8B), i.e., the nontrivial equilibrium of food web is unstable.
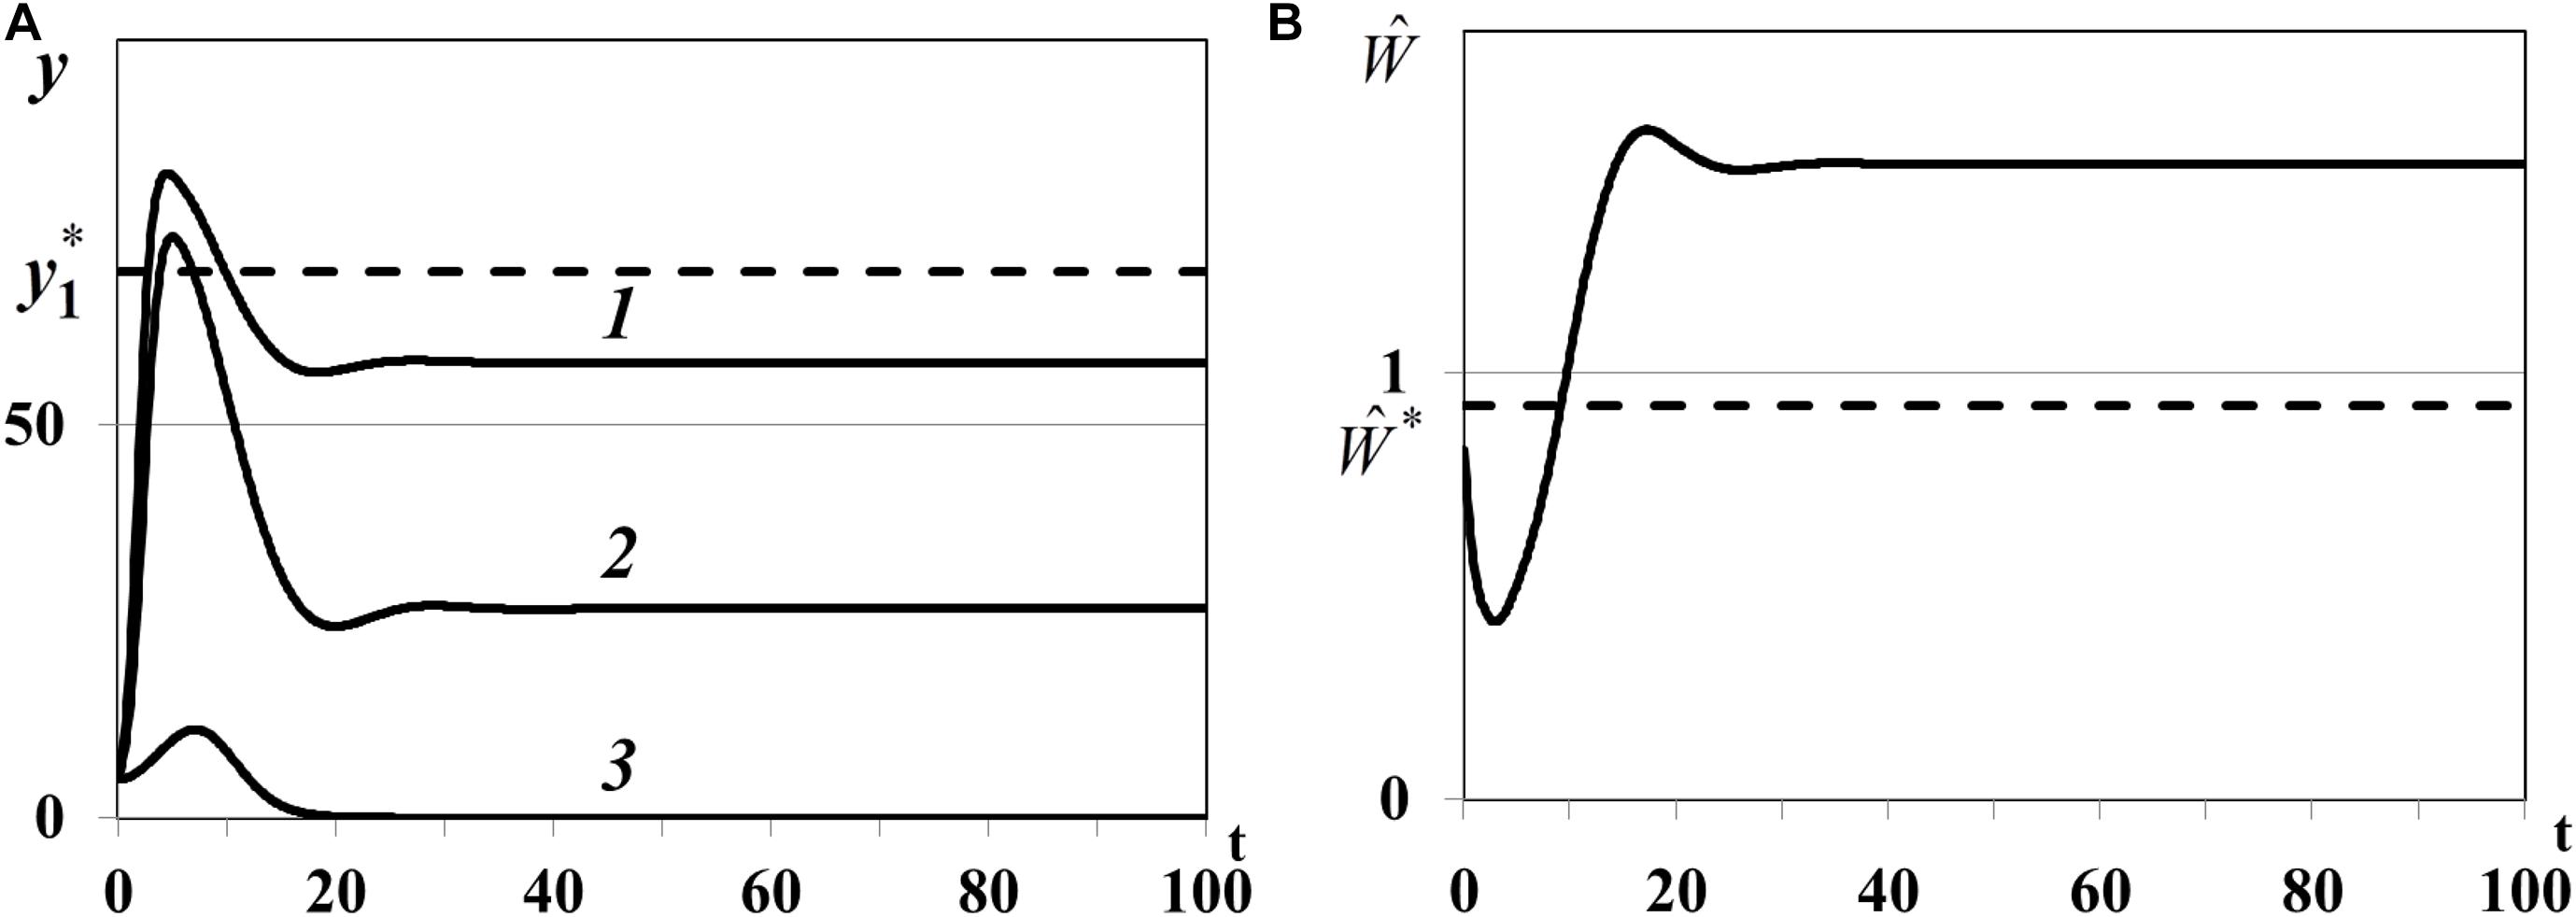
Figure 8. (A) Case (ii). Resource densities yi(t) (i = 1,2,3). y_1* is a computed equilibrium of the first resource. (B) Weighted number of consumers . is a computed equilibrium of .
Case (iii) of Theorem 4. In the third experiment we study the positive equilibrium with one non-depleted patch, two less active depleted patches with : n0 = 1, , , . In equation we use , , , for which , , . The density of first food patch y1(t) in this case evolves to the positive equilibrium (curve 1 in Figure 8A), the densities of the other patches y2(t) and y3(t) evolve to the trivial equilibrium (, ), and become depleted (curves 2 and 3 in Figure 8A). Consumer weighted quantity evolves to the positive equilibrium (Figure 8B), i.e., the nontrivial equilibrium with one non-depleted patch and two depleted patches is locally asymptotically stable.
Case (iv) of Theorem 4. In the last fourth experiment we study the positive equilibrium with three non-depleted patches and nontrivial consumer population: n0 = 3, , , . In equation we use , , , for which , , . The densities of food patches yi(t) evolve to the corresponding positive equilibria , (i = 1,2,3) (curves 1, 2, 3 in Figure 10A), consumer weighted quantity evolves to the positive equilibrium (Figure 10B), i.e., the nontrivial equilibrium with all non-depleted patches is locally asymptotically stable.
In the third experiment the nontrivial equilibrium with one non-depleted patch and two depleted patches (I0≠∅) and in the fourth experiment the nontrivial equilibrium with three non-depleted patches (I0 = ∅) are locally asymptotically stable (Figures 9, 10). Overall, we can conclude that stability indicators obtained in Theorem 3 and 4 correctly predict the asymptotic stability or instability of trivial, semi-trivial and non-trivial equilibria of system (1)–(5) in all numerical experiments.
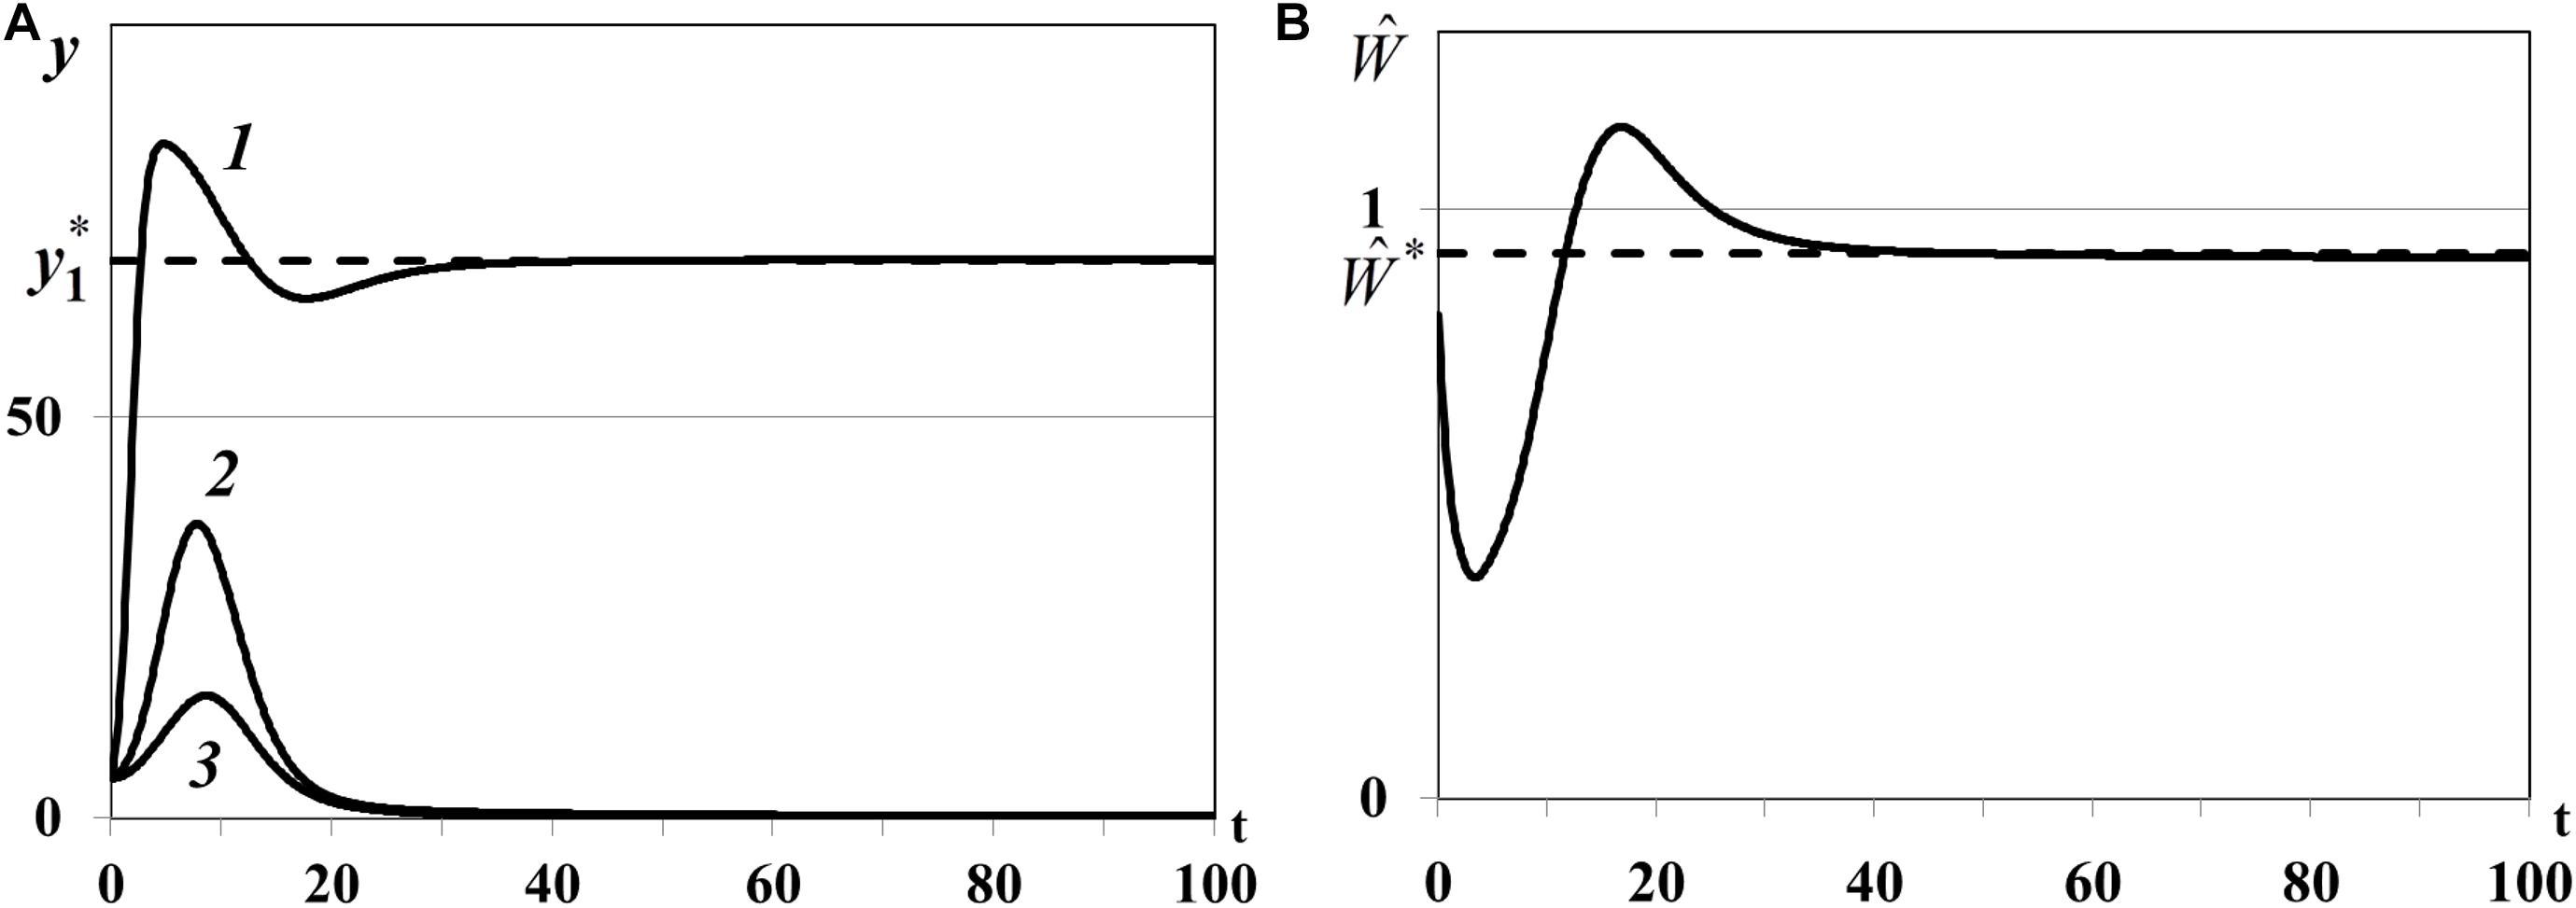
Figure 9. (A) Case (iii). Resource densities yi(t) (i = 1,2,3). y_1* is a computed equilibrium of the first resource. (B) Weighted number of consumers . is a computed equilibrium of .
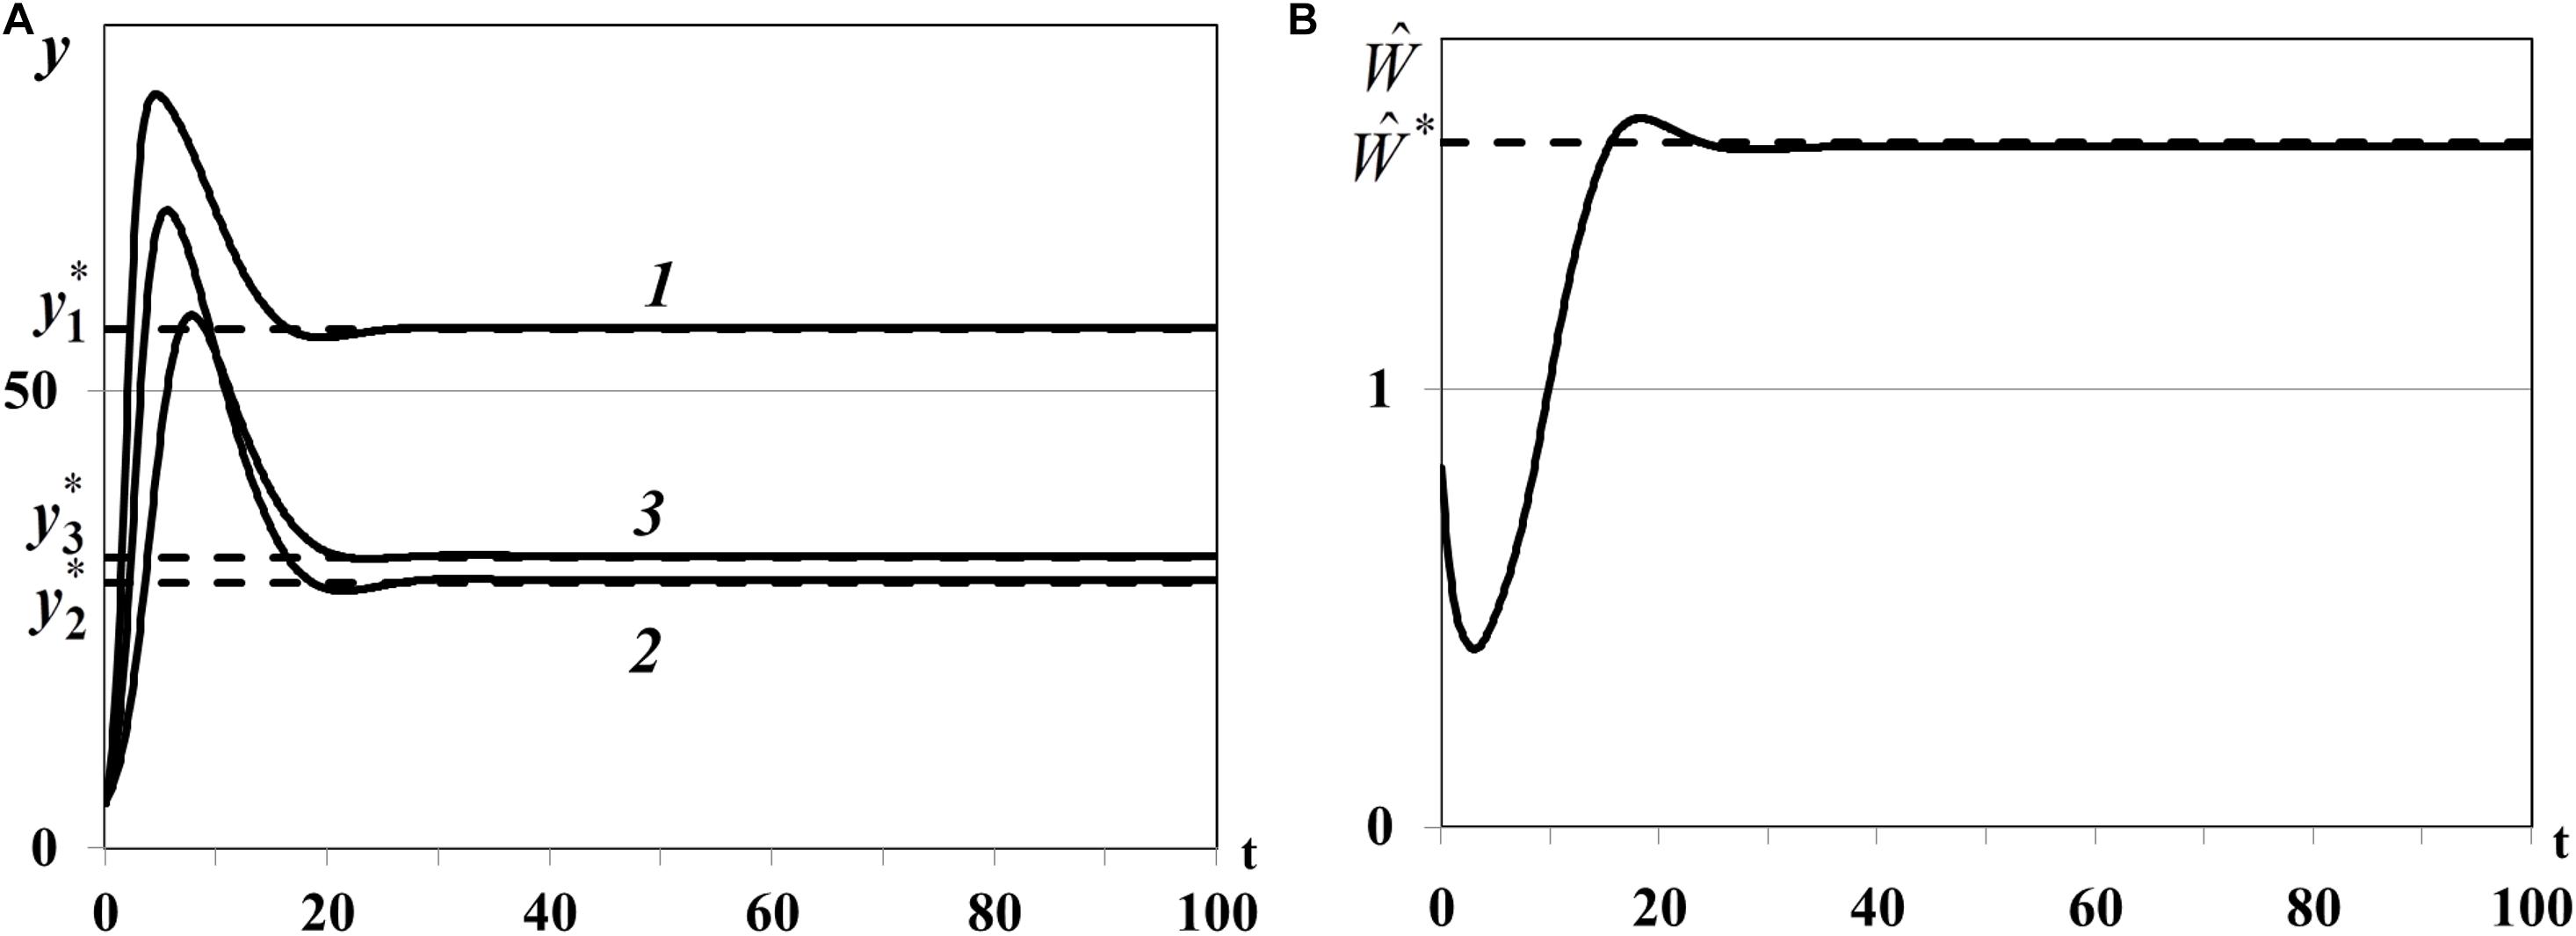
Figure 10. (A) Case (iv). Resource densities yi(t) (i = 1,2,3). y_1* is a computed equilibrium of the i-th resource, i = 1,2,3. (B) Weighted number of consumers . is a computed equilibrium of .
Conclusion and Discussion
In this work an autonomous system was studied–a resource-consumer model in a heterogenous environment consisting of several food patches with active resource. Food resources do not disperse between patches, while consumers do disperse. The model of food resources is unstructured while the model of consumer population is age-structured. The relationship between the consumed food resource and consumer demographic parameters (fertility and death rates) is modeled by means of a calorie intake rate that describes the amount of energy obtained by consumer at a given age from all food patches per unit of time. In biological applications calorie intake rate can be obtained from the observations, or foraging experiments focusing on age-structured consumer behavior. The consumer calorie intake rate is proportional to the saturated intake rate (where the coefficient of saturation is a behavioral parameter of food resource) and depends on the time period a consumer needs to handle and digest a unit of resource (delayed parameter). Thus, the model considered in this paper extends the classic apparent competition models (Holt, 1984; Holt and Kotler, 1987; Holt and Lawton, 1993; Holt et al., 1994; Křivan, 2014) to a structured consumer population with time delay and active food resources.
All types of possible equilibria: trivial (depleted all n resource patches and extinct consumer population), semi-trivial (abundant all n resource patches with satiated density and extinct consumer population), and non-trivial equilibria (food web with at least one non-depleted patch, at most (n−1) depleted patches and consumer population) were studied. All theorems used a new condition of sign-preserving partial derivatives of calorie intake rate-dependent fertility and mortality rates of consumer: , . The trivial and semi-trivial equilibria of the nonlinear autonomous system always exist while the non-trivial equilibria exist if and only if the basic reproduction number of the consumer population R = 1. Since this condition leads actually to a complex nonlinear equation, derivation of conditions for the existence of non-trivial equilibria in practice is not an easy problem. For facilitation of this problem, the additional sufficient conditions for existence of the nontrivial equilibria were obtained in this paper in the form of simple constraints on the coefficients of the autonomous system.
The conditions of local asymptotic stability/instability of trivial and semi-trivial equilibrium were formulated in terms of the consumer’s basic reproduction number. These conditions were derived on the basis of the perturbation theory and linearization methods. Unfortunately, the well-known stability indicator of equilibria of nonlinear age-structured models–partial derivative of density-dependent basic reproduction number of consumer population (Cushing, 1998; Akimenko and Křivan, 2018) cannot be used for stability analysis of nontrivial equilibria of resource-consumer model with depleted patches. Instead of it, the conditions of instability/local asymptotic stability of nontrivial equilibria with several or without depleted resource patches were obtained in the form of additional restrictions on coefficients of system. As expected, the time-delay parameter, the consumer’s digestion period does not cause local asymptotical instabilities of consumer population at the trivial, semi-trivial or nontrivial equilibria.
The dynamical regimes of autonomous system with the different values of time-delay parameter were studied in numerical experiments for illustration of the obtained theoretical results. In the 1st and 2nd groups of experiments (Figures 1–6) the local asymptotic stability/instability of the trivial and semi-trivial equilibria, consumer population outbreaks, extinct and non-extinct quasi-periodic dynamic regimes were obtained for the different values of the time delay parameter. The processes of resource handle and food digestion are inherent for all biological organisms, although the value of handling and digestion period can significantly differ among species. Numerical experiments showed that digestion period of generalist consumer τ does not cause the local asymptotical instabilities or high-frequency oscillations (deterministic chaos) of consumer population in the vicinity of semi-trivial equilibrium.
In the 3rd and 4th groups of experiments (Figures 7–10) we study the local asymptotic stability/instability of the nontrivial equilibria of system with one generalist consumer and one non-depleted and two depleted resource patches (3rd group), three non-depleted resource patches (4th group). The numerical results showed that if there exists the non-trivial equilibrium positive solution of equation , which satisfies condition for all depleted patches (i ∈ I0) and for all non-depleted patches (i ∈ I+) such equilibrium is always locally asymptotically stable. The coefficient of saturation (behavioral characteristic of a food resource) αi plays an important role in this criterion: if the corresponding i-th patch cannot be depleted in the asymptotically stable equilibrium of a food web. Thus, the numerical experiments illustrated and confirmed all theoretical results obtained in paper.
The theoretical results obtained in this work can be applied, for example, to study: (i) metapopulation dynamics that include the prey-predator interactions (Nakazawa, 2015; Becker and Hall, 2016); (ii) desert locust–food resource population dynamics with non-active resource (αi = 0) (Guttal et al., 2012; Akimenko and Piou, 2018); (iii) the predator-dependent functional responses and prey-predator interaction strengths in a natural food web in fisheries (Essington and Hansson, 2004; Smith and Smith, 2020), and many others.
Data Availability Statement
The datasets generated for this study are available on request to the corresponding author.
Author Contributions
The author confirms being the sole contributor of this work and has approved it for publication.
Conflict of Interest
The author declares that the research was conducted in the absence of any commercial or financial relationships that could be construed as a potential conflict of interest.
Acknowledgments
I would like to acknowledge Vlastimil Krivan, Cyril Piou, and referees for the helpful and valuable comments and suggestions to the topic of manuscript. This manuscript has been released as a pre-print at bioRxiv (Akimenko, 2020) (VA, Stability Analysis of Delayed Age-structured Resource-Consumer Model of Population Dynamics with Saturated Intake Rate. BioRxiv.doi.org/10.1101/2020.01.10.901629).
Supplementary Material
The Supplementary Material for this article can be found online at: https://www.frontiersin.org/articles/10.3389/fevo.2021.531833/full#supplementary-material
References
Abbott, K. C., and Dwyer, G. (2007). Food limitation and insect outbreaks: complex dynamics in plant–herbivore models. J. Anim. Ecol. 76, 1004–1014. doi: 10.1111/j.1365-2656.2007.01263.x
Abrams, P. A., Holt, R. D., and Roth, J. D. (1998). Apparent competition or apparent mutualism? Shared predation when population cycle. Ecology 79, 201–212. doi: 10.1890/0012-9658(1998)079[0201:acoams]2.0.co;2
Akimenko, V. V. (2017a). An age-structured SIR epidemic model with the fixed incubation period of infection. Comput. Math. Appl. 73, 1485–1504. doi: 10.1016/j.camwa.2017.01.022
Akimenko, V. V. (2017b). Asymptotically stable states of non-linear age-structured monocyclic cell population model I. Travelling wave solution. Math. Comput. Simul. 133, 2–23. doi: 10.1016/j.matcom.2015.06.004
Akimenko, V. V. (2017c). Asymptotically stable states of non-linear age-structured monocyclic cell population model II. Numerical simulation. Math. Comput. Simul. 133, 24–38. doi: 10.1016/j.matcom.2015.06.003
Akimenko, V. V. (2017d). Nonlinear age-structured models of polycyclic population dynamics with death rates as a power functions with exponent n. Math.Comput. Simul. 133, 175–205. doi: 10.1016/j.matcom.2016.08.004
Akimenko, V. V. (2020). Stability analysis of delayed age-structured resource-consumer model of population dynamics with saturated intake rate. BioRxiv [Preprint] doi: 10.1101/2020.01.10.901629
Akimenko, V. V., and Anguelov, R. (2017). Steady states and outbreaks of two-phase nonlinear age-structured model of population dynamics with discrete time delay. J. Biol. Dynam. 11, 75–101. doi: 10.1080/17513758.2016.1236988
Akimenko, V. V., and Křivan, V. (2018). Asymptotic stability of delayed predator age-structured population models with an Allee effect. Math. Biosci. 306, 170–179. doi: 10.1016/j.mbs.2018.10.001
Akimenko, V. V., and Piou, C. (2018). Two-compartment age-structured model of solitarious and gregarious locust population dynamics. Math. Meth. Appl. Sci. 41, 8636–8672. doi: 10.1002/mma.4947
Becker, D. J., and Hall, R. J. (2016). Heterogeneity in patch quality buffers metapopulations from pathogen impacts. Theor. Ecol. 9, 197–205. doi: 10.1007/s12080-015-0284-6
Beddington, R. (1975). Mutual interference between parasites or predators and its effect on searching efficiency. J. Animal Ecol. 44, 331–340. doi: 10.2307/3866
Bekkal-Brikci, F., Boushaba, K., and Arino, O. (2007). Nonlinear age structured model with cannibalism, Discrete Contin. Dyn. Syst. Ser. B 7, 201–218. doi: 10.3934/dcdsb.2007.7.201
Capasso, V., and Serio, G. (1978). A generalization of the Kermack-Mckendrick deterministic epidemic model. Math. Biosci. 42, 43–61. doi: 10.1016/0025-5564(78)90006-8
Cushing, J. M., and Saleem, M. (1982). A consumer prey model with age structure. J. Math. Biol. 14, 231–250.
de Ross, A. M., and Persson, L. (2013). Population and Community Ecology of Ontogenetic Development. Princeton: Princeton University Press.
DeAngelis, D. L., Goldstein, R. A., and O’Neil, R. V. (1975). A model for trophic interaction. Ecology 56, 881–892.
Elderkin, R. H. (1985). Nonlinear, globally age-dependent population models: some basic theory. J. Math. Anal. Applic. 108, 546–562. doi: 10.1016/0022-247x(85)90044-7
Essington, T. E., and Hansson, S. (2004). Predator-dependent functional responses and interaction strengths in a natural food web. Can. J. Fish. Aquat. Sci. 61, 2215–2226. doi: 10.1139/f04-146
Gourley, S. A., and Kuang, Y. (2004). A stage structured consumer-prey model and its dependence on maturation delay and death rate. J. Math. Biol. 49, 188–200.
Gurtin, M. E., and Maccamy, R. C. (1974). Nonlinear age-dependent population dynamics. Arch. Ration. Mech. Anal. 54, 281–300.
Gurtin, M. E., and MacCamy, R. C. (1979). Some simple models for nonlinear age-dependent population dynamics. Math. Biosci. 43, 199–211. doi: 10.1016/0025-5564(79)90049-x
Guttal, V., Romanczuk, P., Simpson, S. J., Sword, G. A., and Couzin, I. D. (2012). Cannibalism can drive the evolution of behavioural phase polyphenism in locusts. Ecol. Lett. 15, 1158–1166. doi: 10.1111/j.1461-0248.2012.01840.x
Han, Q., Chen, L., and Jiang, D. (2017). A note on the stationary distribution of stochastic SEIR epidemic model with saturated incidence rate. Sci. Rep. 7:3996.
Holt, R. D. (1977). Predation, apparent competition, and the structure of prey communities. Theor. Popul. Biol. 12, 197–229. doi: 10.1016/0040-5809(77)90042-9
Holt, R. D. (1984). Spatial heterogeneity, indirect interactions, and the coexistence of prey species. Amer. Natur. 124, 377–406. doi: 10.1086/284280
Holt, R. D., Grover, J., and Tilman, D. (1994). Simple rules to interspecific dominance in system with exploitative and apparent competition. Amer. Natur. 144, 741–771. doi: 10.1086/285705
Holt, R. D., and Kotler, B. P. (1987). Short-term apparent competition. Amer.Natur. 130, 412–430. doi: 10.1086/284718
Holt, R. D., and Lawton, J. H. (1993). Apparent competition and enemy-free space in insect host-parasitoid communities. Amer. Natur. 142, 623–645. doi: 10.1086/285561
Hoppensteadt, F. (1975). “Mathematical theory of population: demographics, genetics and epidemics,” in Proceedings of the CBMS-NSF Regional Conference Series in Applied Mathematics, (Philadelphia, PA: SIAM).
Hritonenko, N., and Yatsenko, Y. (2007). The structure of optimal time- and age-dependent harvesting in the Lotka–McKendrik population model. Math. Biosci. 208, 48–62. doi: 10.1016/j.mbs.2006.09.008
Kolmogorov, A. N., and Fomin, S. V. (1999). Elements of the Theory of Functions and Functional Analysis. New York, NY: Dover Publications.
Křivan, V. (2003). Competitive coexistence caused by adaptive consumers. Evol. Ecol. Res. 5, 1163–1182.
Křivan, V. (2014). Competition in di- and tri-trophic food web modules. J. Theor. Biol. 343, 127–137. doi: 10.1016/j.jtbi.2013.11.020
Křivan, V., and Eisner, J. (2006). The effect of the Holling type II functional response on apparent competition. Theor. Popul. Biol. 70, 421–430. doi: 10.1016/j.tpb.2006.07.004
Levin, S. A. (1970). Community equilibria and stability: an extension of the competitive exclusion principle. Am. Nat. 104, 413–423. doi: 10.1086/282676
Liu, Z., Guo, C., Li, H., and Zhao, L. (2019). Analysis of a nonlinear age-structured tumor cell population model. Nonlinear Dyn. 98, 283–300.
Martinez, N. D. (1991). Artefacts or attributes? Effects of resolution on the little rock lake food web. Ecol. Monogr. 61, 367–392. doi: 10.2307/2937047
Martsenyuk, V., Klos-Witkowska, A., and Sverstiuk, A. (2018). Stability, bifurcation and transition to chaos in a model of immunosensor based on lattice differential equation with delay, Electron. J. Qual. Theory Differ. Equ. 27, 1–31. doi: 10.14232/ejqtde.2018.1.27
Metz, J. A. J., and Diekmann, O. (1986). The Dynamics of Physiologically Structured Populations. Berlin: Springer-Verlag.
Mohr, M., Barbarossa, M. V., and Kuttler, C. (2014). Consumer-prey interactions, age structures and delay equations. Math. Model. Nat. Phenom. 9, 92–107. doi: 10.1051/mmnp/20149107
Nakazawa, T. (2015). Introducing stage-specific spatial distribution into the Levins metapopulation model. Sci. Rep. 5:7871. doi: 10.1038/srep07871
Qiu, Z. P., Yu, J., and Zou, Y. (2004). The asymptotic behavior of a chemostat model with the Beddington-DeAngelis functional response. Math. Biosci. 187, 175–187. doi: 10.1016/j.mbs.2003.10.001
Richardson, M. L., Mitchell, R. F., Reagel, P. F., and Hanks, L. M. (2010). Causes and consequences of cannibalism in noncarnivorous insects. Annu. Rev. Entomol. 55, 39–53. doi: 10.1146/annurev-ento-112408-085314
Shi, J. (2013). “Absolute stability and conditional stability in general delayed differential equations,” in Advances in Interdisciplinary Mathematical Research, ed. B. Toni (New York, NY: Springer), 117–131. doi: 10.1007/978-1-4614-6345-0_5
Smith, B. E., and Smith, L. A. (2020). Multispecies functional responses reveal reduced predation at high prey densities and varied responses among and within trophic groups. Fish. Fish. 21, 891–905. doi: 10.1111/faf.12468
Von Foerster, H. (1959). “Some remarks on changing populations,” in The Kinetics of Cellular Proliferation, ed. F. Stohlman (New York, NY: Grune and Stratton), 382–407.
Vrkoc, I., and Krivan, V. (2015). Asymptotic stability of tri-trophic food chains sharing a common resource. Math. Biosci. 270, 90–94. doi: 10.1016/j.mbs.2015.10.005
Wang, W., and Zhao, X.-Q. (2004). An epidemic model in a patchy environment. Math. Biosci. 190, 97–112. doi: 10.1016/j.mbs.2002.11.001
Webb, G. F. (2008). “Population models structured by age, size and spatial position,” in Structured Population Models in Biology and Epidemiology, Lecture Notes in Mathematics, eds P. Magal and S. Ruan (Berlin: Springer), 1–49. doi: 10.1007/978-3-540-78273-5_1
Williams, R. J., and Martinez, N. D. (2004). Stabilization of chaotic and non-permanent food-web dynamics. Eur. Phys. J. B 38, 297–303. doi: 10.1140/epjb/e2004-00122-1
Wootton, J. T. (1997). Estimates and tests of per capita interaction strength: diet, quantity, and impact of intertidally foraging birds. Ecol. Monographs 67, 45–64. doi: 10.1890/0012-9615(1997)067[0045:eatopc]2.0.co;2
Keywords: age-structured model, saturated intake rate, stability analysis, digestion period, resource-consumer model
Citation: Akimenko VV (2021) Stability Analysis of Delayed Age-Structured Resource-Consumer Model of Population Dynamics With Saturated Intake Rate. Front. Ecol. Evol. 9:531833. doi: 10.3389/fevo.2021.531833
Received: 01 February 2020; Accepted: 18 January 2021;
Published: 18 February 2021.
Edited by:
John Maxwell Halley, University of Ioannina, GreeceReviewed by:
Leonardo Montagnani, Free University of Bozen-Bolzano, ItalyLuís Borda-de-Água, Universidade do Porto, Portugal
Copyright © 2021 Akimenko. This is an open-access article distributed under the terms of the Creative Commons Attribution License (CC BY). The use, distribution or reproduction in other forums is permitted, provided the original author(s) and the copyright owner(s) are credited and that the original publication in this journal is cited, in accordance with accepted academic practice. No use, distribution or reproduction is permitted which does not comply with these terms.
*Correspondence: Vitalii V. Akimenko, dml0YWxpaWFrbUBnbWFpbC5jb20=