
94% of researchers rate our articles as excellent or good
Learn more about the work of our research integrity team to safeguard the quality of each article we publish.
Find out more
ORIGINAL RESEARCH article
Front. Ecol. Evol., 25 January 2021
Sec. Phylogenetics, Phylogenomics, and Systematics
Volume 8 - 2020 | https://doi.org/10.3389/fevo.2020.617948
This article is part of the Research TopicAssessing Biodiversity in the Phylogenomic EraView all 10 articles
Environmental DNA metabarcoding is a tool with increasing use worldwide. The uses of such technology have been validated several times for diversity census, invasive species detection, and endangered/cryptic/elusive species detection and monitoring. With the help of this technology, water samples collected (n = 37) from several main river basins and other water bodies of the northern part of Colombia, including the Magdalena, Sinú, Atrato, and San Jorge river basins, were filtered and analyzed and processed using universal 12S primers for vertebrate fauna and NGS. Over 200 native taxa were detected, the majority of them being fish species but also including amphibia, reptiles, and several non-aquatic species of birds and mammals (around 78, 3, 2, 9, and 8%, respectively). Among the matches, vulnerable, and endangered species such as the catfish Pseudoplatystoma magdaleniatum and the Antillean manatee (Trichechus manatus) were detected. The manual revision of the data revealed some geographical incongruencies in classification. No invasive species were detected in the filters. This is, to our knowledge, the first time this technique is used in rivers of the country and this tool promises to bring advances in monitoring and conservation efforts, since its low cost and fast deployment allows for sampling in small periods of time, together with the fact that it can detect a wide range of species, allows for a new way of censing the vertebrate diversity in Colombia. Diversity analysis showed how the species identified using this method point to expected community structure although still much needs to be improved in rates of detection and genomic reference databases. This technique could be used in citizen science projects involving local communities in these regions.
The term environmental DNA (eDNA) has been used to make reference to the DNA collected from microbial organisms in sediments (Ogram et al., 1987). However with the development of better tools for sequencing and analyzing large amounts of information it was possible to adapt both the technique and the definition to all the DNA found in large environmental samples, both for micro and macroorganisms (Venter et al., 2004; Ficetola et al., 2008). Samples now may come from a wide variety of sources including water, soil, air and feces but most studies have focused on water samples (Drummond et al., 2015; Johnson et al., 2019; Sousa et al., 2019; Yates et al., 2019).
Although it existed well-before this millennium (Ogram et al., 1987), most of the development of this technique (environmental DNA analyses from water samples) occurred in the last 15 years and is already showing important results for species detection and diversity analysis (Ficetola et al., 2008; Jerde et al., 2011; Phalen et al., 2011; Hunter et al., 2015, 2018; Bakker et al., 2017; Castelblanco-Martínez et al., 2018; Tsuji et al., 2019; Yates et al., 2019). Most of these studies have been performed in Europe, Japan or North America (Myers et al., 2000; Arbeláez-Cortés, 2013; Habel et al., 2019). However, the most biodiverse areas in the planet are in developing countries (Myers et al., 2000) and little representation of these places is found among eDNA studies (Sales et al., 2019).
Studying the diversity of an area has always been troublesome, particularly when such areas are of difficult access. The Colombian biodiversity began to be studied with the royal botanical expedition of the New Granada in the late eighteenth century and have been occurring to this day. Increased knowledge has been available in later years by having higher access to previously unreachable locations (due to environmental conditions and safety concerns) and expanding the basis of biological knowledge through biodiversity inventories (Ayala López et al., 2018). While there is a high interest in reaching and studying all the regions of Colombia, keeping updated data from every corner of the country has been a less valued objective. Time, funding, and trained personnel are required in order for these tasks to be completed, and these factors are not as in developed countries. Basic abundance and distribution data remains relevant regardless of the place for reasons including protected areas research and evaluation of human impact on ecosystems evaluation (Pearce and Boyce, 2006; Leathwick et al., 2008; Bakker et al., 2017).
Environmental DNA metagenomics analysis has helped in the study of entire communities (Handley et al., 2019; Nichols and Marko, 2019), specific taxonomic groups (Ostberg et al., 2019), rare/cryptic species (Sakai et al., 2019), vulnerable species (Hunter et al., 2018), and also invasive species (Hunter et al., 2015; Robinson et al., 2019) making it an ideal tool to work on distribution censuses of many taxa. Presence/absence measures are now possible but abundance measures are still not entirely achievable since correct estimations of abundance based on eDNA are not precise enough currently, due to primer sensitivity to target DNA, seasonal variation of eDNA and environmental factors that diminish the correlation between eDNA and abundance (Bylemans et al., 2019; Yates et al., 2019).
For many regions of Colombia, eDNA metabarcoding may be a reliable source of initial information to improve existing biodiversity information by updating or completing it. The easiness with which this technique can be applied in a waterbody could help biologist, local governments, local communities, and NGOs to better understand the natural treasure found in these places. However, since there is only one previous study with this technique in Colombia [focused on tropical reef fish (Polanco Fernández et al., 2020)], much of the information will be hard to compare even with previously obtained data since there is not much genetic information available and databases with said information for comparisons may be incomplete. Other challenges include the physical and chemical properties of the water itself and the preservation methods used in order to obtain good results (Strickler et al., 2015; Sales et al., 2019; Tsuji et al., 2019).
With all of the above in mind, we present initial information on data collected of several water bodies from four river basins in the northern part of Colombia. The general objective was to collect the first diversity data using eDNA metabarcoding in rivers and water bodies from northern Colombia and to explore its opportunities to detect rare, endangered, invasive and cryptic species.
Two field trips were made in 2019 to the Magdalena, San Jorge and Sinú river basins and to the Atrato river basin (from July 11th to July 20th and October 31st to November 4th, respectively). The chosen places consisted of water bodies and rivers from the four main river basins in northern Colombia-Caribbean region. Several locations required access via canoe or other type of aquatic transportation since all samples were collected from a boat. Figure 1 presents sampling locations in three main river basins of northern Colombia. Additionally, saltwater samples were taken at Cispatá Bay, and a positive control was made at the lake in the Number 1 marine infantry mobility battalion, for known communities. Figure 2 presents the four locations where sampling was made in the gulf of Urabá with samples from the Atrato river basin.
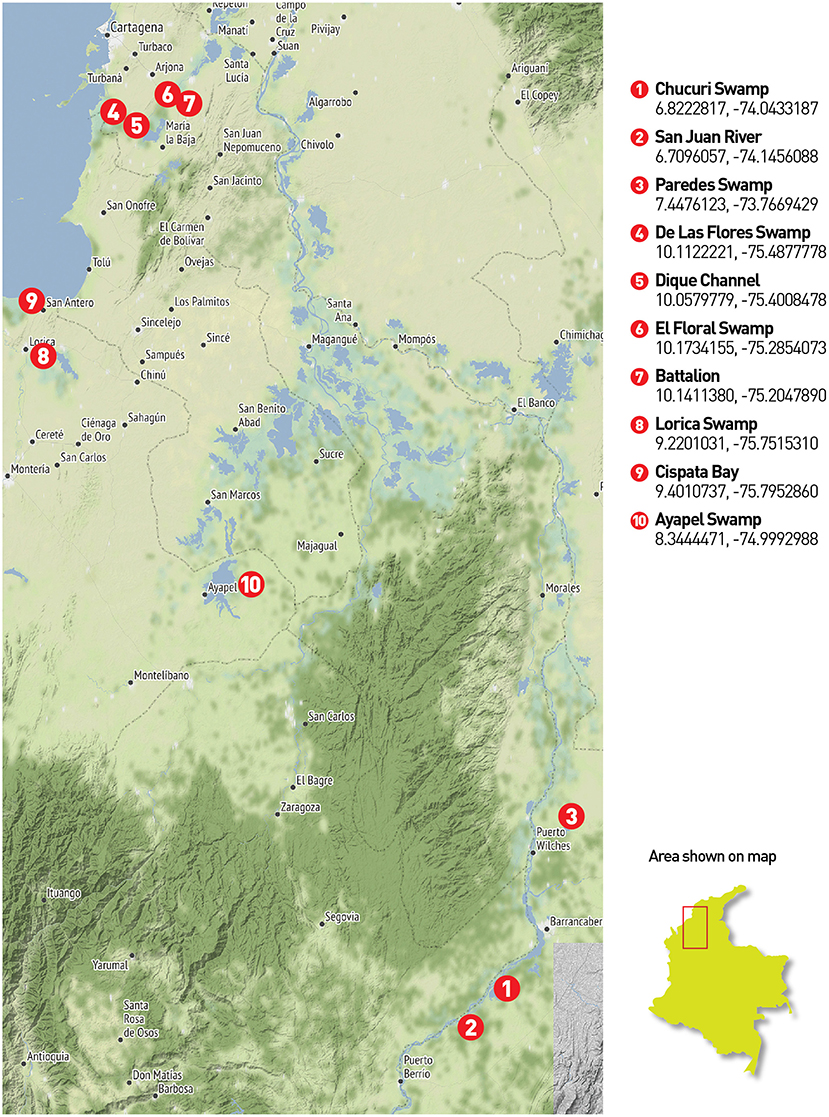
Figure 1. Northern Colombia sampling places: Twenty-five (25) eDNA filters were collected across 10 locations in the central northern region of Colombia. The first three places belong to the middle Magdalena basin. The Chucuri swamp (1) and the San Juan River (2) used 3 filters while the Paredes swamp (3) was sampled with four filters. Samples 4 to 7 belong to the Canal del Dique region where the Magdalena river is deviated from its natural flow. Samples were taken directly in the canal (5) in two of the adjacent and connected swamps (4 and 6) and an artificial lake in the Nr 1 marine infantry mobility battalion (7) for a total of 6 filters between all these places. Sample 8 corresponds to the Lorica swamp (Sinú river basin), sample 9 to the Cispatá bay and sample 10 to the Ayapel swamp as part of the San Jorge river basin (3 filters each).
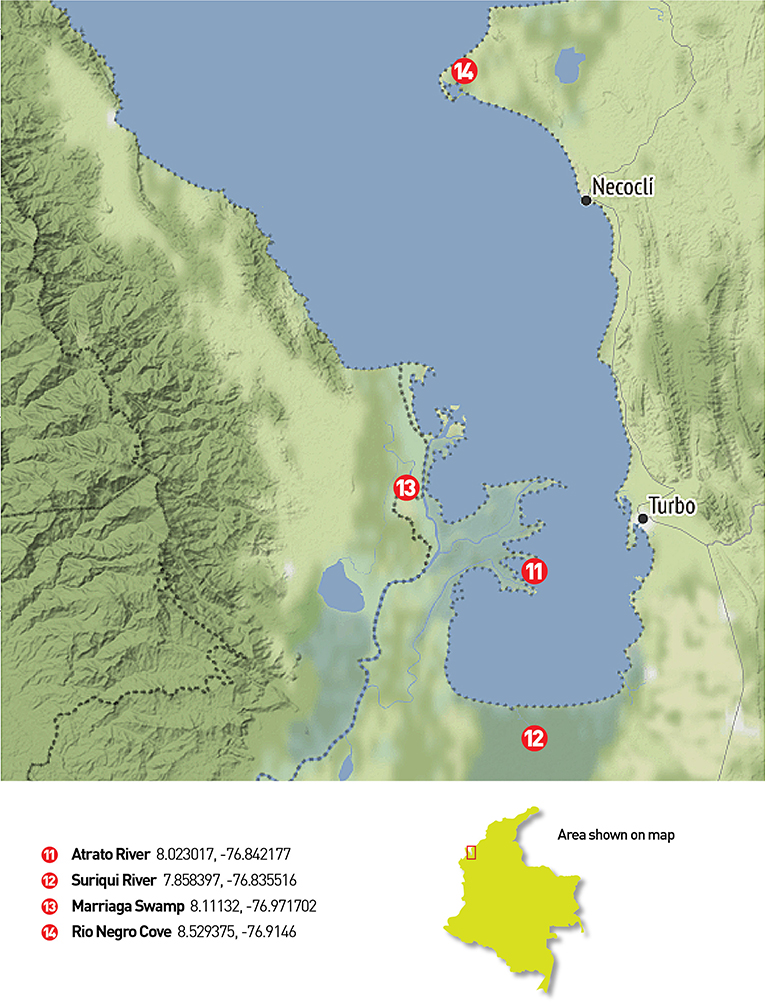
Figure 2. Gulf of Urabá sampling places: 12 filters were collected in the Gulf of Urabá. The first three were taken on one of the Atrato river arms near its end (11), the next four were taken in the Suriquí river and its secondary channels (12), other four filters were used at the Marriaga swamp (13) and the last filter was used near the Rio Negro Cove in the northeastern part of the Gulf (14).
At each sampling location, up to seven, one-liter (1 L) subsamples of water were pooled in a bucket covered with a sterile plastic bag. Each sample was taken from surface water or up to 1 m depth using a plastic bottle and sterile gloves avoiding the contact of skin with the water to avoid human DNA contamination. Each subsample was collected either 50–200 m upstream when in narrow water channels and rivers or in an area of ~1 km around in a circular transect when in wider water bodies (i.e., swamps). The bottle and bucket were disinfected with 70% alcohol thoroughly (bleach or a more concentrated alcohol were not available at many places and their transport was not viable for many locations) to prevent cross contamination. After taking each sample, the plastic bag was changed for each sampling event to prevent the mixing of water in the bucket. Once all the subsamples were taken the process of filtration began using NatureMetrics eDNA collection kit. The water went through a 0.8 um pore size filter inside a plastic disk until it was clogged, point at which total filtered volume was measured and the kits preservative was added to the filters in order to avoid DNA degradation. Between one and four disks were taken per sampling event due to limited funding to purchase additional filters. Filters were stored in their respective envelopes and later after collection was ended, kept cool in Styrofoam fridges with ice packs until their shipping to NatureMetrics laboratory facilities in England for analysis.
Once the filters arrived in the laboratory, DNA was extracted and purified from each filter using DNeasy Blood and tissue kits (Quiagen). Twelve replicate PCRs for the hyper variable region of the 12S rRNA gene with vertebrate primers (Riaz et al., 2011) were run for each sample/filter. Positive controls were made alongside regular PCRs using mock communities of known non-native fish composition in order to verify sequence quality and also a negative control using only distilled water to detect cross contamination if present. Success of the amplifications was confirmed via gel electrophoresis. All amplicons were purified, and adapters were added before pooling all replicates and sequencing them using Illumina MiSeq at 12pM and a 10% PhiX spike in (Miseq V2 2x250 cartridges were used for this process) Sequences were processed using custom bioinformatic pipelines for quality filtering, denoising, and clustering at 99% similarity. Read pairs were merged with usearch v11 (Edgar, 2010) and only keeping pairs with at least 80% agreement in the overlapping region. Cutadapt 2.3 (Martin, 2011) was used to remove primers and short sequences. Quality filter was performed with usearch at an expected error rate of 0.001 and after that they were dereplicated. For the denoising step, unoise was used (Edgar, 2016) and also were clustered at 99%. OTUs were taxonomically assigned to species, genus, family order or class by searching for similarities with the NCBI nucleotide database (GenBank) and PROTAX. Species with matches of 99% or higher similarity and no ambiguity were retained, and genus level matches went through a similar process with matches at 95% similarity or higher. Cases were multiple species were possible, manual check of records of GBIF and IUCN were used to solve the ambiguity. OTUs that were ≥99% similar and hat similar co-occurrence patterns were combined with LULU (Frøslev et al., 2017) and OTUs were relative abundance in the sample was lower than 0.05% or <10 reads (whichever was the higher) were omitted. Human and livestock sequences were also removed. A second run of taxonomical analysis was made in order to search specially for invasive species designated for the country according to current law (Ministerio De Ambiente Territorial Vivienda Y Desarrollo, 2008; Ministerio De Ambiente Vivienda Y Desarrollo, 2010).
R studio (RStudio Team, 2020) (R Project for Statistical Computing, RRID:SCR_001905) version 3.6.0 was used to perform correlation tests among variables of sampling and results and to perform diversity analysis using the vegan package (Oksanen et al., 2019). Diversity indexes (Shannon-Wienner and Simpson) and statistical analysis were used to evaluate alpha diversity and beta diversity was evaluated using Bray-Curtis dissimilarity index. Since tetrapod detections were scarce and not present at each sample unlike fish, community analysis was performed on fish data only, at genus and species level to compare results between detected data with basic geographic corrections (genus level) and data with confirmed accuracy using available data for the sampling locations (species level).
Thirty seven filters were collected at 15 different locations as seen in Figures 1, 2. At each location up to 4 filters were collected. For the 25 samples belonging to the Magdalena, San Jorge and Sinú basins along with the samples from Cispatá bay and the artificial small lake containing a known community (sample 16), 2,695,309 sequences from northern Colombia and 620,828 aditional sequences from the gulf of Urabá were obtained and went through taxonomic assignment resulting in 169 taxa identified. Sixty one of the assigned taxa had a 99% or higher similarity with species reference data and therefore could be assigned up to the aforementioned level. Another 68 taxa could be identified up to the genus level and for the remaining 40, assignment was possible to either family or order (whichever was the lowest possible). Of the 169 taxa, 133 were identified as fish and this group was usually the most abundant taxa in each sample. The remaining 36, belonged to amphibians (4 taxa), birds (16 taxa), mammals (13 taxa), and reptiles (3). Sequencing depth was higher than 10,000 sequences with the exception of the data from samples 25–29 (Table 1).
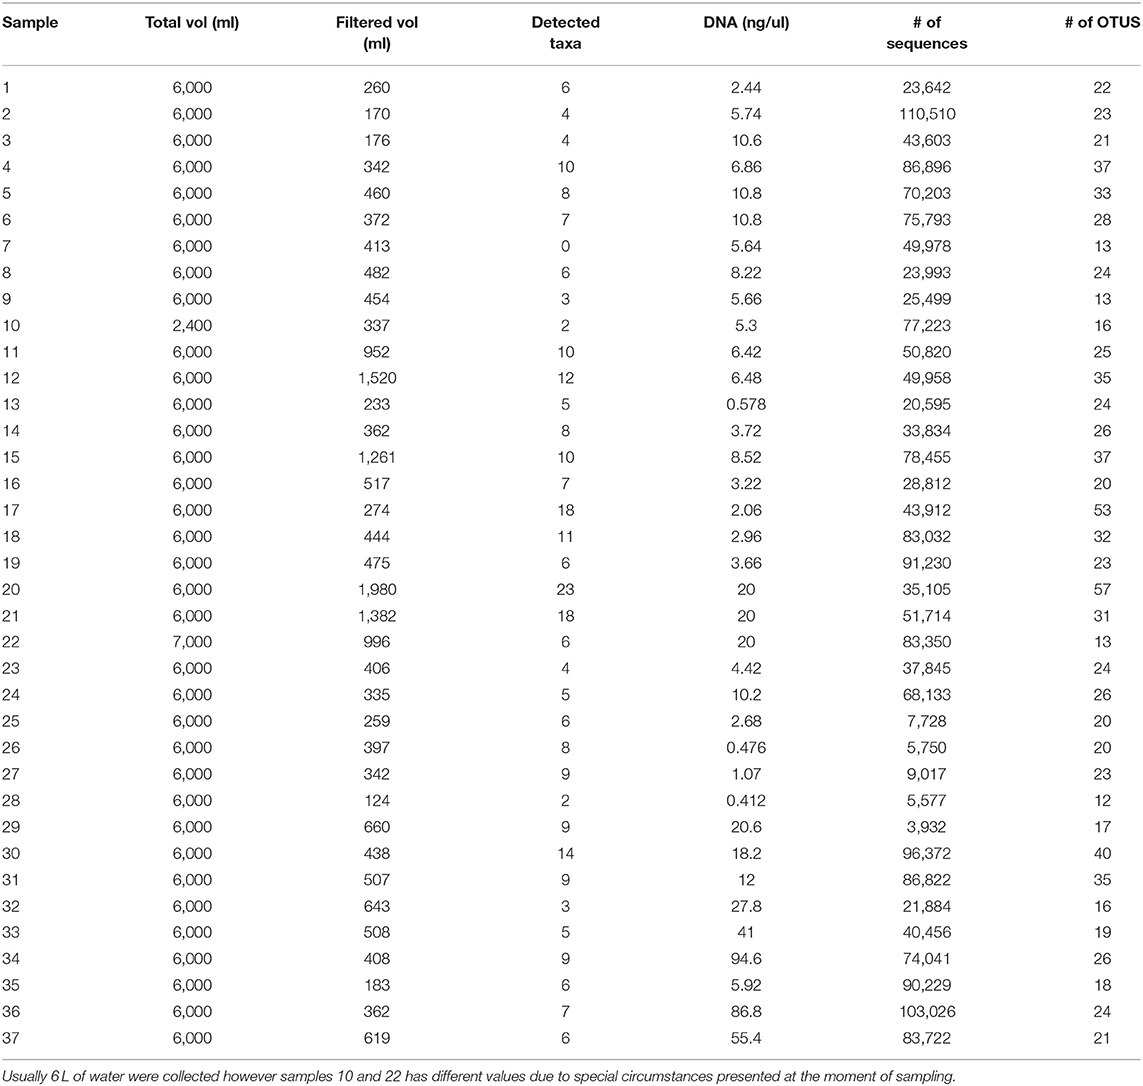
Table 1. Water and DNA collection results: 37 samples of water were collected northern Colombia and filtered in order to extract the DNA and asses the quality of the sample and to correlate it with Taxa detected (Figure 6).
For the remaining 12 samples taken from the Gulf of Urabá and the Atrato river basin (Figure 2), results showed 89 taxa detected in 620,828 high quality sequences. The distribution of taxa between main vertebrate groups and between distinct taxonomical categories followed a similar pattern to previous results. Seventy taxa belonged to fish, three to amphibians, six to birds, eight to mammals, and the remaining two were assigned to reptiles. Of these taxa, 38 could be assigned to species level and 29 more to genus level while the remaining 22 belonged to family (12) and order (10). For both sets of samples, human DNA contamination was present and ranged between 1 to 96.45%.
Community analyses were performed with detected genera of fish (Figure 3A) and also using only OTUs that could be identified to species and matched with previous reports for its presence to contrast the original obtained data against revised filtered information at the smallest taxonomic level possible (Figure 3B). If a detected species did not match any of the current information sources, geographical ranges were checked to decide if it was plausible that it was a new detection (these cases are elaborated further bellow in the discussions) or if it was a misidentification due to genetic similarity to other more plausible species. If this was the case, the detection was only considered up to the genus level. Environmental DNA analysis has been proved to be a reliable source of information for fish communities (Handley et al., 2019; Li et al., 2019; Sales et al., 2019), while other vertebrates detected in this study (i.e., tetrapods) still are mostly occasional detections and therefore are not included in the community analysis. Nonetheless genera and species of tetrapods detected for the sampling locations are also displayed (Figures 4A,B). Alpha diversity was calculated using Shannon and Simpsons indexes in vegan package (Oksanen et al., 2019) in order to present them based on eDNA. Table 2 shows alpha diversity calculated for each of the 37 samples. After testing normality for the samples, beta diversity analysis was calculated using Bray-Curtis dissimilarity as seen in Figure 5. Diversity analysis showed some significant differences at the alpha level (Figures 6A,B). Significant differences were found in both diversity indexes between the Paredes swamp and three other locations: The Canal del Dique (p = 0.027), the Marriaga Swamp (p = 0.029) and the Suriqui river (p = 0.029). Bray Curtis dissimilarity pointed to the highest difference between saltwater and freshwater locations, leaving the Cispata bay (location 9) and the Rio Negro cove (location 14) in a separate branch to the remaining sampling locations, even if they were geographically closer (Figures 1, 2). The Battalion sample (location 7) was also highly different to other locations and on the other extreme, the San Juan river and the Chucurí swamp were the most similar locations despite of the level of taxa used (Figure 5).
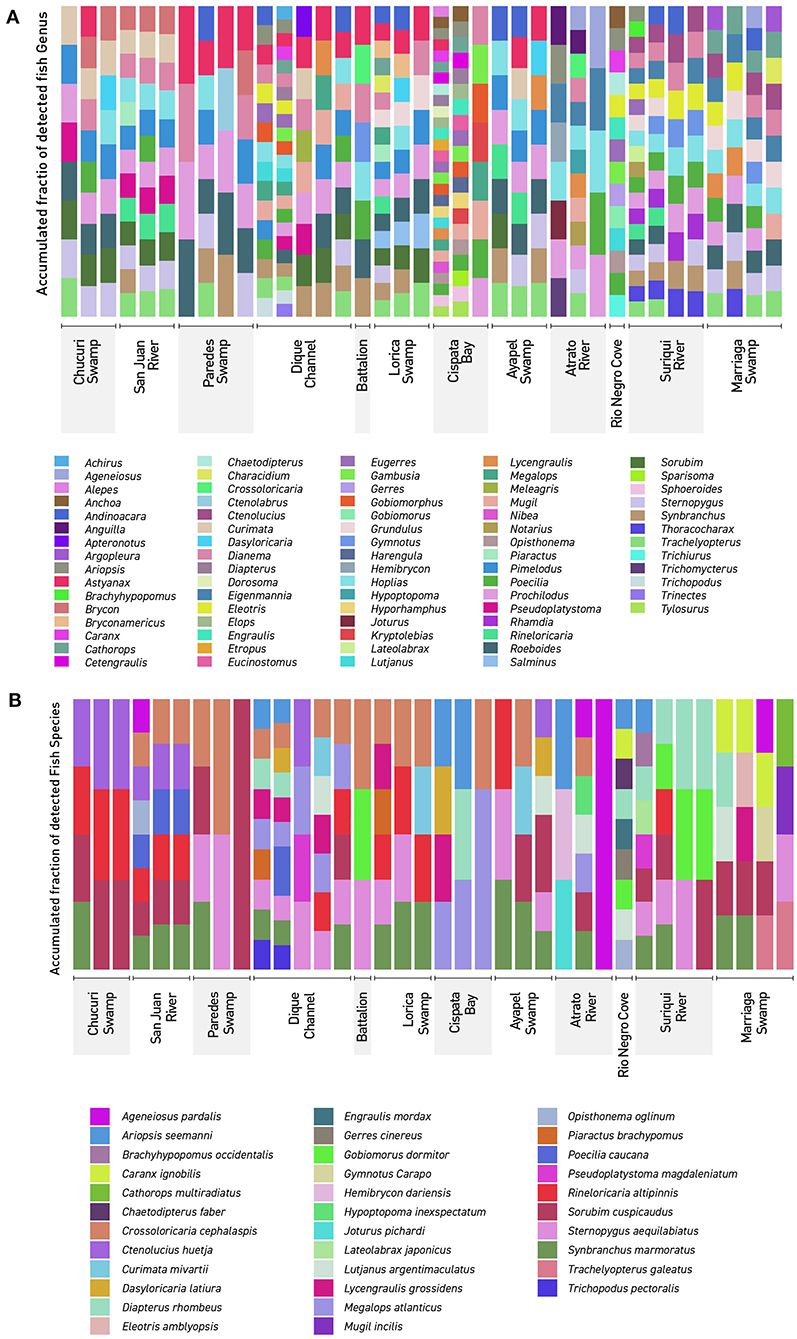
Figure 3. Detected Northern Colombia fish communities: The figure shows every detected fish genera and species using eDNA metabarcoding. Colors don't represent similar lineages or taxa but rather are there to clearly differentiate. (A) Genera detected in the 37 filters used in this work. (B) Species detected in the 37 filters used in this work. Dique Cannel comprises sampling locations 4, 5, and 6.
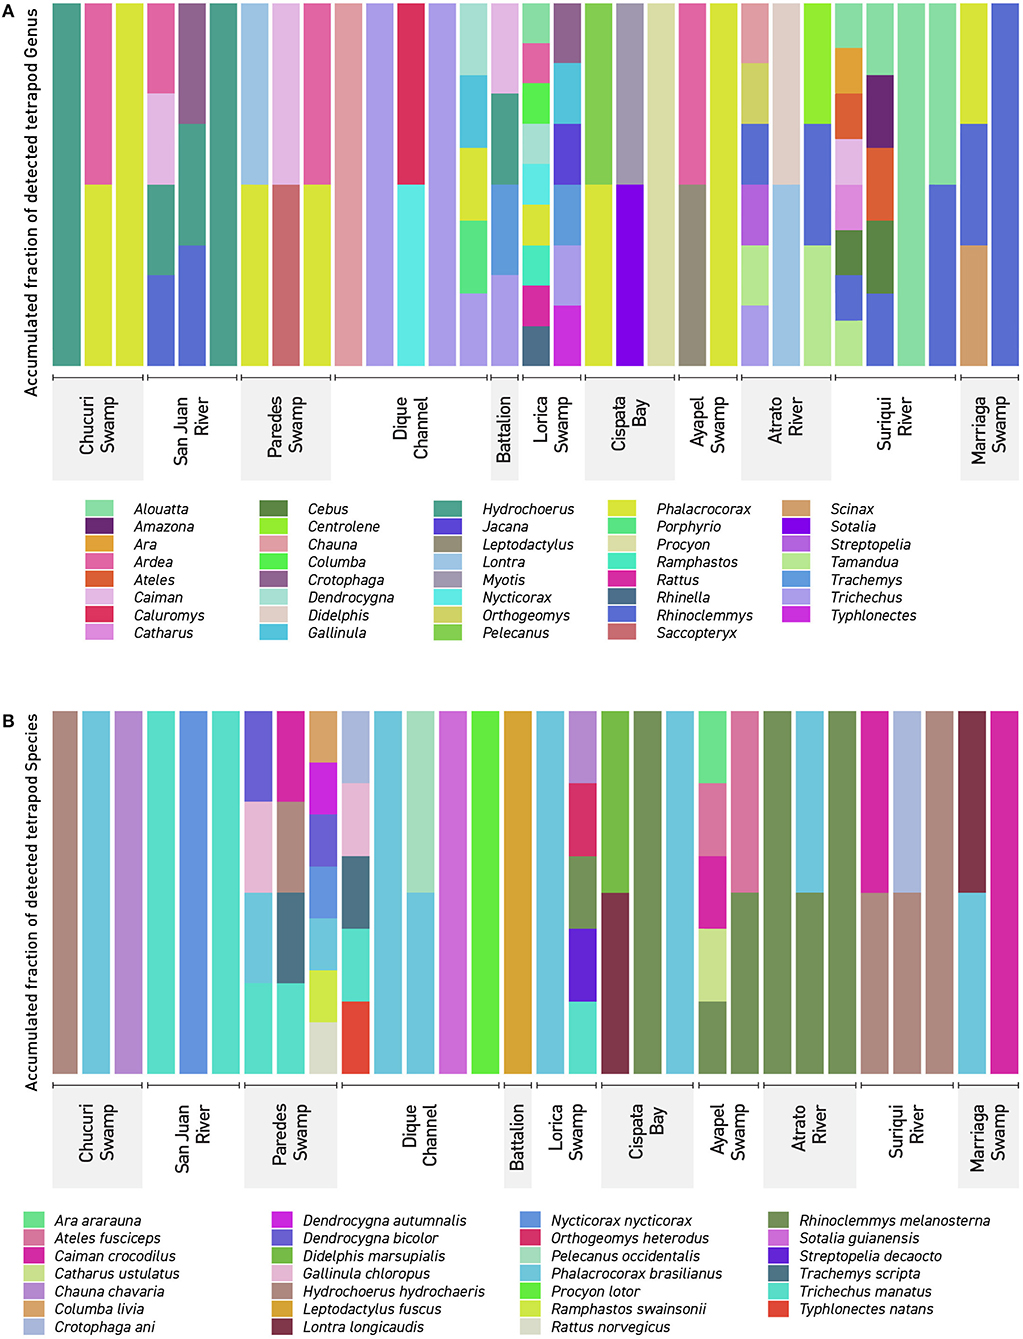
Figure 4. Detected Tetrapods in Northern Colombia: The figure shows every detected tetrapod (A) genera in the 37 filters used in this work. (B) Detected tetrapod species in the 37 filters collected in this work. The names showcased correspond to the sampling locations seen in (Figures 1, 2). Dique Channel comprises sampling locations 4, 5, and 6.
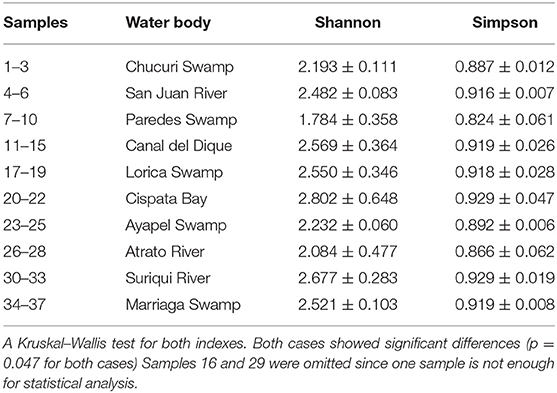
Table 2. Alpha diversity indexes of Shannon and Simpson for each sampling location. Indexes are based on detected fish genera.
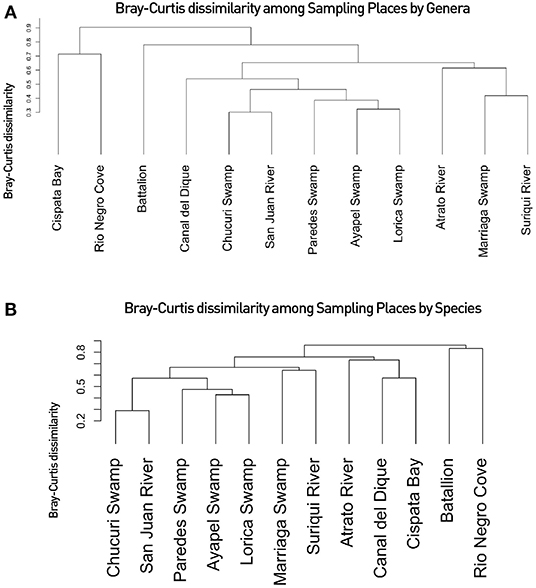
Figure 5. Fish communities of Northern Colombia: The figure shows the beta diversity based on the Bray-Curties dissimilarity Index based on: (A) Confirmed detected fish genera for all 37 filters used in this work. (B) Confirmed detected fish species per filter. The names showcased correspond to the sampling locations seen in (Figures 1, 2). Confirmed detected genera/species indicate that the taxa has been detected both in eDNA filters used for this study and are registered in literature or may be based on habitat ranges. Dique Channel comprises sampling locations 4, 5, and 6.
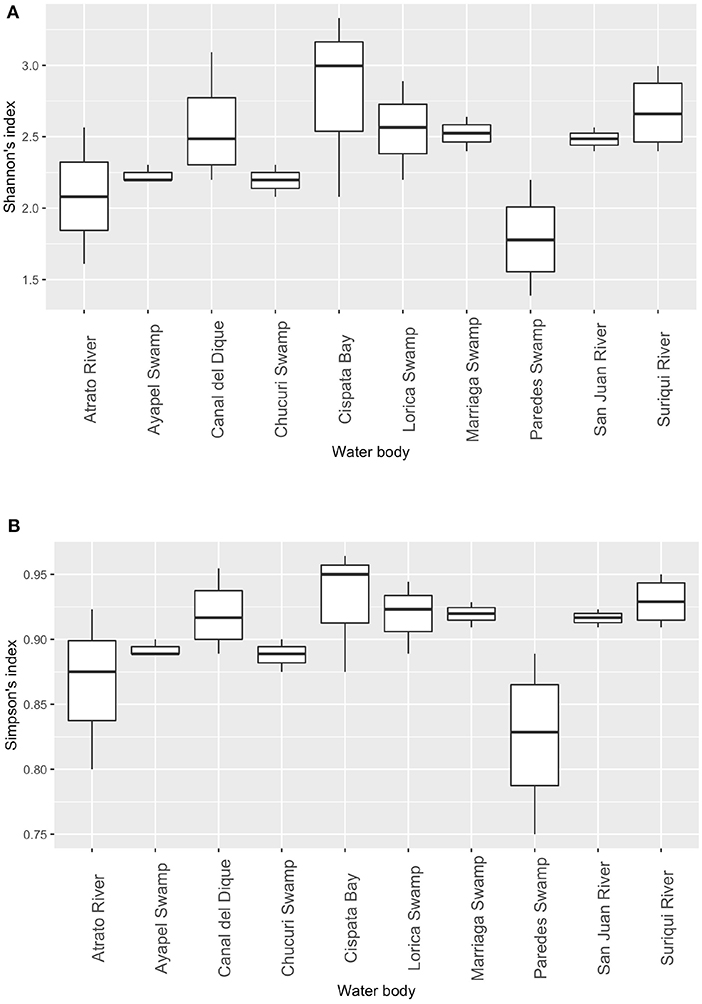
Figure 6. Diversity indexes: Shannon's diversity index between sampling places. Significant differences between sampling locations based on Shannon's diversity index. (A) and Simpson's diversity index (B). Statistical differences for both indexes were detected (Wicoxons Rank Sum test) at an alpha of 0.05 were found between Paredes swamp and the following: Canal del Dique, Marriaga Swamp, and Suriqui river (p = 0.027, 0.029, 0.029, respectively).
Many eDNA studies are coupled with traditional survey techniques since there are still some doubts regarding the usefulness and detection capacity of this technique, and to the fact that false negatives are possible (Pinfield et al., 2019). Still, eDNA as a cheap and efficient alternative for classic diversity census must be explored. Some studies are beginning to only work with filter information (Hunter et al., 2015; Bakker et al., 2017; Pinfield et al., 2019). In this study a small, yet relevant (since it's the one of the first times it is done) number of eDNA samples were taken in several water bodies of the northern Colombia. As expected, most of the results were from fish taxa (Jeunen et al., 2020). The other vertebrate groups showed also in smaller numbers.
Comparisons of the data generated in this study against available data for these sampling regions (Aguilera, 2006; Maldonado-Ocampo et al., 2006; Mojica et al., 2006; Ríos-Pulgarín et al., 2008; Mojica-Figueroa and Díaz-Olarte, 2016; Arango-Sánchez et al., 2019) showed some degree of correlation between available information from traditional sampling techniques and information obtained from eDNA (Table 3). At the genus level, around 60% of the recovered fish genera in the filters matched available information sources and a quarter of the species as well. It is worth mentioning that with the exception of the two swamps (Paredes and Ayapel), the information used to compare with the filters is not exactly of the designated area but rather the smallest range possible that includes the places sampled. In many cases detailed and updated diversity studies for these locations are missing, since long term field studies were not possible due to the internal conflict in the last decades and therefore it should not be seen as a negative result but rather the first on which to build further data obtained using this method. The initially high differences contrasts with studies comparing traditional sampling and eDNA filters, where the species recovered with eDNA were close to be the same amount (or even higher) that normal sampling methods found for groups like fishes, corals and soil eDNA (Drummond et al., 2015; Handley et al., 2019; Nichols and Marko, 2019). In most of these studies, multiple gene primers were designed and tested and or the communities were much smaller in question like in Handley et al. (2019) where the fish community consisted of a total of 16 species where the only two undetected species were lampreys and later the authors explained that these were not detectable through the assay they were using.
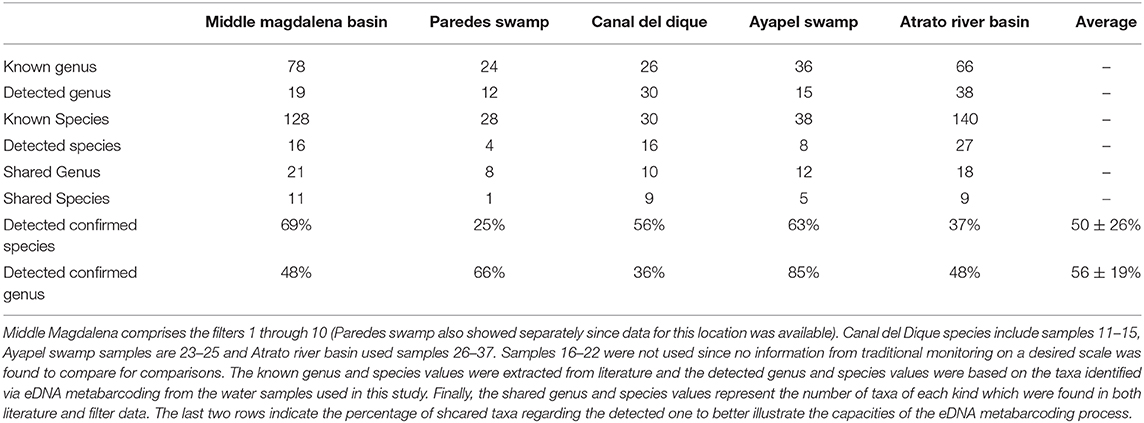
Table 3. Comparison between filter obtained information and available information: 5 places had available information to compare with filter data although filter data had to be joined at times to make a better analysis since not every dataset vas specific for the sampled region in this work.
Several reasons may explain this discrepancy between datasets. As mentioned before, the fact that current information is not specific for the studied areas in most cases, but instead covers larger areas along these basins. Other studies also have encountered problems to detect or assign sequences to species due to issues such as the aforementioned lack of genetic information but also others such as the current sequence and/or specimen being classified to other species. Also there may be a lack of enough genetic variation for the 12S region to separate species (Cilleros et al., 2019; Sales et al., 2021). The most usual solutions to this problems include the use of more than one primer set so that more species can be recovered in the case that some groups are either too genetically similar or do not work well with one primer set (Polanco Fernández et al., 2020; Sales et al., 2020b) or complementing it with other sampling techniques (Cilleros et al., 2019). These solutions however raise costs. Environmental DNA at the scale used in this study can be a useful initial tool for “snapshotting” communities and regions and once initial results are analyzed, further and deeper analysis can be done focusing on specific groups where the 12S primer fails to differentiate at a deeper more desired level, or coupling it with net fishing, electrofishing, toxicants, or trap cameras (Cilleros et al., 2019; Sales et al., 2020b).
The small volumes of filtered water could explain in part of the lack of detection. The total filtered volume varied between 124 and 1,980 ml (Table 1) with the mean being at 542 ml. Figure 7 supports in part this idea, showing that there is a small but significant correlation between filtered volume and total species detected (R = 0.43, p = 0.0081) and also is in accordance with literature (Leduc et al., 2019). Other studies used vacuum pumps or peristaltic pumps instead of manual pumps or syringes like the one used here, since it would increase the amount of filtered water used (Hunter et al., 2015; Baker et al., 2018; Leduc et al., 2019; Wineland et al., 2019).
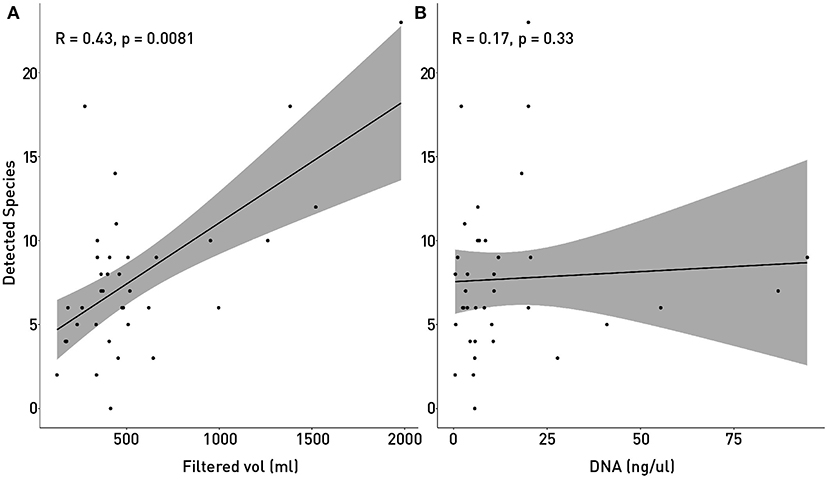
Figure 7. Correlation of detected species with sampling and processing variables: The number of detected and identified species was tested with Spearmans correlation coefficient in order to determine if the small volume of filtered water (A) or the amount of recovered DNA (B). In (A) P-value showed that the correlation between Filtered volume of water and the number of detected species is significant.
False negatives are also a possibility also and have occurred in other studies due to low amounts of target DNA in the water (Pinfield et al., 2019). While this could explain lack of detection for species that move long distances in rivers such as Trichechus manatus, for fish in particular is not highly feasible to explain the absence of many species. Besides, the 12S primers used in this study an also other sets have shown to be effective for use in fish (Bylemans et al., 2019; Li et al., 2019; Sales et al., 2019).
Upon further inspection of the data, particularly of species detected by filters but not found in other information sources, some geographical incongruences were detected. Some of the species showed for the Urabá region are distributed solely in the Pacific coast (such as Engraulis mordax or Caranx ignobilis) even though the whole sampling was made in the Caribbean coast or in rivers that eventually end in the Caribbean Sea. One possibility is that this confusion derives from sister species split after the Isthmus of Panama formed, allowing for allopatric speciation (Rocha et al., 2008; Aguilar et al., 2019) but this must also be treated carefully since as Rocha et al. (2008) points out, many of the speciation events for the genus Haemulon occurred after the closure of the Isthmus and so this could also be the case. Of the 71 fully identified species, 36 did match with bibliography and 35 were out of their distribution range after a final search in GBIF database (GBIF.org, 2020).
Diversity analyses showed some promising results. In Figure 5, water bodies should group according to the basin they belong to. Results show that all basin samples were grouped in one clade separated from the saltwater samples and the Battalion sample. Inside the branch of the basins the Atrato samples were separated from the other basins. The Lorica swamp, the Ayapel Swamp and the Paredes swamp were together in another clade inside the basins clade. Certainly these places share many species leaving the possibility of similarity high in the charts (Aguilera, 2006; Ríos-Pulgarín et al., 2008; Lasso et al., 2011; Mojica-Figueroa and Díaz-Olarte, 2016). If based on species detection data, Bray's dissimilarity showed some different patterns (Figure 5B). The Chucurí swamp and the San Juan river are still together as well as the Ayapel, Paredes and Lorica swamps but now all the previously mentioned places are the sister branch to the Marriaga swamp and Suriquí river instead of the Canal del Dique, which now is in the same clade as the Atrato river and the saltwater samples of the Cispatá bay. The Gulf of Urabá was also paired with the Batallion lake this time. Figure 8 is a Venn diagram showing fish genera shared among the four basins (Atrato, Sinú, San Jorge and Magdalena) where it is seen that the Sinu and San Jorge river basins have no unique genera or genera that aren't shared with the Magdalena basin according to data available on GBIF (Herrera-Collazos et al., 2018) and therefore are grouped together with the Paredes swamp (the Lorica swamp and the Ayapel swamp, respectively, represent these basins) which supports their position in the dendrograms.
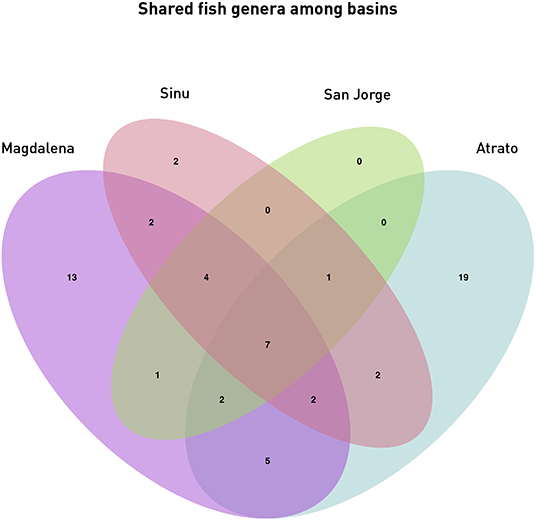
Figure 8. Shared genera among Basins: The Venn diagram shows the shared fish genera between the four basins samples in this study. Magdalena Basin comprises samples 1 through 15 (San Juan River, Chucuri swamp, Paredes swamp, and the Canal del Dique), the Sinú basin is represented by samples 17–19 (Lorica swamp), the San Jorge basin is represented by samples 23–25 (Ayapel swamp) and the Atrato basin comprises samples 26–28 and 30–37 (Atrato river, Suriqui river, and Marriaga swamp).
Many challenges still lay ahead related to obtaining consistent results using this technique. There are not many reference genomes or even gene sequences available for many of the species that inhabit the sampled waters. Projects such as the Earth BioGenome Project (Lewin et al., 2018) or Vertebrate Genomes Project are still only beginning their second phase of work focusing on higher taxa rather than on species leading many organisms still without a decent genomic frame to compare with and also most of the species in these projects are distributed in temperate areas rather than in tropical regions. Alpha diversity can greatly influence beta diversity analysis even if it shouldn't (Jost, 2007) and rare species can have a high impact in diversity assessments (Fontana et al., 2008).
Threatened and endangered species were detected in several places. The most relevant results include the detection of the endangered “Bagre rayado” Pseudoplatystoma magdaleniatum in samples belonging to the Chucuri swamp, San Juan river and Canal del Dique (1, 4–6, and 12 and 13) matching literature (Mojica et al., 2016) together with other six vulnerable fish species (Curivata mivartii, Megalops atlanticus, Ageneiosus pardalis, Sorubim cuspicaudus, Mugil liza, and Mugil incilis, the Antillean manatee, which is considered vulnerable (Self-Sullivan and Mignucci-Giannoni, 2008) and the endangered brown-headed spider monkey Ateles fusciceps from the Suriquí river (Samples 30–32) and the Marriaga swamp (Sample 37) (Figure 4B). The Antillean manatee Trichechus manatus was found in a total of six samples including the Battalion sample, designated as a positive control for T. manatus. Its presence was detected in samples 12, 14, 15, 16, 18, and 26 (Figures 1, 2), respectively, belonging to the swamps around the Canal del Dique (an artificial deviation of the natural course of the Magdalena river (samples 12, 14, 15, 16), the Lorica swamp (Sinú basin) and one of the mouths of the Atrato river. While literature and local fishermen and boat drivers report the presence of the animal in all places where samples were taken, only these six spots captured DNA belonging to the species. On a side note, visual detection of the animal was made while collecting samples 22, 33, and 35 (Cispatá bay, Suriquí river, and Marriaga swamp), however none of these samples reported positive results, since most likely either the animals arrived recently to the area or in low numbers, resulting in non-significant amounts of DNA being shed into the water.
Some species detections were interesting (see Appendices 1, 2 in Supplementary Material) for complete list of species detected). For samples 26 and 27, taken in the Atrato river mouth, the American eel, Anguilla rostrata was detected. This species was not detected in the Gulf of Urabá even when its presence should have been detected based on their distribution range and known habitats in the Caribbean and in Colombia (Benchetrit and McCleave, 2015; Arango-Sánchez et al., 2019). Another interesting detection was a match for Lateolabrax japonicus (Japanese sea bass), one of three species from the genus Lateolabrax, all belonging to the western side of the western Pacific Ocean and all had their complete mitochondrial genome sequenced (Shan et al., 2016). No close relative(at least at the genus level) can be used to explain this match and the lateolabraciade family is placed as the sister branch of the acropomatidae family where perhaps a possible candidate for confusion may be found (Betancur et al., 2017).
Sample 16 was a particular case also since it was an “unofficial positive control.” Upon arrival at the place, only the Antillean manatee (Trichechus manatus) was supposed to be at the place besides some common fish for the area: Ctenolucius huetja, Synbrancus marmoratus and Gymnotus carapo which is not listed for the area is likely to be Gymnotus ardilai based on registers (Mojica et al., 2006). The sample also showed positive results for the spectacled caiman (Caiman crocodylus), a turtle assigned as Trachemys scripta although most likely Trachemys callirostris (Galvis-Rizo et al., 2016) and for the largest rodent, the capybara (Hydrochoerus hydrochoaeris). The reason these results are particularly interesting, is because this is an enclosed artificial lake of the battalion. The two most likely explanations as to how the detections appeared are: (1) perhaps the most likely is that all three species live in nearby water bodies that occasionally feed the lake, and their DNA traveled with the current to the lake. This could help to better understand the flow of eDNA through current and how far can it travel if the position of the creatures in relation to the lake is more precisely determined. Studies support transportation of eDNA in short distances (Li et al., 2019; Wacker et al., 2019) and studying the transport of eDNA in small areas such as this could help to further develop this technique and its uses in open uncontrolled environments. The other possibility (2) is of course that these species recently were in the lake but were not seen, and it was thanks to eDNA that they could be detected.
Invasive vertebrate species for Colombia (Ministerio De Ambiente Territorial Vivienda Y Desarrollo, 2008; Ministerio De Ambiente Vivienda Y Desarrollo, 2010) were surprisingly not detected. Common invasive fishes such as the Nile Tilapia and the Mozambique Tilapia were not detected in the samples of this study, Cichlids were however detected although not identified (Appendix 2 in Supplementary Material). Additionally, in samples taken for another project in Colombia (Caballero, Personal communication) they have been also been identified. Tilapia species were initially introduced but rapidly expanded their range beyond planned and became invasive (Dirección de Recursos Naturales, 2017). It is unclear as to how they were not detected since they are reported for most of Colombia. Very low numbers or highly degraded DNA are perhaps the only possible explanations since the detection of these fish species has been proven to be possible and yield good results (Keskin, 2014).
The detection of many not aquatic species was a surprise and not many studies of eDNA have included terrestrial species (Drummond et al., 2015; Ishige et al., 2017; Johnson et al., 2019) even with aquatic eDNA (Ushio et al., 2017; Williams et al., 2018; Seeber et al., 2019; Sales et al., 2020a,b). This study, however, presents evidence from very open sampling locations, unlike the ponds or waterholes with high eDNA concentrations mentioned by Ushio or Seeber who even went further into using DNA hybridization techniques in order to recover increased amounts of mammal eDNA. The fact that endangered species such as Ateles fusciceps or the southern tamandua (Tamandua tetradactyla only identified to genus and therefore not included in the main results, see Appendix 2 in Supplementary Material) shows that water samples could be used to monitor threatened or rare mammals. Coupled with habitat prediction computer programs it could help improve the determination of previously unknown habitat ranges for some species, like it has been made with the Yamato salamander in Japan (Sakai et al., 2019). Many of the most recognizable groups of terrestrial mammals were detected (see Appendices 1, 2 in Supplementary Material). However, as pointed in Seeber et al. (2019), rarer species may have lower representation in samples, due to low quality sequences than are filtered and eliminated and therefore not included in further analysis, or in such low amounts that is impossible to determine even family level, which may be the case for the order Chiroptera that appeared in very small quantities (see Appendix 3 in Supplementary Material) Both studies from Sales indicate that eDNA is very capable of detecting mammals, specially herbivores. Of these two studies one was performed in south America and identified 15 different mammal families including some bats to the species level. Primer selection in this study was a clear difference with both Sales studies were mammal primers were used unlike the universal vertebrate primers used here This would explain some of the differences in the identification to the species level. The Sales study performed in England showed confident data on the detection of at least three mammal species (water vole, filed vole and red deer) using just four water samples per location. While the number of samples might be close or equal for both studies, it has also been mentioned that conditions on tropical waters are different to those in the lakes and ponds of temperate regions, likely affecting the integrity of DNA. Fifteen bird species were identified in this study (Appendices 1, 2 in Supplementary Material). Bird eDNA showed frequently also and most likely derived from fecal matter (Bohmann et al., 2014) for species like Ramphastos swainsoni or Ara araraurana that are not considered aquatic species. A migrant bird (Catharus ustulatus) was found among the data collected in the Atrato river (Sample 26). This suggests that the presence of migrant birds might be monitored via eDNA, however not much has been done to date to use eDNA in monitoring bird species. Studies focused on birds have not been published extensively, with the exception from of preliminary tests in small scale environments (Ushio et al., 2018) or by exploring other types of eDNA such as saliva in fruits or soil eDNA (Drummond et al., 2015; Monge et al., 2020). Since many species of migrant birds are attracted to waters, aquatic eDNA could be used in the future to monitor them as well.
As the whole country becomes easier to access, more detailed biodiversity sampling will be a possibility. The advantage of eDNA metabarcoding relies on its simplicity to deploy to the point that communities can work along scientists to generate valid results (Sakai et al., 2019). Communities were close to all sampling places and it has been a long time since the relevance of local communities in conservations efforts was noted (Wells and Brandon, 1993) and many successful examples exist such as The California environmental DNA “CALeDNA” program (Meyer et al., 2019) that already is working with a well-established network to allow both scientists and volunteers to provide samples from project associated or random places in the California state and could even enter the Earth BioGenome Project (Lewin et al., 2018). Environmental metabarcoding sampling in this work showed that there are still aspects to work on to improve the application of this technique, but the amount of information recovered from <3 l of water per sampling place showed the great potential for this monitoring technique for to further biodiversity studies in Colombia.
The datasets presented in this study can be found in online repositories. The names of the repository/repositories and accession number(s) can be found at: DRYAD Repository (https://datadryad.org/stash/share/Qtb2EFuCHoZdUSrMnKu6m2FeWJ01x1_mL0IO96mkauA).
Ethical review and approval was not required for the animal study because all information and data was obtained through the collection of water samples and environmental DNA in it. There was no contact with animals during the whole process of sampling. Since no animals were collected, handled or harmed, no ethical review was necessary.
JL: field work, sample processing, data analysis, statistical analysis, manuscript writing, and editing. SC: project conceptualization, field work, sample processing, manuscript writing, and editing.
Funding for this project was available from a private donation to Universidad de los Andes from Programa de Investigacion initiative from Facultad de Ciencias, Universidad de los Andes [Project Name: Conservación del Manatí Antillano (Trichechus manatus) en Colombia y el Caribe uso de nuevas tecnologías como apoyo efectivo en procesos de recuperación de especies amenazadas].
The authors declare that the research was conducted in the absence of any commercial or financial relationships that could be construed as a potential conflict of interest.
The authors would like to thank D. A. Quiroga, M. Luna, and C. Rosso for their help with field work, Fundación Omacha for logistics support in Lorica, Cispatá, and Canal del Dique sampling and the Cabildo Verde de Sabana de Torres organization, as well as to Don Mora, Seferino, and the people of the towns of Bocas del Carare and Marriaga for their hospitality during the sampling process.
The Supplementary Material for this article can be found online at: https://www.frontiersin.org/articles/10.3389/fevo.2020.617948/full#supplementary-material
Aguilar, C., Miller, M. J., Loaiza, J. R., González, R., Krahe, R., and De León, L. F. (2019). Tempo and mode of allopatric divergence in the weakly electric fish Sternopygus dariensis in the Isthmus of Panama. Sci. Rep. 9:18828. doi: 10.1038/s41598-019-55336-y
Aguilera, M. M. (2006). El Canal Del Dique Y Su Subregion Una Economía Basada En La Riqueza Hidrica. Colombia: Cartagena de Indias.
Arango-Sánchez, L. B., Correa-Herrera, T., and Correa-Rendón, J. D. (2019). Diversidad de peces en hábitats estuarinos delta del río atrato, golfo de urabá. Bol. Cient. Mus. Hist. Nat. Univ. Caldas. 23, 191–207. doi: 10.17151/bccm.2019.23.1.7
Arbeláez-Cortés, E. (2013). Knowledge of Colombian biodiversity: Published and indexed. Biodivers. Conserv. 22, 2875–2906. doi: 10.1007/s10531-013-0560-y
Ayala López, L., Murcia, L. M., and Barriga, J. (2018). “Expediciones científicas nacionales,” in Biodiversidad 2017. Available online at: http://reporte.humboldt.org.co/biodiversidad/2017/cap1/104/index.html#seccion10 (accessed April 23, 2020).
Baker, S., Steel, D., Nieukirk, S., and Klink, H. (2018). Environmental DNA (eDNA) from the wake of the whales: droplet digital PCR for detection and species identification. Front. Mar. Sci. 1:133. doi: 10.3389/fmars.2018.00133
Bakker, J., Wangensteen, O. S., Chapman, D. D., Boussarie, G., Buddo, D., Guttridge, T. L., et al. (2017). Environmental DNA reveals tropical shark diversity in contrasting levels of anthropogenic impact. Sci. Rep. 7:16886. doi: 10.1038/s41598-017-17150-2
Benchetrit, J., and McCleave, J. D. (2015). Current and historical distribution of the American eel Anguilla rostrata in the countries and territories of the wider Caribbean. ICES J. Mar. Sci. 73, 122–134. doi: 10.1093/icesjms/fsv064
Betancur, R. R., Wiley, E. O., Arratia, G., Acero, A., Bailly, N., Miya, M., et al. (2017). Phylogenetic classification of bony fishes. BMC Evol. Biol. 17:162. doi: 10.1186/s12862-017-0958-3
Bohmann, K., Evans, A., Gilbert, M. T. P., Carvalho, G. R., Creer, S., Knapp, M., et al. (2014). Environmental DNA for wildlife biology and biodiversity monitoring. Trends Ecol. Evol. 29, 358–367. doi: 10.1016/j.tree.2014.04.003
Bylemans, J., Gleeson, D. M., Duncan, R. P., Hardy, C. M., and Furlan, E. M. (2019). A performance evaluation of targeted eDNA and eDNA metabarcoding analyses for freshwater fishes. Environ. DNA 1, 402–414. doi: 10.1002/edn3.41
Castelblanco-Martínez, D. N., dos Reis, V., and de Thoisy, B. (2018). How to detect an elusive aquatic mammal in complex environments? A study of the endangered Antillean manatee Trichechus manatus manatus in French guiana. Oryx 52, 382–392. doi: 10.1017/S0030605316000922
Cilleros, K., Valentini, A., Allard, L., Dejean, T., Etienne, R., Grenouillet, G., et al. (2019). Unlocking biodiversity and conservation studies in high-diversity environments using environmental DNA (eDNA): a test with Guianese freshwater fishes. Mol. Ecol. Resour. 19, 27–46. doi: 10.1111/1755-0998.12900
Dirección de Recursos Naturales (2017). Plan de Prevención, Control Y Manejo De la Tilapia Del Nilo (Oreochromis niloticus) En La Jurisdicción Car Cundinamarca. Plan De Prevención, Control Y Manejo De La Tilapia Del Nilo (Oreochromis niloticus) En La. Available online at: https://www.car.gov.co/uploads/files/5b90332505307.pdf (accessed September 25, 2020).
Drummond, A. J., Newcomb, R. D., Buckley, T. R., Xie, D., Dopheide, A., Potter, B. C., et al. (2015). Evaluating a multigene environmental DNA approach for biodiversity assessment. Gigascience 4:46. doi: 10.1186/s13742-015-0086-1
Edgar, R. C. (2010). Search and clustering orders of magnitude faster than BLAST. Bioinformatics 26, 2460–2461. doi: 10.1093/bioinformatics/btq461
Edgar, R. C. (2016). UNOISE2: improved error-correction for Illumina 16S and ITS amplicon sequencing. BioRxiv [Preprint] 081257. doi: 10.1101/081257
Ficetola, G. F., Miaud, C., Pompanon, F., and Taberlet, P. (2008). Species detection using environmental DNA from water samples. Biol. Lett. 4, 423–425. doi: 10.1098/rsbl.2008.0118
Fontana, G., Ugland, K. I., Gray, J. S., Willis, T. J., and Abbiati, M. (2008). Influence of rare species on beta diversity estimates in marine benthic assemblages. J. Exp. Mar. Biol. Ecol. 366, 104–108. doi: 10.1016/j.jembe.2008.07.014
Frøslev, T. G., Kjøller, R., Bruun, H. H., Ejrnæs, R., Brunbjerg, A. K., et al. (2017). Algorithm for post-clustering curation of DNA amplicon data yields reliable biodiversity estimates. Nat. Commun. 8:1188. doi: 10.1038/s41467-017-01312-x
Galvis-Rizo, C., Carvajal-Cogollo, J. E., Arredondo, J. C., Passos, P., López-Victoria, M., Velasco, J. A., et al (2016). Libro Rojo de Reptiles de Colombia 2015. Bogotá. Available online at: http://repository.humboldt.org.co/handle/20.500.11761/9303 (accessed August 12, 2020).
GBIF.org (2020). Free and Open Access to Biodiversity Data. GBIF. Available online at: https://www.gbif.org/ (accessed August 8, 2020).
Habel, J. C., Rasche, L., Schneider, U. A., Engler, J. O., Schmid, E., Rödder, D., et al. (2019). Final countdown for biodiversity hotspots. Conserv. Lett. 12:e12668. doi: 10.1111/conl.12668
Handley, L. L., Read, D. S., Winfield, I. J., Kimbell, H., Johnson, H., Li, J., et al. (2019). Temporal and spatial variation in distribution of fish environmental DNA in England's largest lake. Environ. DNA 1, 26–39. doi: 10.1002/edn3.5
Herrera-Collazos, H.-C., Herrera, R. G., DoNascimiento, C., and Maldonado-Ocampo, J. A. (2018). Lista de Especies De Peces De Agua Dulce De Colombia/Checklist of the Freshwater Fishes of Colombia. v2.10. Bogotá: Asociation Colombia Ictiólogos.
Hunter, M. E., Meigs-Friend, G., Ferrante, J. A., Takoukam Kamla, A., Dorazio, R. M., Keith-Diagne, L., et al. (2018). Surveys of environmental DNA (eDNA): a new approach to estimate occurrence in vulnerable manatee populations. Endanger. Species Res. 35, 101–111. doi: 10.3354/esr00880
Hunter, M. E., Oyler-McCance, S. J., Dorazio, R. M., Fike, J. A., Smith, B. J., Hunter, C. T., et al. (2015). Environmental DNA (eDNA) sampling improves occurrence and detection estimates of invasive burmese pythons. PLoS ONE 10:e0121655. doi: 10.1371/journal.pone.0121655
Ishige, T., Miya, M., Ushio, M., Sado, T., Ushioda, M., Maebashi, K., et al. (2017). Tropical-forest mammals as detected by environmental DNA at natural saltlicks in Borneo. Biol. Conserv. 210, 281–285. doi: 10.1016/j.biocon.2017.04.023
Jerde, C. L., Mahon, A. R., Chadderton, W. L., and Lodge, D. M. (2011). “Sight-unseen” detection of rare aquatic species using environmental DNA. Conserv. Lett. 4, 150–157. doi: 10.1111/j.1755-263X.2010.00158.x
Jeunen, G., Lamare, M. D., Knapp, M., Spencer, H. G., Taylor, H. R., Stat, M., et al. (2020). Water stratification in the marine biome restricts vertical environmental DNA (eDNA) signal dispersal. Environ. DNA 2, 99–111. doi: 10.1002/edn3.49
Johnson, M. D., Cox, R. D., and Barnes, M. A. (2019). Analyzing airborne environmental DNA: A comparison of extraction methods, primer type, and trap type on the ability to detect airborne eDNA from terrestrial plant communities. Environ. DNA 1, 176–185. doi: 10.1002/edn3.19
Jost, L. (2007). Partitioning diversity into independent alpha and beta components. Ecology 88, 2427–2439. doi: 10.1890/06-1736.1
Keskin, E. (2014). Detection of invasive freshwater fish species using environmental DNA survey. Biochem. Syst. Ecol. 56, 68–74. doi: 10.1016/j.bse.2014.05.003
Lasso, C. A., de Paula Gutiérrez, F., Morales-Betancourt, M. A., Agudelo, E., Ramírez -Gil, H., and Ajiaco-Martínez, R. E. (2011). Pesquerías Con- Tinentales De Colombia: Cuencas Del Magdalena-Cauca, Sinú, Canalete, Atrato, Orinoco, Amazonas y Vertiente del Pacífico. Bogotá: Instituto de In- vestigación de los Recursos Biológicos Alexander von Humboldt.
Leathwick, J., Moilanen, A., Francis, M., Elith, J., Taylor, P., Julian, K., et al. (2008). Novel methods for the design and evaluation of marine protected areas in offshore waters. Conserv. Lett. 1, 91–102. doi: 10.1111/j.1755-263X.2008.00012.x
Leduc, N., Lacoursière-Roussel, A., Howland, K. L., Archambault, P., Sevellec, M., Normandeau, E., et al. (2019). Comparing eDNA metabarcoding and species collection for documenting Arctic metazoan biodiversity. Environ. DNA 1, 342–358. doi: 10.1002/edn3.35
Lewin, H. A., Robinson, G. E., Kress, W. J., Baker, W. J., Coddington, J., Crandall, K. A., et al. (2018). Earth BioGenome Project: Sequencing life for the future of life. Proc. Natl. Acad. Sci. U.S.A. 115, 4325–4333. doi: 10.1073/pnas.1720115115
Li, J., Lawson Handley, L. J., Harper, L. R., Brys, R., Watson, H. V., Di Muri, C., et al. (2019). Limited dispersion and quick degradation of environmental DNA in fish ponds inferred by metabarcoding. Environ. DNA 1, 238–250. doi: 10.1002/edn3.24
Maldonado-Ocampo, J. A., Antonio Villa-Navarro, F., Ortega-Lara, A., Prada-Pedreros, S., Jaramillo Villa, U., Claro, A., et al (2006). Peces del río Atrato, Zona Hidrogeografica Del Caribe, Colombia. Available online at: www.fishbase.org (accessed October 29, 2019).
Martin, M. (2011). Cutadapt removes adapter sequences from high-throughput sequencing reads. EMBnet. J. 17, 10–12. doi: 10.14806/ej.17.1.200
Meyer, R. S., Curd, E. E., Schweizer, T., Gold, Z., Ramos, D. R., Shirazi, S., et al. (2019). The California Environmental DNA “CALeDNA” program. bioRxiv. 503383. doi: 10.1101/503383
Ministerio De Ambiente Vivienda Y Desarrollo (2010). Resolución Número 0207 3 de Febrero de 2010. Available online at: http://www.minambiente.gov.co/images/BosquesBiodiversidadyServiciosEcosistemicos/pdf/Politicas-de-conservacion-de-la-Biodiversidad/res_0207_030210.pdf (accessed April 20, 2020).
Ministerio De Ambiente Territorial Vivienda Y Desarrollo (2008). Resolución Número 0848 del 23 de Mayo de 2008. Available online at: http://www.parquesnacionales.gov.co/portal/wp-content/uploads/2013/08/res_0848.pdf (accessed April 20, 2020).
Mojica, J., Valderrama, M., Jimenez-Segura, L., and Alonso, J. C. (2016). Pseudoplatystoma magdaleniatum (Bagre rayado). Available online at: https://www.iucnredlist.org/species/58439165/61474168#bibliography (accessed July 9, 2020).
Mojica, J. I., Galvis, G., Sánchez-Duarte, P., Castellanos, C., and Villa-Navarro, F. A. (2006). Peces del valle medio del río Magdalena, Colombia. Biota Colomb. 7, 23–38.
Mojica-Figueroa, B. H., and Díaz-Olarte, J. J. (2016). Comunidad de peces de la ciénaga de Paredes, Magdalena Medio, Santander (Colombia) y su asociación con variables espacio-temporales y ambientales. Biota Colomb. 16, 27–43. doi: 10.21068/c2016s01a02
Monge, O., Dumas, D., and Baus, I. (2020). Environmental DNA from avian residual saliva in fruits and its potential uses in population genetics. Conserv. Genet. Resour. 12, 131–139. doi: 10.1007/s12686-018-1074-4
Myers, N., Mittermeler, R. A., Mittermeler, C. G., Da Fonseca, G. A. B., and Kent, J. (2000). Biodiversity hotspots for conservation priorities. Nature 403, 853–858. doi: 10.1038/35002501
Nichols, P. K., and Marko, P. B. (2019). Rapid assessment of coral cover from environmental DNA in Hawai'i. Environ. DNA 1, 40–53. doi: 10.1002/edn3.8
Ogram, A., Sayler, G. S., and Barkay, T. (1987). The extraction and purification of microbial DNA from sediments. J. Microbiol. Methods 7, 57–66. doi: 10.1016/0167-7012(87)90025-X
Oksanen, J., Blanchet, F., Kindt, R., Legendre, P., Minchin, P., O'Hara, R., et al. (2019). Vegan: Community Ecology Package.
Ostberg, C. O., Chase, D. M., Hoy, M. S., Duda, J. J., Hayes, M. C., Jolley, J. C., et al. (2019). Evaluation of environmental DNA surveys for identifying occupancy and spatial distribution of Pacific Lamprey ( Entosphenus tridentatus ) and Lampetra spp. in a Washington coast watershed. Environ. DNA 1, 131–143. doi: 10.1002/edn3.15
Pearce, J. L., and Boyce, M. S. (2006). Modelling distribution and abundance with presence-only data. J. Appl. Ecol. 43, 405–412. doi: 10.1111/j.1365-2664.2005.01112.x
Phalen, D., Slapeta, J., King, J., and Rose, K. (2011). Development and Validation of a Rapid Field Test to Detect the Chytrid Fungus Batrachochytrium dendrobatidis at a High Specificity and Sensitivity, for Use in Surveys to Determine the Distribution of Chytridiomycosis. Taronga Conservation Society Australia. Available online at: http://www.environment.gov.au/system/files/resources/d3fb8c1a-1d58-4d7e-bcd0-f9fd63d67bdc/files/chytrid-fungus-field-test.pdf (accessed March 10, 2019).
Pinfield, R., Dillane, E., Runge, A. K. W., Evans, A., Mirimin, L., Niemann, J., et al. (2019). False-negative detections from environmental DNA collected in the presence of large numbers of killer whales (Orcinus orca ). Environ. DNA 1, 316–328. doi: 10.1002/edn3.32
Polanco Fernández, A., Marques, V., Fopp, F., Juhel, J., Borrero-Pérez, G. H., Cheutin, M., et al. (2020). Comparing environmental DNA metabarcoding and underwater visual census to monitor tropical reef fishes. Environ. DNA. 1–15. doi: 10.1002/edn3.140
Riaz, T., Shezad, W., Viari, A., Pompanon, F., Taberlet, P., and Coissac, E. (2011). ecoPrimers: inference of new DNA barcode markers from whole genome sequence analysis. Nucleic Acids Res. 39:e145. doi: 10.1093/nar/gkr732
Ríos-Pulgarín, M. I., Jiménez-Segura, L. F., Palacio, J. A., and Ramírez-Restrepo, J. J. (2008). Comunidad De Peces En La Ciénaga De Ayapel, Río Magdalena (Córdoba) Colombia: Cambios Espacio-Temporales En Su Asociación the Fish Community of the Ayapel Floodplain Lagoon, Magdalena River (Córdoba). Colombia: Spacio-Temporal Changes in its Assemblage. Available at: https://www.researchgate.net/profile/Maria_Rios-Pulgarin/publication/305279431_COMUNIDAD_DE_PECES_EN_LA_
CIENAGA_DE_AYAPEL_RIO_MAGDALENA_CORDOBA_COLOMBIA_CAMBIOS_ESPACIO-TEMPORALES_EN_SU_
ASOCIACION_THE_FISH_COMMUNITY_OF_THE_AYAPEL_FLOODPLAIN_
LAGOON_MAGDALENA_RIVER_CORDOBA_COLOMBI/links/57865a2108ae3949cf5558a4.pdf (accessed December 2, 2019).
Robinson, C. V., Garcia de Leaniz, C., Rolla, M., and Consuegra, S. (2019). Monitoring the eradication of the highly invasive topmouth gudgeon (Pseudorasbora parva ) using a novel eDNA assay. Environ. DNA 1, 74–85. doi: 10.1002/edn3.12
Rocha, L. A., Lindeman, K. C., Rocha, C. R., and Lessios, H. A. (2008). Historical biogeography and speciation in the reef fish genus Haemulon (Teleostei: Haemulidae). Mol. Phylogenet. Evol. 48, 918–928. doi: 10.1016/j.ympev.2008.05.024
RStudio Team (2020). RStudio: Integrated Development for R. RStudio Team. Available online at: http://www.rstudio.com/.
Sakai, Y., Kusakabe, A., Tsuchida, K., Tsuzuku, Y., Okada, S., Kitamura, T., et al. (2019). Discovery of an unrecorded population of yamato salamander (Hynobius vandenburghi) by GIS and eDNA analysis. Environ. DNA 1, 281–289. doi: 10.1002/edn3.31
Sales, N. G., Kaizer, M. C., Coscia, I., Perkins, J. C., Highlands, A., Boubli, J. P., et al. (2020a). Assessing the potential of environmental DNA metabarcoding for monitoring neotropical mammals: a case study in the Amazon and Atlantic Forest, Brazil. Mamm. Rev. 50, 221–225. doi: 10.1101/750414
Sales, N. G., McKenzie, M. B., Drake, J., Harper, L. R., Browett, S. S., Coscia, I., et al. (2020b). Fishing for mammals: landscape-level monitoring of terrestrial and semi-aquatic communities using eDNA from riverine systems. J. Appl. Ecol. 57, 707–716. doi: 10.1111/1365-2664.13592
Sales, N. G., Wangensteen, O. S., Carvalho, D. C., Deiner, K., Præbel, K., Coscia, I., et al. (2021). Space-time dynamics in monitoring neotropical fish communities using eDNA metabarcoding. Sci. Total Environ. 754:142096. doi: 10.1016/j.scitotenv.2020.142096
Sales, N. G., Wangensteen, O. S., Carvalho, D. C., and Mariani, S. (2019). Influence of preservation methods, sample medium and sampling time on eDNA recovery in a neotropical river. Environ. DNA 1, 119–130. doi: 10.1002/edn3.14
Seeber, P. A., McEwen, G. K., Löber, U., Förster, D. W., East, M. L., Melzheimer, J., et al. (2019). Terrestrial mammal surveillance using hybridization capture of environmental DNA from African waterholes. Mol. Ecol. Resour. 19, 1486–1496. doi: 10.1111/1755-0998.13069
Self-Sullivan, C., and Mignucci-Giannoni, A. (2008). Caribbean Manatee Trichechus Manatus ssp. Manatus. Available online at: https://www.iucnredlist.org/species/22105/9359161 (accessed March 4, 2019).
Shan, B., Song, N., Han, Z., Wang, J., Gao, T., and Yokogawa, K. (2016). Complete mitochondrial genomes of three sea basses Lateolabrax (Perciformes, Lateolabracidae) species: genome description and phylogenetic considerations. Biochem. Syst. Ecol. 67, 44–52. doi: 10.1016/j.bse.2016.04.007
Sousa, L. L., Silva, S. M., and Xavier, R. (2019). DNA metabarcoding in diet studies: unveiling ecological aspects in aquatic and terrestrial ecosystems. Environ. DNA 1, 199–214. doi: 10.1002/edn3.27
Strickler, K. M., Fremier, A. K., and Goldberg, C. S. (2015). Quantifying effects of UV-B, temperature, and pH on eDNA degradation in aquatic microcosms. Biol. Conserv. 183, 85–92. doi: 10.1016/j.biocon.2014.11.038
Tsuji, S., Takahara, T., Doi, H., Shibata, N., and Yamanaka, H. (2019). The detection of aquatic macroorganisms using environmental DNA analysis—a review of methods for collection, extraction, and detection. Environ. DNA 1, 99–108. doi: 10.1002/edn3.21
Ushio, M., Fukuda, H., Inoue, T., Makoto, K., Kishida, O., Sato, K., et al. (2017). Environmental DNA enables detection of terrestrial mammals from forest pond water. Mol. Ecol. Resour. 17, e63–e75. doi: 10.1111/1755-0998.12690
Ushio, M., Murata, K., Sado, T., Nishiumi, I., Takeshita, M., Iwasaki, W., et al. (2018). Demonstration of the potential of environmental DNA as a tool for the detection of avian species. Sci. Rep. 8:4493. doi: 10.1038/s41598-018-22817-5
Venter, J. C., Remington, K., Heidelberg, J. F., Halpern, A. L., Rusch, D., Eisen, J. A., et al. (2004). Environmental genome shotgun sequencing of the sargasso sea. Science 304, 66–74. doi: 10.1126/science.1093857
Wacker, S., Fossøy, F., Larsen, B. M., Brandsegg, H., Sivertsgård, R., and Karlsson, S. (2019). Downstream transport and seasonal variation in freshwater pearl mussel (Margaritifera margaritifera) eDNA concentration. Environ. DNA 1, 64–73. doi: 10.1002/edn3.10
Wells, M. P., and Brandon, K. E. (1993). The principles and practice of buffer zones and local participation in biodiversity conservation. Ambio 22, 157–162.
Williams, K. E., Huyvaert, K. P., Vercauteren, K. C., Davis, A. J., and Piaggio, A. J. (2018). Detection and persistence of environmental DNA from an invasive, terrestrial mammal. Ecol. Evol. 8, 688–695. doi: 10.1002/ece3.3698
Wineland, S. M., Arrick, R. F., Welch, S. M., Pauley, T. K., Mosher, J. J., Apodaca, J. J., et al. (2019). Environmental DNA improves Eastern hellbender (Cryptobranchus alleganiensis alleganiensis) detection over conventional sampling methods. Environ. DNA 1, 86–96. doi: 10.1002/edn3.9
Keywords: eDNA metabarcoding, vertebrates, fish communities, Colombia, Magdalena river, Atrato river
Citation: Lozano Mojica JD and Caballero S (2021) Applications of eDNA Metabarcoding for Vertebrate Diversity Studies in Northern Colombian Water Bodies. Front. Ecol. Evol. 8:617948. doi: 10.3389/fevo.2020.617948
Received: 15 October 2020; Accepted: 23 December 2020;
Published: 25 January 2021.
Edited by:
Joong-Ki Park, Ewha Womans University, South KoreaCopyright © 2021 Lozano Mojica and Caballero. This is an open-access article distributed under the terms of the Creative Commons Attribution License (CC BY). The use, distribution or reproduction in other forums is permitted, provided the original author(s) and the copyright owner(s) are credited and that the original publication in this journal is cited, in accordance with accepted academic practice. No use, distribution or reproduction is permitted which does not comply with these terms.
*Correspondence: Juan Diego Lozano Mojica, amQubG96YW5vQHVuaWFuZGVzLmVkdS5jbw==
Disclaimer: All claims expressed in this article are solely those of the authors and do not necessarily represent those of their affiliated organizations, or those of the publisher, the editors and the reviewers. Any product that may be evaluated in this article or claim that may be made by its manufacturer is not guaranteed or endorsed by the publisher.
Research integrity at Frontiers

Learn more about the work of our research integrity team to safeguard the quality of each article we publish.