 Shiliang Liu
 FangFang Wang1
94% of researchers rate our articles as excellent or good
Learn more about the work of our research integrity team to safeguard the quality of each article we publish.
Find out more
ORIGINAL RESEARCH article
Front. Ecol. Evol. , 08 January 2021
Sec. Conservation and Restoration Ecology
Volume 8 - 2020 | https://doi.org/10.3389/fevo.2020.616356
This article is part of the Research Topic Impacts of Habitat Transformation on Species, Biodiversity and Ecosystems in Asia View all 13 articles
Dam construction is a major threat to terrestrial ecological processes that exhibit spatial variation. As an effective indicator of species movements at large scales, the dynamics of forest landscape connectivity for the dispersal abilities of local species such as primates both upstream and downstream of the Manwan hydropower station were compared in three periods: before, during, and after dam construction (in 1974, 1988, and 2004, respectively). The equivalent connected area (ECA) index which was modified from the probability of connectivity (PC) index based on the graph theory was applied in this study. We used this method to analyze the spatial and temporal changes in the overall forest landscape connectivity due to dam construction. The results showed that forest connectivity decreased after dam construction. The forest connectivity upstream was much greater than that downstream in 1974 but was lower in 1988 and 2004. The importance of connectivity increased with increasing dispersal distance. Only 8, 12, and 18% of forest patches of small area exhibited changes in 1974, 1988, and 2004, respectively. Most of the large habitat patches (i.e., those with dECA values >50%) remained stable, and the greatest patch changes were found at a dispersal distance of 400 m in all three periods. These large forest patch changes often occurred near the boundary of the study area. The Betweenness Centrality indicator, which identifies patches as stepping stones while accounting for ecological processes and biological flows at a larger scale, indicated that some habitat patches near Manwan Dam acted as stepping stones in maintaining the forest connectivity. Furthermore, rank correlations between the forest patch area and the three dPC (intra, flux, connector) fractions indicated that the dPCflux indicator can be used to measure the prioritization of habitat patches.
Dams are considered one of the most important human disturbances to river basins. Although they provide many economic benefits, their negative effects on ecological processes and habitats cannot be ignored (Bombino et al., 2006). After the impoundment of a dam, spatial differences occur in landscape pattern and related connectivity between the upstream and downstream stretches of a river. As dam construction continues, the connectivity of natural habitat patches is disrupted and fragmented, and vegetation is submerged by the impounded water (Gordon and Meentemeyer, 2006). Previous studies showed that trophic and community interactions were affected by river structure and position (Anderson and Hayes, 2018). Moreover, the declining sizes of forest patches and the lack of habitat continuity can lead to landscape fragmentation, connectivity reduction and habitat loss (Fahrig, 2003). Therefore, it is essential to measure the impacts of spatial changes of habitats and habitat connectivity to preserve biodiversity and understand the ecological effects of dam construction.
Landscape connectivity is composed of two different facets, including structural connectivity and functional connectivity (Baguette and Van Dyck, 2007). Structural connectivity refers to the level at which two landscape elements or habitat patches are physically connected. Functional connectivity can be defined as the degree to which the landscape impedes the dispersal movements of populations across habitat patches (Taylor et al., 1993; Saura and Pascual-Hortal, 2007). Landscape connectivity has been linked to various ecological processes, such as nitrogen cycling, decomposition, pollination, seed dispersal, and animal migration (Forman and Deblinger, 2000; Minor and Urban, 2008; Nichols et al., 2008). Improved connectivity can facilitate the ecological flow of materials and resources (Bélisle, 2005). Also, connectivity shapes diversity patterns at different levels (Carrara et al., 2012). The alteration of natural links between patches affects community composition and population persistence (Fagan, 2002; Carrara et al., 2014; Ma et al., 2020). Landscape connectivity depends not only on the area and patterns of habitats but also on the habitat affinities and dispersal abilities of species (Galpern et al., 2010). It has frequently been argued that the ecological effects of dam construction depend on the relatedness of habitats and the various ecological processes that determine the survival of local species (Laita et al., 2010). As information on most species’ dispersal movements is limited, researchers usually focus on potential functional connectivity in estimating connectivity. This is because potential connectivity makes use of assumed dispersal distance thresholds estimated from the limited data on actual dispersal abilities and the physical attributes of the landscape, and it can be used to predict the degree of connectivity of landscapes with respect to a particular species (Diaz-Varela et al., 2009).
With increasing recognition of the importance of landscape connectivity and habitat availability, a series of landscape connectivity metrics based on graph theory and related network frameworks have been developed to model the spatial patterns of habitats and the dispersal behavior of rare species (Pascual-Hortal and Saura, 2006, 2007; Zetterberg et al., 2010; Saura et al., 2011). Graph theory considers that the network consists of a set of nodes and a set of links connecting different nodes. In ecological applications, a node typically represents a habitat patch and a link typically represents dispersal. Conefor Sensinode software is a tool for combining data on the habitat patch distributions and habitat availability of landscape patches (Saura and Torné, 2009). The equivalent connected area (ECA) index, modified from the probability of connectivity (PC) index, can be used to quantify spatial pattern changes in the quantity of habitats within landscapes and monitor their potential impacts on landscape connectivity variation. ECA (PC) is convenient for measuring the dynamics of functional connectivity of habitat areas in a landscape (Saura et al., 2011). ECA is measured as that property of the landscape that determines the amount of available habitat within it (Saura et al., 2011). Moreover, to identify the key habitat patches in a landscape network and stepping stone effects, the PC index can be divided into three separate fractions including dPCflux, dPCintra, and dPCconnector which quantify dispersal flux through the links, interpatch connectivity, and contribution of patch or connection to the connectivity, respectively (Saura and Rubio, 2010). These three metrics are based on the same concept and are measured in the same units, so they are easily computed and compared within a framework. Additionally, several topological indicators can be used to identify conservation priorities regarding the quantification of important landscape elements (such as habitat patches and stepping stones) (Lander et al., 2010). For example, measurements of centrality characteristics are degree centrality, closeness centrality, betweenness centrality (BC), eigenvalue centrality, subgraph centrality, and the Harary index (Baranyi et al., 2011). Integrating the ECA index and centrality characteristics to depict the habitat importance is necessary for conservation.
Manwan Dam is a typical gorge dam in the middle and lower reaches of the Mekong River in Yunnan Province (He et al., 2004). In recent years, the landscape pattern dynamics arising in response to the construction of the Manwan Dam have been extensively studied. Some researchers have noted that the land use structure changed markedly during and after dam construction and forest as the main habitat decreased its area and experienced intense fragmentation due to farmland transformation (Zhao et al., 2010; Yang et al., 2013). Landscape pattern and dynamics analysis has also revealed forest fragmentation in the reservoir basin (Zhao et al., 2012). Although many sensitive structural indicators have been used to assess landscape patterns and the interaction between human activity and the natural landscape (Zhang et al., 2010), ecological processes have not been taken into accounted in the assessment of ecological effects of dam construction. Previous studies that have addressed the ecological processes occurring in the reservoir ecosystem have concentrated on inner river processes, such as runoff and deposition (Zhao et al., 2012), and few studies have attempted to analyze the fragmented landscape and its effects on the terrestrial species dispersal in reservoir basin ecosystems. Therefore, studies of the landscape connectivity dynamics in the upstream and downstream reaches of Manwan Dam are needed.
In this study, we focused on the landscape connectivity dynamics upstream and downstream of the Manwan hydropower station both before and after the construction of Manwan Dam. The objectives of this study were to (1) analyze the spatial patterns and overall connectivity changes of forest patches in 1974, 1988, and 2004; (2) compare differences in landscape connectivity between the upstream and downstream reaches based on dECA at the patch level; and (3) evaluate the relative importance of the three functional indexes PCflux, dPCintra, and dPCconnector in estimating dispersal distances and measure the prioritization of habitat patches in the Manwan habitat network.
The Manwan hydropower station is located near Manwan town in the middle reach of Lancang River in Yunnan Province. It began operation in June 1993, and it is the first multimillion-kilowatt hydropower station to operate along the Lancang River, with an installed capacity of 125 × 104 kW (Feng et al., 2000). After the dam began operation, the size of the reservoir increased to more than twice its the original size, and it currently averages 337.1 m in width and occupies an area of 23.6 km2 (Zhou et al., 2008). It is 148 m long, 132 m in height and has a backwater area of 70 km (Liu et al., 2006). The climate of Manwan basin is subtropical, and the forest types are broadleaf and coniferous; species include Bon bax ceiba, Cycloba lanopsis, Lithocarpus spp., Lauraceae spp., and Pinus kesiya var langbianensis (Zhou et al., 2010). According to the landscape effect range in Manwan dam as derived from buffer analysis (Zhao et al., 2010), the study area was selected as the 0–10 km buffer zone (distance from the Manwan dam site) in the river watershed (Figure 1).
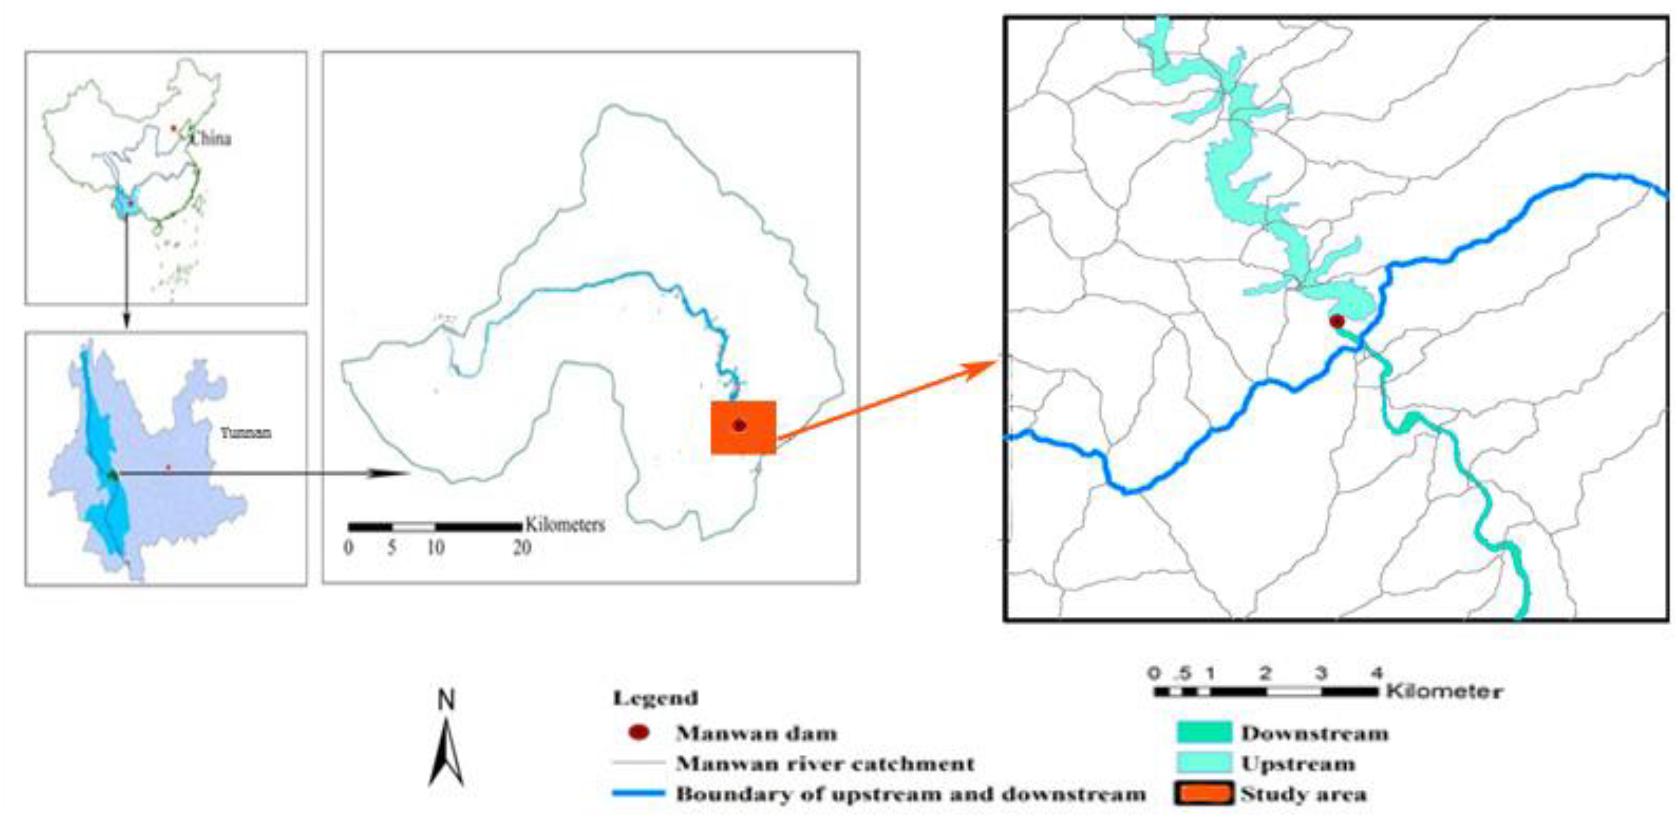
Figure 1. Location of the study area.
The original land cover data for the area of the Manwan hydropower station were interpreted from Landsat Multi Spectral Scanner (MSS) and Landsat Thematic Mapper (TM) images. These land use data were obtained from the Data Center for Resources and Environmental Sciences, Chinese Academy of Sciences (Zhao et al., 2012). MSS images were utilized as the primary data for creating the land use maps of 1974. In addition, a map of Yunnan land-use types in 1975 (scale of 1:100,000) obtained from the Yunnan Department of Land and Resource served as a reference map for the classification and accuracy evaluation of the MSS images. Two TM images were interpreted as land use maps for 1988 and 2004, and a vegetation map (scale of 1:100,000 in 1991) obtained from the Yunnan Forest Bureau was used as a reference for the classification and accuracy evaluation of the TM images. The TM and MSS images were classified using a supervised maximum likelihood classification approach, and the results were revised as necessary based on visual interpretations and ground survey data. One hundred and two ground control points (Global Positioning System) were compared with the images, and the overall classification accuracies of these images were identified as 83.3, 83.9, and 83.6% in 1974, 1988, and 2004, respectively. The land use maps were classified into forest, grassland, shrubland, farmland, construction land, and water.
Based on the concept of habitat availability, the ECA, modified from the PC, is defined as the size of a single habitat patch that would provide the same value of PC metric as the actual habitat pattern in the landscape (Saura et al., 2011). Generally, the ECA can be considered as the EC (equivalent connectivity) whenever patch habitat quality or population size is used as the node attribute (Saura et al., 2011). The ECA index is computed as the square root of the numerator of the PC index, and the expression is as follows:
Where ai and aj are the areas of resource patches i and j, respectively, and p is the maximum product probability of the overall probable paths between patches i and j (including single step paths). The product probability of a path is the product of all of the pij values for all of the connections in a habitat patch (Saura et al., 2011). The formula of pij is given by:
Where pij is the direct dispersal probability, which reflects the strength of each link; dij is the effective (minimum cost) distance between patches i and j (in meters); and k is a species-specific constant (automatic index) that matches the function to the probability distance values (Pascual-Hortal and Saura, 2007; Saura et al., 2011). Here, the pij value was characterized by a negative exponential as a function of the inter-patch effective distances selected in our study (Bunn et al., 2000; Saura et al., 2011).
The ECA metric of Conefor Sensinode software was strongly correlated with the ecological processes within the habitat patches, which requires that the dispersal abilities of local species be accounted for in the evaluation of functional connectivity. In the present study, the capabilities of the forest dwelling species were considered in the scenario analysis in the ECA model. Researchers have observed that most seeds travel only a few tens of meters to a hundred meters through habitat patches. In addition, researchers from Yunnan University reported that 135 mammals and some other endemic animals (such as Macaca nemestrina, Presbytis phayrei, and Eothenomys spp.) only occur in the Lancang River valley (He et al., 2004). Moreover, according to the dispersal ability information from previous studies, most mammals in the study area can only travel short distances of less than 1,000 m to another habitat patch (Sutherland et al., 2000; Bowman et al., 2002; Johst et al., 2002; Wang et al., 2010). Therefore, in the present study, we evaluated four different dispersal distances (d = 200, 400, 600, 800 m) in the ECA model. In addition, due to the same dispersal probability (pij) of the occurrence of a random event among the habitat patches, the pij value was set to 0.5 for these four dispersal distance thresholds (Pascual-Hortal and Saura, 2007; Saura et al., 2011).
The ranking of habitat patches by their contributions to overall landscape connectivity and habitat availability can be computed from the dECA values (Saura et al., 2011). The index is described as the difference in the ECA value before and after changes in spatial pattern (i.e., loss of habitat patches), and it describes the proportional importance of connectivity for each habitat patch. A higher dECA value indicates greater habitat importance in increasing landscape connectivity for forest patches (Saura et al., 2011). In addition, the percentage of the total habitat area (dA) was computed.
All of the ECA and other connectivity indicators were calculated using Conefor Sensinode software 2.6 (Saura and Torné, 2009).
The dPC values can be divided into three fractions that reflect different ways in which a particular habitat patch can contribute to entire overall landscape connectivity and availability in the landscape. The formula is as follows:
Where dPCintra is the contribution of a habitat patch in terms of interpatch connectivity; it describes how a patch may be connected to other patches and relates to available habitat area or other patch attribute of availability. It is independent of patch connections to other patches thus even if it is isolated dPCintra will not change (Saura and Rubio, 2010). dPCflux is associated with the area-weighted dispersal flux through the links of an individual patch to or from other patches in the landscape. This fraction depends on the patch area and its position within the landscape network. dPCconnector is the contribution of patch or connection to the connectivity between other habitat patches, as a connecting element or stepping stone between them. In the landscape network, the topological position of a patch or connection in the landscape network will affect the dPCconnector value (Saura and Rubio, 2010). The intra, flux, and connector fractions yield information on the importance of a patch in a landscape network, and they measured most of the variability in habitat patch priorities.
The network centrality of habitat patches can be measured by the BC indicator. BC based on the PC index is denoted BC (PC). It describes a habitat patch in which the shortest paths (based on topological distance) between all pairs of patches in the landscape are calculated and the number of times those paths cross each node are counted (Bodin and Saura, 2010). BC (PC) improves on the classical BC metrics measured in the Conefor model (Bodin and Saura, 2010). In addition to the PC (intra, flux and connector) fractions, BC (PC) can be considered as a “fourth fraction” of PC metrics, as it is measured in the same units and within the same analytical framework. The BC index may be effective for identifying patches as stepping stones when taking into account biological flows at a larger scale. Unlike the connector fraction of the PC metrics, BC do not estimate the impacts of a patch removal in terms of connectivity loss. We used the topological indicators dPCconnector and BC (PC) characterize different properties of the habitat network of Manwan Dam.
Correlation analysis were conducted using the non-parametric Kendall’s taub rank test of correlation coefficients (Arndt, 1999). To reveal the effectiveness of different indexes, correlations were investigated between the three dPC fractions (dPCintra, dPCflux, anddPCconnector), between the total dPC value and the three dPC fractions. Further, to understand how the patch size affect the connectivity, the correlation between habitat patch area and three dPC fractions were also investigated. This analysis was conducted using SPSS software (Norušis, 1993).
At the landscape level, the forest connectivity, as measured by the ECA values, successively decreased from 1974 to 2004, particularly after dam construction. The functional connectivity before dam construction was highest in 1974, likely due to the numerous forest patches of large area. With the fragmentation of the forest after dam construction and impoundment, the overall connectivity values of ECA were lower than before dam construction in 1974 (Table 1). However, the overall connectivity increased slightly with the increase in dispersal distances from 200 to 800 m.
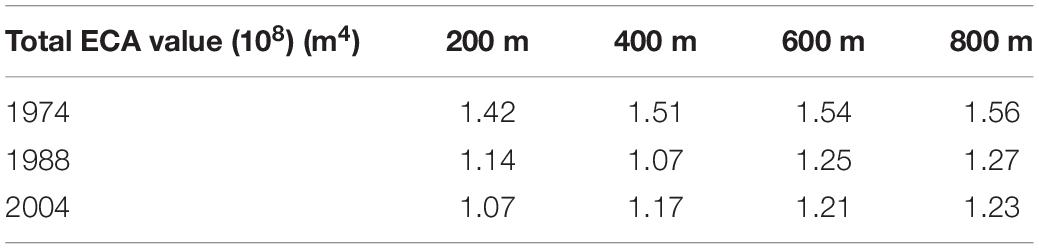
Table 1. Total ECA values in the Manwan forest landscape (1974–2004).
As indicated by the total ECA values, there was considerable spatial variation in forest connectivity between the upstream and downstream areas of the dam in 1974, 1988, and 2004 (Figure 2). Under the four dispersal distance thresholds, the forest connectivity upstream of Manwan Dam was much greater than downstream before the dam construction, and the lowest ECA value reached 0.4. In 1988 and 2004, the total connectivity of ECA values upstream was lower than that downstream. Alterations in connectivity due to dam construction primarily occurred downstream of Manwan Dam, and the lowest ECA value upstream was observed in 2004, after dam construction. However, with increasing dispersal distance from 200 to 800 m, a slight overall increase in forest connectivity was observed around Manwan dam, with the highest values observed at 800 m.
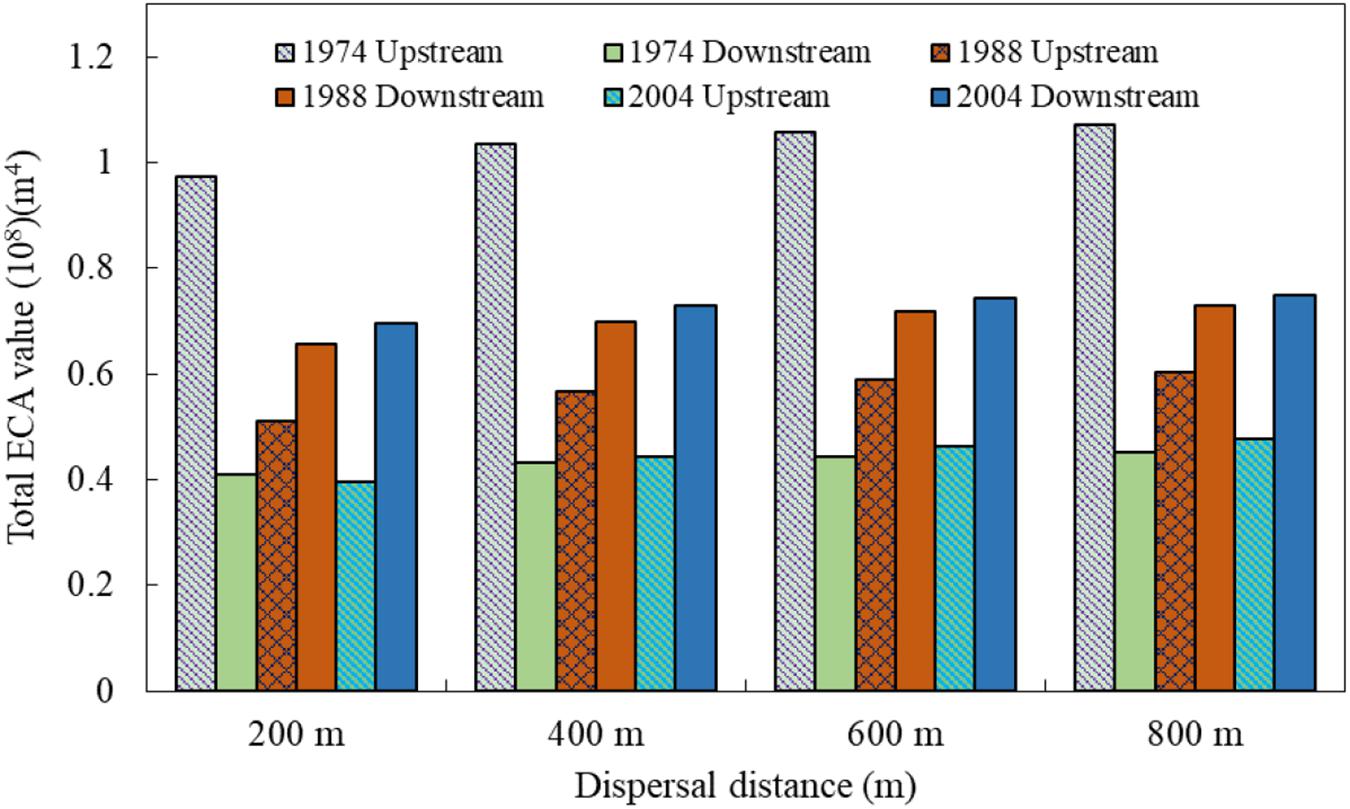
Figure 2. Spatial differences in total landscape connectivity as measured by the ECA index (1974–2004).
The dynamics of patch importance of functional connectivity at the patch scale are described by the dECA values in Figure 3. In 1974, the importance of forest connectivity in forest patches at the edges of the study area changed most at dispersal distances of 400 and 800 m (ranging from 20 to 50%). Only 8% of forest patches exhibited significant changes in connectivity under the four dispersal distances. The average dECA values for all of the forest patches ranged from 54% at a dispersal distance of 200 m to 66% at 800 m, values greater than the average dA value of 51%.
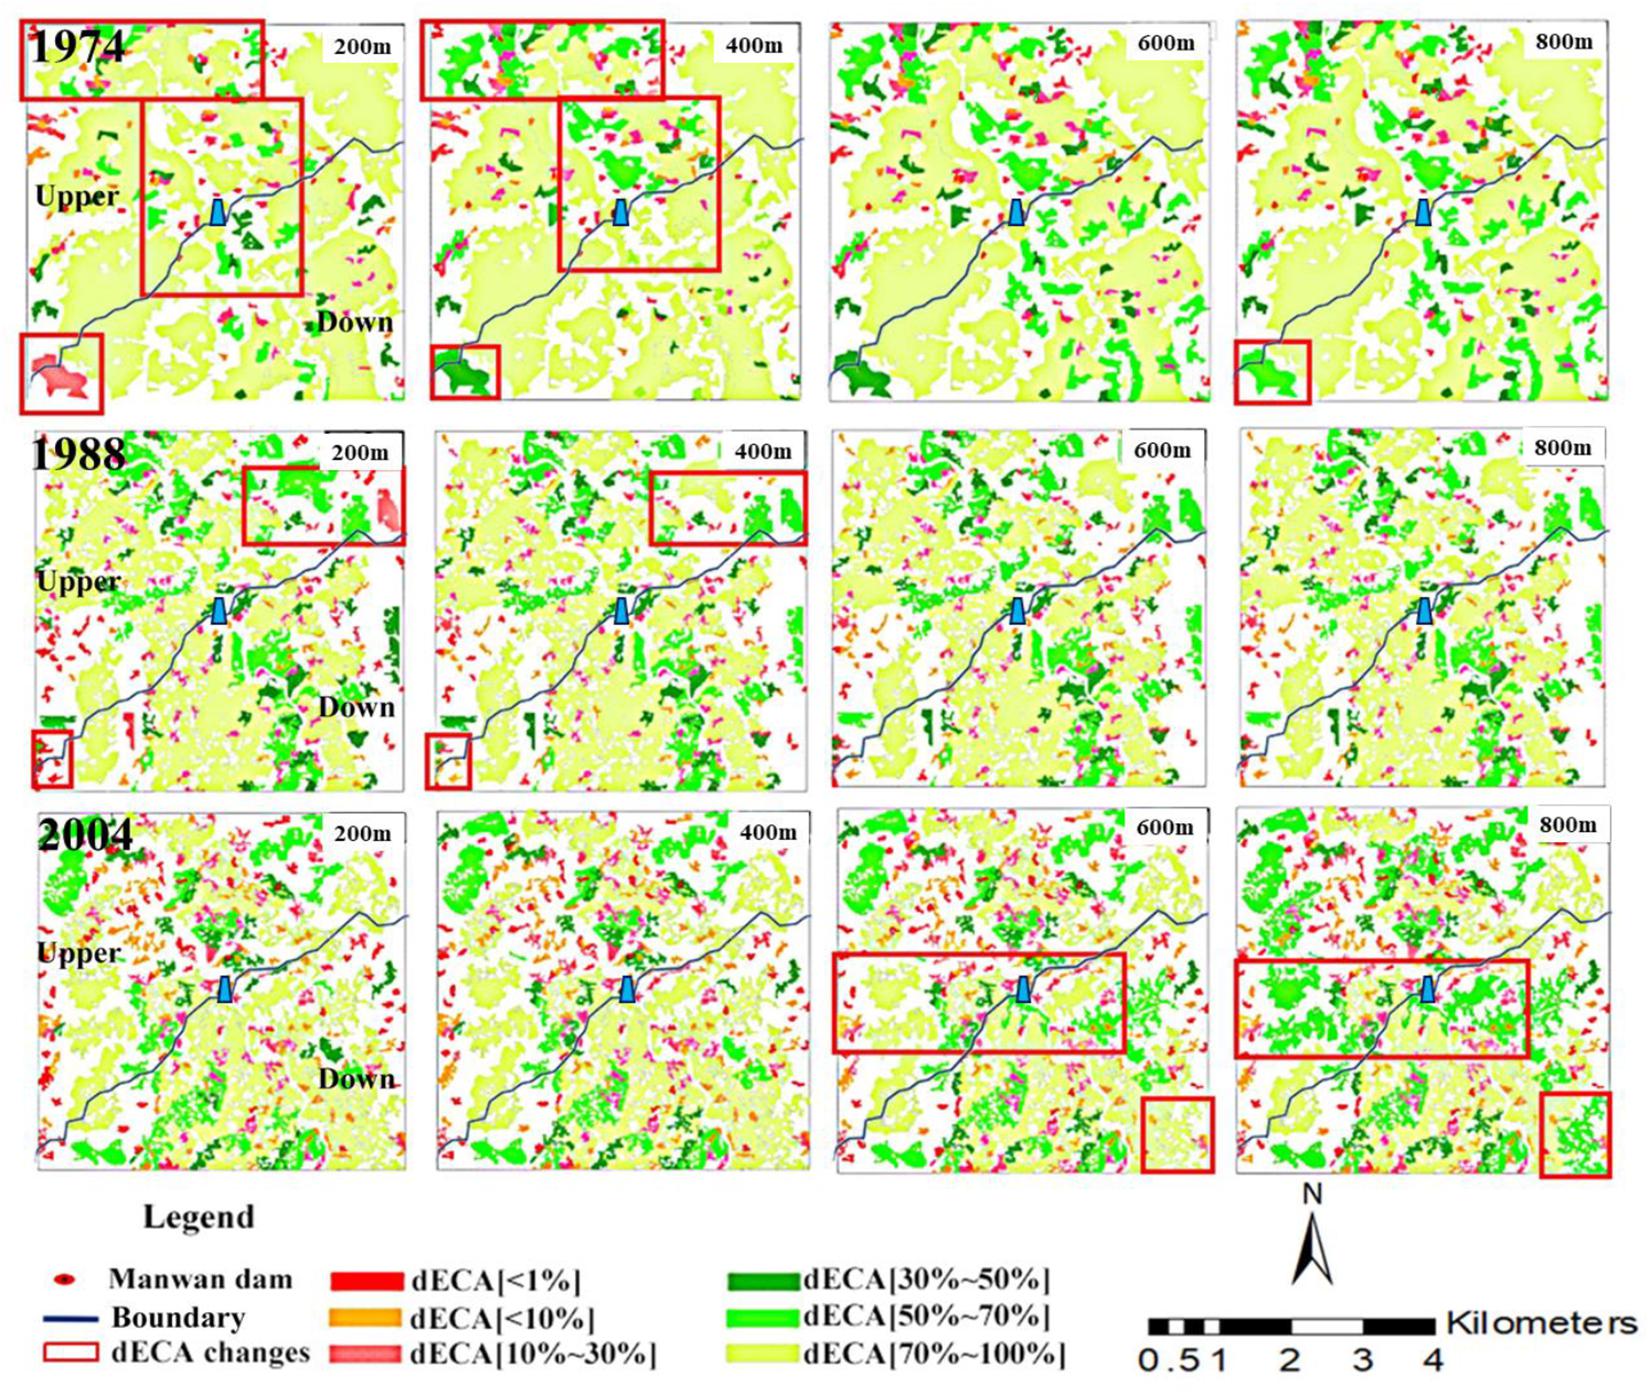
Figure 3. Connectivity changes in the Manwan forest patches under four different dispersal distances in 1974, 1988, and 2004, as measured by the dECA index.
In 1988, approximately 12% of forest patches exhibited obvious changes in connectivity under the four dispersal distances, with dECA values greater than 20%. The greatest change in forest connectivity was observed at the dispersal distance of 400 m, upstream of the dam. The average dECA values for all of the forest patches ranged from 41% at a dispersal distance of 200 m to 49% for the 800 m distance, values greater than the mean dA value of 39%.
In 2004, approximately 18% of forest patches had importance level changes in connectivity under the four movement distances. The greatest change in forest connectivity downstream occurred at the dispersal distance of 800 m, with a dECA value greater than 50%. The average dECA values for all of the forest patches ranged from 45% at a distance of 200 m to 52% at 800 m, values higher than the average dA value of 35%.
Due to changes in spatial pattern between 1974 and 2004, the overall forest landscape connectivity increased at the patch level. The dECA values indicated a slight increase in the importance of connectivity on forest patches under the four dispersal distances in all three periods (Figure 3). At the patch level, the degree of connectivity was stable for most of the large habitat patches, with dECA values in excess of 50% under the four dispersal distances. In each of the three periods, dECA tended to increase slightly with the increase in dispersal distance. The most important forest patches were those with the largest patch areas. The greatest individual changes were found in edge forest patches of small and medium area; these key forest patches were located primarily near the boundary of the study area.
Correlations between dPC and its different fractions (intra, flux, and connector) are illustrated in Figure 4. Similar trends in rank correlation were observed between dPC and both habitat area and dPCflux. The rank correlations of dPCflux and patch area increased steadily with dispersal distance, particularly at 600 and 800 m. The taub correlation coefficients of dPC and dPCflux were high at both 200 and 800 m, with the lowest coefficient values ranging from 0.82 to 0.85 and the highest values approaching 1 (0.92 and 0.95). In accordance with the dPCflux fraction, for the longer dispersal distances, the key forest patches were generally related to the largest habitat patches. This is because these large forest patches are more likely to be inter-connected; the P value often approached 1 for large habitat patches. The flux features of different habitat patches were primarily influenced by patch area.
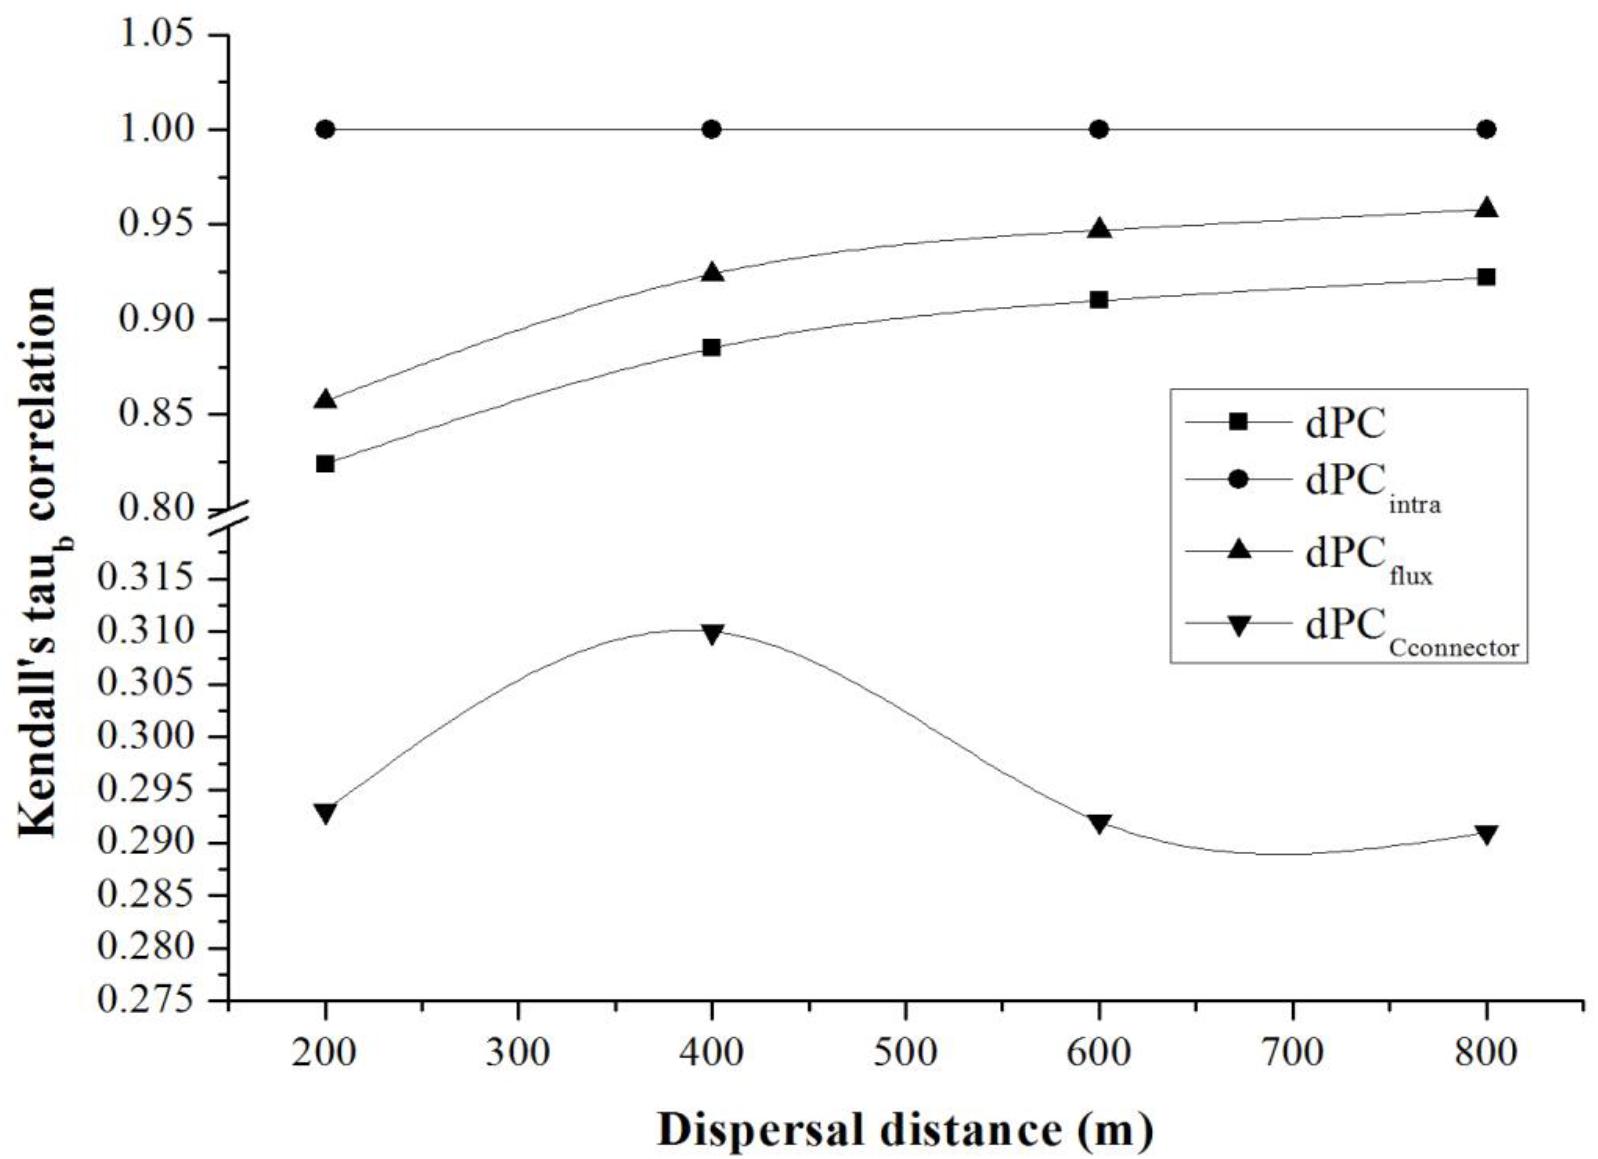
Figure 4. Kendall’s rank correlations (taub) between the patch importance indices (dPC, dPCflux, dPCintra, dPCconnector,) and patch area with increasing dispersal distance.
Independent of the dispersal distance, the dPCintra value had a strong rank correlation (taub = 1) with patch area (Figure 4). This fraction did not change with dispersal distance. This fraction indicates that forest patches with the largest habitat area have the highest importance for connectivity.
The dPCconnector fraction evaluates landscape pattern and was not in accordance with the area-based prioritization. The rank correlation coefficients of dPCconnector and patch area remained low relative to other three indicators. With increasing dispersal distance, the taub values were stable at 0.29, except at 400 m, with a value of 0.31.
Similar increasing trends were observed among the correlations between dPC and dPCflux, dPCflux and dPCconnector (Figure 5). As their taub values are near 1, the prioritization of habitat patches can be measured with the dPC and dPCflux indicators. The coefficient correlations were lower at 200 and 400 m and higher at 600 and 800 m. The rank correlations of dPC and dPCconnector were lower than those of other two indices, with the lowest values occurring at 200 and 400 m. The results also indicated that dPCconnector is an effective metric for measuring landscape connectivity in habitat patches.
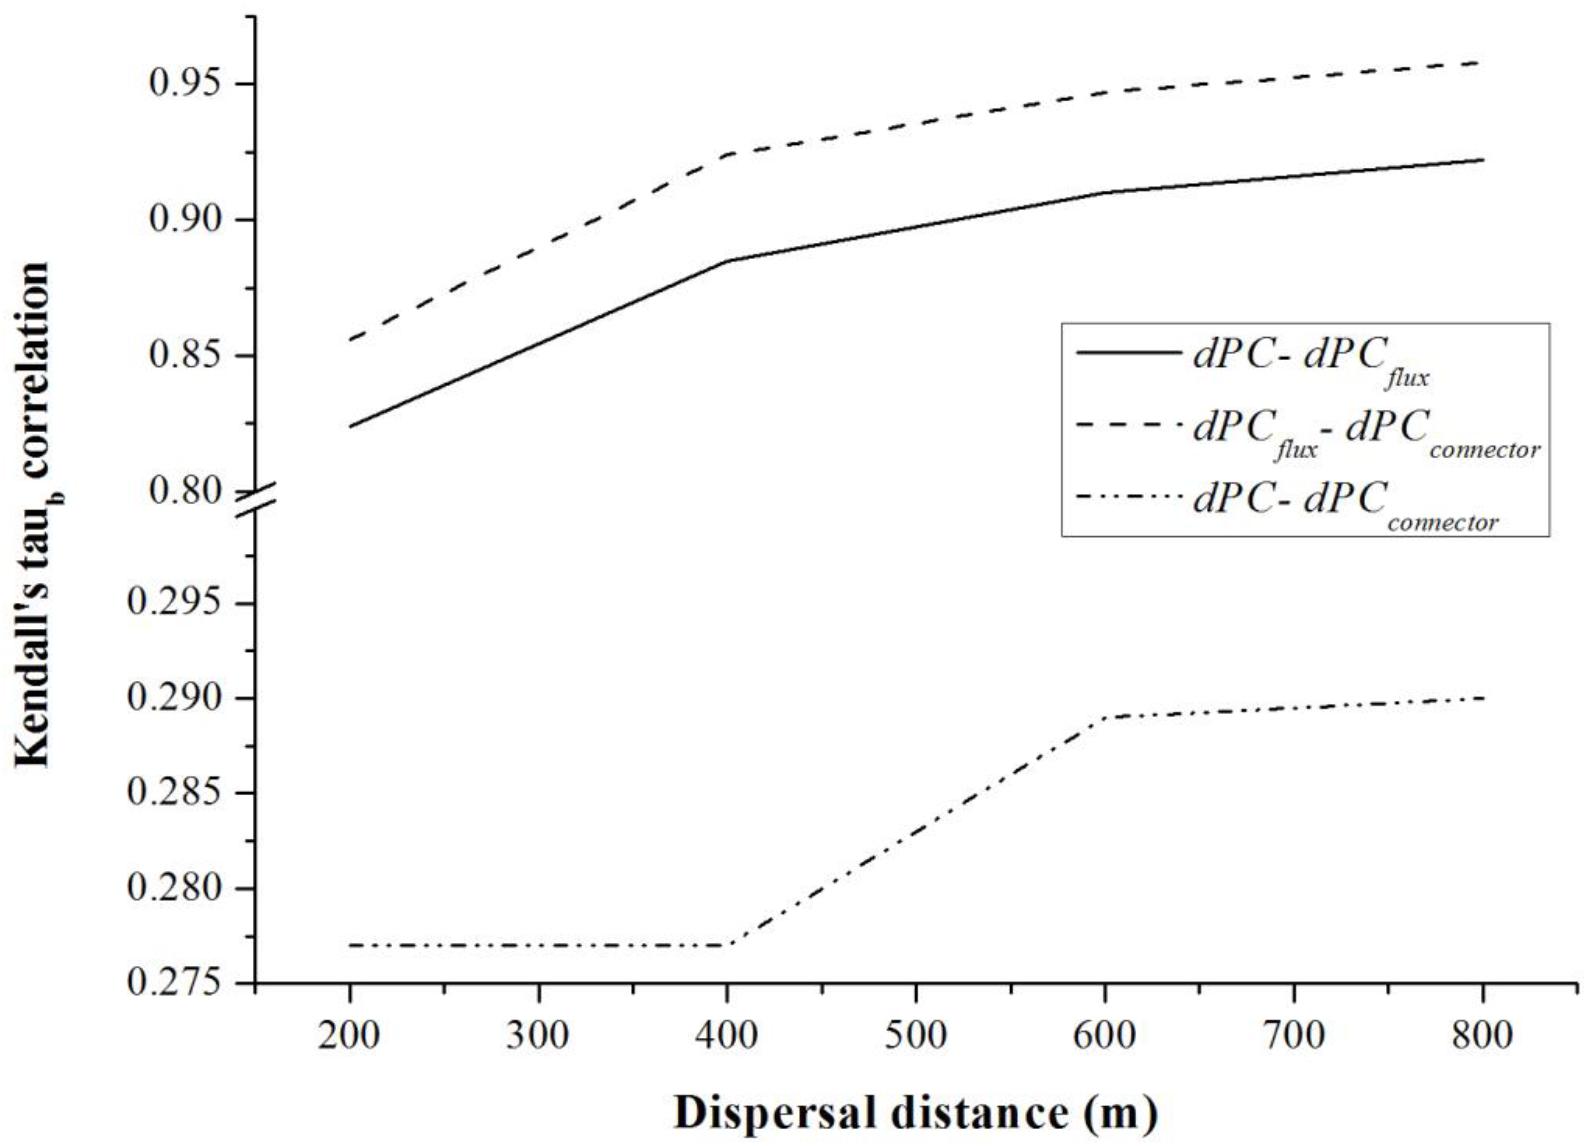
Figure 5. Kendall’s rank correlations (taub) between dPC, dPCflux, and dPCconnector, at different dispersal distances.
In emphasizing the prioritizing of habitat patches, our results identified some differences between BC (PC) and dPCconnector. Links or ecological corridors can only contribute through dPCconnector, not through dPCintra or dPCflux. Although the calculation of dPCconnector for a certain patch is independent of the patch attributes, it does consider patch area in the operational process.
In the present study, our results suggested that obvious changes to stepping stone patches occurred at both the maximum dispersal distance of 800 m and the minimum dispersal distance of 200 m (Figure 6). We consider the BC index and dPCconnector as the most effective metrics for identifying key habitat patches as stepping stones in the landscape. These key stepping stones between large habitat patches characterize the flux and total habitat area in the landscape near Manwan Dam.
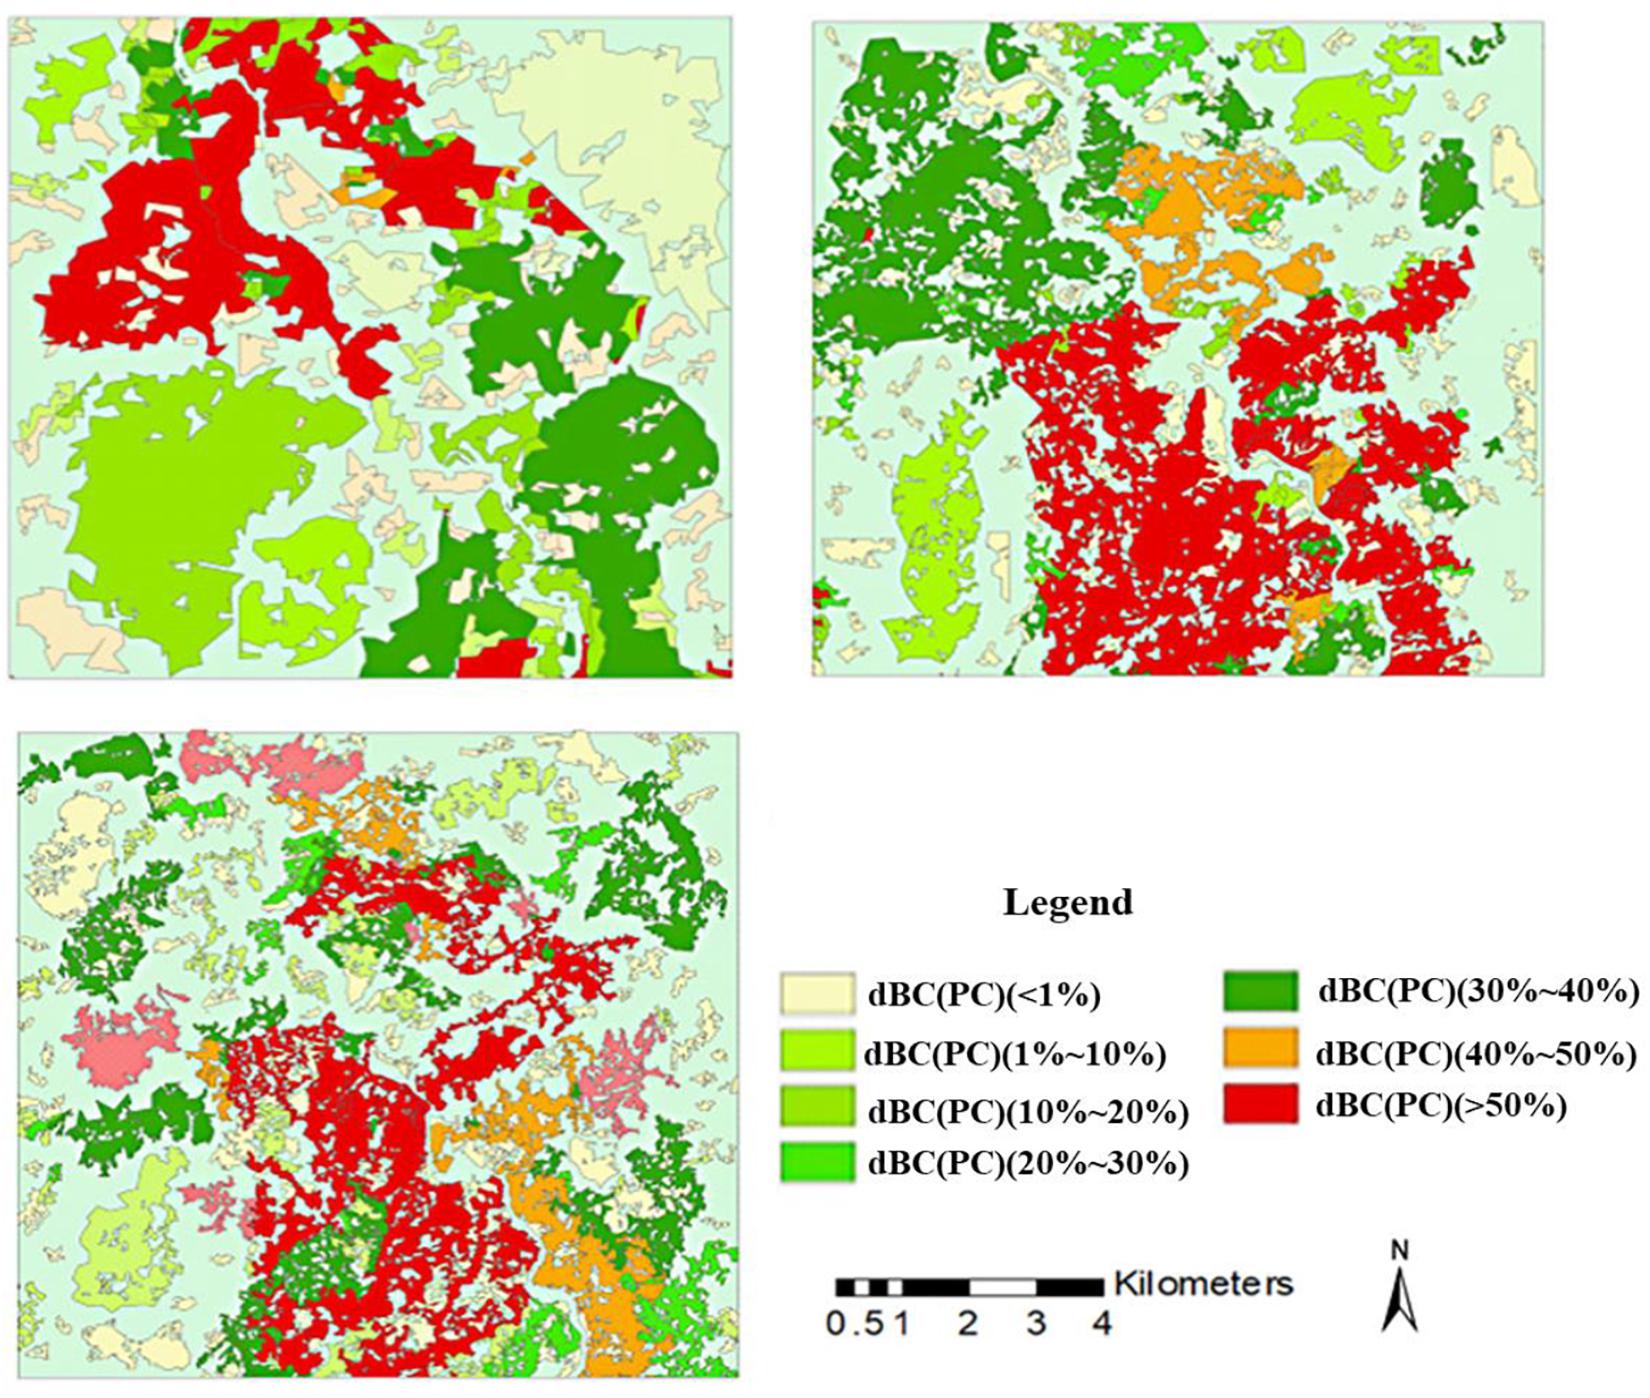
Figure 6. Dynamics of the Betweenness Centrality BC (PC) index in the three periods.
Although the BC (PC) metric does not directly measure the overall connectivity of the entire landscape, it is a topological indicator that only considered the habitat patch position at the patch scale. The BC indicator suggested that some larger area habitat patches near Manwan Dam were significant in maintaining the forest connectivity of the networks in the Manwan reservoir ecosystem (Figure 6). This indicator revealed the degree to which the shortest paths for dispersal between other habitat patches pass through a given habitat patch. However, the patch area or habitat quality of that particular patch that is connected through the shortest path was not taken into account.
In the post-dam era, landscape dynamics take place over time due to many driving factors, mainly anthropogenic alterations near dams. Variation in landscape distributions, which alter landscape connectivity and habitat availability, may be the result of dam construction, the extension of road networks, agricultural activities, economic development, and immigration (Safner et al., 2011).
Many researchers have focused on landscape dynamics due to dam construction and evaluation of the natural landscape at different spatial and temporal scales (Zhou et al., 2010; Zhao et al., 2012). Previous studies showed that the reservoir impoundment have significant effects on land use in the Manwan reservoir basin (Zhao et al., 2010). Due to the high level of anthropogenic disturbance in this region, dam construction can not only degrade river connectivity but also inhibit adjacent landscape processes in the river basin (Zhao et al., 2012). Our results indicated that landscape dynamics and fragmented watersheds influenced the connectivity of the adjacent landscape, particularly in 2004 (after the construction and impoundment of Manwan Dam). These results emphasize that functional landscape connectivity varies with dispersal ability and habitat availability in the fragmented landscape. In the present study, we discuss how a key ecological process (i.e., movements of local species) is strongly related to adjacent landscape changes and fragmented forest patches. Furthermore, the local microclimate can be greatly altered due to open water evaporation and influence the ecosystems directly.
Traditionally, buffer analysis with landscape pattern analysis had been performed to evaluate the land use dynamics associated with dam construction, which are characterized by different distances to a river channel or dam site (Zhao et al., 2012). In a previous study around the Manwan reservoir, landscape effects appeared to be greatest primarily within the 2000-m to 3000-m buffer zone, and the greatest change in patch density occurred within 1,000 m of the dam site during 1974–2004 (Zhao et al., 2012). In the present study, the combined application of the connectivity model with GIS was effective for the spatial and temporal assessment of landscape connectivity dynamics before and after dam construction. We selected 10 km (distance from Manwan Dam) as the buffer zone to analyze the upstream and downstream functional connectivity dynamics. Our results suggest that dECA(PC) may be an appropriate indicator for identifying critical priority habitat patches as connectivity providers in the areas upstream and downstream of Manwan Dam.
As the influence of dam construction extends well beyond the reservoir area, forest fragmentation and stress are discovered in upstream and downstream ecosystems from dams. In the Amazon basin, studies found the lack of a strategic dam construction plan could drive deforestation and lead to severe break in connectivity (Finer and Jenkins, 2012). It is proved that the continuity and abiotic conditions of habitat are disrupted by forests fragmentation, and leads to great changes in populations of animals and plants (Laurance et al., 2018), as well as disruptions of species interactions (Galetti and Dirzo, 2013). Thus, assessing functional connectivity in the fragmented forest landscape is effective for integrating fragmented forest patches and the dispersal activities of local species (Bunn et al., 2000). The impacts of habitat loss may be aggravated to varying degrees by the fragmentation of the habitat network (Saura et al., 2011). Considering the fragmentation process of forest patches, we used the landscape-based, functional connectivity indicator dECA(PC) to identify that landscape characteristic that determines the amount of available habitat, regardless of whether that habitat is available via interpatch connectivity. The dECA(PC) indicator was able to identify six different importance degrees of habitat patches as connectivity providers and conservation protectors, indicating the large forest patches yield the highest importance degrees for maintaining landscape connectivity.
Our study documented the terrestrial ecological processes that were affected by habitat fragmentation associated with dam construction. The isolated or connected patches in the fragmented landscape, particularly the small ones, were influenced by the potential dispersal abilities. As shown in our study, fragmentation of forest patches was greater in 2004 than in 1988 and 1974. The connection scenarios under different dispersal distance scenarios identified the isolated or connected patches for target species as they were strongly dependent on these potential dispersal thresholds. When the connection scenario was applied, the dECA(PC) index ranked each patch as a connectivity provider in relation to its habitat availability. And we identified that the greatest changes in the importance of habitat links among small patches occurred at a dispersal distance of 400 m by evaluating the results from all scenarios. Many connected patches with higher importance of habitat areas and links were assumed to be more important than isolated patches for the maintenance and improvement of landscape connectivity.
For many endemic species in forest-dwelling patches, responses to landscape pattern changes related to connectivity were not always the same. When we applied functional connectivity analyses to the entire forest landscape near the river channel, the most important problem to overcome was the large number of forest-dwelling species with varied movement abilities and other traits. The key issue of dispersal distance threshold selection remains, as these distances may vary with landscape pattern dynamics related to landscape connectivity (Saura et al., 2011). Although some researchers concentrate their efforts on the traits of endangered and endemic species in different regions around the world (Lander et al., 2010), insufficient data were available in the present study regarding the dispersal abilities and other traits of local species in the study region. Thus, there is some uncertainty inherent in the process of modeling connection scenarios and measuring landscape connectivity (Decout et al., 2012). Although this lack of information can reduce the efficacy of the functional connectivity models used to identify habitat patches as connectivity providers (Saura et al., 2011), our results show that some indicators, such as ECA(PC), rely less on the actual dispersal activities of local species, which are highly sensitive to changes in habitat area. Therefore, the potential dispersal distances of various endemic species were often assumed in the functional connectivity models.
The scale of dispersal capacities considered in this study may affect forest connectivity. In this case study, the organisms involved may include reptiles, amphibians, birds, plants (seeds), and their pollinators, and other endemic or endangered species. The dispersal distance thresholds are likely related to the movement abilities of these endemic species. Previous studies have suggested that only a small number of endemic and endangered species populations should be considered target species in functional connectivity analysis (Saura and Rubio, 2010). As many studies have reported species’ dispersal distances of within a few hundred meters, we chose dispersal thresholds of 200, 400, 600, and 800 m (equal intervals) for our connectivity scenarios (Liu et al., 2014). Target species such as Macaca nemestrina, Prebytis phayrei, Eothenomys custos or the seeds of target plant species may be more sensitive to changes in forest spatial patterns. They may benefit to a greater extent from available stepping stones, and their biological traits and dispersal capabilities will be specific to the Manwan reservoir ecosystem. Future studies should address the landscape connectivity dynamics of cascade dams (such as Xiaowan and Dachaoshan Dams) in Lancang River, as the different species and related ecological flows may be affected by the advanced forest spatial framework dynamics of the Manwan reservoir ecosystem.
This study analyzed changes in a modified ECA index in response to landscape dynamics to characterize the effects of dam construction on landscape connectivity. The overall connectivity measured by the ECA successively decreased from 1974 to 2004. With the change in landscape pattern, the connectivity upstream of Manwan Dam was much greater than downstream in 1974; however, in 1988 and 2004, the total ECA values upstream were lower than those downstream, indicating a large impact of dam construction on landscape connectivity. The spatio-temporal variation of forest networks on landscape connectivity in the Manwan basin indicated that dam construction had some negative ecological effects on landscape connectivity and forest conservation. The degree of connectivity was stable for most of the large habitat patches under the four dispersal distances (200, 400, 600, and 800 m). Only 8, 12, and 18% of patches in 1974, 1988, and 2006, respectively, exhibited obvious changes in connectivity. The greatest individual changes were found at the 400 m species dispersal distance in key forest patches located near the boundary of the study area. For the purposes of forest conservation, these crucial patches require more attention. As dispersal distance increased, dECA tended to increase slightly in all three years (1974, 1988, and 2004). Moreover, the rank correlations between forest patch area and the three dPC fractions indicated that, as forest availability metrics, dPC and its three fractions can effectively quantify the percentage importance of the connectivity on forest patches. These correlations also revealed that connectivity varied with dispersal distance. The BC(PC) index suggested that some large area or high quality habitat patches near Manwan Dam were significant in maintaining the forest connectivity of the networks in the Manwan basin. This research provides a case study of the analysis of landscape connectivity based on network analysis. In addition, for biodiversity and forest conservation efforts, future studies will require more information about the movement abilities of local species and incorporate this information into the calculation of the ECA index.
The original contributions presented in the study are included in the article/supplementary materials, further inquiries can be directed to the corresponding author/s.
All authors listed have made a substantial, direct and intellectual contribution to the work, and approved it for publication.
This work was supported by the Second Tibetan Plateau Scientific Expedition and Research Program (No. 2019QZKK0405-05), National Natural Sciences Foundation of China (No. 41571173), and Special Fund of State Key Joint Laboratory of Environment Simulation and Pollution Control (No. 19L01ESPC).
The authors declare that the research was conducted in the absence of any commercial or financial relationships that could be construed as a potential conflict of interest.
Anderson, K. E., and Hayes, S. M. (2018). The effects of dispersal and river spatial structure on asynchrony in consumer–resource metacommunities. Freshw. Biol. 63, 100–113. doi: 10.1111/fwb.12998
Arndt, S. (1999). Correlating and predicting psychiatric symptom ratings: spearman’s versus Kendall’s tau correlation. J. Psychaiatr Res. 33, 97–104. doi: 10.1016/s0022-3956(98)90046-2
Baguette, M., and Van Dyck, H. (2007). Landscape connectivity and animal behavior: functional grain as a key determinant for dispersal. Landsc. Ecol. 22, 1117–1129. doi: 10.1007/s10980-007-9108-4
Baranyi, G., Saura, S., Podani, J., and Jordán, F. (2011). Contribution of habitat patches to network connectivity: redundancy and uniqueness of topological indices. Ecol. Ind. 11, 1301–1310. doi: 10.1016/j.ecolind.2011.02.003
Bélisle, M. (2005). Measuring landscape connectivity: the challenge of behavioral landscape ecology. Ecology 86, 1988–1995. doi: 10.1890/04-0923
Bodin, Ö, and Saura, S. (2010). Ranking individual habitat patches as connectivity providers: integrating network analysis and patch removal experiments. Ecol. Modelling 221, 2393–2405. doi: 10.1016/j.ecolmodel.2010.06.017
Bombino, G., Tamburino, V., and Zimbone, S. (2006). Assessment of the effects of check-dams on riparian vegetation in the mediterranean environment: a methodological approach and example application. Ecol. Eng. 27, 134–144. doi: 10.1016/j.ecoleng.2006.01.005
Bowman, J., Jaeger, J. A. G., and Fahrig, L. (2002). Dispersal distance of mammals is proportional to home range size. Ecology 83, 2049–2055. doi: 10.1890/0012-9658(2002)083[2049:ddomip]2.0.co;2
Bunn, A., Urban, D., and Keitt, T. (2000). Landscape connectivity: a conservation application of graph theory. J. Environ. Manag. 59, 265–278. doi: 10.1006/jema.2000.0373
Carrara, F., Altermatt, F., Rodriguez-Iturbe, I., and Rinaldo, A. (2012). Dendritic connectivity controls biodiversity patterns in experimental metacommunities. Proc. Natl. Acad. Sci. U.S.A. 109, 5761–5766. doi: 10.1073/pnas.1119651109
Carrara, F., Rinaldo, A., Giometto, A., and Altermatt, F. (2014). Complex interaction of dendritic connectivity and hierarchical patch size on biodiversity in river-like landscapes. Am. Nat. 183, 13–25. doi: 10.1086/674009
Decout, S., Manel, S., Miaud, C., and Luque, S. (2012). Integrative approach for landscape-based graph connectivity analysis: a case study with the common frog (Rana temporaria) in human-dominated landscapes. Landsc. Ecol. 27, 267–279. doi: 10.1007/s10980-011-9694-z
Diaz-Varela, E. R., Marey-Pérez, M. F., Rigueiro-Rodriguez, A., and Álvarez-Álvarez, P. (2009). Landscape metrics for characterization of forest landscapes in a sustainable management framework: potential application and prevention of misuse. Ann. For. Sci. 66:301. doi: 10.1051/forest/2009004
Fagan, W. F. (2002). Connectivity, fragmentation, and extinction risk in dendritic metapopulations. Ecology 83, 3243–3249. doi: 10.1890/0012-9658(2002)083[3243:cfaeri]2.0.co;2
Fahrig, L. (2003). Effects of habitat fragmentation on biodiversity. Ann. Rev. Ecol.Evol.Syst. 34, 487–515.
Feng, Y., He, D., and Bao, H. (2000). Study on the equitable and suitable allocation model of water resources in the Lancang-Mekong River Basin. J. Nat. Resour. 15, 241–245.
Finer, M., and Jenkins, C. N. (2012). Proliferation of hydroelectric dams in the Andean Amazon and implications for Andes-Amazon connectivity. PLoS One 7:e35126. doi: 10.1371/journal.pone.0035126
Forman, R. T. T., and Deblinger, R. D. (2000). The ecological road-effect zone of a Massachusetts (USA) suburban highway. Conserv. Biol. 14, 36–46. doi: 10.1046/j.1523-1739.2000.99088.x
Galetti, M., and Dirzo, R. (2013). Ecological and evolutionary consequences of living in a defaunated world. Biol. Conserv. 136, 1–6. doi: 10.1016/j.biocon.2013.04.020
Galpern, P., Manseau, M., and Fall, A. (2010). Patch-based graphs of landscape connectivity: a guide to construction, analysis and application for conservation. Biol. Conserv. 144, 44–55. doi: 10.1016/j.biocon.2010.09.002
Gordon, E., and Meentemeyer, R. K. (2006). Effects of dam operation and land use on stream channel morphology and riparian vegetation. Geomorphology 82, 412–429. doi: 10.1016/j.geomorph.2006.06.001
He, D., Zhao, W., and Chen, L. (2004). Ecological change in the Manwan reservoir area and its causes. J. Yunnan Univ. 26, 220–226.
Johst, K., Brandl, R., and Eber, S. (2002). Metapopulation persistence in dynamic landscapes: the role of dispersal distance. Oikos 98, 263–270. doi: 10.1034/j.1600-0706.2002.980208.x
Laita, A., Mnkknen, M., and Kotiaho, J. S. (2010). Woodland key habitats evaluated as part of a functional reserve network. Biol. Conserv. 143, 1212–1227. doi: 10.1016/j.biocon.2010.02.029
Lander, T. A., Boshier, D. H., and Harris, S. A. (2010). Fragmented but not isolated: contribution of single trees, small patches and long-distance pollen flow to genetic connectivity for Gomortega keule, an endangered Chilean tree. Biol. Conserv. 143, 2583–2590. doi: 10.1016/j.biocon.2010.06.028
Laurance, W. F., Camargo, J. L. C., Fearnside, P. M., Lovejoy, T. E., Williamson, G. B., Mesquita, R. C. G., et al. (2018). An Amazonian rainforest and its fragments as a laboratory of global change. Biol. Rev. 93, 223–247. doi: 10.1111/brv.12343
Liu, H., Xie, H., Chen, L., Zhang, J., and Gan, S. (2006). Monitoring of land-cover dynamic change in Lancangjiang River cascaded Hydropower Area. Wuhan Univ. J. Nat. Sci. 11, 1015–1020. doi: 10.1007/bf02830203
Liu, S., Deng, L., and Dong, S. (2014). Landscape connectivity dynamics based on network analysis in the Xishuangbanna Nature Reserve, China. Acta Oecol. 55, 66–77. doi: 10.1016/j.actao.2013.12.001
Ma, C., Shen, Y., Bearup, D., Fagan, W. F., and Liao, J. (2020). Spatial variation in branch size promotes metapopulation persistence in dendritic river networks. Freshw. Biol. 65, 426–434. doi: 10.1111/fwb.13435
Minor, E. S., and Urban, D. L. (2008). A graph-theory framework for evaluating landscape connectivity and conservation planning. Conserv. Biol. 22, 297–307. doi: 10.1111/j.1523-1739.2007.00871.x
Nichols, E., Spector, S., Louzada, J., Amezquita, S., Favila, M. E., The Scarabaeinae Research Network, et al. (2008). Ecological functions and ecosystem services provided by Scarabaeinae dung beetles. Biol. Conserv. 141, 1461–1474. doi: 10.1016/j.biocon.2008.04.011
Norušis, M. J. (1993). SPSS for Windows: Base System User’s Guide, Release 6.0. Upper Saddle River, NJ: Prentice Hall.
Pascual-Hortal, L., and Saura, S. (2006). Comparison and development of new graph-based landscape connectivity indices: towards the prioritization of habitat patches and corridors for conservation. Landsc. Ecol. 21, 959–967. doi: 10.1007/s10980-006-0013-z
Pascual-Hortal, L., and Saura, S. (2007). Impact of spatial scale on the identification of critical habitat patches for the maintenance of landscape connectivity. Landsc. Urban Plann. 83, 176–186. doi: 10.1016/j.landurbplan.2007.04.003
Safner, T., Miaud, C., Gaggiotti, O., Decout, S., Rioux, D., and Zundel, S. (2011). Combining demography and genetic analysis to assess the population structure of an amphibian in a human-dominated landscape. Conserv. Genet. 12, 161–173. doi: 10.1007/s10592-010-0129-1
Saura, S., Estreguil, C., Mouton, C., and Rodríguez-Freire, M. (2011). Network analysis to assess landscape connectivity trends: application to European forests (1990–2000). Ecol. Ind. 11, 407–416. doi: 10.1016/j.ecolind.2010.06.011
Saura, S., and Pascual-Hortal, L. (2007). A new habitat availability index to integrate connectivity in landscape conservation planning: comparison with existing indices and application to a case study. Landsc. Urban Plann. 83, 91–103. doi: 10.1016/j.landurbplan.2007.03.005
Saura, S., and Rubio, L. (2010). A common currency for the different ways in which patches and links can contribute to habitat availability and connectivity in the landscape. Ecography 33, 523–537.
Saura, S., and Torné, J. (2009). Conefor Sensinode 2.2: a software package for quantifying the importance of habitat patches for landscape connectivity. Environ. Modelling Softw. 24, 135–139. doi: 10.1016/j.envsoft.2008.05.005
Sutherland, G. D., Harestad, A. S., Price, K., and Lertzman, K. (2000). Scaling of natal dispersal distances in terrestrial birds and mammals. Conserv. Ecol. 4:16.
Taylor, P. D., Fahrig, L., Henein, K., and Merriam, G. (1993). Connectivity is a vital element of landscape structure. Oikos 68, 571–572. doi: 10.2307/3544927
Wang, H., Sork, V. L., Wu, J., and Ge, J. (2010). Effect of patch size and isolation on mating patterns and seed production in an urban population of Chinese pine (Pinus tabulaeformis Carr.). For. Ecol. Manag. 260, 965–974. doi: 10.1016/j.foreco.2010.06.014
Yang, J., Liu, S., Wang, C., Deng, L., and Dong, S.-K. (2013). Forest pattern dynamics and landscape connectivity changes in the Manwan Basin after dam construction in the Lancang River, China. Landsc. Ecol. Eng. 10, 77–83. doi: 10.1007/s11355-013-0217-8
Zetterberg, A., Mrtberg, U. M., and Balfors, B. (2010). Making graph theory operational for landscape ecological assessments, planning, and design. Landsc. Urban Plann. 95, 181–191. doi: 10.1016/j.landurbplan.2010.01.002
Zhang, F., Tashpolat, T., Kung, H., and Ding, J. (2010). The change of land use/cover and characteristics of landscape pattern in arid areas oasis: an application in Jinghe. Xinjiang. Geo Spatial Inform. Sci. 13, 174–185. doi: 10.1007/s11806-010-0322-x
Zhao, Q., Liu, S., Deng, L., Dong, S., Wang, C., and Yang, Z. (2012). Landscape change and hydrologic alteration associated with dam construction. Int. J. Appl. Earth Observ. Geoinf. 16, 17–26. doi: 10.1016/j.jag.2011.11.009
Zhao, Q., Liu, S., and Dong, S. (2010). Effect of dam construction on spatial-temporal change of land use: a case study of Manwan, Lancang River, Yunnan, China. Proc. Environ. Sci. 2, 852–858. doi: 10.1016/j.proenv.2010.10.096
Zhou, Q., Ou, X., and Zhang, Z. (2008). Spatial-temporal land use pattern changes in Manwan hydropower station Reservoir of Lancang River, Yunnan, China. J. Mt. Sci. 26, 481–489.
Keywords: forest landscape connectivity, patch prioritization, spatiotemporal difference, Manwan dam, Lancang River
Citation: Liu S, Wang F, Deng L, Dong Y and Liu Y (2021) Multi-Scale Ecological Connectivity Dynamics Associated With Hydropower Station: A Case Study in the Lancang River Valley. Front. Ecol. Evol. 8:616356. doi: 10.3389/fevo.2020.616356
Received: 12 October 2020; Accepted: 02 December 2020;
Published: 08 January 2021.
Edited by:
Emilio Pagani-Núñez, Xi’an Jiaotong-Liverpool University, ChinaReviewed by:
Jinbao Liao, Jiangxi Normal University, ChinaCopyright © 2021 Liu, Wang, Deng, Dong and Liu. This is an open-access article distributed under the terms of the Creative Commons Attribution License (CC BY). The use, distribution or reproduction in other forums is permitted, provided the original author(s) and the copyright owner(s) are credited and that the original publication in this journal is cited, in accordance with accepted academic practice. No use, distribution or reproduction is permitted which does not comply with these terms.
*Correspondence: Shiliang Liu, c2hpbGlhbmdsaXVAYm51LmVkdS5jbg==
Disclaimer: All claims expressed in this article are solely those of the authors and do not necessarily represent those of their affiliated organizations, or those of the publisher, the editors and the reviewers. Any product that may be evaluated in this article or claim that may be made by its manufacturer is not guaranteed or endorsed by the publisher.
Research integrity at Frontiers
Learn more about the work of our research integrity team to safeguard the quality of each article we publish.