 Can Huang1
 Xiao-Fan Li
95% of researchers rate our articles as excellent or good
Learn more about the work of our research integrity team to safeguard the quality of each article we publish.
Find out more
ORIGINAL RESEARCH article
Front. Ecol. Evol. , 11 January 2021
Sec. Conservation and Restoration Ecology
Volume 8 - 2020 | https://doi.org/10.3389/fevo.2020.612883
This article is part of the Research Topic Dams and Wetland Biodiversity: Impacts and Mitigating Measures View all 8 articles
As an important way to promote economic growth and to improve ecological environment quality, industrial agglomeration strategy has been widely accepted and implemented in various regions of China. In theory, industrial agglomeration is conducive to reducing pollution emissions. However, this needs to be tested in reality. The purpose of this paper is to test the impacts of manufacturing industry agglomeration on the quality of water ecological environment in 17 prefecture-level cities downstream of the Three Gorges Dam. Therefore, a theoretical model was established to test the direct and indirect effects. Empirically, results show that the direct effect of manufacturing agglomeration on the quality of water ecological environment is −0.426, which provides statistical evidence for the important role of manufacturing agglomeration in improving the quality of water ecological environment. The indirect effect of manufacturing agglomeration on ammonia nitrogen (NH3-N) is 0.118% through technological innovation, the indirect effect on NH3-N is 0.114% through economic growth, and the indirect effect on NH3-N is 0.254% through industrial structure. Due to the low overall level of the manufacturing industry and its reliance on dirty technologies, the indirect effects of industrial agglomeration are not conducive to improving the quality of the water ecological environment. Therefore, it is necessary to establish a long-term mechanism to promote the evolution of the regional economy along a path that is conducive to the improvement of the water ecological environment.
With urban economic growth and population expansion, series of ecological and environmental problems such as water pollution, land occupation, soil degradation, air pollution, and reduction of biodiversity have become more and more obvious (Dai et al., 2016; Wu et al., 2019, 2020a). Environmental pollutions have already caused the health and safety of Chinese residents (Ebenstein et al., 2015; Elahi et al., 2019a; Gu et al., 2019).
Under the Chinese government’s new development concept of “clear water and green mountains are also mountains of golden and silver,” the water ecological environment protection of the Three Gorges of the Yangtze River has been highly valued. In April 2018, General Secretary Jin-Ping Xi hosted a symposium on in-depth promotion of the development of the Yangtze River Economic Belt in Wuhan, pointing out that the high-density layout of heavy and chemical industries along the Yangtze River has long been a concentrated area of heavy chemical industry in China. He said that we must do a good job in the restoration of the ecological environment of the Yangtze River, explore new ways to coordinate the promotion of ecological priority and green development, and promote the high-end and green development of the chemical industry in the Yangtze River Economic Zone. In August 2018, the Ministry of Ecology and Environment and the National Development and Reform Commission jointly issued the “Action Plan for the Protection and Restoration of the Yangtze River,” which put forward clear tasks for the protection of the water ecology of the mainstream of the Yangtze River, major tributaries, and key lakes and reservoirs and forbidding the agglomeration and migration of polluting industries and enterprises to the middle and upper reaches of the Yangtze River. In 2020, the Ministry of Agriculture and Rural Affairs announced that a 10 year ban on fishing along the Yangtze River would come into effect on January 1 this year. Although the Chinese government has adopted a series of measures to protect the ecological environment, the long-term and extensive development mode still puts the ecological environment of the Yangtze River Basin under severe pressure. In 2018, the 510 water quality sections monitored in the Yangtze River Basin were classified as national standard IV∼V and the inferior class V accounted for 12.6%.
Downstream of the Three Gorges Dam, which is located in Sandouping Town, Yichang City, Hubei Province, flowing through Hubei, Jiangxi, Hunan, Anhui, Jiangsu, Zhejiang, and Shanghai, is a densely populated area and concentrated industries in the Yangtze River Basin. According to the surface water quality monitoring data of the Ministry of Ecology and Environment of the People’s Republic of China, the changes of three water quality indexes [dissolved oxygen (DO), chemical oxygen demand (COD), and ammonia nitrogen (NH3-N)] in 17 cities of Yichang, Yueyang, Jiujiang, Anqing, Nanjing, Shiyan, Changsha, Wuhan, Nanchang, Yangzhou, Hangzhou, Wuxi, Suzhou, Huzhou, Shanghai, Jiaxing, and Hefei downstream of the Three Gorges Dam were obtained (Figure 1). From 2007 to 2018, the quality of water ecological environment of most cities has improved. Cities such as Shanghai and Jiaxing have higher COD and NH3-N values, indicating that the water ecological environment quality of these cities is inferior to other cities.

Figure 1. Comparison of urban water ecological environment quality in 2007 and 2018.
Many studies have conducted an environmental impact assessment from agriculture (Kamyab et al., 2016; Elahi et al., 2018a; Abid et al., 2019; Dai et al., 2019), animal husbandry (Elahi et al., 2018b, 2019b), and industry (Peng et al., 2018) and attributed water ecological and environmental problems to economic growth (Choi et al., 2015; Liu et al., 2016; Cai et al., 2020), population expansion (Fan and Fang, 2020), environmental regulation (ER) (Pan and Tang, 2021), cross-regional trade (Wu and Ye, 2020), and land planning (Peng et al., 2019; Elahi et al., 2020; Wu et al., 2020b).
In fact, industrial agglomeration is also one of the important factors influencing the quality of the water ecological environment. Especially in developing countries like China, as an important engine to promote economic growth, the strategy of industrial agglomeration has been widely accepted and implemented. With the development of global economic integration and the continuous advancement of new urbanization, as well as the implementation of regional development strategies such as the Yangtze River Economic Belt, the Silk Road Economic Belt, and the twenty-first Century Maritime Silk Road, China’s industrial agglomeration characteristics will be further strengthened. It can be seen from Table 1 that the manufacturing agglomeration degree of most cities downstream of the Three Gorges Dam is greater than 1, and the cities with the largest industrial agglomeration are mainly Wuxi, Suzhou, Hangzhou, Jiaxing, and Shiyan, among which the industrial agglomeration degree of Jiaxing and Suzhou is greater than 2. It shows that the manufacturing industries in these cities have obvious spatial agglomeration characteristics.
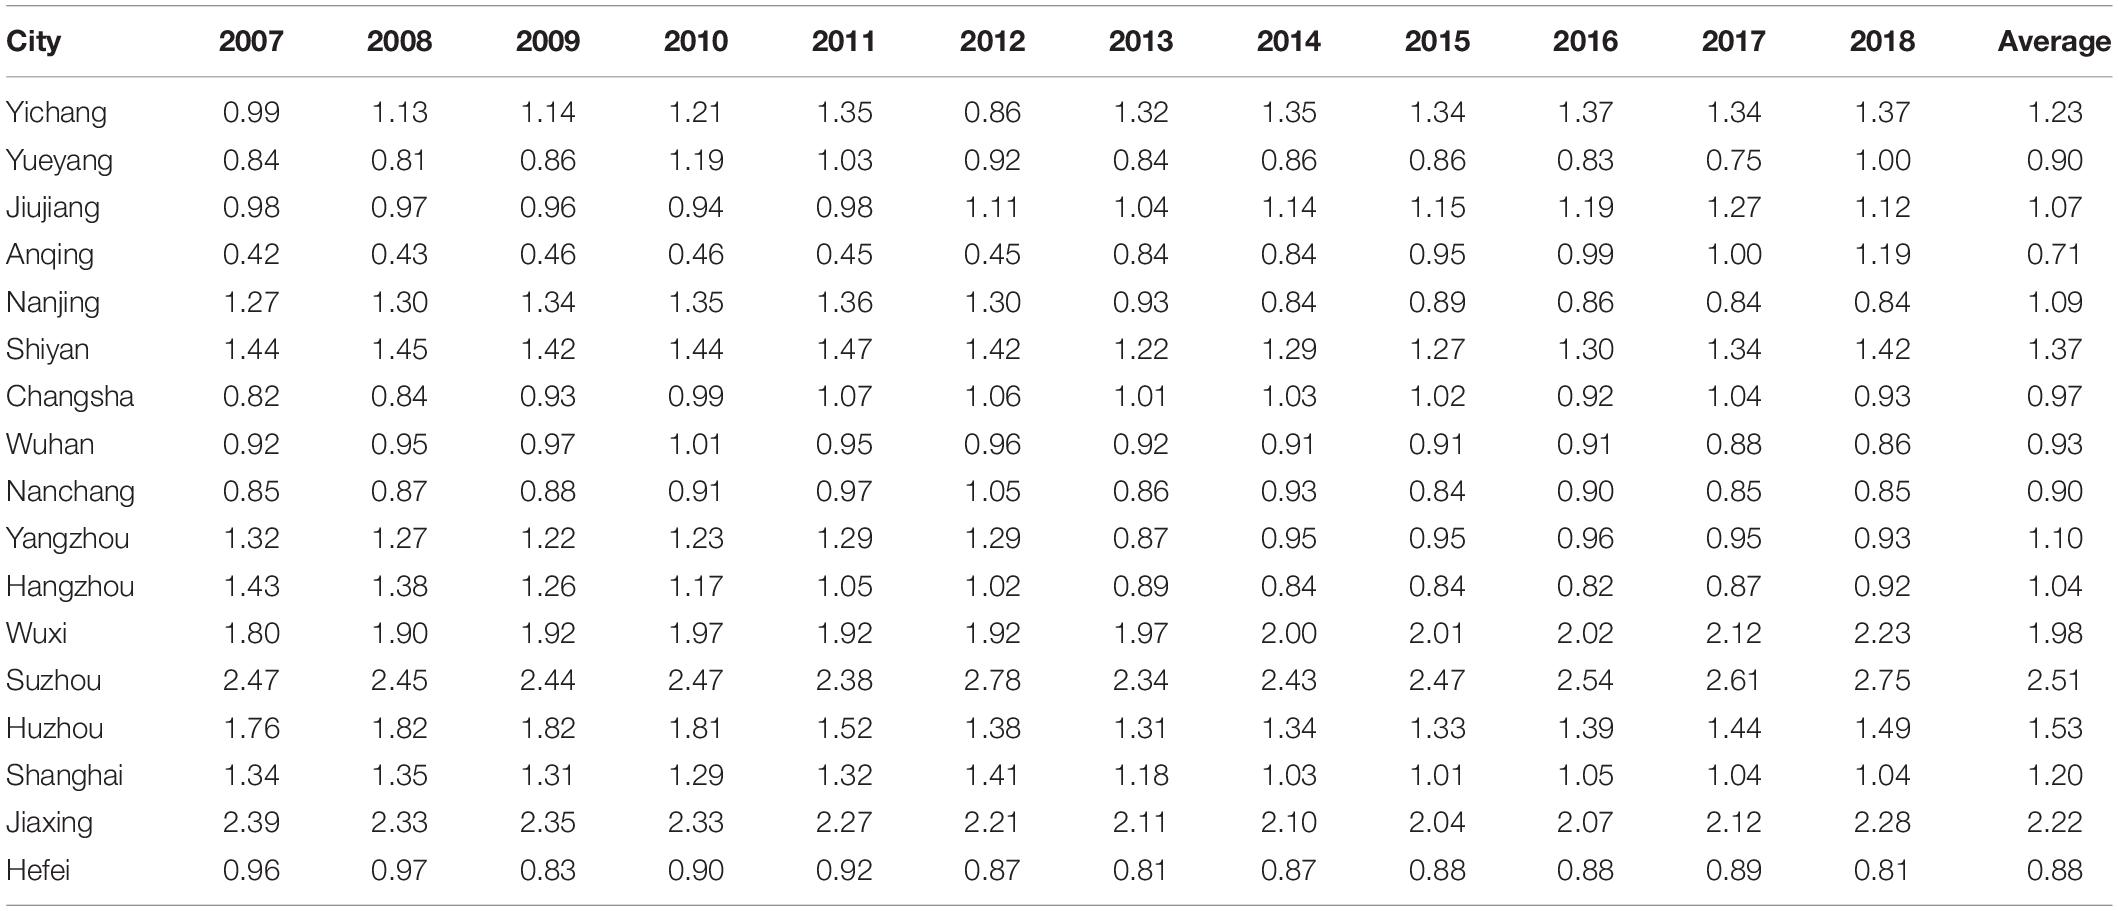
Table 1. The degree of manufacturing agglomeration in each city from 2007 to 2018.
It is generally believed that industrial agglomeration mainly affects environmental pollution through three paths: economies of scale, technology spillover effect, and structural effect. The economies of scale of agglomeration are conducive to improving labor productivity (Combes and Gobillon, 2015; Wetwitoo and Kato, 2017), and the increase in labor productivity is conducive to improving the efficiency of resource utilization, thereby improving environmental quality. Agglomeration can also realize the scale effect of pollution control, reduce the cost of public pollution control, and enhance the ability of environmental pollution control (Taylor and Copeland, 2004). Sharing technology spillover effect among enterprises helps to improve production technology level and promote technological innovation (Porter, 1998; Storper and Venables, 2004). This may help improve environmental quality (Grossman and Krueger, 1991; Irandoust, 2016; Chen et al., 2019; Ganda, 2019; Sinha et al., 2020). The industrial structure (IS) reflects the pollution-intensive nature of economic activities. When the IS changes from agriculture to industry, the pollution level rises. When the economy enters the “post-industrialization” period, the IS further shifts from energy-intensive industries to knowledge-intensive industries and service industries, the pollution level drops (Dinda, 2004).
In theory, industrial agglomeration is conducive to reducing pollution emissions. However, whether agglomeration can produce positive environmental externalities depends on whether the three effects of agglomeration on environmental pollution can be effectively exerted. Some studies have found that industrial agglomeration exacerbates environmental pollution (Ren et al., 2003; Cheng, 2016; Liu et al., 2017; Dong et al., 2019). Therefore, it is necessary to study the influence path of industrial agglomeration on the quality of water ecological environment.
Although existing studies have analyzed the impacts of industrial agglomeration in different countries on the quality of the water ecological environment, including Finland (Virkanen, 1998), Vietnam (Duc, 2007), and China (Cheng, 2016), the impact of urban manufacturing agglomeration downstream of the Three Gorges Dam is still uncertain. The important contribution of this paper is to research whether manufacturing agglomeration downstream of the Three Gorges Dam has an impact on the water ecological environment quality. And for the first time, the scale economy effect, technology spillover effect, and structural effect of industrial agglomeration are added to the model, so as to reflect the direct and indirect effects of manufacturing agglomeration.
The sample data used in this paper come from 17 prefecture-level cities in Yichang, Yueyang, Jiujiang, Anqing, Nanjing, Shiyan, Changsha, Wuhan, Nanchang, Yangzhou, Hangzhou, Wuxi, Suzhou, Huzhou, Shanghai, Jiaxing, and Hefei downstream of the Three Gorges Dam. The span uses annual data from 2007 to 2018. The data mainly come from the “China City Statistical Yearbook” and the automatic water quality monitoring report of the China Environmental Monitoring Station.
Table 2 shows the descriptive statistics of each variable. Among them, NH3-N is the explained variable, which is measured by the concentration of NH3-N discharged from the water. The main explanatory variable is manufacturing agglomeration (IA). Other explanatory variables include economic growth (PGDP), IS, technological innovation (TO), total population (POP), ER, total foreign direct investment (FDI), and wastewater discharge (IND_WATER). Among them, manufacturing agglomeration (IA) is represented by the location quotient index (LQ) measured by the number of manufacturing employees; economic growth (PGDP) is reflected by per capita gross domestic product (GDP), that is, the ratio of gross domestic product to registered population; IS is represented by the proportion of the output value of the secondary industry in GDP; technological innovation (TO), expressed by the expenditure on science and technology of each city; POP, expressed by the total population registered in each city; ER, expressed by the number of employees in water conservancy, environment, and public facilities management; total FDI is expressed by the amount of foreign capital actually used; and wastewater discharge (IND_WATER) is expressed by industrial wastewater discharge. Considering the magnitude difference of each variable, in the next step of regression, the logarithm of each variable is processed first.
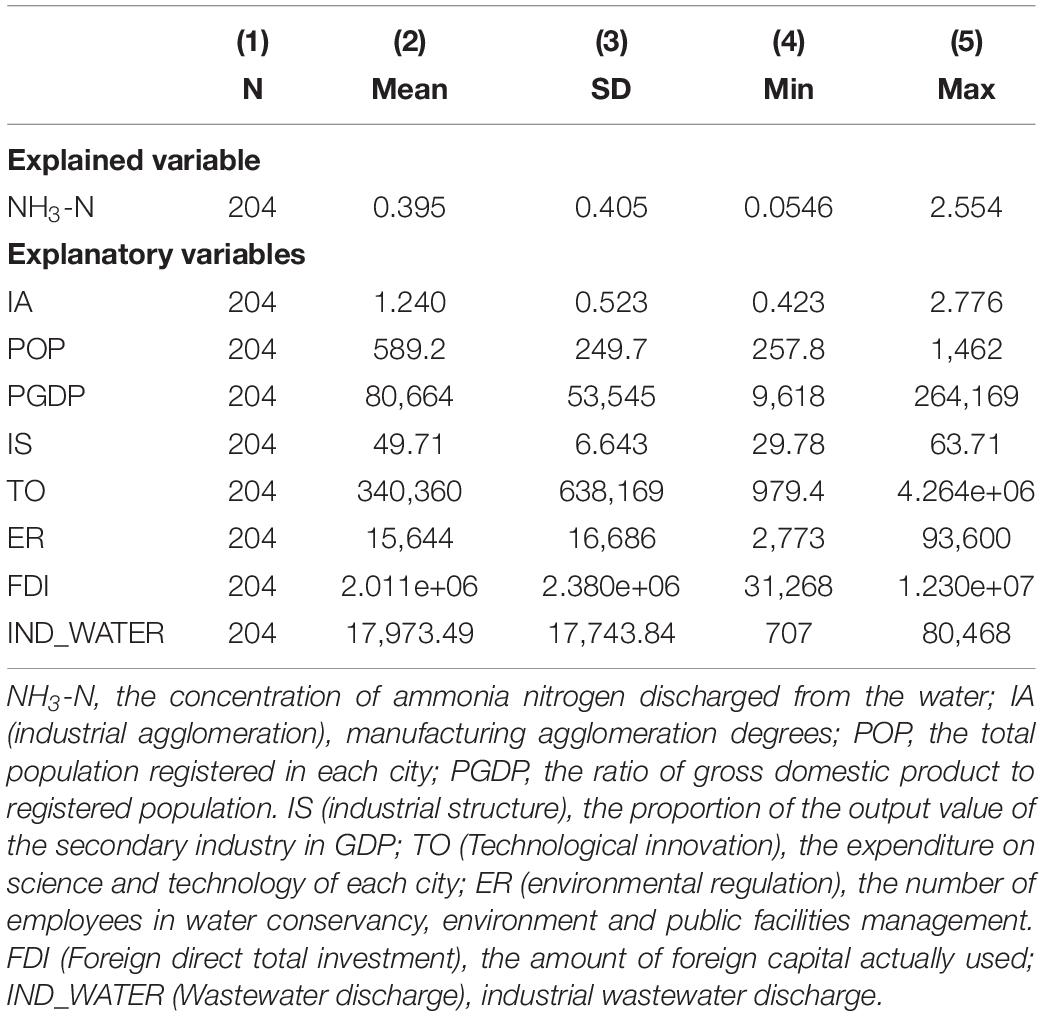
Table 2. Descriptive statistics.
Considering that manufacturing agglomeration has an impact on the quality of water ecological environment through the three effects of economies of scale, technological spillover, and structural effect, a mediating effect model is established for the three effects. The specific model form is shown in formulas (1) and (2).
In the formula, mediator represents the intermediary variable, which is lnPGDP in the effect of economies of scale, lnTO in the effect of technological spillover, and lnIS in the effect of IS. The pollution indicates the quality of the water ecological environment, measured by the concentration of NH3-N discharged in the water. IA represents the degree of manufacturing agglomeration. Xi is the control variable, including population size (POP), ER, the total FDI, and the wastewater discharge (IND_WATER). The α and β are the coefficients of each variable.
This paper uses the LQ calculated by the number of manufacturing employees to reflect the degree of manufacturing agglomeration. The index is used to measure the concentration of certain activities in the studied area relative to the reference area. It is used to reflect where the industry is concentrated and the degree of specialization of the industry (Zheng and Lin, 2018), which can better reflect the spatial distribution of elements (Dong et al., 2020). The calculation method is as follows:
In formula (3), ei represents the total output value of manufacturing industry in region i; Ei represents the gross product of region i. Location quotient equal to 1 means that the concentration of manufacturing activities in the studied region is the same as that of the reference region. Location quotient less than 1 means that the manufacturing agglomeration in the studied region is low, and location quotient greater than 1 means that the manufacturing agglomeration in the studied region is higher.
In order to control the influence of unobserved factors, this paper adopts fixed-effects model and random-effects model to estimate the model, respectively. The fixed-effects model is used to eliminate the influence of individual effects. When using a random-effects model, first assume that the individual effects of the model are not related to the explanatory variables. Then, the coefficients are estimated by the generalized least square method (GLS). According to Hausman test, it can be judged whether the estimation bias is caused by ignoring the individual fixed effects.
Equations 1–3 in Table 3 report the regression results based on formula (1) with lnTO, lnPGDP, and lnIS as the explained variables, respectively. The Hausman estimation results show the null hypothesis that the estimated coefficients of the rejection model are not systematically different, so the FE model is selected as the final estimation result. From the results in Table 3, it can be seen that manufacturing agglomeration has a significant positive effect on technological innovation and the IS while having a significant negative effect on economic growth. Specifically, for every 1% increase in the level of manufacturing agglomeration, technological innovation increases by 1.010%, economic growth decreases by 0.350%, and the proportion of the secondary industry increases by 0.227%, indicating that manufacturing agglomeration still has a positive effect on technological innovation, but the current manufacturing agglomeration has a certain degree of diseconomies of scale.
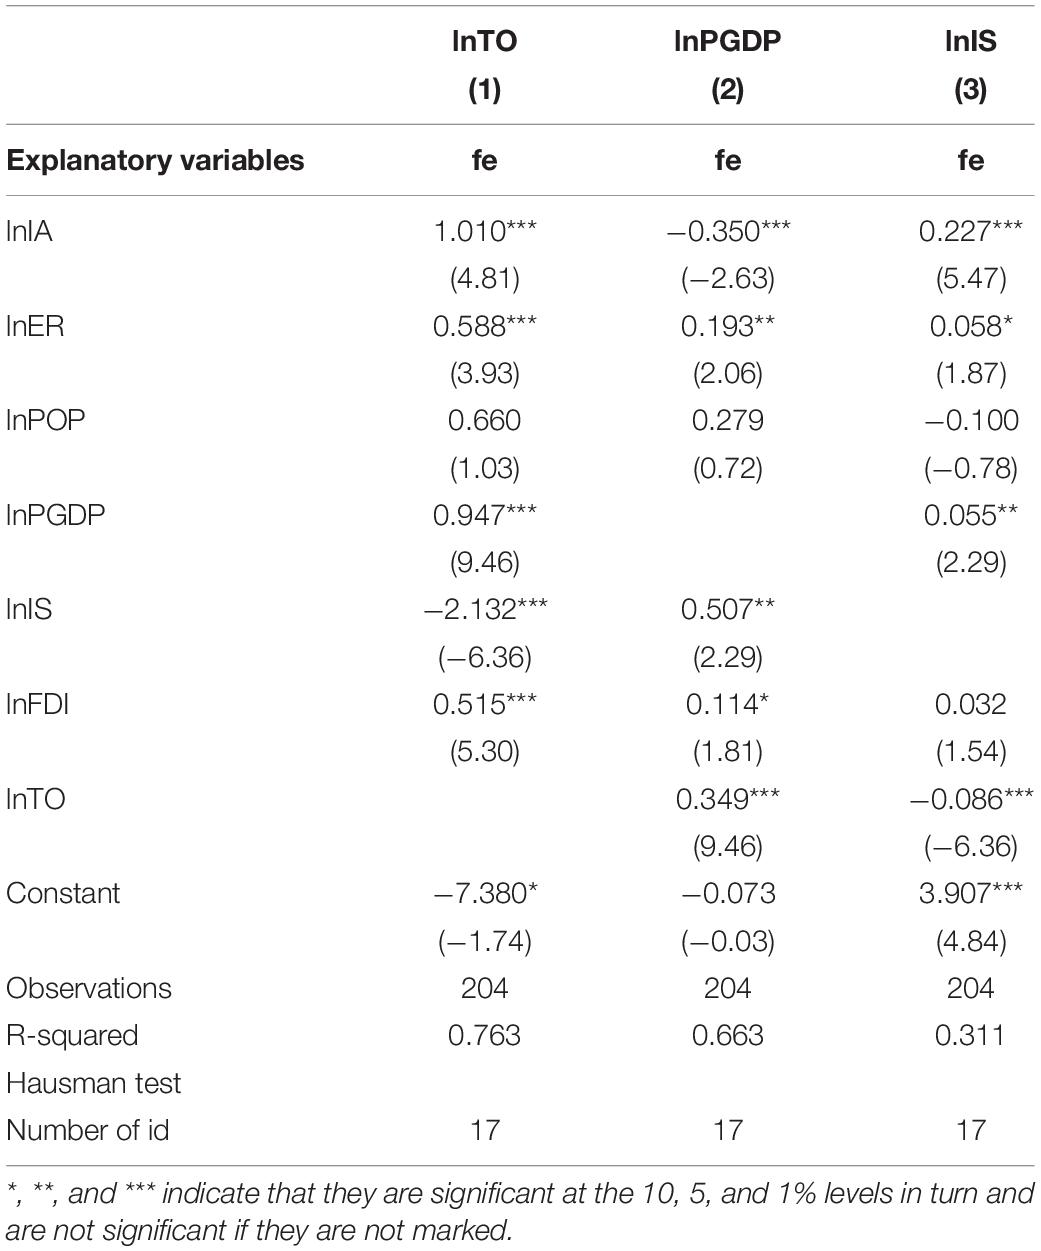
Table 3. The impacts of manufacturing agglomeration on technological innovation, economic growth, and industrial structure.
In terms of other explanatory variables, ER, economic growth, and FDI have significant positive effects on technological innovation, and the proportion of the secondary industry in GDP has a significant negative effect on technological innovation. The current manufacturing agglomeration is mostly labor-intensive and capital-intensive industries, and it is already in the stage of diseconomies of scale, the efficiency and quality of agglomeration are not high, so the increase in the proportion of the secondary industry will hinder technological innovation. ER, the proportion of the secondary industry, FDI, and technological innovation all have significant positive effects on economic growth. The explanation for this is that ER will improve efficiency and increase economic scale through measures such as strengthening industrial park planning and industry supervision. At the same time, the proportion of the secondary industry, FDI, and technological innovation can all expand the economic scale by improving structure, increasing investment, and improving efficiency. ER and economic growth have significant positive effects on the proportion of the secondary industry, and technological innovation has a significant negative effect on the proportion of the secondary industry. The explanation for this is that due to the existence of path dependence, the increase in the proportion of the secondary industry is not driven mainly by technological innovation, but by labor-intensive and capital-intensive promotion, thus “squeezing out” the space for technological innovation. At the same time, the increase in ER as measured by the number of environmental workers means that more areas of the economy need environmental supervision, which to a certain extent is also related to the increase in the proportion of the secondary industry.
Furthermore, Table 4 reports the impact of manufacturing agglomeration and various intermediary variables on the water ecological environment quality. According to Hausman’s test, Eq. 4 is selected as the final estimation results. The results show that manufacturing agglomeration has a significant impact on NH3-N. The direct effect is −0.426, indicating that for every 1% increase in agglomeration, NH3-N will decrease by 0.426%, which can be seen that the agglomeration of manufacturing will help improve the quality of the water ecological environment.

Table 4. The impacts of manufacturing agglomeration on the quality of water ecological environment.
Combined with Table 3, it can be obtained that the indirect effect of agglomeration on NH3-N through technological innovation is 0.118%; that is, for every 1% increase in the degree of agglomeration, NH3-N emissions can be increased by 0.118% through technological innovation. Since technological innovation has not occurred in the manufacturing sector, the long-term dependence on dirty technologies has produced a certain hindrance to the development of new technologies. As a result, the quality of water ecological environment deteriorates. Manufacturing agglomeration has a significant impact on economic growth, with an impact coefficient of −0.35, while the impact coefficient of economic growth on NH3-N is −0.325; that is, the indirect effect of agglomeration on NH3-N through economic growth is 0.114%, indicating manufacturing agglomeration is not conducive to promoting economic growth, but economic growth is conducive to reducing NH3-N emissions. Every 1% increase in the degree of agglomeration can reduce the content of NH3-N by 0.114% through economic growth. Although manufacturing industry agglomeration is in the stage of diseconomies of scale, economic growth means that local governments have the ability to undertake more pollution control work, and higher income also means that residents have a stronger awareness of ecological protection, thus contributing to improvement of the water ecology environmental quality. Agglomeration has an indirect effect on NH3-N through structural effects is 0.254%. That is, for every 1% increase in agglomeration, NH3-N emissions will increase by 0.254% by increasing the proportion of the secondary industry. As the overall development level of China’s manufacturing industry is relatively low, manufacturing industry agglomeration is still at the low-end development stage and the total factor productivity of enterprises is low. That is, it is still dominated by labor-intensive and capital-intensive enterprises and lacks the deep division of labor in the industrial chain. Therefore, the increase in agglomeration means that the relative proportion of “clean” enterprises will decrease, which is not conducive to the improvement of the quality of the water ecological environment.
In terms of other explanatory variables, the influence of lnER is not significant, indicating that ER represented by the number of employees in the water conservancy, environment and public facility management industries do not have a significant partial correlation with the water ecological environment quality. The possible reason is that ERs have increased dirty technological innovations, thereby reducing the quality of water ecological environment, and ER will also promote economic growth, and economic growth is conducive to improving environmental quality. The above two effects cancel each other out, and as a result, the effect of ER on the improvement of the water ecological environment quality is not obvious. Only when the government implements a long-term and effective ER policy can it improve the traditional industrial development path, promote the innovation of clean production technology, and achieve the improvement of the quality of the water ecological environment.
The lnFDI has a significant negative effect on NH3-N, indicating that the increase in FDI can promote the improvement of the quality of the water ecological environment to a certain extent. At a time when the ecological environment is increasingly being valued, cities will pay more attention to the environmental benefits of FDI when attracting investment, so as to improve the quality of the water ecological environment. The lnIND_WATER has a significant negative effect on NH3-N, indicating that the increase of industrial wastewater has a certain positive correlation with the improvement of water ecological environment. This paper believes that under the premise of manufacturing agglomeration, although industrial agglomeration can bring about an increase in the total amount of industrial wastewater discharge, agglomeration can help pollution control play a scale effect, thereby improving the efficiency of water pollution control and reducing pollution emissions.
Based on the empirical study of the direct and indirect effects of manufacturing agglomeration on water ecological environment quality in 17 prefecture-level cities downstream of the Three Gorges Dam, this paper found that manufacturing agglomeration has significant positive effects on technological innovation and IS while having significant negative effects on economic growth. Specifically, for every 1% increase in manufacturing agglomeration, technological innovation increases by 1.010%, economic growth decreases by 0.350%, and the proportion of secondary industry increases by 0.227%. The direct effect of manufacturing agglomeration on NH3-N is −0.426, indicating that for every 1% increase in agglomeration, NH3-N will decrease by 0.426%. The indirect effect of manufacturing agglomeration on NH3-N through technological innovation is 0.118%, indicating that agglomeration is conducive to promoting technological innovation. However, due to the long-term dependence on dirty technologies, enterprises’ research and development of new technologies are still dirty new technologies, leading to technological innovation that is not conducive to the improvement of water ecological environment quality. The indirect effect of agglomeration on NH3-N through economic growth is 0.114%, indicating that agglomeration is not conducive to promoting economic growth, but economic growth is conducive to the improvement of water ecological environment quality. The indirect effect of agglomeration on NH3-N through structural effect is 0.254%, indicating that agglomeration is conducive to the increase of the proportion of the secondary industry, but the increase of the proportion of the secondary industry means that the relative proportion of “clean” enterprises will be reduced, which is not conducive to the improvement of water ecological environment quality.
Our empirical research provides statistical evidence for the important role of manufacturing agglomeration in improving the quality of the water ecological environment. However, as a whole, the manufacturing industry in the study area is still at a low-end development stage, leading to diseconomies of scale in industrial agglomeration. In order to improve the quality of the water ecological environment while strengthening the industrial agglomeration, cities should promote horizontal division of labor and simple vertical division of labor toward deep division of labor in the industrial chain, accelerate the formation of a manufacturing deep processing system, and enhance the position of manufacturing in the global industrial chain. Guide the manufacturing industry to transform from labor-intensive and capital-intensive to technology-intensive. The government should also strengthen the ERs of the manufacturing industry, reduce the agglomeration of polluting enterprises, and avoid path dependence and “polluting paradise” effects in the process of manufacturing agglomeration. Strengthen the synergy between the market and the government, guide the scientific allocation of resource elements, and improve the efficiency of industrial agglomeration. Introduce clean production technology, promote the transformation and upgrading of manufacturing industry, and realize the improvement of clean technology innovation efficiency. On the basis of the abovementioned policy measures, the establishment of a long-term mechanism can maintain the continuity of the water ecological environment protection policy in time and can continuously promote the evolution of the regional economy along a path conducive to the improvement of the water ecological environment.
The original contributions presented in the study are included in the article/supplementary material, further inquiries can be directed to the corresponding author/s.
CH contributed significantly to the analysis and wrote the manuscript. X-FL performed the methods and wrote the manuscript. ZY helped to perform the analysis with constructive discussions. All authors contributed to the article and approved the submitted version.
This research was financially supported by the National Social Science Foundation of China (17CRK009).
The authors declare that the research was conducted in the absence of any commercial or financial relationships that could be construed as a potential conflict of interest.
Abid, M., Scheffran, J., Schneider, U. A., and Elahi, E. (2019). Farmer perceptions of climate change, observed trends and adaptation of agriculture in Pakistan. Environ. Manage. 63, 110–123. doi: 10.1007/s00267-018-1113-7
Cai, H., Mei, Y. D., Chen, J. H., Wu, Z. H., Lan, L., and Zhu, D. (2020). An analysis of the relation between water pollution and economic growth in China by considering the contemporaneous correlation of water pollutants. J. Clean. Prod. 276:122783. doi: 10.1016/j.jclepro.2020.122783
Chen, K., Guo, Y., Liu, X., Jin, G., and Zhang, Z. (2019). Spatial-temporal pattern evolution of wastewater discharge in Yangtze River Economic Zone from 2002 to 2015. Phys. Chem. Earth Parts A/B/C 110, 125–132. doi: 10.1016/j.pce.2019.01.005
Cheng, Z. H. (2016). The spatial correlation and interaction between manufacturing agglomeration and environmental pollution. Ecol. Indic. 61, 1024–1032. doi: 10.1016/j.ecolind.2015.10.060
Choi, J., Hearne, R., Lee, K., and Roberts, D. (2015). The relation between water pollution and economic growth using the environmental Kuznets curve: a case study in South Korea. Water Int. 40, 499–512. doi: 10.1080/02508060.2015.1036387
Combes, P. P., and Gobillon, L. (2015). “The empirics of agglomeration economies,” in Handbook of Regional and Urban Economics, Vol. 5, eds G. Duranton, J. V. Henderson, and W. C. Strange (Amsterdam: Elsevier), 247–348. doi: 10.1016/b978-0-444-59517-1.00005-2
Dai, J., Wu, H. P., Zhang, C., Zeng, G. M., Liang, J., Guo, S. L., et al. (2016). Responses of soil microbial biomass and bacterial community structure to closed-off management (an ecological natural restoration measures): a case study of Dongting Lake wetland, middle China. J. Biosci. Bioeng. 122, 345–350. doi: 10.1016/j.jbiosc.2016.03.001
Dai, J., Zhou, Y. J., Wu, H. P., Zhang, Y. C., and Zhu, K. X. (2019). Response of phytoplankton to banana cultivation: a case study of Lancang-Mekong River, southwestern China. Sci. Rep. 9:9145.
Dinda, S. (2004). Environmental Kuznets curve hypothesis: a survey. Ecol. Econ. 49, 431–455. doi: 10.1016/j.ecolecon.2004.02.011
Dong, F., Wang, Y., Zheng, L., Li, J. Y., and Xie, S. X. (2020). Can industrial agglomeration promote pollution agglomeration? Evidence from China. J. Clean. Prod. 246:118960. doi: 10.1016/j.jclepro.2019.118960
Dong, Z. Q., He, Y., and Wang, H. (2019). Dynamic effect retest of R&D subsidies policies of China’s auto industry on directed technological change and environmental quality. J. Clean. Prod. 231, 196–206. doi: 10.1016/j.jclepro.2019.05.188
Duc, T. A. (2007). Experimental investigation and modeling approach of the impact of urban wastewater on a tropical river: a case study of the Nhue River, Hanoi, Vietnam. J. Hydrol. 122, 43–61.
Ebenstein, A., Fan, M., Greenstone, M., He, G., Yin, P., and Zhou, M. (2015). Growth, pollution, and life expectancy: China from 1991–2012. Am. Econ. Rev. 105, 226–231. doi: 10.1257/aer.p20151094
Elahi, E., Abid, M., Zhang, H. M., Cui, W. J., and Hasson, S. U. I. (2018a). Domestic water buffaloes: access to surface water, disease prevalence and associated economic losses. Prev. Vet. Med. 154, 102–112. doi: 10.1016/j.prevetmed.2018.03.021
Elahi, E., Abid, M., Zhang, L. Q., Haq, S., and Sahito, J. G. M. (2018b). Agricultural advisory and financial services; farm level access, outreach and impact in a mixed cropping district of Punjab, Pakistan. Land Use Policy 71, 249–260.
Elahi, E., Cui, W. J., Jha, S. K., and Zhang, H. M. (2019a). Estimation of realistic renewable and non-renewable energy use targets for livestock production systems utilising an artificial neural network method: a step towards livestock sustainability. Energy 183, 191–204. doi: 10.1016/j.energy.2019.06.084
Elahi, E., Cui, W. J., Zhang, H. M., and Abid, M. (2019b). Use of artificial neural networks to rescue agrochemical-based health hazards: a resource optimisation method for cleaner crop production. J. Clean. Prod. 238:117900. doi: 10.1016/j.jclepro.2019.117900
Elahi, E., Khalid, Z., Cui, W. J., and Zhang, H. M. (2020). The public policy of agricultural land allotment to agrarians and its impact on crop productivity in Punjab province of Pakistan. Land Use Policy 90:104324. doi: 10.1016/j.landusepol.2019.104324
Fan, Y. P., and Fang, C. L. (2020). A comprehensive insight into water pollution and driving forces in Western China case study of Qinghai. J. Clean. Prod. 274:123950. doi: 10.1016/j.jclepro.2020.123950
Ganda, F. (2019). The impact of innovation and technology investments on carbon emissions in selected organisation for economic co-operation and development countries. J. Clean. Prod. 217, 469–483. doi: 10.1016/j.jclepro.2019.01.235
Grossman, G. M., and Krueger, A. B. (1991). Environmental Impacts of a North American Free Trade Agreement: National Bureau of Economic Research Working Paper No. 3914. Cambridge, MA: National Bureau of Economic Research.
Gu, H. J., Cao, Y. X., Elahi, E., and Jha, S. K. (2019). Human health damages related to air pollution in China. Environ. Sci. Pollut. Res. 26, 13115–13125. doi: 10.1007/s11356-019-04708-y
Irandoust, M. (2016). The renewable energy-growth nexus with carbon emissions and technological innovation: evidence from the Nordic countries. Ecol. Indic. 69, 118–125. doi: 10.1016/j.ecolind.2016.03.051
Kamyab, H., Din, M. F. M., and Ghoshal, S. K. (2016). Chlorella pyrenoidosa mediated lipid production using Malaysian agricultural wastewater: effects of photon and carbon. Waste Biomass Valoriz. 7, 779–788. doi: 10.1007/s12649-016-9556-7
Liu, S. X., Zhu, Y. M., and Du, K. Q. (2017). The impact of industrial agglomeration on industrial pollutant emission: evidence from China under New Normal. Clean Technol. Environ. Policy 19, 2327–2334. doi: 10.1007/s10098-017-1407-0
Liu, X., Wang, W., Lu, S., Wang, Y., and Ren, Z. (2016). Analysis of the relationship between economic growth and industrial pollution in Zaozhuang, China—based on the hypothesis of the environmental Kuznets curve. Environ. Sci. Pollut. Res. 23, 16349–16358. doi: 10.1007/s11356-016-6803-1
Pan, D., and Tang, J. (2021). The effects of heterogeneous environmental regulations on water pollution control: quasi-natural experimental evidence from China. Sci. Total Environ. 751:141550. doi: 10.1016/j.scitotenv.2020.141550
Peng, B. H., Li, Y., Elahi, E., and Wei, G. (2019). Dynamic evolution of ecological carrying capacity based on the ecological footprint theory: a case study of Jiangsu province. Ecol. Indic. 99, 19–26. doi: 10.1016/j.ecolind.2018.12.009
Peng, B. H., Tu, Y., Elahi, E., and Wei, G. (2018). Extended producer responsibility and corporate performance: effects of environmental regulation and environmental strategy. J. Environ. Manage. 218, 181–189. doi: 10.1016/j.jenvman.2018.04.068
Ren, W., Zhong, Y., Meligrana, J., Anderson, B., Watt, W. E., Chen, J., et al. (2003). Urbanization, land use, and water quality in Shanghai: 1947-1996. Environ. Int. 29, 649–659. doi: 10.1016/s0160-4120(03)00051-5
Sinha, A., Sengupta, T., and Alvarado, R. (2020). Interplay between technological innovation and environmental quality: formulating the SDG policies for next 11 economies. J. Clean. Prod. 242:118549. doi: 10.1016/j.jclepro.2019.118549
Storper, M., and Venables, A. J. (2004). Buzz: face-to-face contact and the urban economy. J. Econ. Geogr. 4, 351–370. doi: 10.1093/jeg/4.4.351
Taylor, M. S., and Copeland, B. R. (2004). Trade, growth, and the environment. J. Econ. Lit. 42, 7–71.
Virkanen, J. (1998). Effect of urbanization on metal deposition in the Bay of Töölönlahti, Southern Finland. Mar. Pollut. Bull. 36, 729–738.
Wetwitoo, J., and Kato, H. (2017). Inter-regional transportation and economic productivity: a case study of regional agglomeration economies in Japan. Ann. Reg. Sci. 59, 321–344. doi: 10.1007/s00168-017-0833-6
Wu, H. P., Chen, J., Xu, J. J., Zeng, G. M., Sang, L. H., Liu, Q., et al. (2019). Effects of dam construction on biodiversity: a review. J. Clean. Prod. 221, 480–489. doi: 10.1016/j.jclepro.2019.03.001
Wu, H. P., Chen, J., Zeng, G. M., Xu, J. J., Sang, L. H., Liu, Q., et al. (2020a). Effects of early dry season on habitat suitability for migratory birds in China’s two largest freshwater lake wetlands after the impoundment of Three Gorges Dam. J. Environ. Inform. 36, 82–92. doi: 10.3808/jei.201900411
Wu, H. P., Hu, X. Y., Sun, S. Q., Dai, J., Ye, S. J., Du, C. Y., et al. (2020b). Effect of increasing of water level during the middle of dry season on landscape pattern of the two largest freshwater lakes of China. Ecol. Indic. 113:106283. doi: 10.1016/j.ecolind.2020.106283
Wu, Z. D., and Ye, Q. L. (2020). Water pollution loads and shifting within China’s inter-province trade. J. Clean. Prod. 259:120879. doi: 10.1016/j.jclepro.2020.120879
Keywords: manufacturing agglomeration, water ecological environment quality, technological innovation, industrial structure, economic growth, Three Gorges Dam
Citation: Huang C, Li X-F and You Z (2021) The Impacts of Urban Manufacturing Agglomeration on the Quality of Water Ecological Environment Downstream of the Three Gorges Dam. Front. Ecol. Evol. 8:612883. doi: 10.3389/fevo.2020.612883
Received: 01 October 2020; Accepted: 23 November 2020;
Published: 11 January 2021.
Edited by:
Haipeng Wu, Changsha University of Science and Technology, ChinaReviewed by:
Huan Liu, Kyoto University, JapanCopyright © 2021 Huang, Li and You. This is an open-access article distributed under the terms of the Creative Commons Attribution License (CC BY). The use, distribution or reproduction in other forums is permitted, provided the original author(s) and the copyright owner(s) are credited and that the original publication in this journal is cited, in accordance with accepted academic practice. No use, distribution or reproduction is permitted which does not comply with these terms.
*Correspondence: Xiao-Fan Li, bGl4aWFvZmExMDBAMTI2LmNvbQ==
Disclaimer: All claims expressed in this article are solely those of the authors and do not necessarily represent those of their affiliated organizations, or those of the publisher, the editors and the reviewers. Any product that may be evaluated in this article or claim that may be made by its manufacturer is not guaranteed or endorsed by the publisher.
Research integrity at Frontiers
Learn more about the work of our research integrity team to safeguard the quality of each article we publish.