
94% of researchers rate our articles as excellent or good
Learn more about the work of our research integrity team to safeguard the quality of each article we publish.
Find out more
SYSTEMATIC REVIEW article
Front. Ecol. Evol. , 07 December 2020
Sec. Conservation and Restoration Ecology
Volume 8 - 2020 | https://doi.org/10.3389/fevo.2020.609973
This article is part of the Research Topic Environmental DNA Innovations for Conservation View all 19 articles
The rapid evolution of environmental (e)DNA methods has resulted in knowledge gaps in smaller, yet critical details like proper use of negative controls to detect contamination. Detecting contamination is vital for confident use of eDNA results in decision-making. We conducted two literature reviews to summarize (a) the types of quality assurance measures taken to detect contamination of eDNA samples from aquatic environments, (b) the occurrence, frequency and attribution (i.e., putative sources) of unexpected amplification in these quality assurance samples, and (c) how results were interpreted when contamination occurred. In the first literature review, we reviewed 156 papers and found that 91% of targeted and 73% of metabarcoding eDNA studies reported inclusion of negative controls within their workflows. However, a large percentage of targeted (49%) and metabarcoding (80%) studies only reported negative controls for laboratory procedures, so results were potentially blind to field contamination. Many of the 156 studies did not provide critical methodological information and amplification results of negative controls. In our second literature review, we reviewed 695 papers and found that 30 targeted and 32 metabarcoding eDNA studies reported amplification of negative controls. This amplification occurred at similar proportions for field and lab workflow steps in targeted and metabarcoding studies. These studies most frequently used amplified negative controls to delimit a detection threshold above which is considered significant or provided rationale for why the unexpected amplifications did not affect results. In summary, we found that there has been minimal convergence over time on negative control implementation, methods, and interpretation, which suggests that increased rigor in these smaller, yet critical details remains an outstanding need. We conclude our review by highlighting several studies that have developed especially effective quality assurance, control and mitigation methods.
Environmental (e)DNA refers to sampling and detection techniques for deoxyribonucleic acid (DNA) released by organisms into the environment (e.g., water, soil, or air). The DNA can be queried for specific taxa in targeted techniques (Ficetola et al., 2008) or can be surveyed for many taxonomic groups with metabarcoding approaches (Thomsen et al., 2012). Because most eDNA methods utilize polymerase chain reaction (PCR) of relatively short DNA fragments (generally < 200 nucleotides), these methods are sensitive enough to detect DNA at extremely low concentrations. This sensitivity is a key advantage, as it allows users to make inferences about taxa presence even when they are at abundances too low to be detected by traditional, non-molecular techniques. However, this extreme sensitivity presents a challenge, as it heightens susceptibility to contaminating DNA.
The rapid evolution of eDNA methods over the past decade has resulted in knowledge gaps in smaller, yet critical details. Here, we argue that contamination detection is a critical detail that has been overlooked, but is deserving of attention, especially as eDNA methods transition from research to application. Detecting contamination of eDNA samples is vital for confident use of eDNA results in natural resource management, as positive eDNA results can initiate a costly chain of control and containment actions. Costly actions based on false positives can cause decision-makers to question the use of eDNA as a monitoring tool (Jerde, 2019; Sepulveda et al., 2020). Effective means for detecting contamination are needed to not only inform potentially costly management decisions, but to also identify and strengthen weak points in current workflow protocols.
Those using eDNA sampling have been combating contamination since the inception of these techniques, and many guidelines and procedures have been developed to prevent, detect, and quantify false positives resulting from contamination at every stage of the work flow. Most eDNA research and monitoring programs have instituted general molecular best practices to minimize contamination potential in the field (e.g., single-use supplies, bleach sterilization) and in the lab (e.g., separation of low-template vs. high-template DNA work spaces), as described in Goldberg et al. (2016). However, these best practices are imperfect—multiple published examples report unexpected amplification of negative control samples despite adherence to best practices to minimize contamination (e.g., Maruyama et al., 2014; Serrao et al., 2018; Sepulveda et al., 2019b). For example, Serrao et al. (2018) analyzed 258 negative controls samples for redside dace (Clinostomus elongatus) DNA and found that 30% of samples amplified, though 98.4% of these samples had less than 1 copy reaction−1. Similarly, Sepulveda et al. (2019b) analyzed 619 samples for dreissenid mussel (Dreissena spp.) DNA and two negative field control samples amplified despite the nearest known dreissenid population being > 1,000 km away. Additionally, some researchers with quality assurance results indicative of contamination likely opt to not publish studies, thus slowing the progress of the field.
Outside of the general guidance of analyzing field and laboratory negative controls, specific guidance for contamination detection does not exist. Consequently, a broad range of approaches are currently used to detect contamination in the field and laboratory. Some programs ensure a minimum of 10% of samples collected are field blanks comprised of target DNA-free water handled in the field (e.g., Woldt et al., 2019), while others assess field contamination only by analyzing field samples where the target species is presumed absent (e.g., Carim et al., 2019).
Moreover, there is no clear guidance on how to proceed when negative control samples amplify. Some studies discarded associated field samples (Sepulveda et al., 2019b), others attributed unexpected amplification to random noise and ignored the amplified negative controls (Maruyama et al., 2014), while others established a “limit of blank” that delimited detection thresholds above which was considered significant (Serrao et al., 2018). Additional examples in the peer-reviewed literature can be found that follow each of these paths, producing confusion and doubt for researchers and decision-makers alike. The need for clarification on how to proceed is elevated when associated field samples also amplify for the target DNA, as these detections could be true positives. A better understanding of the known or potential rate of error and standards for the control of the technique's operation are required for eDNA results to be considered reliable scientific evidence (Sepulveda et al., 2020).
We conducted a literature review to summarize (a) the types of quality assurance measures taken to detect contamination of eDNA samples, (b) the occurrence, frequency, and attribution (i.e., putative sources) of unexpected amplification in these quality assurance samples, and (c) how results were interpreted when contamination occurred. We also assess how these response variables have changed since 2008, when eDNA approaches were initially used to detect aquatic macroorganisms (Ficetola et al., 2008). Convergence in quality assurance measures and a decrease in the frequency and occurrence of contamination would suggest general agreement in best practices and that these best practices are effective, while divergence in quality assurance measures and an increase in contamination would suggest that contamination detection is still a critical detail deserving of attention.
We conducted two literature reviews to synthesize contamination detection methods, contamination occurrence, and result interpretation related to the eDNA detection of aquatic organisms in peer-reviewed studies published between January 2008 and April 2020. Both reviews were inclusive of targeted and metabarcoding approaches across freshwater and marine environments. The objectives of the first review were to document the quality assurance measures used for contamination detection and to estimate how frequently amplification of negative controls has been reported. The objectives of the second review were to identify which stages of the eDNA workflow have been most susceptible to contamination and to document how evidence of contamination influenced result interpretations.
We used Web of Science to conduct the first literature review. The following topical terms had to appear in an article's title, abstract, or keywords: “environmental DNA” AND “aquatic*” OR “water*” OR “marine” OR “ocean*” OR “estuary.” We reviewed the abstract of each article to ensure that it was applicable and included primary data (i.e., not a review paper). This resulted in 876 entries (Supplementary Figure 1). We randomly sampled 25% of the articles that were published each year from these 876 entries (Supplementary Table 1). We then reviewed each article and recorded the information listed in Table 1. Any article that was deemed not applicable when read in full was replaced by a randomly selected article published the same year.
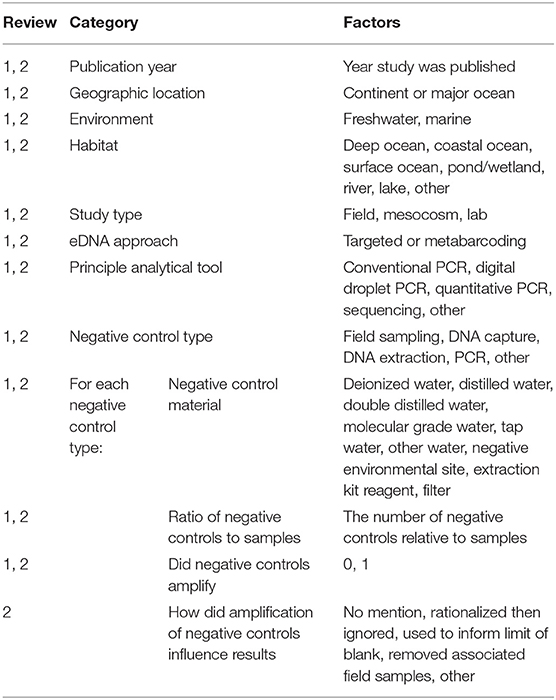
Table 1. The occurrence of factors within each category was recorded for all studies in Literature Review #1 or #2.
Web of Science was not a useful tool for our second literature review because amplification of negative controls was seldom mentioned in a study's title, abstract or keywords. Consequently, we used Google Scholar to conduct our second literature review since this tool searches within the text as well as the title, abstract and keywords. Comparable search terms in Google Scholar as used in the previous Web of Science literature review returned over 8,000 papers. Thus, we used studies that were already filtered by Tsuji et al. (2019) in a recent review of eDNA detection methods for aquatic macroorganisms. These authors used a Google Scholar search for studies published between 2008 and 2018 that including the keywords: “eDNA” and “environmental DNA”. The search results were filtered by hand to 388 papers based on the following criteria: (1) detection of macroorganisms (not micoorganisms, virus, or bacteria); (2) published in international journals (except preprint servers); and (c) peer-reviewed. To update papers published between 2019 and April 2020, we repeated these methods which resulted in an additional 307 papers (Supplementary Table 2). We then used Google Scholar to search within these papers for the following terms: “false positive*” OR “contaminat*.” This resulted in 193 articles, but after further review of these articles, we found that only 64 articles reported negative control samples that amplified (Supplementary Figure 2). We then recorded the information listed in Table 1 for these 64 articles and for any articles in our first literature review that did not appear in our Google Scholar search, yet had amplification of negative controls.
We summarized the number of studies per publication year, geographic location, environment, habitat, study type, and eDNA approach to place the reviewed studies into appropriate context. We then grouped the remaining data fields by eDNA approach (targeted or metabarcoding), since these approaches are used to address different types of study objectives and the potential for amplification of negative controls is much greater in metabarcoding approaches. For each eDNA approach group, we calculated the frequency of occurrence of factors within each data category (Table 1). We binned eDNA workflow steps into the following categories: field sampling; DNA capture, defined as the concentration of DNA material using filtration or centrifugation; DNA extraction; PCR and; other. We report results using descriptive statistics (e.g., frequency of occurrence, percentages) because sample sizes were often too small for inferential statistics, thus our results are not generalizable to all eDNA studies.
We reviewed 155 papers that met our inclusion criteria (Supplementary Figure 1). The number of studies using eDNA methods nearly doubled each year since 2012, consequently 80% of the studies that we reviewed were published between 2016 and April 2020 (Figure 1). The most commonly reviewed studies used targeted eDNA methods and took place in North American and European freshwater, lotic ecosystems (Table 2). Quantitative PCR analysis was the dominant analytical platform used for targeted eDNA studies (Table 2).
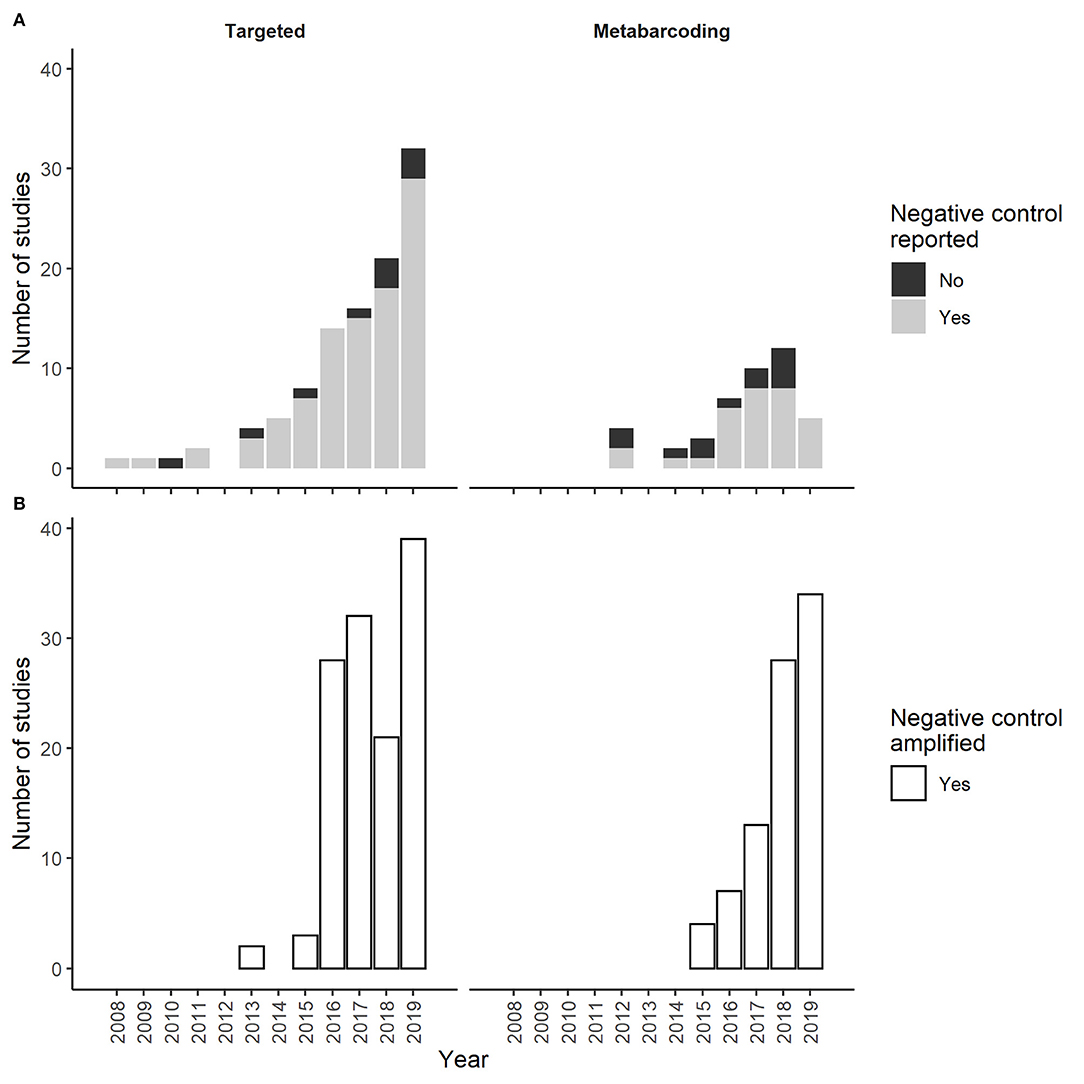
Figure 1. The number of targeted and metabarcoding eDNA studies that (A) reported (Yes) or did not report (No) negative controls in the first literature review and that (B) reported (Yes) amplification of negative controls in the second literature review.
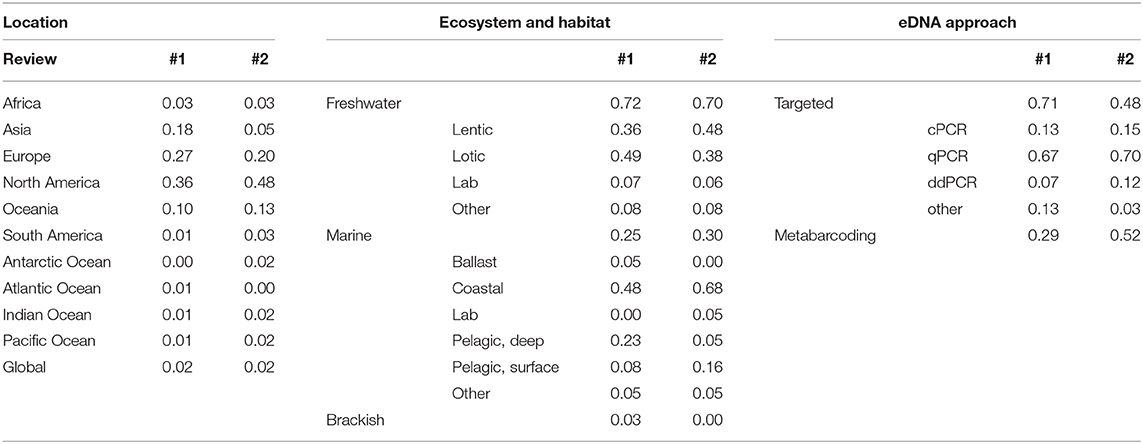
Table 2. The proportion of studies in Literature Review #1 (N = 155) and #2 (N = 62) by geographic location, ecosystem and habitat, and eDNA approach.
One-hundred (91%) of the 110 targeted eDNA studies and 33 (73%) of the 45 metabarcoding studies reported collection of at least one negative control (Figure 1). PCR controls were reported in 71%, field controls were reported in 51%, extraction controls were reported in 36%, and DNA capture controls were reported in 25% of the 100 targeted eDNA studies that collected negative controls (Figure 2). PCR controls were reported in 71%, extraction controls were reported in 44%, and field controls and DNA capture controls were each reported in 20% of the 33 metabarcoding studies that collected negative controls (Figure 2). The reporting of other negative control categories (e.g., travel controls) was less common (1–12%). We documented high annual fluctuations in the percent of targeted and metabarcoding studies that included controls from the most common categories (e.g., PCR and field; Figure 2). These fluctuations did not dampen over time. Temporal trends for metabarcoding studies were especially vague since most years had few studies.
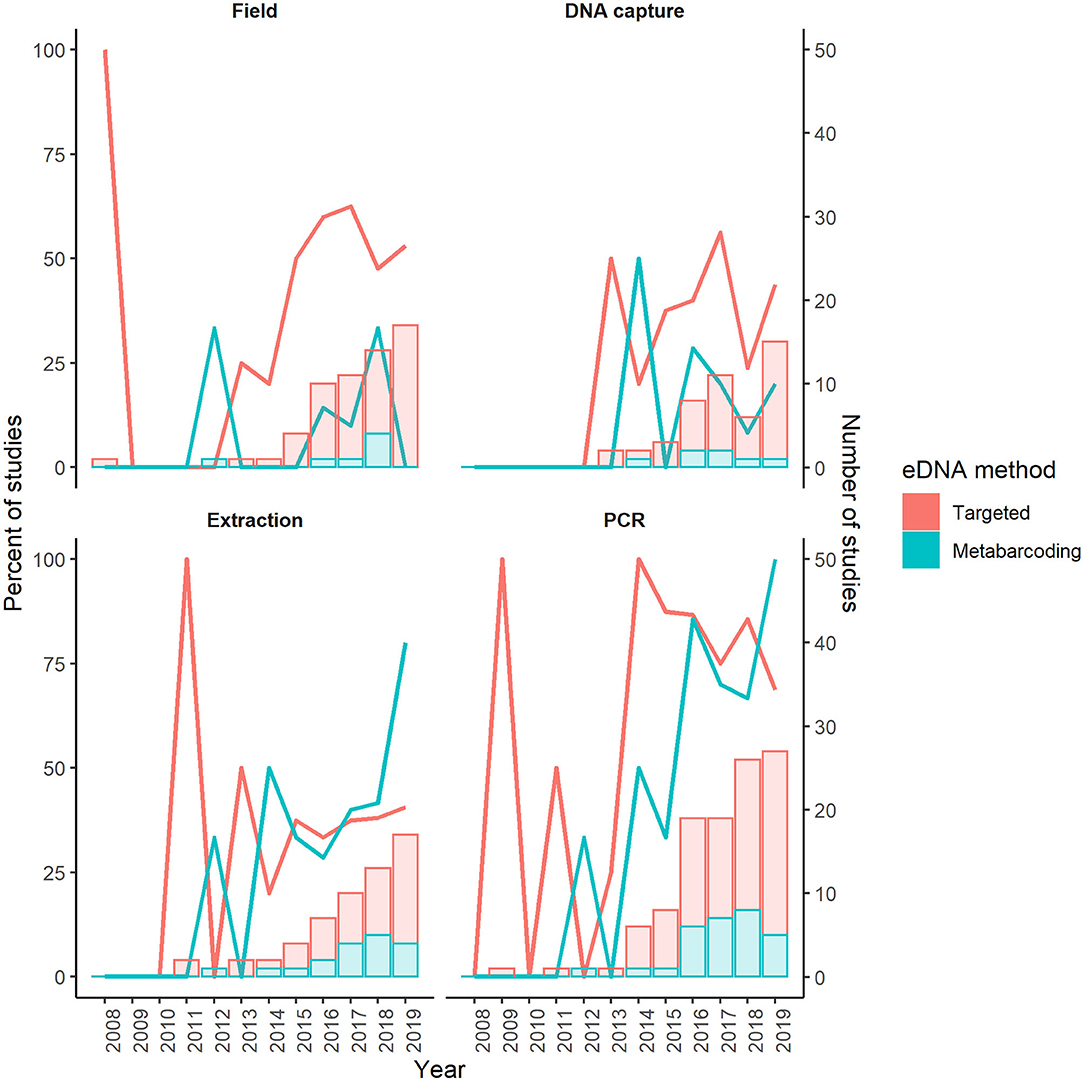
Figure 2. Temporal trends in the percent of studies with reported negative controls associated with field, DNA capture, extraction, and PCR workflow steps in targeted and metabarcoding eDNA studies in the first literature review. Lines indicate the percent of studies and columns indicate the number of studies for a given year.
Targeted and metabarcoding eDNA studies used a wide variety of water sources for field negative controls (Supplementary Figure 3). Deionized (28% of studies with field negative controls), environmental (27%) and distilled water (16%) were most common in targeted studies across years. Distilled (22%) and tap water (22%) were most common in metabarcoding studies across years, though a similar proportion of studies (22%) did not report the water source.
We first documented reporting of negative control amplification in targeted and metabarcoding eDNA studies in 2016 (Figure 3). Thereafter, negative control amplification was reported in ~6% of targeted studies and 25% of metabarcoding studies that included negative controls each year. Many targeted and metabarcoding studies that reported use of negative controls failed to report negative control results (Figure 3). Amplification was reported at similar low proportions across all negative control categories for targeted and metabarcoding studies (Figure 4).
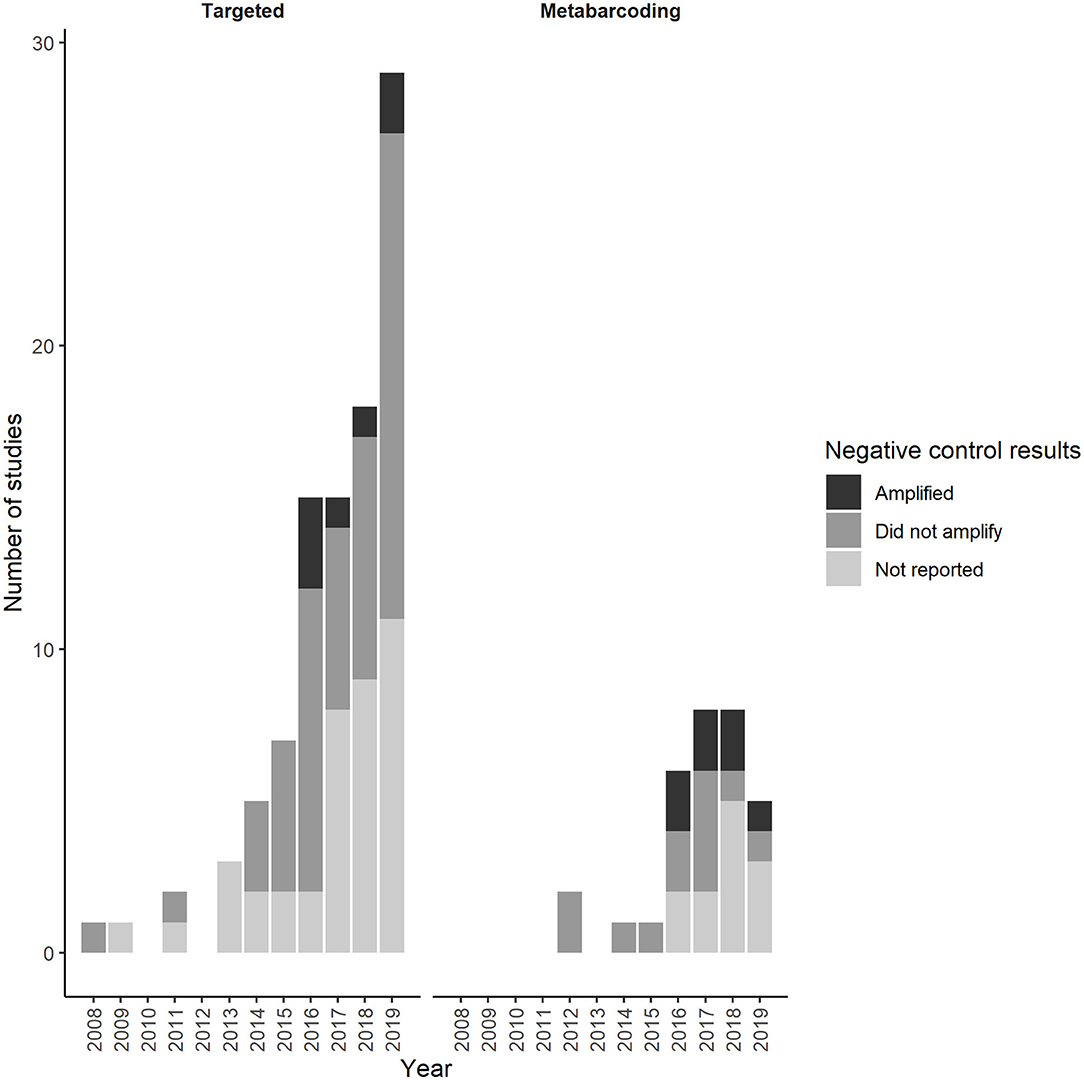
Figure 3. Annual trends in the number of studies in the first literature review that reported amplification of negative controls (Amplified), no amplification of negative controls (Did not amplify), or collected negative controls but did not report amplification results (Not reported).
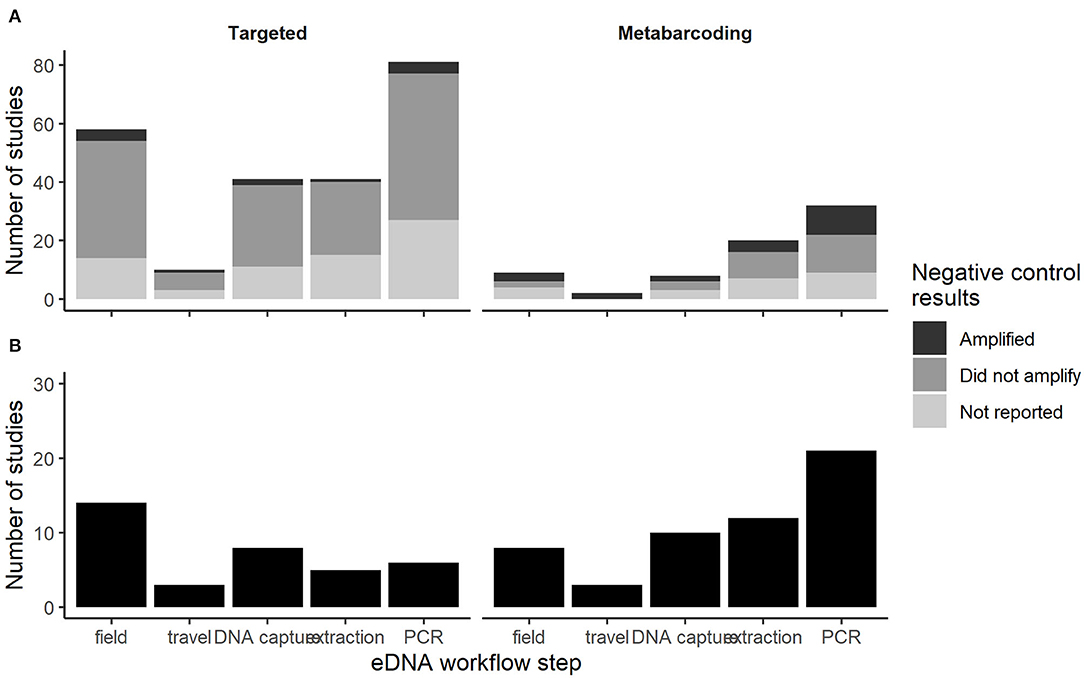
Figure 4. The number of studies in the first (A) and second (B) literature reviews with eDNA workflow steps associated with negative controls that amplified, did not amplify, or amplification results were not reported.
Most studies failed to provide explicit data on the ratio of negative controls samples to field samples. For example, studies reported that extraction controls were collected per batch of extractions but failed to report the number of extraction batches. Raw data were not always publicly accessible, and when these data were available, negative control results were infrequently reported.
We reviewed 62 studies that met our inclusion criteria of unexpected negative control amplification (Supplementary Figure 2). Thirty of these studies used targeted eDNA methods and 32 used metabarcoding eDNA methods (Figure 1). Twenty-two of the 30 targeted eDNA studies and 19 of the 32 metabarcoding eDNA studies provided enough description to attribute amplification to a specific negative control category (e.g., field or PCR). The other studies only reported the general occurrence of unexpected negative control amplification. The characteristics of studies reviewed were similar to those reviewed in the first literature review (Table 1), with the exception of the proportional representation of targeted vs. metabarcoding studies. In this second review, metabarcoding studies were as common as targeted studies.
For targeted studies, amplification was reported most frequently in field negative controls (Figure 4). For metabarcoding studies, contamination was reported most frequently in PCR negative controls (Figure 4). Amplification was reported in a variety of field negative control water sources, but sample sizes were too small to assess if specific water sources amplified more frequently than others. Similar to the first literature review, most studies failed to provide explicit data on the ratio of negative controls samples to field samples so it was not possible to characterize negative control effort.
We documented a variety or study responses to negative control amplification. Most targeted eDNA studies provided rationale for why the unexpected amplifications did not affect results; whereas, metabarcoding studies used amplified negative controls to delimit a detection threshold above which is considered significant (Figure 5). Fewer studies removed samples that were associated with negative controls that amplified or failed to provide rationale for why these results could be ignored.
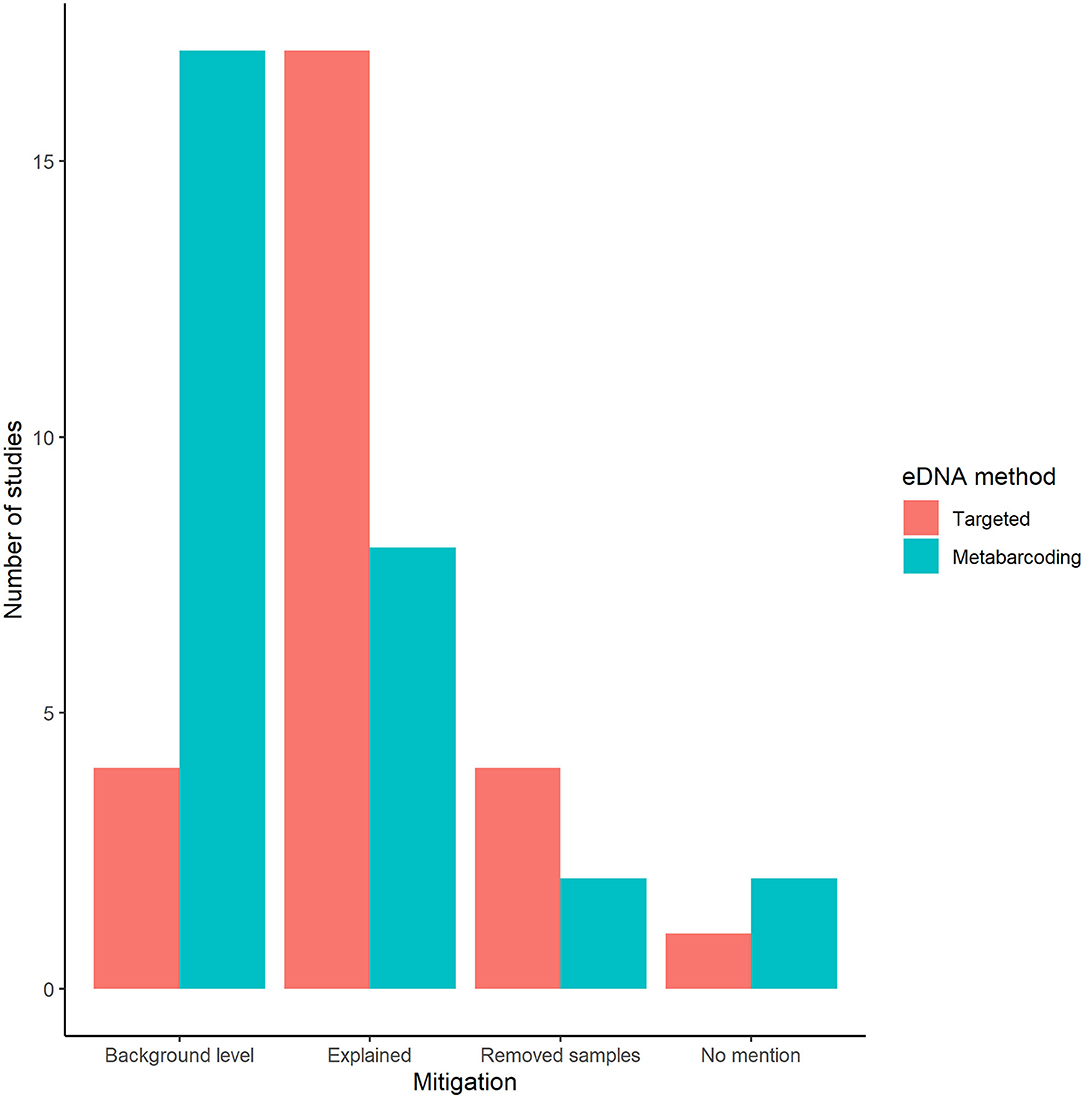
Figure 5. The number of studies in the second literature review that used amplified negative controls to delimit a detection threshold above which is considered significant (Set as background level), provided rationale for why the unexpected amplifications did not affect results (Explained away), removed field samples that were associated with negative controls that amplified (Removed samples), or reported amplification but did not provide rationale for why these results could be ignored (No mention).
A substantial number of eDNA studies from across the globe have been published in the past 12 years, which underscores the rapid technological advancements in this field and the applicability of eDNA methods to a broad range of taxa and habitats. Yet the inherent sensitivity of eDNA methods to contamination is a principal reason for why managers have been reluctant to use eDNA results for decision-making. Consequently, managers and eDNA practitioners have called for increased rigor in quality assurance and control measures to prevent and detect contamination (Loeza-Quintana et al., 2020; Sepulveda et al., 2020). Our review of eDNA studies published over the past 12 years suggests that this call for increased rigor remains an outstanding need.
We reviewed ~25% of eDNA studies published each year, 2008–2020, and found 100 of 110 targeted studies and 33 of 45 metabarcoding studies reported inclusion of negative controls within their workflow (Figure 1). It is encouraging that most eDNA practitioners have included quality assurance methods in their workflows, but it is disconcerting that many studies failed to report method specifics, such as the negative control water source and the number of negative control samples analyzed. This result is in line with Dickie et al. (2018), which found that 95% of reviewed eDNA metabarcoding studies failed to provide critical methodological information required for reproducibility by independent researchers. These kinds of omissions set up the potential for a replication crisis that has hampered the advancement of other disciplines. Moreover, these omissions make it difficult to discern general best practices and to identify workflow steps that are consistently susceptible to contamination and therefore require improved quality assurance.
The negative control methods that were described with enough detail to be reproduced varied greatly among studies, and this variability has not decreased over time despite calls for standardization (Figure 2; Loeza-Quintana et al., 2020; Minamoto et al., 2020). For example, field and PCR negative controls used a wide variety of water types and collection schemes that are likely influenced by study objectives (Supplementary Figure 3). Examples included collecting field negative controls once per site vs. once per day, as the first vs. last sample collected at a site, or laboratory (e.g., deionoized water) vs. environmental (e.g., presumed negative field site) water sources. Different negative control methods may provide similar results when contamination is systemic (e.g., contamination of laboratory reagents), but it is unknown how these methods vary in their ability to reliably detect cross-contamination among samples collected from multiple sites on the same day and random contamination (i.e., that which does not affect all samples in a batch equitably). Our review indicates that systemic contamination is rare, as amplification was only reported in a small subset of negative controls per study. For example, Guillera-Arroita et al. (2017) filtered and extracted 50 negative controls in the lab and found that 2–8% of these samples amplified for the DNA of four target amphibian species. Indeed, it is likely that studies with systemic contamination never make it to publication.
Overall, the number of studies reporting amplification of negative controls was low; ~6% of targeted studies and 25% of metabarcoding studies that included negative controls each year (Figure 3). While these low percentages seem reassuring, we suspect that they are underestimates for at least two reasons. First, a large percentage of targeted (49%) and metabarcoding (80%) studies limited negative controls to laboratory procedures (Figure 4). These studies were blind to any contamination that may have occurred during field collection, transport to the lab and DNA capture (e.g., filtration). This is a surprising omission given the attention to developing field protocols (e.g., single-use supplies; Spens et al., 2017) that reduce risk of cross-contamination. Indeed, multiple papers over the past decade have indicated that the inclusion of controls throughout the entire eDNA workflow is required for strong inference about species presence (Darling and Mahon, 2011; Goldberg et al., 2016; Jerde, 2019; Sepulveda et al., 2019b). Our results from the second literature review support this recommendation since amplification of pre-lab workflow negative controls occurred as much or more frequently than lab workflow negative controls (Figure 4). However, amplification of pre-lab workflow negative controls does not unequivocally indicate contamination occurred prior to the lab since these samples are also susceptible to lab contamination. Second, metabarcoding studies especially may have higher rates of contamination than we documented because the discipline of DNA metabarcoding (inclusive of eDNA and DNA samples) has only recently become aware of multiple contamination issues that can cause incorrect assignment of sequences to samples, including false tag combinations in the sequencing output (Schnell et al., 2015) and amplicon contamination (Schnell et al., 2015; Ballenghien et al., 2017). We found considerably more agreement among reviewed studies on how to proceed when negative control samples had unexpected amplification. The majority of targeted eDNA studies attributed the amplification to low-level noise and ignored unexpected amplification (Figure 5), whereas most metabarcoding studies used the quantitative information provided by analyses to delimit a detection threshold above which is considered significant (Figure 5). Consensus was stronger in metabarcoding studies, which had much higher occurrence of negative control amplification (and/or sequence reads) and a general acceptance that low-level contamination is unavoidable.
These ad hoc approaches for dealing with unexpected amplification have been criticized, given that they are subjective and can lead to underestimation of species occurrences (Ficetola et al., 2016; Lahoz-Monfort et al., 2016). Site occupancy-detection models (SODMs) provide a more objective means of accounting for detection errors caused by false positives. Contamination rates derived from amplified negative controls (Ficetola et al., 2016), calibration experiments that explicitly assess contamination rates at different steps of the eDNA work flow (e.g., Guillera-Arroita et al., 2017), or unambiguous eDNA data collected from sites with known absences (Lahoz-Monfort et al., 2016; Smith and Goldberg, 2020) can be used to parameterize SODMs. Model output informs the probability that an eDNA detection is a true presence given the number of detections. However, SODMs that account for false positives have infrequently been used in eDNA studies because they are relatively new, computationally intensive advancements. It is unclear how managers and other eDNA result end-users would integrate false positive probabilities into decision making.
Even with implementation of appropriate negative controls, ad hoc approaches for dealing with negative control amplification, and advanced statistical tools, it is critical to follow strict procedures at each step of the workflow to limit the potential for false positives. Many of these procedures have been described elsewhere, especially in Goldberg et al. (2016). Here we draw attention to several procedures that have reduced false positive sample rates associated with contamination: development of assays that target multiple genomic locations, cleverly designed positive PCR controls, and single-use field sampling gear.
The use of multiple assays that each target different genomic locations provides independent tests of detection. The probability that an amplification in a sample is due to contamination is the product of the contamination rates of the multiple assays (i.e., the product rule). If the contamination probabilities are low, as is the case we documented in this review, then the probability that an amplification is due to contamination is multiplicatively lower with each additional assay. This strategy increases certainty that observed amplifications are the result of the target organism's DNA in the original sample, as opposed to contaminating DNA or other false-positive signals that act independently on each assay. Calibration studies, such as those by Guillera-Arroita et al. (2017), are needed to quantify false positive sample probabilities. Multiple independent tests of detection, via the statistical product rule should also help to reduce uncertainty caused by cross-contamination and base-rate bias (i.e., when the prevalence of the target is extremely low, the test results in a significant proportion of false positives). Consequently, several eDNA programs that monitor for controversial species or in controversial locations use this type of approach. In the Asian Carp eDNA Monitoring Quality Assurance Project Plan, a sample must be positive for a genus-specific COI assay and for a species-specific ND2 or ND6 assay (Woldt et al., 2019). Similarly, for dreissenid mussels, a sample must be positive for a genus-specific 16S assay and for species-specific COI or Cytb assays (Sepulveda et al., 2019b). Moreover, water samples collected during proceeding field surveys (i.e., resampling verification) must also amplify for the suite of assays in order for the initial samples to be scored as positive.
Metabarcoding eDNA approaches have also begun to use multiple primer sets to minimize false positive taxa assignments. For example, a few studies only retained sequences that are shared by PCR replicates (Giguet-Covex et al., 2014; Alberdi et al., 2018). Metabarcoding studies also commonly remove singletons or doubletons from sequence reads to account for potential low levels of contamination (Evans et al., 2017). While these conservative approaches decrease the potential for false positives, they do increase false-negatives rates and may lead to incorrect inference about target species presence or diversity (Alberdi et al., 2018; Zinger et al., 2019). These approaches also inflate the costs of analyses. The tradeoffs among cost, decreasing false-positive rates and increasing false-negative rates should be carefully considered when designing an eDNA monitoring program.
Even the most cautious laboratories have the potential for sample contamination because high-template positive control material are handled adjacent to analytical samples and negative controls. Standard curves that include positive control DNA at orders of magnitude greater than that found in field samples are a common practice; standard curves are a quality assurance check that the assay is performing as expected and are a means to quantify the amount of target DNA in a sample. Multiple studies have suggested that DNA can aerosolize (e.g., Hebsgaard et al., 2005; Newton et al., 2015; Sepulveda et al., 2019a) and act as a contamination source. Wilson et al. (2016) proposed use of synthetic oligonucleotides with the addition of a readily detectable insert sequence for use as positive PCR controls. A simpler approach may be to scramble the non-priming regions of synthetic DNA. If negative controls amplify, both options permit sequencing of the amplicon to distinguish between real target detections in field samples and positive control-derived contamination. However, sequence inserts/modifications could affect tertiary structures of the DNA molecules (e.g., hairpin loops) and alter the melting temperature of and polymerase binding affinity to the template DNA (Fan et al., 2019). Great care must be taken when designing these synthetic genes to validate them in silico. In vitro comparisons between native sequences and modified sequences can also be performed to determine any changes in efficacy.
Sample collection and DNA capture methods (e.g., filtration and precipitation) are also important for limiting contamination in eDNA surveys. Collection and DNA capture methods have evolved over time to employ single-use supplies (e.g., gloves and sample collection containers) in order to minimize the potential of cross-contamination. However, there is still high variance among studies in specific methods since each study faces different challenges when attempting to optimize the tradeoffs between contamination risk, sample volume, collection time, and cost. For example, single-use enclosed filters have minimal contamination risk because they are pre-loaded and require no handling of the filter membrane since DNA extraction takes place within the filter capsule (Spens et al., 2017). Relative to open filters that have a higher contamination risk since they do require handling of the filter membrane both pre- and post-sampling, enclosed filters are more expensive, require more time to process, and the volume of water that can be processed may be limited in sites with turbid water since the filters clog easily (Uthicke et al., 2018; Tingley et al., 2019; Tsuji et al., 2019). More recently, Thomas et al. (2019) introduced a self-preserving eDNA filter housing that can process larger volumes of water yet limits handling of the filter membrane to the lab, where it is removed from the housing for DNA extraction.
The potential for contamination-caused uncertainty in eDNA sampling and analysis has eroded confidence in the method because making decisions on incorrect inference can be socio-economically, politically and ecological costly (Jerde, 2019; Sepulveda et al., 2020). We reviewed the eDNA literature over the past twelve years and found contamination did occur, though at a very low rate relative to the hundreds of published studies. Over this period of time, much progress has been made on developing and applying quality control and assurance measures for preventing, alerting to, and source-tracing contamination. More recently, statistical methods have been developed to guide result interpretation in light of false positives. Though these efforts have strengthened the eDNA science and application, there is still ample room for improvement. Specifically, inclusion of critical methodological information is required to quantitatively identify best practices for negative control implementation. There is also an outstanding need for calibration experiments to quantify contamination rates under ideal and realistic field and laboratory conditions. Ultimately, eDNA researchers and end-users must acknowledge that contamination is more commonly observed when using an extremely sensitive molecular tool to search for rare taxa, and that this is an inversely proportional trade-off between false positive and false negative inferences. Awareness of this tradeoff and due diligence to prevent, identify, and correct for contamination should bolster the use of eDNA results in confident decision-making and management applications.
The original contributions presented in the study are included in the article/Supplementary Material, further inquiries can be directed to the corresponding author/s.
AJS and PH: study design and data analyses. AJS, PH, MF, MM, and AMS: data collection and writing. All authors contributed to the article and approved the submitted version.
The USGS Ecosystems Mission Area Invasive Species Program providing funding to support this work.
The authors declare that the research was conducted in the absence of any commercial or financial relationships that could be construed as a potential conflict of interest.
We thank Cameron Turner for motivating us to conduct this review. We also thank Yale Passamaneck with the US Bureau of Reclamation for helpful comments on earlier versions of this manuscript. Any use of trade, firm, or product names is for descriptive purposes only and does not imply endorsement by the U.S. Government.
The Supplementary Material for this article can be found online at: https://www.frontiersin.org/articles/10.3389/fevo.2020.609973/full#supplementary-material
Alberdi, A., Aizpurua, O., Gilbert, M. T. P., and Bohmann, K. (2018). Scrutinizing key steps for reliable metabarcoding of environmental samples. Methods Ecol. Evolut. 9, 134–147. doi: 10.1111/2041-210X.12849
Ballenghien, M., Faivre, N., and Galtier, N. (2017). Patterns of cross-contamination in a multispecies population genomic project: detection, quantification, impact, and solutions. BMC Biol. 15, 1–16. doi: 10.1186/s12915-017-0366-6
Carim, K. J., Caleb Dysthe, J., McLellan, H., Young, M. K., McKelvey, K. S., and Schwartz, M. K. (2019). Using environmental DNA sampling to monitor the invasion of nonnative Esox lucius (northern pike) in the Columbia River basin, USA. Environ. DNA 1, 215–226. doi: 10.1002/edn3.22
Darling, J. A., and Mahon, A. R. (2011). From molecules to management: adopting DNA-based methods for monitoring biological invasions in aquatic environments. Environ. Res. 111, 978–988. doi: 10.1016/j.envres.2011.02.001
Dickie, I. A., Boyer, S., Buckley, H. L., Duncan, R. P., Gardner, P. P., Hogg, I. D., et al. (2018). Towards robust and repeatable sampling methods in eDNA-based studies. Mol. Ecol. Resourc. 18, 940–952. doi: 10.1111/1755-0998.12907
Evans, N. T., Li, Y., Renshaw, M. A., Olds, B. P., Deiner, K., Turner, C. R., et al. (2017). Fish community assessment with eDNA metabarcoding: effects of sampling design and bioinformatic filtering. Can. J. Fish. Aquat. Sci. 74, 1362–1374. doi: 10.1139/cjfas-2016-0306
Fan, H., Wang, J., Komiyama, M., and Liang, X. (2019). Effects of secondary structures of DNA templates on the quantification of qPCR. J. Biomol. Struct. Dyn. 37, 2867–2874. doi: 10.1080/07391102.2018.1498804
Ficetola, G. F., Miaud, C., Pompanon, F., and Taberlet, P. (2008). Species detection using environmental DNA from water samples. Biol. Lett. 4, 423–425. doi: 10.1098/rsbl.2008.0118
Ficetola, G. F., Taberlet, P., and Coissac, E. (2016). How to limit false positives in environmental DNA and metabarcoding? Mol. Ecol. Resources 16, 604–607. doi: 10.1111/1755-0998.12508
Giguet-Covex, C., Pansu, J., Arnaud, F., Rey, P.-J., Griggo, C., Gielly, L., et al. (2014). Long livestock farming history and human landscape shaping revealed by lake sediment DNA. Nat. Commun. 5:4211. doi: 10.1038/ncomms4211
Goldberg, C. S., Turner, C. R., Deiner, K., Klymus, K. E., Thomsen, P. F., Murphy, M. A., et al. (2016). Critical considerations for the application of environmental DNA methods to detect aquatic species. Methods Ecol. Evolut. 7, 1299–1307. doi: 10.1111/2041-210X.12595
Guillera-Arroita, G., Lahoz-Monfort, J. J., van Rooyen, A. R., Weeks, A. R., and Tingley, R. (2017). Dealing with false-positive and false-negative errors about species occurrence at multiple levels. Methods Ecol. Evolut. 8, 1081–1091. doi: 10.1111/2041-210X.12743
Hebsgaard, M. B., Phillips, M. J., and Willerslev, E. (2005). Geologically ancient DNA: fact or artefact? Trends Microbiol. 13, 212–220. doi: 10.1016/j.tim.2005.03.010
Jerde, C. L. (2019). Can we manage fisheries with the inherent uncertainty from eDNA? J. Fish Biol. doi: 10.1111/jfb.14218
Lahoz-Monfort, J. J., Guillera-Arroita, G., and Tingley, R. (2016). Statistical approaches to account for false-positive errors in environmental DNA samples. Mol. Ecol. Resources 16, 673–685. doi: 10.1111/1755-0998.12486
Loeza-Quintana, T., Abbott, C. L., Heath, D. D., Bernatchez, L., and Hanner, R. H. (2020). Pathway to increase standards and competency of eDNA surveys (PISCeS)—advancing collaboration and standardization efforts in the field of eDNA. Environ. DNA 2, 255–260. doi: 10.1002/edn3.112
Maruyama, A., Nakamura, K., Yamanaka, H., Kondoh, M., and Minamoto, T. (2014). The release rate of environmental DNA from juvenile and adult fish. PLoS ONE 9:e114639. doi: 10.1371/journal.pone.0114639
Minamoto, T., Miya, M., Sado, T., Seino, S., Doi, H., Kondoh, M., et al. (2020). An illustrated manual for environmental DNA research: water sampling guidelines and experimental protocols. Environ DNA. doi: 10.1002/edn3.121
Newton, J., Sepulveda, A., Sylvester, K., and Thum, R. (2015). Potential utility of environmental DNA for early detection of Eurasian watermilfoil (Myriophyllum spicatum). J. Aquat. Plant Manage. 54, 46–49.
Schnell, I. B., Bohmann, K., and Gilbert, M. T. P. (2015). Tag jumps illuminated–reducing sequence-to-sample misidentifications in metabarcoding studies. Mol. Ecol. Resour. 15, 1289–1303. doi: 10.1111/1755-0998.12402
Sepulveda, A. J., Nelson, N. M., Jerde, C. L., and Luikart, G. (2020). Are Environmental DNA methods ready for aquatic invasive species management? Trends Ecol. Evolut. 35, 668–678. doi: 10.1016/j.tree.2020.03.011
Sepulveda, A. J., Schabacker, J., Smith, S., Al-Chokhachy, R., Luikart, G., and Amish, S. J. (2019a). Improved detection of rare, endangered and invasive trout in using a new large-volume sampling method for eDNA capture. Environ. DNA. 2, 13–23. doi: 10.1002/edn3.23
Sepulveda, A. J., Schmidt, C., Amberg, J., Hutchins, P., Stratton, C., Mebane, C., et al. (2019b). Adding invasive species biosurveillance to the US Geological Survey streamgage network. Ecosphere 10:e02843. doi: 10.1002/ecs2.2843
Serrao, N. R., Reid, S. M., and Wilson, C. C. (2018). Establishing detection thresholds for environmental DNA using receiver operator characteristic (ROC) curves. Conservat. Genet. Resour. 10, 555–562. doi: 10.1007/s12686-017-0817-y
Smith, M. M., and Goldberg, C. S. (2020). Occupancy in dynamic systems: accounting for multiple scales and false positives using environmental DNA to inform monitoring. Ecography 43, 376–386. doi: 10.1111/ecog.04743
Spens, J., Evans, A. R., Halfmaerten, D., Knudsen, S. W., Sengupta, M. E., Mak, S. S., et al. (2017). Comparison of capture and storage methods for aqueous macrobial eDNA using an optimized extraction protocol: advantage of enclosed filter. Methods Ecol. Evolut. 8, 635–645. doi: 10.1111/2041-210X.12683
Thomas, A. C., Nguyen, P. L., Howard, J., and Goldberg, C. S. (2019). A self-preserving, partially biodegradable eDNA filter. Methods Ecol. Evolut. 10, 1136–1141. doi: 10.1111/2041-210X.13212
Thomsen, P. F., Kielgast, J., Iversen, L. L., Wiuf, C., Rasmussen, M., Gilbert, M. T. P., et al. (2012). Monitoring endangered freshwater biodiversity using environmental DNA. Mol. Ecol. 21, 2565–2573. doi: 10.1111/j.1365-294X.2011.05418.x
Tingley, R., Greenlees, M., Oertel, S., van Rooyen, A., and Weeks, A. (2019). Environmental DNA sampling as a surveillance tool for cane toad Rhinella marina introductions on offshore islands. Biol. Invasions 21, 1–6. doi: 10.1007/s10530-018-1810-4
Tsuji, S., Takahara, T., Doi, H., Shibata, N., and Yamanaka, H. (2019). The detection of aquatic macroorganisms using environmental DNA analysis—A review of methods for collection, extraction, and detection. Environ. DNA 2, 3–12. doi: 10.1002/edn3.21
Uthicke, S., Lamare, M., and Doyle, J. R. (2018). eDNA detection of corallivorous seastar (Acanthaster cf. solaris) outbreaks on the Great Barrier Reef using digital droplet PCR. Coral Reefs 37, 1229–1239. doi: 10.1007/s00338-018-1734-6
Wilson, C. C., Wozney, K. M., and Smith, C. M. (2016). Recognizing false positives: synthetic oligonucleotide controls for environmental DNA surveillance. Methods Ecol. Evolut. 7, 23–29. doi: 10.1111/2041-210X.12452
Woldt, A., Baerwaldt, K., Monroe, E., Tuttle-Lau, M., Grueneis, N., Holey, M., et al. (2019). Quality assurance project plan: eDNA monitoring of Bighead and Silver carps. Bloomington, MN.
Keywords: aquatic, false positive, metabarcoding, negative control (NC), PCR, targeted, review
Citation: Sepulveda AJ, Hutchins PR, Forstchen M, Mckeefry MN and Swigris AM (2020) The Elephant in the Lab (and Field): Contamination in Aquatic Environmental DNA Studies. Front. Ecol. Evol. 8:609973. doi: 10.3389/fevo.2020.609973
Received: 24 September 2020; Accepted: 16 November 2020;
Published: 07 December 2020.
Edited by:
Katy Klymus, United States Geological Survey (USGS), United StatesReviewed by:
Anna McKee, USGS South Atlantic Water Science Center, United StatesCopyright © 2020 Sepulveda, Hutchins, Forstchen, Mckeefry and Swigris. This is an open-access article distributed under the terms of the Creative Commons Attribution License (CC BY). The use, distribution or reproduction in other forums is permitted, provided the original author(s) and the copyright owner(s) are credited and that the original publication in this journal is cited, in accordance with accepted academic practice. No use, distribution or reproduction is permitted which does not comply with these terms.
*Correspondence: Adam J. Sepulveda, YXNlcHVsdmVkYUB1c2dzLmdvdg==
†Present address: Meghan Forstchen, University of Notre Dame, Notre Dame, IN, United States
Madeline N. Mckeefry, National Park Service, Yellowstone National Park, Mammoth, WY, United States
Anna M. Swigris, South Florida Water Management District, West Palm Beach, FL, United States
Disclaimer: All claims expressed in this article are solely those of the authors and do not necessarily represent those of their affiliated organizations, or those of the publisher, the editors and the reviewers. Any product that may be evaluated in this article or claim that may be made by its manufacturer is not guaranteed or endorsed by the publisher.
Research integrity at Frontiers

Learn more about the work of our research integrity team to safeguard the quality of each article we publish.