
94% of researchers rate our articles as excellent or good
Learn more about the work of our research integrity team to safeguard the quality of each article we publish.
Find out more
ORIGINAL RESEARCH article
Front. Ecol. Evol. , 09 November 2020
Sec. Behavioral and Evolutionary Ecology
Volume 8 - 2020 | https://doi.org/10.3389/fevo.2020.590345
This article is part of the Research Topic Adaptation of Invasive Species to Islands and the Puerto Rican Honey Bee View all 14 articles
 Alberto Galindo-Cardona1,2,3*†
 Alejandra C. Scannapieco1,4*†
 Romina Russo4
 Karen Escalante5Martín Geria5Nicolás Lepori5María M. Ayup3,5
 Irina Muntaabski1,4María C. Liendo1,4
 Lucas Landi6
 Tugrul Giray7
 A. Carolina Monmany-Garzia3*†
Varroa destructor is a serious ectoparasite of the western honey bee, Apis mellifera, which negatively impacts on colonies health and survival worldwide. Drone-mediated movement and the presence of the mite in Drone Congregation Areas (DCA) may play a relevant role in Varroa dispersal. The objectives of this study were to characterize mite infestation levels and genetic diversity in DCAs and surrounding apiaries and to explore putative environmental variables associated to Varroa infestation in two eco-climatic regions of Argentina (temperate, and subtropical). Phoretic mite proportions in DCAs and apiaries were estimated during spring. Landscape, topographic, and climate variables were described using satellite image classifications and data from public databases. The genetic composition of drones at the DCAs and workers from the surrounding apiaries was assessed using mitochondrial markers. In total, eleven DCAs were identified in both regions during 2017 and 2018. The mean proportion of Varroa was ca. 3 in 1,000 (0.0028 ± 0.0046) at the apiaries, and ca. 2 in 100 (0.0168 ± 0.0227) at the DCAs. No statistical differences were observed between apiaries and DCAs or between ecoregions, but the proportion of infested males at the DCAs was positively correlated to the distance to the apiary and a trend was observed toward higher mite loads in DCAs. Landscape and topography were not determinant for Varroa infestation at the DCAs but relative humidity and precipitation in the previous week of sampling, positively influenced infestation. More haplotypic diversity was detected in the DCAs compared to the surrounding apiaries, particularly in the subtropical region. While in this region high prevalence of Africanized (A1, A4) mitochondrial lineages was detected, European lineages (C1, C2j) were mostly found in apiaries and DCA in the temperate region. Our results provide valuable information on the dynamics of Varroa parasitism in apiaries and DCAs, and highlight the role of drones in mite dispersion and genetic variability of new colonies. The study of DCAs emerges as a tool for investigating not only honey bee reproduction and conservation, but also the impact of the environment on bee epidemiology.
Varroa destructor Anderson and Trueman (Acari: Varroidae) is considered the main ectoparasitic pathogen of the western honey bee Apis mellifera Linnaeus (Hymenoptera: Apidae) worldwide. No other pathogen has had a comparable impact on honey bee health and colony survival during the history of apiculture (Guzmán-Novoa et al., 2010; Le Conte et al., 2010; Neumann and Carreck, 2010; Francis et al., 2013). The dynamics of V. destructor populations and the impact of mite parasitism in honey bee colonies are influenced by the genotype of the bees (Guzmán-Novoa et al., 1999; Rosenkranz, 1999; Martin and Medina, 2004; Invernizzi et al., 2015; Merke, 2016) and by the environment (Meixner et al., 2015; Giacobino et al., 2017). For example, Africanized bees are more resistant to the Varroa mite than European bees in many South and Central American regions (Martin and Medina, 2004; Mondragón et al., 2005) and in Puerto Rico (Rivera-Marchand et al., 2012). Differences in Varroa infestation rates and mite tolerance were also detected between African subspecies (A. m. scutellata, A. m. capensis) and hybridized colonies of these two subspecies in South Africa (Mortensen et al., 2016). Meanwhile, recent research in honey bee populations of European origin demonstrated strong genotype—environment interactions and suggested that the presence of a highly significant environmental effect on Varroa infestation rates may be stronger than the effect of the bees’ genotype (Francis et al., 2013; Büchler et al., 2014). In fact, honey bee colony life histories, driven by environmental conditions, have a significant influence on Varroa infestation rates; in consequence, mite infestation thresholds probably vary considerably across localities and regions (Meixner et al., 2015; Giacobino et al., 2017).
Landscape, topography, and climate are relevant environmental drivers that can influence the prevalence of Varroa in honey bee colonies (Chemurot et al., 2016; Giacobino et al., 2017; Correia-Oliveira et al., 2018). Landscape composition has been shown to impact on bee health in general, and in V. destructor loads in particular (Youngsteadt et al., 2015; Giacobino et al., 2017; Kuchling et al., 2018). However, the relationship between landscape and Varroa is not clear, because some studies have reported high prevalence of Varroa in colonies where urban land cover dominates (Youngsteadt et al., 2015), while others have described high prevalence of the mite where crops dominate (e.g., Giacobino et al., 2017). Similarly, in relation to topographic and climatic influence, some variables such as altitude, apiaries slope, temperature, and rainfall have been shown to be associated with mite parasitism in honey bees’ colonies from tropical and neotropical environments (Chemurot et al., 2016; Giacobino et al., 2017; Correia-Oliveira et al., 2018). Specifically, hot and dry conditions seem to be negatively correlated to the prevalence of the mite at the colony level (Maggi et al., 2016).
The majority of studies examining the role of the environment on the mite load have analyzed parasitism patterns in honey bee colonies, while a large component of mite dynamics is related to bees’ movement. In fact, nest drifting in honeybees is believed to be involved in disease transmission between colonies (e.g., Kralj and Fuchs, 2006, 2010; Aubert et al., 2008). This behavior, performed by female and male bees, has been attributed to beekeeping practices and a lack of landmarks (Free, 1958; Southwick and Buchmann, 1995; Nolan and Delaplane, 2017), and has been reported to vary depending on the season, colony characteristics and bee subspecies (Duranville et al., 1991; Pfeiffer and Crailsheim, 1998; Neumann et al., 2000, 2003; Paar et al., 2002; Forfert et al., 2015). At the same time, parasites can influence the drifting behavior of worker bees, and higher occurrence of drifting may occur in infected bees (Bordier et al., 2017). Drone-mediated movement may also play a relevant role in disease transmission in general, and in Varroosis in particular (Nolan and Delaplane, 2017). Compared to the queen or the workers, the biology, dispersion activity, and influence on mites’ transmission of honey bee drones are poorly understood.
Male bees represent an important part of the mite-bee’ interaction, given that they often drift to other, non-maternal colonies and may spread the mite among them (Neumann et al., 2000; Paar et al., 2002; Abrol, 2012; Gąbka, 2018). In addition, drones and queens from different colonies meet during the spring and summer at mating areas that persist through the years, called Drone Congregation Areas (DCAs) (Zmarlicki and Morse, 1963; Ruttner, 1966). Recently, the presence of Varroa in males gathered at DCAs has been reported in the continental US (Mortensen et al., 2018), which suggests that these sites are of utmost importance when studying the dynamics of the parasitization. In Puerto Rico, DCAs have been observed to meet certain landscape characteristics, such as dominance of grassland cover, the presence of surrounding tree curtains, a slope of 20°, and southern orientation (Galindo-Cardona et al., 2012). DCAs’ characteristics have been understudied in the southern hemisphere, thus the relationship between environmental characteristics and Varroa infestation at these sites remains unclear.
In Argentina, apiculture occurs in four of six eco-climatic regions, and particular honey bees’ ecotypes have locally adapted to these regions, with important implications for Varroa resistance, bees’ productivity, and defensive behavior (Giacobino et al., 2016, 2017; Merke, 2016). For instance, in contrast to what occurs in the temperate regions of the country, honey bee populations exhibit general resistance or tolerance to the mite in the subtropical region, possibly because of the high prevalence of African-derived bees and the warmer temperatures of these regions (Hou et al., 2016; Correia-Oliveira et al., 2018). At the same time, not only climatic or bee genetics, but also agricultural and beekeeping practices, and landscape features, such as urban land cover, differ between regions, and are potentially important determinants of the levels of Varroa at apiaries in our territory (Abrol, 2012; Giacobino et al., 2017; Molineri et al., 2018). In addition, the first DCAs have been recently identified in the subtropical region of Argentina (Galindo-Cardona et al., 2017). However, the contribution of these areas to the Varroa dispersal and the possible differences in DCA features and Varroa parasitism between eco-climatic regions have not been explored yet. Our approach in this study was to address the relative importance of distance to the closest apiary, landscape, topographic, and climatic characteristics on Varroa infestation at the DCAs and to characterize genetic diversity in two eco-climatic regions of Argentina (subtropical and temperate). In addition, we intended to environmentally describe DCAs in South America for the first time. Our main hypothesis was that Varroa infestation and genetic diversity at the DCAs varied across eco-climatic regions associated with land cover, topographic, and climatic characteristics.
Commercial and non-commercial apiaries and their respective DCAs were evaluated during 2017 and 2018 in two provinces of Argentina: Tucumán (TU) and Buenos Aires (BA). A total of four apiaries were monitored in TU (Alberdi, Timbó Viejo, Manantial and Horco Molle) and five in BA (two at Luján, two at Castelar, and one in San Antonio de Areco) (Figure 1). These provinces belong to different eco-climatic regions of the territory (Figure 1). In Tucumán, the climate is subtropical, with precipitations mostly concentrated between October and March, and cold and dry winters (Cabrera and Willink, 1980). The original vegetation of this region (called Yungas forest) includes canopy species of the Fabaceae (e.g., Parapiptadenia exelsa), Bignoniaceae (e.g., Handroanthus impetiginosus), Lauraceae (e.g., Ocotea porphyria), and Malvaceae (e.g., Ceiba chodatii) families, among others. For decades, the lowest elevation belt of the Yungas forest has been progressively transformed into agricultural lands, mainly sugarcane and citrus (Gasparri and Grau, 2009) and currently it is a mosaic of croplands bordering the remaining Yungas forests on the eastern slopes of the pre-montane range of the Andes (Morello et al., 2018; Oyarzabal et al., 2018). In Buenos Aires, the climate is temperate, with precipitations occurring between March and June. The original vegetation of the region (Pampa) was a scrub dominated by species of the Zygophyllaceae family and by flowering plants as alfalfas, clovers and trees of the Fabaceae family, such as Prosopis sp. and Geoffroea sp. (Ferrari et al., 2011). The intensive and persistent agriculture and the rising cattle production in the region has deeply transformed the landscape in the last decades (Morello et al., 2018). The Pampa region concentrates around 65% of the beekeepers in the country. In Buenos Aires there are approximately 1,500,000 hives in contrast to the near 40,000 hives in Tucumán, where the majority of beekeepers are small producers and hardly exceed 30 hives each (Ferrari et al., 2011).
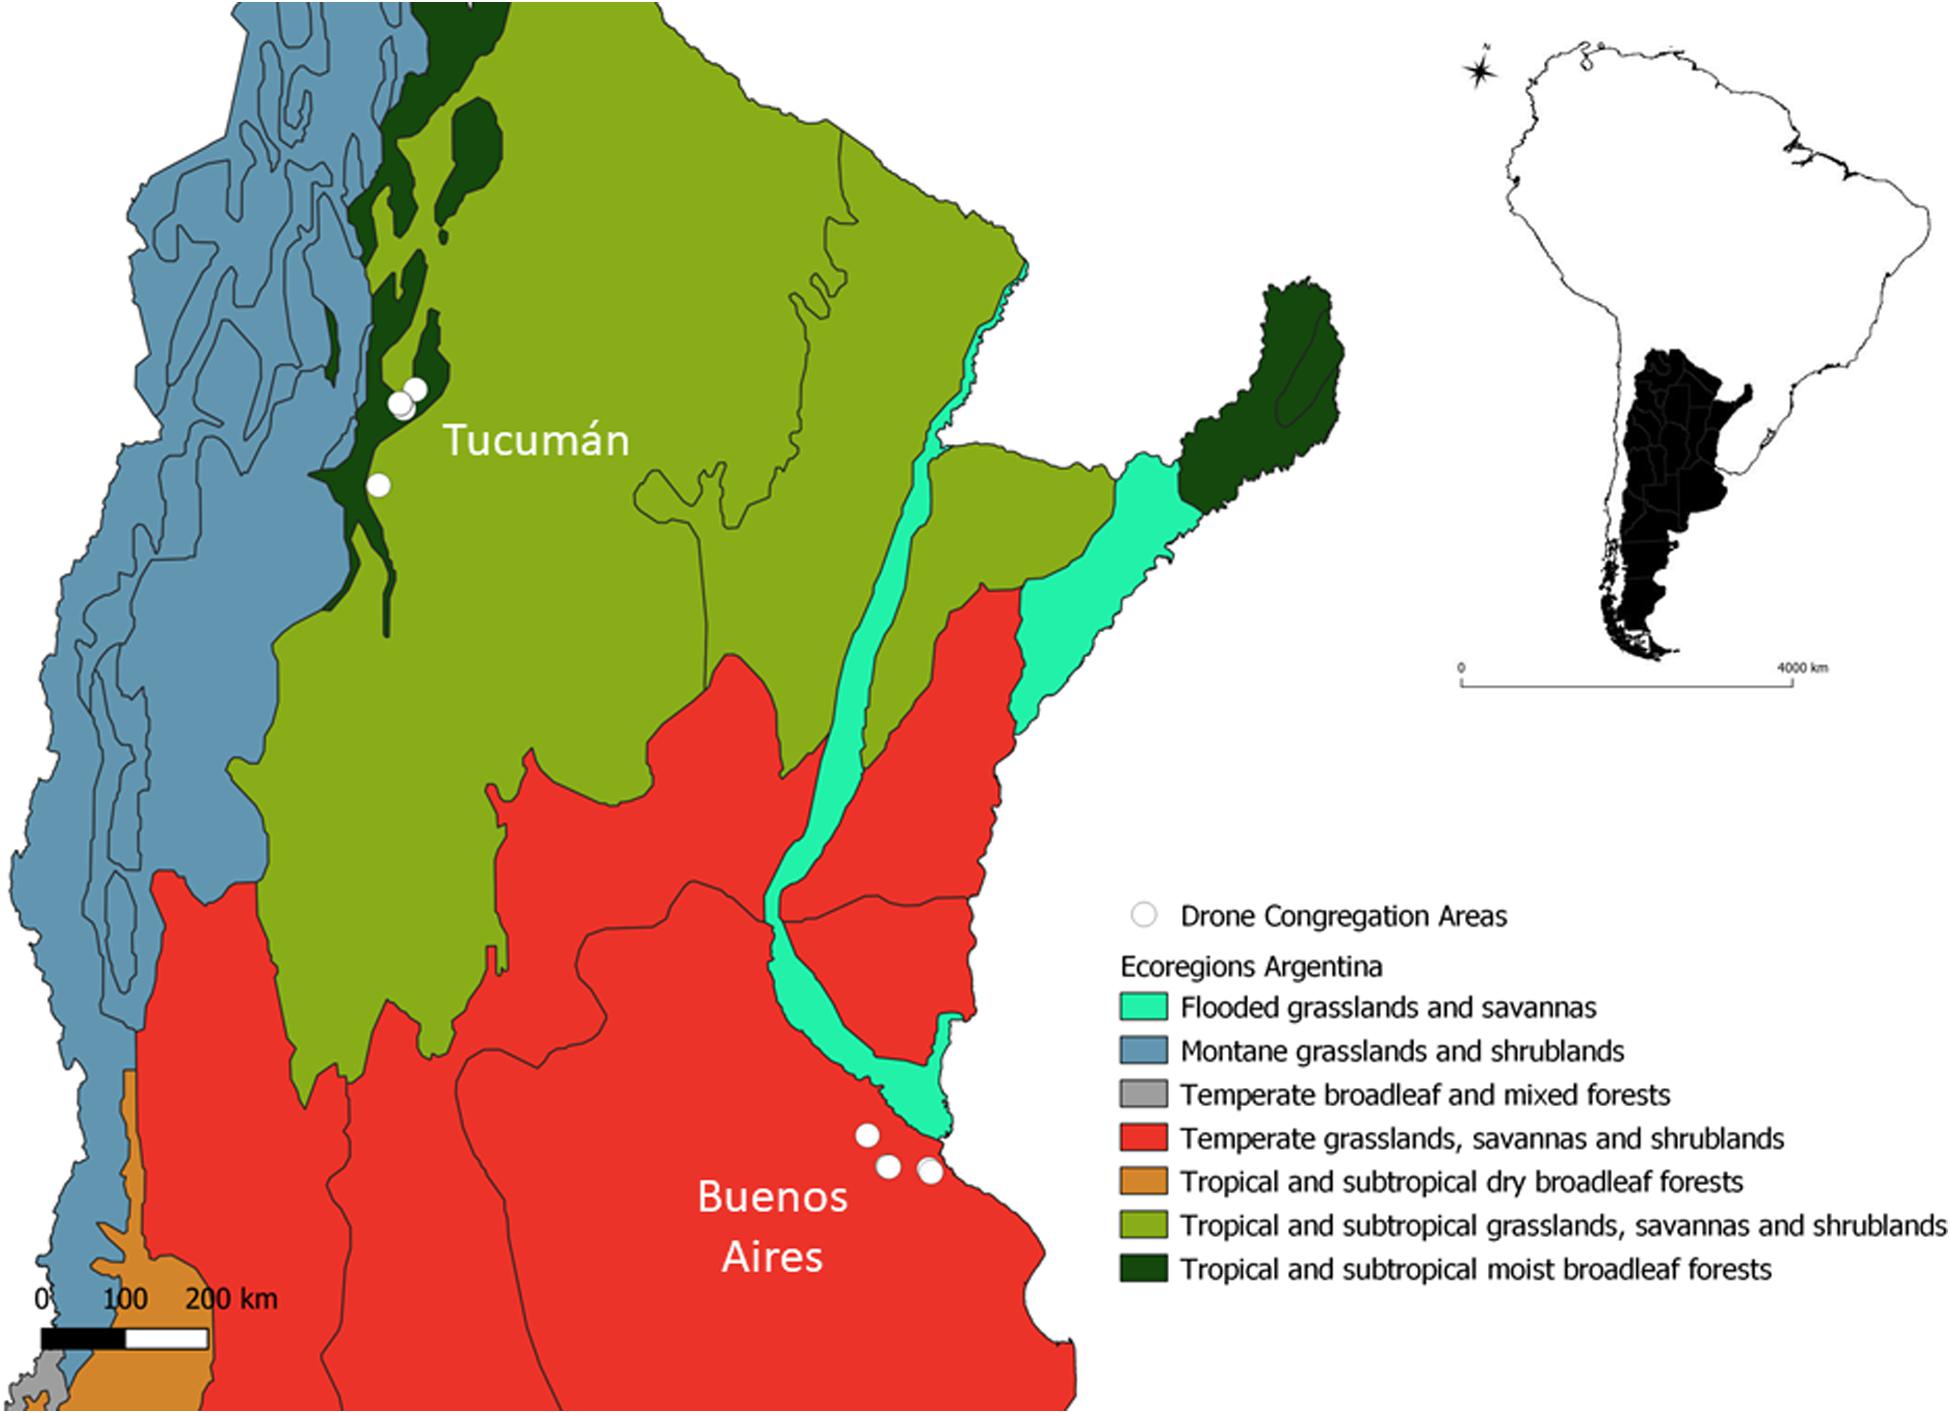
Figure 1. Map of the study area showing the identified Drone Congregation Areas at the two eco-regions in Argentina. Eco-regions were defined according to Olson et al. (2001).
At both eco-regions and for each of the nine reference apiaries, a search of the nearest DCA was performed. DCAs were identified and monitored once in spring and once in summer, for two consecutive years (2017 and 2018) in order to assess their stability through seasons and years. To find a DCA, the route of drones entering and leaving colonies was traced in each reference apiary (Galindo-Cardona et al., 2012, 2017). To this end, a synthetic pheromone (9-hydroxy-2-enoic acid, Phero Tech Inc.) was attached to a helium balloon, which was elevated at a distance of 150 meters from the apiary. This action was repeated multiple times while increasing the distance from the apiary and following the direction of the drones’ flights. Searches were carried out intensively during 1 week in each apiary. Each DCA was confirmed where at least 30 drones were observed forming a comet around the bait. At that site, the pheromone was elevated with an unmanned aerial vehicle (UAV) (DJI Phantom 3 STD) at three different points and drone arrival re-checked for a final confirmation.
The four apiaries in TU and five in BA were evaluated in spring of 2018 for the V. destructor phoretic infestation following De Jong et al. (1982) and Dietemann et al. (2013). Thirty percent of the colonies of each apiary (and up to six honey bee colonies in the smallest apiaries) were sampled randomly. Approximately, three hundred worker bees were collected from each colony and conserved in 96% ethanol. Similarly, at each identified DCA, phoretic Varroa infestation was assessed on samples of flying drones, which were attracted using the synthetic pheromone (9-hydroxy-2-enoic acid) attached to an UAV, and collected with a standard entomological net at 1.5–2.5 m above ground. Phoretic Varroa infestation was estimated as the number of mites/total number of sampled bees (drones or workers in each case).
Landscape composition and configuration, and topography were characterized within 400 m-radii buffers around each DCA, given that landscape characteristics have been previously shown to be highly correlated to the presence of DCAs at this distance (Galindo-Cardona et al., 2012). First, a supervised classification of Sentinel-2 satellite images (pixel resolution: 10 m; European Space Agency) was performed using a random forest classifier in Google Earth Engine (Gorelick et al., 2017). To do this, winter scenery (June–September 2018) was combined with summer scenery (January–May 2018) with less than 10% of cloudy pixels. Then, land use was categorized within the buffers into: (1) trees (linear forest remnants, groups of trees, and forest), (2) arable land (crops, pastures, and fields with bare soil), and (3) urban use (buildings, paved roads) (Supplementary Table 1). In relation to topographic characteristics, a 30 m-resolution Digital Elevation Model from the US Geological Survey (Jarvis et al., 2007) was used to calculate slope and aspect in Google Earth Engine, and roughness in QGIS 2.18 (Geographic Information System [QGIS], 2018) within each buffer (Supplementary Table 1).
Climate data were downloaded from public databases for 2018 for both eco-regions. Data for each identified DCA in Tucumán were downloaded from the Agrometeorology Section of the Obispo Colombres Agro-industrial Experimental Station (EEAOC) website.1 Data for each identified DCA in Buenos Aires were downloaded from the section of Agrometeorology Management and Information System of the National Institute of Agricultural Technology (INTA)2 (Supplementary Table 1).
To identify bees’ mt haplotype, newly emerged workers were collected from the central brood frames of colonies of apiaries at Timbó Viejo, Manantial, and Horco Molle (TU), and Luján and Castelar (BA) in spring 2018 (Figure 1). One (TU) or two (BA) apiaries per locality and 7–10 colonies per apiary were sampled. Total DNA was extracted from the thorax of one worker per colony following a high-salt protocol (Baruffi et al., 1995). DNA samples of honey bee workers were analyzed using a PCR-RFLP-based method. A fragment of 1,001 bp from the mitochondrial COI-COII region was amplified by PCR using primers and conditions described by Hall and Smith (1991) and Lobo Segura (2000). The amplifications were conducted in a MJ PTC-100 thermal cycler (GMI, Ramsey, MN, United States) and the cycle consisted of an initial denaturation step of 2 min at 94°C followed by 40 cycles of 30 s at 94°C, 30 s at 55°C, and 1 min at 72°C, followed by a final extension step of 2 min at 72°C. A 10-ll aliquot of each PCR product was digested with HinfI (Promega, Madison, MN, United States) following the manufacturers recommendations. The restriction fragments were separated on 4% (wt/vol) agarose gels, stained with GelRed and photographed under UV light. The haplotypes detected in the restriction analysis using HinfI were assigned as previously described by Agra et al. (2018). A total of 15 and 35 individual worker samples were analyzed for TU and BA, respectively. The same procedure was performed to evaluate the haplotypic lineage of drones from the identified DCAs; in this case, 20–30 drones from each DCA were analyzed. A total of 78 and 64 individual drone samples were analyzed for TU and BA, respectively. In all cases, except for Castelar Norte and Castelar Sur, we sampled at least twice the number of drones from each DCA than workers from colonies of the surrounding (reference) apiary.
For statistical analyses, only the proportion of Varroa for 2018 was used because data for 2017 were scarce. One site (i.e., Alberdi, TU) could not be visited in 2018, then data for 2017 was used instead. All statistical analyses were conducted in R (R Core Team, 2017). The proportion of Varroa at the DCAs and at the colonies were arcsin-transformed according to arcsin(sqrt(proportion of infested drones at DCA/colony) for all further analysis. To test for differences in the proportion of Varroa between samples (apiaries vs. DCAs) and ecoregions (BA vs. TU) a Two-way ANOVA was performed. To examine the effects of the closest apiaries on the incidence of Varroa at the DCAs, two analyses were conducted. First, a linear model (lm) was run on the proportion of infested bees in the colonies as the explanatory variable and the proportion of infested drones at the DCAs as the response variable. A second linear model was performed with the distance of the DCA to the closest apiary as the explanatory variable and the proportion of infested drones at the DCAs as the response variable.
To examine the relationship between Varroa infestation at the DCAs and landscape, topographic, and climate variables, several analyses were performed. First, to characterize the DCAs in both eco-regions, a Principal Components Analysis (PCA) on each of the subsets of variables was performed, using landscape, topographic, and climate variables, respectively, in a main matrix. The data were relativized to the maximum value and the PCA was run using a correlation matrix, and a distance—based biplot. A supplier seed = 20 and number of runs = 999 were set in all cases. PCAs were run in PCORD 5.0 (McCune and Mefford, 1999). After performing the PCAs with each data subset (i.e., landscape, topographic, and climate) the eigenvalues of the first two axes were extracted in each case to relate them to the level of Varroa at the DCAs. To test these relationships, individual GLMs were run on the proportion of Varroa at the DCAs as response variable and both PCA axes were examined as additive factors. In addition, based on the correlations of each variable with the first two PCA axes (Table 1), the variables that were most positively and most negatively correlated to each axis were selected (i.e., four variables in total for each data subset) to perform backward stepwise GLM selections. These model selections were performed for the landscape, topographic, and climate datasets separately with the aim of simplifying variable numbers before running the final model. The terms were additive in all cases.
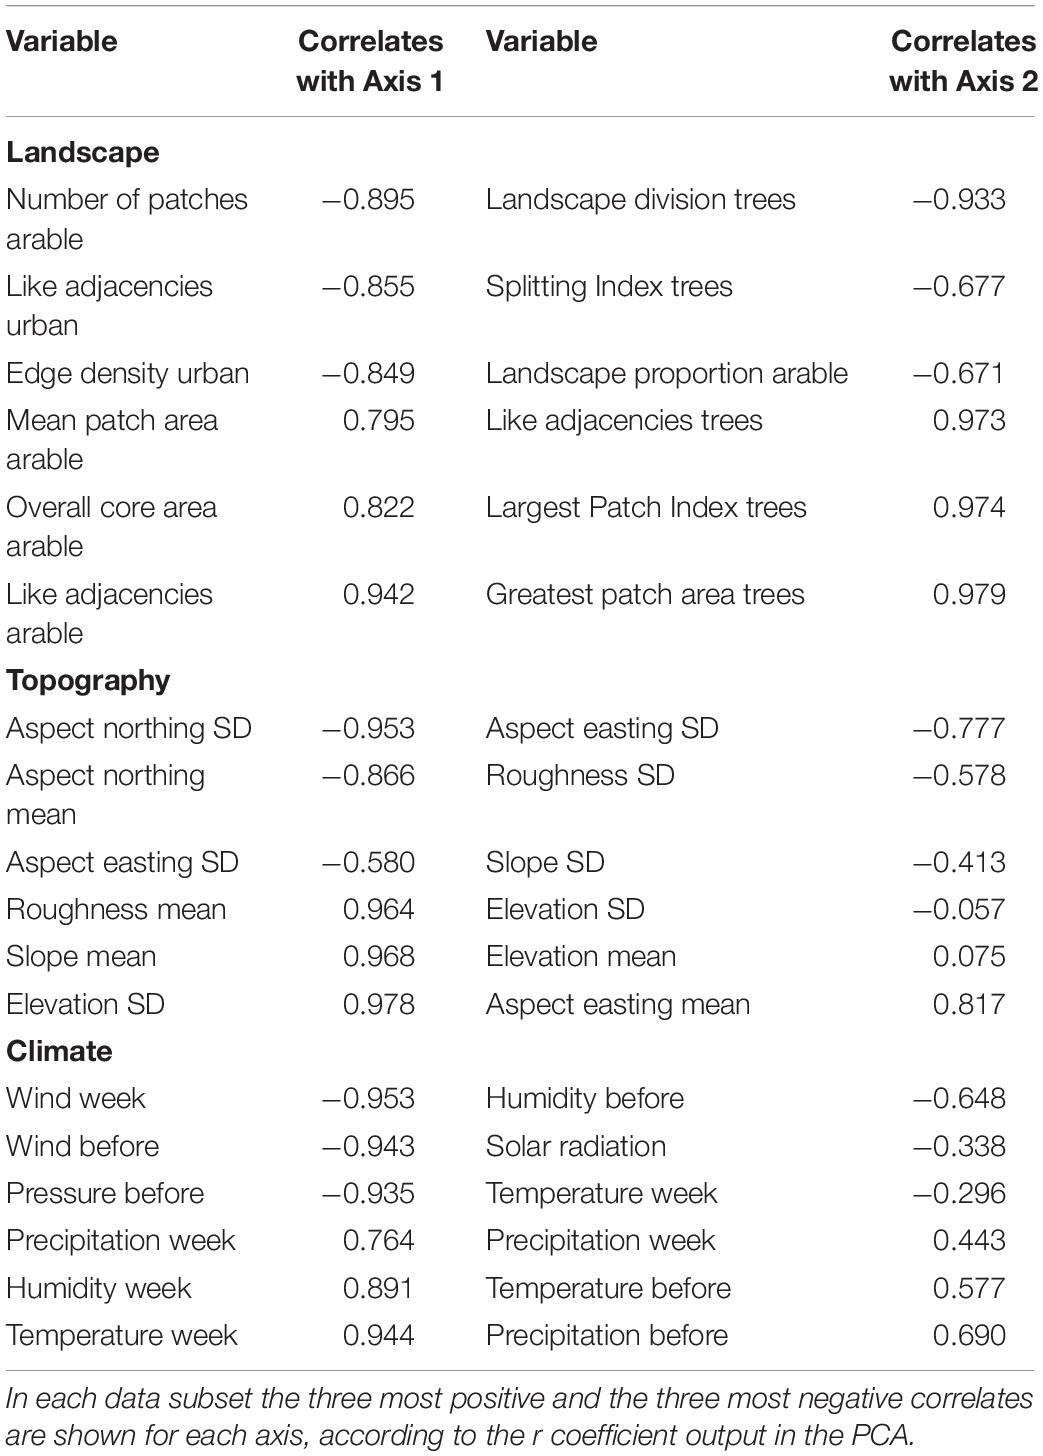
Table 1. Main correlates between landscape, topographic, and climatic metrics analyzed using Principal Components Analysis and the first two PCA axes in each analysis.
A final process of backward stepwise GLM selections were performed using the proportion of Varroa at the DCAs as the response variable; distance of the DCA to the closest colony, and the landscape, topography, and climate variables selected in the previous steps were explanatory variables. The explanatory variables were examined as additive and interacting factors. The GLMs were run using family = gaussian and link = identity. The function step in R conducts a stepwise selection procedure starting with an arbitrary model, adding or removing a term from the model that most reduces the Akaike’s information criterion (AIC) and stops when no step decreases the AIC (Chambers and Hastie, 1993). The AIC identifies the best model taking into account both the sample size and the number of predictors (Quinn and Keough, 2002); models with the lowest AIC are the best fit, more parsimonious models.
To analyze possible differences in haplotype frequencies between eco-regions (TU vs. BA) and between apiaries and DCAs for each region, Chi-square tests were performed. Spearman’s rank order correlations between the percentage of Varroa and the percentage of Africanized haplotypes were performed separately for DCAs and apiaries.
We found a total of 11 DCAs, five in 2017 and six more in 2018 (Supplementary Table 1). All DCAs found in 2017 persisted in 2018. The maximum distance between each DCA and the closest apiary was 1,000 m and the average distance between DCAs and apiaries was 500 m. Specifically for the locality of Manantial (TU), two DCAs were detected and since these were separated by 100 m, only the one that was confirmed in both years was included in the analyses. In the locality of Horco Molle (TU) three DCAs, separated by 1,000 m, were identified and all were included in the analyses. For the rest of the localities, only one DCA was identified per reference apiary.
In 2018, the mean proportion of Varroa was 0.0028 (SD: 0.0046) at the apiaries and 0.0168 (SD: 0.0227) at the DCAs (Supplementary Table 1). Varroa infestation was not significantly different between apiaries and DCAs (F = 0.6179, df = 1, p = 0.442) or between BA and TU (F = 0.112, df = 1, p = 0.742) (Figure 2). The proportion of Varroa at the DCAs was not linearly correlated to the proportion of Varroa at the apiaries (Adj. R2 = −0.1186, p = 0.8357; Figure 3A), but it was positively correlated to the distance to the apiaries (Adj. R2 = 0.3718, p = 0.02734; Figure 3B). Specifically, the proportion of Varroa at the DCAs varied between 0 and 0.02 up to 800 m away from the apiaries, and increased to more than 0.06 at higher distances.
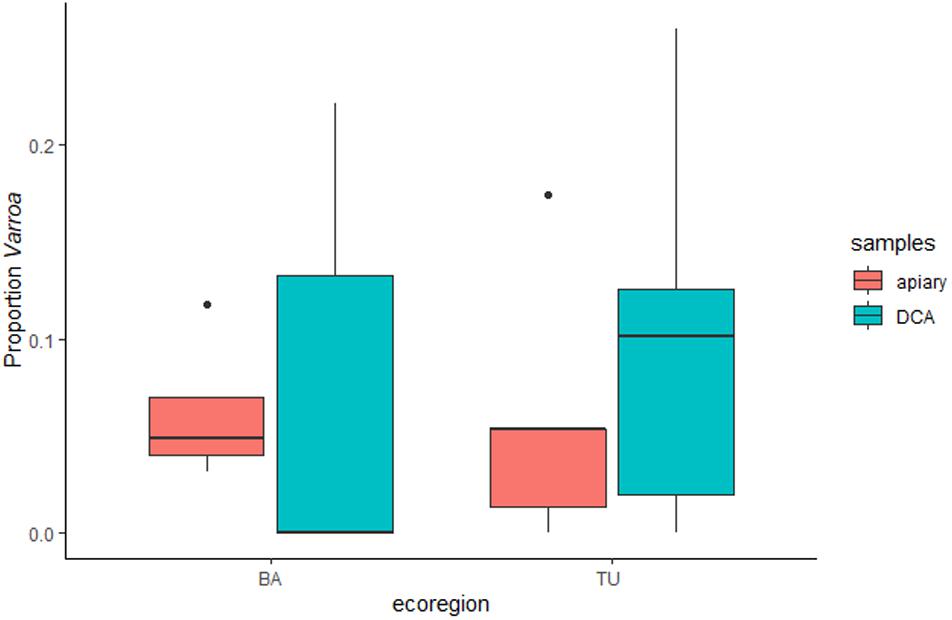
Figure 2. Box-and-whisker plot of the arcsine-transformed proportion of Varroa in samples taken from apiaries and from Drone Congregation Areas at the two ecoregions, Buenos Aires (BA) and Tucumán (TU). Each box shows the lower and upper quartiles, the black line within the box is the median, and the error bars are the minimum and maximum values, respectively.
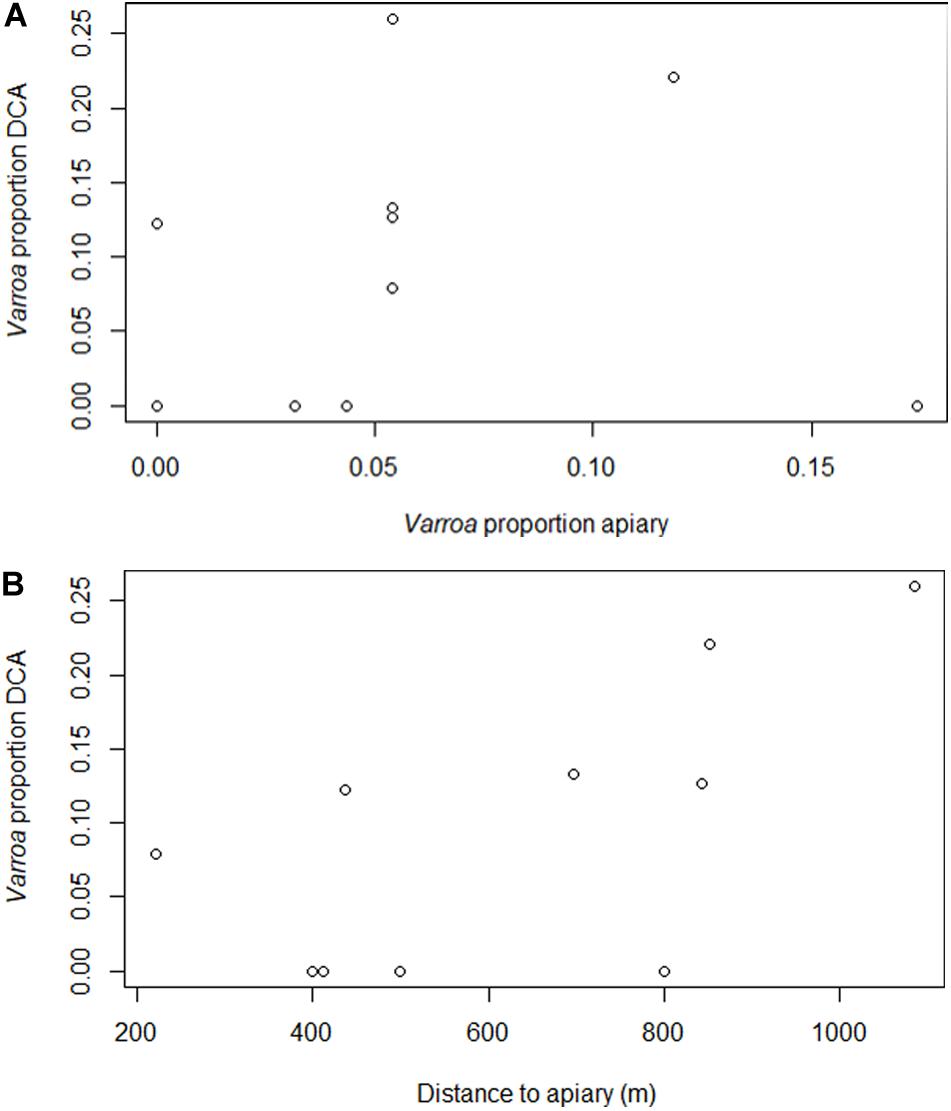
Figure 3. Proportion of Varroa infestation at the DCAs in relation to (A) proportion of Varroa infestation at the closest apiary, and (B) distance to the closest apiary. Data from the two eco-regions of Argentina were included in the analysis. Proportion of Varroa infestation was arcsine-square root-transformed.
The dominant land use around all DCAs was arable lands, which varied between 28 and 88% and showed greater connectivity and more regular-shaped patches than natural vegetation and urban covers. The multivariate analysis showed that PCA Axis 1 explained 37.25% and Axis 2 explained 30.19% of the variation in the landscape features characterizing the DCAs, respectively (Figure 4A). Cumulatively, Axes 1–4 explained 86.72% of this variation. DCAs in TU showed landscape characteristics that separated them from DCAs in BA, in general. Axis 1 separated sites surrounded by continuous arable land (right part of the axis) from sites surrounded by urban land cover (left part of Axis 1) (Table 1 and Figure 4A). DCAs surrounded by continuous arable land showed high values of the following metrics calculated from the arable land cover: Mean Patch Area, Overall Core Area, and Like Adjacencies (i.e., contiguity). In contrast, DCAs surrounded by urban land cover showed high values of Number of arable land patches (i.e., the arable cover was more fragmented), and high values of Like Adjacencies and Edge Density of the urban cover. Axis 2, which explained as much variation in the data as Axis 1, separated DCAs located at TU from those located at BA more clearly than Axis 1. The main variable differentiating DCAs at both ecoregions was the configuration of the natural vegetation land cover. DCAs at the upper part of the ordination (i.e., high values in Axis 2) had high values of Greatest Patch Area, Largest Patch Index, and Like Adjacencies of the natural vegetation land cover. On the other hand, DCAs located at the lower part of the ordination, showed high values of Landscape Proportion of the arable cover and high values of Landscape Division and Splitting Index of the natural vegetation cover.
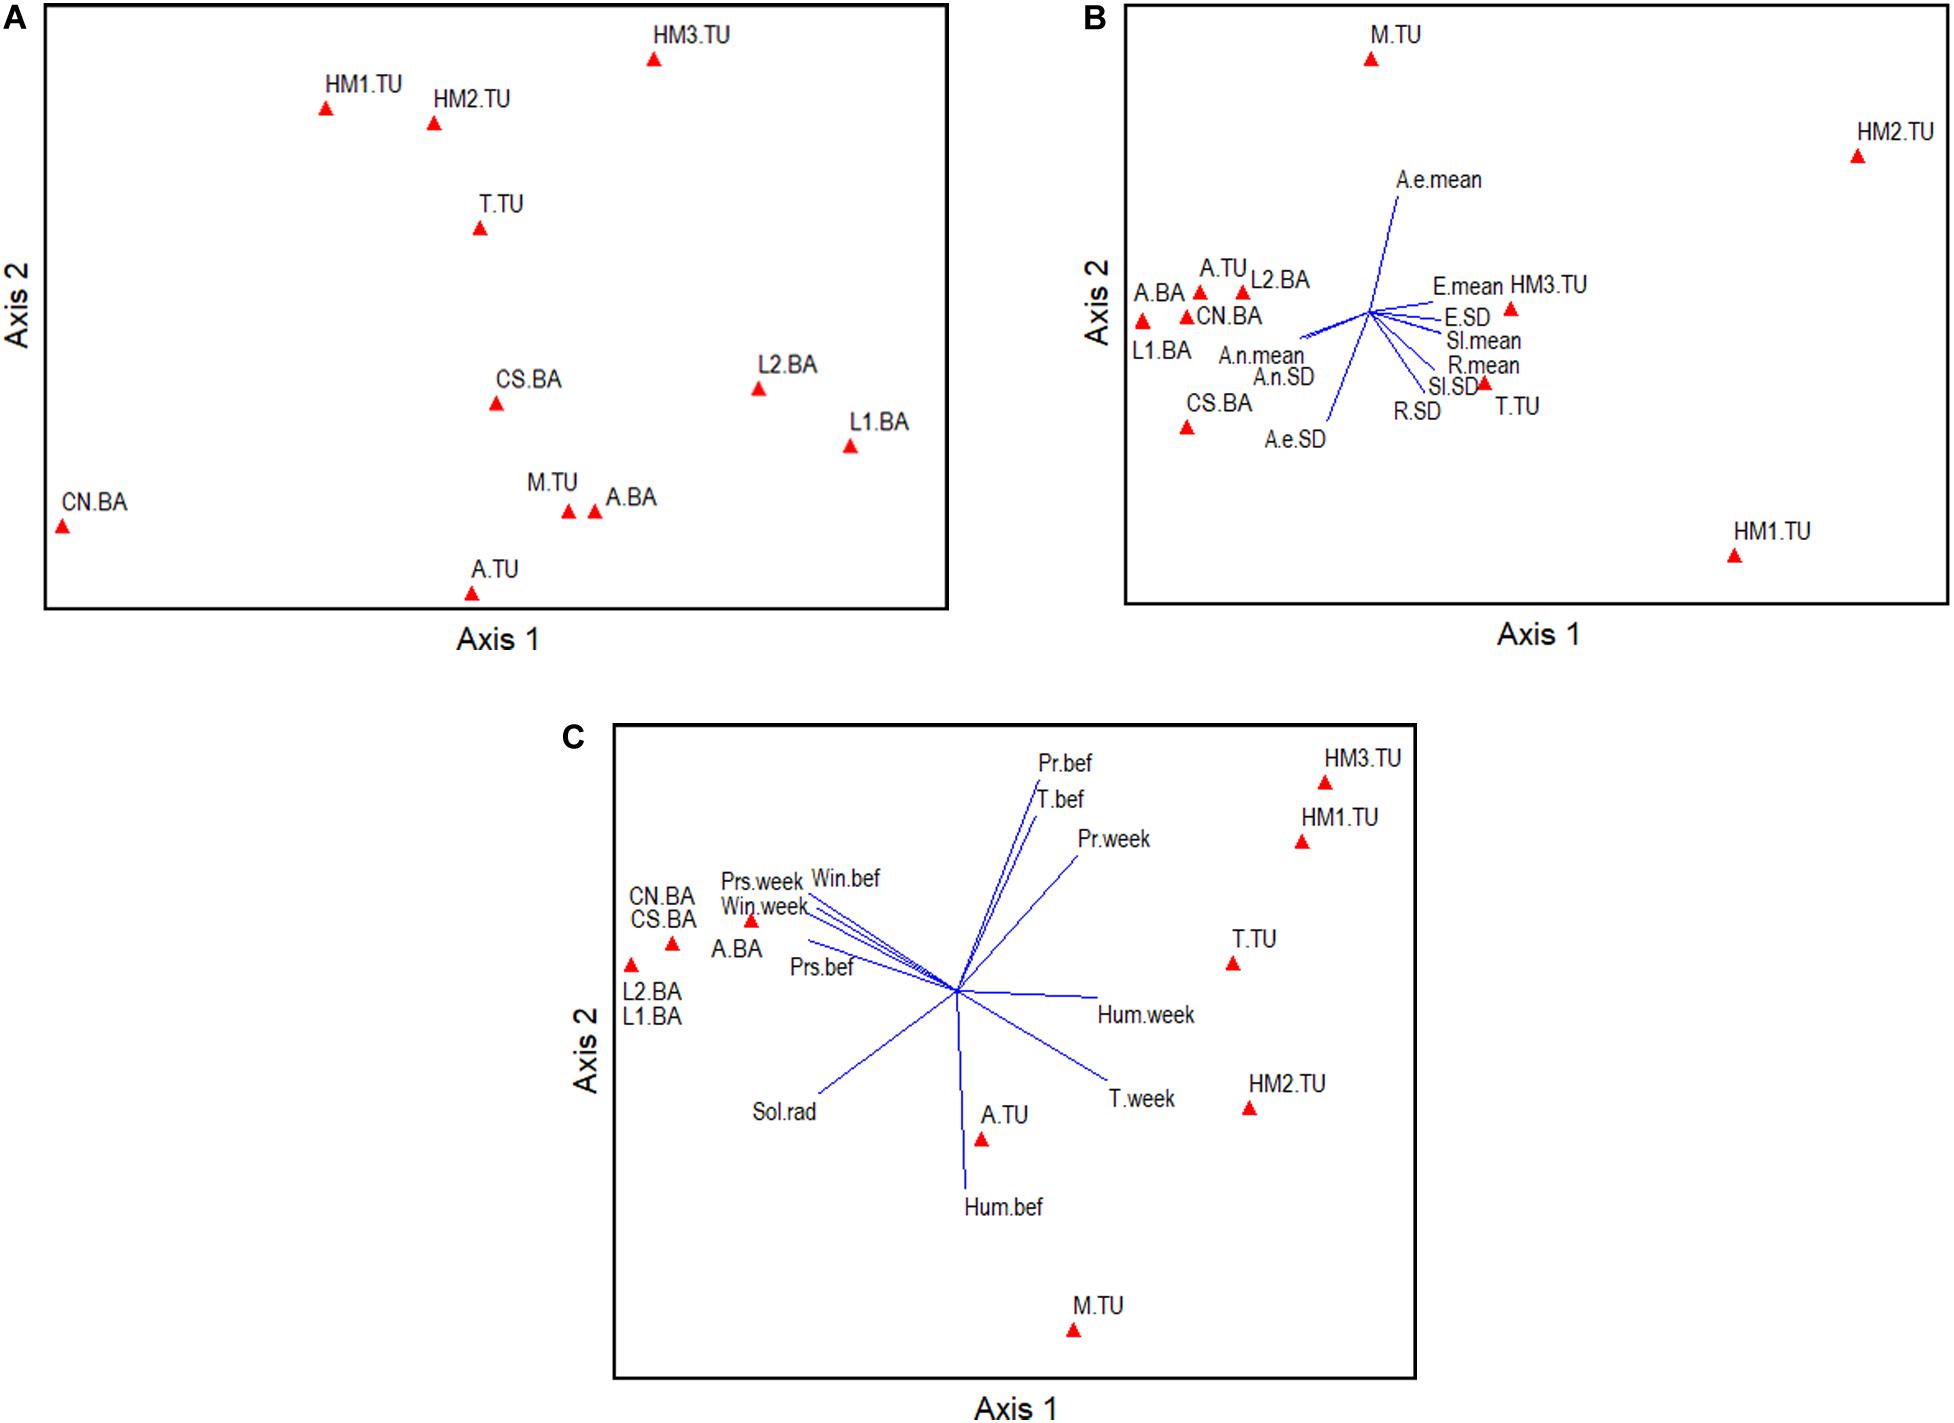
Figure 4. Principal Components Analyses of the Drone Congregation Areas located in two eco-regions in Argentina. PCAs on (A) landscape variables, (B) topographic variables, and (C) climate variables using a correlation matrix in all cases (Supplementary Table 1 for coding).
In relation to topography, Axis 1 explained 70.6% and Axis 2 explained 19.0% of the variation in the PCA run on the DCAs. Cumulatively, Axes 1–4 explained 96.62% of this variation. DCAs in TU were more variable in terms of topographic characteristics than DCAs in BA. Axis 1, which explained most of the variation in the ordination, separated DCAs located at a more variable elevation above sea level (right part of the axis) from DCAs at slopes facing to the north (left part of Axis 1) (Table 1 and Figure 4B). The DCAs at the right part of the axis were mostly in TU where DCAs were located at a maximum of 688 m.a.s.l. In addition to showing high values of Elevation Standard Deviation (e.g., 17.45), they showed high values of Mean Slope (5.6°) and Mean Roughness (Supplementary Table 1). Roughness derives from elevation and represents the physical morphology of the sites where DCAs were located. In contrast, at the left part of the axis, DCAs were mostly from BA, which, in addition to low elevation above sea level (from 8 m.a.s.l.), showed high values of Aspect northing Standard Deviation and Aspect northing mean, followed by Aspect easting Standard Deviation. Axis 2 did not clearly separate DCAs at the ecoregion level. The main variable differentiating DCAs in this axis was Aspect easting mean, which was positively related to Axis 2. To a lesser degree, Elevation mean and Standard Deviation characterized DCAs at the upper part of the ordination. In contrast, at the lower part of the ordination, DCAs showed high values of Aspect easting Standard Deviation, Roughness Standard Deviation, and Slope Standard Deviation.
The DCAs were located in sites under different climatic characteristics (Figure 4C). Axis 1 in the PCA explained 63.76% and Axis 2 explained 17.25% of the variation in climate variables. Cumulatively, Axes 1–4 explained 96.27% of this variation. In comparison with the landscape and topographic ordinations, PCA runs on climate variables more clearly separated DCAs in TU from DCAs in BA. Axis 1 separated DCAs located at sites with high mean temperature in TU (right part of the axis) from DCAs at sites with high values of wind velocity in BA (left part of Axis 1) (Table 1 and Figure 4C). In addition, DCAs in TU showed high values of relative humidity and mean precipitation while DCAs in BA showed high values of both wind velocity and atmospheric pressure the week before sampling. Axis 2 was positively correlated to both, mean precipitation and mean temperature the week before sampling, and to mean precipitation on the week of sampling (i.e., DCAs in the upper part of the ordination) (Table 1 and Figure 4C). At the same time, Axis 2 was negatively correlated to relative humidity 1 week before sampling, solar radiation, and mean temperature on the week of sampling (i.e., DCAs in the lower part of the ordination).
The proportion of Varroa at the DCAs was not related to the PCA’ eigenvalues in any of the three data subsets (i.e., landscape, topography, climate) (Table 2). When landscape, topographic, and climate variables were tested in separate GLMs (i.e., one GLM for each data subset) as additive terms, the following were significantly correlated to the proportion of Varroa at the DCAs: Distance of DCA to closest apiary, Landscape Division of the natural vegetation cover, mean precipitation 1 week before sampling, and relative humidity 1 week before sampling. These variables were considered in the final backward stepwise GLM selections where the full model contained the simple terms, quadratic terms, and interactions. The best resulting model was: Proportion Varroa at DCA = Distance of DCA to closest apiary + Humidity 1 week before + (Precipitation 1 week before) 2 + Distance of DCA to closest apiary ∗ Humidity 1 week before ∗ (Precipitation 1 week before) 2 (Residual deviance: 0.0017315 on 3 degrees of freedom, AIC: −47.106) (Table 3 and Figure 5).
Table 2. Coefficients resulting from Generalized Linear Models (GLM) where the proportion of drones infested with Varroa at the Drone Congregation Areas was the response variable.
Table 3. Coefficients resulting from backward stepwise deletions using the proportion of drones infested with Varroa at the Drone Congregation Areas (DCAs) as the response variable.
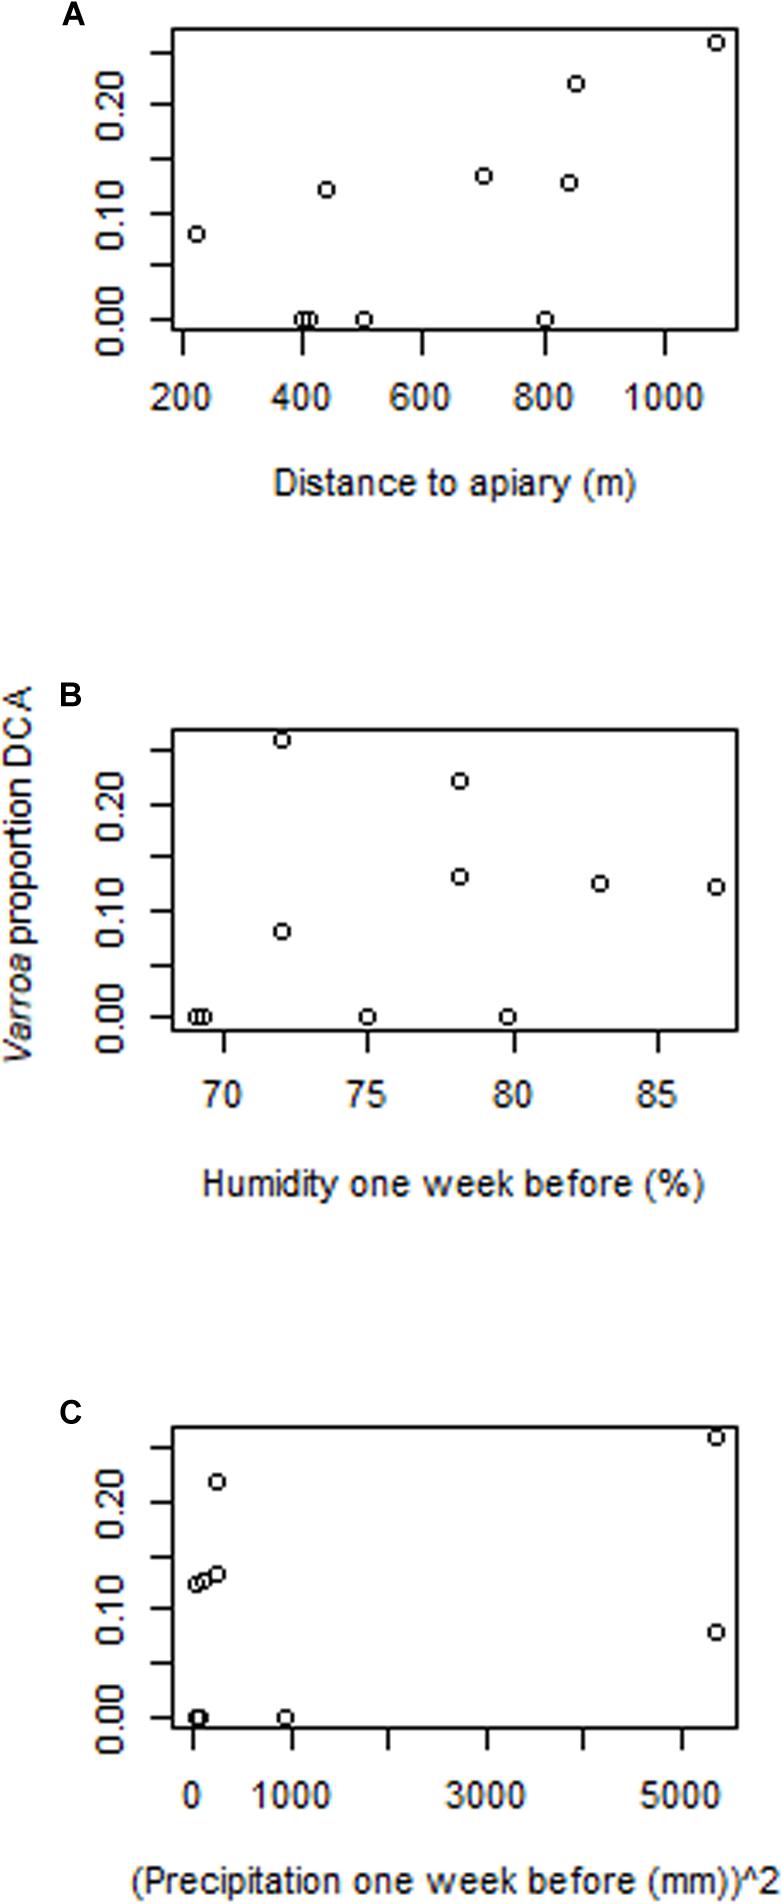
Figure 5. Relationships between the proportion of Varroa in males at the Drone Congregation Areas and the environmental variables identified by the automatic Generalized Linear Model backward selection in R. (A) Distance from the DCA to the closest apiary, (B) humidity 1 week before Varroa estimation, and (C) precipitation 1 week before Varroa estimation. Proportion of Varroa infestation was arcsine-square root-transformed.
The analysis of workers from honey bee colonies and drones from DCAs revealed the presence of four mitochondrial haplotypes (Figure 6). Two haplotypes corresponded to evolutionary branch A (A1, A4), and two haplotypes corresponded to branch C (C1 and C2J). The African haplotypes A1 and A4 have been observed at a high frequency in African subspecies A. mellifera intermissa and A. m. scutellata, respectively, while the C1 haplotype corresponds to the East-European evolutionary lineage that includes the Italian honey bee A. m. ligustica and also the Carniolan honey bee (A. m. carnica). The haplotype diversity was similar between TU and BA, with three (C1, C2J, A1) and four (C1, C2J, A1, A4) haplotypes identified, respectively (Figure 6). However, the relative frequency of the identified haplotypes differed between eco-regions, and also between DCAs and their surrounding apiaries (specifically in the case of TU, subtropical region) (Figure 6). For the temperate region (BA), European haplotypes were found in a high percentage at DCAs (96.9%) and apiaries (97.1%), with no differences between them (χ2 = 0.01, P > 0.05). Haplotype C1 was the most prevalent of C lineage (found in 97% of the samples) and haplotype C2J was found in low frequency (found in 3% of the samples). Respect to the African mt lineage, only 3% of the analyzed samples from Buenos Aires were identified as haplotype A1, while the A4 haplotype was not found (Figure 6). Conversely, in the subtropical region, a higher mean percentages of A haplotypes was detected in both DCAs (73.1%) and apiaries (40.0%) when compared to temperate region (χ2 = 70.83, P < 0.0001 for DCAs; χ2 = 12.03, P = 0.001 for apiaries). Significant differences in the mean percentage of A lineage were identified between DCAs and the nearest apiaries for this region (χ2 = 6.3, P < 0.05). In these cases, two haplotypes (A1 and A4) were detected, being A4 the most prevalent in drones from the DCAs.
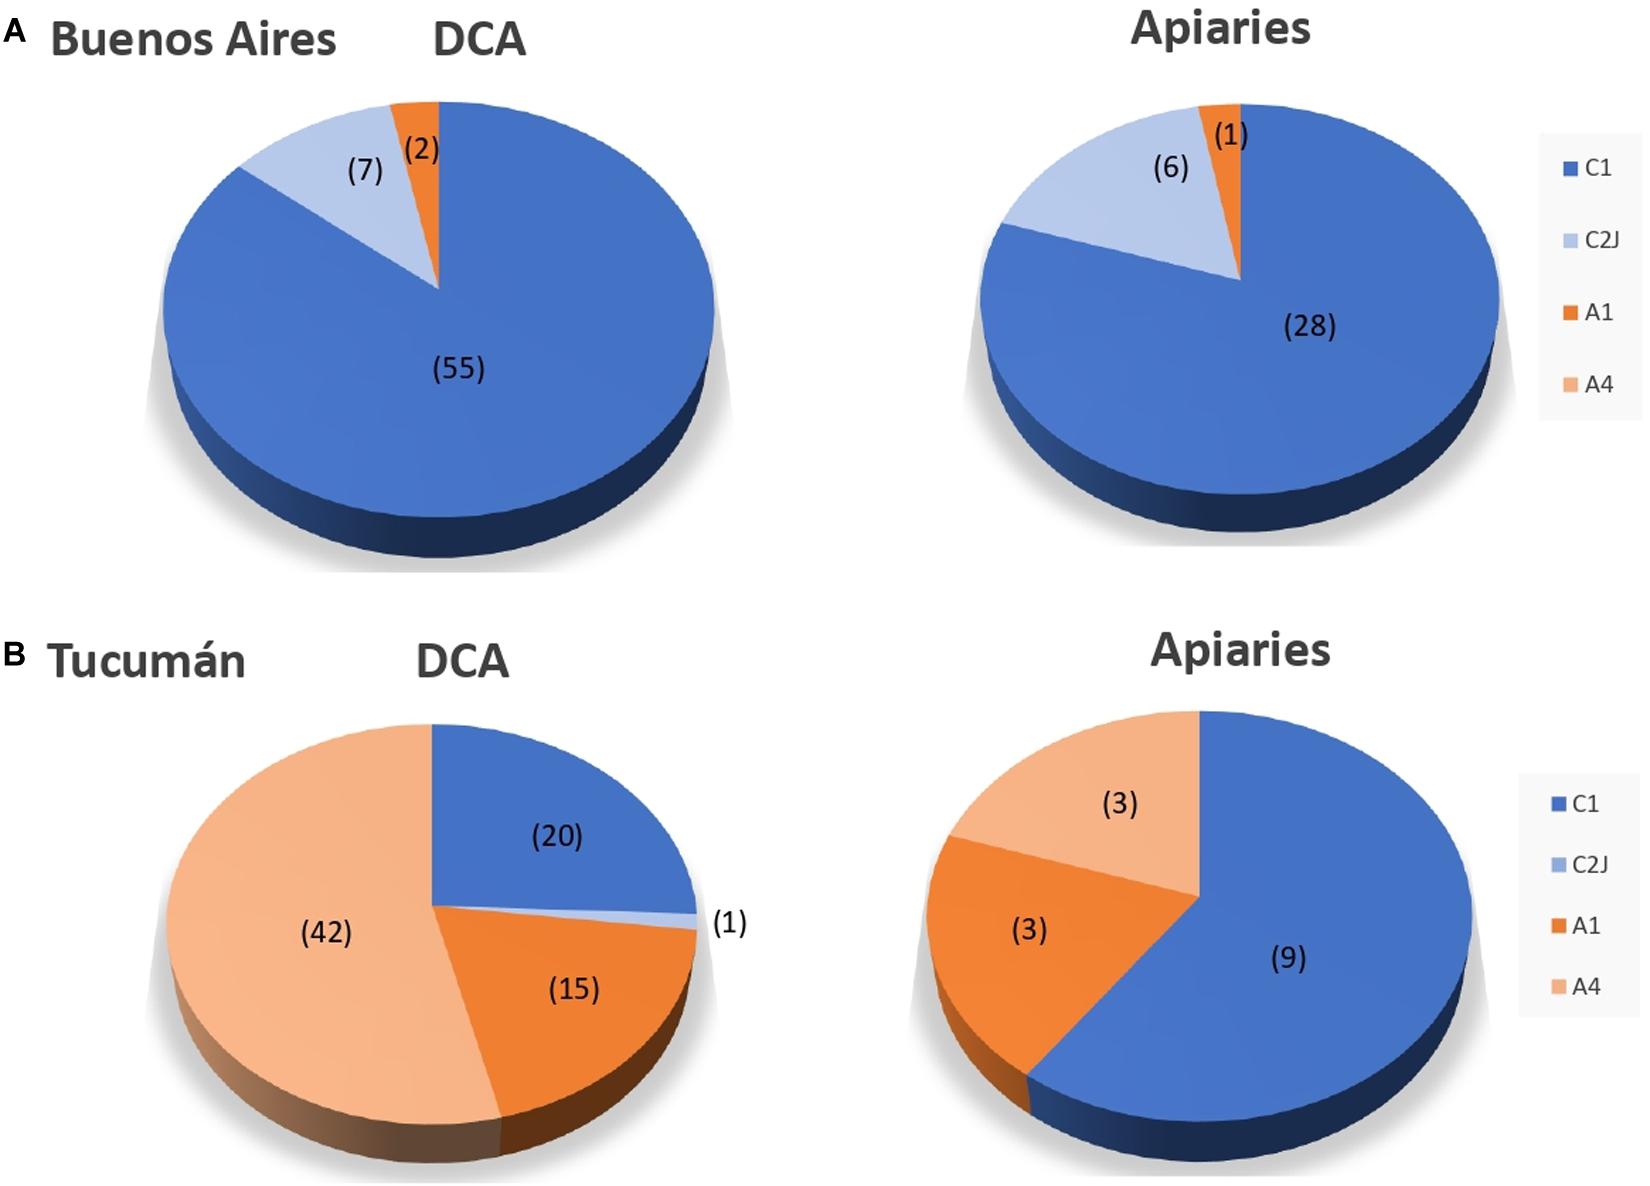
Figure 6. Percentage of mitochondrial lineages of drones at the Drone Congregation Areas and workers at the nearest apiaries for (A) Buenos Aires and (B) Tucumán provinces. African-derived (A1, A4) and European-derived mitochondrial lineages (C1, C2j) are shown in orange and blue, respectively. Number of analyzed bees are shown between brackets.
When distribution of haplotypes was analyzed within each region (BA or TU), a similar pattern was detected among the three localities from BA (Additional File S2). Conversely, the distribution of haplotypes was dissimilar among localities of Tucumán (Additional File S3). Specifically, DCAs near to non-commercial apiaries (Manantial and Horco Molle) presented a high representation of African haplotypes (85 and 100%, respectively), while the DCA near to a commercial apiary (Timbó) only exhibited 18.2% of A haplotypes (Additional File S3). The frequencies of haplotypes A were different between the two types of DCAs (Timbó vs. Manantial: χ2 = 23.9, P < 0.001; Timbó vs. Horco Molle: χ2 = 37.5, P < 0.001; Horco Molle vs. Manantial: χ2 = 3.7, P > 0.05). Finally, no significant correlation was detected between the percentage of Varroa and the percentage of A haplotypes in DCAs or apiaries.
In this study, we presented an integral description of main characteristics of the landscape, topography, climate, Varroa infestation status, and genetic variability of the Drone Congregation Areas and identified environmental variables associated to mite infestation in two eco-climatic regions from Argentina.
Environmental characteristics of the DCAs within a 400 m-radius buffer in the subtropical (TU) and temperate (BA) regions in Argentina were highly variable. With respect to landscape, DCAs were surrounded by all three types of matrices (i.e., natural vegetation, arable lands, and urban), and the presence and contiguity of natural vegetation was the main difference between ecoregions. In relation to topography, DCAs were located at elevations as low as 8 m.a.s.l. and up to 688 m.a.s.l. Topographic characteristics were more distinct among ecoregions than landscape characteristics describing DCAs and included elevation variability (higher in TU) and aspect in the north-south direction (northern aspect in BA). Lastly, DCAs occurred under highly variable climatic conditions, from windy (5.73 km/h) and cooler (18°C) locations in BA, to less windy (1.3 km/h) and warmer (22.3°C) locations in TU. DCAs in both ecoregions were better differentiated by climatic conditions than by topography and landscape.
Most previous observations of DCA environmental descriptors have been conducted in the northern hemisphere (Europe: Baudry et al., 1998; Koeniger G. et al., 2005; Koeniger N. et al., 2005; Kraus et al., 2005; and Asia: Punchihewa et al., 1990; Wattanachaiyingcharoen et al., 2008), in South Africa (Muerrle et al., 2007; Jaffé et al., 2009; Yañez et al., 2012), and in Australia (Arundel et al., 2013). Similarly to previous evidence, DCAs in our South American sites were located in vegetation clearings, where contrasting vertical relieves, such as a forest-pasture boundary, lines of trees, or buildings seemed to be important landmarks (Ruttner, 1966; Strang, 1970; Loper et al., 1992; Quezada-Euan and Jesus May-Itza, 2006; Muerrle et al., 2007). Other similarities with previous works are that DCAs in our sites were variable in terms of topography (Koeniger and Koeniger, 2000) but located in slopes < 20% (Galindo-Cardona et al., 2012), and they were variable in terms of climatic conditions (Strang, 1970). On the other hand, our sites in Argentina showed some differences with previous studies. First, it has been shown that urban land cover of less than 10% improved DCA occurrence in the subtropical Puerto Rico (Galindo-Cardona et al., 2012), while some of our DCAs, including temperate and subtropical sites, were surrounded by more than 50% urban cover. Thus, the role of urban cover in the formation of DCAs needs to be further explored. In addition, DCAs in Puerto Rico had slope orientations (i.e., aspect) more concentrated toward the South than locations where no DCAs were encountered, and this pattern was proposed to be a response to wind direction, sunlight, and magnetism (Galindo-Cardona et al., 2012). Our data showed that half of the DCAs (i.e., those in BA) had a northern aspect. This may be related to protection from wind currents, which occur from the southeast in this region of Argentina. This implies that wind direction may be an environmental character to address when describing DCAs in other regions of the world. In contrast, solar radiation, as a surrogate of sunlight, was not a main environmental variable differentiating DCAs among ecoregions in our study. Further assessments need to incorporate environmental characteristics of non-DCAs vs. DCAs in order to build statistical models for DCAs prediction.
Extremely low levels of Varroa infestation were detected in the present study, with no significant differences between apiaries and DCAs. However, a trend toward higher loads in DCAs suggests that a preference of the mite for drones in comparison to workers may be operating as previously suggested for immature stages (Boot et al., 1995). A similar pattern has been observed for the loads of Deformed Wing Virus of drones in South Africa, where drones demonstrated to be able to reach DCAs in spite of the infection (Yañez et al., 2012). Even though the mite loads were not significantly different between ecoregions in Argentina, the maximum values of Varroa infestation were reached in the subtropical TU. This apparent difference would be in line with the current beekeeping practices applied in the country (Giacobino et al., 2016), where acaricide applications are more frequent in the temperate BA due to the susceptibility of honey bee populations of European origin to the mite infestation. In TU, as in the rest of the northern region of Argentina, the control of Varroa is scarce due to low density of hives, limited economic resources for apiculture, and high prevalence of Africanized honey bees. Giacobino et al. (2017) found that the environment, measured using climate and landscape variables, was more important than management as a driver of V. destructor infestation in the territory in autumn. In our study, no statistical differences among ecoregions were detected in spring, suggesting that seasonal differences on the relative weights of Varroa drivers may exist. It is worth characterizing the Varroa loads in summer, where the mite’s populations increase in colonies and hence probably at the DCAs. The low levels of infestation detected in spring could be preventing the detection of differences between apiaries and DCA and also between ecoregions. Further characterization of Varroa levels at both apiaries and DCAs for all three seasons of bee activity (i.e., spring, summer, autumn) would shed light on the general dynamics of parasitization since a great variation occurs between years (Harris et al., 2003).
No correlation between Varroa infestation at the apiaries and at the DCAs was observed, but Varroa infestation at the DCAs was positively correlated to the distance to the closest managed apiary. Given that drones prefer closer than farther DCAs (Koeniger N. et al., 2005), we speculate that those DCAs that were located at higher distances from the closest managed apiary received a relatively higher proportion of mite-infested drones from feral colonies. In this sense, both the application of acaricides in the apiaries and the input of feral colonies to DCAs would have an effect in the mite infestation level at these sites, independently of the ecoregion. Taking into account our results, we suggest that the assessment of mite infestation (or other pathogens) in DCAs could be a diagnostic measure of the health of honey bees (both managed and feral) in a particular area. This measure would improve Varroa monitoring strategies by reducing the time and economic costs of evaluating colonies of all the apiaries of a particular area. In relation to other environmental drivers of parasitism, such as climate, additional research is needed to confirm associations, given the low infestation rates detected in our study.
Here, we provided a first description of the genetic variability found in DCAs and their surroundings apiaries from Argentina by identifying the mytotype origin of drones and workers honey bees. We detected the presence of both Africanized and European mitochondrial lineages but at different relative frequencies between the two analyzed regions. According to the previous results obtained by Abrahamovich et al. (2007), we found a high frequency of European haplotypes in the apiaries from the temperate region. This is not surprising as Argentinian beekeepers have imported queens from Europe since the beginning of beekeeping activities in the country. Moreover, in order to conserve the high productivity and gentle character of these bees, local beekeepers have selected these populations based on the yellowish colour of the abdomen of the Italian queens (Abrahamovich et al., 2007). As we expected, African haplotypes were detected at higher frequencies in apiaries from the subtropical region compared to the temperate region. These results are in line with pioneer studies from Sheppard et al. (1991) and Whitfield et al. (2006) and more recent work from Agra et al. (2018), who found a latitudinal cline from north to south for the level of hybridization between Africanized and European honey bees. In addition, these results agree with those from Diniz et al. (2003) for honey bee populations from southern Brazil and Uruguay.
The pattern of haplotypic distribution found between regions for workers (apiaries) was consistently similar for drones (DCAs). However, the DCAs appeared to be more diverse in terms of the quantity and frequencies of the detected haplotypes. These results agree with previous works in which DCAs concentrate drones from several apiaries and feral colonies (Baudry et al., 1998; Collet et al., 2009). Related to the comparisons between DCA and apiaries, we observed a similar pattern of genetic diversity for the temperate region, where the beekeeping is intensive and principally based on European-derived honey bees. Conversely, in the subtropical region, a different pattern of haplotypic frequencies was detected between DCAs and apiaries, with DCAs showing a high frequency of African haplotypes and apiaries showing a higher representation of European haplotypes. These results may suggest that in the subtropical region, despite the beekeepers also using European honey bee stocks in their apiaries, a great contribution of African haplotypes (probably from feral colonies or swarms) to DCAs occurs. In addition, a high natural queen turnover at commercial apiaries occurs in this region. These results probably reflect that DCAs of northern regions of Argentina are more dynamic systems and maintain high genetic diversity compared to southern DCAs, in line with what Jaffé et al. (2009) previously described for African (A. mellifera scutellata) DCAs. These authors found a high turnover of wild colonies that resulted in a temporal genetic differentiation and an effective population size of the DCA. In our case, when non-commercial apiaries (Manantial, Horco Molle) from the subtropical region were analyzed, this pattern was particularly evident. Moreover, this result is in line with previous findings by Mortensen and Ellis (2016) who found that DCAs distant to managed European honey bee apiaries had significantly more African matriline drones than did DCAs located close to managed European honey bee apiaries.
Our results are also consistent with observations made by Collet et al. (2009), who assessed the genetic structure of DCAs and commercial European-derived and Africanized apiaries in southern Brazil. These authors, by employing microsatellite loci, found high genetic similarity between colonies of commercial apiaries and DCAs formed nearby, and differences in genetic structure of Africanized DCAs when compared to the European. It is worth to mention that in our study European drones in DCAs near the apiary of Manantial (TU) were under-represented, while all colonies were of European origin. If drones actually chose the nearest DCA (Koeniger N. et al., 2005), our results could evidence (i) a differential drone contribution of European and Africanized colonies to DCAs (as was observed in Collet et al., 2009), probably with the former drones being displaced by Africanized ones or (ii) colonies from commercial apiaries are underrepresented in the nearest DCAs because of a high density of non-commercial colonies in the area. Given the mentioned trend toward higher Varroa loads in DCAs vs. apiaries, specifically in the subtropical region, further studies need to determine if the relatively higher Varroa parasitism detected at DCA represents an indirect evidence of the tolerance to the mite in these Africanized populations. Understanding these mechanisms will add light into current debate about the vulnerability of honey bee races to different diseases.
Previous evidence (e.g., Collet et al., 2009; Mortensen and Ellis, 2016) jointly with our present results suggest that the proportion of drones of a particular genetic origin in DCAs can be influenced by drone flooding. This technique could have a strong influence in selective breeding programs aimed at influencing mating to partially control the paternal contribution in breeding populations of honey bees. In fact, Guzman-Novoa and Page (1999) conducted a long-term selective breeding program in an open honey bee population of more than 3,000 European-derived colonies located in an Africanized area in Mexico, and found that Africanization was diluted within interference from instrumental insemination. Studying these areas where European-derived and Africanized colonies coexist represents an opportunity for checking how these honey bee populations cooperate in forming a DCA, the dynamics of these sites, and the actions that must be considered for specific breeding strategies.
Our results provide valuable information on the dynamics of Varroa parasitism in apiaries and DCAs, and highlight the role of drones in mite dispersion and genetic diversity of new colonies. We demonstrated that distance to the closest apiaries, relative humidity, and precipitation the previous week need to be taken into account when examining Varroa infestation at the DCAs. Further studies need to incorporate DCAs and non-DCAs’ environmental characteristics in order to model DCA occurrence and Varroa loads with more accuracy. Our study also provides a new step toward the study of the genetic variability of DCAs in the Southern hemisphere where European and African-derived honey bee populations coexist. The study of DCAs in general emerges as a tool for investigating not only honey bee reproduction and breeding, but also the impact of the environment on bee epidemiology.
The raw data supporting the conclusions of this article will be made available by the authors, without undue reservation.
AG-C, AS, and AM-G: methodology and analysis, conceptualization, validation and visualization, resources and project administration, supervision and writing—original draft preparation. AG-C, AS, RR, KE, MG, NL, MA, IM, ML, LL, TG, and AM-G: investigation and writing—review and editing. AS and AM-G: software and data curation. All authors have read and agreed to the published version of the manuscript.
This study was partially supported by grants from the National Scientific and Technical Research Council of Argentina (CONICET) through the project PIP 2015-517CO to AG-C and AS, and from The National Agency for the Promotion of Science and Technology (ANPCyT) through the project PICT 2016-0221 to AS. This publication was supported by National Science Foundation (NSF) Grant HRD 1736019 (to TG).
The authors declare that the research was conducted in the absence of any commercial or financial relationships that could be construed as a potential conflict of interest.
We thank the beekeepers Carolina del Aro, Nelson Lizárraga, Mario Gallo, Verónica Albarracín in Tucumán, and Luciano Landi, Bruno and Willie Scally in Buenos Aires, for their assistance in managing the colonies and help in the field and with Varroa estimations. Javier Foguet (IER) assisted with image classifications and Lucía Zarbá (IER) provided the ecoregions’ map. We thank two reviewers for their valuable contributions.
The Supplementary Material for this article can be found online at: https://www.frontiersin.org/articles/10.3389/fevo.2020.590345/full#supplementary-material
Supplementary Figure 1 | Percentage of mitochondrial lineages of drones at the Drone Congregation Areas and workers at the nearest apiaries for the sites at Buenos Aires. African-derived (A1, A4) and European-derived lineages (C1, C2j) are shown in orange and blue, respectively. Numbers of analyzed bees are shown between brackets.
Supplementary Figure 2 | Percentage of mitochondrial lineages of drones at the Drone Congregation Areas and workers at the nearest apiaries for the sites at Tucumán. African-derived (A1, A4) and European-derived lineages (C1, C2j) are shown in orange and blue, respectively. Numbers of analyzed bees are shown between brackets.
Abrahamovich, A. H., Atela, O., De la Rúa, P., and Galián, J. (2007). Assessment of the mitochondrial origin of honey bees from Argentina. J. Apic. Res. 46, 191–194. doi: 10.1080/00218839.2007.11101391
Abrol D. P. (ed.). (2012). “The problem of diseases in bees,” in Pollination Biology, (Dordrecht: Springer), 603–633. doi: 10.1007/978-94-007-1942-2_18
Agra, M. N., Conte, C. A., Corva, P. M., Cladera, J. L., Lanzavecchia, S. B., and Palacio, M. A. (2018). Molecular characterization of Apis mellifera colonies from Argentina: genotypic admixture associated with ecoclimatic regions and apicultural activities. Entomol. Exp. Appl. 166, 724–738. doi: 10.1111/eea.12719
Arundel, J., Oldroyd, B. P., and Winter, S. (2013). Modelling estimates of honey bee (Apis spp.) colony density from drones. Ecol. Modell. 267, 1–10. doi: 10.1016/j.ecolmodel.2013.07.008
Aubert, M., Ball, B., Fries, I., Moritz, R., Milani, N., and Bernardinelli, I. (2008). Virology and the Honey Bee. Luxembourg: Publications Office of the European Union, 462. Available online at: http://www.eurosfaire.prd.fr/7pc/doc/1262083725_virology_and_the_honey_bee.pdf
Baruffi, L., Damiani, G., Guglielmino, C. R., Bandi, C., Malacrida, A. R., and Gasperi, G. (1995). Polymorphism within and between populations of Ceratitis capitata: comparison between RAPD and multilocus enzyme electrophoresis data. Heredity 74, 425–437. doi: 10.1038/hdy.1995.60
Baudry, E., Solignac, M., Garnery, L., Gries, M., Cornuet, J. M., and Koeniger, N. (1998). Relatedness among honeybees (Apis mellifera) of a drone congregation. Proc. R. Soc. B Biol. Sci. 265, 2009–2014. doi: 10.1098/rspb.1998.0533
Boot, W. J., Schoenmaker, J., Calis, J. N. M., and Beetsma, J. (1995). Invasion of Varroa jacobsoni into drone brood cells of the honey bee, Apis mellifera. Apidologie 26, 109–118. doi: 10.1051/apido:19950204
Bordier, C., Pioz, M., Crauser, D., Le Conte, Y., and Alaux, C. (2017). Should I stay or should I go: honeybee drifting behaviour as a function of parasitism. Apidologie 48, 286–297. doi: 10.1007/s13592-016-0475-1
Büchler, R., Costa, C., Hatjina, F., Andonov, S., Meixner, M. D., Le Conte, Y., et al. (2014). The influence of genetic origin and its interaction with environmental effects on the survival of Apis mellifera L. Colonies in Europe. J. Apic. Res. 53, 205–214. doi: 10.3896/IBRA.1.53.2.03
Cabrera, A. L., and Willink, A. (1980). Biogeografía de América Latina. Zaragoza: Sociedad Entomológica Aragonesa.
Chemurot, M., Akol, A. M., Masembe, C., de Smet, L., Descamps, T., and de Graaf, D. C. (2016). Factors influencing the prevalence and infestation levels of Varroa destructor in honeybee colonies in two highland agro-ecological zones of Uganda. Exp. Appl. Acarol. 68, 497–508. doi: 10.1007/s10493-016-0013-x
Collet, T., Cristino, A. S., Quiroga, C. F. P., Soares, A. E. E., and Del Lama, M. A. (2009). Genetic structure of drone congregation areas of Africanized honeybees in southern Brazil. Genet. Mol. Biol. 32, 857–863. doi: 10.1590/s1415-47572009005000083
Correia-Oliveira, M. E., Mercês, C. D. C., Mendes, R. B., Neves, V. S. L., Silva, F. L., and Carvalho, C. A. L. (2018). Can the environment influence varroosis infestation in Africanized honey bees in a neotropical region? Fla. Entomol. 101, 464–469. doi: 10.1653/024.101.0304
De Jong, D., De Jong, P. H., and Gonçalves, L. S. (1982). Weight loss and other damage to developing worker honeybees from infestation with Varroa jacobsoni. J. Apic. Res. 21, 165–167. doi: 10.1080/00218839.1982.11100535
Dietemann, V., Nazzi, F., Martin, S. J., Anderson, D. L., Locke, B., Delaplane, K. S., et al. (2013). Standard methods for Varroa research. J. Apic. Res. 52, 1–54. doi: 10.1007/978-3-319-23534-9_1
Diniz, N. M., Soares, A. E. E., Sheppard, W. S., and Del Lama, M. A. (2003). Genetic structure of honeybee populations from southern Brazil and Uruguay. Genet. Mol. Biol. 26, 47–52. doi: 10.1590/S1415-47572003000100008
Duranville, C., Miniggio, C., Arnold, G., and Borneck, R. (1991). Dérive des butineuses et réinfestation des colonies d’abeilles par Varroa jacobsoni. La Santé L’abeille 125, 228–235.
Ferrari, C. A., Currao, H. R., and Bessone, J. F. (2011). La Apicultura Argentina y sus Regiones. Una Visioìn Panoraìmica, 1st Edn, eds R. Otero and J. A. Collía (Buenos Aires: Consejo Federal de Inversiones).
Forfert, N., Natsopolou, M. E., Frey, E., Rosenkranz, P., Paxton, R. J., and Moritz, R. F. A. (2015). Parasites and pathogens of the honeybee (Apis mellifera) and their influence on inter-colonial transmission. PLoS One 10:e0140337. doi: 10.1371/journal.pone.0140337
Francis, R. M., Nielsen, S. L., and Kryger, P. (2013). Varroa-virus interaction in collapsing honey bee colonies. PLoS One 8:e57540. doi: 10.1371/journal.pone.0057540
Free, J. B. (1958). The drifting of honey-bees. J. Agric. Sci. 51, 294–306. doi: 10.1017/S0021859600035103
Gąbka, J. (2018). Drifting of honey bee queens returning from flights. J. Apic. Res. 57, 580–585. doi: 10.1080/00218839.2018.1492502
Galindo-Cardona, A., Monmany, A. C., Moreno-Jackson, R., Huertas-Dones, C., Caicedo-Quiroga, L., and Giray, T. (2012). Landscape analysis of drone congregation areas of the honey bee, Apis mellifera. J. Insect Sci. 12:122.
Galindo-Cardona, A., Quiroga, O. B., Bianchi, E., and Ayup, M. M. (2017). Primer reporte de un área de congregación de zánganos de Apis mellifera (Hymenoptera: Apidae) de Argentina. Rev. Soc. Entomol. Argent. 76, 50–53. doi: 10.25085/rsea.761207
Gasparri, N. I., and Grau, H. R. (2009). Deforestation and fragmentation of Chaco dry forest in NW Argentina (1972-2007). For. Ecol. Manage. 258, 913–921. doi: 10.1016/j.foreco.2009.02.024
Geographic Information System [QGIS] (2018). QGIS Dev. Team. Available online at: https://www.qgis.org/en/site/ (accessed September 20, 2008).
Giacobino, A., Molineri, A. I., Pacini, A., Fondevila, N., Pietronave, H., Rodríguez, G., et al. (2016). Varroa destructor and viruses association in honey bee colonies under different climatic conditions. Environ. Microbiol. Rep. 8, 407–412. doi: 10.1111/1758-2229.12410
Giacobino, A., Pacini, A., Molineri, A., Bulacio Cagnolo, N., Merke, J., Orellano, E., et al. (2017). Environment or beekeeping management: what explains better the prevalence of honey bee colonies with high levels of Varroa destructor? Res. Vet. Sci. 112, 1–6. doi: 10.1016/j.rvsc.2017.01.001
Gorelick, N., Hancher, M., Dixon, M., Ilyushchenko, S., Thau, D., and Moore, R. (2017). Google earth engine: planetary-scale geospatial analysis for everyone. Remote Sens. Environ. 202, 18–27. doi: 10.1016/j.rse.2017.06.031
Guzmán-Novoa, E., Eccles, L., Calvete, Y., McGowan, J., Kelly, P. G., and Correa-Benítez, A. (2010). Varroa destructor is the main culprit for the death and reduced populations of overwintered honey bee (Apis mellifera) colonies in Ontario, Canada. Apidologie 41, 443–450. doi: 10.1051/apido/2009076
Guzman-Novoa, E., and Page, R. E. Jr. (1999). Selective breeding of honey bees (Hymenoptera: Apidae) in Africanized areas. J. Econ. Entomol. 92, 521–525. doi: 10.1093/jee/92.3.521
Guzmán-Novoa, E., Vandame, R., and Arechavaleta, M. E. (1999). Susceptibility of European and Africanized honey bees (Apis mellifera L.) to Varroa jacobsoni Oud. in Mexico. Apidologie 30, 173–182. doi: 10.1051/apido:19990207
Hall, H. G., and Smith, D. R. (1991). Distinguishing African and European honeybee matrilines using amplified mitochondrial DNA. Proc. Natl. Acad. Sci. U.S.A. 88, 4548–4552. doi: 10.1073/pnas.88.10.4548
Harris, J. W., Harbo, J. R., Villa, J. D., and Danka, R. G. (2003). Variable population growth of Varroa destructor (Mesostigmata: Varroidae) in colonies of honey bees (Hymenoptera: Apidae) during a 10-year period. Environ. Entomol. 32, 1305–1312. doi: 10.1603/0046-225x-32.6.1305
Hou, C. S., Li, B. B., Deng, S., and Diao, Q. Y. (2016). Effects of Varroa destructor on temperature and humidity conditions and expression of energy metabolism genes in infested honeybee colonies. Genet. Mol. Res. 15:gmr8997. doi: 10.4238/gmr.15038997
Invernizzi, C., Zefferino, I., Santos, E., Sánchez, L., and Mendoza, Y. (2015). Evaluación a varios niveles del comportamiento de limpieza contra Varroa destructor en abejas de la miel africanizadas e italianas. J. Apic. Res. 54, 321–327. doi: 10.1080/00218839.2016.1159055
Jaffé, R., Dietemann, V., Crewe, R. M., and Moritz, R. F. A. (2009). Temporal variation in the genetic structure of a drone congregation area: an insight into the population dynamics of wild African honeybees (Apis mellifera scutellata). Mol. Ecol. 18, 1511–1522. doi: 10.1111/j.1365-294X.2009.04143.x
Jarvis, A., Reuter, H. I., Nelson, A., and Guevara, E. (2007). Hole-filled seamless SRTM data (V3 ed.). International Centre for Tropical Agriculture (CIAT), 9. Available online: http://srtm.csi.cgiar.org
Koeniger, G., Koeniger, N., Tingek, S., and Phiancharoen, M. (2005). Variance in spermatozoa number among Apis dorsata drones and among Apis mellifera drones. Apidologie 36, 279–284. doi: 10.1051/apido:2005009
Koeniger, N., and Koeniger, G. (2000). Reproductive isolation among species of the genus Apis. Apidologie 31, 313–339. doi: 10.1051/apido:2000125
Koeniger, N., Koeniger, G., and Pechhacker, H. (2005). The nearer the better? Drones (Apis mellifera) prefer nearer drone congregation areas. Insectes Soc. 52, 31–35. doi: 10.1007/s00040-004-0763-z
Kralj, J., and Fuchs, S. (2006). Parasitic Varroa destructor mites influence flight duration and homing ability of infested Apis mellifera foragers. Apidologie 37, 577–587.
Kralj, J., and Fuchs, S. (2010). Nosema sp. influences flight behavior of infected honey bee (Apis mellifera) foragers. Apidologie 41, 21–28. doi: 10.1051/apido/2009046
Kraus, F. B., Koeniger, N., Tingek, S., and Moritz, R. F. A. (2005). Temporal genetic structure of a drone congregation area of the giant Asian honeybee (Apis dorsata). Naturwissenschaften 92, 578–581. doi: 10.1007/s00114-005-0044-3
Kuchling, S., Kopacka, I., Kalcher-Sommersguter, E., Schwarz, M., Crailsheim, K., and Brodschneider, R. (2018). Investigating the role of landscape composition on honey bee colony winter mortality: a long-term analysis. Sci. Rep. 8:12263. doi: 10.1038/s41598-018-30891-y
Le Conte, Y., Ellis, M., and Ritter, W. (2010). Varroa mites and honey bee health: can Varroa explain part of the colony losses? Apidologie 41, 353–363.
Lobo Segura, J. A. (2000). Highly polymorphic DNA markers in an Africanized honey bee population in Costa Rica. Genet. Mol. Biol. 23, 317–322. doi: 10.1590/s1415-47572000000200013
Loper, G. M., Wolf, W. W., and Taylor, O. R. (1992). Honey bee drone flyaways and congregation areas: radar observations. J. Kans. Entomol. Soc. 65, 223–230.
Maggi, M., Antúnez, K., Invernizzi, C., Aldea, P., Vargas, M., Negri, P., et al. (2016). Honeybee health in South America. Apidologie 47, 835–854.
Martin, S. J., and Medina, L. M. (2004). Africanized honeybees have unique tolerance to Varroa mites. Trends Parasitol. 20, 112–114. doi: 10.1016/j.pt.2003.12.005
McCune, B., and Mefford, M. J. (1999). PC-ORD. Multivariate Analysis of Ecological Data. Version 5.0. Gleneden Beach, OR: MjM Software.
Meixner, M. D., Kryger, P., and Costa, C. (2015). Effects of genotype, environment, and their interactions on honey bee health in Europe. Curr. Opin. Insect Sci. 10, 177–184. doi: 10.1016/j.cois.2015.05.010
Merke, J. (2016). Dinámica Poblacional de Varroa destructor y Apis mellifera L. Como Herramienta Para la Selección de Abejas Tolerantes. Ph.D. dissertation, National University of Mar del Plata, Mar del Plata.
Molineri, A., Giacobino, A., Pacini, A., Bulacio Cagnolo, N., Merke, J., Orellano, E., et al. (2018). Environment and Varroa destructor management as determinant of colony losses in apiaries under temperate and subtropical climate. J. Apic. Res. 57, 551–564. doi: 10.1080/00218839.2018.1475697
Mondragón, L., Spivak, M., and Vandame, R. (2005). A multifactorial study of the resistance of honeybees Apis mellifera to the mite Varroa destructor over one year in Mexico. Apidologie 36, 345–358. doi: 10.1051/apido:2005022
Morello, J., Matteucci, S. D., Rodriguez, A., and Silva, M. (2018). Ecorregiones y Complejos Ecosistémicos Argentinos, 2nd Edn. Buenos Aires: Orientacioìn Graìfica Editora S.R.L.
Mortensen, A. N., and Ellis, J. D. (2016). Managed European-derived honey bee, Apis mellifera sspp, colonies reduce African-matriline honey bee, A. m. scutellata, drones at regional mating congregations. PLoS One 11:e0161331. doi: 10.1371/journal.pone.0161331
Mortensen, A. N., Jack, C. J., and Ellis, J. D. (2018). The discovery of Varroa destructor on drone honey bees, Apis mellifera, at drone congregation areas. Parasitol. Res. 117, 3337–3339. doi: 10.1007/s00436-018-6035-z
Mortensen, A. N., Schmehl, D. R., Allsopp, M., Bustamante, T., Kimmel, C. B., Dykes, M. E., et al. (2016). Differences in Varroa destructor infestation rates of two indigenous subspecies of Apis mellifera in the Republic of South Africa. Exp. Appl. Acarol. 68, 509–515. doi: 10.1007/s10493-015-9999-8
Muerrle, T. M., Hepburn, H. R., and Radloff, S. E. (2007). Experimental determination of drone congregation areas for Apis mellifera capensis esch. J. Apic. Res. 46, 154–159. doi: 10.1080/00218839.2007.11101387
Neumann, P., and Carreck, N. L. (2010). Honey bee colony losses. J. Apic. Res. 49, 1–6. doi: 10.3896/IBRA.1.49.1.01
Neumann, P., Moritz, R. F. A., and Mautz, D. (2000). Colony evaluation is not affected by drifting of drone and worker honeybees (Apis mellifera L.) at a performance testing apiary. Apidologie 31, 67–79. doi: 10.1051/apido:2000107
Neumann, P., Radloff, S. E., Pirk, C. W. W., and Hepburn, R. (2003). The behaviour of drifted Cape honeybee workers (Apis mellifera capensis): predisposition for social parasitism? Apidologie 34, 585–590. doi: 10.1051/apido:2003048
Nolan, M. P., and Delaplane, K. S. (2017). Distance between honey bee Apis mellifera colonies regulates populations of Varroa destructor at a landscape scale. Apidologie 48, 8–16. doi: 10.1007/s13592-016-0443-9
Olson, D. M., Dinerstein, E., Wikramanayake, E. D., Burgess, N. D., Powell, G. V. N., Underwood, E. C., et al. (2001). Terrestrial ecoregions of the world: a new map of life on earth: a new global map of terrestrial ecoregions provides an innovative tool for conserving biodiversity. BioScience 51, 933–938. doi: 10.1641/0006-3568(2001)051[0933:TEOTWA]2.0.CO;2
Oyarzabal, M., Clavijo, J., Oakley, L., Biganzoli, F., Tognetti, P., Barberis, I., et al. (2018). Unidades de vegetación de la Argentina. Ecol. Austral 28, 1–156. doi: 10.25260/EA.18.28.1.0.399
Paar, J., Oldroyd, B. P., Huettinger, E., and Kastberger, G. (2002). Drifting of workers in nest aggregations of the giant honeybee Apis dorsata. Apidologie 33, 553–561. doi: 10.1051/apido
Pfeiffer, K. J., and Crailsheim, K. (1998). Drifting of honeybees. Insectes Soc. 45, 151–167. doi: 10.1007/s000400050076
Punchihewa, R. W. K., Koeniger, N., and Koeniger, G. (1990). Congregation of Apis cerana indica Fabricius 1798 drones in the canopy of trees in Sri Lanka. Apidologie 21, 201–208. doi: 10.1051/apido:19900305
Quezada-Euan, J. J. G., and Jesus May-Itza, W. D. (2006). Partial seasonal isolation of African and European-derived Apis mellifera (Hymenoptera: Apidae) drones at congregation areas from subtropical Mexico. Ann. Entomol. Soc. Am. 94, 540–544. doi: 10.1603/0013-8746(2001)094[0540:psioaa]2.0.co;2
Quinn, G. P., and Keough, M. J. (2002). Experimental Design and Data Analysis for Biologists, 1st Edn. New York, NY: Cambridge University Press.
R Core Team (2017). R: A Language and Environment for Statistical Computing. Vienna: R Foundation for Statistical Computing.
Rivera-Marchand, B., Oskay, D., and Giray, T. (2012). Gentle Africanized bees on an oceanic island. Evol. Appl. 5, 746–756. doi: 10.1111/j.1752-4571.2012.00252.x
Rosenkranz, P. (1999). Honey bee (Apis mellifera L.) tolerance to Varroa jacobsoni Oud. in South America. Apidologie 30, 159–172. doi: 10.1051/apido:19990206
Ruttner, F. (1966). The life and flight activity of drones. Bee World 47, 93–100. doi: 10.1080/0005772X.1966.11097111
Sheppard, W. S., Rinderer, T. E., Mazzoli, J. A., Stelzer, J. A., and Shimanuki, H. (1991). Gene flow between African-and European-derived honey bee populations in Argentina. Nature 349, 782–784. doi: 10.1038/349782a0
Southwick, E. E., and Buchmann, S. (1995). Effects of horizon landmarks on homing success in honey bees. Am. Nat. 146, 748–764. doi: 10.1086/285823
Strang, G. E. (1970). A study of honey bee drone attraction in the mating response. J. Econ. Entomol. 63, 641–645. doi: 10.1093/jee/63.2.641
Wattanachaiyingcharoen, W., Wongsiri, S., Oldroyd, B. P., Wattanachaiyingcharoen, W., Wongsiri, S., and Oldroyd, B. P. (2008). Aggregations of unrelated Apis florea colonies. Apidologie 39, 531–536.
Whitfield, C. W., Behura, S. K., Berlocher, S. H., Clark, A. G., Johnston, J. S., Sheppard, W. S., et al. (2006). Thrice out of Africa: ancient and recent expansions of the honey bee, Apis mellifera. Science 314, 642–645. doi: 10.1126/science.1132772
Yañez, O., Jaffé, R., Jarosch, A., Fries, I., Robin, F. A. M., Robert, J. P., et al. (2012). Deformed wing virus and drone mating flights in the honey bee (Apis mellifera): implications for sexual transmission of a major honey bee virus. Apidologie 43, 17–30. doi: 10.1007/s13592-011-0088-7
Youngsteadt, E., Appler, R. H., López-Uribe, M. M., Tarpy, D. R., and Frank, S. D. (2015). Urbanization increases pathogen pressure on feral and managed honey bees. PLoS One 10:e0142031. doi: 10.1371/journal.pone.0142031
Keywords: Argentina, DCA, eco-climatic regions, genetic variability, landscape metrics, mite parasitism
Citation: Galindo-Cardona A, Scannapieco AC, Russo R, Escalante K, Geria M, Lepori N, Ayup MM, Muntaabski I, Liendo MC, Landi L, Giray T and Monmany-Garzia AC (2020) Varroa destructor Parasitism and Genetic Variability at Honey Bee (Apis mellifera) Drone Congregation Areas and Their Associations With Environmental Variables in Argentina. Front. Ecol. Evol. 8:590345. doi: 10.3389/fevo.2020.590345
Received: 01 August 2020; Accepted: 19 October 2020;
Published: 09 November 2020.
Edited by:
Mingbo Yin, Fudan University, ChinaReviewed by:
Ernesto Guzman-Novoa, University of Guelph, CanadaCopyright © 2020 Galindo-Cardona, Scannapieco, Russo, Escalante, Geria, Lepori, Ayup, Muntaabski, Liendo, Landi, Giray and Monmany-Garzia. This is an open-access article distributed under the terms of the Creative Commons Attribution License (CC BY). The use, distribution or reproduction in other forums is permitted, provided the original author(s) and the copyright owner(s) are credited and that the original publication in this journal is cited, in accordance with accepted academic practice. No use, distribution or reproduction is permitted which does not comply with these terms.
*Correspondence: Alberto Galindo-Cardona, YWdhbGluZG9AdHVjdW1hbi1jb25pY2V0Lmdvdi5hcg==; Alejandra C. Scannapieco, YWxlamFuZHJhc2Nhbm5hcGllY29AZ21haWwuY29t; A. Carolina Monmany-Garzia, YWNtb25tYW55QGdtYWlsLmNvbQ==
†These authors have contributed equally to this work
Disclaimer: All claims expressed in this article are solely those of the authors and do not necessarily represent those of their affiliated organizations, or those of the publisher, the editors and the reviewers. Any product that may be evaluated in this article or claim that may be made by its manufacturer is not guaranteed or endorsed by the publisher.
Research integrity at Frontiers
Learn more about the work of our research integrity team to safeguard the quality of each article we publish.