 Jordana M. Meyer
 Kevin Leempoel1
 Gianalberto Losapio
 Elizabeth A. Hadly
- 1Department of Biology, Stanford University, Stanford, CA, United States
- 2Jasper Ridge Biological Preserve, Stanford University, Stanford, CA, United States
- 3Stanford Woods Institute for the Environment, Stanford University, Stanford, CA, United States
Global biodiversity is threatened by the anthropogenic restructuring of animal communities, rewiring species interaction networks in real-time as individuals are extirpated or introduced. Conservation science and adaptive ecosystem management demand more rapid, quantitative, and non-invasive technologies for robustly capturing changing biodiversity and quantifying species interactions. Here we develop molecular ecological network analyses (MENA) as an ecosystem assessment tool to address these needs. To construct the ecological network, we used environmental DNA from feces to identify the plant and mammal diet of two carnivores: puma (Puma concolor) and bobcat (Lynx rufus); two omnivores: coyote (Canis latrans) and gray fox (Urocyon cinereoargenteus); and two herbivores: black-tailed deer (Odocoileus hemionus) and black-tailed jackrabbit (Lepus californicus) in a well-studied Californian reserve. To evaluate MENA as a comprehensive biodiversity tool, we applied our framework to identify the structure of the network, patterns of trophic interactions, key species, and to assess its utility in capturing the biodiversity of the area. The high dietary taxonomic resolution enabled the assessment of species diversity, niche breadth and overlap. The network analysis revealed a dense ecological network with a high diversity of weakly connected species and a community that is highly modular and non-nested. The significant prevalence of tri-trophic chain and exploitative competition patterns indicates (i) the removal or reintroduction of a top predator would trigger a trophic cascade within this community, directly affecting their prey and indirectly the plant communities, and (ii) the potential impact of indirect effects between two predators that consume the same prey. These results suggest that the recent resurgence of puma in the study area may impact the herbaceous and woody vegetation and the population size of other predators. This effect of fluctuating predator populations and plant communities could be predicted through MENA’s fine-scale assessment of the diet selection and the identified keystone species. Although just using a subset of species, MENA more rapidly, accurately, and effectively captured the broader biodiversity of the area in comparison to other methodologies. MENA reconstructed and unveiled the hidden complexity in trophic structure and interaction networks within the community, providing a promising toolkit for biodiversity and ecosystem management.
Introduction
Anthropogenic impacts threaten global biodiversity, as species and their networks of interactions (ecological networks) are forced to adapt or be lost (Gonzalez et al., 2011; Dirzo et al., 2014; Munguía et al., 2016; Start et al., 2018). As a consequence of species loss and invasion, ecological networks, such as food webs and pollinator networks, are restructuring and species interactions are rewiring in real-time, fundamentally impacting whole ecosystems and their functions (Bartley et al., 2019; Daam et al., 2019). To comprehend these altered ecological networks, conservation biologists are increasingly focusing on extinction cascades caused by weakened or lost species interactions (Baiser et al., 2012; Valiente-Banuet et al., 2015; Losapio and Schöb, 2017) and are motivated to take a multitrophic perspective to address biodiversity and ecosystem functioning (Eisenhauer et al., 2019). However, we are in need of more rapid, non-invasive, and quantitative technologies for biodiversity assessments and monitoring for the implementation of adaptive management strategies.
Counting species (alpha diversity) rather than their interactions is often more tractable, however, it is not nearly as informative for understanding how ecosystems function (Jordan and Scheuring, 2004; McCann, 2007). Ecosystems are composed of thousands of species interactions (billions if including microbes) that directly or indirectly impact biological populations (Kéfi et al., 2016) and contribute to network robustness (Losapio and Schöb, 2017). Recent advances in network analysis enable the interpretation of large numbers of species interactions and assessment of the predictability of dynamic ecological systems (Dale and Fortin, 2010; Delmas et al., 2019). Yet, building robust ecological networks, particularly in response to perturbations and across communities that are comprised of different species, is challenging given the difficulty of observing trophic events and quantifying the strength of interactions between species. The advent of high-throughput sequencing (HTS) makes this kind of research remarkably more tractable (Roslin et al., 2019).
Innovations in HTS, and, more specifically, DNA metabarcoding, enable accurate and cost-effective biodiversity assessments at a level of taxonomic coverage and precision previously unavailable (Ji et al., 2013; Clare, 2014; Deiner et al., 2017; Pawlowski et al., 2018; Bush et al., 2019; Makiola et al., 2020). Recent studies have used metabarcoding techniques to investigate the feeding ecology of carnivores (Shehzad et al., 2012; Torre et al., 2013; Walsh, 2015; Xiong et al., 2017), herbivores (Soininen et al., 2009; Czernik et al., 2013; Kartzinel et al., 2015; Coverdale et al., 2016; Iwanowicz et al., 2016; Erickson et al., 2017; Pansu et al., 2019), and omnivores (De Barba et al., 2014; Robeson et al., 2018; for a review see Sousa et al., 2019). For example, Kartzinel et al. (2015) measured dietary niche partitioning among large herbivores and was able to address how generalist consumer species coexist on a limited range of resource types because metabarcoding allowed for unprecedented plant identification. While many of these studies targeted the diet of a single species or a trophic guild, few compared across mammal species and multiple trophic levels, a shortcoming that hinders our full knowledge of complex ecological processes (Eisenhauer et al., 2019). Multitrophic perspectives provide a better understanding of ecological and evolutionary processes than do typical pairwise interactions between trophic levels (Abdala-Roberts et al., 2019). Despite this, our knowledge of ecosystem function in multitrophic communities is limited to date (Eisenhauer et al., 2019).
Constructing multitrophic ecological networks using traditional methods is difficult and labor intensive, especially in poorly studied and highly diverse systems (Derocles et al., 2018). Non-invasively collected DNA from the environment (eDNA) [i.e., a complex mixture of genomic DNA from different organisms found in soil, water, or feces (Taberlet et al., 2018)] may help to construct complex ecological networks by rapidly detecting trophic interactions that would otherwise be impossible to observe, and to do so more quickly than traditional methods (Ruppert et al., 2019). Only recently has molecular network analysis been applied to the assessment of ecological systems. Metabarcoding studies in this context have focused on varying scales: the diet of European hake (Riccioni et al., 2018); coral reef fish (Casey et al., 2019); freshwater ecosystems (Compson et al., 2019); aquatic macroinvertebrates (Bush et al., 2019); and bat (Clare et al., 2019), forest (Evans et al., 2016), and herbivore (Kartzinel et al., 2015) communities. However, to the best of our knowledge (see Sousa et al., 2019 for a review), to date a metabarcoding study has yet to use fecal eDNA to reconstruct ecological networks and unravel trophic interactions among carnivores, omnivores, and herbivores within a terrestrial mammal community to inform biodiversity assessments.
Here we combine DNA metabarcoding and network-based approaches in a non-invasive molecular ecological network analyses (MENA) (Deng et al., 2012) and demonstrate its utility to assess biodiversity, trophic interactions, and structure within a mammalian community. We construct a food web by identifying the diets of mammals using HTS of eDNA from feces across three feeding guilds – two carnivores: puma (Puma concolor) and bobcat (Lynx rufus); two omnivores: coyote (Canis latrans) and gray fox (Urocyon cinereoargenteus); and two herbivores: black-tailed deer (Odocoileus hemionus) and black-tailed jackrabbit (Lepus californicus). To evaluate MENA as a comprehensive biodiversity assessment tool, we apply our framework to answer the following questions: (i) What is the structure of the network and who are key species? (ii) Are specific patterns of trophic interactions (i.e., trophic cascade, omnivory, and exploitative competition) occurring and prevailing within the community?; (iii) Does MENA provide an accurate portrait of biodiversity? We validate findings with long-term studies in the study area and discuss how these molecular and network metrics provide increasingly valuable information and a rapid bioassessment tool for conservation decision making.
Materials and Methods
Study Site and Feces Collection
Jasper Ridge Biological Preserve (JRBP) is a small (5 km2) protected area on the urban fringe of Silicon Valley, a highly urbanized region in California, United States. It is located in the eastern foothills of the Santa Cruz Mountains and surrounded by various land use types. JRBP has a Mediterranean-type climate, consisting of warm, dry summers and cool, wet winters, and averaging temperatures of 5–22°C across the year. The mean annual precipitation is 605 mm (Zavaleta and Kettley, 2006). JRBP has been an active site of research for over a century, protected as a preserve since 1973, and the fauna and flora of the preserve have been well-documented. Dominant vegetation types include grassland, woodland, chaparral, coastal scrub, marshes, and forests, with the most common vegetation type being oak (Perea et al., 2017).
A long-term camera-trapping effort (2009–2018) at JRBP elucidated dynamic shifts within the predator and herbivore populations, triggered when an apex predator, the puma, became resident after at least a decade of very low abundance (Leempoel et al., 2019). The (re)establishment of the puma coincides with a change in coyote behavior and abundance, which in turn, opened a niche for the smaller, omnivorous gray fox. JRBP thus provides an ideal opportunity to test the MENA tool in identifying biodiversity and patterns of trophic interactions, because the flora, fauna and dynamic shifts within this system are known.
Fecal samples (scats) from puma, coyote, bobcat, gray fox, black-tailed deer, and black-tailed jackrabbit were collected across all six habitat types in JRBP within 2-week survey windows [following (Murphy et al., 2007; Ruell et al., 2009)] in the dry season (October 26 – November 12, 2017) and wet season (April 4 – 17, 2018). Before the start of the survey, all scat was removed from the trails to ensure the age of the collected samples was all less than 2 days old. This kept freshness of the sample consistent and minimized fecal DNA degradation. Sampling transects were non-random and predator scat was collected along 34 paths (trails 17 km; roads 7 km) throughout JRBP (Supplementary Figure S1). Camera trapping demonstrates that predators use these pathways at a high frequency (Kohn et al., 1999; Leempoel et al., 2019). During collection, one-half of the scat sample was left in situ to ensure that the relevant inter- and intra-species scent cues were not disturbed. Scat samples were collected into a sterile bag, using gloves to avoid contamination, and GPS coordinates and metadata were recorded at the collection site. All samples were stored at −20°C until DNA extraction was performed. In total, + 175 km of trails were traversed through all dominate habitats over 12 collection days in each season (finding scat on 19 of the 24 traversing days).
A combination of morphological identification (i.e., size, shape, composition) and DNA sequencing (e.g., the mammal primer confirmed all predator identifications through the most abundant predator reads per sample) enabled us to determine the identity of species that deposited the scat. Multiple jackrabbit fecal samples were genotyped to confirm the identification of the collected samples, which are visually much larger, but similar in shape, to scats of the smaller brush rabbit (Sylvilagus bachmani).
Fecal DNA Extraction and Metabarcoding
We conducted all DNA extractions at Stanford University in a sterilized laminar airflow hood to avoid contamination. Before DNA extractions, fecal samples were thawed, homogenized, and processed (∼0.2 g) utilizing the Zymo Quick-DNA Fecal/Soil Microbe Miniprep Kit (Kartzinel et al., 2015). Samples were processed in small batches (∼14) with an extraction blank to monitor for potential cross-contamination in the laboratory. The eluted DNA was quantified using a Nanodrop 2000 (Thermo Fisher Scientific Inc.) and stored at −20°C until used for PCR.
We used DNA metabarcoding on the extracted DNA to characterize carnivore, omnivore, and herbivore diets, by quantifying large numbers of short, unique regions of DNA extracted from individual fecal samples (Pompanon et al., 2012). Two different primer pairs were used to amplify mammal and plant DNA. All primers were modified with the Illumina adaptor preceding the target primers and separated by 6-N spacers as designed by Ushio et al. (2017).
Mammals
We use the MiMammal-U metabarcoding primers for the 12S mtDNA gene targeting 210 bp amplicons because it can amplify and distinguish DNA from a diverse and wide range of mammals that are well represented in public databases (MiMammal-UF: GGGTTGGTAAATTTCGTGCCAGC and MiMammal-UR: CATAGTGGGGTATCTAATCCCAGTTTG) (Ushio et al., 2017). We compared our primer reference database to the list of known JRBP mammal species (46 species) and found that these primers identify 96% of the mammals present in JRBP to the genus and species level and 4% to the family level (Leempoel et al., 2020). The PCR comprised 20 μL: 10 μl of GoTaq® Colorless Master Mix, 1 μL of each primer (5 mM), 4 μL of DNA template, and 4 μL of water. Cycling conditions used initial denaturing at 95°C for 10 min, followed by 35 cycles of denaturing at 95°C for 30 s, annealing at 60°C for 30 s and extension at 72°C for 10 s.
Plants
The most widely applied DNA barcode for herbivore diet analysis is the P6 loop of the chloroplast trnL (UAA) gene (Taberlet et al., 2007). However, it has a lower taxonomic coverage than a recently designed second internal transcribed spacer of nuclear ribosomal DNA (ITS2) primer (Moorhouse-Gann et al., 2018). For this study, we targeted 200–387 bp amplicons of the ITS2 region for the amplification of plants in the diet using primers UniPlantF: TGTGAATTGCARRATYCMG and UniPlantR: CCCGHYTGAYYTGRGGTCDC (Moorhouse-Gann et al., 2018). We compared our primer reference database to the list of known JRBP plant species (762 species) and found that these primers identify 88% of the plants present at JRPB to the species and genus levels, 7% only to the family level, and 5% were not found in the database (GenBank). The first PCR comprised of 20 μL reactions using GoTaq® Colorless Master Mix, 0.6 μL (10 mM) of each primer, and 6 μL of DNA template and 2 μL of water. Thermocycling followed a program of initial denaturing at 95°C for 10 min, followed by 35 cycles of 95°C for 30 s, 55°C for 30 s, and 72°C for 30 s, with a 2-min final extension at 72°C.
The integrity of DNA extracted by each primer was assessed by gel electrophoresis. Specifically, 3 μL of each DNA extract was analyzed in a 2% agarose gel and was visualized by UV illumination. If positive, the PCR products were cleaned with the Qiagen PCR Purification Kit (Valencia, CA). For the two-step PCR, appropriate Illumina barcodes were ligated to each sample as an index tag for each unique sample (Ushio et al., 2017). The index PCR was performed as a 20 μl reaction: 10 μl of Amplitaq Gold360 Mastermix reactions (with 2.5 mM MgCl2,200 lM each dNTP, 0.1 mg/mL BSA, 4% DMSO), 1 μl (of each primer), 3 μl of purified DNA amplicons and 6 μl of H20. Cycling conditions used initial denaturing at 95°C for 10 min, followed by 12 cycles of denaturing at 95°C for 30 s, annealing at 60°C for 30 s and extension at 72°C for 10 s.
The indexed secondary PCR products were quantified using a Fragment AnalyzerTM (Automated CE System from Advanced Analytical Technologies), normalized to equimolar concentrations and pooled together before purification using QIAquick PCR Purification Kit (Qiagen). Sequencing was performed on a MiSeq platform using the Reagent Kit Nano v3 for 2 × 300 bp (plant primers) and 2 × 150 bp (mammal primers) paired-end reads (Illumina, San Diego, CA, United States) and run at the Stanford University PAN Facility. PhiX DNA spike-in control (18–30%) was added to improve the data quality.
Sequence Filtering and Taxonomic Assignment
We used a series of conservative filtering steps developed by Leempoel et al. (2020), to retain as much of the “true” DNA diversity present in the scat samples as possible. We used software packages in Obitools (Boyer et al., 2016) and R version 3.6.3 (R Core Team, 2020) for demultiplexing and quality control. Each sequence was assigned to its sample of origin based on exact matches to both index identifier. Sequences were paired with Obitools illuminapairedend and aligned sequences with a score of <40 were discarded (Kartzinel et al., 2015). Quality scores of paired sequences were checked using FastQC, prior to adapter trimming (with a mismatch tolerance with primers of 10%) in Cutadapt (Martin, 2011), and low-quality sequences <Q30 were removed. After assignment of sequences to their corresponding samples, we used obiuniq to dereplicate reads into unique sequences, eliminated potential PCR and sequencing errors with obiclean, and kept only sequences occurring at least 10 times. See Boyer et al. (2016) for a more detailed explanation. Obiclean was applied sample by sample, with a maximum of one difference between two-variant sequences and a threshold ratio between counts of one, meaning that all less-abundant sequences were considered as variants. Only sequences with “head” (true sequences or chimera product and can have multiple variants) or “singleton” (either true sequences or chimeras but are not related to any other sequences) status in at least one sample were kept. Further, sequences whose status in the global dataset were more commonly “internal” (amplification/sequencing errors) than “head” or “singleton” were discarded (Giguet-Covex et al., 2014).
The remaining sequences were matched in Obitools against the reference databases built using EcoPCR to identify the molecular operational taxonomic units (mOTUs) (Blaxter et al., 2005; Ficetola et al., 2010). First, we downloaded all standard sequences for vertebrates and plants from EMBL (1 release 141) and converted the recovered file to EcoPCR format. EcoPCR was then used to simulate an in silico PCR, using the two primer pairs and maximum three mismatches, and a minimum and maximum length identical to the length of each metabarcode. The taxonomic assignment of mOTUs was performed using Ecotag, keeping only sequences with an identity ≥ 95%, and further inspecting and revising taxonomic assignments to ensure validity.
We removed sequences with relative read abundance (RRA) < 0.001% within samples to reduce the likelihood of including data that might be the result of cross-contamination (Kartzinel et al., 2015). Obvious contaminants (i.e., human DNA) and counter-marking species mOTUs were removed – e.g., fox and bobcat frequently urinate or defecate on each other’s scats. Non-target mOTUs were removed because the MiMammal primer is known to identify bird sequences in the database (Ushio et al., 2017) and we identified 7 different bird mOTUs (Supplementary Table S4) (resulting removal of one coyote and bobcat scat) and the ITS2 primer amplified fungi and bacteria (Moorhouse-Gann et al., 2018). Canis lupus familiaris (domestic dog) was present in many fox samples yet the sequence was a 95% match to Vulpes vulpes (red fox) in the database, therefore we believe reads were misidentified and we removed this mOTU from diet analyses. Finally, all sequences with > 1% of the total reads in the negative controls were removed from our samples, a threshold that is 10 times more conservative than other recent studies (e.g., Siegenthaler et al., 2019).
Diet Composition and Biodiversity Analysis
We converted the filtered sequence read data into read abundance and occurrence data to examine the utility of both data types for food web construction. Three methods were used to quantify diet composition, as suggested by Deagle et al. (2019), including Frequency of Occurrence (FOO), which is calculated as the number of occurrences divided by the total number of samples; Percent of Occurrence (POO), rescaled to account for all food items; and the Relative Read Abundance (RRA) defined as the proportion of unique Illumina sequence reads in a sample divided by the final (i.e., after quality control) number of sequence reads in that sample. Fecal samples were sequenced separately for the plant and mammal DNA; therefore, we analyzed each independently for RRA and combined the FOO results in the case of omnivore diets.
Diet items were categorized into functional groups. Plants were identified as grasses, herbs, or woody vegetation (trees and shrubs), while small mammals were defined as species with an average adult body mass < 1.5 kg and large animals as those with a body mass > 1.5 kg. The mean percent of RRA was used to compare diet type (e.g., grass vs. trees vs. small mammals) among the focal species (Pansu et al., 2019).
To determine if there is an empirical relationship in the predator–prey mass ratio in JRBP, we compared predator body size (in grams) to prey body size (both natural log transformed) at the individual level as suggested by Nakazawa (2017) using Pearson’s correlation coefficient. Predators can take down prey of a certain size or smaller and scavenging carcasses does not involving killing of prey. We have evidence from camera trap imagery that deer carcasses are being scavenged by bobcats and gray fox within JRBP, therefore these correlations were performed with and without the deer.
To capture important baseline information about the food web dynamics, we compared different diversity, niche breadth and diet overlap metrics. We determined diet diversity (raw richness, Shannon diversity), niche breadth (individual, Levins’), niche overlap (Pianka’s niche overlap), and compared consumed prey species diversity (at mOTU level) following Razgour et al. (2011). The Shannon’s diversity index (H) accounts for both abundance and evenness of the species present in the diet and was calculated for each species diet using the vegan package (Oksanen et al., 2019) in R version 3.6.3 (R Core Team, 2020). A species’ niche breadth describes the suite of resources that it can use (Gaston et al., 1997). We determined how uniformly resources (mOTUs) are being utilized by each species using the standardized Levins’ measure of niche breadth index (BA) (Razgour et al., 2011; Lyngdoh et al., 2014):
Standardize as:
where pi is the proportion of fecal samples in which the mOTU i was found and n is the number of possible mOTUs in the diet.
Pianka’s adaptation of the niche overlap (Ojk) metric was used to determine dietary overlap among all pairs of target species (Pianka, 1973; Woodward and Hildrew, 2002; Brown et al., 2014; Pansu et al., 2019):
where pij is the proportion of prey species i in one carnivore species j diet, pik is the proportion prey species i in another carnivore species k diet, n = total number of available prey species. Ojk = 0 represents no overlap, whereas a value of Ojk = 1 represents complete overlap in prey species between all carnivore species.
To determine whether the number of collected fecal samples captured enough of the diet richness for this study, we used the function specaccum in the R package vegan to determine the mOTUs accumulation curve (without replacement) (Gotelli and Colwell, 2001). We used EcoSim null models (version 12) to test whether the extent of niche overlap is greater than expected by chance (Gotelli et al., 2015). We generated 1,000 simulated matrices of randomized mOTU diet composition, using the randomization algorithm 3, where the niche utilization values are reshuffled within each row of the matrix to detect non-random niche overlap patters (Winemiller and Pianka, 1990). The observed niche overlap (Ojk) is then compared to the simulated niche overlap values (Gotelli et al., 2015). For all of these pairwise comparisons, we deemed niche overlap to be significant when the observed value was greater than at least 99% of the simulated values.
We performed a non-metric multidimensional scaling (nMDS) ordination based on a Bray–Curtis dissimilarity matrix using the occurrences and the FOO of mOTUS to examine the patterns of niche space across different species (permutations = 999, trymax = 500, k = 2) (Kartzinel et al., 2015; Casey et al., 2019). We also performed principle component analysis (PCA) on the FOO of mammal and plant diet taxa to detect differences in the diet composition among species and to investigate whether certain taxa were more commonly found in certain diets.
Molecular Ecological Network Analyses
Molecular ecological network analyses consisted of three main steps: (i) mapping species interactions, (ii) quantifying network structure, and (iii) quantifying specific interaction patterns.
First, we built a JRBP food web as a unipartite network, which consists of one set of nodes where two species can be connected through trophic interactions (Delmas et al., 2019). Because network metrics can be impacted by mOTU identification protocols (Clare et al., 2019), we were conservative with the filtering process. Thus, unique sequence reference number mOTUs were grouped at species, genus, or family level, as this approach circumvents the potential taxonomic misclassification (Lupatini et al., 2014). The network was directed from predator to prey and interactions were weighted using the FOO values. To calculate network complexity and visualize the JRBP food web, we used the software Gephi (3 Bastian and Heymann, 2009). The Yifan Hu layout algorithm was used for the construction of the directed network and belongs to the category of force-directed algorithms (Force Atlas and Fruchterman Reingold algorithms) (Hu, 2006).
Second, we quantified overall network complexity and structure calculating the following network metrics: Connectance (proportion of realized interactions among all possible ones) to quantify the level of arrangement of a network; Average degree (average number of links per species) to understand the average level of specialization of the network; Average clustering coefficient (degree to which the neighbors of a node are connected) to estimate groupings in closely connected subsets; and Path length (average distance between any pair of nodes) to determine shortest distance between species (Delmas et al., 2017; Landi et al., 2018).
To measure the relative importance of each taxon within the network we calculated: (i) Weighted in-degree centrality, which also indicates the degree to which losing a central species from the network will trigger secondary extinctions and impact the community (Elhesha et al., 2017) and (ii) the Eigenvector centrality, which measures the node’s importance within the network while accounting for the importance of its neighbors, representing potential keystone species (Allesina and Pascual, 2009). Keystone species play a structuring role within the food web, strongly influencing the abundances of other species (Power et al., 1996). The higher the centrality values within the network, the greater the functional role within the network (Allesina and Pascual, 2009).
To better understand the structure of the JRBP food web, we measured modularity and nestedness. Modularity is defined as the degree to which networks are organized in discrete groups, i.e., modules. A modular network is characterized by species belonging to the same module having high connection among themselves and few connections to species belonging to other modules (Moore et al., 2017; Landi et al., 2018; Ma et al., 2020). Modularity and module partitions were computed by simulated annealing (Doulcier et al., 2016) using rnetcarto, which allowed us also to determine which species were most connected among modules and to calculate z-values for within-module connectivity. Nestedness is defined as the degree to which more specialist species interact only with subsets of species that interact with more generalist species (Jonsson, 2001; Bastolla et al., 2009). The role of nestedness for biodiversity depends on the type of species interactions. In mutualistic networks, nestedness enhances the number of coexisting species, but in food webs nestedness increases niche overlap among consumers and thus may prevent their coexistence (Kondoh et al., 2010). Nestedness (η) was calculated (Bastolla et al., 2009; Losapio et al., 2019) for unipartite networks as:
where nij is the number of prey species between two predator species i and j and min (ni, nj) is the smaller of the two values. Values of nestedness η range between 0 (perfectly non-nested, full trophic complementarity) and 100 (perfectly nested).
Thirdly, we identified specific interaction patterns using network motif analysis (Milo et al., 2002). Specifically, we focused on patterns of: (i) tri-trophic chains (e.g., predator that consumes prey who feed on plants), (ii) omnivory (species at the top of a food chain that feed on both plants and animals), and (iii) exploitative competition (two predators competing for the same shared prey) (Giling et al., 2019). These three motif patterns are represented as:
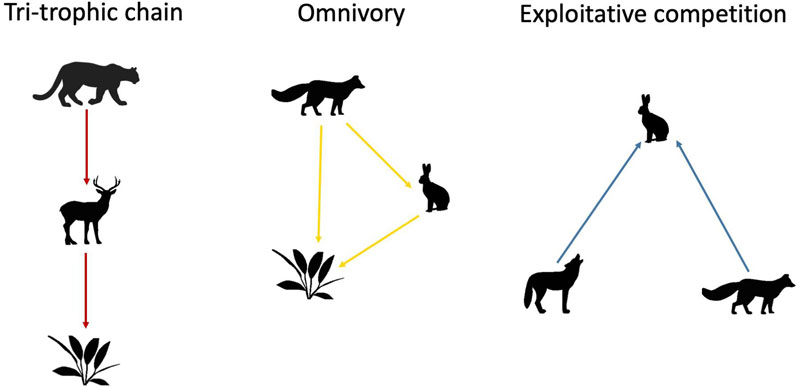
We used figure the RANDESU motif finder algorithm of igraph (Csardi and Nepusz, 2006) to find and count these subnetworks. Then, we compared the JRBP food web motifs with random expectation. Notice that network links were directed from predators to prey, highlighting the structure of “who eats whom” rather the “matter and energy flow.” For this reason, the motif of exploitative competition involving two predators and one prey can resemble apparent competition in theory. However, apparent competition involves two prey and one predator (Wootton, 1994). Thus, we opted for a biological definition of network motifs involving indirect interactions between two predators as exploitative competition.
To assess the significance of nestedness, modularity, trophic cascade, omnivory and exploitative competition, we used randomizations of the empirical JRBP food web. Our null model randomized the food web probabilistically maintaining total number of interactions and species-specific frequencies (Jonsson, 2001; Oksanen et al., 2019). To assess statistical significance for each of these metrics we assessed whether (i) the empirical food web metric was higher or lower than the 95% CI expected by chance, and (ii) the probability, p, that a randomization was equal or higher than observed empirically. All analyses were conducted in R version 3.6.3 (R Core Team, 2020).
Bioassessment Comparison
Mammal diversity recovered from fecal DNA was compared to an expert-curated list of known mammals in the region, and both camera trap soil eDNA surveys at JRBP. The fauna and flora of JRBP are well documented, including 762 plant species (Oakmead Herbarium, 2019) and 46 mammal species (JRBP, 2019). Camera trap and soil eDNA data sets and their analysis are described in Leempoel et al. (2020) and Leempoel et al. (2019). Briefly, during the time of this study, 18 wireless camera traps were continuously recording wildlife along trails. We used images recorded from October 15, 2017 – April 20, 2018 to overlap both fecal collection sessions for a total of 2,754 capture days (153 days × 18 cameras). To determine if some scats were over- or under-represented, we tested for a correlation between the number of capture days per species and the number of scats. The soil eDNA study was conducted in October 2017, contemporaneously with some scat collection. It relied on 12 soil samples sampled in front of 6 of the camera traps, and used the same MiMammal-U 12 s metabarcode. We compared mammal species identified in this soil eDNA study with those identified in the scat samples.
Results
We collected 158 fecal samples over the two sampling periods, consisting of 15 puma, 12 coyote, 31 bobcat, 71 gray fox, 14 deer, and 15 jackrabbit samples. The majority of the samples (87%) were collected in the dry season (dry season = 137 and wet season = 12), which may be a result of seasonal usage of the JRBP by animals, seasonal differences in trail use, and/or seasonal differences in scat preservation. We combined all samples for further analysis to represent the temporal averaging of the focal species’ diets and plotted sample-based species-accumulation curves, all of which are approaching asymptotes (Supplementary Figures S2A,D), indicating adequate sampling of guild diets for this study.
Mammal and Plant DNA Metabarcoding
We successfully sequenced either mammal DNA, plant DNA or both from 113 fecal samples post filtering (Table 1 and Supplementary Table S1 for sample size filtering). A total of 75% of gray fox samples contained plant DNA (n = 36) and 63% contained mammal DNA (n = 30). Two of the coyote samples had both plant and mammal DNA, with one containing plant DNA only. We retained all mOTUs as representatives of the number of species that were both in the environment (biodiversity assessment) and being consumed (network assessment) at the time of collection.
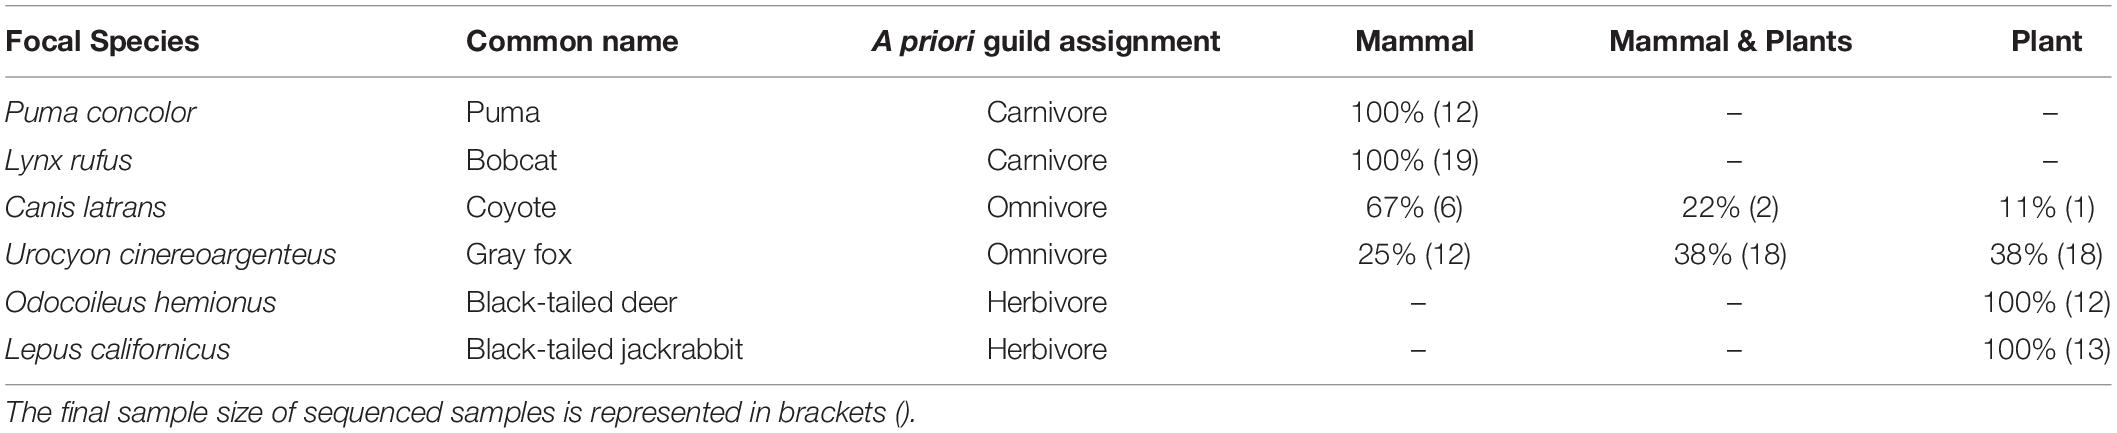
Table 1. A priori guild assignment according to the plant and mammal DNA, represented as the percent of samples that contained only mammal, only plants and both.
From a combined 24-day sampling period, we identified a total of 212 known mOTUs with unique reference sequence numbers from 31 carnivore, 57 omnivore, and 25 herbivore fecal samples (Supplementary Table S2). These mOTUs represent 55 families and 119 genera. We combined multiple mOTUs identified to the same genus or family, making up 167 individual mOTUs (identified to each taxonomic level: 85 species/sub-species, 67 genera, 10 tribes/sub-tribes, and 5 families/sub-families) (Supplementary Table S3). We classified 91% of the mOTUs to the genus or species/sub-species level.
The mtDNA 12S gene was sequenced to assess the mammal diet of four predator species. From the 102 samples sequenced, a total of 20,373,994 raw reads were generated with 4,459,979 reads remaining after removing host and contaminant DNA. Host DNA made up the majority of the reads for puma 63 ± 0.12%, bobcat 89 ± 0.04%, coyote 81 ± 0.09%, and gray fox 93 ± 0.02%, and therefore able to identify any unidentified scat. After taxonomic assignment, a total of three mOTUs (genera Equus, Rattus, and Felis) were removed because their abundance in the extraction-negative control was > 1% of the total reads for those mOTUs, suggesting upstream contamination. We removed samples that consisted only of host reads (i.e., samples showing no prey species other than host DNA) or samples deemed contaminated, leaving 69 samples for downstream analysis (Supplementary Table S1).
We identified a total of 16 unique mammal mOTUs from the scat samples of the predator species for downstream diet analysis (Table 2). Predator diet diversity comprised 11 families and 13 genera. If an mOTU was identified to the genus-level and that genus was monotypic in the San Francisco Bay Area, then cf. (conferre) was indicated and the species level identification was included (i.e., Neotoma cf. fuscipes). Therefore, 75% (12/16) of the mOTUs were identified to species.
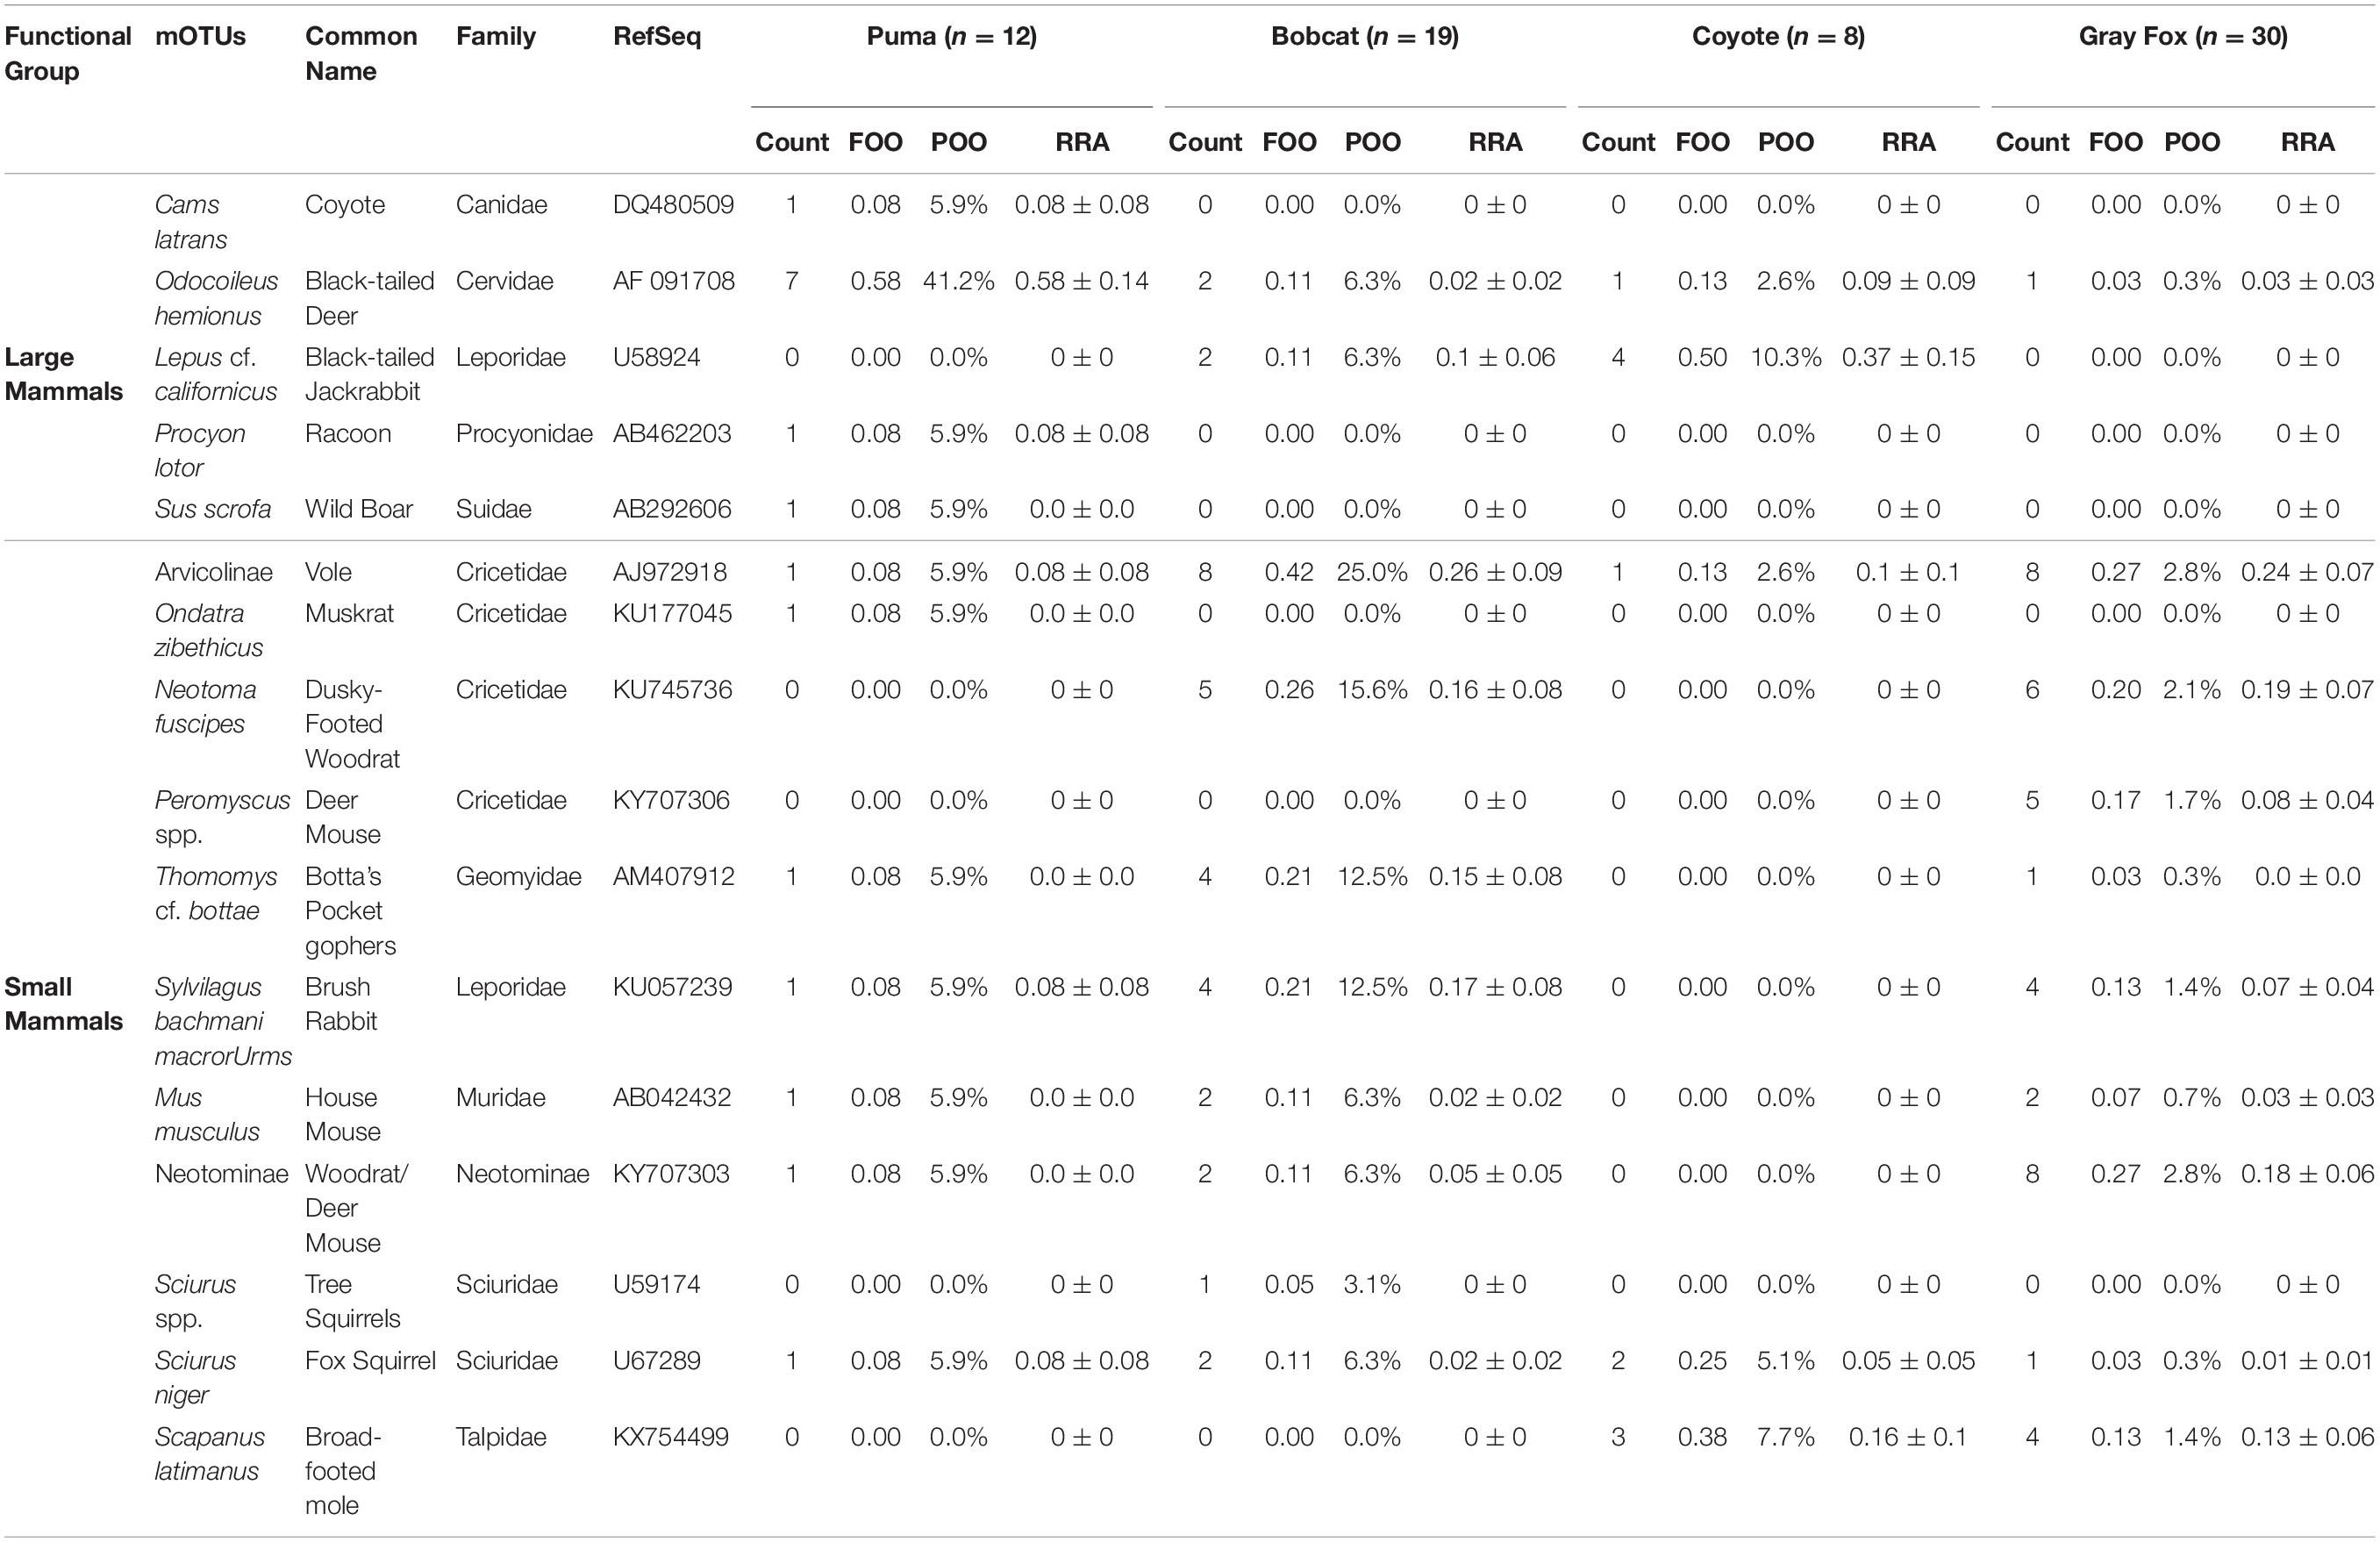
Table 2. Mammal diet mOTUs found within scats from four predator species collected from JRBP, expressed by the Count (number of scats containing prey species); FOO (frequency of occurrence = number of occurrences/total scat sample size); POO (percentage of occurrence = number of occurrences/total number of prey species across all samples); and RRA (mean relative read abundance = number of reads per species/total number of reads per scat sample).
The ITS2 marker was sequenced to assess the plant diet of the two herbivore and two omnivore species (Moorhouse-Gann et al., 2018; Table 1). From the 64 samples sequenced, a total of 1,970,916 post filtering and a final 1,813,698 reads were used for downstream analysis. Plant DNA was identified as 196 unique mOTUs to the family level and below, marked by unique reference sequence numbers (Supplementary Table S5). The mOTUs represented 44 families and 106 different genera and 77 species of plants. Of the 196 unique reference sequence numbers, there were 151 individual mOTUs after combining the same family and same genus together (identified to each taxonomic level: 77 species, 61 genera, 10 tribes, and 3 families) (Supplementary Table S6). The ITS2 primers were specific in identifying plants to the species level (51% of mOTUs) and genus level (40% of mOTUs).
Diet Composition and Richness
When evaluating diet by functional groups, we found that puma consumed mainly large mammals (Figure 1 and Table 3), primarily black-tailed deer, and frequently augmented with small mammals and single occurrences of coyote, raccoon (Procyon lotor), and feral pig (Sus scrofa). The next largest predator, the coyote, consumed an even mix of large mammals, mainly black-tailed jackrabbit (Lepus cf. californicus), and small mammals, mainly broad-footed mole (Scapanus latimanus). The smaller mesopredators, the bobcat and gray fox, regularly consumed small mammals (95 and 97% of samples, respectively) including dusky-footed woodrats (Neotoma cf. fuscipes), voles (Arvicolinae), and brush rabbits (Sylvilagus bachmani macrorhinus) (Figure 1 and Tables 2, 3). All mesopredators consumed black-tailed deer, but at a very low frequency of 1–2 samples for all species.
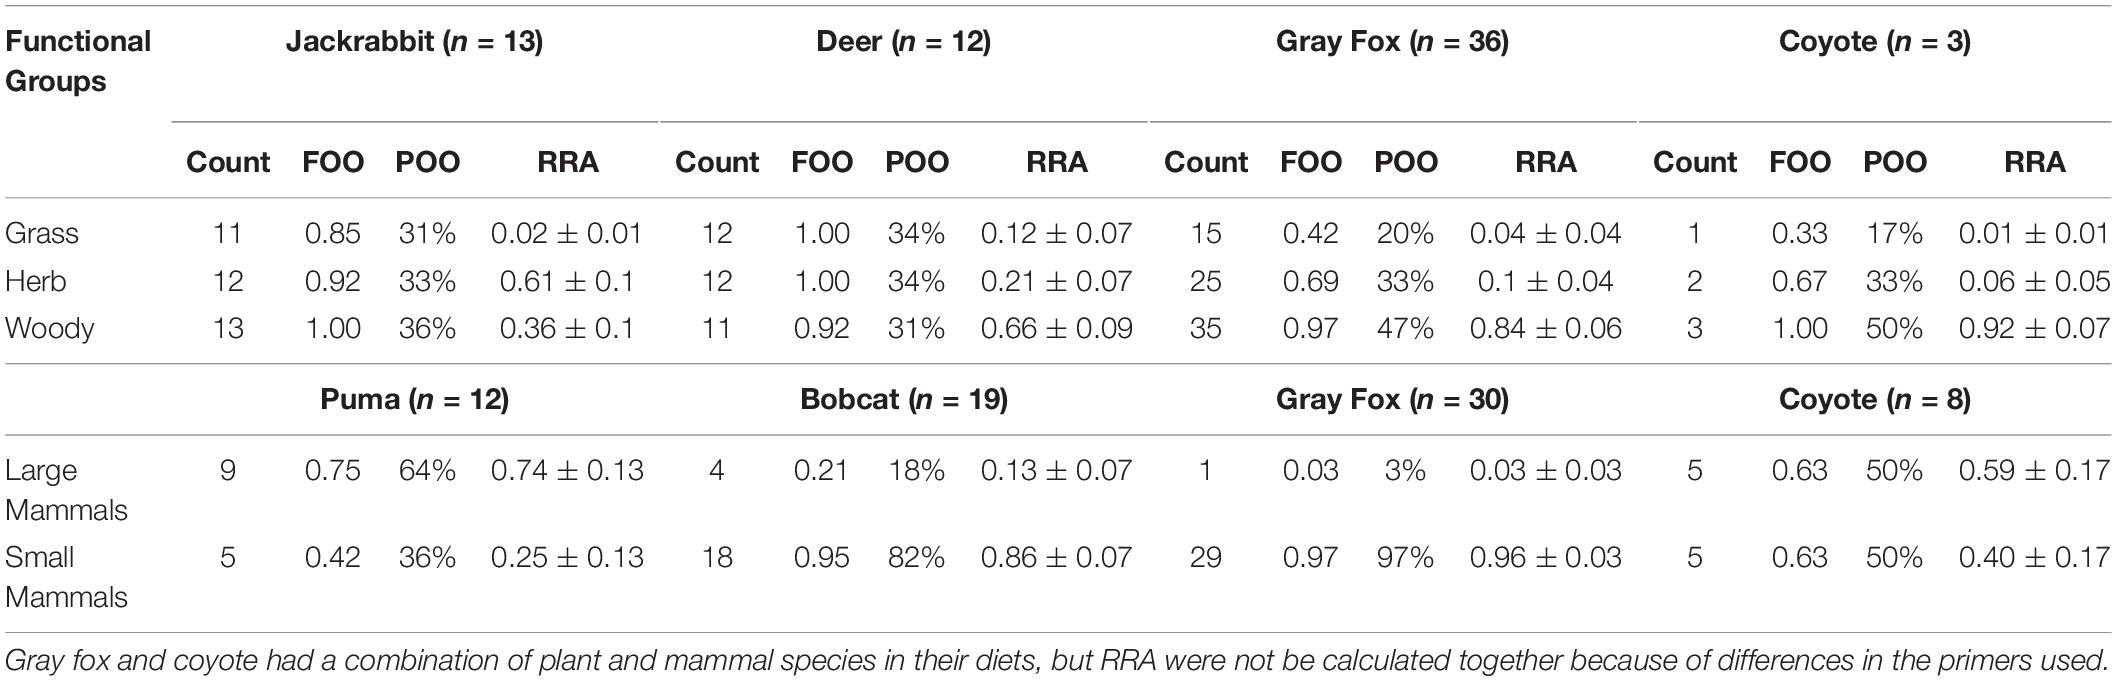
Table 3. Diet composition of six focal species, described at the functional groups of plants and mammals consumed and expressed by the Count, FOO, POO, and RRA.
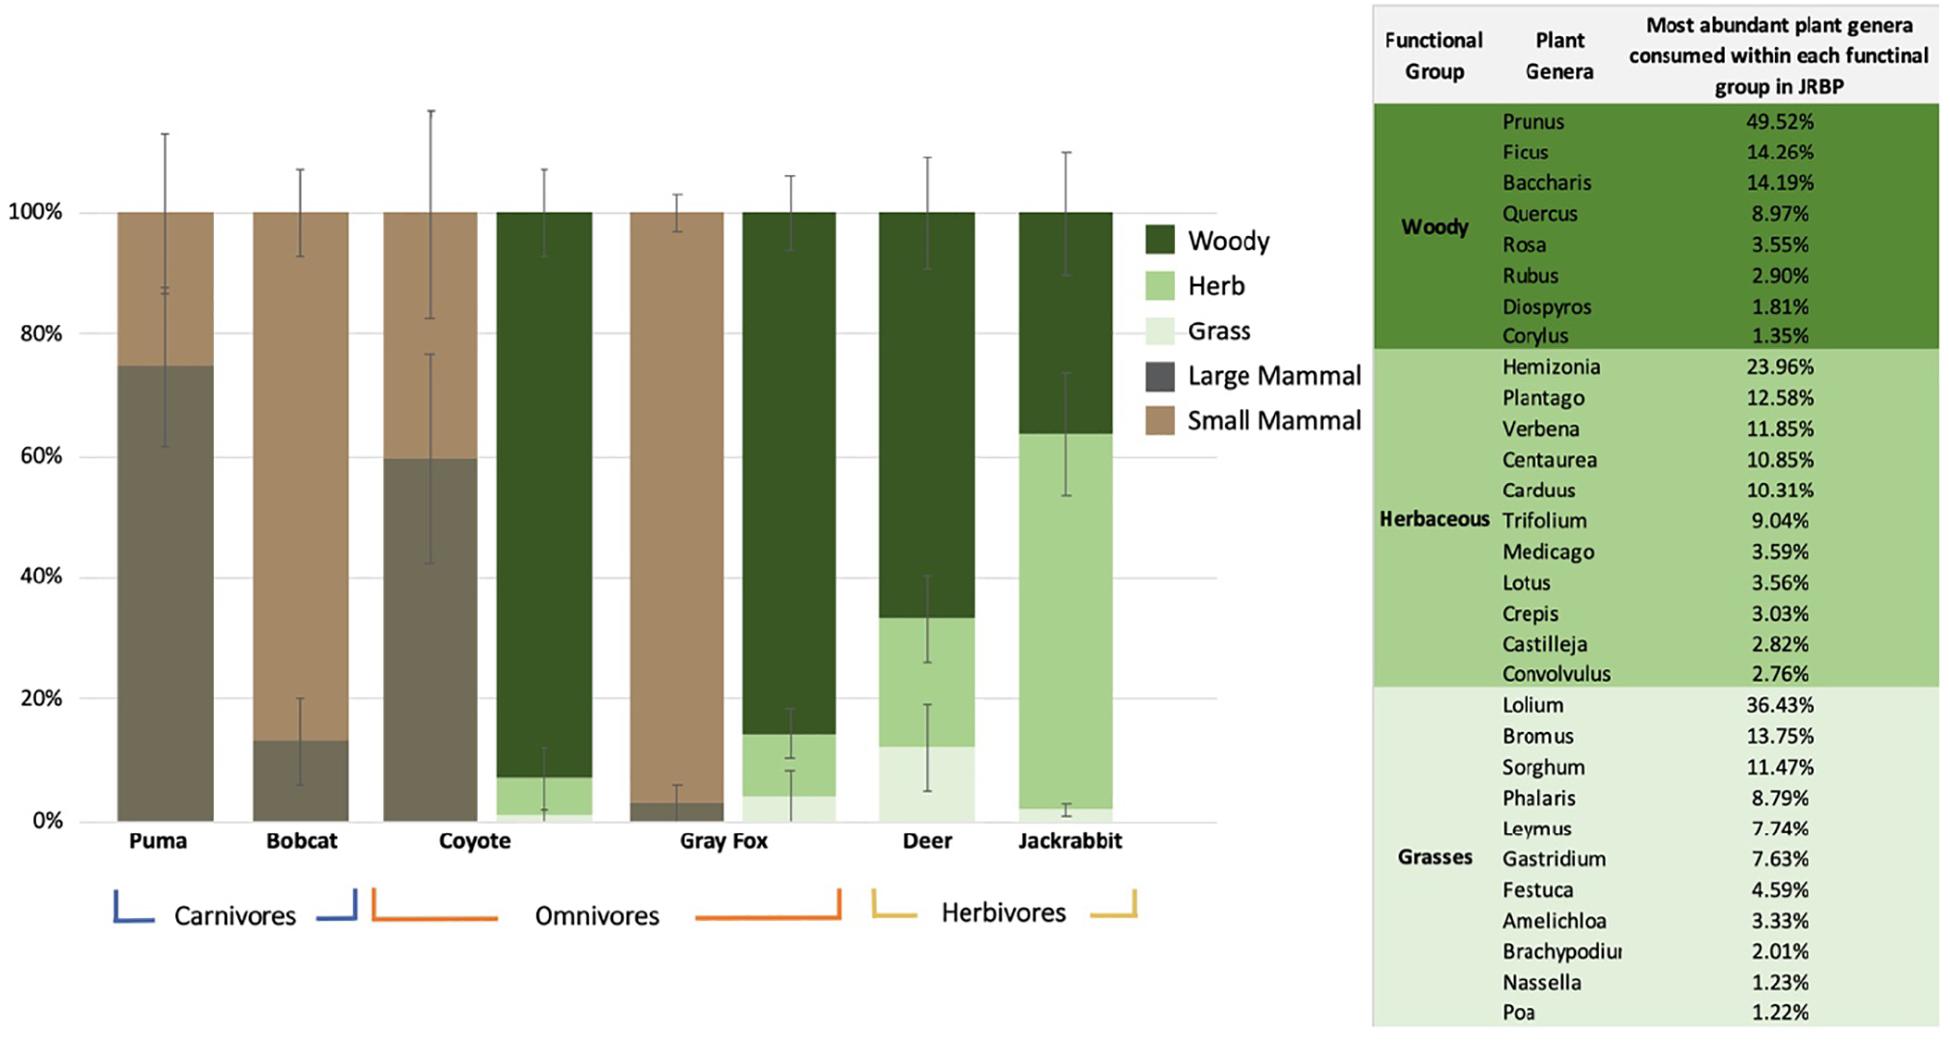
Figure 1. Mean percentage ± SE of the relative read abundance per species per diet functional groups. The two omnivores (coyote and gray fox) have two columns representing both their plant and animal diets. The panel represents the percent of total plant genera reads identified in the diets of herbivore and omnivores within JRBP, showing only genera that comprised 1% or more of the diet.
Based on PCA, it is evident that the body size of both predator and prey drive the differences in the diets of predators (Figure 2A). The two principal components explained 82.6% of the variation, with small mammals contributing 70.6% of variance to PC1 and large mammals 60.6% in the PC2. Predator-prey body mass were positively correlated when scavenged deer was included (n = 98, r = 0.55, p < 0.0001), but the correlation is stronger when deer was excluded (n = 95, r = 0.62, p < 0.0001) (Supplementary Figure S3).
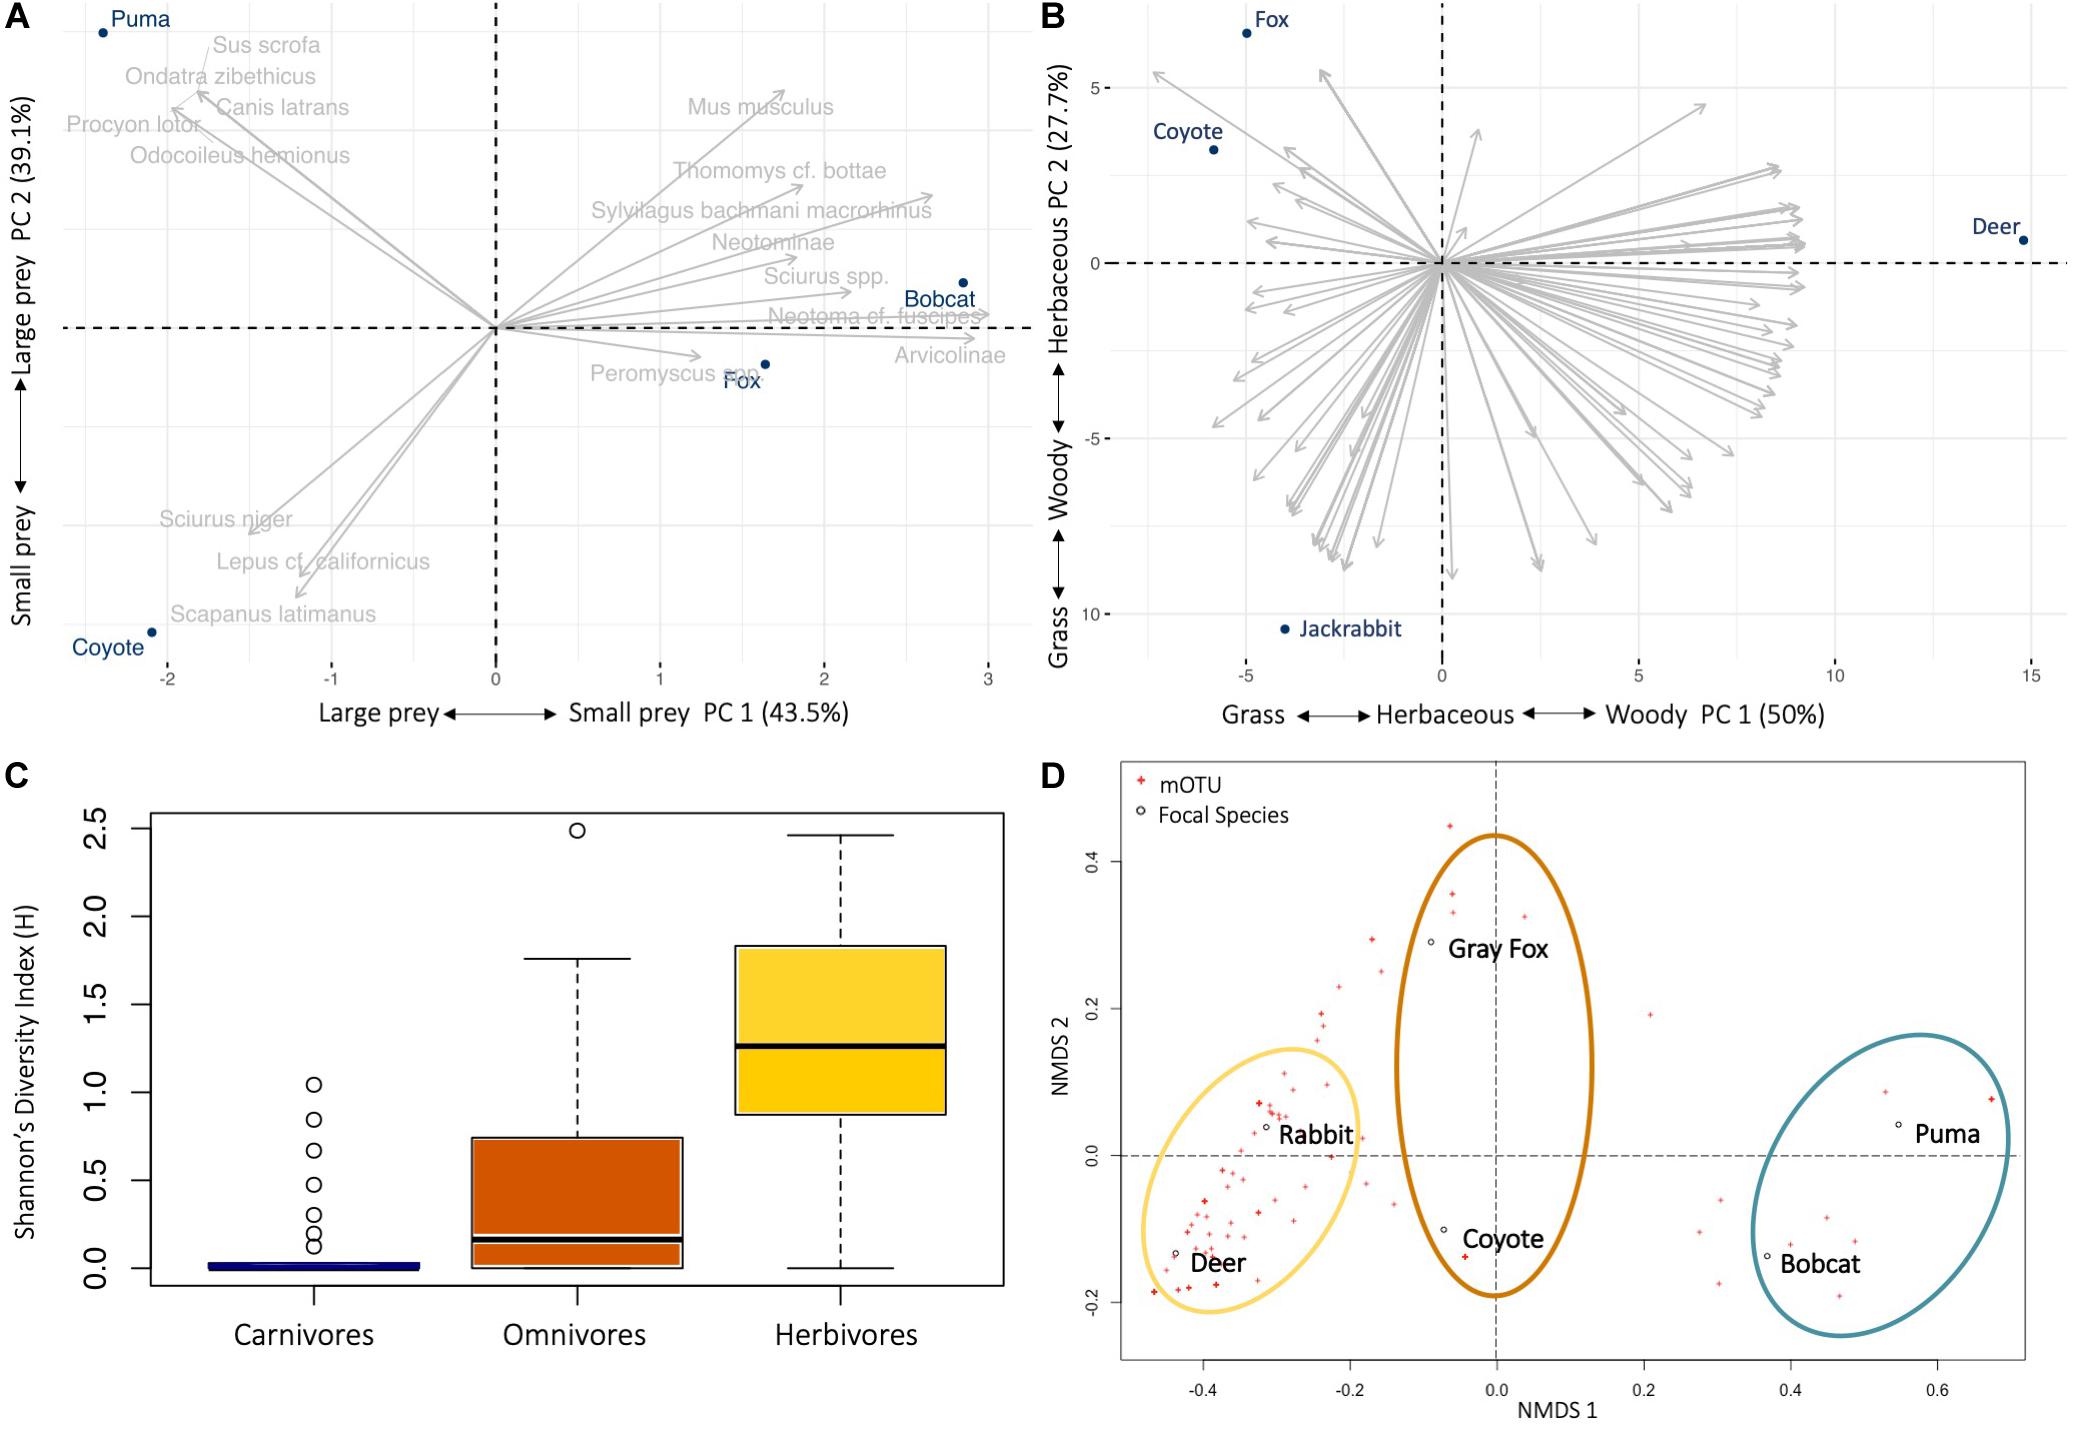
Figure 2. Diet ecology of six mammal species on Jasper Ridge Biological Preserve. Principal component analysis (PCA) biplot of the mammal (n = 16) and plant (n = 196) taxa frequency of occurrence within fecal samples of the (A) predators (puma, coyote, bobcat, gray fox), showing the position of consumer in relation to the different prey items; and (B) herbivore (deer, jackrabbit) and omnivore (coyote, gray fox) (taxa names removed for clarity). Explained variances of the two principal components are shown in brackets. (C) Box-plots alpha diversity indices of Shannon diversity (F2,110 = 29.65, p < 0.0001) in diet across fecal samples from the carnivore, omnivore and herbivore trophic level in JRBP. Lines in boxes are medians, box ends are quartiles, whiskers show ranges, and o indicates outliers. (D) Patterns of niche space across the six different focal species using non-metric multidimensional scaling (nMDS) for Bray-Curtis dissimilarity of frequency of occurrence data showing dissimilarity of carnivore (blue), omnivore (orange), and herbivore (yellow) diets. The distance between points represents the level of difference. The closer the species in the graph, the higher their similarity.
Dietary prey richness was the same for the small predators [gray fox and bobcat (10 mOTUs)], 11 for the puma, but only five for the coyote, although the number of samples for the latter was low (Table 2). The number of mammal taxa per scat ranged between 1 and 6 (individual niche breadth, mean mOTUs ± SE per species) (Supplementary Table S7). Individual niche breadth was similar among the four predator species (F3,65 = 0.69, p = 0.56).
The mean plant taxa per scat sample was much larger for herbivores, with 18.63 ± 1.72 mOTUs/fecal sample, as opposed to 7.05 ± 1.06 for omnivores. The dietary dissimilarity within species was greatest for the gray fox and least for deer, while fox, deer, and jackrabbit diets were almost completely overlapping (Supplementary Figure S4). Deer are mixed feeders (i.e., grazers and browsers), and here their diet comprised of 66% woody and 33% grass and herbaceous vegetation, while jackrabbits are grazers, with 63% of their diet containing grasses and/or herbaceous plants (Figure 1 and Table 3). The plants with the highest overall FOO for the herbivores included: the trees Quercus spp. and Cedrus deodara, (FOO = 0.68, 0.40, respectively); the forbs Plantago spp. and Medicago polymorpha (0.48, 0.36); and the grasses Amelichloa spp. and Nassella spp. (0.40) (Supplementary Table S5). Note that grass was found in all deer fecal samples, however, it only represented 12% of the RRA of the diet. For the gray fox, herbs comprised just 1% of RRA, despite being frequent in the diet (FOO) (Table 3). Clear differences in the diets of plant consumers were evident in the PCA (Figure 2B). The two principal components explained 77.7% of the variation, with woody vegetation explaining 43.5% of the variance in PC1 and herbaceous vegetation explaining 53.4% of the variance in PC2.
Gray fox were frequent plant consumers (75% of samples contained plant DNA), selecting a wide diversity of plants (representing 59 genera). The fox and coyote both frequently consumed woody vegetation (85–92% of the diet) which produce fruit. The top plants consumed by the two omnivores were the woody plants Catalina cherry (Prunus ilicifolia), coyote brush (Baccharis pilularis), and oaks (Fagaceae, Quercus spp.) (FOO = 0.36, 0.28), and herbaceous English ivy (Hedera helix) (0.31) (Supplementary Table S5). Although differing in average daily intake, the gray fox diet richness was similar to that of the herbivores (Supplementary Table S7).
Dietary Diversity, Niche Breadth and Overlap
We identified diet diversity and niche overlap among carnivores, and across all feeding guilds. Between the two carnivores, the bobcat had a relatively wider niche breadth than the puma (Levins’ measure: BA = 0.41 and 0.26, respectively) but approximately the same dietary diversity (Shannon diversity index: H = 2.13 and 2.03, respectively) (Supplementary Table S7). The coyote had the narrowest niche breadth and dietary diversity of all four predators (BA = 0.19, H = 1.47). The Shannon’s Index shows that the herbivores and omnivores have a significantly more diverse diet than do the carnivores (F2,110 = 29.65, p < 0.0001) (Figure 2C), along with a higher individual niche breadth (F2,110 = 58.99, p < 0.0001) and wider niche breadth using Levins’ Standardized Index (Supplementary Table S7).
Pianka’s index was used to calculate the niche overlap of predator species, first considering only mammal species in the diet (Supplementary Table S8A). The diets of the coyote and the puma did not significantly overlap [Ojk = 0.23, P(Obs > null) = 37%], as the diet of the coyote consisted mostly of small mammals and jackrabbits while the diet of the puma consisted mostly of deer. Gray fox and bobcat niches overlap significantly with each other [Ojk = 0.77, P(Obs > null) = 99%], and to a lesser extent with the coyote [Ojk = 0.26, 0.33, respectively; P(Obs > null) < 95%]. Gray fox and bobcat differ from the coyote mainly in the breadth of small mammals they consume. As expected, the bobcat does not significantly overlap with the puma [Ojk = 0.39, P(Obs > null) = 65%]. However, the nMDS for Bray-Curtis dissimilarity of diet shows that when plant and mammal diet are considered, the carnivores group together, the herbivores group together, and the omnivores group in the first nMDS axis but split in the second nMDS axis (Figure 2D).
We expanded the dietary niche overlap analysis to include plant mOTUs for omnivores and herbivores (Supplementary Table S8B). The coyote shares the greatest niche overlap with the gray fox [Ojk = 0.32, P(Obs > null) = 99%] while sharing the least with the puma (Ojk = 0.16). As expected, deer and jackrabbit diets have the greatest overlap [Ojk = 0.50, P(Obs > null) = 99%]. Although there is a 50% niche overlap in the herbivores diets, the PCA visually represents how the woody and herbaceous plant taxa are driving a significant differences between the two species (Figure 2B). The gray fox diet significantly overlaps with diet of both herbivores [Ojk = 0.46, P(Obs > null) = 99%]. The jackrabbit and black-tailed deer have the widest niche breadth (BA = 0.32), and a relatively diverse and even diet (H = 4.45 and 4.35) (Supplementary Table S7).
Molecular Ecological Network Analyses
The diet data were used to construct an empirical food web composed of 151 plant (Supplementary Table S6) and 19 mammal mOTUs (Table 2), totaling 170 nodes and 310 weighted edges/links (predation interactions) by FOO (Figure 3A). The network was directed with links going from the predator node to prey/plant node. The analysis of the topological properties showed that the JRBP network has an average clustering coefficient of 0.104 among the feeding guilds with an average path length of 1.608, average degree of 1.82, and a low connectance of 0.011.
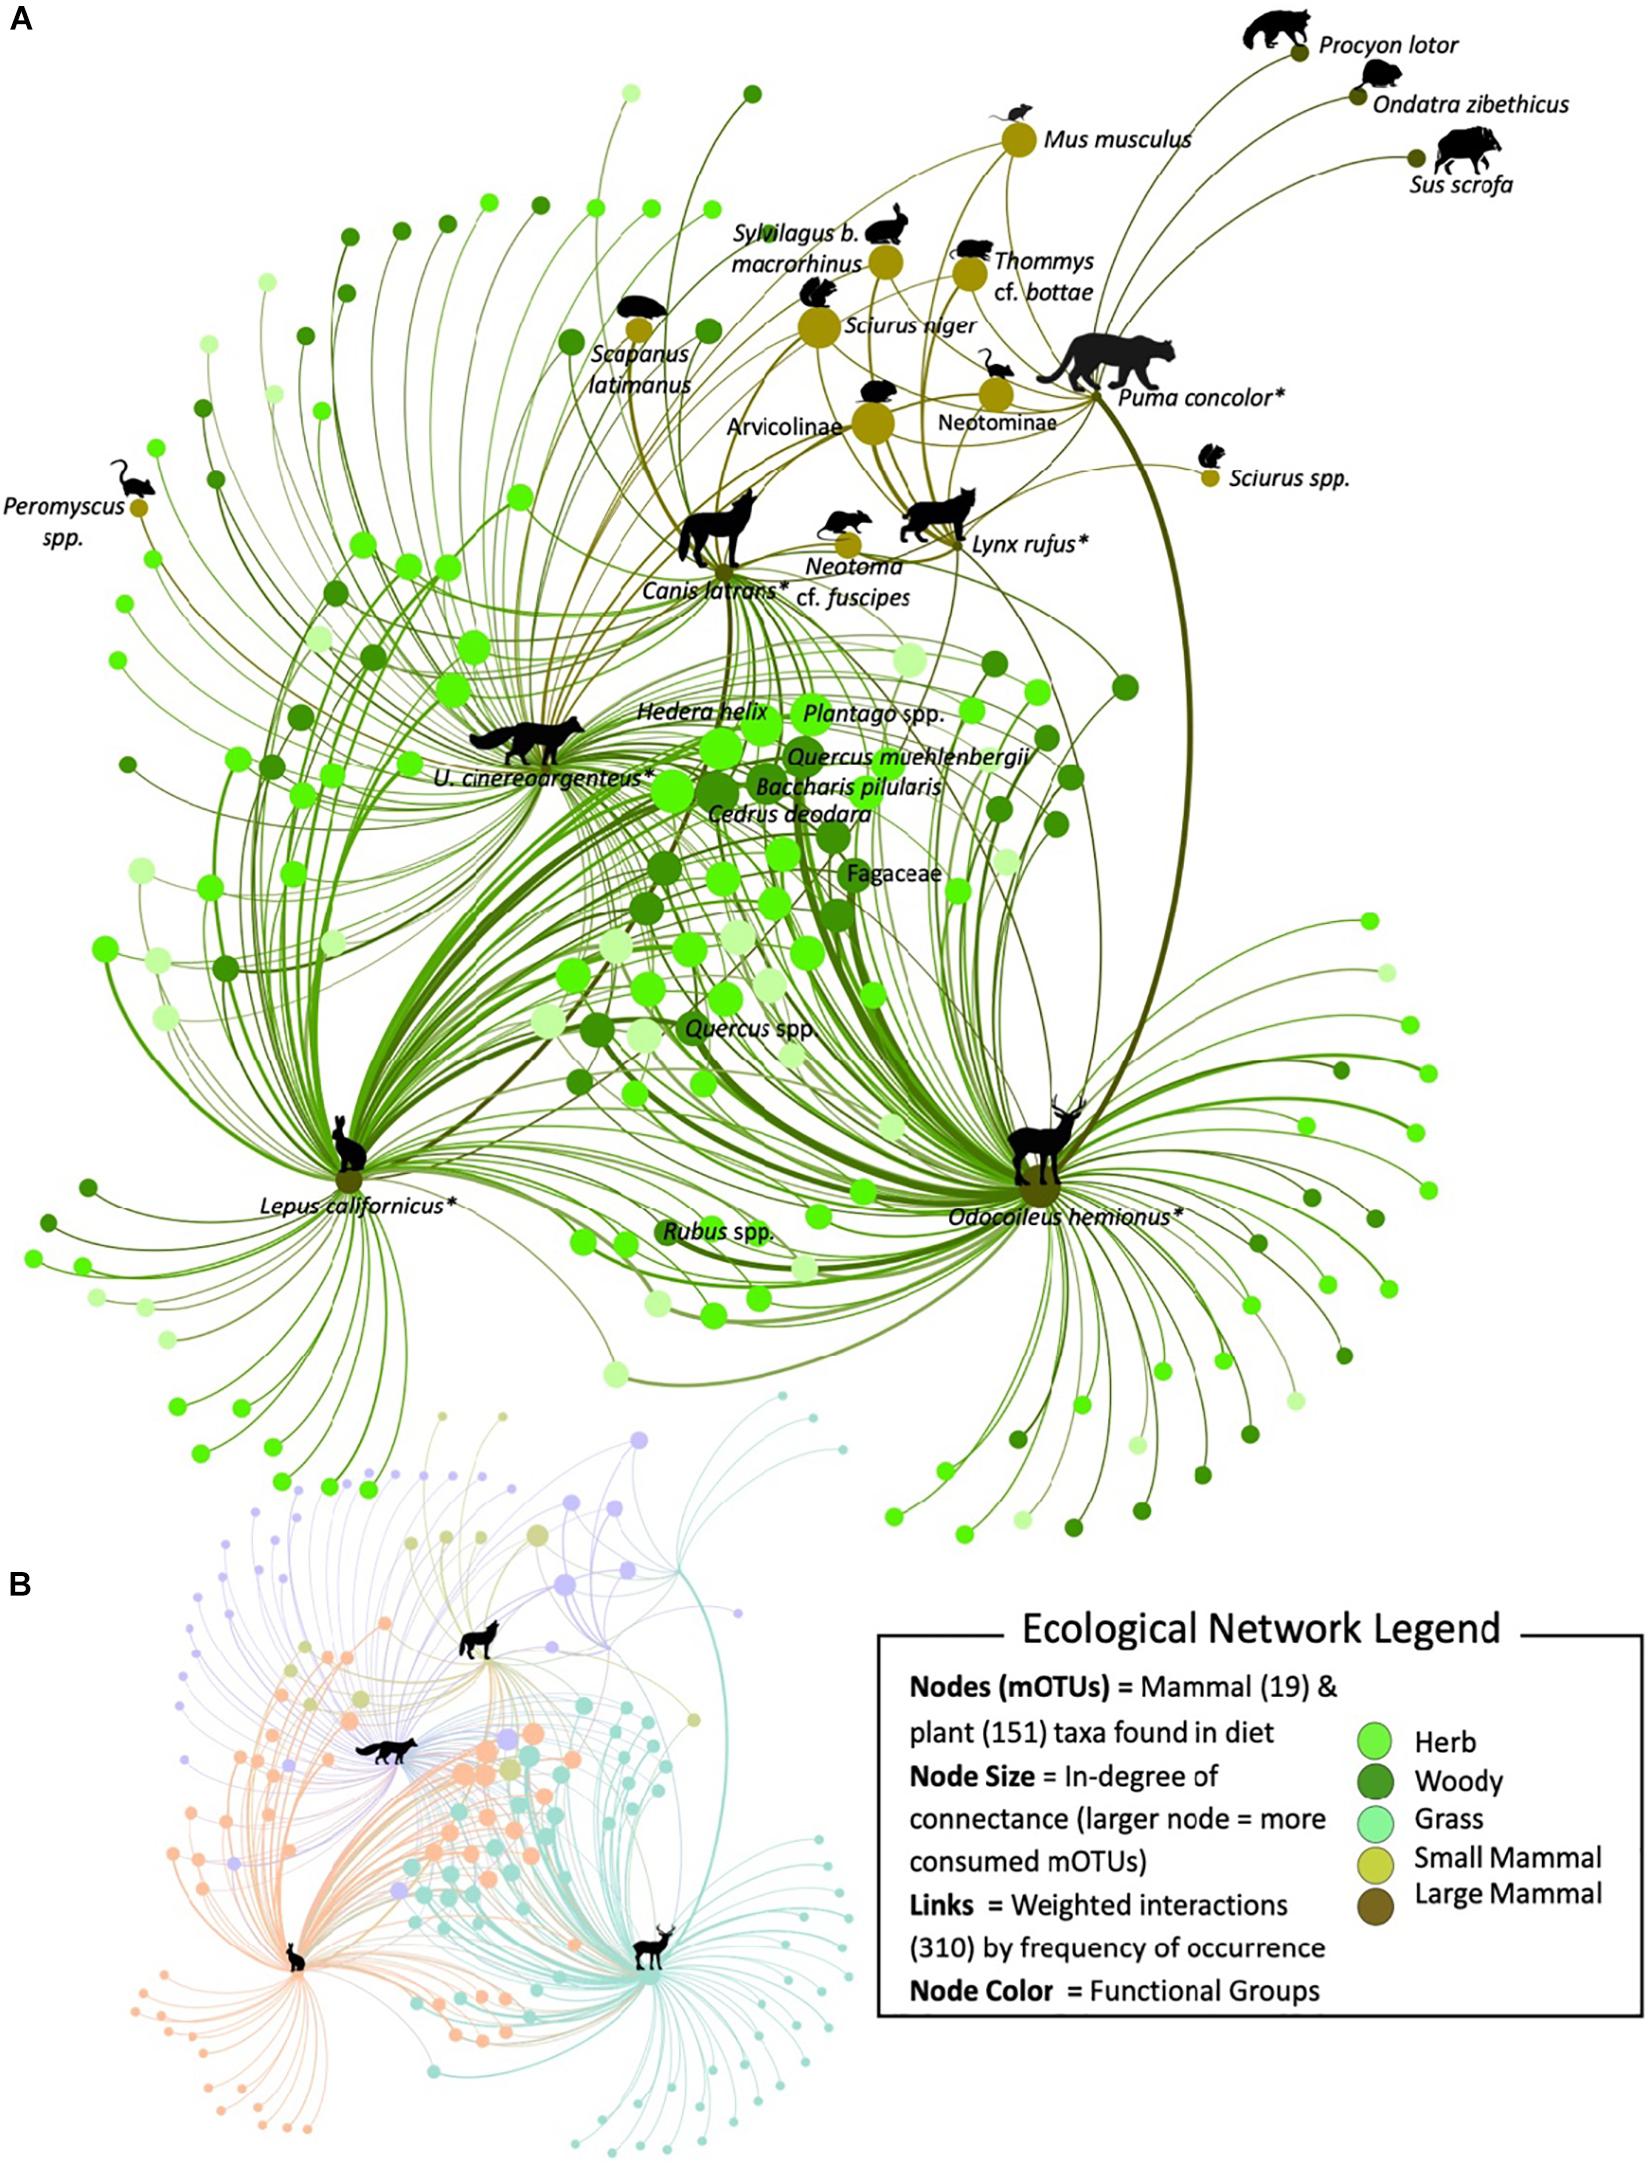
Figure 3. A subset of the molecularly constructed food web of JRBP targeting the diets of black-tailed jackrabbit, black-tailed deer, gray fox, coyote, bobcat, and puma (*) represented by 170 nodes and 310 interactions. (A) Nodes are representing the predator – prey mOTUs and are color coded according to their functional group. The size of the node is proportional to the number of links connected (in-degree), and the width of the link is proportional to the frequency of occurrence the prey item was found in the diet across scat samples. The curve of the edge is always in a clockwise direction representing a weighted link from the consumer to the food item. All of the mammal mOTUs have been labeled, along with the most consumed plant mOTUs. (B) The colors in the scaled network represent the four different modular communities detected within the JRBP community and the icon represents the key species within each module.
The metrics to determine key species within the network identified similar species. The most central nodes were identified through the weighted in-degree centrality metric and the top plant mOTUS were: Quercus, Cedrus deodara, Plantago, Baccharis pilularis and mammals were: deer, vole (Arvicolinae), squirrel (Sciurus niger) and jackrabbit. Within the network, each node was given an eigenvector centrality score, the closer to 1 the greater the level of influence within the network. The most important plant nodes were: Quercus, Plantago, Cedrus deodara, Baccharis pilularis, Centaurea solstitialis, Brassica, Hedera helix; and the mammal nodes were: deer, vole, squirrel, and jackrabbit (for full list see Supplementary Table S9).
The JRBP community network was significantly more modular than expected by chance (Q = 0.36, 95% CI = 0.26–0.30, p < 0.05). The JRBP food web was comprised of four modules (Figure 3B). The most significantly connected (Z-score > 1.96) species (hub connectors) within this community are deer (7.95), jackrabbit (7.08), gray fox (5.66), coyote (3.96) and bobcat (2.74) (for a full list see Supplementary Table S10). The JRBP network is not significantly nested (falls within the 95% CI expected from random networks;η = 0.40, 95% CI = 0.39–0.49, p = 0.09).
The tri-trophic chain motif was significantly over-represented, meaning this pattern occurred within the network more times than expected by chance (JRBP Network = 464; 95% CI = 43–240). Omnivory, however, was not more prevalent in this network than expected by chance (JRBP Network = 74; 95% CI = 42–184). Finally, the exploitative competition motif was also significantly more represented than expected by chance (JRBP Network = 128, 95% CI = 17–123).
Bioassessment Comparison
We compared our fecal eDNA data to camera trap and soil eDNA surveys from the same time period of scat collection (October 2017 – April 2018), and to an expert-curated mammal list of mammals in the study area (see Leempoel et al., 2020 for camera trap and soil eDNA methodologies). The scat sample size of predators was significantly correlated with the number of camera trap days for predator occurrences – in fact the rank order abundance in each data set was the same (Spearman’s rs = 1, p(2-tailed) = 0): in order, gray fox was most abundant (scat n = 71, camera n = 186), followed by bobcat (n = 31, 136), puma (n = 15, 84) and finally coyote (n = 12, 22).
This study detected 73% of known (listed) mammals in the study area (excluding bats), equal to the percent of mammals detected from soil eDNA, but greater than detected of the camera trap array (59%). Through our diet analysis, we found five species undetected by the camera traps that were small mammals (Thomomys sp., Scapanus latimanus, Peromyscus spp., and Arvicolinae), two large mammals undetected by the soil eDNA survey (Ondatra zibethicus and Procyon lotor), and an additional two species previously not known from JRBP (Mus musculus and Sus scrofa) (Figure 4). These two species, the house mouse (Mus musculus) and feral pig (Sus scrofa), are not known to inhabit the preserve, suggesting that consumption of these prey may have taken place outside the preserve.
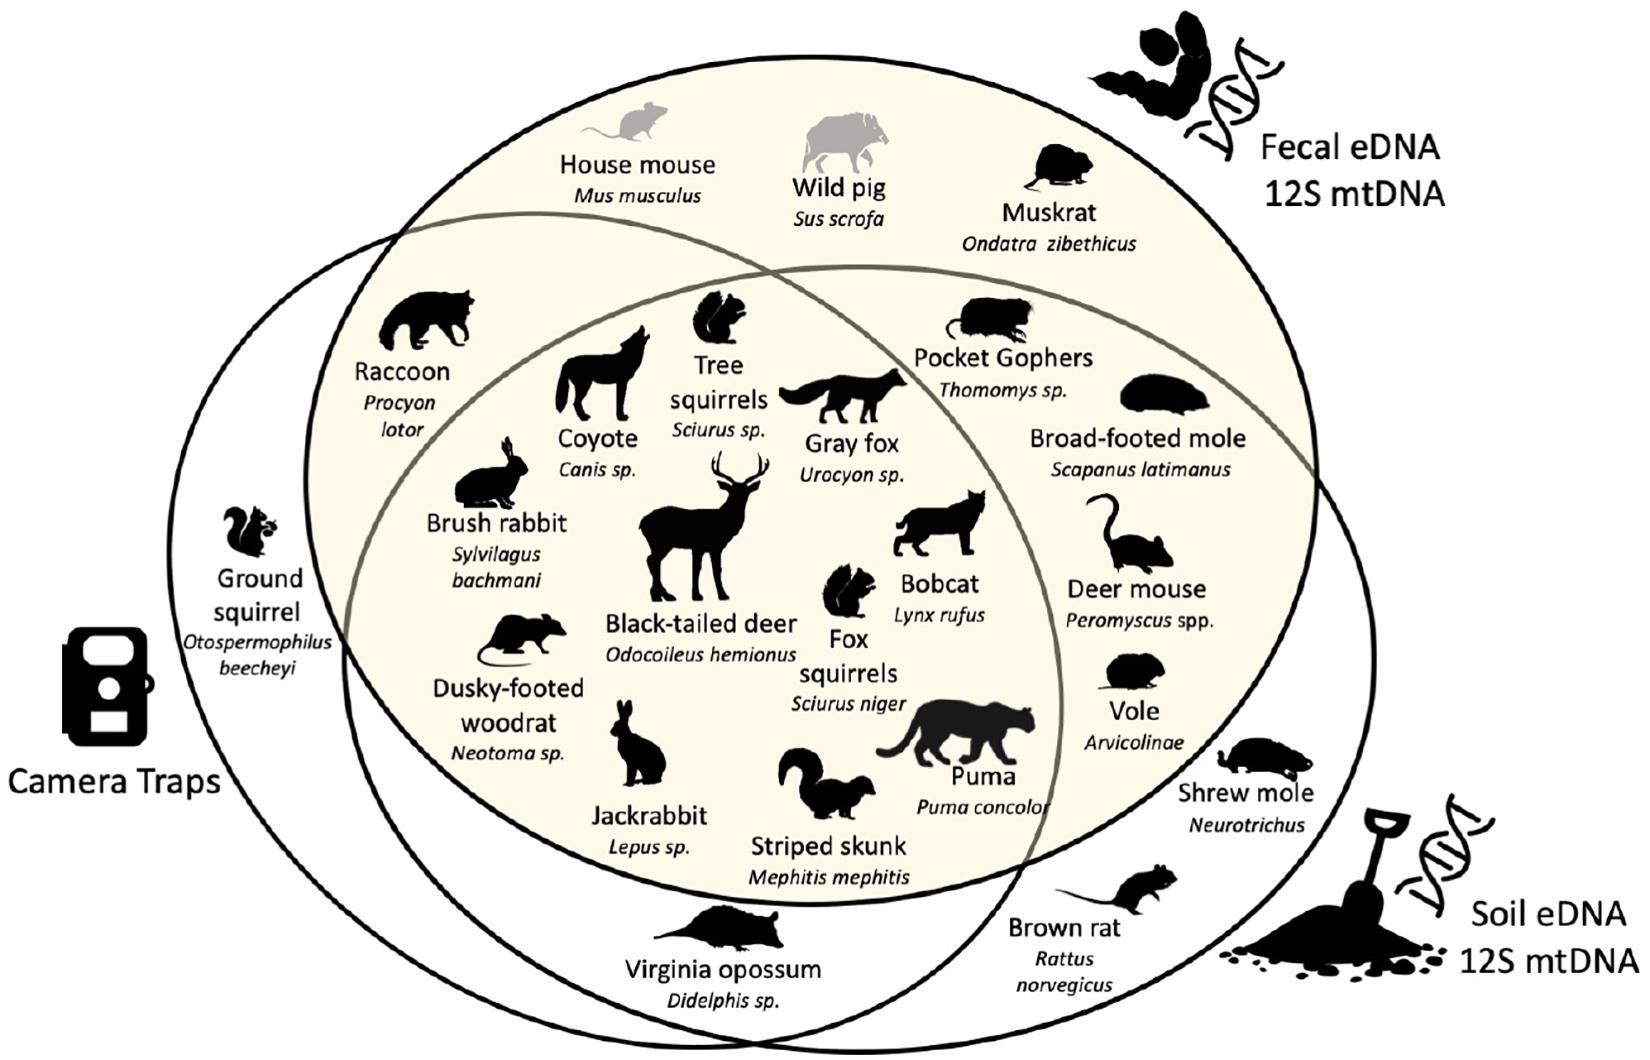
Figure 4. Venn diagram between species recorded by camera traps, and species detected with soil eDNA and fecal eDNA both using the mtDNA 12S metabarcode. Scientific names are given at the maximum rank reached with each metabarcode. Species known to be present in the study area are in black. Species absent from the study area but detected with fecal eDNA are in gray [figure modified from Leempoel et al. (2020)].
The camera trap and soil eDNA survey both captured two species that were not found in the diets of the four predators: opossum (Didelphis virginiana) and the striped skunk (Mephitis mephitis) (Figure 4; Leempoel et al., 2019, 2020). However, one misidentified skunk scat sample was sequenced, which we included in the biodiversity assessment. Ground squirrels (Otospermophilus beecheyi) are abundant in JRBP and captured by the cameras as prey items, however, were undetected in the fecal or soil eDNA. We found that neither this species nor genus were in our 12S database relying on GenBank accessions, and thus could not be detected using our methods. The soil eDNA study documented two small mammal species not found in this study: the native shrew mole (Neurotrichus gibbsii) and non-native brown rat (Rattus norvegicus).
When we include both plant genera and mammal mOTUs, we found that 32% of our mOTUs have not been recorded at JRBP previously, comprising identified plant species (41/77), genera (45/61), family/tribe (13/13) and mammal taxa (17/19) in the diet. These previously unrecord species could be new species to the reserve, or our study species may be going beyond the reserve to forage. It is also possible that detection of these new taxa is caused by poor resolution or errors in the GenBank database, or unknown sequencing errors. To be more conservative with the mOTU identification, we collapsed each plant species to the genus-level, which revealed that 71% (84/119) were on the JRBP plant list.
Discussion
Studies of multitrophic interactions and ecological network analysis are increasingly being used to monitor biodiversity and trophic interactions (Compson et al., 2019), but the fundamental assessment and quantification of these interactions is challenging. We assembled a real-world, high-resolution multitrophic food web (Figure 3), demonstrating that molecular ecological network analyses (MENA) from readily available fecal environmental DNA (eDNA) provides a powerful assessment of an ecosystem. MENA identified the plant and mammal diet composition for six large mammals across three feeding guilds, accurately capturing the biodiversity of the area and characterizing the trophic structure and interaction patterns within the community at an exceptional taxonomic resolution, thereby improving traditional food web analysis and biomonitoring. Although previous studies have validated the use of DNA metabarcoding (Roslin et al., 2019), and created bipartite networks (Kartzinel et al., 2015; Pansu et al., 2019) or even a network of networks (Clare et al., 2019), few studies have yet characterized multitrophic networks with high taxonomic resolution, to characterize the extent of indirect links in a terrestrial system.
Assessing Community Structure and Keystone Species
Food web structure is one mechanism to examine ecosystem organization (Allesina et al., 2009; Thompson et al., 2012; Saint-béat et al., 2015; Monteiro and Faria, 2016) and is key in forecasting the effects of trophic degradation on ecosystem function (Duffy et al., 2007; Estes et al., 2011; Naiman et al., 2012), however, is often underutilized in bioassessments. The structure of the multitrophic network of Jasper Ridge Biological Preserve (JRBP) was found to be significantly more modular and non-nested. This highlights the presence of discrete groups of predators and preys that are strongly connected among each other and less tightly with other groups. The highly modular community indicates that disturbances (e.g., defaunation and local extinctions) would spread more slowly throughout the multiple smaller communities (Tylianakis et al., 2010). The most connected species within each hub or module were, in order of connectance, deer, jackrabbit, gray fox, and coyote. The non-nestedness of this food web indicates low niche overlap among consumers and thus a more stable coexistence (Kondoh et al., 2010).
The centrality metrics we chose identified a list of candidate keystone species that play a functional role in the food web dynamics (Power et al., 1996; Delmas et al., 2019). Studies have shown that the removal of such keystone species or nodes with a high centrality value collapse the network (Allesina et al., 2009), thus should be prioritized for monitoring to avoid cascading extinctions within an ecosystem (Dunne et al., 2002). Within Jasper Ridge, we identified species contributing most to supporting higher trophic levels, such as the oaks, plantains, and fleshy fruit bearing shrubs/trees being fundamental to the herbivore and omnivore community and the deer, jackrabbit, vole, and squirrel are primarily supporting the predator community (Supplementary Table S9). Accurately identifying the diets of these key prey within the system will contribute to the mapping of ecological feedback loops, allowing for quantitative vegetation projections (Bowman et al., 2015). For example, the two focal herbivores of this study were the most frequently consumed prey species, and had the widest niche breadth and most diverse diets. If we focused exclusively on the frequency of functional group occurrence in the diet, we might infer that the three plant groups were consumed equally among both herbivores, however, when considering the mean abundance of reads within the diet, we see a much different conclusion (Figure 1 and Table 3). We find that both species are feeding on a broad variety of plant taxa, the deer are consuming mostly woody vegetation (trees and shrubs) and the jackrabbit more herbaceous plants. Consequently, despite the high overlap of mOTUs consumed by the herbivores, the impact on the vegetation from the removal or introduction of a prey-specific predator (e.g., puma consume mostly deer, whereas gray fox consumes more rabbits) is expected to be markedly different (Figure 2B). With our fine-scale understanding of the diet selection by these herbivores and identified keystone species, we can now better predict the impact fluctuating predator populations may have on this ecosystem.
Patterns of Trophic Interactions
Our MENA framework provides a real-time assessment of empirical species interactions and a technique to quantify and predict the patterns of trophic interactions. Trophic interactions in food webs are, however, often modeled through species traits (McGill et al., 2006; Gravel et al., 2013), for example body mass, where predator and prey body masses scale with each other in natural food webs (Brose et al., 2019). This predator-prey mass ratio (PPMR) is often a driver of the patterns and strength of trophic interactions within a food web, in turn contributing to food web stability (Emmerson and Raffaelli, 2004; Brose, 2010). To be confident in the identified species interactions and trophic patterns, we confirmed that the predator and prey body masses scale with each other in JRBP, adding validity to this method and allowing for stronger predictive modeling in the future (Brose et al., 2019). As expected according to recent results (Allen, 2014), we found the largest predator in the region, the puma, predominantly consumed deer and other large mammals (including coyote), supplemented with small mammals. The smaller mesopredators, bobcat and gray fox, had a similar diet richness to the puma, but primarily consumed small mammals, similar to diets observed nearby in the Santa Cruz Mountains (Table 2 and Figure 2A; Smith et al., 2018).
We captured the same hierarchical patterns through network motifs as the long-term camera trap study, where the natural reoccurrence of puma to JRBP triggered a top-down effect on mesopredators and herbivores (Leempoel et al., 2019). Network motifs are the basic building blocks of communities and can be identified as overrepresented patterns throughout the network. Here we focused on the three most informative patterns: tri-trophic chains, exploitative competition, and omnivory (Milo et al., 2002; Stouffer and Bascompte, 2010; Paulau et al., 2015; Delmas et al., 2019). Within the JRBP food web, tri-trophic chains and exploitative competition patterns were significantly overrepresented compared to chance expectation. These motifs may emerge through the functional importance of these direct and indirect interactions within the assembly of this ecological network. In fact, the prevalence of tri-trophic chain patterns indicate that the removal or reintroduction of top predators would trigger a trophic cascade within this community, directly affecting not only their prey but also, indirectly, the plant communities on which the prey feed. Projecting the long-term consequences of these trophic cascade motifs, we predict that the recent resurgence of puma population may positively affect the woody vegetation, favoring forest regrowth and benefiting the overall ecosystem function.
Exploitative competition predicts indirect links between predators consuming the same resources and may lead to resource exclusion by some of these competitors, results that are concordant with the decrease in coyotes following an increase in pumas in the study area (Leempoel et al., 2019). These predicted network responses are also supported by the significant niche overlap of the omnivorous coyote and gray fox diets and the subsequent predator release of gray fox that occurred at JRBP due to the exclusion of coyote by puma (Leempoel et al., 2019). This suggest the small overlap between the puma and coyote diets is driven by interspecific competition and resource partitioning, while the larger overlap of the bobcat and gray fox diet points to limited competition and a sharing of resources (Gotelli and Graves, 1996). Although omnivory patterns were not significant within this network, among the six mammals we studied, the gray fox was responsible for 58% of omnivore motifs within the food web. Since omnivory is significantly reduced without fox, it is possible that a future change in fox population would shift the prevalence and importance of omnivory within the community. Taken together, our results suggest that the JRBP food web is favoring the persistence of apex predators, despite the consequences of exploitative competition, and is enhancing the regulation of herbivores and the survival of identified key woody and herbaceous vegetation. We can then generate expectations about the impacts of shifting community dynamics, which would provide a framework for management decisions.
Capturing Biodiversity With MENA
This study showcases the value of non-invasive fecal eDNA surveys as a biodiversity assessment tool, highlighted by the depth of biodiversity captured and the greater insight into the ecology of species and their interactions. We identified a rich diversity of plant and mammal mOTUs, classifying 91% to the genus or species level (Supplementary Table S2), allowing for high-resolution assessments of species dietary richness, niche breadth and overlap, and diversity of the community. To the best of our knowledge, this is the first published molecular analysis of gray fox, coyote and black-tail jackrabbit plant diets. Our approach revealed a much wider diet breadth of plants than previously recorded for gray fox (107 mOTUs), jackrabbit (97) and, to a lesser extent, coyote (24). Micro histological identification techniques used to determine fox diet found only 4–20 different plant species (Wilson and Thomas, 1999; Cunningham et al., 2006), whereas we identified 61 different genera, tripling previous estimates. We identified 65 plant genera within the black-tailed jackrabbit diet at this site, while previous morphological studies only identified 14–32 plant species across numerous sites and habitats (Fagerstone et al., 1980; Wansi et al., 1992).
We compared MENA to the plant and mammal species list of Jasper Ridge, and two concurrently run surveys, soil eDNA and camera traps (Leempoel et al., 2020), to determine its effectiveness. Although this is just a subset of the larger biodiversity network in this protected area (e.g., other mammals, microorganisms, birds, pollinators), fecal eDNA detected a greater number of mammal species over a shorter period of time than the dense array of camera traps (4 cameras/km2) and a greater number of species than the soil eDNA (Figure 4). Two species, the possum and skunk, were not found in the fecal eDNA sampled diets, although we did collect a skunk scat (initially misidentified as gray fox) and so included skunk in the biodiversity assessment. Puma have previously been identified consuming both skunk and possum on camera traps, and the populations of both have declined since puma returned (Leempoel et al., 2019). The low abundances of these species could explain their absence from scat samples over the scat collection period. Fecal eDNA identified a significant proportion of the known small mammal community, which were not detected by the camera trap survey. Camera traps are set up to survey either medium to large mammals or small mammal communities, but seldom both. Accurate identification from images is also challenging (De Bondi et al., 2010; Meek and Pittet, 2012; Meek et al., 2013), and consequently, small mammals are often left out of camera trap biodiversity studies, or are poorly distinguished, yet they are important indicators of ecosystem health (Rowe and Terry, 2014). The soil eDNA detected the same small mammals as fecal eDNA, however, did not detect some of the larger mammals that occur at low occupancy in JRBP, including raccoon and muskrat. Also notable, the positive correlation between scats and camera-trap images suggests that scat collection may also be used as an indicator of relative abundance for these species, similar to previous studies on Iberian lynx (Garrote et al., 2014) and jaguar abundance (Sollmann et al., 2013).
Fecal eDNA provides a perspective of a system through a species lens, rather than that of a predefined human boundary – often used to delimit conventional surveys or assessments. For example, the diet of plants is representative throughout a herbivores range, rather than just that recorded in JRBP (29% of mOTUs genera were previously unrecorded in JRBP). MENA can also be deployed for the early detection and monitoring of non-native species that are occurring within the animal’s range (e.g., two prey items never before recoded within JRBP). For example, the presence of feral pigs (Sus scrofa) in the puma diet is an early sign that this highly invasive and destructive species [$1.5 billion in economic damage to United States agriculture and environment annually (Finzel and Baldwin, 2015]) is moving into the region, as the nearest known records are 15 km + from the study area.
Current Limitations of MENA
Molecular biodiversity assessments can only be as good as the reference database on which they rely for species identification. A good example of this is ground squirrels (Otospermophilus beecheyi), an abundant species in JRBP that we know is frequently preyed upon from photographic evidence. Ground squirrels were not detected in the diet of our four predator species and the concurrent eDNA soil study because it was not in our 12S mtDNA database. This highlights the importance of collaborative initiatives, such as The Bar Code of Life data system (Ratnasingham and Hebert, 2007), to increase reference library coverage and database capacities. Only with a comprehensive database can we thoroughly assess the biodiversity of an area using a metabarcoding approach, especially in regions that have been historically understudied (Bush et al., 2019).
Due to the sensitivity of eDNA, it is important to be aware of confounding factors. For example, we identified bobcat and gray fox DNA in many of each other’s scat samples. We have evidence from camera traps that these species countermark one another (urinate and defecate on scats from the other species), and it is highly unlikely that they are consuming each other. Therefore, it is important to know the behavioral ecology of a study species, to rule out possible cross-contaminations, while at the same time exploring the possibility of novel and poorly recognized interactions. A second example is wind-dispersed plant spores that could seasonally contaminate scat samples. We considered possible contamination from Deodar Cedar (Cedrus deodar) pollen as it is released in the autumn (September – October) (Sharma and Khanduri, 2012). However, Deodar occurred in less than half of the samples from species consuming plants. It is possible they were consuming the seed-producing cones that were readily available. A third consideration is that the prey’s diet (via the gut contents) could be represented in a predator’s molecular diet analysis. It is not yet feasible to detect this, however, we did not have positive PCR results for plant DNA in the majority of the predator scats, possibly due to the larger fragment size (200–387 bp) of the ITS2 amplicon region that we used (Moorhouse-Gann et al., 2018). Regardless, as a bioassessment of the region, the identified plants were either consumed by the omnivores directly or indirectly and thus still part of the functional system. Studies reviewing these and other limitations of these techniques should be considered prior to bioassessments (Clare, 2014; Alberdi et al., 2018; Pawlowski et al., 2018; Delmas et al., 2019; McGee et al., 2019; Ruppert et al., 2019; Zinger et al., 2019).
Conclusion
We have demonstrated that MENA is a promising tool for monitoring biodiversity, unveiling and understanding multitrophic interactions and community structure, and identifying key and vulnerable species within a terrestrial system. Only when we know what species are present and understand their function in the ecosystem, will we be equipped to protect and holistically manage these systems. The consequences of ecological network rewiring are drastic (Olivier et al., 2019), and the current rapidity of changes to ecological networks makes it difficult to detect and respond. By repeating MENA, temporal changes can be quickly identified and tracked. For example, the impact of wildlife reintroductions or changes in wildlife abundance and occupancy can be tracked and assessed through MENA and fed back into adaptive management plans to monitor for predicted impacts (Pires, 2017). Here we have explored MENA using a few mammal species scats on three trophic levels, but future assessments could drastically broaden the picture by including more vertebrates, invertebrates, and interaction types that also include pathogens and parasites. The non-invasive and quick turn-around of MENA, along with the decreasing costs of HTS, will accelerate its implementation at local and global scales (Ruppert et al., 2019).
Data Availability Statement
The datasets presented in this study can be found in online repositories. The names of the repository/repositories and accession number(s) can be found in the article/Supplementary Material.
Author Contributions
JM designed the study, performed the field and lab work, and wrote the first draft. JM and KL performed the bioinformatics related to DNA metabarcoding. GL and JM performed the network analysis. EH designed and supervised the research. GL, KL, and EH contributed to writing and editing the manuscript. All authors contributed to the article and approved the submitted version.
Conflict of Interest
The authors declare that the research was conducted in the absence of any commercial or financial relationships that could be construed as a potential conflict of interest.
Funding
JM acknowledges support from the Philippe S. Cohen Graduate Fellowship and JRBP Mellon grant. KL acknowledges support from the Swiss National Science Foundation Early Post doc Mobility grant (P2ELP3_175075), JRBP Mellon grant. GL acknowledges support from the Swiss National Science Foundation (P2ZHP3_187938). The work was made possible by funding from the HHMI Professorship (EH).
Acknowledgments
The manuscript was greatly improved after reviews by Simon Morgan, Allison Stegner, and Katie Solari. We thank Rodolfo Dirzo for initiating the long-term camera trap array and inspiring the continuous research, and for invaluable advising and edits. We thank Nona Chiariello, Trevor Herbert, and the Docents of Jasper Ridge Biological Preserve for their contributions to the tagging of camera trap images, scat collection, plant identifications, and historical information.
Supplementary Material
The Supplementary Material for this article can be found online at: https://www.frontiersin.org/articles/10.3389/fevo.2020.588430/full#supplementary-material
Footnotes
- ^ http://ftp.ebi.ac.uk/pub/databases/embl/release/std/
- ^ http://grayentsminger.com/ecosim.htm
- ^ http://gephi.org
References
Abdala-Roberts, L., Puentes, A., Finke, D. L., Marquis, R. J., Montserrat, M., Poelman, E. H., et al. (2019). Tri-trophic interactions: bridging species, communities and ecosystems. Ecol. Lett. 22, 2151–2167. doi: 10.1111/ele.13392
Alberdi, A., Aizpurua, O., Gilbert, M. T. P., and Bohmann, K. (2018). Scrutinizing key steps for reliable metabarcoding of environmental samples. Methods Ecol. Evol. 9, 134–147. doi: 10.1111/2041-210X.12849
Allen, M. L. (2014). The Ecology and Behaviour of Pumas (Puma Concolor) in Northern California, U.S.A. Ph.D. Diss, Victoria University of Wellington, Wellington
Allesina, S., Bodini, A., and Pascual, M. (2009). Functional links and robustness in food webs. Philos. Trans. R. Soc. B Biol. Sci. 364, 1701–1709. doi: 10.1098/rstb.2008.0214
Allesina, S., and Pascual, M. (2009). Googling food webs: can an eigenvector measure species’ importance for coextinctions? PLoS Comput. Biol. 5:e1000494. doi: 10.1371/journal.pcbi.1000494
Baiser, B., Buckley, H. L., Gotelli, N. J., and Ellison, A. M. (2012). Predicting food-web structure with metacommunity models. Oikos 122, 001–015. doi: 10.2307/41937696
Bartley, T. J., McCann, K. S., Bieg, C., Cazelles, K., Granados, M., Guzzo, M. M., et al. (2019). Food web rewiring in a changing world. Nat. Ecol. Evol. 3, 345–354. doi: 10.1038/s41559-018-0772-3
Bastian, M., and Heymann, S. (2009). “Gephi: an open source software for exploring and manipulating networks,” in Proceedings of the Third International Conference on Weblogs and Social Media, ICWSM 2009, San Jose, CA, 4–6. doi: 10.13140/2.1.1341.1520
Bastolla, U., Fortuna, M. A., Pascual-García, A., Ferrera, A., Luque, B., and Bascompte, J. (2009). The architecture of mutualistic networks minimizes competition and increases biodiversity. Nature 458, 1018–1020. doi: 10.1038/nature07950
Blaxter, M., Mann, J., Chapman, T., Thomas, F., Whitton, C., Floyd, R., et al. (2005). Defining operational taxonomic units using DNA barcode data. Philos. Trans. R. Soc. B Biol. Sci. 360, 1935–1943. doi: 10.1098/rstb.2005.1725
Bowman, D. M. J. S., Perry, G. L. W., and Marston, J. B. (2015). Feedbacks and landscape-level vegetation dynamics. Trends Ecol. Evol. 30, 255–260. doi: 10.1016/j.tree.2015.03.005
Boyer, F., Mercier, C., Bonin, A., Le Bras, Y., Taberlet, P., and Coissac, E. (2016). obitools: a unix-inspired software package for DNA metabarcoding. Mol. Ecol. Resour. 16, 176–182. doi: 10.1111/1755-0998.12428
Brose, U. (2010). Body-mass constraints on foraging behaviour determine population and food-web dynamics. Funct. Ecol. 24, 28–34. doi: 10.1111/j.1365-2435.2009.01618.x
Brose, U., Archambault, P., Barnes, A. D., Bersier, L. F., Boy, T., Canning-Clode, J., et al. (2019). Predator traits determine food-web architecture across ecosystems. Nat. Ecol. Evol. 3, 919–927. doi: 10.1038/s41559-019-0899-x
Brown, D. S., Burger, R., Cole, N., Vencatasamy, D., Clare, E. L., Montazam, A., et al. (2014). Dietary competition between the alien Asian Musk Shrew (Suncus murinus) and a re-introduced population of Telfair’s Skink (Leiolopisma telfairii). Mol. Ecol. 23, 3695–3705. doi: 10.1111/mec.12445
Bush, A., Compson, Z. G., Monk, W. A., Porter, T. M., Steeves, R., Emilson, E., et al. (2019). Studying ecosystems With DNA metabarcoding: lessons from biomonitoring of aquatic macroinvertebrates. Front. Ecol. Evol. 7:434. doi: 10.3389/fevo.2019.00434
Casey, J. M., Meyer, C. P., Morat, F., Brandl, S. J., Planes, S., and Parravicini, V. (2019). Reconstructing hyperdiverse food webs: gut content metabarcoding as a tool to disentangle trophic interactions on coral reefs. Methods Ecol. Evol. 10, 1157–1170. doi: 10.1111/2041-210X.13206
Clare, E. L. (2014). Molecular detection of trophic interactions: emerging trends, distinct advantages, significant considerations and conservation applications. Evol. Appl. 7, 1144–1157. doi: 10.1111/eva.12225
Clare, E. L., Fazekas, A. J., Ivanova, N. V., Floyd, R. M., Hebert, P. D. N., Adams, A. M., et al. (2019). Approaches to integrating genetic data into ecological networks. Mol. Ecol. 28, 503–519. doi: 10.1111/mec.14941
Compson, Z. G., Monk, W. A., Hayden, B., Bush, A., O’Malley, Z., Hajibabaei, M., et al. (2019). Network-based biomonitoring: exploring freshwater food webs with stable isotope analysis and DNA metabarcoding. Front. Ecol. Evol. 7:395. doi: 10.3389/FEVO.2019.00395
Coverdale, T. C., Kartzinel, T. R., Grabowski, K. L., Shriver, R. K., Hassan, A. A., Goheen, J. R., et al. (2016). Elephants in the understory: opposing direct and indirect effects of consumption and ecosystem engineering by megaherbivores. Ecology 97, 3219–3230. doi: 10.1002/ecy.1557
Csardi, G., and Nepusz, T. (2006). The igraph software package for complex network research. Inter J. Complex Sys. 1695, 1–9.
Cunningham, S. C., Kirkendall, L., and Ballard, W. (2006). gray fox and coyote abundance and diet responses after a wildfire in central arizona. West. North Am. Nat. 66, 169–180. doi: 10.3398/1527-0904(2006)66[169:gfacaa]2.0.co;2
Czernik, M., Taberlet, P., Świsłocka, M., Czajkowska, M., Duda, N., and Ratkiewicz, M. (2013). Fast and efficient DNA-based method for winter diet analysis from stools of three cervids: moose, red deer, and roe deer. Acta Theriol. 58, 379–386. doi: 10.1007/s13364-013-0146-9
Daam, M. A., Teixeira, H., Lillebø, A. I., and Nogueira, A. J. A. (2019). Establishing causal links between aquatic biodiversity and ecosystem functioning: status and research needs. Sci. Total Environ. 656, 1145–1156. doi: 10.1016/j.scitotenv.2018.11.413
Dale, M. R. T., and Fortin, M.-J. (2010). From graphs to spatial graphs. Annu. Rev. Ecol. Evol. Syst. 41, 21–38. doi: 10.1146/annurev-ecolsys-102209-144718
Deagle, B. E., Thomas, A. C., McInnes, J. C., Clarke, L. J., Vesterinen, E. J., Clare, E. L., et al. (2019). Counting with DNA in metabarcoding studies: how should we convert sequence reads to dietary data? Mol. Ecol. 28, 391–406. doi: 10.1111/mec.14734
De Barba, M., Miquel, C., Boyer, F., Mercier, C., Rioux, D., Coissac, E., et al. (2014). DNA metabarcoding multiplexing and validation of data accuracy for diet assessment: application to omnivorous diet. Mol. Ecol. Resour. 14, 306–323. doi: 10.1111/1755-0998.12188
De Bondi, N., White, J. G., Stevens, M., and Cooke, R. (2010). A comparison of the effectiveness of camera trapping and live trapping for sampling terrestrial small-mammal communities. Wildl. Res. 37, 456–465. doi: 10.1071/WR10046
Deiner, K., Bik, H. M., Mächler, E., Seymour, M., Lacoursière-Roussel, A., Altermatt, F., et al. (2017). Environmental DNA metabarcoding: transforming how we survey animal and plant communities. Mol. Ecol. 26, 5872–5895. doi: 10.1111/mec.14350
Delmas, E., Besson, M., Brice, M.-H., and Burkle, L. A. (2017). Analyzing ecological networks of species in- teractions. bioRxiv [Preprint]. doi: 10.1101/112540
Delmas, E., Besson, M., Brice, M. H., Burkle, L. A., Dalla Riva, G. V., Fortin, M. J., et al. (2019). Analysing ecological networks of species interactions. Biol. Rev. 94, 16–36. doi: 10.1111/brv.12433
Deng, Y., Jiang, Y. H., Yang, Y., He, Z., Luo, F., and Zhou, J. (2012). Molecular ecological network analyses. BMC Bioinformatics 13:113. doi: 10.1186/1471-2105-13-113
Derocles, S. A. P., Bohan, D. A., Dumbrell, A. J., Kitson, J. J. N., Massol, F., Pauvert, C., et al. (2018). Biomonitoring for the 21st Century: integrating next-generation sequencing into ecological network analysis. Adv. Ecol. Res. 58, 1–62. doi: 10.1016/bs.aecr.2017.12.001
Dirzo, R., Young, H. S., Galetti, M., Ceballos, G., Isaac, N. J. B., and Collen, B. (2014). Defaunation in the antrhopocene. Science 401, 401–406. doi: 10.1126/science.1251817
Doulcier, G., Guimera, R., and Stouffer, D. (2016). Fast Network Modularity and Roles Computation by Simulated. R Packag. Version 0.2.4. doi: 10.1038/nature03288
Duffy, J. E., Cardinale, B. J., France, K. E., McIntyre, P. B., Thébault, E., and Loreau, M. (2007). The functional role of biodiversity in ecosystems: incorporating trophic complexity. Ecol. Lett. 10, 522–538. doi: 10.1111/j.1461-0248.2007.01037.x
Dunne, J. A., Williams, R. J., and Martinez, N. D. (2002). Network structure and biodiversity loss in food webs: robustness increase with connectance. Ecol. Lett. 5, 558–567. doi: 10.1046/j.1461-0248.2002.00354.x
Eisenhauer, N., Schielzeth, H., Barnes, A. D., Barry, K., Brose, U., Bruelheide, H., et al. (2019). A multitrophic perspective on biodiversity–ecosystem functioning research. Adv. Ecol. Res. 61, 1–48. doi: 10.1016/bs.aecr.2019.06.001
Elhesha, R., Kahveci, T., and Baiser, B. (2017). Motif centrality in food web networks. J. Complex Netw. 5, 641–664. doi: 10.1093/comnet/cnw032
Emmerson, M. C., and Raffaelli, D. (2004). Predator-prey body size, interaction strength and the stability of a real food web. J. Anim. Ecol. 73, 399–409. doi: 10.1111/j.0021-8790.2004.00818.x
Erickson, D. L., Reed, E., Ramachandran, P., Bourg, N. A., McShea, W. J., and Ottesen, A. (2017). Reconstructing a herbivore’s diet using a novel rbcL DNA mini-barcode for plants. AoB Plants 9:lx015. doi: 10.1093/aobpla/plx015
Estes, J., Terborgh, J., and Brashares, J. (2011). Trophic downgrading of planet Earth. Science 333, 301–306. doi: 10.1126/science.1205106
Evans, D. M., Kitson, J. J. N., Lunt, D. H., Straw, N. A., and Pocock, M. J. O. (2016). Merging DNA metabarcoding and ecological network analysis to understand and build resilient terrestrial ecosystems. Funct. Ecol. 30, 1904–1916. doi: 10.1111/1365-2435.12659
Fagerstone, K. A., Lavoie, G. K., and Griffith, R. E. (1980). Black-tailed jackrabbit diet and density on rangeland and near agricultural crops. J. Range Manag. 33, 229–233. doi: 10.2307/3898292
Ficetola, G. F., Coissac, E., Zundel, S., Riaz, T., Shehzad, W., Bessière, J., et al. (2010). An In silico approach for the evaluation of DNA barcodes. BMC Genomics. 11:434. doi: 10.1186/1471-2164-11-434
Garrote, G., de Ayala, R. P., and Tellería, J. L. (2014). A comparison of scat counts and camera-trapping as means of assessing Iberian lynx abundance. Eur. J. Wildl. Res. 60, 885–889. doi: 10.1007/s10344-014-0855-7
Gaston, K. J., Blackburn, T. M., and Lawton, J. H. (1997). Interspecific abundance-range size relationships: an appraisal of mechanisms. J. Anim. Ecol. 66, 579–601. doi: 10.2307/5951
Giguet-Covex, C., Pansu, J., Arnaud, F., Rey, P. J., Griggo, C., Gielly, L., et al. (2014). Long livestock farming history and human landscape shaping revealed by lake sediment DNA. Nat. Commun. 5:3211. doi: 10.1038/ncomms4211
Giling, D. P., Ebeling, A., Eisenhauer, N., Meyer, S. T., Roscher, C., Rzanny, M., et al. (2019). Plant diversity alters the representation of motifs in food webs. Nat. Commun. 10, 1–7. doi: 10.1038/s41467-019-08856-0
Gonzalez, A., Rayfield, B., and Lindo, Z. (2011). The disentangled bank: how loss of habitat fragments and disassembles ecological networks. Am. J. Bot. 98, 503–516. doi: 10.3732/ajb.1000424
Gotelli, N., Hart, E., Ellison, A., and Maintainer (2015). PFackage “EcoSimR”: Null Model Analysis for Ecological Data. R Packag.
Gotelli, N. J., and Colwell, R. K. (2001). Quantifying biodiversity: procedures and pitfalls in the measurement and comparison of species richness. Ecol. Lett. 4, 379–391. doi: 10.1046/j.1461-0248.2001.00230.x
Gotelli, N. J., and Graves, G. R. (1996). Null Models in Ecology. Washington, D.C: Smithsonian Institution Press, doi: 10.1086/284619
Gravel, D., Poisot, T., Albouy, C., Velez, L., and Mouillot, D. (2013). Inferring food web structure from predator-prey body size relationships. Methods Ecol. Evol. 4, 1083–1090. doi: 10.1111/2041-210X.12103
Iwanowicz, D. D., Vandergast, A. G., Cornman, R. S., Adams, C. R., Kohn, J. R., Fisher, R. N., et al. (2016). Metabarcoding of fecal samples to determine herbivore diets: a case study of the endangered Pacific pocket mouse. PLoS One 11:e0165366. doi: 10.1371/journal.pone.0165366
Ji, Y., Ashton, L., Pedley, S. M., Edwards, D. P., Tang, Y., Nakamura, A., et al. (2013). Reliable, verifiable and efficient monitoring of biodiversity via metabarcoding. Ecol. Lett. 16, 1245–1257. doi: 10.1111/ele.12162
Jonsson, B. G. (2001). A null model for randomization tests of nestedness in species assemblages. Oecologia 127, 309–313. doi: 10.1007/s004420000601
Jordan, F., and Scheuring, I. (2004). Network ecology: topological constraint on ecosystem dynamics. Phys. Life Rev. 1, 139–172. doi: 10.1016/j.plrev.2004.08.001
JRBP (2019). Jasper Ridge Biological Preserve Mammal Species List. Available online at: https://jrbp.stanford.edu/search/site/mammal list (accessed February 10, 2019).
Kartzinel, T. R., Chen, P. A., Coverdale, T. C., Erickson, D. L., Kress, W. J., Kuzmina, M. L., et al. (2015). DNA metabarcoding illuminates dietary niche partitioning by African large herbivores. Proc. Natl. Acad. Sci. U.S.A. 112, 8019–8024. doi: 10.1073/pnas.1503283112
Kéfi, S., Miele, V., Wieters, E. A., Navarrete, S. A., and Berlow, E. L. (2016). How structured is the entangled bank? The surprisingly simple organization of multiplex ecological networks leads to increased persistence and resilience. PLoS Biol. 14:e1002527. doi: 10.1371/journal.pbio.1002527
Kohn, M. H., York, E. C., Kamradt, D. A., Haught, G., Sauvajot, R. M., and Wayne, R. K. (1999). Estimating population size by genotyping faeces. Proc. R. Soc. B Biol. Sci. 266, 657–663. doi: 10.1098/rspb.1999.0686
Kondoh, M., Kato, S., and Sakato, Y. (2010). Food webs are built up with nested subwebs. Ecology 91, 3123–3130. doi: 10.2307/20788145
Landi, P., Minoarivelo, H. O., Brännström, Å, Hui, C., and Dieckmann, U. (2018). Complexity and stability of ecological networks: a review of the theory. Popul. Ecol. 60, 319–345. doi: 10.1007/s10144-018-0628-3
Leempoel, K., Hebert, T., and Hadly, E. A. (2020). A comparison of eDNA to camera trapping for assessment of terrestrial mammal diversity. Proc. R. Soc. B Biol. Sci. 287:20192353. doi: 10.1098/rspb.2019.2353
Leempoel, K., Meyer, J., Hebert, T., Nova, N., and Hadly, E. A. (2019). Return of an apex predator to a suburban preserve triggers a rapid trophic cascade. bioRxiv [Preprint]. doi: 10.1101/564294
Losapio, G., Fortuna, M. A., Bascompte, J., Schmid, B., Michalet, R., Neumeyer, R., et al. (2019). Plant interactions shape pollination networks via nonadditive effects. Ecology 100, 1–9. doi: 10.1002/ecy.2619
Losapio, G., and Schöb, C. (2017). Resistance of plant–plant networks to biodiversity loss and secondary extinctions following simulated environmental changes. Funct. Ecol. 31, 1145–1152. doi: 10.1111/1365-2435.12839
Lupatini, M., Suleiman, A. K. A., Jacques, R. J. S., Antoniolli, Z. I., de Siqueira Ferreira, A., Kuramae, E. E., et al. (2014). Network topology reveals high connectance levels and few key microbial genera within soils. Front. Environ. Sci. 2:10. doi: 10.3389/fenvs.2014.00010
Lyngdoh, S., Shrotriya, S., Goyal, S. P., Clements, H., Hayward, M. W., and Habib, B. (2014). Prey preferences of the snow leopard (Panthera uncia): regional diet specificity holds global significance for conservation. PLoS One 9:e0088349. doi: 10.1371/journal.pone.0088349
Ma, J., Lu, Y., Chen, F., Li, X., Xiao, D., and Wang, H. (2020). Molecular ecological network complexity drives stand resilience of soil bacteria to mining disturbances among typical damaged ecosystems in China. Microorganisms 8:433. doi: 10.3390/microorganisms8030433
Makiola, A., Compson, Z. G., Baird, D. J., Barnes, M. A., Boerlijst, S. P., Bouchez, A., et al. (2020). Key questions for next-generation biomonitoring. Front. Environ. Sci. 7:197. doi: 10.3389/fenvs.2019.00197
Martin, M. (2011). Cutadapt removes adapter sequences from high-throughput sequencing reads. EMBnet.journal. doi: 10.14806/ej.17.1.200
McGee, K. M., Robinson, C. V., and Hajibabaei, M. (2019). Gaps in DNA-based biomonitoring across the globe. Front. Ecol. Evol. 7:337. doi: 10.3389/fevo.2019.00337
McGill, B. J., Enquist, B. J., Weiher, E., and Westoby, M. (2006). Rebuilding community ecology from functional traits. Trends Ecol. Evol. 21, 178–185. doi: 10.1016/j.tree.2006.02.002
Meek, P. D., and Pittet, A. (2012). User-based design specifications for the ultimate camera trap for wildlife research. Wildl. Res. 39, 649–660. doi: 10.1071/WR12138
Meek, P. D., Vernes, K., and Falzon, G. (2013). On the reliability of expert identification of small-medium sized mammals from camera trap photos. Wildl. Biol. Pract. 9, 1–19. doi: 10.2461/wbp.2013.9.4
Milo, R., Shen-Orr, S., Itzkovitz, S., and Kashtan, N. (2002). Network motif: simple building blocks of complex networks. Science 298, 824–827. doi: 10.1126/science.298.5594.824
Monteiro, A. B., and Faria, L. D. B. (2016). The interplay between population stability and food-web topology predicts the occurrence of motifs in complex food-webs. J. Theor. Biol. 409, 165–171. doi: 10.1016/j.jtbi.2016.09.006
Moore, J. C., de Ruiter, P. C., McCann, K. S., and Wolters, V. (2017). in Adaptive Food Webs: STABILITY and Transitions of Real and Model Ecosystems, eds J. C. Moore, P. C. de Ruiter, K. S. McCann, and V. Wolters (Cambridge: Cambridge University Press), doi: 10.1017/9781316871867
Moorhouse-Gann, R. J., Dunn, J. C., De Vere, N., Goder, M., Cole, N., Hipperson, H., et al. (2018). New universal ITS2 primers for high-resolution herbivory analyses using DNA metabarcoding in both tropical and temperate zones. Sci. Rep. 8, 1–15. doi: 10.1038/s41598-018-26648-2
Munguía, M., Trejo, I., González-Salazar, C., and Pérez-Maqueo, O. (2016). Human impact gradient on mammalian biodiversity. Glob. Ecol. Conserv. 6, 79–92. doi: 10.1016/j.gecco.2016.01.004
Murphy, M. A., Kendall, K. C., Robinson, A., and Waits, L. P. (2007). The impact of time and field conditions on brown bear (Ursus arctos) faecal DNA amplification. Conserv. Genet. 8, 1219–1224. doi: 10.1007/s10592-006-9264-0
Naiman, R. J., Alldredge, J. R., Beauchamp, D. A., Bisson, P. A., Congleton, J., Henny, C. J., et al. (2012). Developing a broader scientific foundation for river restoration: columbia river food webs. Proc. Natl. Acad. Sci. U.S.A. 109, 21201–21207. doi: 10.1073/pnas.1213408109
Nakazawa, T. (2017). Individual interaction data are required in community ecology: a conceptual review of the predator-prey mass ratio and more. Ecol. Res. 32, 5–12. doi: 10.1007/s11284-016-1408-1
Oakmead Herbarium (2019). Introdcution to the Vascular Palnt List, Oakmead Herbarium. Available online at: https://jrbp.stanford.edu/content/introduction-vascular-plant-list-oakmead-herbarium (accessed February 10, 2019).
Oksanen, J., Blanchet, F. G., Friendly, M., Kindt, R., Legendre, P., Mcglinn, D., et al. (2019). Package “vegan” Title Community Ecology Package. Community Ecol. Packag. 2, 1–297. Available online at: https://cran.r-project.org/web/packages/vegan/vegan.pdf (accessed August 15, 2019).
Olivier, P., Frelat, R., Bonsdorff, E., Kortsch, S., Kröncke, I., Möllmann, C., et al. (2019). Exploring the temporal variability of a food web using long-term biomonitoring data. Ecography 42, 2107–2121. doi: 10.1111/ecog.04461
Pansu, J., Guyton, J. A., Potter, A. B., Atkins, J. L., Daskin, J. H., Wursten, B., et al. (2019). Trophic ecology of large herbivores in a reassembling African ecosystem. J. Ecol. 107, 1355–1376. doi: 10.1111/1365-2745.13113
Paulau, P. V., Feenders, C., and Blasius, B. (2015). Motif analysis in directed ordered networks and applications to food webs. Sci. Rep. 5, 12–15. doi: 10.1038/srep11926
Pawlowski, J., Kelly-Quinn, M., Altermatt, F., Apothéloz-Perret-Gentil, L., Beja, P., Boggero, A., et al. (2018). The future of biotic indices in the ecogenomic era: integrating (e)DNA metabarcoding in biological assessment of aquatic ecosystems. Sci. Total Environ. 637–638, 1295–1310. doi: 10.1016/j.scitotenv.2018.05.002
Perea, R., López-Sánchez, A., and Dirzo, R. (2017). Differential tree recruitment in California oak savannas: are evergreen oaks replacing deciduous oaks? For. Ecol. Manag. 399, 1–8. doi: 10.1016/j.foreco.2017.05.018
Pianka, E. R. (1973). The structure of lizard communities. Annu. Rev. Ecol. Syst. 4, 53–74. doi: 10.1146/annurev.es.04.110173.000413
Pires, M. M. (2017). Rewilding ecological communities and rewiring ecological networks. Perspect. Ecol. Conserv. 15, 257–265. doi: 10.1016/j.pecon.2017.09.003
Pompanon, F., Deagle, B. E., Symondson, W. O. C., Brown, D. S., Jarman, S. N., and Taberlet, P. (2012). Who is eating what: diet assessment using next generation sequencing. Mol. Ecol. 21, 1931–1950. doi: 10.1111/j.1365-294X.2011.05403.x
Power, M. E., Tilman, D., Estes, J. A., Menge, B. A., Bond, W. J., Mills, L. S., et al. (1996). Challenges in the Quest for Keystones. Bioscience 46, 609–620. doi: 10.2307/1312990
R Core Team (2020). R: A Language and Environment for Statistical Computing. Vienna, Austria: R Foundations for Statistical Computing. Available online at: https://www.r-project.org/ (accessed May 26, 2020).
Ratnasingham, S., and Hebert, P. D. N. (2007). The Barcode of Life Data System. Mol. Ecol. Notes 7, 355–364. doi: 10.1111/j.1471-8286.2006.01678.x
Razgour, O., Clare, E. L., Zeale, M. R. K., Hanmer, J., Schnell, I. B., Rasmussen, M., et al. (2011). High-throughput sequencing offers insight into mechanisms of resource partitioning in cryptic bat species. Ecol. Evol. 1, 556–570. doi: 10.1002/ece3.49
Riccioni, G., Stagioni, M., Piccinetti, C., and Libralato, S. (2018). A metabarcoding approach for the feeding habits of European hake in the Adriatic Sea. Ecol. Evol. 8, 10435–10447. doi: 10.1002/ece3.4500
Robeson, M. S., Khanipov, K., Golovko, G., Wisely, S. M., White, M. D., Bodenchuck, M., et al. (2018). Assessing the utility of metabarcoding for diet analyses of the omnivorous wild pig (Sus scrofa). Ecol. Evol. 8, 185–196. doi: 10.1002/ece3.3638
Roslin, T., Traugott, M., Jonsson, M., Stone, G. N., Creer, S., and Symondson, W. O. C. (2019). Introduction: special issue on species interactions, ecological networks and community dynamics – Untangling the entangled bank using molecular techniques. Mol. Ecol. 28, 157–164. doi: 10.1111/mec.14974
Rowe, R. J., and Terry, R. C. (2014). Small mammal responses to environmental change: integrating past and present dynamics. J. Mammal. 95, 1157–1174. doi: 10.1644/13-MAMM-S-079
Ruell, E. W., Riley, S. P. D., Douglas, M. R., Pollinger, J. P., and Crooks, K. R. (2009). Estimating bobcat population sizes and densities in a fragmented urban landscape using noninvasive capture–recapture sampling. J. Mammal. 90, 129–135. doi: 10.1644/07-MAMM-A-249.1
Ruppert, K. M., Kline, R. J., and Rahman, M. S. (2019). Past, present, and future perspectives of environmental DNA (eDNA) metabarcoding: a systematic review in methods, monitoring, and applications of global eDNA. Glob. Ecol. Conserv. 17:e00547. doi: 10.1016/j.gecco.2019.e00547
Saint-béat, B., Baird, D., Saint-béat, B., Baird, D., Asmus, H., Asmus, R., et al. (2015). Trophic networks: how do theories link ecosystem structure and functioning to stability properties? A review Trophic networks: how do theories link ecosystem structure and functioning to stability properties? A review. Ecol. Indic. 52, 458–471. doi: 10.1016/j.ecolind.2014.12.017
Sharma, C. M., and Khanduri, V. P. (2012). Pollen cone characteristics, pollen yield and pollen-mediated gene flow in Cedrus deodara. Curr. Sci. 102, 394–397.
Shehzad, W., Riaz, T., Nawaz, M. A., Miquel, C., Poillot, C., Shah, S. A., et al. (2012). Carnivore diet analysis based on next-generation sequencing: application to the leopard cat (Prionailurus bengalensis) in Pakistan. Mol. Ecol. 21, 1951–1965. doi: 10.1111/j.1365-294X.2011.05424.x
Siegenthaler, A., Wangensteen, O. S., Benvenuto, C., Campos, J., and Mariani, S. (2019). DNA metabarcoding unveils multiscale trophic variation in a widespread coastal opportunist. Mol. Ecol. 28, 232–249. doi: 10.1111/mec.14886
Smith, J. A., Thomas, A. C., Levi, T., Wang, Y., and Wilmers, C. C. (2018). Human activity reduces niche partitioning among three widespread mesocarnivores. Oikos 127, 890–901. doi: 10.1111/oik.04592
Soininen, E. M., Valentini, A., Coissac, E., Miquel, C., Gielly, L., Brochmann, C., et al. (2009). Analysing diet of small herbivores: the efficiency of DNA barcoding coupled with high-throughput pyrosequencing for deciphering the composition of complex plant mixtures. Front. Zool. 6:16. doi: 10.1186/1742-9994-6-16
Sollmann, R., Tôrres, N. M., Furtado, M. M., De Almeida Jácomo, A. T., Palomares, F., Roques, S., et al. (2013). Combining camera-trapping and noninvasive genetic data in a spatial capture-recapture framework improves density estimates for the jaguar. Biol. Conserv. 167, 242–247. doi: 10.1016/j.biocon.2013.08.003
Sousa, L. L., Silva, S. M., and Xavier, R. (2019). DNA metabarcoding in diet studies: unveiling ecological aspects in aquatic and terrestrial ecosystems. Environ. DNA 1, 199–214. doi: 10.1002/edn3.27
Start, D., Bonner, C., Weis, A. E., and Gilbert, B. (2018). Consumer-resource interactions along urbanization gradients drive natural selection∗. Evolution 72, 1863–1873. doi: 10.1111/evo.13544
Stouffer, D. B., and Bascompte, J. (2010). Understanding food-web persistence from local to global scales. Ecol. Lett. 13, 154–161. doi: 10.1111/j.1461-0248.2009.01407.x
Taberlet, P., Bonin, A., Zinger, L., and Coissac, E. (2018). Environmental DNA – For Biodiversity Research and Monitoring - Oxford Scholarship Online Find in Library Find in Worldcat Environmental DNA: For Biodiversity Research and Monitoring. Oxford: Oxford University Press, doi: 10.1093/OSO/9780198767220.001.0001
Taberlet, P., Coissac, E., Pompanon, F., Gielly, L., Miquel, C., Valentini, A., et al. (2007). Power and limitations of the chloroplast trnL (UAA) intron for plant DNA barcoding. Nucleic Acids Res. 35:e14. doi: 10.1093/nar/gkl938
Thompson, R. M., Brose, U., Dunne, J. A., Hall, R. O., Hladyz, S., Kitching, R. L., et al. (2012). Food webs: reconciling the structure and function of biodiversity. Trends Ecol. Evol. 27, 689–697. doi: 10.1016/j.tree.2012.08.005
Torre, I., Arrizabalaga, A., Freixas, L., Ribas, A., Flaquer, C., and Díaz, M. (2013). Using scats of a generalist carnivore as a tool to monitor small mammal communities in Mediterranean habitats. Basic Appl. Ecol. 14, 155–164. doi: 10.1016/j.baae.2013.01.005
Tylianakis, J. M., Laliberté, E., Nielsen, A., and Bascompte, J. (2010). Conservation of species interaction networks. Biol. Conserv. 143, 2270–2279. doi: 10.1016/j.biocon.2009.12.004
Ushio, M., Fukuda, H., Inoue, T., Makoto, K., Kishida, O., Sato, K., et al. (2017). Environmental DNA enables detection of terrestrial mammals from forest pond water. Mol. Ecol. Resour. 17, e63–e75. doi: 10.1111/1755-0998.12690
Valiente-Banuet, A., Aizen, M. A., Alcántara, J. M., Arroyo, J., Cocucci, A., Galetti, M., et al. (2015). Beyond species loss: the extinction of ecological interactions in a changing world. Funct. Ecol. 29, 299–307. doi: 10.1111/1365-2435.12356
Walsh, A. J. (2015). Carnivore Diet Identification Through Scat and Genetic Analysis in Namibia, Africa. Durham, NH: University of New Hampshire.
Wansi, T., Pieper, R., Beck, R., and Murray, L. (1992). Botanical content of black-tailed jackrabbit diets on semidesert rangeland. Gt. Basin Nat. 52, 300–308.
Wilson, J., and Thomas, B. (1999). Diet and Seed dispersal efficiency of the gray fox (Urocyon cinereoargenteus) in chaparral. Bull. South. Calif. Acad. Sci. 98, 119–126.
Winemiller, K. O., and Pianka, E. R. (1990). Organization in natural assemblages of desert lizards and tropical fishes. Ecol.Monogr. 60, 27–55. doi: 10.2307/1943025
Woodward, G., and Hildrew, A. G. (2002). Food web structure in riverine landscapes. Freshw. Biol. 47, 777–798. doi: 10.1046/j.1365-2427.2002.00908.x
Wootton, J. T. (1994). The nature and consequences of indirect effects in ecological communities. Annu. Rev. Ecol. Syst. 25, 443–466. doi: 10.1146/annurev.es.25.110194.002303
Xiong, M., Wang, D., Bu, H., Shao, X., Zhang, D., Li, S., et al. (2017). Molecular dietary analysis of two sympatric felids in the Mountains of Southwest China biodiversity hotspot and conservation implications. Sci. Rep. 7, 1–12. doi: 10.1038/srep41909
Zavaleta, E. S., and Kettley, L. S. (2006). Ecosystem change along a woody invasion chronosequence in a California grassland. J. Arid Environ. 66, 290–306. doi: 10.1016/j.jaridenv.2005.11.008
Keywords: food web, network analysis, diet ecology, eDNA, DNA metabarcoding, conservation
Citation: Meyer JM, Leempoel K, Losapio G and Hadly EA (2020) Molecular Ecological Network Analyses: An Effective Conservation Tool for the Assessment of Biodiversity, Trophic Interactions, and Community Structure. Front. Ecol. Evol. 8:588430. doi: 10.3389/fevo.2020.588430
Received: 28 July 2020; Accepted: 28 September 2020;
Published: 10 November 2020.
Edited by:
Hiroki Yamanaka, Ryukoku University, JapanReviewed by:
Haruko Ando, National Institute for Environmental Studies (NIES), JapanHirokazu Toju, Kyoto University, Japan
Copyright © 2020 Meyer, Leempoel, Losapio and Hadly. This is an open-access article distributed under the terms of the Creative Commons Attribution License (CC BY). The use, distribution or reproduction in other forums is permitted, provided the original author(s) and the copyright owner(s) are credited and that the original publication in this journal is cited, in accordance with accepted academic practice. No use, distribution or reproduction is permitted which does not comply with these terms.
*Correspondence: Jordana M. Meyer, jordana7@stanford.edu