
94% of researchers rate our articles as excellent or good
Learn more about the work of our research integrity team to safeguard the quality of each article we publish.
Find out more
ORIGINAL RESEARCH article
Front. Ecol. Evol., 22 October 2020
Sec. Urban Ecology
Volume 8 - 2020 | https://doi.org/10.3389/fevo.2020.569730
This article is part of the Research TopicHistorical Legacies of Land Use in Cities; Parks, Open Spaces and Potential for Green Infrastructure- Ideas of City Nature in an Urbanizing PlanetView all 10 articles
 Jeffrey A. Brown1*†
 Kelli L. Larson2,3†
 Susannah B. Lerman4
 Daniel L. Childers3
 Riley Andrade2Heather L. Bateman5
 Sharon J. Hall6Paige S. Warren7Abigail M. York8
Although the value of urban ecological infrastructure (UEI) is widely recognized, insufficient research has investigated how people perceive the wide variety of UEI. To address this gap, we investigated residents’ perceptions of the coupled value of aesthetic and biological qualities as related to diverse UEI and other environmental and social factors (including personal beliefs and demographics), collectively referred to as bio-cultural services and disservices. We evaluated whether people positively view their neighborhood environments as natural-looking while providing diverse plants and wildlife habitat (services), in contrast to negatively perceived disservices that we evaluated as messy-looking with weeds and pests (disservices). We analyzed survey data from residents (n = 495) in metropolitan Phoenix, Arizona, United States, coupled with environmental variables (UEI and vegetative cover) compiled from diverse sources. We ran three regression models to compare the relative influence of social and environmental factors independently and combined on the perception of bio-cultural services and disservices. Our results demonstrate the influence of social factors, particularly place identity, neighborhood cohesion, and income, on both bio-cultural services and disservices. Additionally, environmental factors such as vegetation cover increased perceptions of bio-cultural services while decreasing perceived disservices. The effects of proximity to UEI were more varied. While proximity to cropland increased perceived bio-cultural disservices, proximity to desert parks reduced disservices. Although UEI can promote biodiversity and human well-being, all UEI are not perceived the same. Our results underscore the added value of considering both the form of UEI and perceptions among people who live nearby when designing and implementing infrastructure to promote bio-cultural services that are both ecologically and socially valued.
People’s everyday relationships with their local environments largely depend on the structure and design of natural areas within urban settings. Globally, urban areas expanded by 10,000 km2 per year between 1985 and 2015 (Li et al., 2018). The projected urban population of 5.2 billion by 2030 (up from 4.0 billion in 2015; United Nations, Department of Economic and Social Affairs, Population Division, 2019) underscores the importance of understanding complex relationships between people and nature in urban ecosystems (Pickett and Cadenasso, 2008; McPhearson et al., 2016). Although urban areas frequently experience ecological homogenization, especially compared to their outlying native ecosystems (Groffman et al., 2014, 2017), they also exhibit a high degree of ecological variability at local scales (Pickett et al., 2017). Research into the heterogeneity of urban landscapes, both within and between metropolitan areas, provides a deeper understanding of how local features influence the perceived benefits of varied landscapes, including those related to biological outcomes (Cadenasso et al., 2007, 2013). In this paper, we investigate how environmental features of people’s neighborhoods, including urban ecological infrastructure (UEI), coupled with social factors, affect public perceptions of their aesthetic and biological value.
Urban ecological infrastructure encompasses all infrastructure in a city that supports ecological structure and function, and by extension, provides ecosystem services to urban residents (Childers et al., 2019). UEI is a broad, all-encompassing concept for “nature in cities.” This idea includes commonly recognized forms of infrastructure, such as parks, residential yards, community gardens, lakes and rivers, and street trees. But UEI also includes less recognized forms, such as vacant lots, agricultural fields, canals, and water retention basins. Childers et al. (2019) categorized UEI into terrestrial, aquatic, and wetland ecosystem types because each type supports unique ecological structures and functions and thus provides different ecosystem services. Understanding how UEI influences people’s perceptions can lead to improved city design and an increase in resident satisfaction with, and stewardship of, their local environments (Paul et al., 2014; Artmann et al., 2019).
At the turn of the twentieth century and through the Progressive Era, city planners and developers focused on gray infrastructure that provided basic services (e.g., water delivery, waste removal, flood control, etc.) in a mostly successful effort to make urban areas “sanitary” (Melosi, 2008; Pincetl, 2010; MacKinnon and Derickson, 2013). More recent urban solutions have promoted “green” infrastructure, or UEI broadly, that are more adaptive and flexible than gray infrastructure while also providing multiple benefits to residents (Campbell, 1996; Colding and Barthel, 2013; Elmqvist et al., 2015; Li et al., 2017). Integration of UEI can simultaneously improve both human well-being as well as biodiversity in urban environments (Tzoulas et al., 2007; Ekkel and de Vries, 2017). Exposure to biodiversity and natural areas has positive impacts on human well-being (Cox et al., 2017a,b), but these impacts can vary based on people’s subjective views of local landscapes (Syrbe and Walz, 2012; Shwartz et al., 2014; Pett et al., 2016). Importantly, for urban residents, perceived biodiversity is more important in driving psychological well-being than actual biodiversity (i.e., species richness) (Dallimer et al., 2012; Pett et al., 2016).
While the benefits and conflicts surrounding nature in cities are widely acknowledged (Soulsbury and White, 2016), research has not fully linked different types of UEI to public perceptions of their aesthetic qualities. For example, green spaces that have a diversity of native plants often benefit wildlife by providing habitat in cities (Marzluff and Rodewald, 2008; Niemelä et al., 2010); meanwhile, these features can also benefit people through aesthetic appreciation and other positive outcomes for human well-being (Casalegno et al., 2013; Hernández-Morcillo et al., 2013; Fish et al., 2016). However, certain types of UEI that provide habitat can also be perceived as messy and unkempt (van Heezik and Ludwig, 2012). These UEI might elicit negative responses by urban residents because of an association with pest or nuisance species (Lyytimäki et al., 2008; Maruthaveeran and van den Bosh, 2015). From this point on, we refer to these linked biological and cultural ecosystem services and disservices as bio-cultural services and disservices. In particular, our analysis centers on natural-looking landscapes and their perceived ability to provide wildlife habitat as a bio-cultural service, as well as perceptions regarding messy-looking landscapes that attract pests as a disservice.
Research has explored how local wildlife contribute to bio-cultural services, specifically in terms of perceptions of birds (Lerman and Warren, 2011; Belaire et al., 2015). More broadly, research has revealed an array of perceptions in relation to diverse environmental features (e.g., trees and parks) across different urban contexts (Flannigan, 2005; Fernandes et al., 2019). However, the literature largely fails to examine public perceptions of bio-cultural services and disservices flowing specifically from proximity to diverse UEI, along with other environmental and social factors. Moreover, research often focuses on social or environmental explanations for ecosystem services, often through biophysical evaluations or economic valuation of ecosystem services (Casalegno et al., 2013; Buizer et al., 2016; Li et al., 2017). Further, existing research on perceptions of UEI tends to focus on temperate climates in which the distribution of vegetation and UEI may be more uniform than in arid climates. Herein, we couple social and environmental datasets in a desert metropolis to examine how an array of potential social and environmental factors influence people’s subjective views of a specific type of bio-cultural service, focusing on perceptions of vegetation and wildlife.
In this research, we asked: what social and environmental features, including proximity to varied UEI, influence perceived bio-cultural services and disservices. Overall, since personal values and experiences strongly influence public perceptions (Bruvold, 1973; Rokeach, 1973; Bell et al., 1996), we hypothesize that social factors (including personal beliefs and demographics) will better explain perceived services and disservices than local UEI and other environmental conditions. Regarding environmental features, we specifically test whether distinct UEI differentially influences perceived bio-cultural services and disservices. By understanding patterns in perceived bio-cultural services and disservices, planners and practitioners can more effectively promote biodiversity and the design of UEI that are appreciated by the public (Buizer et al., 2016; Larson et al., 2019). Designing UEI according to societal preferences is critical since people’s values and attitudes are often steadfast and difficult to change (e.g., through education and outreach efforts; Heberlein, 2012). Ultimately, how the public perceives and values UEI will affect support for their implementation, management, and continued investments.
The Phoenix Metropolitan Area (Figure 1) was originally settled by the Hohokam people who created a series of irrigation canals that branched from the Salt River and allowed farming to occur in the arid landscape (Trimble and Trimble, 2003). Hundreds of years after the Hohokam left the region, Anglo-Americans settled there in the 1800s. As Phoenix developed, some of the original Hohokam canals paved the path for modern canals that deliver water throughout Phoenix. Due to restoration efforts, some areas of the canals and Salt River Channel are bordered by native vegetation, but most canals are hardscaped with concrete. Given the upstream storage of the Salt and Verde River water in dams built in the early twentieth century, most of the river channels that run through the metropolitan region are ephemeral.
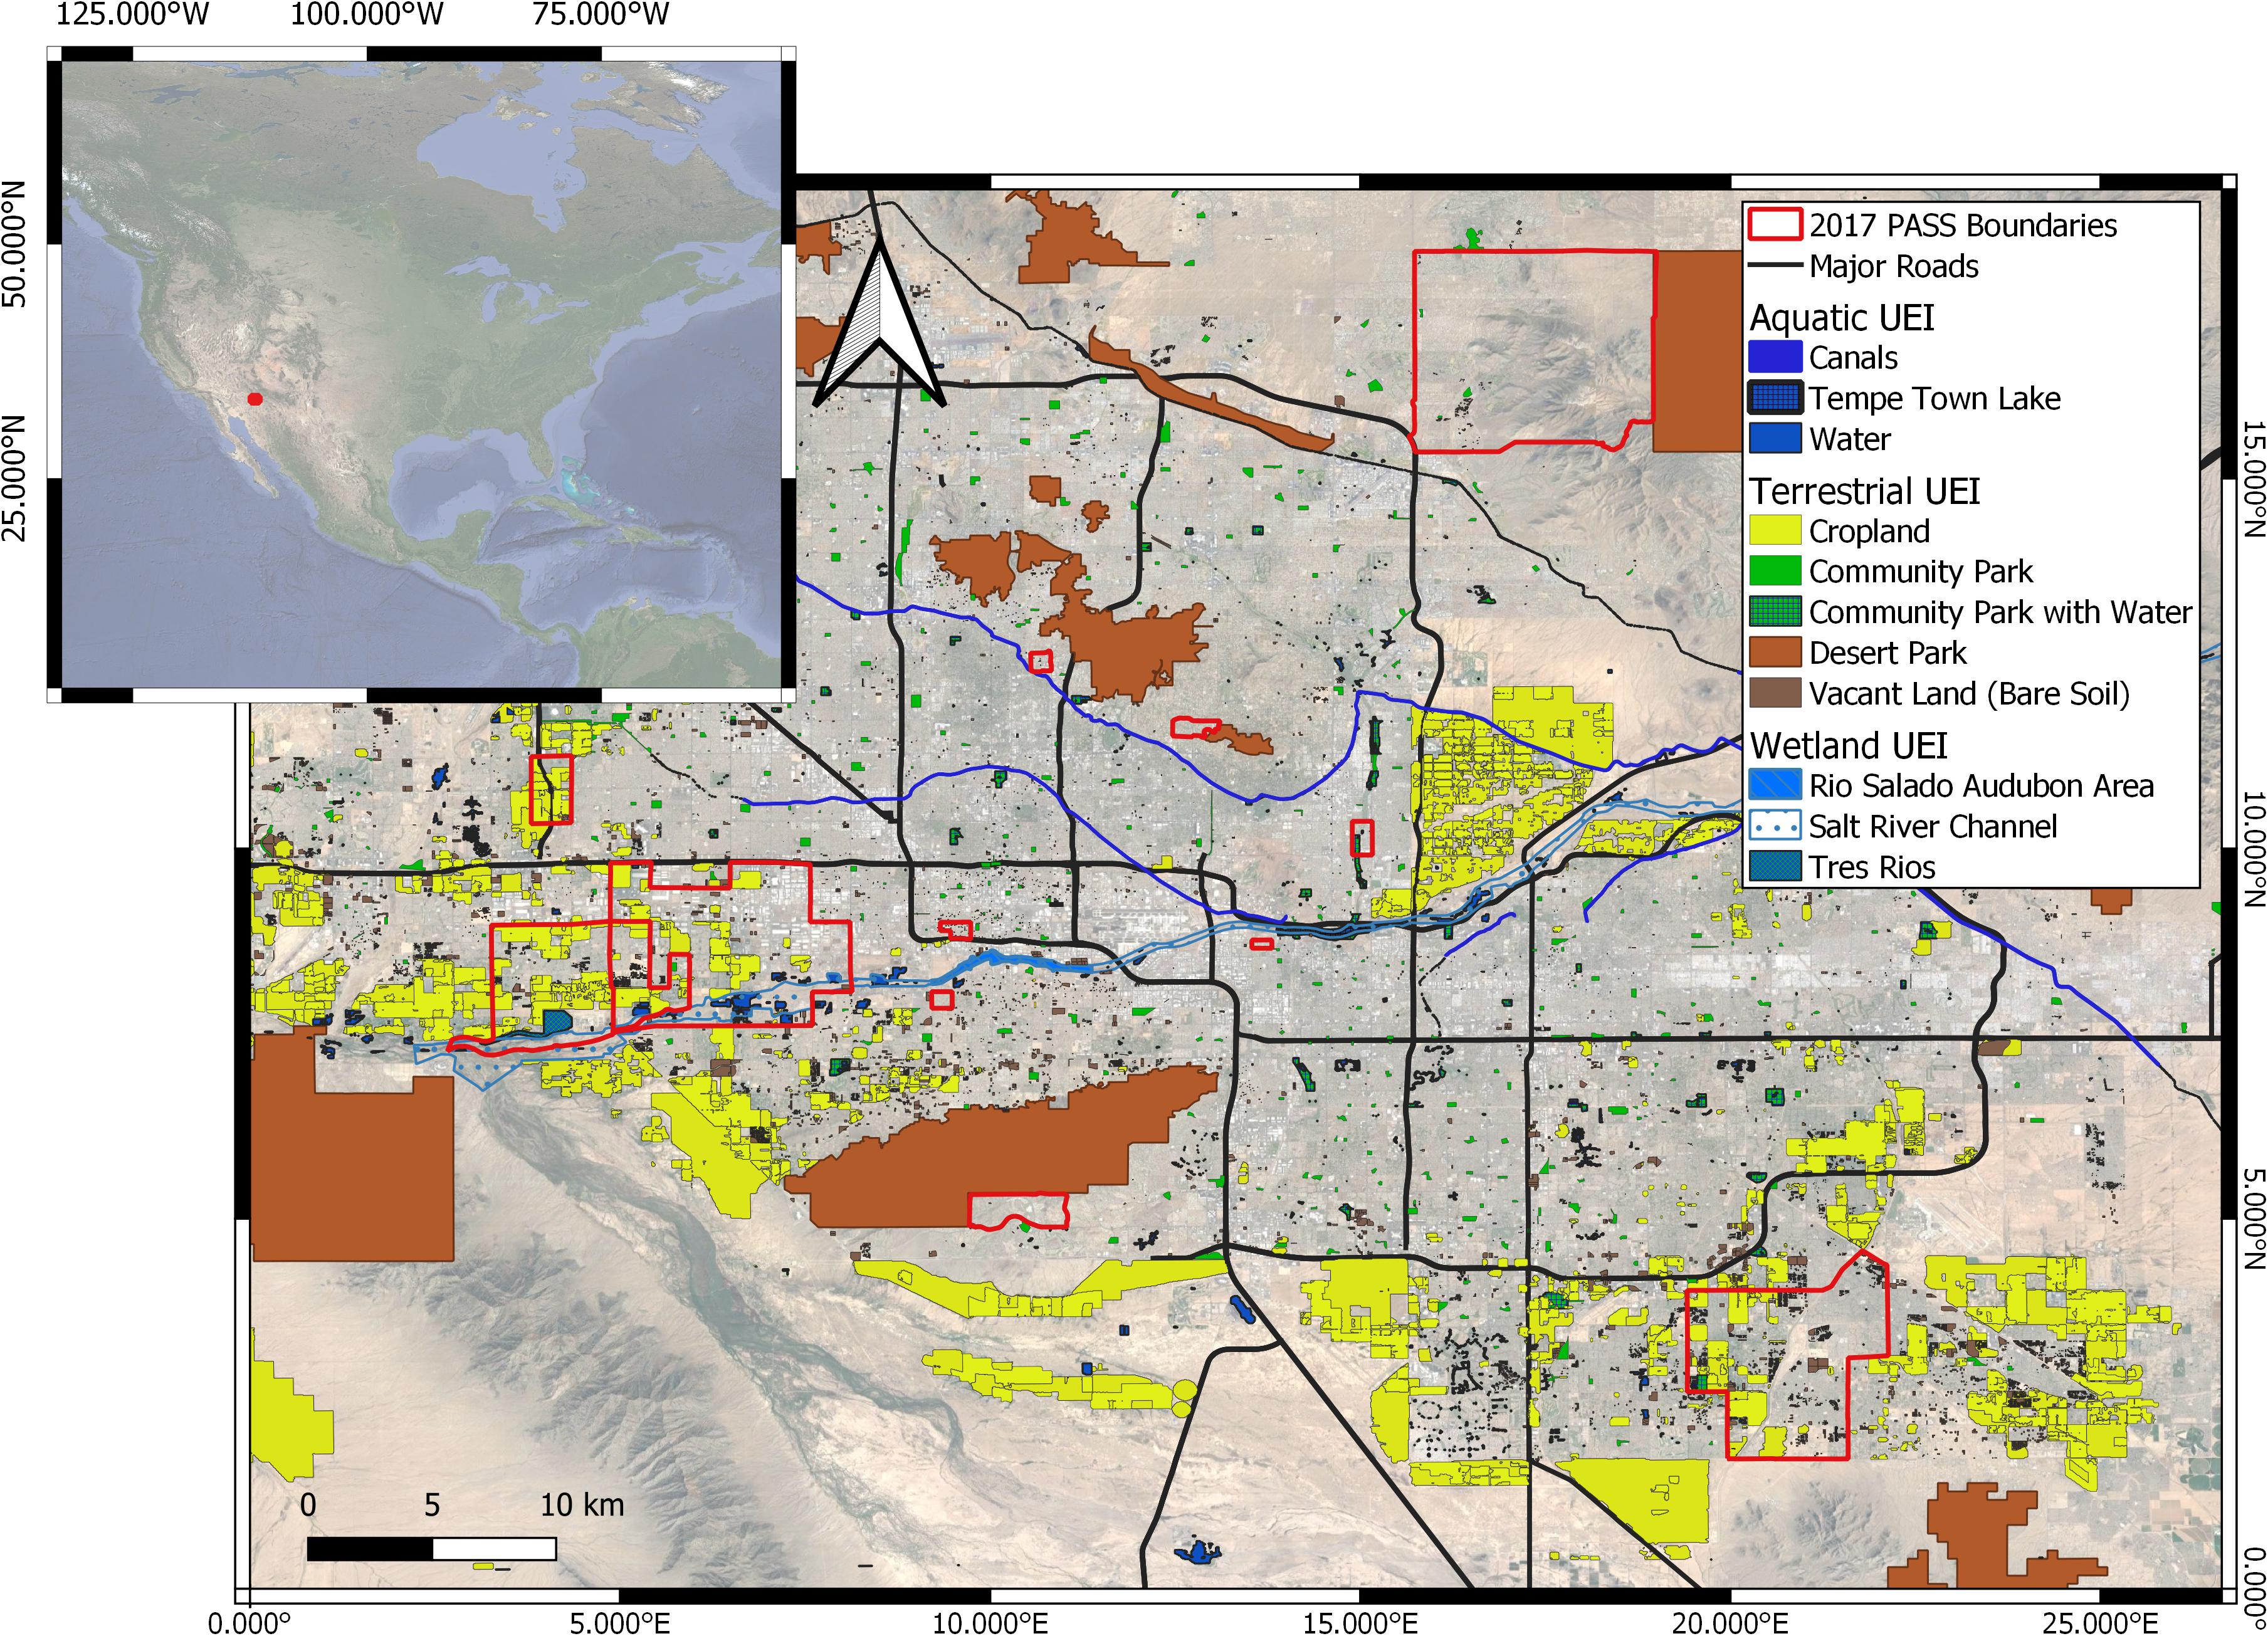
Figure 1. The Phoenix study area (indicated in red on the map of North America). PASS neighborhoods outlined in red. Aquatic, terrestrial, and wetland UEI are shown throughout the study area. Base maps are from Google Earth 2017.
Agricultural settlements developed along the canals to facilitate widespread irrigation use. Although much of the farmland has been developed into residential and other urban land uses, agrarian land remains throughout the region (Figure 1; Keys et al., 2007; Kane and York, 2017). Currently, farmland includes dominant crops of hay, cotton, and wheat (York et al., 2020). The region is also home to a large dairy industry.
Despite the arid environment, which receives 13 cm of rain annually, the regional landscape is traditionally characterized as an oasis, distinct from the surrounding desert (Larson et al., 2009). These lush landscapes include irrigated agriculture as well as ample irrigated grass and more than 1,400 artificial bodies of water (Larson and Grimm, 2012). Although residential lawns are ubiquitous, drought-tolerant xeric landscapes with gravel groundcover and low water-use plants have become increasingly common in recent decades (Martin, 2015). Meanwhile, large undeveloped swaths of the Sonoran Desert—including several desert parks and preserves—exist within and at the edges of the metro area.
To measure people’s perceptions of bio-cultural services and disservices and select explanatory factors in our analysis, we used data collected from the 2017 Phoenix Area Social Survey (PASS1; Larson et al., 2019). The PASS is a longitudinal survey effort conducted as a part of the Central Arizona-Phoenix Long-Term Ecological Research Program. The 2017 survey targeted 12 neighborhoods, delineated by Census Block Groups, strategically located to capture a range of demographic characteristics (e.g., low to high income levels) and central, suburban, and exurban locations in proximity to diverse UEI (Figures 1, 2). The survey was sent to 1,400 addresses between May and September of 2017; 188 addresses represented households that responded to a previous PASS (2011), and the other 1,212 surveys were randomly drawn from addresses provided by the Marketing Systems Group, which come from the U.S. Postal Service’s Delivery Sequence Files.
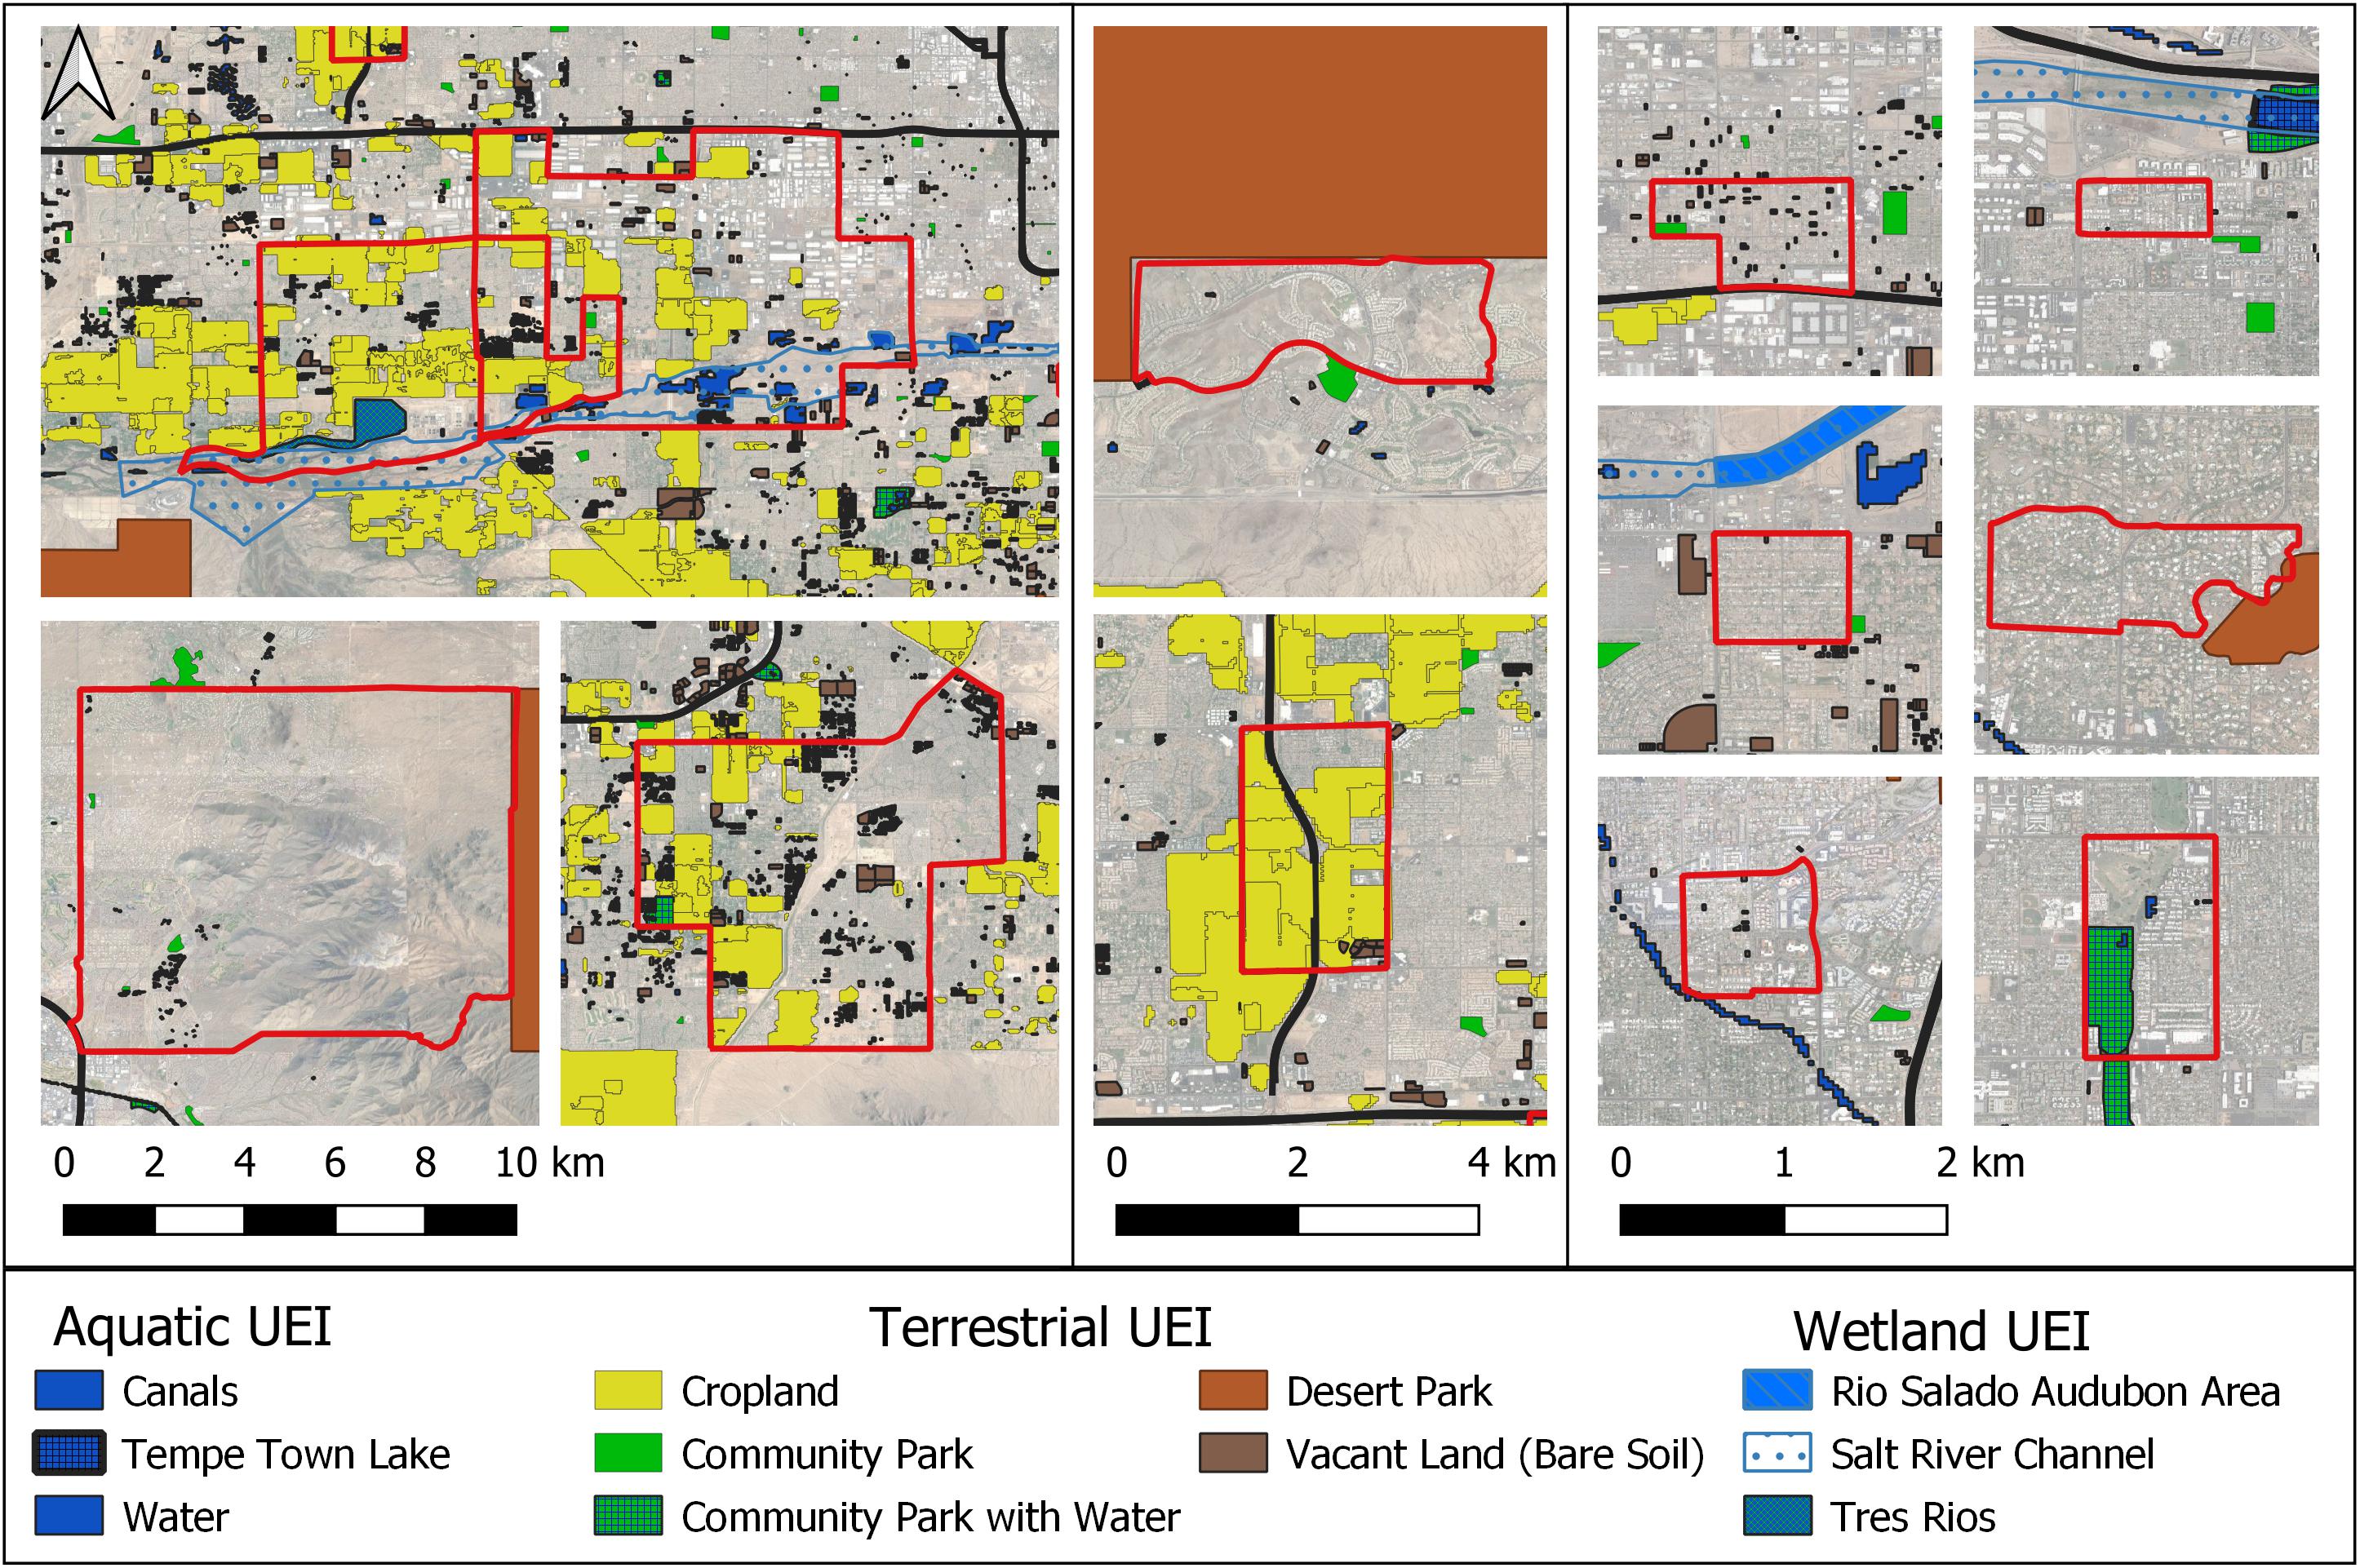
Figure 2. Close ups of the various PASS neighborhoods from the study area. PASS neighborhoods outlined in red. Aquatic, terrestrial, and wetland UEI are shown throughout the study area. Base maps are from Google Earth 2017.
The University of Wisconsin survey lab administered the questionnaires to households via four-wave mailing, including three full questionnaires and a reminder postcard sent in-between mailings (Larson et al., 2019). Individuals could request a Spanish version with a postage-paid postcard. Regardless of response, the survey lab sent a $5 incentive as well as post-response incentives (ranging from $5 to $40; see Smith et al., 2020 for details) to increase participation. A total of 39.4% of contacted households responded for a total of 496 completed surveys. We dropped one respondent who removed their identifier, since we could not map their location and link their responses to the environmental data including local UEI features. See Larson et al. (2020) for all survey questions.
We measured the ecosystem service and disservice variables using a Likert scale with responses ranging from strongly disagree (1) to strongly agree (5). In particular, we asked the following question: “To what extent do you disagree or agree that the following statement describes the environment in your neighborhood” (Larson et al., 2019). We specifically asked respondents to consider their local “environment” as, “the grass, plants, and/or trees in the area, along with the streets, sidewalks, patios, porches, and built structures as well as parks and open spaces.” We purposefully included both ecological and built infrastructure since both influence ecosystem services and disservices in urban areas (Shackleton et al., 2016).
The statements analyzed herein include: “looks natural,” “offers a variety of plants,” and “provides habitat for birds,” in addition to “looks messy,” “attracts unwanted animals or pests,” and “has too many weeds.” We created two composite survey scales for our dependent variables, with the first three variables averaged for each respondent to capture bio-cultural services and the latter three averaged to capture bio-cultural disservices. Larson et al. (2019) informed the development of the survey scales, along with the scholarly literature and expert input among our interdisciplinary research team. We deemed the two scales reliable through a standard test of internal consistency; each scale had Cronbach alpha values greater than the 0.7 criterion (Table 1, see also Supplementary Figure 1).
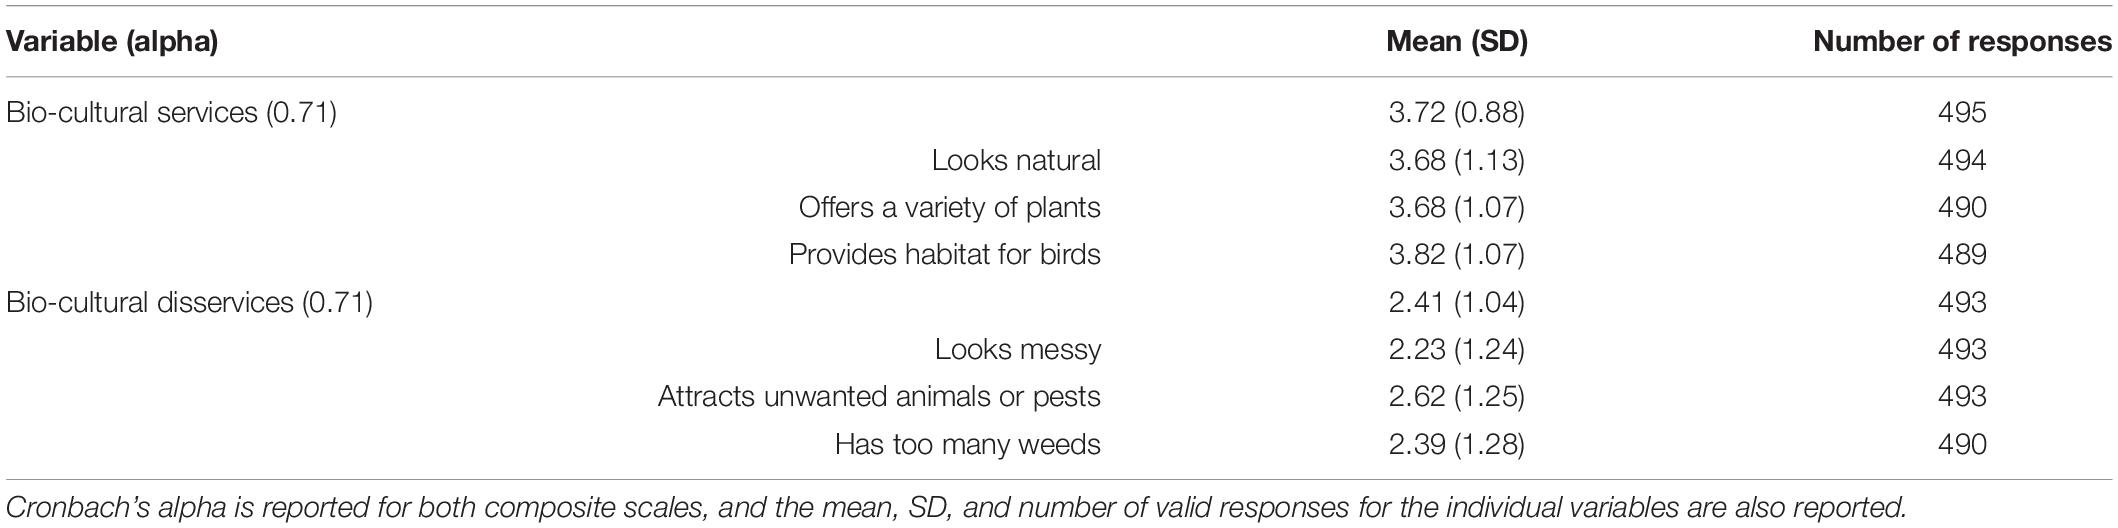
Table 1. Dependent variables in composite scales (i.e., bio-cultural services and disservices) with their means and standard deviations.
We measured UEI to link larger scale and landscape features to perceptions of bio-cultural services. Following Childers et al. (2019), we first classified UEI as aquatic (containing perennial water), terrestrial (no water), or wetlands (both terrestrial and aquatic due to ephemeral water features). The three broad categories are ecologically distinct and thus provide disparate ecosystem services broadly. However, while these broad classifications can be useful for distinguishing between ecosystem services (specifically provisioning or regulating services), they may not adequately measure bio-cultural services. To better understand perceptions of bio-cultural services, we investigated 11 different forms of UEI (Table 2), identified through a combination of expert opinion and pre-existing data sources (Maricopa Association of Governments, 2014; Zhang and Li, 2017; Smith et al., 2017). Local governments, including the cities of Phoenix and Tempe, have restored or redesigned segments of the river channel. We therefore classified these UEI features separately (i.e., Tempe Town Lake, Rio Salado Audubon, and Tres Rios Wetlands) relative to the remaining river channel, which is ephemeral due to upstream dams and the distribution of water throughout the region (Table 2). We also included agricultural land and vacant land (Smith et al., 2017; Childers et al., 2019). See Supplementary Figure 2 for example images of the varying UEI.
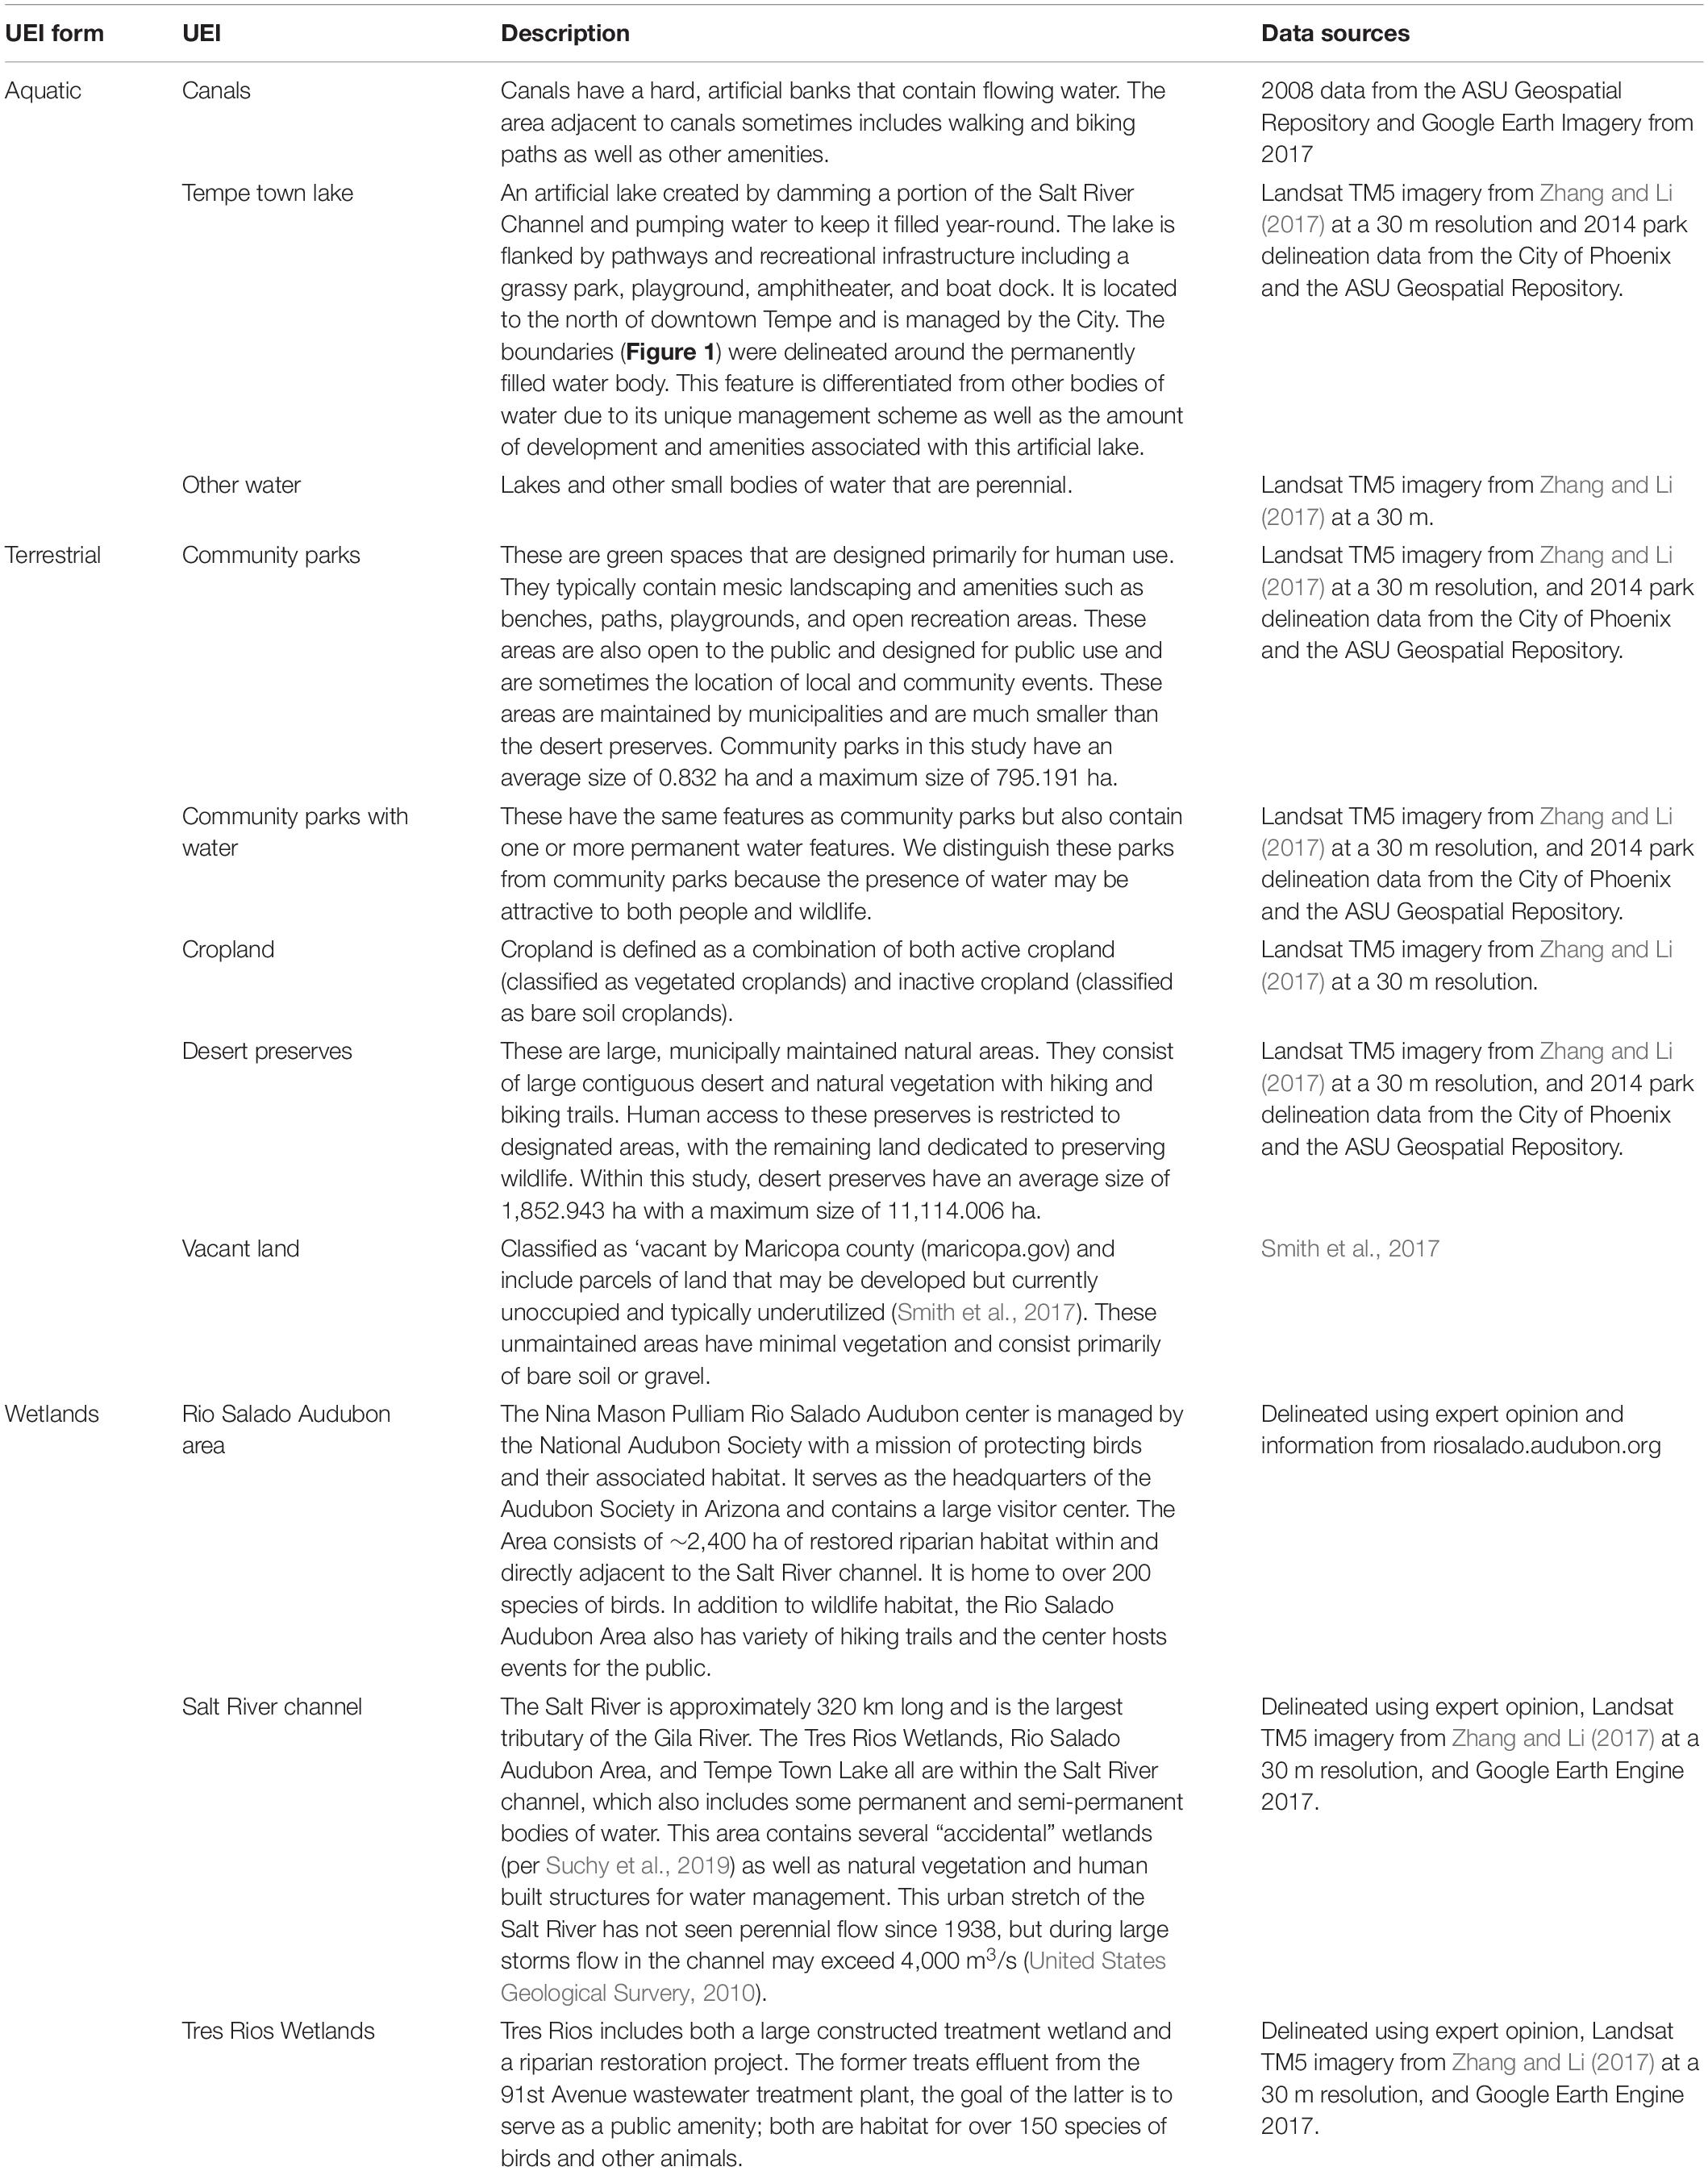
Table 2. Classifications and descriptions of UEI used in this study as well as associated data sources.
We used QGIS version 3.12.2 to calculate the amount of UEI (in hectares) within a 1 km radius of a respondent’s home for all UEI except the Salt River and canals. Since the Salt River and canals are predominantly linear features, we measured the distance (in meters) from respondents’ homes to these features instead of the area within 1 km of the respondent these features occupied. We defined residents’ local environments as those within a 1 km radius since this distance captures how most respondents (84%) defined their neighborhood. Moreover, planners commonly consider this distance as walkable and, thus, individuals are likely to interact with UEI within this radius (Macedo and Haddad, 2016). Descriptive statistics for all UEI are provided in Table 2.
Although we classified UEI broadly as aquatic, terrestrial, or wetland, we did not that expect all UEI within a classification would be perceived similarly due to differences in accessibility (e.g., open vs. closed to the public), appearance (e.g., relatively managed vegetation in community parks vs. natural desert preserves), and function (e.g., croplands producing commercial agricultural products vs. public parks used for recreation). For instance, UEI that was not publicly accessible, such as croplands and the Tres Rios Wetlands, are less likely to impact perceptions since people cannot visit and interact with these UEIs as readily as public spaces such as parks (de Groot et al., 2010). Additionally, UEI that lacks active management of vegetation or other features (e.g., wetlands, vacant lots) may be perceived as messy and thereby be perceived negatively (Rega-Brodsky et al., 2018; Stoffel, 2020). Finally, we predicted that natural areas established to protect and promote biodiversity, such as desert preserves, will enhance perceptions of bio-cultural services.
Vegetation density and the extent to which the study neighborhoods had xeric landscaping provided further information about the vegetative structure of a respondent’s neighborhood not captured by the UEI. We used two metrics, Normalized Difference Vegetation Index (NDVI and neighborhood yard composition (proportion of xeric yards in a neighborhood), to assess local vegetative cover. The NDVI data was measured at a 1 meter resolution from the National Agriculture Imagery Program 1–4 June 2017. To reflect local neighborhood environments, we used the average NDVI value within a 1 km radius of each respondent. We also included a proxy for neighborhood yard composition (percent xeric) based on survey responses since we did not have information on all yards within a neighborhood. Specifically, respondents were asked what percent of their front yard was composed of grass. We classified yards that were less than 50% grass as xeric yards and then measured the percent of xeric yards (0.00–1.00) in a neighborhood as the number of xeric yards reported divided by the total number of respondent’s yards in the neighborhood.
We analyzed social variables from the PASS survey to represent personal values and beliefs, in addition to demographic attributes. We also included the age of housing (from county tax assessor data), since we expected historical patterns of development might influence perceptions of local landscapes (Tengberg et al., 2012; Locke et al., 2020).
To capture environmental values, we used the standard 15-question New Ecological Paradigm (NEP) scale (Dunlap et al., 2000). The NEP reflects broad-based beliefs about the relationship between people and the natural environment or, in other words, the extent to which people hold biocentric (or pro-ecological) versus anthropocentric (i.e., human-centered) views. We averaged responses from the NEP scale to create a single variable ranging from 1 to 5 (Table 3). Values closer to 1 represent anthropocentric orientations, whereas values closer to 5 captured biocentric views.
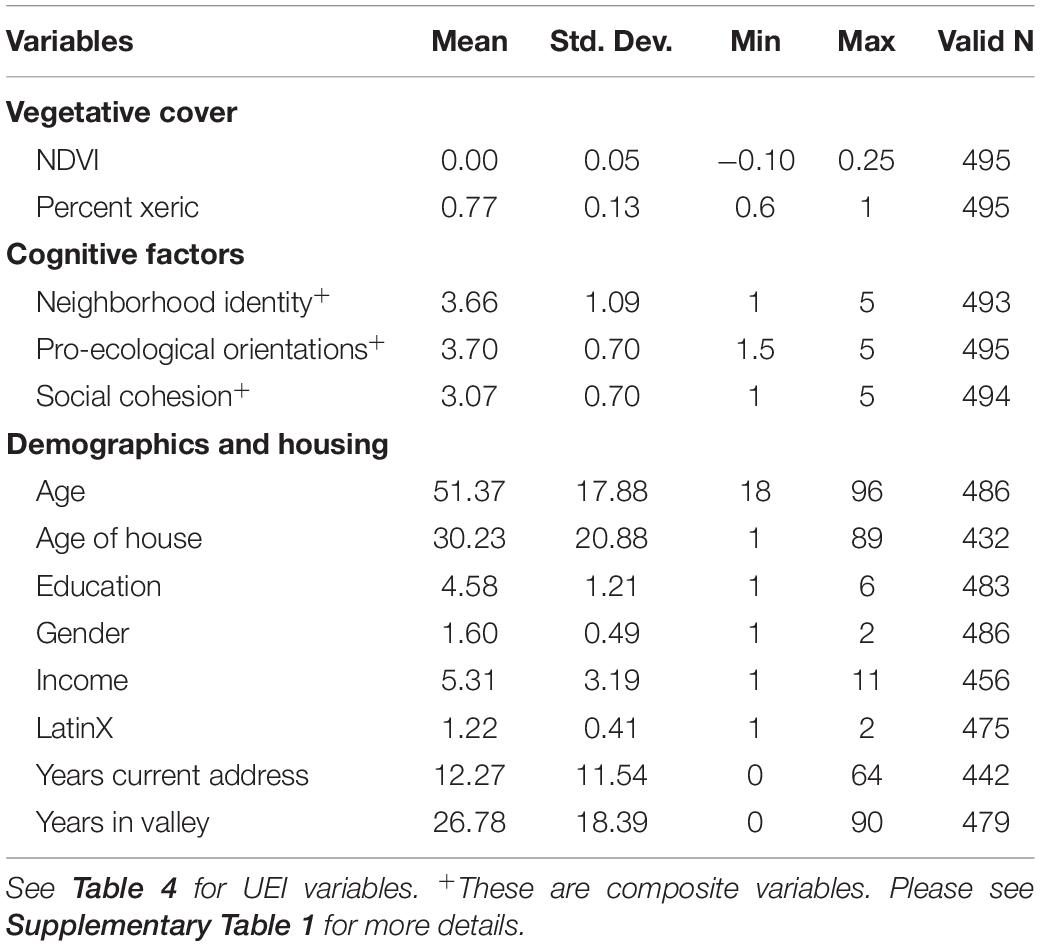
Table 3. Descriptive statistics for environmental and social explanatory variables.
As one dimension of place attachment, we measured neighborhood identity using the average of five different variables (following a standard scale developed by Williams and Vaske, 2003). The verbatim survey question included statements such as, “I feel my neighborhood is a part of me.” and “I identify strongly with my neighborhood.” (see Larson et al., 2020 for the complete list of questions). This index ranged from 1 to 5 with 1 indicating an individual who feels a weak connection to their neighborhood and 5 representing an individual with a strong connection to their neighborhood (Table 3). Individuals who strongly identify with their neighborhood are likely to perceive their local environments more positively than others (for example, as shown by Brown and Raymond, 2007).
Lastly, we used a measure of social cohesion to reflect one aspect of social capital. The concept of social capital conveys the value of interpersonal relationships and networks in taking collective actions, among other human assets (Putnam and Putnam, 2000; Locke et al., 2020). Following Larsen et al. (2004), we assessed social cohesion using the average response to four statements, such as, “I live in a close-knit neighborhood.” and “I can trust my neighbors” (see Supplementary Material for the complete list of statements). The scale ranges from 1 to 5, with 1 indicating individuals who felt a weak connection to their neighbors and 5 indicating that individuals felt a strong connection with their neighbors (Table 3).
In the survey, each respondent provided their date of birth, from which we calculated their age. Age is associated with the amount of free time an individual has (Goerres, 2007) and is associated with how frequently individuals visit parks and local neighborhood features (Godbey and Blazey, 1983). Older individuals often prefer bio-cultural features such as natural areas in community parks as opposed to recreational areas (Alves et al., 2008).
For tenure of residence in the Phoenix area and at the surveyed home, we asked respondents: “How many years have you lived in the Phoenix metropolitan area?” and “How many years have you lived at your current address?” The amount of time an individual has lived in one location can positively influence their perception of that area and their willingness to care for it (York et al., 2017; Sorensen et al., 2018). People who have lived in an area longer may feel stronger attachment to that area and are therefore more likely to perceive it positively (Vaske and Kobrin, 2001; Altman and Low, 2012).
We coded gender on a binary scale with 0 as male and 1 as female. Gender can influence perceptions of risk (Flynn et al., 1994; Slovic, 2000), which may in turn, for example, influence women’s perceptions of messy, pest-ridden UEI as being dangerous (Sreetheran and van den Bosch, 2014). An individual’s engagement with environmental issues and their perceived importance of natural spaces has shown to vary by gender, with women perceiving natural systems as more important than men (Mohai, 1997; Momsen, 2007).
To capture socioeconomic status, we included income and education. Respondents reported their household income on an 11-point scale in $20,0000 increments, from $20,000 to over $200,000. People with higher income levels likely have more control over their local landscape, which might influence their perception of bio-cultural services and disservice that relate to the biodiversity in the neighborhood (Lerman and Warren, 2011; Locke et al., 2020). We measured education on a 7-point scale, from completion of grades 1 to 8 to attainment of a graduate or professional degree. Education was included because of its association with income (Morgan and David, 1963; Gregorio and Lee, 2002) and its positive association with environmental attitudes (Lundmark, 2007).
For ethnicity, we asked respondents whether they identified as LatinX (including Mexican, Mexican-American, Chicano, Hispanic, or LatinX). We coded the LatinX variable on a binary scale with 1 as not LatinX and 2 as LatinX. We limited the response to this binary variable as the ethnic composition of the study area and respondents is primarily white/Caucasian and LatinX (white/Caucasian and LatinX respondents accounted for 91.4% of respondents in this study). Previous work has shown that LatinX ethnicity is associated with environmental views. For example, LatinX are less likely to perceive the “natural” desert environment positively (Andrade et al., 2019). LatinX individuals may more likely perceive wildlife as a potential risk (Ramer et al., 2019; Larson et al., 2020), and thus, may perceive disservices more strongly than services.
Finally, we obtained housing age by linking respondent addresses to the Maricopa County Assessor’s Office (Parcel Secured Master 2017), which includes the year the home was built. In the Phoenix metropolitan area, newer construction at the fringe of the city is associated with increased exposure to potentially dangerous or negatively perceived animals like snakes (Pitts et al., 2017).
We used generalized linear models since these models do not assume that independent variables are pulled from a normal distribution. We first ran four models to compare how environmental (Tables 5, 6) versus social factors (Table 7) explained the bio-cultural service and disservice variables separately. Additionally, to test whether broad UEI classifications (terrestrial, aquatic, and wetland) influence perceived bio-cultural services and disservices, we ran another model in which we centered and scaled all UEI variables and then combined all values within a single broad category (e.g., scaled scores for canals, Tempe Town Lake, and water were combined as “aquatic UEI”) and also included average NDVI and xeric yard variables (Tables 6). In the more specified environmental model, we used the distinct UEI variables (Tables 2, 5) as well as the other environmental variables. The social models incorporated the varied personal beliefs and demographic variables as explanatory factors. The final models combined all environmental (at the specific UEI level) and social variables. To ensure variables were not co-linear, we also ran a variable inflation factor to ensure we did not have co-linearity with our predictor variables. No independent variables had a score over 5 indicating non-significant co-linearity of predictor variables within our model (James et al., 2014). Additionally, since the independent variables were measured on different scales, we standardized all variables by subtracting the mean value of each variable and dividing by its standard deviation before running our analysis. All analyses were conducted in R version 3.6.1 (R Core Team, 2019).
On average, the survey respondents lived within 1 km of eight of the eleven types of UEI (Table 4). Cropland was the most abundant in terms of land cover within 1 km of our survey respondents, likely because the four largest neighborhoods from our study had high amounts of cropland within them. Access to restored or redeveloped portions of the Salt River channel was low among survey respondents overall, given their relatively small area coverage in specific locations of the region.
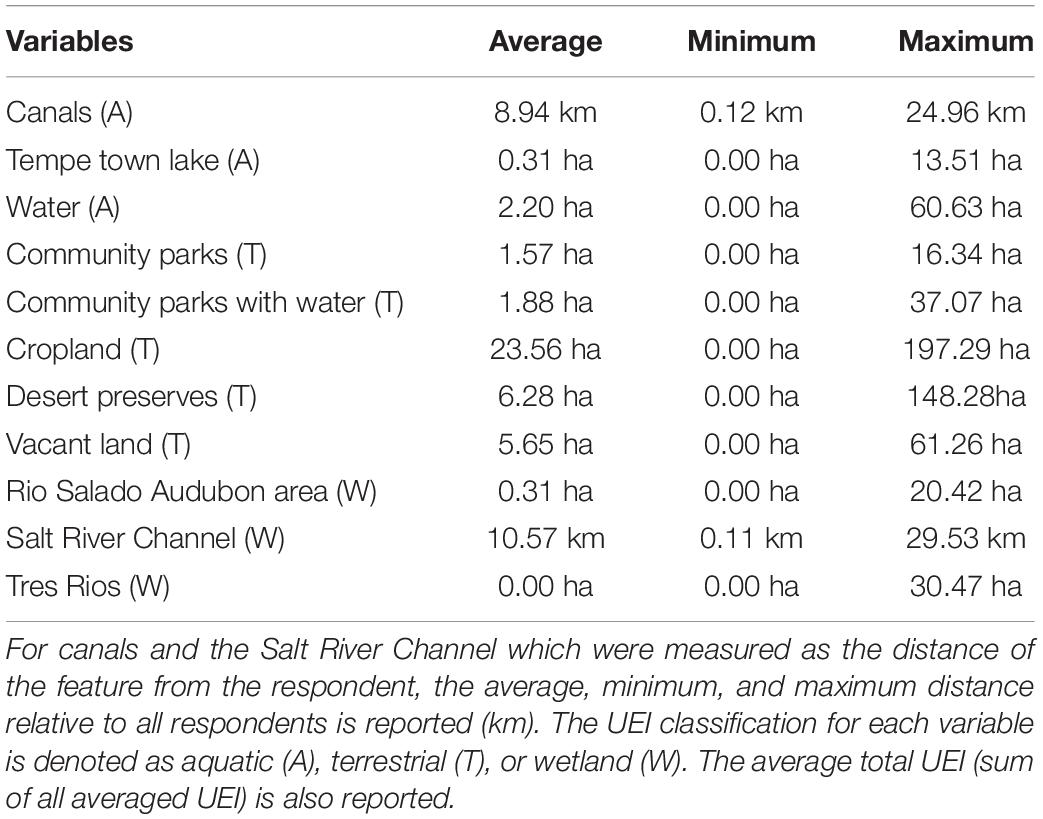
Table 4. Average, minimum, and maximum amount (in ha) of each UEI that was measured within a 1 km radius relative to all respondents.
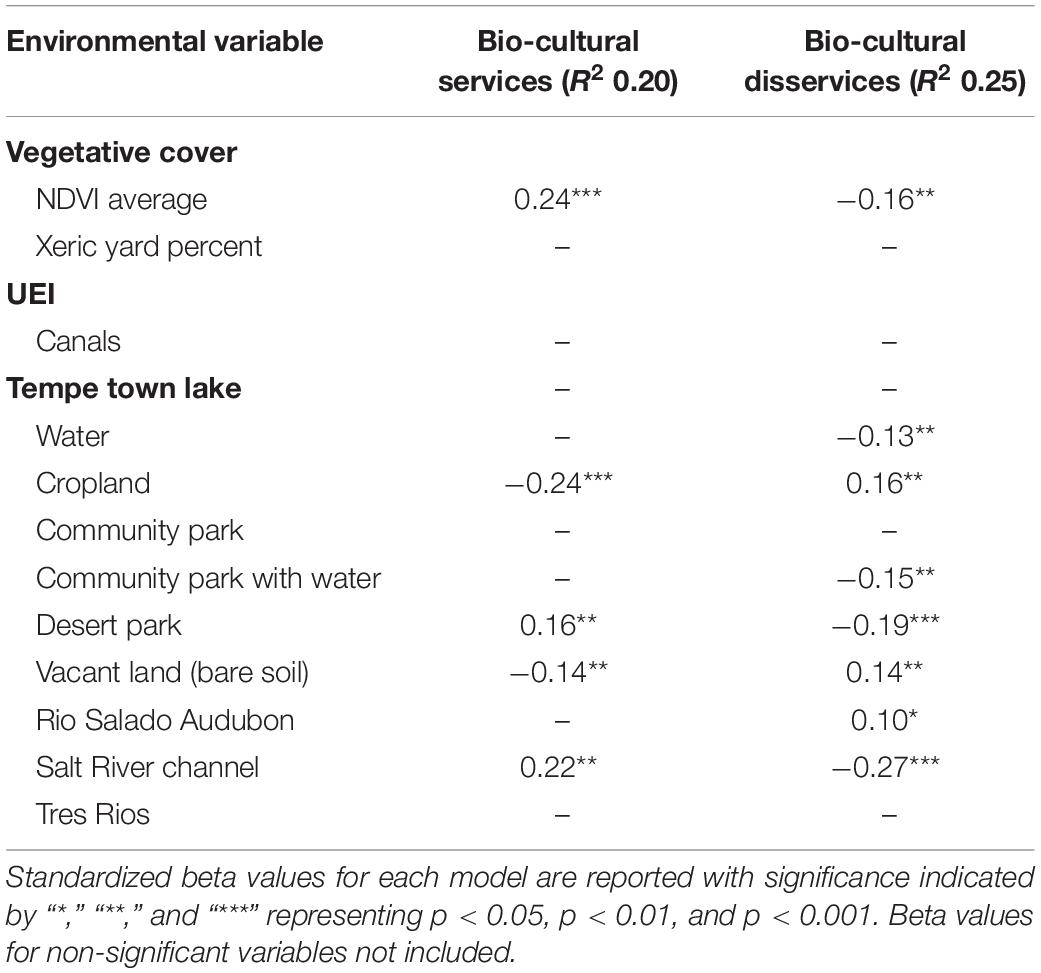
Table 5. Environmental models predicting perceptions of bio-cultural services and disservices. Model fits (R2) for dependent variables are presented.
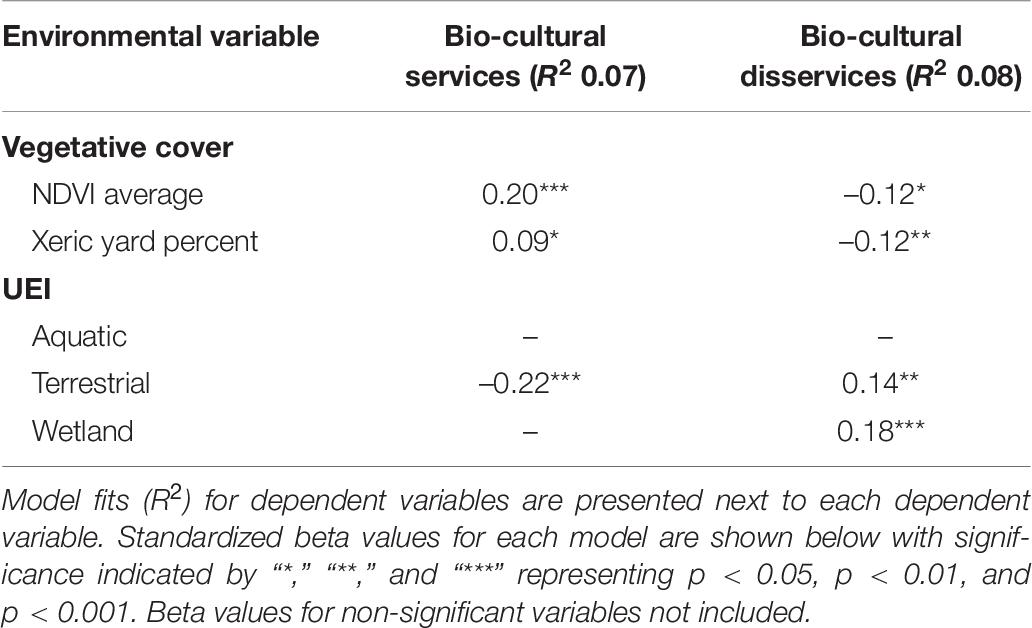
Table 6. Environmental models at the broadly classified UEI level predicting perceptions of bio-cultural services and disservices.
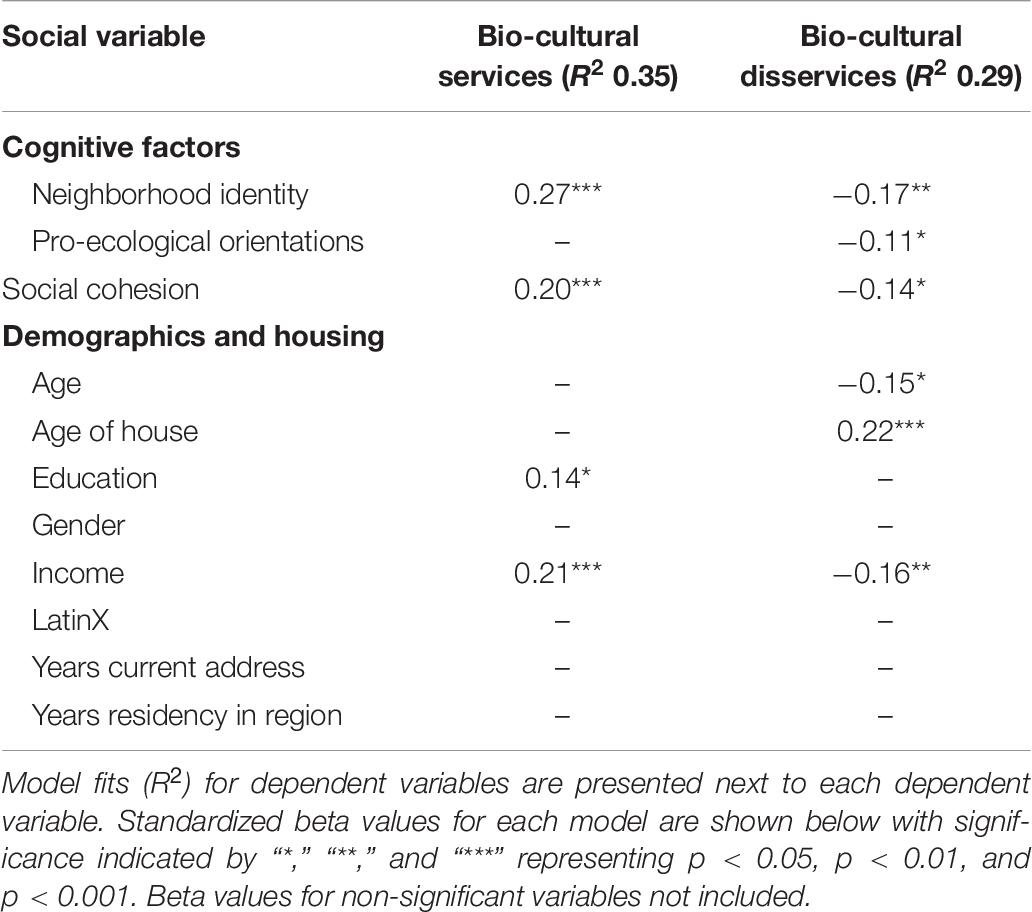
Table 7. Social model results for predicting perceptions of bio-cultural services and disservices.
Out of the two sets of environmental models, the UEI specific models (Table 5) outperformed the broadly classified UEI models (Table 6). For bio-cultural services and disservices separately, the broadly defined UEI models had an R2 of 0.07 and 0.08 (Table 6), whereas the UEI specific models had a fit of 0.20 and 0.25 (Table 5).
The environmental models that captured distinct UEI identified five of the thirteen environmental variables and explained 20% of the variation in perceived bio-cultural services (Table 5). Increasing neighborhood NDVI and proximity to desert preserves significantly increased perceptions of bio-cultural services while increasing the amount of cropland and vacant land decreased perceived bio-cultural services (Table 5).
By comparison, eight of the thirteen environmental variables captured 25% of the variation in perceived disservices (Table 5). The same variables that enhanced perceptions of bio-cultural services decreased perceptions of bio-cultural disservices. Similarly, the variables that diminished perceptions of bio-cultural services increased perceived bio-cultural disservices. Additionally, increasing proximity to the Rio Salado Audubon Area increased perceptions of bio-cultural disservices. Two additional variables, community parks with water and open water, lowered perceptions of bio-cultural disservices but did not increase perceived bio-cultural services.
In the broadly defined UEI model, terrestrial UEI decreased perceived bio-cultural services while increasing bio-cultural disservices. In this model, wetland UEI also increased perceived bio-cultural disservices but had no influence on bio-cultural services (Table 6). Meanwhile, aquatic UEI were not significantly associated with either perceived bio-cultural services or disservices. Additionally, the results from this model show that higher NDVI and more xeric yards also increased perceived bio-cultural services while reducing perceived bio-cultural disservices (Table 6).
As hypothesized, the social models explained more variation in perceived bio-cultural services (R2 = 0.35) as well as disservices (R2 = 0.28) than the environmental models. Of the eleven social variables, four and seven variables were significant in the ecosystem services and disservices models, respectively (Table 7). Identification with one’s neighborhood, as one dimension of local place attachment, was the most influential factor explaining perceived bio-cultural services, followed by income and perceived social cohesion. Education levels, another measure of socioeconomic status, also significantly explained the perceived services.
The same variables significantly explained perceived bio-cultural disservices but in the opposite direction, apart from education which was not significant (Table 7). Additional significant variables included age of housing, which had the largest influence on perceived disservices, with older homes associated with lower perceived bio-cultural disservices. People who have lived in the region longer also tended to perceive more bio-cultural disservices compared to others, while older people perceived fewer disservices. Lastly, pro-ecological worldviews were associated with perceptions of bio-cultural disservices.
The combined models, which included both the social and environmental variables (Table 8), explained the most variation in perceived bio-cultural services (R2 = 0.39) and disservices (R2 = 0.35). Social variables still proved to be strong predictors of perceptions; specifically, neighborhood identity, social cohesion, and income followed the same patterns as in the social model. Environmental variables less strongly explained perceived bio-cultural services, though average NDVI within a neighborhood was positively associated with perceived bio-cultural services while cropland and Tempe Town Lake were negatively associated with bio-cultural services. All other environmental and social variables were statistically insignificant in the combined model for perceived bio-cultural services.
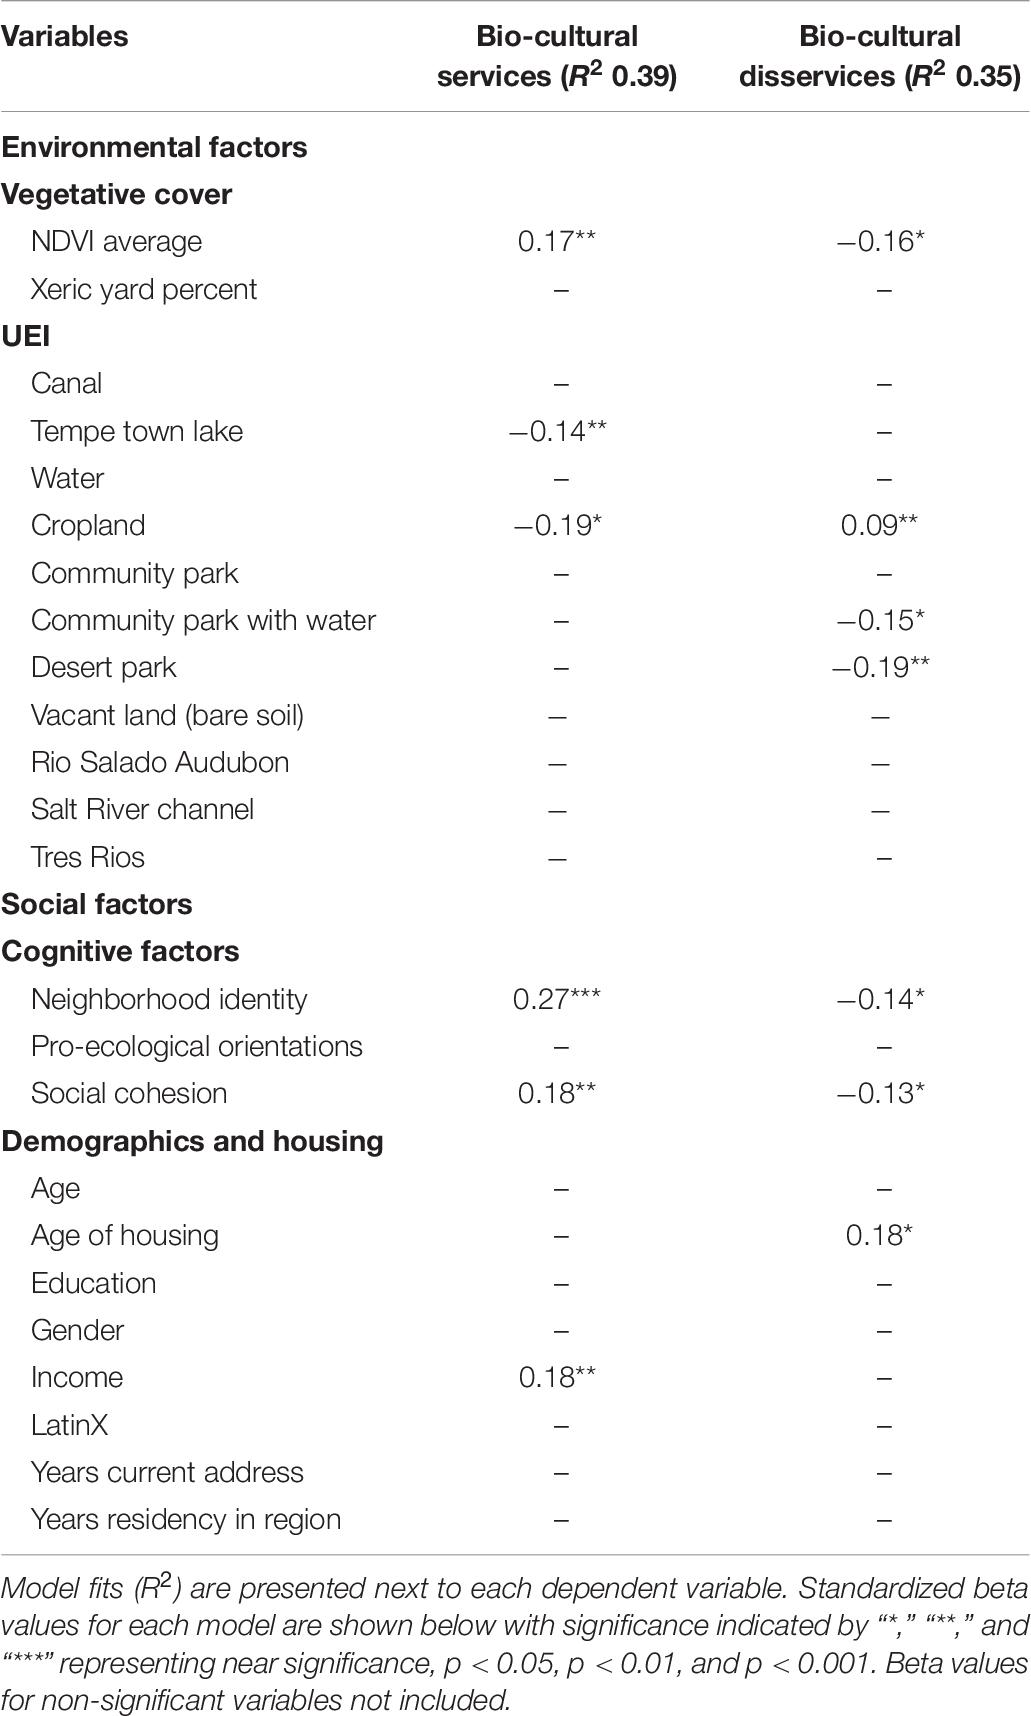
Table 8. The combined model combines environmental and social variables for bio-cultural services and disservices.
In the combined models for perceived bio-cultural disservices, the same variables were significant for perceived bio-cultural services except proximity to Tempe Town Lake (Table 8). Several additional variables uniquely explain perceptions about bio-cultural disservices, including proximity to desert parks (negative relationship), distance to the Salt River and water (both negatively related). Among the social variables, the age of housing was significant with older homes being associated with more perceived disservices.
Our research illustrates that people’s perceptions of bio-cultural services and disservices are related to both local landscape features (including varied UEI) and social factors including personal beliefs and demographics. While these factors can be investigated independently, our results showed that coupling environmental and social factors best explain variations in perceptions of ecosystem services and disservices. Our study also demonstrates the importance of considering social factors, such as neighborhood identity and social cohesion, as drivers of perceived ecosystem services. This consideration is important since the ultimate value placed on bio-cultural services by people depends largely on public perceptions of them, which are often highly subjective and contingent upon personal beliefs and experiences (Heberlein, 2012; Larson et al., 2019). However, since our sample does not represent the entire population of the study area, and instead captures predominantly older individuals with high levels of income and education, we suggest caution in generalizing the results to Phoenix as a whole. However, this work may provide more direct insight into the perception of UEI in arid land systems than other studies conducted in more temperate climates.
While ecologists, planners, and other professionals tout the value of UEI (e.g., Li et al., 2017), our research shows that UEI is not always linked to positive perceptions of local environments among nearby residents. Our results also show that many forms of UEI are negatively perceived (e.g., croplands and wetlands) and thus we recommend careful consideration of how to integrate these features in landscape design and planning. While our dependent variables, bio-cultural services and disservices, only captured a narrow set of perceptions regarding bio-cultural services, as related to their aesthetic quality coupled with vegetation and wildlife features, our results indicate that people’s views vary in relation to local environmental and social factors.
Our analysis of perceived bio-cultural services underscores that, although social factors were more important predictors of people’s perceptions, UEI still plays a role in explaining perceived bio-cultural services and disservices. Our findings suggest that landscape elements such as vegetation density and preserved natural areas can increase people’s aesthetic appreciation of, and support for, UEI while also reducing perceived ecosystem disservices. Similarly, features such as open water can influence aesthetic appreciation (Cottet et al., 2013). However, much of the restored or redeveloped areas of the Salt River channel do not significantly influence perceived bio-cultural services and disservices. Our findings echoed those of Sokolow (2003) and Hamilton et al. (2014) finding negative perceptions of cropland. Therefore, in urbanizing areas with adjacent residential and agricultural land, planners and decision makers may wish to look for ways to mitigate negative perceptions of cropland adjacent to residential areas. Overall, our findings stress the importance of considering the specific characteristics of different UEI as well as the landscape context around UEI when assessing public perceptions of these infrastructure and their associated ecosystem services and disservices.
As one of the most dominant UEI in our study area, cropland was among the most significant predictors of perceived bio-cultural disservices. While agricultural areas can have strong cultural value to those in rural and agrarian communities (Lincoln and Ardoin, 2016), these areas may be perceived negatively by those that live in urban, suburban, and exurban areas (Thomson and Kelvin, 1996; Hamilton et al., 2014). This finding is notable given modern interests in urban and near-urban agriculture for varied purposes such as food security, the reduction of food waste and the carbon footprint associated with food transportation, and open space preservation (Coley et al., 2009; McClintock, 2010; Mok et al., 2014). The form of agriculture present in Phoenix may be particularly unappealing to urban residents, due to its uniform, large, flat monocrop fields with little topographic or vegetative variation, and long periods with bare soil (York et al., 2020). Inclusion of habitat refugia in agricultural lands, which can positively influence perceptions of ecosystem services (Diekötter et al., 2008), might be one angle for enhancing biological conservation and societal appreciation of agricultural lands in metropolitan regions. Efforts to make agricultural areas more suitable for wildlife may also reduce the negative impacts croplands have on perceived biocultural services. Ultimately, the ability to enhance the co-benefits from agriculture will depend on support for farmers (Eakin et al., 2016) and regional development policies.
Our research further illustrates the role of spatially distributed nature preserves and community parks in promoting perceptions of aesthetically pleasing local environments that are also biologically valuable. The lack of significant effects of community parks and other accessible UEI on perceptions might be due to substantial variability across parks in terms of specific park features that influence their perceived bio-cultural value. Given the perceived bio-cultural value of preserved deserts in our Phoenix-based study, combined with overwhelming preferences for neat, orderly landscapes (Nassauer, 1995; Larson and Brumand, 2014), incorporating these design elements into parks and other accessible UEI sites may increase their perceived bio-cultural value among diverse residents. Nonetheless, we recommend additional research to clarify how specific environmental features (e.g., varied vegetation structure and land use contexts) among different UEI influence perceptions in diverse contexts. Since the results from our neighborhood-based survey may be highly context specific, especially in relation to features in local parks such as Tempe Town Lake and Indian Bend Wash (Figure 1), additional research is needed to validate results across different contexts.
Although water influences individual’s perceptions of beauty (Burmil et al., 1999; Völker and Kistemann, 2011), the type of water matters. Respondents positively perceived water when present in community parks, likely due to the aesthetic value placed on open water (e.g., ponds and lakes) (Burmil et al., 1999; Asakawa et al., 2004). But in our study, two large features that contain water were negatively perceived: Tempe Town Lake and the Salt River channel. In the case of Tempe Town Lake, nearby residents may correctly perceive the lack of bio-cultural values offered by this site since the lake’s edge is largely surrounded by concrete paths devoid of significant vegetation, which detracts from its “natural” aesthetic and value to wildlife. In terms of the Salt River Channel, a couple of potential factors may contribute to negative bio-cultural perceptions. The channel and its banks are largely unmanaged and, thus, may appear disorderly or unkempt (Nassauer, 1995). Unhoused people occupy these spaces (Palta et al., 2016; DeMyers et al., 2017), and as a result, the channel and banks may be viewed as messy (i.e., due to associated trash found at these sites) or otherwise unsafe or undesirable. Additionally, evaluations of wetlands are often influenced by factors such as the lack of visible open water, dense vegetation, and pests such as mosquitos (Cottet et al., 2013; Landau and van Leeuwen, 2012).
Another explanation for negative views of aquatic and wetland UEI in the study region is that broader landscape context matters, and in the case of the Salt River, much of the channel is flanked by agricultural or industrial lands. Since industrial areas often produce pollution, noise, and other disservices, they are negatively perceived by people who live near them (Burningham and Thrush, 2004; Flanquart et al., 2013). Therefore, we may be capturing the negative response of individuals to the industrial areas surrounding the Rio Salado Audubon site, as opposed to the restored river channel itself. This may reflect the legacy of historic urban development and the management of rivers as functional conduits (e.g., to deliver water and remove waste).
As investments in UEI grow with the shift from gray to green infrastructure designs (Elmqvist et al., 2015; Li et al., 2017), researchers and practitioners might evaluate how the broader land use context of UEI influences how specific sites are perceived, used, and valued by people. In doing so, it will likely take time to overcome the legacy effects of historic gray infrastructure designs, such that public sentiment shifts from relatively negative views of river channels and associated UEI toward appreciation. Such a shift seems underway in metropolitan Phoenix, as some local governments have started to invest in features (e.g., signage, lights, paved pathways) alongside long-established canals to enhance their recreational amenities (Tenny, 2020). However, these investments are often inequitably distributed (Kuras et al., 2020), thereby potentially contributing to the socioeconomic disparities in perceived services in our analyses (Table 7). Further, the addition of recreational amenities or features such as lights and sidewalks, which increase the usability and value of spaces for people, may negatively impact wildlife and thus reduce bio-cultural services (Bennett et al., 2009).
As public investments in UEI increase, whether for social (e.g., recreational) or ecological (e.g., biological conservation) purposes, the perceived aesthetics are imperative to establish and maintain public support and appreciation. This objective entails designing with “cues of care” that demonstrate intentional maintenance and design features that people value (e.g., curvilinear features, some mown or trimmed vegetation; Nassauer, 1995). Meanwhile, to enhance biological conservation, designing sites with native vegetation, a variety of plants, and significant vegetation structure can help to preserve native biodiversity and provide wildlife habitat (Lerman and Warren, 2011; Standish et al., 2013). We realize, however, that these actions may not be possible in some cases. For instance, the rules established by the Federal Aviation Authority prevent establishment of significant vegetation along Tempe Town Lake, since this UEI is in the flight zone and attracting birds to the area may obstruct or cause concerns for air travel. Additional policies and other factors may constrain UEI features and designs, depending on the primary goals of the infrastructure along with applicable regulations, property ownership, and resources available for investing in UEI.
While the prevalence of UEI in a respondent’s neighborhood predicted perceptions of bio-cultural services, as we hypothesized, social factors, especially neighborhood identity and social cohesion, better predicted perceived ecosystem services and disservices than UEI. This result supports previous findings showing that people who feel a stronger sense of community are more likely to positively perceive their surrounding environment, including the beauty of their neighbors’ homes and yards (Dempsey, 2008; Murphy-Dunning, 2009). This finding is also true for people who feel a strong connection to their neighborhood, as they are more likely to take actions which promote bio-cultural services and reduce bio-cultural disservices (Goltsman et al., 2009; Locke et al., 2020). Interventions that promote social cohesion and increase neighborhood connection, such as scheduling social meetings, gardening, or clean-up events, may be one way to increase the perceived value of local landscapes (King et al., 2010; Yamamoto, 2011). As such, facilitating social cohesion events, including participation in decisions to change and maintain UEI in neighborhoods, may enhance perceptions of local bio-cultural services (Yamamoto, 2011).
Characterizing diverse UEI provides a framework for evaluating their ecological and social benefits and impacts, both real and perceived. The evaluation of perceived ecosystem services and disservices is particularly important for understanding societal appreciation and support for specific UEI and associated characteristics. Although many types of UEI investigated herein did not significantly influence perceived bio-cultural services and disservices, future studies can refine the attributes of UEI beyond broad classifications (such as terrestrial or aquatic). Together, such research can inform specific design features that are valued by people. In developing or redesigning UEI into the future, we recommend that planners, landscape architects, and other site designers and managers work with researchers and community members to create UEI in ways that are socially valued both aesthetically and for biological conservation purposes.
All data analyzed in this study is publicly available and can be found at the CAP LTER data portal (https://data.sustainability.asu.edu/cap-portal/home.jsp).
The studies involving human participants were reviewed and approved by Arizona State University (ID: 662) IRB—Social & Behavioral Research Group. The patients/participants provided their written informed consent to participate in this study.
KL conceptualized the project idea. KL and JB decided upon the methodology and wrote the manuscript. JB conducted all data compilation, analyses, and created all tables and figures for the project. SL acted as lead editor of the manuscript and contributed to methods and writing. DC helped classify urban ecological infrastructure, contributed writing, and provided comments. RA contributed writing and provided comments for the manuscript. HB contributed to the methodology and provided comments. SH, PW, and AY contributed comments and reviewed the manuscript. KL and AY co-directed the social survey referenced in this study. All authors contributed to the article and approved the submitted version.
This material was supported by the National Science Foundation under grant number DEB-1832016, Central Arizona-Phoenix Long-Term Ecological Research Program (CAP LTER), with additional support provided by the NSF Macrosystems Biology program grant number MSB FRA 1638725.
The authors declare that the research was conducted in the absence of any commercial or financial relationships that could be construed as a potential conflict of interest.
We thank to Jordan Smith and Billie L. Turner for providing the vacant land data for this project. Lastly, we also thank Sally Wittlinger for her assistance with compiling datasets that represent the location of UEI in the study area.
The Supplementary Material for this article can be found online at: https://www.frontiersin.org/articles/10.3389/fevo.2020.569730/full#supplementary-material
Alves, S., Aspinall, P. A., Ward Thompson, C., Sugiyama, T., Brice, R., and Vickers, A. (2008). Preferences of older people for environmental attributes of local parks: the use of choice-based conjoint analysis. Facilities 26, 433–453. doi: 10.1108/02632770810895705
Andrade, R., Larson, K. L., Hondula, D. M., and Franklin, J. (2019). Social–spatial analyses of attitudes toward the desert in a Southwestern U.S. City. Ann. Am. Assoc. Geogr. 109, 1845–1864. doi: 10.1080/24694452.2019.1580498
Artmann, M., Kohler, M., Meinel, G., Gan, J., and Ioja, I.-C. (2019). How smart growth and green infrastructure can mutually support each other — a conceptual framework for compact and green cities. Ecol. Indic. 96, 10–22. doi: 10.1016/j.ecolind.2017.07.001
Asakawa, S., Yoshida, K., and Yabe, K. (2004). Perceptions of urban stream corridors within the greenway system of Sapporo, Japan. Lands. Urban Plan. 68, 167–182. doi: 10.1016/S0169-2046(03)00158-0
Belaire, J. A., Westphal, L. M., Whelan, C. J., and Minor, E. S. (2015). Urban residents’ perceptions of birds in the neighborhood: biodiversity, cultural ecosystem services, and disservices. Condor 117, 192–202. doi: 10.1650/CONDOR-14-128.1
Bell, P. A., Greene, T. C., Fisher, J. D., and Baum, A. (1996). Environmental Psychology, 4th Edn. Orlando, FL: Harcourt.
Bennett, V. J., Beard, M., Zollner, P. A., Fernández-Juricic, E., Westphal, L., and LeBlanc, C. L. (2009). Understanding wildlife responses to human disturbance through simulation modelling: a management tool. Ecol. Complex. 6, 113–134. doi: 10.1016/j.ecocom.2008.08.002
Brown, G., and Raymond, C. (2007). The relationship between place attachment and landscape values: toward mapping place attachment. Appl. Geogr. 27, 89–111. doi: 10.1016/j.apgeog.2006.11.002
Bruvold, W. H. (1973). Belief and behavior as determinants of environmental attitudes. Environ. Behav. 5, 202–218. doi: 10.1177/001391657300500205
Buizer, M., Elands, B., and Vierikko, K. (2016). Governing cities reflexively—The biocultural diversity concept as an alternative to ecosystem services. Environ. Sci. Policy 62, 7–13. doi: 10.1016/j.envsci.2016.03.003
Burmil, S., Daniel, T. C., and Hetherington, J. D. (1999). Human values and perceptions of water in arid landscapes. Landsc. Urban Plan. 44, 99–109. doi: 10.1016/S0169-2046(99)00007-9
Burningham, K., and Thrush, D. (2004). Pollution concerns in context: a comparison of local perceptions of the risks associated with living close to a road and a chemical factory. J. Risk Res. 7, 213–232. doi: 10.1080/1366987042000158721
Cadenasso, M. L., Pickett, S. T. A., McGrath, B., and Marshall, V. (2013). “Ecological Heterogeneity in Urban Ecosystems: reconceptualized Land Cover Models as a Bridge to Urban Design,” in Resilience in Ecology and Urban Design: Linking Theory and Practice for Sustainable Cities Future City, eds S. T. A. Pickett, M. L. Cadenasso, and B. McGrath (Dordrecht: Springer), 107–129. doi: 10.1007/978-94-007-5341-9_6
Cadenasso, M. L., Pickett, S. T. A., and Schwarz, K. (2007). Spatial heterogeneity in urban ecosystems: reconceptualizing land cover and a framework for classification. Front. Ecol. Environ. 5, 80–88.
Campbell, S. (1996). Green cities, growing cities, just cities: Urban planning and the contradictions of sustainable development. J. Am. Plan. Assoc. 62, 296–312. doi: 10.1080/01944369608975696
Casalegno, S., Inger, R., DeSilvey, C., and Gaston, K. J. (2013). Spatial covariance between aesthetic value & other ecosystem services. PLoS One 8:e0068437. doi: 10.1371/journal.pone.0068437
Childers, D. L., Bois, P., Hartnett, H. E., McPhearson, T., Metson, G. S., and Sanchez, C. A. (2019). Urban ecological infrastructure: an inclusive concept for the non-built urban environment. Elem. Sci. Anth. 7:46. doi: 10.1525/elementa.385
Colding, J., and Barthel, S. (2013). The potential of ‘Urban Green Commons’ in the resilience building of cities. Ecol. Econ. 86, 156–166. doi: 10.1016/j.ecolecon.2012.10.016
Coley, D., Howard, M., and Winter, M. (2009). Local food, food miles and carbon emissions: a comparison of farm shop and mass distribution approaches. Food Policy 34, 150–155. doi: 10.1016/j.foodpol.2008.11.001
Cottet, M., Piégay, H., and Bornette, G. (2013). Does human perception of wetland aesthetics and healthiness relate to ecological functioning? J. Environ. Manage. 128, 1012–1022. doi: 10.1016/j.jenvman.2013.06.056
Cox, D. T. C., Shanahan, D. F., Hudson, H. L., Fuller, R. A., Anderson, K., Hancock, S., et al. (2017a). Doses of nearby nature simultaneously associated with multiple health benefits. Int. J. Environ. Res. Public Health 14:172. doi: 10.3390/ijerph14020172
Cox, D. T. C., Shanahan, D. F., Hudson, H. L., Plummer, K. E., Siriwardena, G. M., Fuller, R. A., et al. (2017b). Doses of neighborhood nature: the benefits for mental health of living with nature. Bioscience 67, 147–155. doi: 10.1093/biosci/biw173
Dallimer, M., Irvine, K. N., Skinner, A. M. J., Davies, Z. G., Rouquette, J. R., Maltby, L. L., et al. (2012). Biodiversity and the feel-good factor: understanding associations between self-reported human well-being and species richness. Bioscience 62, 47–55. doi: 10.1525/bio.2012.62.1.9
de Groot, R. S., Alkemade, R., Braat, L., Hein, L., and Willemen, L. (2010). Challenges in integrating the concept of ecosystem services and values in landscape planning, management and decision making. Ecol. Complex. 7, 260–272. doi: 10.1016/j.ecocom.2009.10.006
Dempsey, N. (2008). Does quality of the built environment affect social cohesion? Proc. Inst. Civ. Eng. Urban Des. Plan. 161, 105–114. doi: 10.1680/udap.2008.161.3.105
DeMyers, C., Warpinski, C., and Wutich, A. (2017). Urban water insecurity: a case study of homelessness in phoenix, Arizona. Environ. Justice 10, 72–80. doi: 10.1089/env.2016.0043
Diekötter, T., Billeter, R., and Crist, T. O. (2008). Effects of landscape connectivity on the spatial distribution of insect diversity in agricultural mosaic landscapes. Basic Appl. Ecol. 9, 298–307. doi: 10.1016/j.baae.2007.03.003
Dunlap, R. E., Van Liere, K. D., Mertig, A. G., and Jones, R. E. (2000). New trends in measuring environmental attitudes: measuring endorsement of the new ecological paradigm: a revised NEP scale. J. Soc. Isssues 56, 425–442. doi: 10.1111/0022-4537.00176
Eakin, H., York, A., Aggarwal, R., Waters, S., Welch, J., Rubiños, C., et al. (2016). Cognitive and institutional influences on farmers’ adaptive capacity: insights into barriers and opportunities for transformative change in Central Arizona. Reg. Environ. Change 16, 801–814. doi: 10.1007/s10113-015-0789-y
Ekkel, E. D., and de Vries, S. (2017). Nearby green space and human health: evaluating accessibility metrics. Landsc. Urban Plan. 157, 214–220. doi: 10.1016/j.landurbplan.2016.06.008
Elmqvist, T., Setälä, H., Handel, S., van der Ploeg, S., Aronson, J., Blignaut, J., et al. (2015). Benefits of restoring ecosystem services in urban areas. Curr. Opin. Environ. Sustain. 14, 101–108. doi: 10.1016/j.cosust.2015.05.001
Fernandes, C. O., da Silva, I. M., Teixeira, C. P., and Costa, L. (2019). Between tree lovers and tree haters. Drivers of public perception regarding street trees and its implications on the urban green infrastructure planning. Urban Forest. Urban Green. 37, 97–108.
Fish, R., Church, A., and Winter, M. (2016). Conceptualising cultural ecosystem services: a novel framework for research and critical engagement. Ecosyst. Serv. 21, 208–217. doi: 10.1016/j.ecoser.2016.09.002
Flannigan, J. (2005). An evaluation of residents’ attitudes to street trees in southwest England. Arboric. J. 28, 219–241.
Flanquart, H., Hellequin, A.-P., and Vallet, P. (2013). Living alongside hazardous factories: risk, choice and necessity. Health Risk Soc. 15, 663–680. doi: 10.1080/13698575.2013.855714
Flynn, J., Slovic, P., and Mertz, C. K. (1994). Gender, race, and perception of environmental health risks. Risk Anal. 14, 1101–1108. doi: 10.1111/j.1539-6924.1994.tb00082.x
Godbey, G., and Blazey, M. (1983). Old people in urban parks: an exploratory investigation. J. Leis. Res. 15, 229–244. doi: 10.1080/00222216.1983.11969558
Goerres, A. (2007). Why are older people more likely to vote? The impact of ageing on electoral turnout in Europe. Br. J. Polit. Int. Relat. 9, 90–121. doi: 10.1111/j.1467-856x.2006.00243.x
Goltsman, S., Kelly, L., McKay, S., Algara, P., and Wight, L. (2009). Raising “Free Range Kids”: creating neighborhood parks that promote environmental stewardship. J. Green Build. 4, 90–106. doi: 10.3992/jgb.4.2.90
Gregorio, J. D., and Lee, J.-W. (2002). Education and income inequality: new evidence from cross-country data. Rev. Income Wealth 48, 395–416. doi: 10.1111/1475-4991.00060
Groffman, P. M., Avolio, M., Cavender-Bares, J., Bettez, N. D., Grove, J. M., Hall, S. J., et al. (2017). Ecological homogenization of residential macrosystems. Nat. Ecol. Evol. 1:191.
Groffman, P. M., Cavender-Bares, J., Bettez, N. D., Grove, J. M., Hall, S. J., Heffernan, J. B., et al. (2014). Ecological homogenization of urban USA. Front. Ecol. Environ. 12, 74–81. doi: 10.1890/120374
Hamilton, A. J., Burry, K., Mok, H.-F., Barker, S. F., Grove, J. R., and Williamson, V. G. (2014). Give peas a chance? Urban agriculture in developing countries. A review. Agron. Sustain. Dev. 34, 45–73. doi: 10.1007/s13593-013-0155-8
Hernández-Morcillo, M., Plieninger, T., and Bieling, C. (2013). An empirical review of cultural ecosystem service indicators. Ecol. Indic. 29, 434–444. doi: 10.1016/j.ecolind.2013.01.013
James, G., Witten, D., Hastie, T., and Tibshirani, R. (2014). An Introduction to Statistical Learning: With Applications in R. New York, NY: Springer Publishing Company, Incorporated.
Kane, K., and York, A. M. (2017). Prices, policies, and place: what drives greenfield development? Land Use Policy 68, 415–428. doi: 10.1016/j.landusepol.2017.07.044
Keys, E., Wentz, E. A., and Redman, C. L. (2007). The spatial structure of land use from 1970–2000 in the Phoenix, Arizona, Metropolitan Area. Prof. Geogr. 59, 131–147. doi: 10.1111/j.1467-9272.2007.00596.x
King, E., Samii, C., and Snilstveit, B. (2010). Interventions to promote social cohesion in sub-Saharan Africa. J. Dev. Effect. 2, 336–370. doi: 10.1080/17449057.2010.504552
Kuras, E. R., Warren, P. S., Zinda, J. A., Aronson, M. F. J., Cilliers, S., Goddard, M. A., et al. (2020). Urban socioeconomic inequality and biodiversity often converge, but not always: a global meta-analysis. Landsc. Urban Plan. 198:103799. doi: 10.1016/j.landurbplan.2020.103799
Landau, K. I., and van Leeuwen, W. J. D. (2012). Fine scale spatial urban land cover factors associated with adult mosquito abundance and risk in Tucson, Arizona. J. Vector Ecol. 37, 407–418. doi: 10.1111/j.1948-7134.2012.00245.x
Larson, E. K., and Grimm, N. B. (2012). Small-scale and extensive hydrogeomorphic modification and water redistribution in a desert city and implications for regional nitrogen removal. Urban Ecosyst. 15, 71–85. doi: 10.1007/s11252-011-0208-1
Larson, K., and Brumand, J. (2014). Paradoxes in landscape management and water conservation: examining neighborhood norms and institutional forces. Environment 7:6.
Larson, K., Corley, E., Andrade, R., Hall, S., York, A., Meerow, S., et al. (2019). Subjective evaluations of ecosystem services and disservices: an approach to creating and analyzing robust survey scales. Ecol. Soc. 24:7. doi: 10.5751/ES-10888-240207
Larson, K., York, A., Andrade, R., and Wittlinger, S. (2020). Phoenix Area Social Survey (PASS): 2017 ver 2. Available online at: https://doi.org/10.6073/pasta/00cbd53778cf38d5f6639cf0bdbba006 (accessed October 01, 2020).
Larson, K. L., Casagrande, D., Harlan, S. L., and Yabiku, S. T. (2009). Residents’ yard choices and rationales in a desert city: social priorities, ecological impacts, and decision tradeoffs. Environ. Manage. 44, 921–937. doi: 10.1007/s00267-009-9353-1
Larsen, L., Harlan, S. L., Bolin, B., Hackett, E. J., Hope, D., Kirby, A., et al. (2004). Bonding and bridging: understanding the relationship between social capital and civic action. J. Plann. Educ. Res. 24, 64–77. doi: 10.1177/0739456X04267181
Lerman, S. B., and Warren, P. S. (2011). The conservation value of residential yards: linking birds and people. Ecol. Appl. 21, 1327–1339. doi: 10.1890/10-0423.1
Li, F., Liu, X., Zhang, X., Zhao, D., Liu, H., Zhou, C., et al. (2017). Urban ecological infrastructure: an integrated network for ecosystem services and sustainable urban systems. J. Clean. Prod. 163, S12–S18. doi: 10.1016/j.jclepro.2016.02.079
Li, X., Zhou, Y., Zhu, Z., Liang, L., Yu, B., and Cao, W. (2018). Mapping annual urban dynamics (1985–2015) using time series of Landsat data. Remote Sen. Environ. 216, 674–683. doi: 10.1016/j.rse.2018.07.030
Lincoln, N. K., and Ardoin, N. M. (2016). Cultivating values: environmental values and sense of place as correlates of sustainable agricultural practices. Agric. Hum. Values 33, 389–401. doi: 10.1007/s10460-015-9613-z
Locke, D. H., York, A., and Grove, J. M. (2020). Know your watershed and know your neighbor: paths to supporting urban watershed conservation and restoration in Baltimore, MD and Phoenix, AZ. Landsc. Urban Plan. 195:103714. doi: 10.1016/j.landurbplan.2019.103714
Lundmark, C. (2007). The new ecological paradigm revisited: anchoring the NEP scale in environmental ethics. Environ. Educ. Res. 13, 329–347. doi: 10.1080/13504620701430448
Lyytimäki, J., Petersen, L. K., Normander, B., and Bezák, P. (2008). Nature as a nuisance? Ecosystem services and disservices to urban lifestyle. Environ. Sci. 5, 161–172. doi: 10.1080/15693430802055524
Macedo, J., and Haddad, M. A. (2016). Equitable distribution of open space: using spatial analysis to evaluate urban parks in Curitiba, Brazil. Environ. Plann. B Plann. Des. 43, 1096–1117. doi: 10.1177/0265813515603369
MacKinnon, D., and Derickson, K. D. (2013). From resilience to resourcefulness: a critique of resilience policy and activism. Prog. Hum. Geogr. 37, 253–270.
Maricopa Association of Governments (2014). Maricopa Association of Governments Municipal Parks and Recreations Areas. Available online at: https://recreation.azmag.gov/ (accessed January 13, 2019).
Maruthaveeran, S., and van den Bosh, C. K. (2015). Fear of crime in urban parks – What the residents of Kuala Lumpur have to say? Urban Forest. Urban Green. 14, 702–713. doi: 10.1016/j.ufug.2015.05.012
Marzluff, J., and Rodewald, A. (2008). Conserving biodiversity in urbanizing areas: nontraditional views from a Bird’s perspective. Environment 1:6.
McClintock, N. (2010). Why farm the city? Theorizing urban agriculture through a lens of metabolic rift. Cambridge J. Regions Econ. Soc. 3, 191–207. doi: 10.1093/cjres/rsq005
McPhearson, T., Haase, D., Kabisch, N., and Gren, Å. (2016). Advancing understanding of the complex nature of urban systems. Ecol. Indic. 70, 566–573. doi: 10.1016/j.ecolind.2016.03.054
Melosi, M. V. (2008). The Sanitary City: Environmental Services in Urban America from Colonial Times to the Present. Pittsburgh, PA: University of Pittsburgh.
Mohai, P. (1997). Gender differences in the perception of most important environmental problems. Race Gender Class 5, 153–169.
Mok, H.-F., Williamson, V. G., Grove, J. R., Burry, K., Barker, S. F., and Hamilton, A. J. (2014). Strawberry fields forever? Urban agriculture in developed countries: a review. Agron. Sustain. Dev. 34, 21–43. doi: 10.1007/s13593-013-0156-7
Momsen, J. H. (2007). Gender and biodiversity: a new approach to linking environment and development. Geogr. Compass 1, 149–162. doi: 10.1111/j.1749-8198.2007.00011.x
Morgan, J., and David, M. (1963). Education and income. Q. J. Econ. 77, 423–437. doi: 10.2307/1879570
Murphy-Dunning, C. (2009). “From front yards to street corners: revitalizing neighborhoods through community-based land stewardship,” in Restorative Commons: Creating Health and Well-Being through Urban Landscapes. Gen. Tech Rep. NRS-P-39, eds C. Lindsay and W. Anne (Washington, DC: U.S. Department of Agriculture), 154–163.
Nassauer, J. I. (1995). Messy Ecosystems, Orderly Frames. Landsc. J. 14, 161–170. doi: 10.3368/lj.14.2.161
Niemelä, J., Saarela, S.-R., Söderman, T., Kopperoinen, L., Yli-Pelkonen, V., Väre, S., et al. (2010). Using the ecosystem services approach for better planning and conservation of urban green spaces: a Finland case study. Biodivers. Conserv. 19, 3225–3243. doi: 10.1007/s10531-010-9888-8
Palta, M., du Bray, M. V., Stotts, R., Wolf, A., and Wutich, A. (2016). Ecosystem services and disservices for a vulnerable population: findings from urban waterways and wetlands in an American desert city. Hum. Ecol. 44, 463–478. doi: 10.1007/s10745-016-9843-8
Paul, A., Downton, P. F., Okoli, E., Gupta, J. K., and Tirpak, M. (2014). Does adding more lettuce make a hamburger truly green? A metaphor behind the green movement paradigm in designing cities. Environ. Syst. Decis. 34, 373–377. doi: 10.1007/s10669-014-9507-4
Pett, T. J., Shwartz, A., Irvine, K. N., Dallimer, M., and Davies, Z. G. (2016). Unpacking the people–biodiversity paradox: a conceptual framework. Bioscience 66, 576–583. doi: 10.1093/biosci/biw036
Pickett, S. T. A., and Cadenasso, M. L. (2008). Linking ecological and built components of urban mosaics: an open cycle of ecological design. J. Ecol. 96, 8–12.
Pickett, S. T. A., Cadenasso, M. L., Rosi-Marshall, E. J., Belt, K. T., Groffman, P. M., Grove, J. M., et al. (2017). Dynamic heterogeneity: a framework to promote ecological integration and hypothesis generation in urban systems. Urban Ecosyst. 20, 1–14. doi: 10.1007/s11252-016-0574-9
Pincetl, S. (2010). From the sanitary city to the sustainable city: challenges to institutionalising biogenic (nature’s services) infrastructure. Local Environ. 15, 43–58. doi: 10.1080/13549830903406065
Pitts, S. L., Hughes, B. D., and Mali, I. (2017). Rattlesnake nuisance removals and urban expansion in Phoenix, Arizona. West. N. Am. Nat. 77, 309–316. doi: 10.3398/064.077.0304
Putnam, R. D. (2000). Bowling Alone: The Collapse and Revival of American Community. New York, NY: Simon and Schuster.
R Core Team (2019). R: A Language and Environment for Statistical Computing. Vienna: R Foundation for Statistical Computing. Available online at: https://www.R-project.org/
Ramer, H., Nelson, K. C., Spivak, M., Watkins, E., Wolfin, J., and Pulscher, M. (2019). Exploring park visitor perceptions of ‘flowering bee lawns’ in neighborhood parks in Minneapolis, MN, US. Landsc. Urban Plan. 189, 117–128. doi: 10.1016/j.landurbplan.2019.04.015
Rega-Brodsky, C. C., Nilon, C. H., and Warren, P. S. (2018). Balancing urban biodiversity needs and resident preferences for vacant lot management. Sustainability 10:1679. doi: 10.3390/su10051679
Shackleton, C. M., Ruwanza, S., Sinasson Sanni, G. K., Bennett, S., De Lacy, P., Modipa, R., et al. (2016). Unpacking Pandora’s Box: Understanding and Categorising Ecosystem Disservices for Environmental Management and Human Wellbeing. Available online at: https://pubag.nal.usda.gov/catalog/5202068 (accessed May 27, 2020).
Shwartz, A., Turbé, A., Simon, L., and Julliard, R. (2014). Enhancing urban biodiversity and its influence on city-dwellers: an experiment. Biol. Conserv. 171, 82–90. doi: 10.1016/j.biocon.2014.01.009
Smith, J. P., Li, X., and Turner, B. L. (2017). Lots for greening: identification of metropolitan vacant land and its potential use for cooling and agriculture in Phoenix, AZ, USA. Appl. Geogr. 85, 139–151. doi: 10.1016/j.apgeog.2017.06.005
Smith, V. K., Larson, K. L., and York, A. (2020). Using quality signaling to enhance survey response rates. Appl. Econ. Lett. 27, 951–954. doi: 10.1080/13504851.2019.1646869
Sokolow, A. D. (2003). California’s Edge Problem: Urban Impacts on Agriculture. Davis, CA: UC Giannini Foundation of Agricultural Economics.
Sorensen, A. E., Jordan, R. C., Blaise, G., Brown, J., Campbell, L. K., Aronson, M. F. J., et al. (2018). Drivers of public participation in urban restoration stewardship programs: linkages between environmental identity and knowledge, and motivations. Arboric. Urban Forest. 44, 266–282.
Soulsbury, C. D., and White, P. C. L. (2016). Human–wildlife interactions in urban areas: a review of conflicts, benefits and opportunities. Wildl. Res. 42, 541–553. doi: 10.1071/WR14229
Sreetheran, M., and van den Bosch, C. C. K. (2014). A socio-ecological exploration of fear of crime in urban green spaces – a systematic review. Urban Forest. Urban Green. 13, 1–18. doi: 10.1016/j.ufug.2013.11.006
Standish, R. J., Hobbs, R. J., and Miller, J. R. (2013). Improving city life: options for ecological restoration in urban landscapes and how these might influence interactions between people and nature. Landsc. Ecol. 28, 1213–1221.
Stoffel, E. (2020). Perceptions of Safety and Plant Diversity Preferences: A Case Study of High Vacancy Neighborhoods. Available online at: https://krex.k-state.edu/dspace/handle/2097/40612 (accessed June 3, 2020).
Suchy, A. K., Palta, M. M., Stromberg, J. C., and Childers, D. L. (2019). High potential nitrate removal by urban accidental wetlands in a desert city: limitations and spatiotemporal patterns. Ecosystems 23, 1227–1242. doi: 10.1007/s10021-019-00465-8
Syrbe, R.-U., and Walz, U. (2012). Spatial indicators for the assessment of ecosystem services: providing, benefiting and connecting areas and landscape metrics. Ecol. Indic. 21, 80–88. doi: 10.1016/j.ecolind.2012.02.013
Tengberg, A., Fredholm, S., Eliasson, I., Knez, I., Saltzman, K., and Wetterberg, O. (2012). Cultural ecosystem services provided by landscapes: Assessment of heritage values and identity. Ecosyst. Serv. 2, 14–26. doi: 10.1016/j.ecoser.2012.07.006
Tenny, W. (2020). Phoenix Grand Canal Transformed into Recreational Amenity. Available online at: https://www.pinalcentral.com/arizona_news/phoenix-grand-canal-transformed-into-recreational-amenity/article_185e6971-0926-584e-9c1e-0e369f06208f.html (accessed March 6, 2020).
Thomson, J., and Kelvin, R. (1996). Suburbanites’ perceptions about agriculture: the challenge for media. J. Appl. Commun. 80, 11–20. doi: 10.4148/1051-0834.1339
Trimble, M., and Trimble, M. (2003). Arizoniana: Stories from Old Arizona. Phoenix, AZ: Golden West Publishers.
Tzoulas, K., Korpela, K., Venn, S., Yli-Pelkonen, V., Kaźmierczak, A., Niemela, J., et al. (2007). Promoting ecosystem and human health in urban areas using green infrastructure: a literature review. Landsc. Urban Plann. 81, 167–178. doi: 10.1016/j.landurbplan.2007.02.001
United Nations, Department of Economic and Social Affairs, Population Division (2019). World Population Prospects 2019: Highlights (ST/ESA/SER.A/423).
United States Geological Survery (2010). Water Resources Data for the United States, Water Year 2010; Gauge 09498500. Salt River near Roosevelt, AZ.
van Heezik, Y., and Ludwig, K. (2012). Proximity to source populations and untidy gardens predict occurrence of a small lizard in an urban area. Landsc. Urban Plann. 104, 253–259. doi: 10.1016/j.landurbplan.2011.10.016
Vaske, J. J., and Kobrin, K. C. (2001). Place attachment and environmentally responsible behavior. J. Environ. Educ. 32, 16–21. doi: 10.1080/00958960109598658
Völker, S., and Kistemann, T. (2011). The impact of blue space on human health and well-being – salutogenetic health effects of inland surface waters: a review. Int. J. Hygiene Environ. Health 214, 449–460. doi: 10.1016/j.ijheh.2011.05.001
Williams, D. R., and Vaske, J. J. (2003). The measurement of place attachment: validity and generalizability of a psychometric approach. For. Sci. 49, 830–840. doi: 10.1093/forestscience/49.6.830
Yamamoto, M. (2011). Community newspaper use promotes social cohesion. Newsp. Res. J. 32, 19–33. doi: 10.1177/073953291103200103
York, A. M., Eakin, H., Bausch, J. C., Smith-Heisters, S., Anderies, J. M., Aggarwal, R., et al. (2020). Agricultural water governance in the desert: shifting risks in Central Arizona. Water Altern. 13, 418–445.
York, A. M., Kane, K., Clark, C. M., Gentile, L. E., Wutich, A., and Harlan, S. L. (2017). What determines public support for graduated development impact fees? State Local Gov. Rev. 49, 15–26. doi: 10.1177/0160323X17716745
Zhang, Y., and Li, X. (2017). Land Cover Classification of the CAP LTER Study Area at Five-Year Intervals from 1985 to 2010 Using Landsat Imagery. Available online at: https://doi.org/10.6073/pasta/dab4db27974f6c8d5b91a91d30c7781d (accessed October 02, 2020).
Keywords: ecosystem services and disservices, urban ecological infrastructure, perceptions, urban planning, urban nature
Citation: Brown JA, Larson KL, Lerman SB, Childers DL, Andrade R, Bateman HL, Hall SJ, Warren PS and York AM (2020) Influences of Environmental and Social Factors on Perceived Bio-Cultural Services and Disservices. Front. Ecol. Evol. 8:569730. doi: 10.3389/fevo.2020.569730
Received: 04 June 2020; Accepted: 29 September 2020;
Published: 22 October 2020.
Edited by:
Stephanie Pincetl, University of California, Los Angeles, United StatesReviewed by:
G. Darrel Jenerette, University of California, Riverside, United StatesCopyright © 2020 Brown, Larson, Lerman, Childers, Andrade, Bateman, Hall, Warren and York. This is an open-access article distributed under the terms of the Creative Commons Attribution License (CC BY). The use, distribution or reproduction in other forums is permitted, provided the original author(s) and the copyright owner(s) are credited and that the original publication in this journal is cited, in accordance with accepted academic practice. No use, distribution or reproduction is permitted which does not comply with these terms.
*Correspondence: Jeffrey A. Brown, SmVmZi5hbGV4YW5kZXIuYnJvd25AZ21haWwuY29t
†These authors share first authorship
Disclaimer: All claims expressed in this article are solely those of the authors and do not necessarily represent those of their affiliated organizations, or those of the publisher, the editors and the reviewers. Any product that may be evaluated in this article or claim that may be made by its manufacturer is not guaranteed or endorsed by the publisher.
Research integrity at Frontiers
Learn more about the work of our research integrity team to safeguard the quality of each article we publish.