- 1Marine Biogeoscience, Alfred-Wegener-Institut, Helmholtz-Zentrum für Polar- und Meeresforschung, Bremerhaven, Germany
- 2MARUM–Zentrum für Marine Umweltwissenschaften, Universität Bremen, Bremen, Germany
- 3Department of Ocean Systems, NIOZ Royal Netherlands Institute for Sea Research, Den Burg, Netherlands
Most studies designed to better understand biomineralization by foraminifera focus mainly on their shell chemistry in order to retrace processes responsible for element uptake and shell formation. Still, shell formation is a combination of not only chemical and biological processes, but is also limited by structural features. Since the processes involved in the formation of the foraminifera shell remains elusive, new focus has been put on potential structural constraints during shell formation. Revealing structural details of shells of foraminifera might increase our mechanistic understanding of foraminifera calcification, and even explain species-specific differences in element incorporation. Recently, shell structures have been studied in increasingly higher resolution and detail. This paper aims to provide new insights on the structural features on foraminifera shells, so-called cogwheels, which can be observed in the shell wall and at its surface. Here, we present a novel method to image and quantify these cogwheel structures, using field specimens from different environments and ecological groups, including benthic and planktonic species. Application of this method allows for comparing shell structures at specimen and species level, to unravel potential drivers of shell formation.
Introduction
Foraminifera are favorite tools for paleoceanography to reconstruct past climate. For example, the chemical and isotopic composition of the shell has been successfully used to quantify past seawater temperature, salinity and carbonate system parameters (e.g., Shackleton, 1987; Barker et al., 2005; Rae et al., 2011; Wit et al., 2013; Foster and Rae, 2016). However, the formation of the foraminifera shell remains elusive, especially to account for species-specific differences in element incorporation (e.g., Toyofuku et al., 2011; van Dijk et al., 2017; Yu et al., 2019). Most approaches to unravel biomineralization processes in foraminifera calcification focus solely on single species and mainly investigate shell chemistry to retrace element uptake. Still, shell formation is a combination of not only chemical but also biological processes, limited by structural constraints like organic templates and crystallographic orientation of the calcium carbonate crystals (e.g., Nakajima et al., 2016; Nagai et al., 2018; Tyszka et al., 2019), and all these aspects have to be considered when trying to explain calcification on successive taxonomic levels. This paper aims to provide new insights on the structural constraints and features of shell construction, as observed in the shell wall and on the shell surface.
The examination of the foraminifera wall began in the mid 19th century, when Ehrenberg (1854) showed the first image of foraminifera in polarized light. The largest breakthrough came in 1921, when Sollas (1921) described the radial orientation of calcite crystals in some hyaline species, i.e., perpendicular to the chamber wall, while in porcelaneous species, the crystals were generally aligned parallel to the surface, felted together. These and other observations led to the determination of three types of wall textures in hyaline foraminifera by Wood (1948): (i) granular shell in which the C axes of the granules are irregularly arranged, (ii) radial shell composed of numerous equidimensional granules each with the C axis perpendicular to the surface of the wall, first reported by Sorby (1879) and Ebner (1887), and (iii) the shell behaving as a single crystal, defined by Boltovskoy and Wright (1976) as monocrystalline walls, which can be found in, e.g., members of Spirillinacea. Radial and granular walls were further subdivided by Krasheninnikov (1956) based on the size of the crystals.
At first, wall type was considered of great importance to define suborders and super families (Loeblich, 1964), especially when using thin sections (Stapleton, 1973). However, since the late 1960s the texture of foraminiferal shells has been studied more intensely and at higher magnification using scanning electron microscopes (SEMs), also casting doubt on the radial-granular concept (Boltovskoy and Wright, 1976(and references therein; Towe and Cifelli, 1967; Stapleton, 1973). The term radial has been used not only for optical orientation, but also for morphological orientation, and this optical-morphological dualism has been a source of confusion in the radial-granular concept, as stated by Towe and Cifelli (1967). This caused the wall of certain species, like Rotalia beccarii and Ammonia tepida to be described by some as radial, while others termed it granular (Wood, 1948; Reiss, 1963; Towe and Cifelli, 1967; Banner and Williams, 1973). Furthermore, within one genus even both a radial and granular wall type have been reported for recent Elphidium (Buzas, 1966) and Cibicides (Wood and Haynes, 1957) or specimens of the same genus from different geological periods, like Trulia and Bolivina (Hofker, 1967). This might be caused by a crystal structure not perfectly perpendicular to the wall surface, since in radial walls, an offset of as little as 5 degrees from parallelism causes an extinction in cross-polarized light (Stapleton, 1973).
All in all, due to its limitations and a variety of observations, the ultrastructure of the foraminiferal shell, such as wall type, has been used more or less unsuccessfully for taxonomic distinction (Loeblich, 1964) as well as for general calcification models, as proposed by Towe and Cifelli (1967) and Stapleton (1973). Still, numerous questions, considering the link between shell ultrastructure and phylogenetic lineages, as well as environmental controls on ultrastructure, remain unanswered. Here, we propose to re-open the investigation on shell structure and wall texture by introducing a method to measure another feature on foraminiferal shells, so-called cogwheels, jigsaw-like structures, which have been noted before, but never examined in detail (Figure 1).
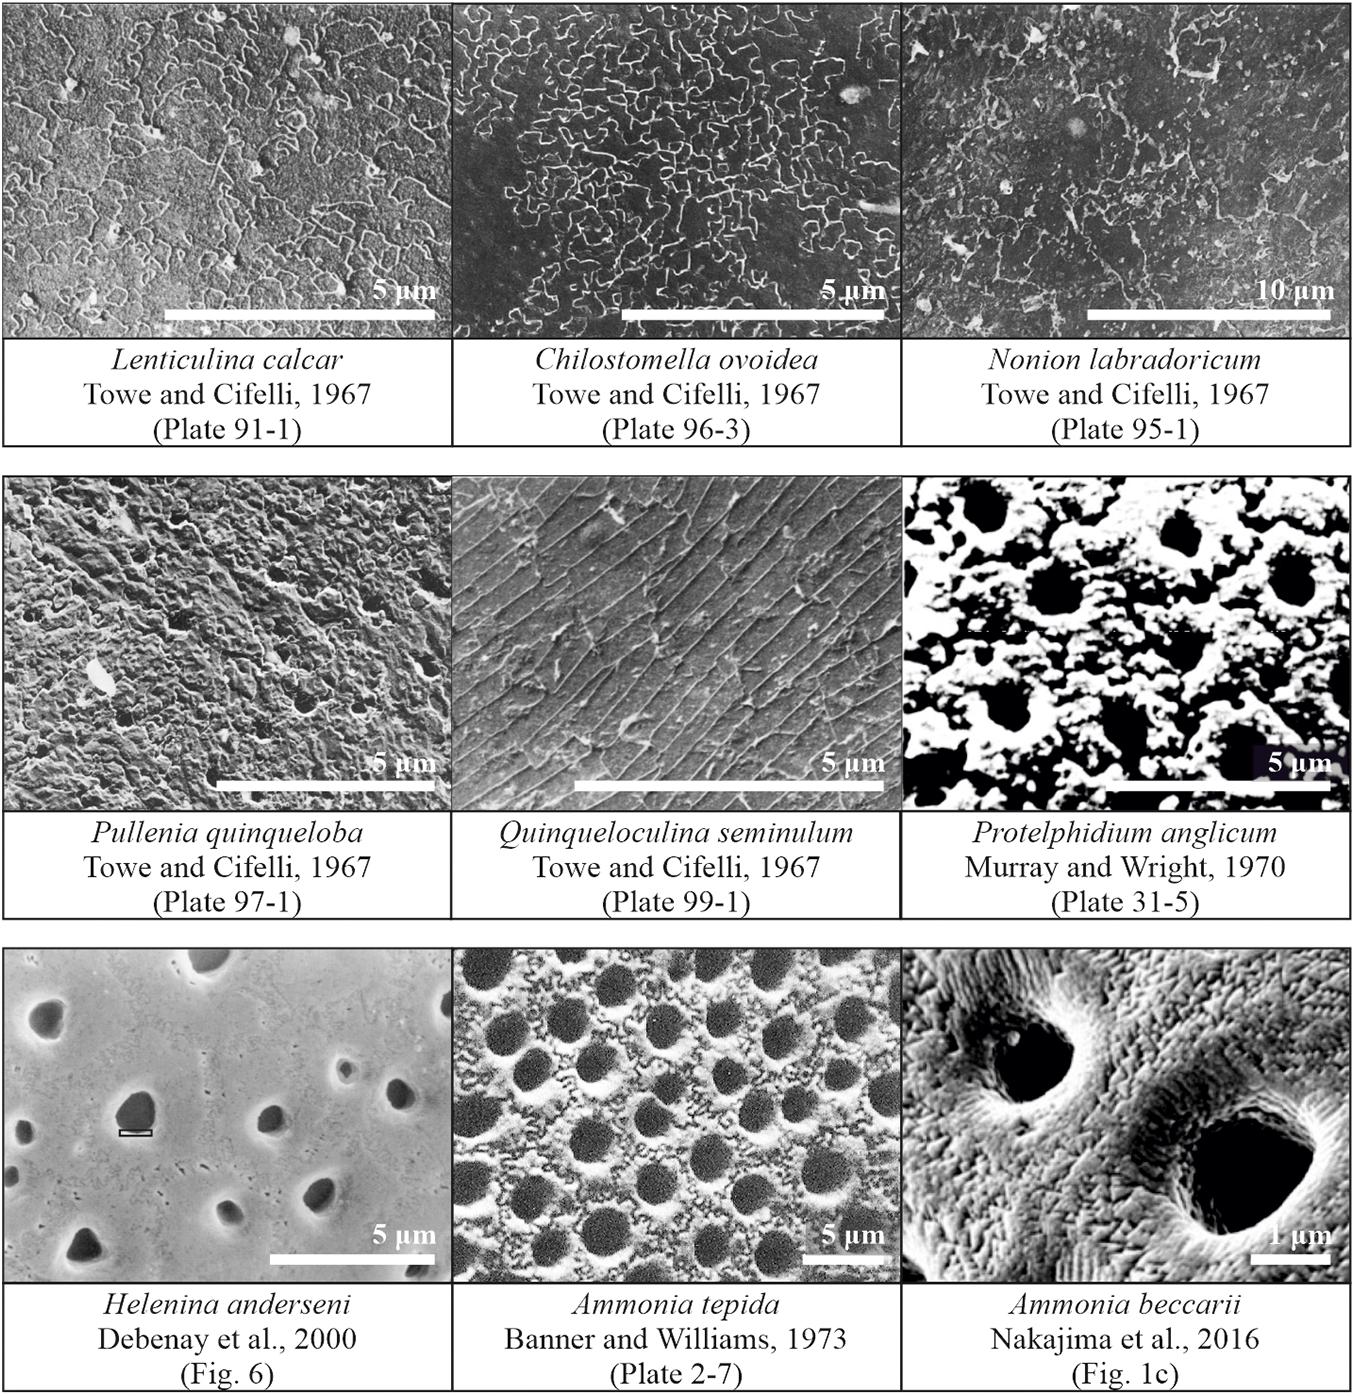
Figure 1. Published observations of surface structure features in scanning electron microscope images of different species of foraminifera. Images obtained from and/or modified after Towe and Cifelli (1967), Debenay et al. (2000), Murray and Wright (1970), Banner and Williams (1973), and Nakajima et al. (2016).
One of the first observations of cogwheels was by Towe and Cifelli (1967), who observed the sutured and granular nature on slightly etched shell surfaces of several species, for both, species with a radial (Lenticulina calcar) or granular (Nonion labradoricum, Chilostomella ovoidea, and Pullenia quinqueloba) wall type, suggesting this is a feature of all hyaline shells, and not restricted to either granular or radial wall types. The surface of Lenticulina calcar is patterned by units that are irregularly sutured in an interlocking fashion, with depressed boundaries, resembling a jigsaw puzzle. The pores appear to be arranged irregularly, occurring both at the sutured boundaries and within the calcite units. Furthermore, Debenay et al. (2000) observed sutures in specimens of Helenina anderseni. Murray and Wright (1970) investigated etched specimens [after several minutes in 5% ethylenediaminetetraacetic acid (EDTA)] of Protelphidium anglicum, and observed polygonal “crystals” with uneven surfaces around the pores, which have sutured contacts with one another. These sutured structures are even preserved in geological specimens, as Dubicka et al. (2018) reported jigsaw-like structures on the surface of Cretaceous specimens of Valvulineria sp. The shell surface of Chilostomella ovoidea has a clear sutured pattern and the similarity between this species and the surface of Lenticulina calcar is remarkable (Towe and Cifelli, 1967). Specimens of Nonion labradoricum also show a sutured surface, but unlike that of Lenticulina calcar: The calcitic blocks (∼3 μm in diameter) appear uniform within a sutured boundary, implying that each block-unit may be a single crystal (Towe and Cifelli, 1967).
Overall, these structures have been observed in a variety of species, independent of wall type, albeit with different characteristics, i.e., shape and size. Even though they have been observed in various independent studies over the past decades (Figure 1), these shell patterns have not been systematically studied, although the different cogwheel and suture structures are most likely the result of (slightly) different controls during the calcification process. Based on the scattered observations in the literature, the presence of sutures might be caused by automorphous mutual boundaries between crystallites, as suggested by Debenay et al. (2000). Debenay et al. (2000) called the cogwheels themselves “quintenary aggregates,” corresponding to the tightly packed crystallite arrangements noted by Dubicka et al. (2018). These suture boundaries might appear as a result of differences in crystallographic orientations of the cogwheels (Nakajima et al., 2016). The question then arises what controls these surface features. Stapleton (1973) commented that one of the most useful ultrastructural features for systematic purposes is the size and shape of pores, while the least useful ultrastructural feature is the surface configuration of the shell, which is presumed to be mainly controlled by environmental factors. Our future goal is to investigate whether these structures are indeed controlled by environmental parameters, or are also an expression of processes involved in calcification and therefore linked to shell chemistry. However, for this purpose, a method needs to be developed first, to consistently measure and characterize the shell features on shells of different species.
Therefore the aim of this study is to establish a protocol to quantify cogwheel and pore parameters to investigate systematic variation between species, and potentially identify some of the drivers of cogwheel formation. Is cogwheel formation linked to “internal” variables such as wall type, shell chemistry, calcification strategy or phylogeny, or an expression of “external” parameters, i.e., environmentally controlled? Our dataset consists of both benthic and planktonic hyaline species. To develop this protocol, we focus on two key taxa, the benthic Ammonia spp. and the planktonic Globorotalia menardii. We validate different parameters of the protocol, and investigate ontogeny and size effects in these two species. Subsequently, we apply our method to different species of foraminifera, to reveal species-specific shell structures in foraminifera.
Methodological Developments
Material
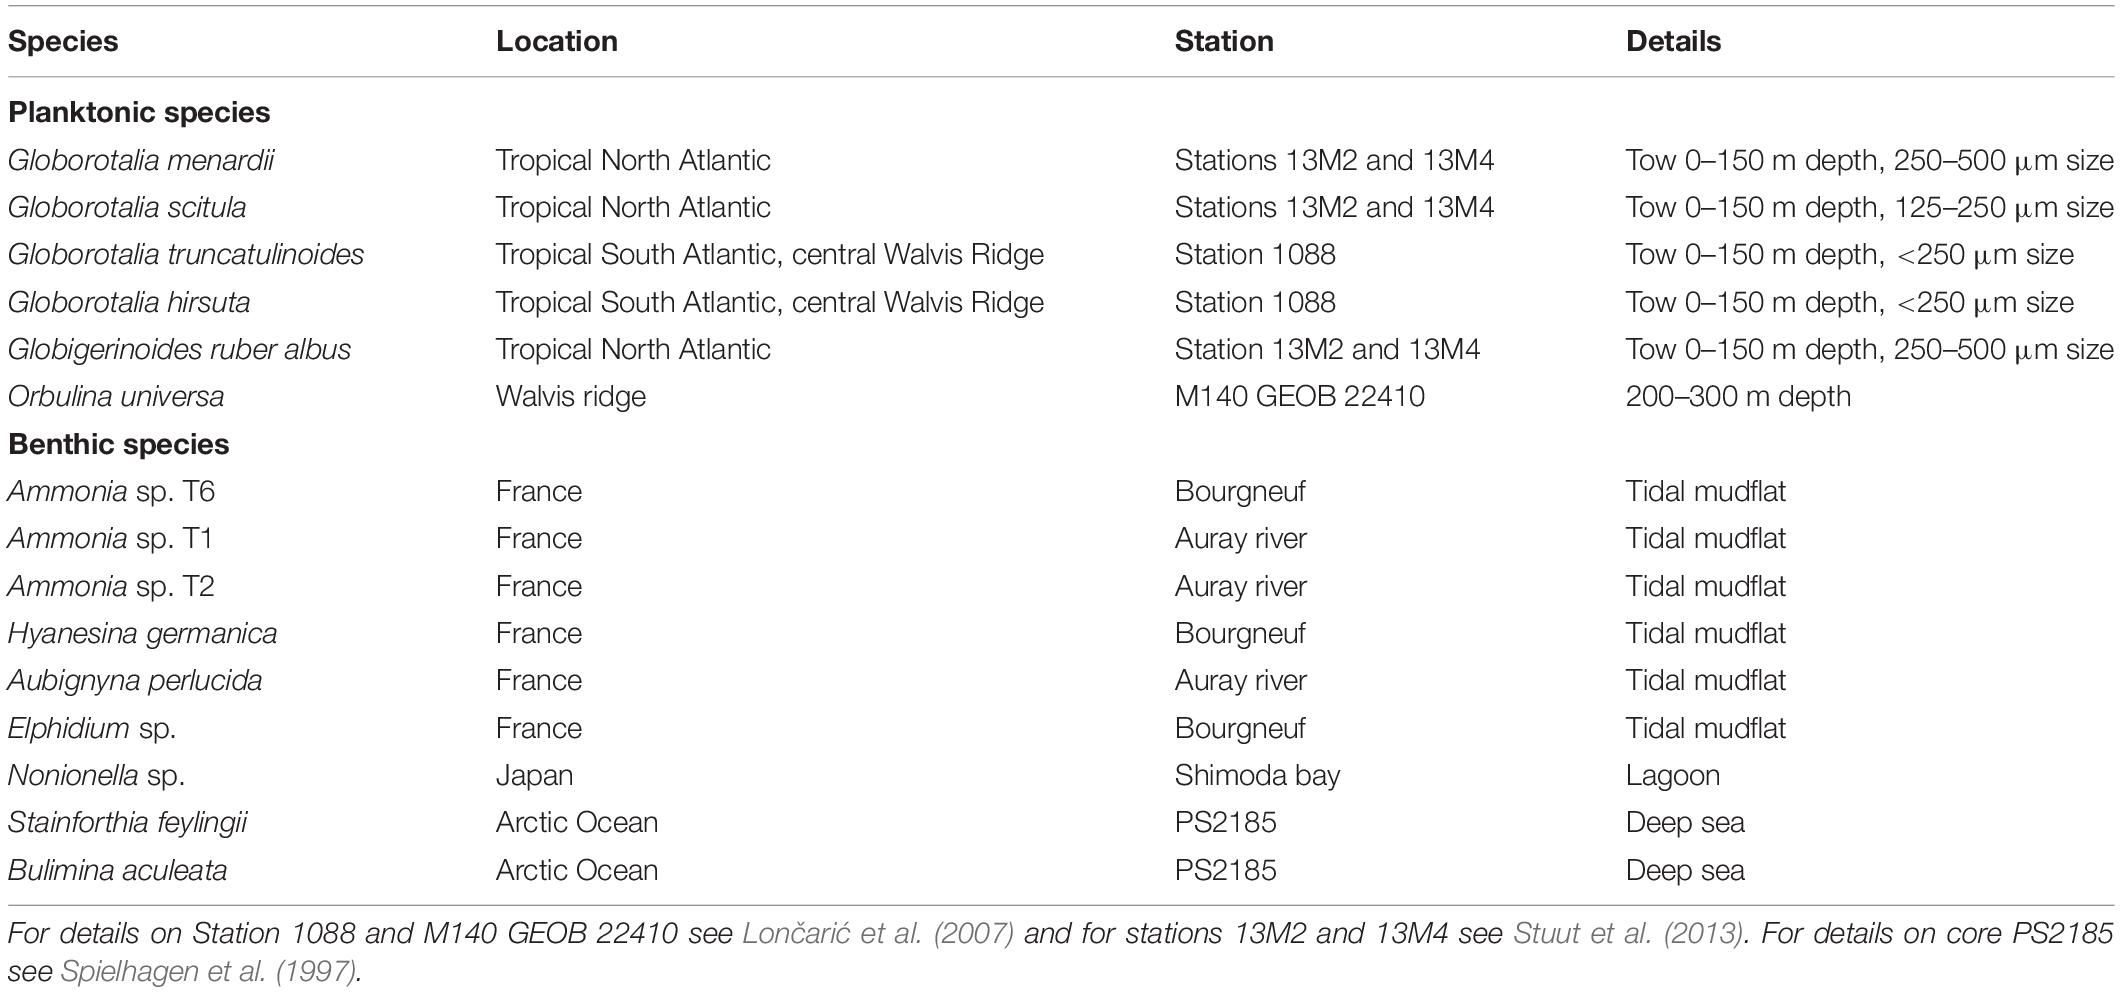
We focused the development of our method to quantify shell surface and pore patterns on two species of foraminifera with contrasting ecology, which are abundant in our samples and are well-studied representatives from their respective groups: the intertidal benthic Ammonia spp. and the planktonic G. menardii. Benthic Ammonia spp. was collected from surface sediment on mudflats on the French Atlantic coast. Specimens were morphologically distinguished in phylotypes T1, T2 and T6 using the method of Richirt et al., 2019. Specimens of Hyanesina germanica, Aubignyna perlucida, and Elphidium sp. were also selected from these samples. Specimens of G. menardii were collected from plankton tows, with no crust formation or diagenetic alterations, in the tropical North Atlantic Ocean. Other planktonic and benthic foraminifera were selected from these and some additional samples, to shell the method and ascertain presence or absence of cogwheel structures. We further included several planktonic species collected by plankton nets from three stations in the Atlantic Ocean (Stuut et al., 2013), i.e., Globorotalia truncatulinoides, Globorotalia hirsuta, Globorotalia scitula, Orbulina universa, and Globigerinoides ruber albus (less likely Globigerinoides elongatus, which is difficult to distinguish in pre-reproductive stages without the distinctive cap-like terminal chamber; see Morard et al., 2019 and Aurahs et al., 2011). A number of specimens of Bolivina pseudopunctata, Stainforthia feylingii, Bulimina aculeate and Nonionella sp. from other locations were added for analysis. An overview of the list of species and the sample locations is given in Table 1. Details on Station 1088 and M140 GEOB 22410 can be found in Lončarić et al. (2007) and details of core PS2185 in Spielhagen et al. (1997).
Sample Preparation
Living benthic foraminifera (viability assessed by presence of cytoplasm and pseudopodial activity) were randomly picked from the topmost millimeters of the sediment from respective sample locations (Table 1), cleaned with a brush and rinsed with de-ionized water. Live planktonic foraminifera were collected from the upper 150 m of the water column using a NIOZ-modified Hydrobios Multinet system with 100 μm mesh plankton nets. After retrieval the catch was drained on a 100 μm sieve, quickly rinsed with pure water to remove sea salts, transferred to a zip-lock bag and deep-frozen. In the laboratory, the samples were freeze dried, weighed and ashed in a low-temperature asher to remove the organic matter and retain a clean skeletal residues (for further details see Lončarić et al., 2006 and Fallet et al., 2009).
Single specimens were transferred to 1 ml vials (Eppendorf). Per vial, 500 μl 1.2 mM EDTA was added to gently etch the surface of the shell, after which the vials were placed on a Roto-shaker (Scientific Industries). Gentle rotation of the etching agent is necessary to avoid unwanted precipitation (see supplementary information Supplementary Figure S1A). Etching time varied between 5 and 20 min, and was carried out in steps of 5 min. Unfortunately, the etching time cannot be standardized, since this is dependent on the species investigated and the thickness of the shell wall and thus the veneer layer, as well as depending on the condition of the shell prior to the treatment, since some natural etching can occur in the field. Etching time needs to be optimized via trial and error and we recommend steps of 5 min to avoid over-etching (see Supplementary information, Supplementary Figures S1B,C). After etching, the EDTA solution was removed and the shells were rinsed four times with deionized water. After drying at room temperature, the foraminifera were mounted on SEM stubs using adhesive carbon pads for further analysis.
Cogwheel and Pore Pattern Quantification Using SEM and ImageJ
SEM images were taken from uncoated selected shells using a JSM IT100 SEM (JEOL) with an accelerating voltage between 5 and 9 kv, run in low-vacuum mode to minimize charging. Specimens were not coated due to planned follow-up analyses (using, e.g., Atomic Force Microscopy). Overview pictures from the whole shell as well as pictures from target areas at several magnifications (1000x, 2000x, 4000x, 6000x, and 8000x) were taken, for quantification of cogwheel and pore parameters, as well as to determine the correct frame size. Areas of interest were the flattest surface of the chamber, with main focus on the penultimate chamber (F-1), since the last chamber is quite thin and often broken or even slightly deformed in terms of (pore) structure. However, where possible, more chambers were imaged several times, to identify ontogenetic effects as well as intra- and inter-chamber cogwheel variability.
The free software ImageJ (https://imagej.nih.gov/ij/; Abramoff et al., 2004; Schneider et al., 2012) was used for processing SEM images. The developed macro and flowchart of the steps is added in the Supplementary Information (Appendix A). An overview of the different steps is given in Figure 2. From the original SEM image (Figure 2A), pore parameters were analyzed using the “Analyze Particle” tool, following a similar method by Petersen et al. (2016), who developed a semi-automated pore measurement method for Ammonia spp., based on previous work and observations by e.g., Huber et al. (1997), Morard et al. (2009), and Kuhnt et al. (2014). In short, using the gray value threshold, pores were isolated from the background. In some cases, parts of the sutures of the cogwheels with similar gray values as the pores were automatically selected as well. To remove any traces of unwanted objects, like cogwheel sutures or small damages of the shell, we used the outlier removal function of ImageJ, or in some cases, removed the objects manually. Resulting black and white selected pores were analyzed using “Analyze Particle” (Figure 2B). During the first run, all pores in the frame are analyzed (including pores on edges) to quantify the total surface area of pores, which represents shell porosity (%; pore area/image area). To quantify pore shape parameters, “Analyze Particle” was run again while excluding cut-off pores on the edges of the frame (using the option “exclude on edges”) as to not bias the resulting shape parameters. The resulting output (e.g., area, perimeter, circularity) of every pore was used to determine the shape of the pores. Circularity is calculated as 4π × 2, in which 1 indicates a perfect circle, and deviations towards 0 indicate a more elongated shape.
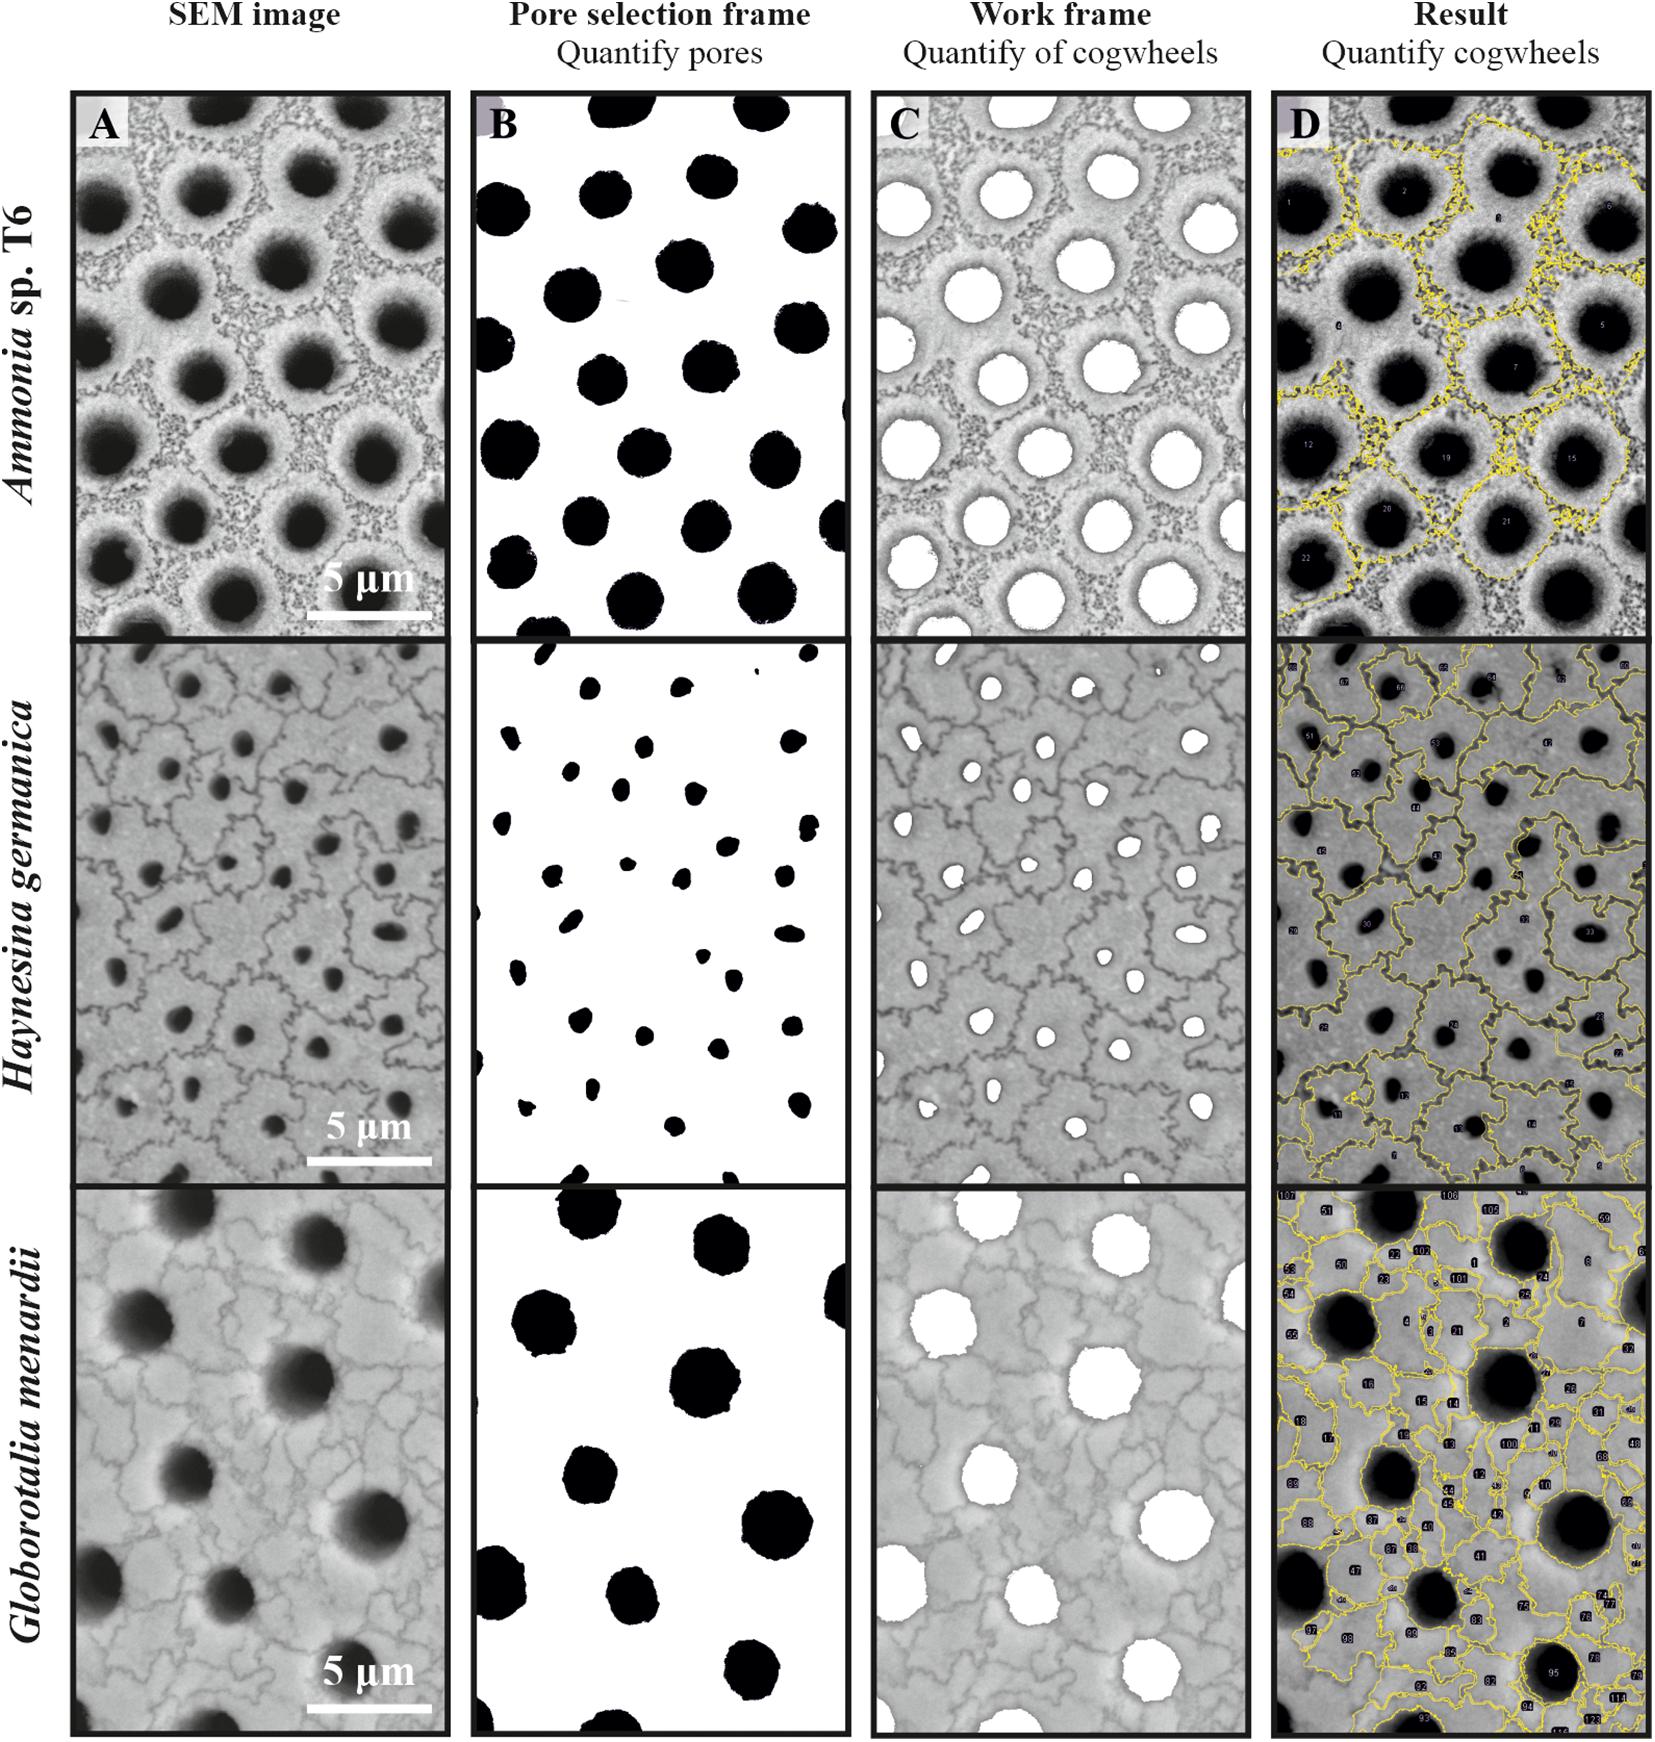
Figure 2. Four panels showing different steps in the shell and pore parameter quantification method applied to three different foraminiferal species (Ammonia sp., Haynesina germanica, and Globorotalia menardii), showing scanning electron microscope images imported in ImageJ (A), the resulting pore selection using the gray value threshold (B), the work frame for cogwheel selection, with pore areas removed (C) and the final result of the cogwheel procedure, with cogwheel number in black (D). Note that for the readability and size of the picture, we show half of the actual frame used for analysis.
The pore selection image was used to remove pore areas from the original image (Figure 2C), allowing for better selection of the cogwheel units using the sutures. Cogwheels were selected by altering the gray value threshold, to isolate the cogwheels using the dark suture areas. Cogwheels were then selected using the “Wand (tracing) tool” and summarized in the “Region of interest (ROI) manager.” After selecting all complete cogwheels within the image (partial cogwheels were not selected due to the bias of size and shape analysis), a summary of the cogwheels was obtained from the ROI manager. The result is shown as an overlay of the original SEM image (Figure 2D).
Using the results from ImageJ, we could define several cogwheel and pore parameters. For the cogwheels, we calculated cogwheel area (μm2) and suture perimeter length (μm). We defined the “interfingering” between cogwheels (or teeth depth) as the “interfingering factor,” which is the cogwheel perimeter / area. Furthermore, we express “cogwheel sorting” as the relative standard deviation (RSD) of all the cogwheels sizes per frame, where 0 means perfectly sorted and >1 means very poorly sorted. For the pore parameters, we calculated the pore diameter (μm) and porosity (%) of the shell (pore area relative to the total area).
Optimizing Method Parameters: Frame Size and Counting Statistics
We used two model foraminiferal species, the benthic species-complex Ammonia spp. and the planktonic foraminifer Globorotalia menardii, to optimize different method parameters. Statistical analyses were performed using R (R Core Team, 2013). Firstly, we needed to determine the correct frame size needed for the cogwheel and pore analysis, to standardize the magnification of the SEM images. The dataset resulting from each frame size needs to be large enough so that the mean cogwheel size gives a good representation of the cogwheel size of the chamber, but not too large to include deformation due to curvature as well as to reduce the details of the sutures. For Ammonia sp., the previously established protocol for pore analysis by Petersen et al. (2016) advise a frame size >250 μm2 and <1000 μm2, with the largest deviations of pore area occurring at 2500 μm2, due to the curvature of the shell. Here we apply a similar approach to investigate the effect of choice of frame size on cogwheel statistics, using the species G. menardii, which have shells with both larger pores, and more importantly, smaller cogwheels compared to Ammonia. We tested images taken at different magnifications, i.e., 6000x, 5000x, 4000x and 3000x, resulting in frames with different areas of 517, 752, 1169, and 2133 μm2, respectively (Figure 3).
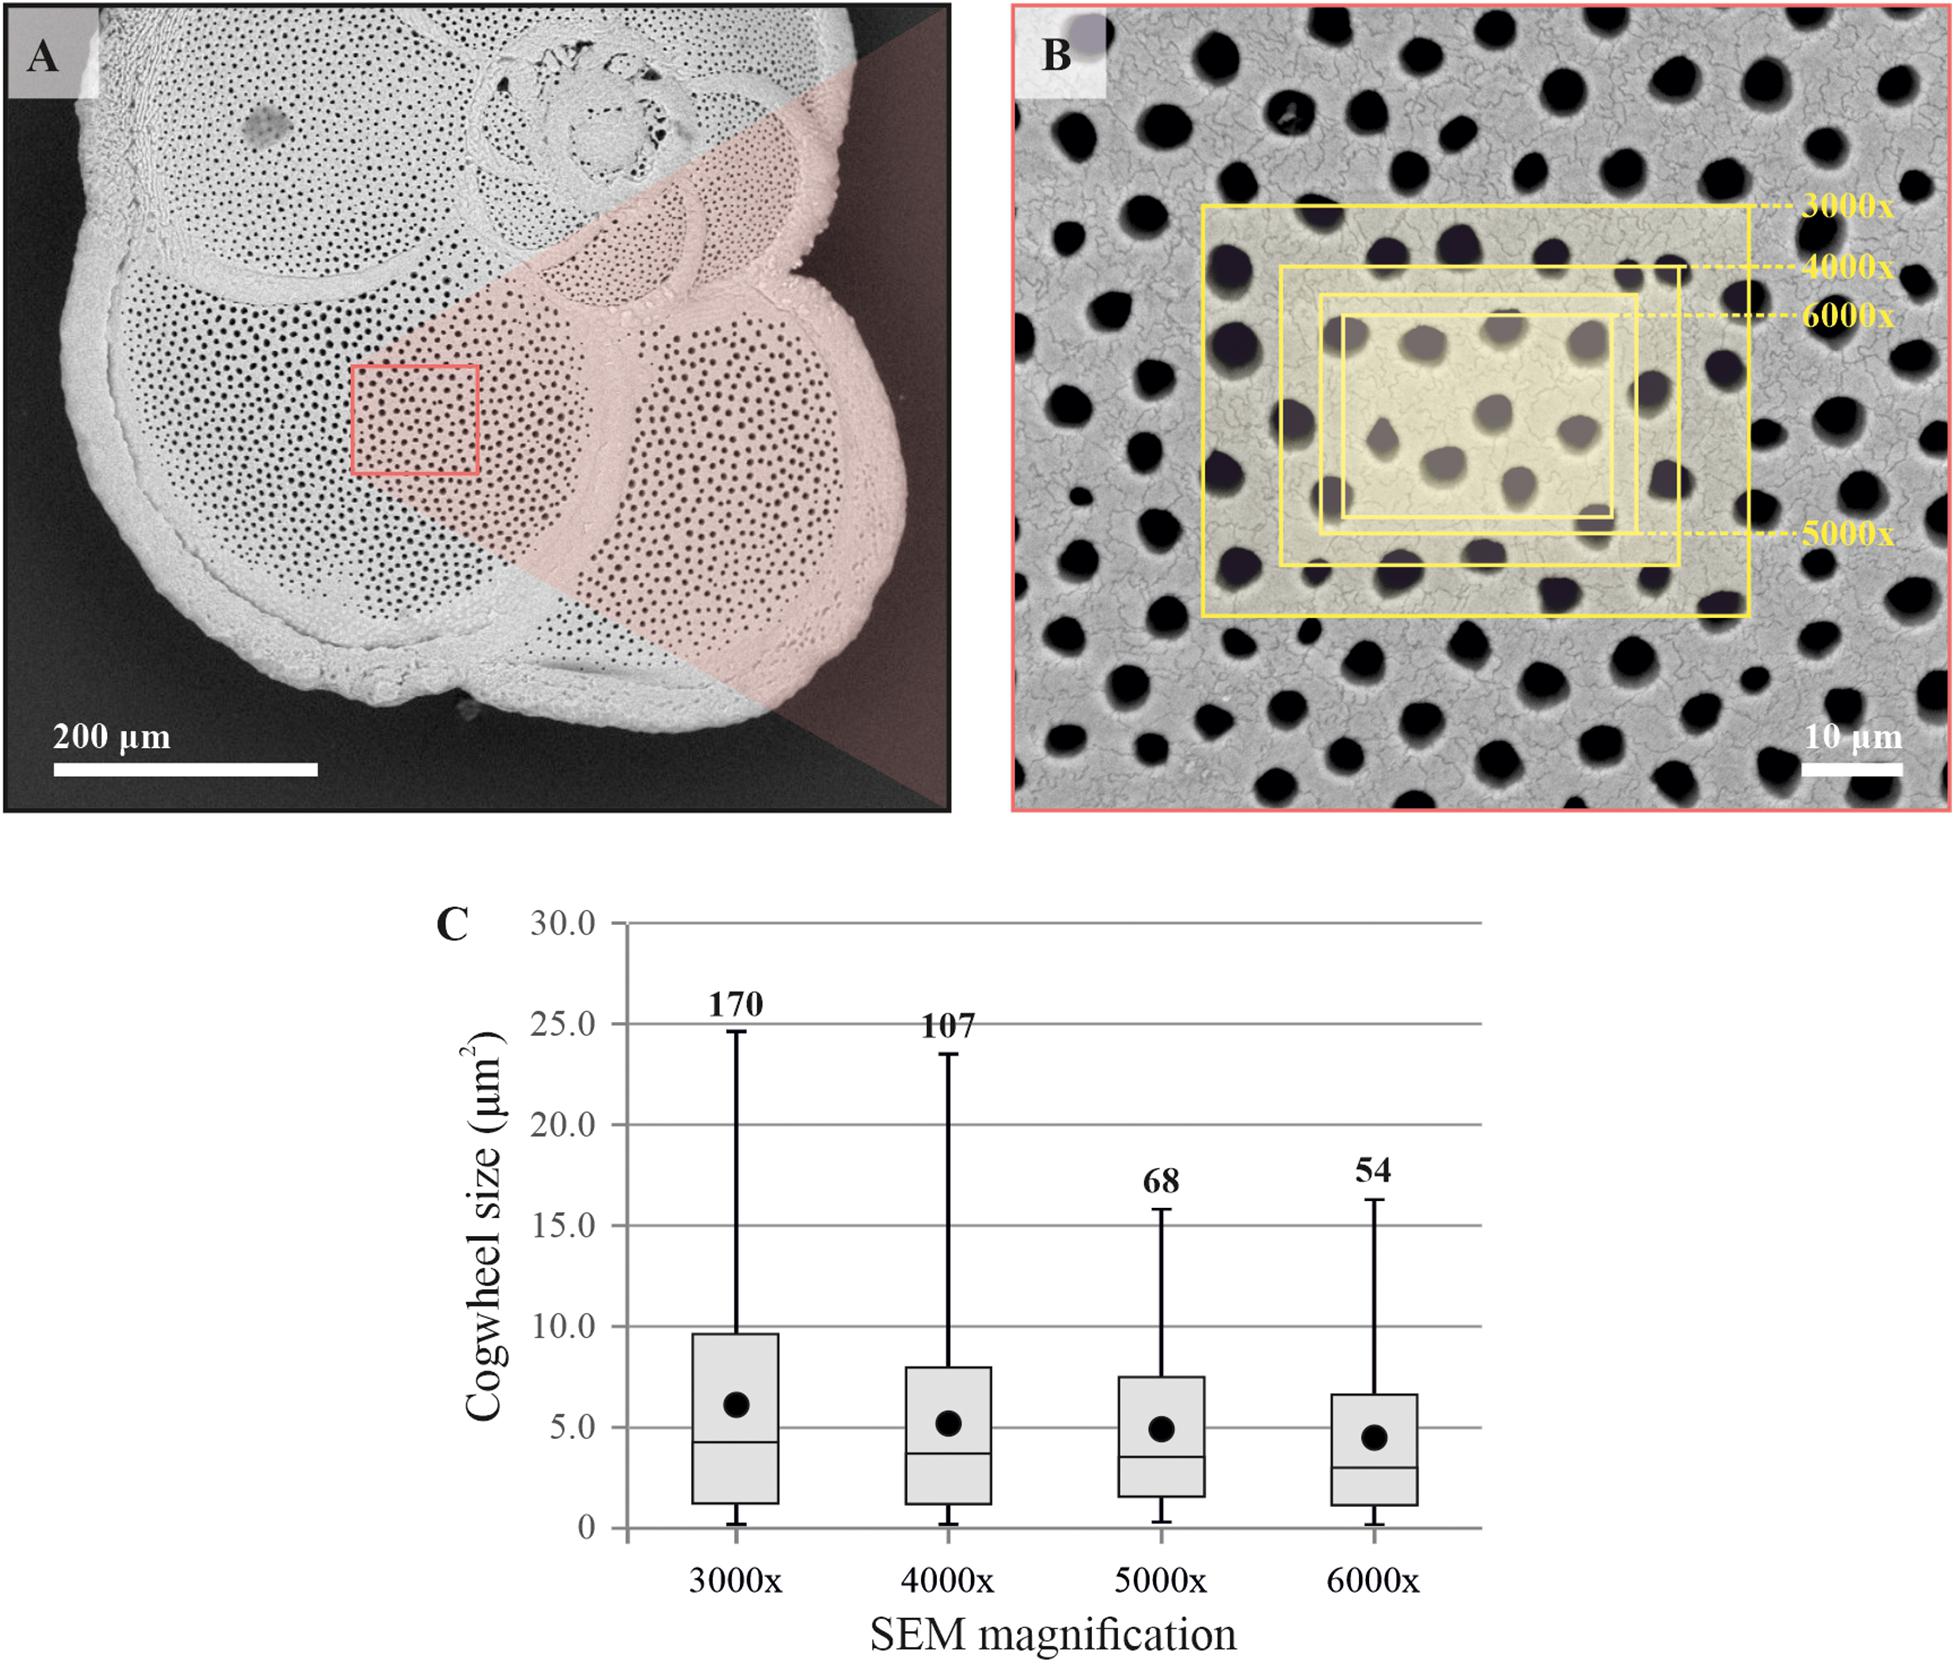
Figure 3. Comparison of resulting mean cogwheel size when using different frame sizes. Scanning electron microscope overview image of the specimen of Globorotalia menardii (A), and location of SEM images taken at different magnifications (3000x, 4000x, 5000x, and 6000x) of the F-1 chamber (B). Boxplot distributions (line = median, boxes = interquartile range, whisker = min/max values) of resulting datasets of cogwheel sizes per magnifications, with mean cogwheel size in black symbols and number of cogwheels analyzed per frame (C). Summary of the data can be found in Table 2.
Both cogwheel and pore parameters were quantified using the protocol described in section 2.3, and results are listed in Table 2. For each resulting dataset, a Kolmogorov–Smirnov test (KS; Kolmogorov, 1933; Smirnov, 1948) was performed (significance level α = 0.05) to test the parameters for normality of distribution. For pore areas, resulting p-values indicate a normal distribution for all frame sizes. In contrast, obtained p-values of cogwheel datasets suggest that cogwheel sizes are normally distributed for the two smaller frame sizes (517 and 752 μm2), while non-normally distributed for the two largest frame sizes (1169 and 2133 μm2). This is might be caused by less accurate distinction between cogwheels at larger frame sizes and lower magnification, leading to merging of cogwheels or potentially the exclusion of some smaller cogwheels. Since we observe similar minimal cogwheel size for the different frames, and the boxplots are mainly skewed toward higher values, the first explanation might be the most sensible. This consequently resulted in higher calculated mean cogwheel area (e.g., 6.1 μm2 for the largest frame vs. 4.5 μm2 for the smallest frame; Table 2) and skews the boxplot distribution to higher values for the two larger frames sizes (Figure 3). Therefore, we propose to use the 5000x magnification, which corresponds to 752 μm2 frame size.

Table 2. Results of shell parameter protocol for different frame sizes using the planktonic foraminifer Globorotalia menardii (Figure 3).
To optimize the method, we needed to assess the necessary number of cogwheels that have to be counted per frame to obtain a representative mean for the full frame. For this, we performed a Monte Carlo Permutation test on two images each of Ammonia spp. and G. menardii. For both species, we chose two individuals with either relatively small or large cogwheels, to present the variation within species. We counted all full cogwheels in each frame (752 μm2) to obtain the “true” mean cogwheel sizes (6.5 and 17.4 μm2 for Ammonia spp. and 2.9 and 3.8 μm2 for G. menardii). From the total number of cogwheels counted in the frame, a randomly selected sub-sample of cogwheel size values was taken to calculate the deviation from the mean cogwheel size. This simulation was run 1000 times for different sample sizes, between 5 and up to 200 cogwheels, depending on the initial cogwheel count. The results are presented in Figure 4 and show the decreasing uncertainty in finding the correct representative mean when increasing the number of cogwheels analyzed. Significance of the power regression was tested using an F-test after log-log transformation, for all four analysis p-values are <0.001. For specimens of Ammonia spp. with large cogwheels, the deviation is less than 10% when measuring 10 or more cogwheels (Figure 4A), while for specimens with smaller cogwheels, the deviation falls below 10% when measuring 20 or more cogwheels (Figure 4B). For both specimens of G. menardii, the deviation from the mean drops below 10% when measuring 50 or more cogwheels (Figures 4C,D). Therefore, for small, poorly sorted cogwheels, typically found in planktonic species like in G. menardii, at least 50 cogwheels have to be analyzed for a good representation. For species with larger cogwheels, i.e., benthic species like Ammonia spp., we recommend to measure a minimum of 20 cogwheels.
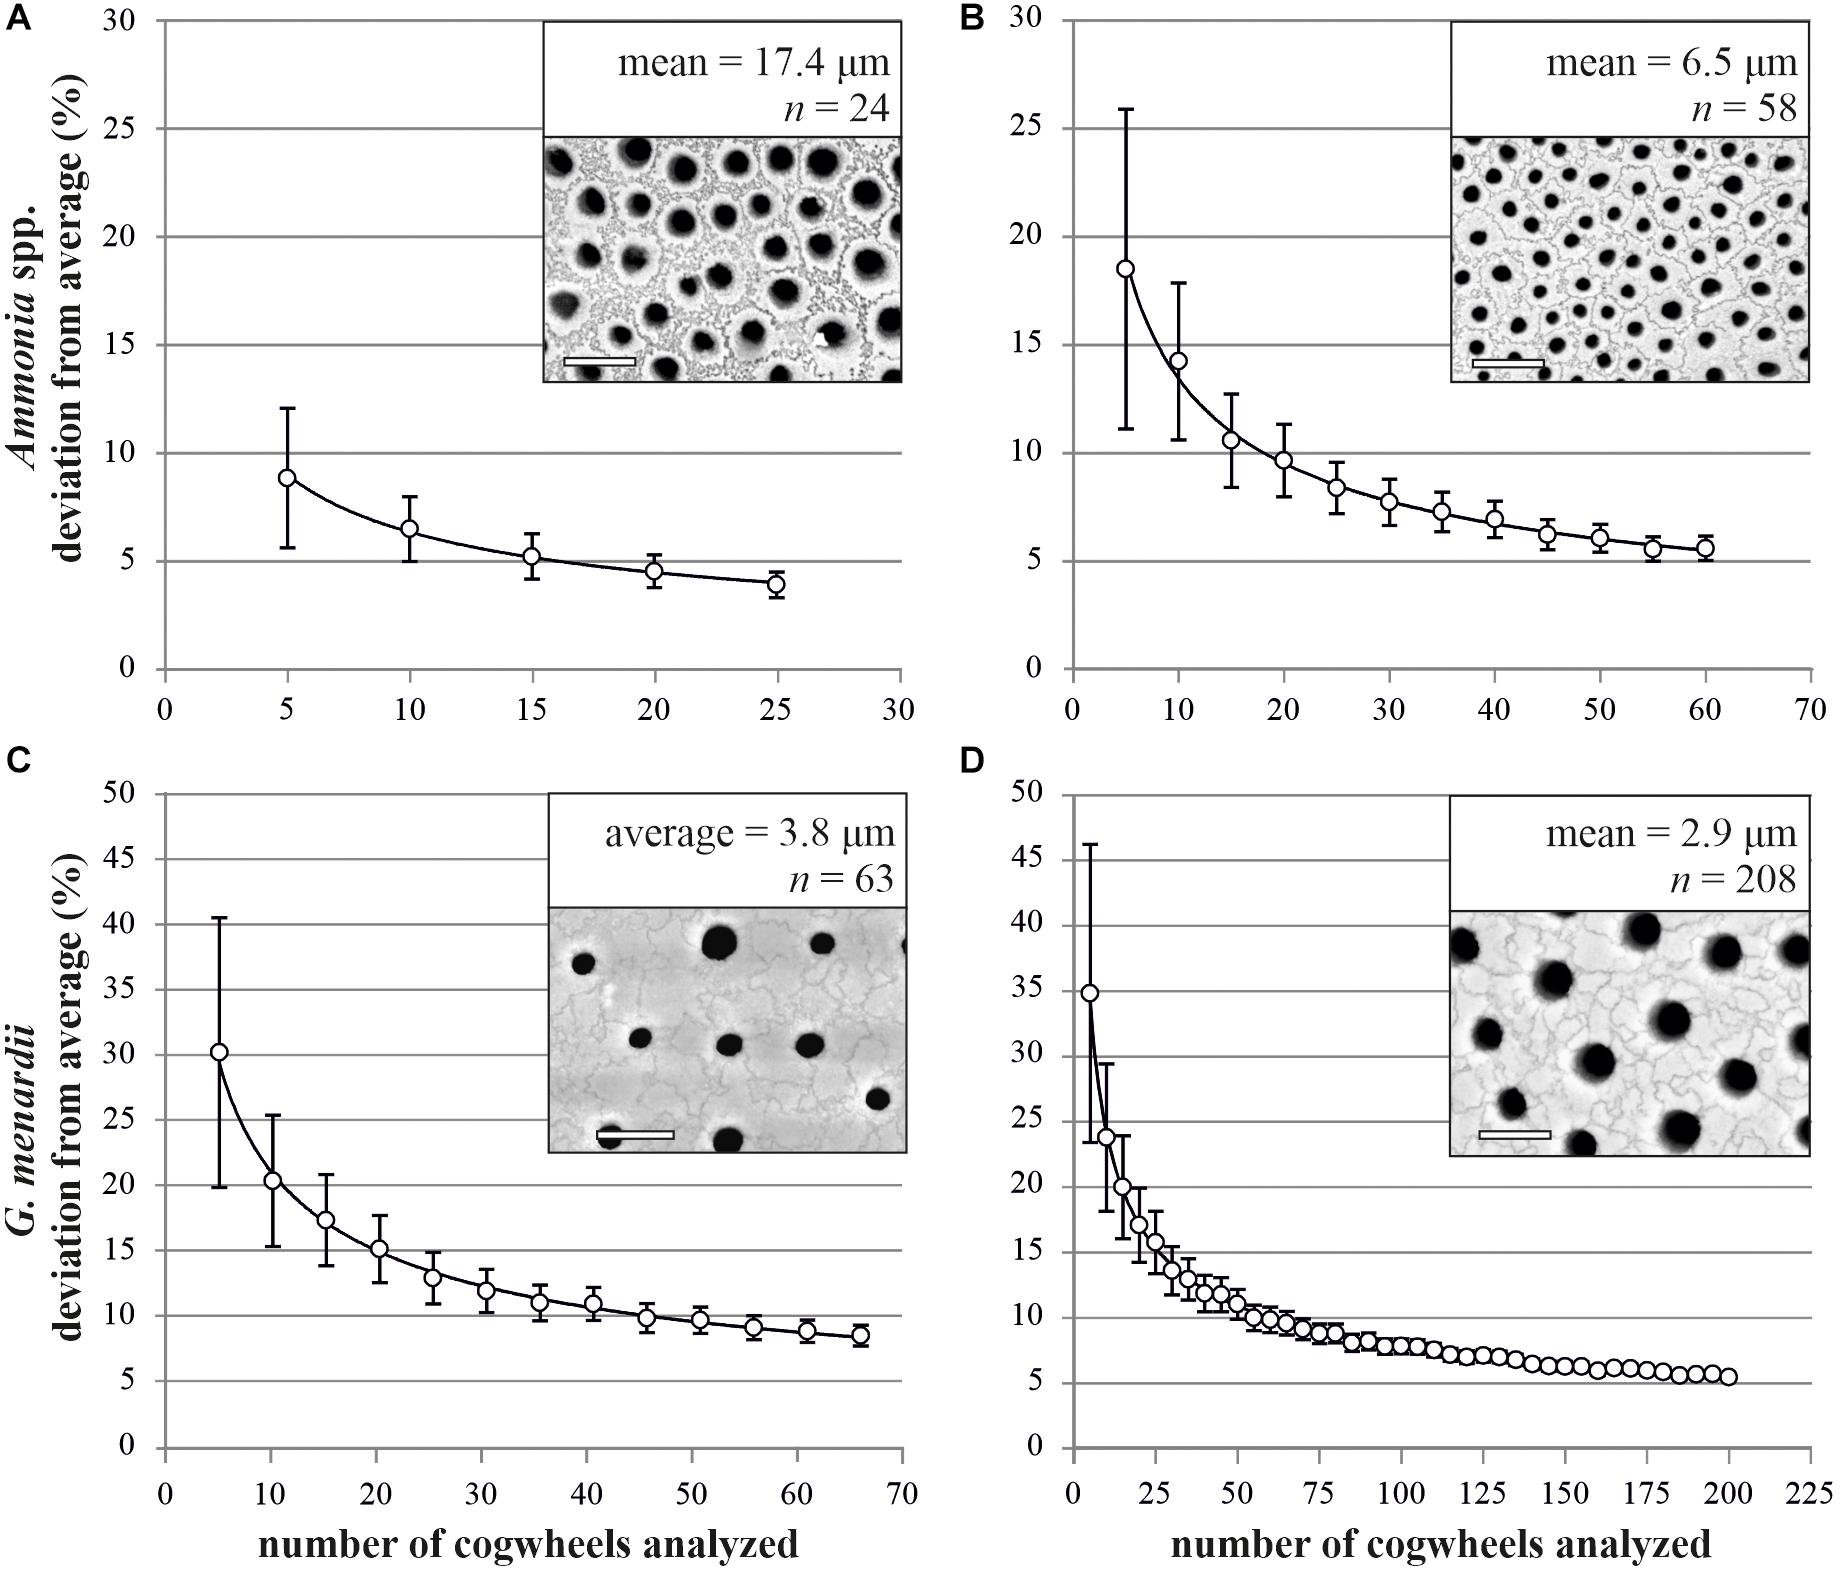
Figure 4. Relation between the number of cogwheels analyzed and deviation from the mean cogwheel size with increasing sample size of two specimens of Ammonia spp. (A,B) and Globorotalia menardii (C,D). White circles show the mean of 1000 simulations (±SE) with power regression line (p < 0.001). Insets show 752 μm2 frame taken by scanning electron microscope of the four investigated specimens, with mean cogwheel size and total number of full cogwheels analyzed. Scale bars are 5 μm.
Case Study
Effect of Shell Size on Cogwheel Size
Using the settings described above, images of Ammonia spp. and G. menardii can now be investigated for potential size effects and intra- and inter-chamber variation. Here we show the results from two case studies for which we investigate the variability of shell size with cogwheel size in Ammonia spp. and G. menardii. For the size effect, we compared cogwheel sizes determined for F-1 chambers of specimens with different shell sizes. Shell size is calculated using the SEM overview images using ImageJ. By adjusting the contrast, the whole shell can be selected and the shell cross-sectional area can be calculated. Figure 5 shows the comparison of cogwheel size (μm2) and shell size (mm2). The regression relationships were analyzed using an F-test of the overall significance.
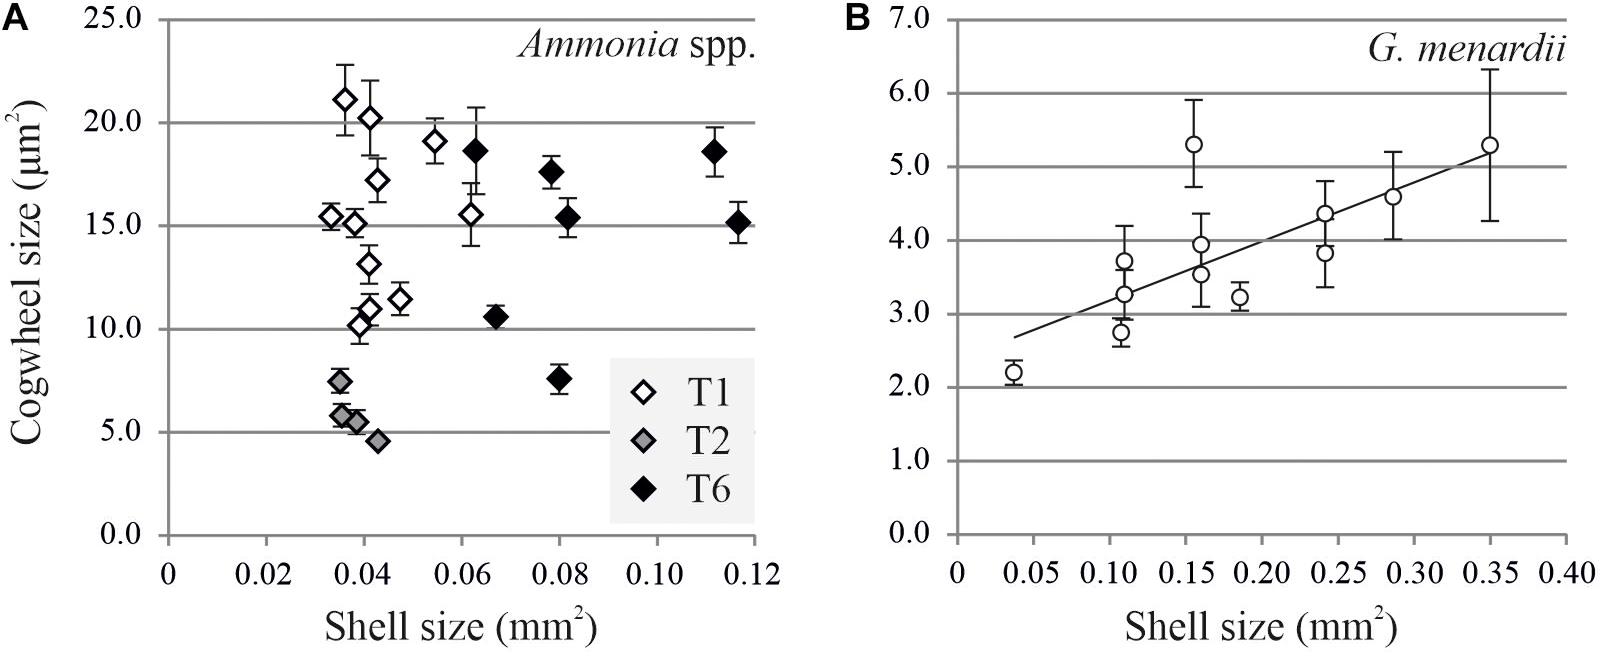
Figure 5. Comparison of shell cross-sectional area (mm2) and mean cogwheel size ±SD (μm2) for Ammonia spp. (A) and Globorotalia menardii (B). Specimens of Ammonia spp. were divided into genotypes T1 (white symbols), T2 (gray symbols) and T6 (black symbols) following Richirt et al. (2019). For G. menardii specimens, the relation can be described by y = 8.08x + 2.39 with R2 = 0.57 and p = 0.0017.
For Ammonia sp., no correlation can be found between shell and cogwheel size (F-value = 1.47, p-value = 0.2382), but we do see a division between the three genotypes T1, T2, and T6 (Figure 5A; Holzmann and Pawlowski, 2000; Richirt et al., 2019). We use a non-parametric Kruskal-Wallis test to test if cogwheel size and shell size are significantly different between the three phylotypes, and if so, we use a pairwise comparison Wilcoxon signed-rank test to determine which phylotype is significantly different from the others regarding cogwheel and shell size. Obtained p-values are corrected for multiple comparisons by applying a Bonferroni correction. For cogwheel size, the Kruskal-Wallis test indicates significant difference (p-value < 0.05) between phylotypes. Pairwise comparisons indicate that mean cogwheel size of specimens of T2 are significantly different from T1 (p = 0.004) and T6 (p = 0.018), while T1 and T6 show no significant difference (p = 1.000). For shell size, Kruskal-Wallis test also indicates a significant difference (p < 0.05) between the phylotypes. Pairwise comparisons show that shell sizes of phylotype T6 are significantly different from T1 (p < 0.001) and T2 (p = 0.018), while T1 and T2 show no significant difference (p = 0.840). In summary, for cogwheel size there is a significant difference between T2 and the other phylotypes, and the shell size of T6 are significantly different from both T1 and T2. The latter distinction on shell size for the different phylotypes has been observed before (Supplementary Information of Richirt et al., 2019). In contrast, for G. menardii, we observed an increase in cogwheel size with increasing shell size, suggesting a potential size effect on cogwheel formation (F-value = 16.158, p-value = 0.0017) and can be described by y = 8.08x + 2.39 (Figure 5).
For individual specimens of G. menardii, we can now apply our protocol to different locations of four successive chambers to investigate the size effect on greater detail. We investigated different chambers on two specimens, specimen A and B (Figure 6). For specimens A, the mean cogwheel size ± standard deviation (SD) per chamber is 4.43 ± 4.56 (n = 216), 3.72 ± 3.13 (n = 158), 3.64 ± 3.63 (n = 118), 3.01 ± 3.14 (n = 169) μm2 for F, F-1, F-2, and F-3, respectively (Figure 6A). After testing for variance with an F-test, we performed pairwise t-tests to determine if values between any two chambers are significantly different (p < 0.05). We show that the last two chambers, F and F-1 have significantly (p = 0.0006 and 0.0415, respectively) larger cogwheel sizes compared to the older chamber F-3. For the other chambers, mean cogwheel sizes are not significantly different. For specimen B, the mean cogwheel size (±SD) per chamber is 3.33 ± 2.93 (n = 239), 2.78 ± 180 (n = 145), 2.20 ± 3.63 (n = 162) μm2 for F, F-1 and F-4, respectively (Figure 6B). Chambers F-2 and F-3 could not be analyzed due to damage on the shell. For specimen B, mean cogwheel sizes of chambers F and F-1 are both significantly (p < 0.0001 and p = 0.0096, respectively) larger compared to chamber F-4. When applying the Bonferroni correction (pBONFERRONI < 0.005), only our final chambers (F) in both our cases (Figures 6A,B) have significantly larger cogwheels compared to the older chamber (F-1, F-2, etc.).
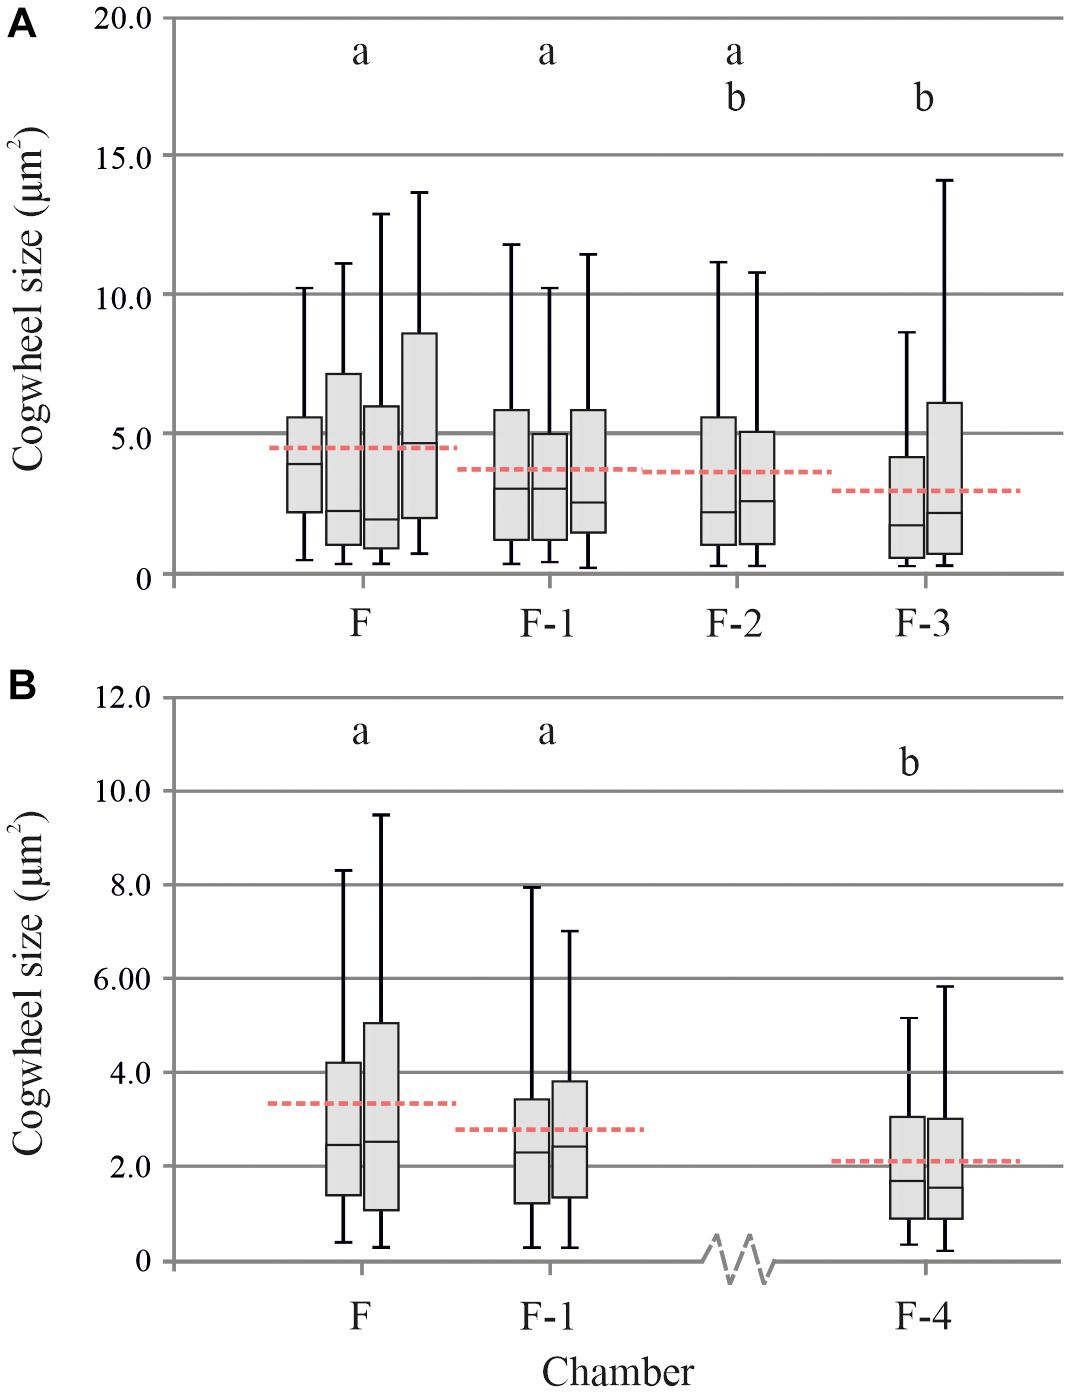
Figure 6. Box plot distribution (line = median, boxes = interquartile range, whisker = min/max values) of several measurements (n = 2–4) on different chambers (F, F-1, etc.) of two individual specimens of Globorotalia menardii from stations 13M2 (A) and M4 (B) (Table 1), specimens A (panel A) and B (panel B). Dashed lines show mean cogwheel size per chamber, based on all analysis per chamber. Boxes with the same letter are not significantly different, while those with no common letters are significantly different (α = 0.05).
For both specimens of G. menardii, we observe an overall increase in cogwheel size with shell size (Figure 5B) that might be related to growth of their shell (Figure 6), while for Ammonia spp. no clear size effect is observed (Figure 5A). For G. menardii, the increase in cogwheel size with shell size is less clear within a specimen (Figure 6), but this might come from the covering of older chambers with sequential layers of secondary calcite (following the laminar calcification model; e.g., Haynes, 1981), and/or that cogwheel size is also impacted by migration thought the water column during different life stages. For both species, laboratory culture experiment under constant conditions should confirm these findings, to evaluate the potential impact of, e.g., environmental parameters. All in all, we show that our protocol can be used to detect potential changes in cogwheel size with shell size within single specimens.
Shell Characteristics in Foraminiferal Species
Using the protocol described above, provides a new pathway for quantifying shell and pore patterns within and between different planktonic and benthic foraminiferal species collected from the field (Table 1). Most importantly, we observed sutured structures on the shell surface of all investigated species, a selection of which is shown in Figure 7. This suggests significant potential for cogwheels to be applied for both environmental and phylogenetic studies. All species studied and their corresponding shell structure can be found in the Supplementary Information (Supplementary Figures S2, S3). The sutured blocks are not limited to the flat surface of the shell, but can also be found in suture areas, pustules and within pore channels (Supplementary Figure S4). However, for quantification, we focus on the flattest surface of the chambers. Supplementary Tables S1, S2 in the Supplementary Information gives an overview of the cogwheel and pore parameters per species, including cogwheel size, cogwheel sorting and interfingering factor, as well as pore size and shell porosity. We compare the very first results of these parameters between species in Figure 8. Species Globorotalia scitula is not listed in Supplementary Table S1 and Figure 8, since we obtained only one image (Supplementary Figure S3D).
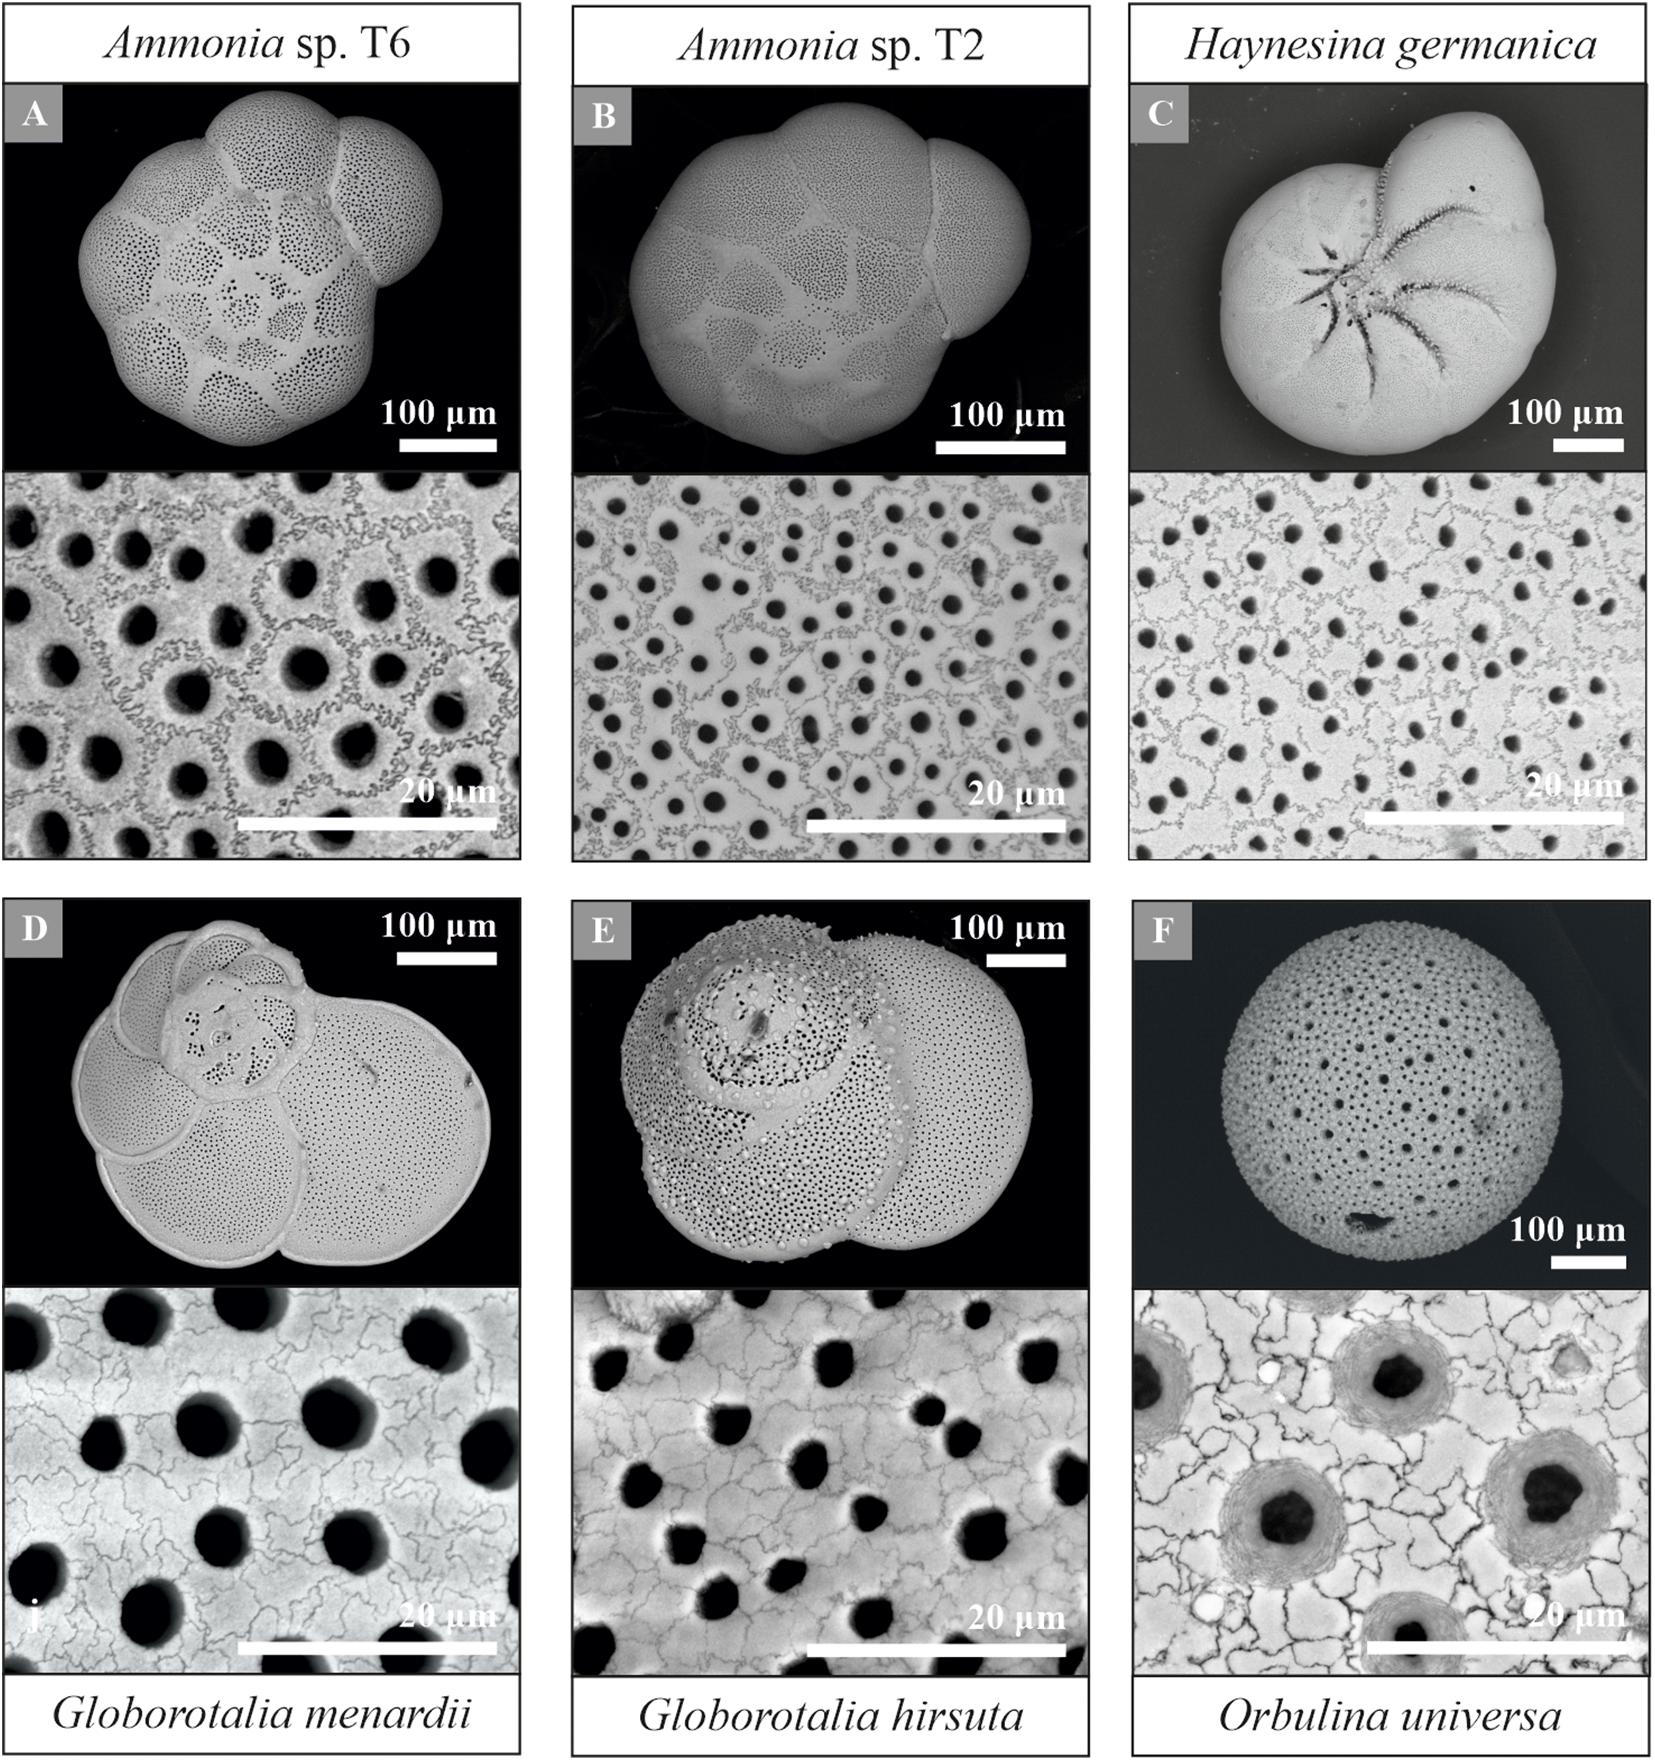
Figure 7. Overview and higher magnification scanning electron microscope images of a selection of the studied foraminiferal species, including the benthic Ammonia sp. T6 (A), Ammonia sp. T2 (B), Haynesina germanica (C) and planktonic Globorotalia menardii (D), Globorotalia hirsuta (E) and Orbulina universa (F). Species Ammonia sp. T6 (A), Ammonia sp. T2 (B) and Globorotalia menardii (D) were used for the protocol development. Examples of other studied species can be found in the Supplementary Information (Supplementary Figures S2, S3).
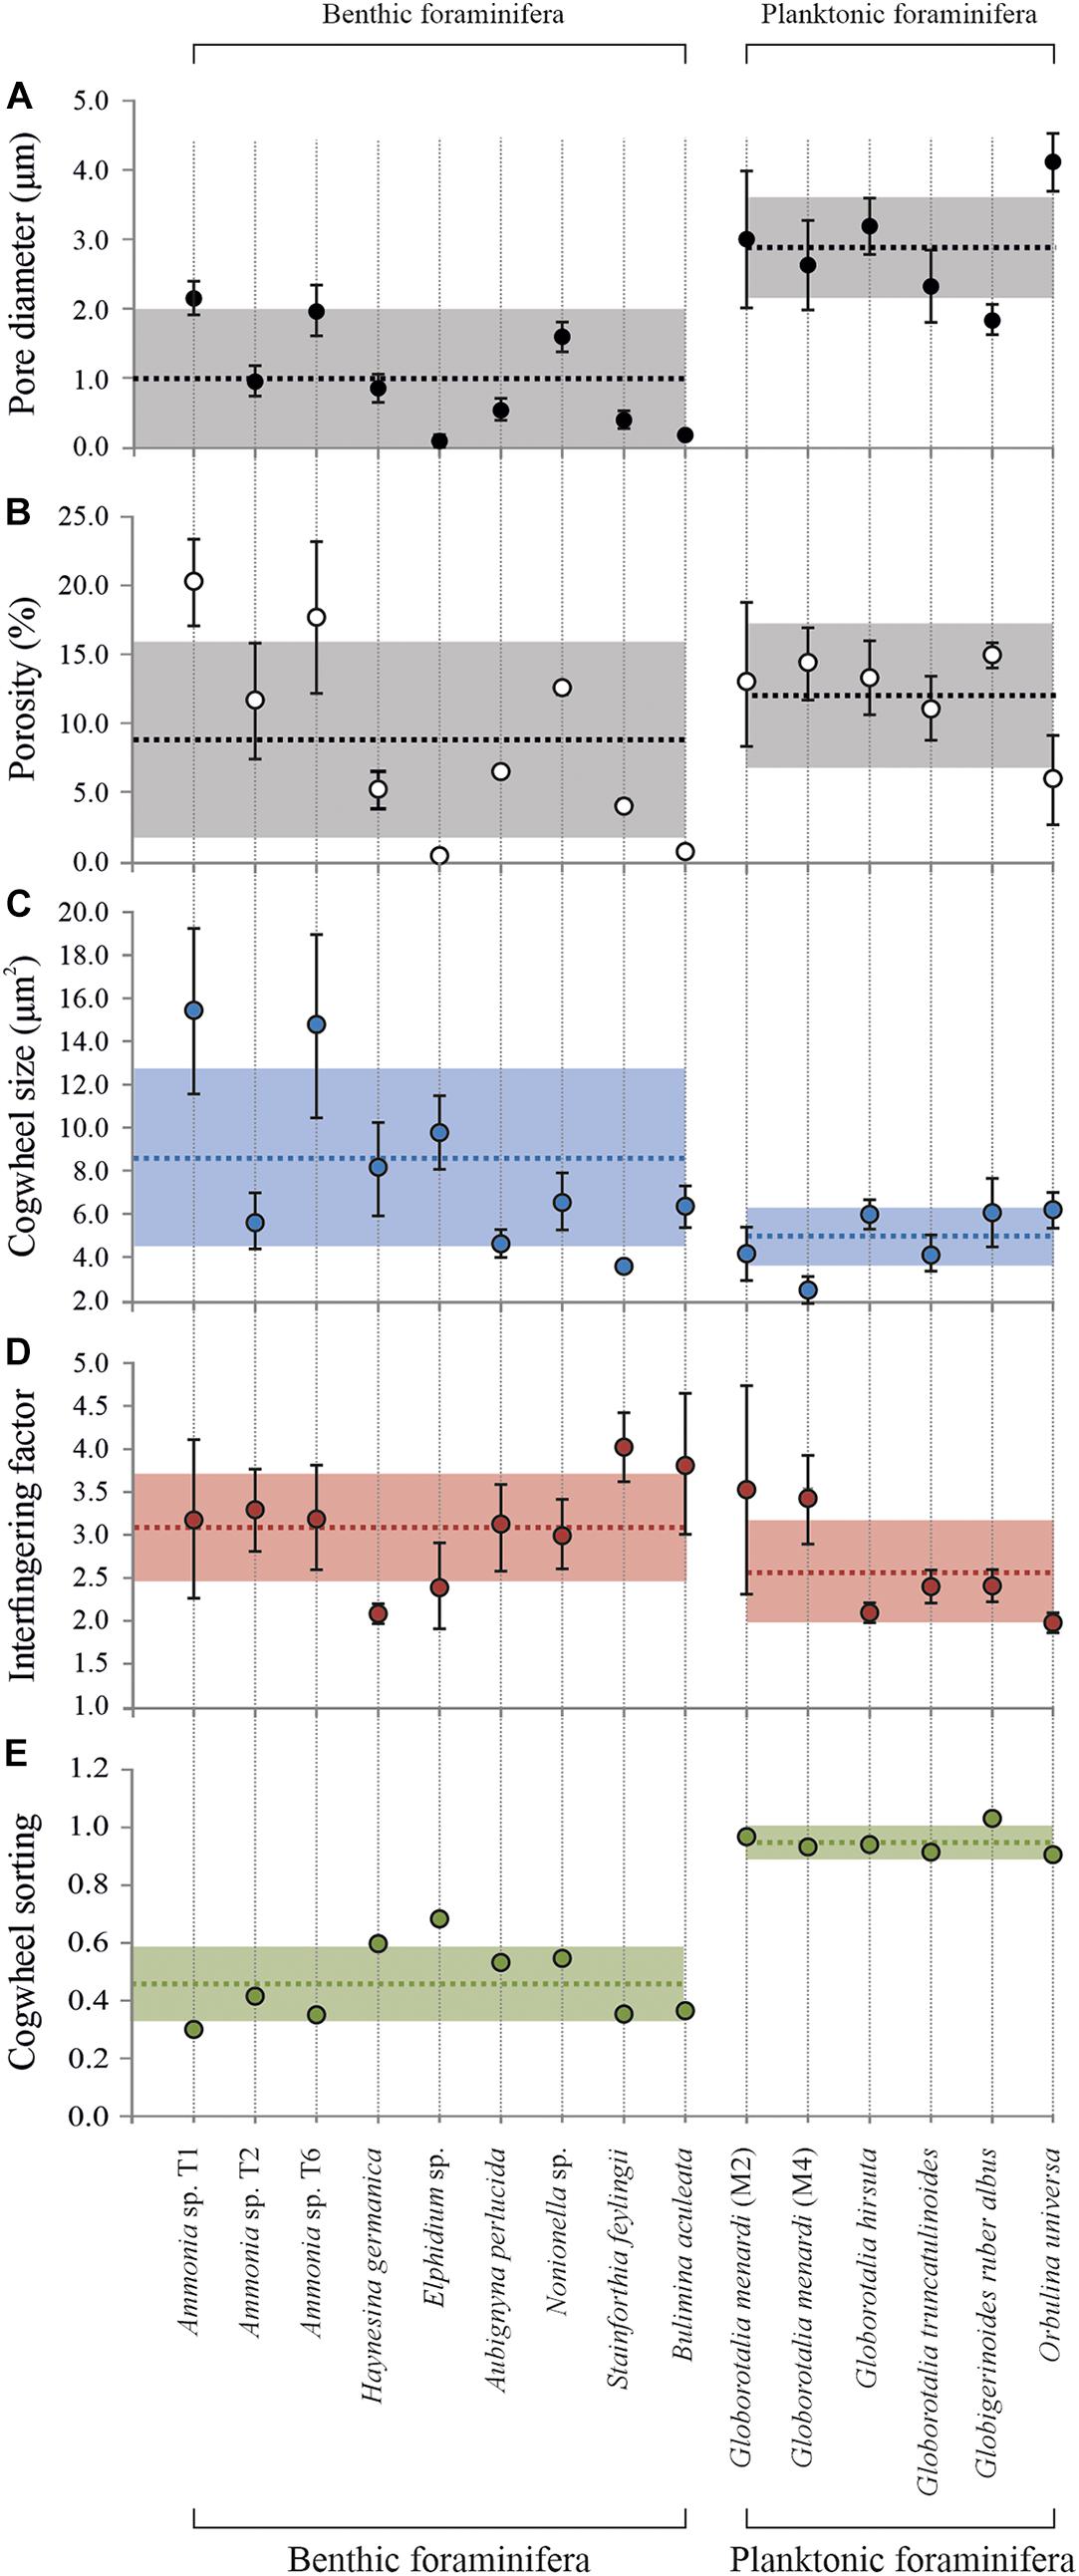
Figure 8. Overview of mean cogwheel and pore parameters for F-1 chambers of both benthic and planktonic foraminiferal species. For specifics on parameter definitions, see the method section. Mean pore diameter (A) in μm (average ± SD) and shell porosities (B) in % (average ± SD). Mean cogwheel size (C) in μm2 (average ± SD), interfingering factor (cogwheel perimeter/cogwheel area ± SD; D) cogwheel sorting (higher values indicate less sorted, based on the relative standard deviation of the cogwheel analysis; panel E). The dashed lines show the mean value of the parameters ± SD (shaded areas) for either all benthic or all planktonic foraminiferal species for reference.
Using the protocol proposed here, we observed cogwheel patterns in both benthic and planktonic species (Figure 7 and Supplementary Figure S2). This first small dataset is used as a proof of concept for the here proposed method, but can already to highlight certain observations and start the discussion of what processes might control cogwheel formation and what external (environmental) parameters impact cogwheels patterns. In general, benthic foraminiferal species show higher variability in cogwheel size (±SE), which varies between 3.6 ± 0.2 to 15.8 ± 1.1 μm2, compared to planktonic species, which are all in the lower spectrum with sizes between 3.0 ± 0.3 and 6.3 ± 0.7 μm2 (Figure 8 and Supplementary Table S1). This may relate to differences in life style (benthic vs. pelagic) and/or the longer evolutionary history of benthic species (BouDagher-Fadel et al., 1997; Fraass et al., 2015). Shell structures between benthic species might be simply more variable because they show a higher diversification then the relatively younger planktonic species, with ∼50 species living in the world’s oceans today (Hemleben et al., 1989; Schiebel and Hemleben, 2017), in contrast to the ∼4.000 benthic species (Murray, 2007). This would explain why the different species from the genus Globorotalia included in this study have more similar shell parameters, while for Ammonia spp. we show that even within previously considered pseudo-cryptic species T1, T2, and T6, there can be a large and significant difference in cogwheel and pore sizes. However, G. menardii collected from two different stations M2 and M4 show a significant difference (unpaired t-test, p < 0.05) in cogwheel size, 4.33 ± 0.55 and 2.95 ± 0.25 μm2, respectively (Figure 8 and Supplementary Table S1), while the mean shell size is very similar, on mean 0.18 ± 0.07 and 0.17 ± 0.09 μm2, respectively. There, the difference in cogwheel size cannot be explained by the size effect observed for this species (Figure 5). Therefore, a more likely explanation for the species-specific differences observed could be due to different local conditions, suggesting additional environmental impacts on cogwheel and pore formation. If environmental or ecological conditions impact shell structures, this could explain the high variation observed between benthic species; compared to planktonic species, benthic species, especially from inter-tidal environments, experience more variable environmental conditions, like changes in salinity, temperature and sediment redox state. Since all specimens from this study are coming from field material, intra-species variability (as shown in Figures 5A, 8) could be explained by external (environmental) fluctuations. To disentangle biological and environmental controls, quantify the effect of different environmental drivers and investigate intra-species variability, we need to apply the established protocol on a wider range of samples and species, specifically from different areas with a narrow environmental variability or controlled laboratory culture studies, to assess the impact of different environmental parameters on cogwheel and pore formation.
Cogwheel morphology might also be tightly linked to the processes involved in biocalcification. Nakajima et al. (2016) investigated these “cogwheel units” and concluded each cogwheel has a uniform C-axis throughout the unit, while it differs between cogwheels. Are cogwheels the locations were crystallization commences, either in the sutures or somewhere within the unit, resulting in this uniform C-axis? Based on snapshots taken at different phases of calcification of Ammonia beccarii, Nagai et al. (2018) concluded that calcification starts at the organic template, a weaving of organics. The sutures could be part of this organic template, either as the primary location of CaCO3 precipitation, or the result of the organics being pushed into the next unit when cogwheels grow and meet, leading to the observed sutures. A high resolution chemical and structural study has to show if sutures are either void, as hypothesized by Nakajima et al. (2016), or maybe filled with organics, high-Mg calcite or another carbonate polymorph, like aragonite or an amorphous precursor (Jacob et al., 2017). The next question is, if different shell patterns lead to (or are an expression of) differences in shell chemistry. Nakajima et al. (2016) suggest suture areas location with higher lattice stress. The variation in suture patterns observed for the species here might therefore result in slight differences in shell chemistry. In this case, we would expect species with highly sutured patterns, which are species with higher interfingering factor values, to have more crystal area with higher lattice stress, to have a higher incorporation of certain elements, like Mg, Sr, and Na (Mucci and Morse, 1983; Evans et al., 2015). All in all, we show cogwheels are an intricate structure found in hyaline foraminiferal shells, which might potentially be an expression of processes and mechanics active during biocalcification, and/or driven by ecology or environmental parameters.
Conclusion
In this study, we propose a protocol to systematically investigate ultrastructures on the outer surface of foraminiferal shells. This protocol uses the free image processing software ImageJ. Firstly, foraminiferal shells are etched with 1.2 mM EDTA for 5–20 min to remove surface veneer. High resolution SEM images of the F-1, taken at 5000x magnification, resulting in a frame size of 752 μm2, can be input in ImageJ to quantify pore and cogwheel parameters. This allows for systematic investigation of shell surface features like cogwheel size and shape, as well as pore parameters between different species, but also to evaluate, e.g., size effects at specimen level.
We show that foraminiferal shells seem to consist of species-specific building blocks, and we observed these sutured structures on the shell surface of all benthic and planktonic species investigated in this study. Therefore, they seem to be an intricate part of the foraminiferal shell. However, we also observed that benthic species show a higher inter-specific variation in shell parameters, which could potentially be evolutionary, e.g., the higher genetic variation between benthic species, but also indicate an impact of environmental drivers. Nevertheless, further studies of cogwheels might possibly lead to new insights in shell formation and the factors controlling inter-species differences. Could these structural differences explain (part of the) variability in shell chemistry observed between species, by acting as a structural constraint on crystal lattice level during biocalcification? Progress in understanding the function of cogwheels potentially lies in the combined application of cogwheel structure analysis and geochemical fingerprinting.
Data Availability Statement
All individual data points are summarized in the Supplementary Material. The scanning electron microscope images supporting the conclusions of this article will be made available by the authors, without undue reservation.
Author Contributions
ID, MR, and JB conceptualized this study. ID acquired the funding and preformed the measurements and coding. G-JB provided the planktonic samples. All authors contributed to the discussion and interpretation of the data, as well as the writing of the original draft, revised manuscript, and contributed to the article and approved the submitted version.
Funding
This research was funded by the Alexander von Humboldt Stiftung.
Conflict of Interest
The authors declare that the research was conducted in the absence of any commercial or financial relationships that could be construed as a potential conflict of interest.
The reviewer, JG, declared a past co-authorship with one of the authors, JB, to the handling editor.
Acknowledgments
We kindly thank the following scientists for the contribution of samples: Prof. Dr. Frans Jorissen, Dr. Julien Richirt, Dr. Jan-Berend Stuut, Prof. Dr. Hiroshi Kitazato, and Dr. Jutta Wollenburg. Dr. Gernot Nehrke is thanked for assistance with SEM imaging.
Supplementary Material
The Supplementary Material for this article can be found online at: https://www.frontiersin.org/articles/10.3389/fevo.2020.567231/full#supplementary-material
References
Abramoff, M. D., Magelhaes, P. J., and Ram, S. J. (20014). Image Processing with ImageJ. Biophotonics International 11, 36–42.
Aurahs, R., Treis, Y., Darling, K., and Kucera, M. (2011). A revised taxonomic and phylogenetic concept for the planktonic foraminifer species Globigerinoides ruber based on molecular and morphometric evidence. Mar. Micropaleontol. 79, 1–14. doi: 10.1016/j.marmicro.2010.12.001
Banner, F. T., and Williams, E. (1973). Test structure, organic skeleton and extrathalamous cytoplasm of Ammonia Bruennich. J. Foraminiferal Res. 3, 49–69. doi: 10.2113/gsjfr.3.2.49
Barker, S., Cacho, I., Benway, H., and Tachikawa, K. (2005). Planktonic foraminiferal Mg/Ca as a proxy for past oceanic temperatures: a methodological overview and data compilation for the Last Glacial Maximum. Quatern. Sci. Rev. 24, 821–834. doi: 10.1016/j.quascirev.2004.07.016
BouDagher-Fadel, M. K., Banner, F. T., and Whittaker, J. E. (1997). Early Evolutionary History of Planktonic Foraminifera. London: Chapman & Hall.
Buzas, M. A. (1966). The discrimination of morphological groups of elphidium (foraminifer) in long island sound through canonical analysis and invariant characters. J. Paleontol. 40, 585–594.
Debenay, J.-P., Guillou, J.-J., Geslin, E., and Lesourd, M. (2000). Crystallization of calcite in foraminiferal tests. Micropaleontology 46, 87–94.
Dubicka, Z., Owocki, K., and Gloc, M. (2018). Micro- and nanostructures of calcareous foraminiferal tests: insight from representatives of miliolida, rotaliida and lagenida. J. Foraminiferal Res. 48, 142–155. doi: 10.2113/gsjfr.48.2.142
Ebner, V. (1887). Über den feineren Bau der Skelettheile der Kalkschwämme nebst Bemerkungen über Kalkskelete überhaupt. Sonder Berichte der Akademie der Wissenschaften Wien Abt 1, 55–149.
Ehrenberg, C. G. (1854). Mikrogeologie: Das Erden und Felsen Schaffende Wirken Des Unsichtbar Kleinen Selbaständigen Lebens auf der Erde. Hypoluxo: L. Voss.
Evans, D., Erez, J., Oron, S., and Müller, W. (2015). Mg/Ca-temperature and seawater-test chemistry relationships in the shallow-dwelling large benthic foraminifera Operculina ammonoides. Geochim. Cosmochim. Acta 148, 325–342. doi: 10.1016/j.gca.2014.09.039
Fallet, U., Boer, W., van Assen, C., Greaves, M., and Brummer, G. J. A. (2009). A novel application of wet oxidation to retrieve carbonates from large organic-rich samples for ocean-climate research. Geochem. Geophys. Geosyst. 10:GC002573.
Foster, G. L., and Rae, J. W. B. (2016). Reconstructing Ocean pH with Boron Isotopes in Foraminifera, Annual Review of Earth and Planetary Sciences. Annual Reviews Inc, 207–237.
Fraass, A. J., Kelly, D. C., and Peters, S. E. (2015). Macroevolutionary history of the planktic foraminifera. Annu. Rev. Earth Planet. Sci. 43, 139–166. doi: 10.1146/annurev-earth-060614-105059
Haynes, J. R. (1981). Test Morphology and Composition. In: Foraminifera. London: Palgrave Macmillan.
Hemleben, C., Spindler, M., and Anderson, O. R. (1989). Modern Planktonic Foraminifera. New York, NY: Springer.
Hofker, J. (1967). Hat die feinere Wandstruktur der Foraminiferen supragenerische Bedeutung? Paläontol. Z. 41, 194–198. doi: 10.1007/bf02988122
Holzmann, M., and Pawlowski, J. (2000). Taxonomic relationships in the genus Ammonia (Foraminifera) based on ribosomal DNA sequences. J. Micropalaeontol. 19, 85–95. doi: 10.1144/jm.19.1.85
Huber, B. T., Bijma, J., and Darling, K. (1997). Cryptic speciation in the living planktonic foraminifer Globigerinella siphonifera (d’Orbigny). Paleobiology 23, 33–62. doi: 10.1017/s0094837300016638
Jacob, D. E., Wirth, R., Agbaje, O. B. A., Branson, O., and Eggins, S. M. (2017). Planktic foraminifera form their shells via metastable carbonate phases. Nat. Commun. 8:1265.
Kolmogorov, A. (1933). Sulla determinazione empirica di una legge di distribuzione. Giornale dell’Istituto Italiano degli Attuari 4, 83–91.
Krasheninnikov, V. (1956). Mikrostruktura stenki Nekotoykh Kajinozojskikh. Foraminifer i metodika ee izuchenija v poljarizovannonn svete. Voprosy Mikropaleontol. 1, 37–48.
Kuhnt, T., Schiebel, R., Schmiedl, G., Milker, Y., Mackensen, A., and Friedrich, O. (2014). Automated et al. (Bailey). J. Foraminiferal Res. 44, 5–16.
Loeblich, A. R. Jr. (1964). Sarcodina, Chiefly” Thecamoebians” and Foraminiferida. Treatise on Invertebrate Paleontology, Protista 2. Boulder, CO: Geological Society of America.
Lončarić, N., Peeters, F. J. C., Kroon, D., and Brummer, G.-J. A. (2006). Oxygen isotope ecology of recent planktic foraminifera at the central Walvis Ridge (SE Atlantic). Paleoceanography 21:PA3009. doi: 10.1029/2005PA001207
Lončarić, N., van Iperen, J., Kroon, D., and Brummer, G. J. A. (2007). Seasonal export and sediment preservation of diatomaceous, foraminiferal and organic matter mass fluxes in a trophic gradient across the SE Atlantic. Prog. Oceanography 73, 27–59. doi: 10.1016/j.pocean.2006.10.008
Morard, R., Füllberg, A., Brummer, G. J. A., Greco, M., Jonkers, L., Wizemann, A., et al. (2019). Genetic and morphological divergence in the warm-water planktonic foraminifera genus Globigerinoides. PLoS One 14:e0225246. doi: 10.1371/journal.pone.0225246
Morard, R., Quillévéré, F., Escarguel, G., Ujiie, Y., Garidel-Thoron, T. D., Norris, R. D., et al. (2009). Morphological recognition of cryptic species in the planktonic foraminifer Orbulina universa. Mar. Micropaleontoly 71, 148–165. doi: 10.1016/j.marmicro.2009.03.001
Mucci, A., and Morse, J. W. (1983). The incorporation of Mg2+ and Sr2+ into calcite overgrowths: influences of growth rate and solution composition. Geochim. Cosmochim. Acta 47, 217–233. doi: 10.1016/0016-7037(83)90135-7
Murray, J., and Wright, C. (1970). Surface textures of calcareous foraminiferids. Palaeontology 13, 184–187. doi: 10.1007/978-3-642-41714-6_30158
Murray, J. W. (2007). Biodiversity of living benthic foraminifera: how many species are there? Mar. Micropaleontol. 64, 163–176. doi: 10.1016/j.marmicro.2007.04.002
Nagai, Y., Uematsu, K., Chen, C., Wani, R., Tyszka, J., and Toyofuku, T. (2018). Weaving of biomineralization framework in rotaliid foraminifera: implications for paleoceanographic proxies. Biogeosciences 15, 6773–6789. doi: 10.5194/bg-15-6773-2018
Nakajima, K., Nagai, Y., Suzuki, M., Oaki, Y., Naito, K., Tanaka, Y., et al. (2016). Mesoscopic crystallographic textures on shells of a hyaline radial foraminifer Ammonia beccarii. Cryst. Eng. Commun. 18, 7135–7139. doi: 10.1039/c6ce01611a
Petersen, J., Riedel, B., Barras, C., Pays, O., Guihéneuf, A., Mabilleau, G., et al. (2016). Improved methodology for measuring pore patterns in the benthic foraminiferal genus Ammonia. Mar. Micropaleontol. 128, 1–13. doi: 10.1016/j.marmicro.2016.08.001
R Core Team (2013). R: A Language and Environment for Statistical Computing. Vienna: R Foundation for Statistical Computing.
Rae, J. W. B., Foster, G. L., Schmidt, D. N., and Elliott, T. (2011). Boron isotopes and B/Ca in benthic foraminifera: proxies for the deep ocean carbonate system. Earth Planet. Sci. Lett. 302, 403–413. doi: 10.1016/j.epsl.2010.12.034
Richirt, J., Schweizer, M., Bouchet, V. M. P., Mouret, A., Quinchard, S., and Jorissen, F. J. (2019). Morphological distinction of three ammonia phylotypes occurring along European Coasts. J. Foraminiferal Res. 49, 76–93. doi: 10.2113/gsjfr.49.1.76
Schiebel, R., and Hemleben, C. (2017). Planktic Foraminifers in the Modern Ocean. Berlin: Springer-Verlag.
Schneider, C. A., Rasband, W. S., and Eliceiri, K. W. (2012). NIH Image to ImageJ: 25 years of image analysis. Nat. Methods 9, 671–675. doi: 10.1038/nmeth.2089
Shackleton, N. J. (1987). Oxygen isotopes, ice volume and sea level. Quatern. Sci. Rev. 6.3-4, 183–190. doi: 10.1016/0277-3791(87)90003-5
Smirnov, N. (1948). Table for estimating the goodness of fit of empirical distributions. Ann. Math. Stat. 19, 279–281. doi: 10.1214/aoms/1177730256
Sollas, W. J. (1921). On Saccammina carteri Brady, and the minute structure of the foraminiferal shell. J. Geol. Soc. 77, 193–212. doi: 10.1144/gsl.jgs.1921.77.01-04.10
Spielhagen, R. F., Bonani, G., Eisenhauer, A., Frank, M., Frederichs, T., Kassens, H., et al. (1997). Arctic Ocean evidence for late Quaternary initiation of northern Eurasian ice sheets. Geology 25, 783–786. doi: 10.1130/0091-7613(1997)025<0783:aoeflq>2.3.co;2
Stapleton, R. P. (1973). Ultrastructure of some recent benthic hyaline foraminifera. Palaeontograph. Abteilung A 1-3, 16–49.
Stuut, J.-B. W., Brummer, G.-J., van der Does, M., Friese, C., Geerken, E., van der Heide, R., et al. (2013). Cruise Report and Preliminary Results (64PE378), TRAFFIC II: Transatlantic Fluxes of Saharan Dust (Las Palmas de Gran Canaria, Spain – St. Maarten). Netherlands: Royal NIOZ, 54.
Towe, K. M., and Cifelli, R. (1967). Wall ultrastructure in the calcareous foraminifera: crystallographic aspects and a model for calcification. J. Paleontol. 41, 742–762.
Toyofuku, T., Suzuki, M., Suga, H., Sakai, S., Suzuki, A., and Ishikawa, T. (2011). Mg/Ca and δ18O in the brackish shallow-water benthic foraminifer Ammonia ‘beccarii’. Mar. Micropaleontol. 78, 113–120. doi: 10.1016/j.marmicro.2010.11.003
Tyszka, J., Bickmeyer, U., Raitzsch, M., Bijma, J., Kaczmarek, K., Mewes, A., et al. (2019). Form and function of F-actin during biomineralization revealed from live experiments on foraminifera. Proc. Natl. Acad. Sci. U.S.A. 116, 4111–4116. doi: 10.1073/pnas.1810394116
van Dijk, I., de Nooijer, L. J., and Reichart, G. J. (2017). Trends in element incorporation in hyaline and porcelaneous foraminifera as a function of pCO2. Biogeosciences 14, 497–510. doi: 10.5194/bg-14-497-2017
Wit, J. C., de Nooijer, L. J., Wolthers, M., and Reichart, G.-J. (2013). A novel salinity proxy based on Na incorporation into foraminiferal calcite. Biogeosciences 10, 6375–6387. doi: 10.5194/bg-10-6375-2013
Wood, A. (1948). The structure of the wall of the test in the Foraminifera; its value in classification. Q. J. Geol. Soc. 104, 229–255. doi: 10.1144/gsl.jgs.1948.104.01-04.11
Wood, A., and Haynes, J. (1957). Certain smaller British paleocene foraminifera. part II—cibicides and its allies. cushman found. Foram. Res. Contr. 8, 45–53.
Keywords: foraminifera, ultrastructure, cogwheel, biomineralization, SEM
Citation: van Dijk I, Raitzsch M, Brummer G-JA and Bijma J (2020) Novel Method to Image and Quantify Cogwheel Structures in Foraminiferal Shells. Front. Ecol. Evol. 8:567231. doi: 10.3389/fevo.2020.567231
Received: 29 May 2020; Accepted: 05 November 2020;
Published: 26 November 2020.
Edited by:
Anne M. Gothmann, St. Olaf College, United StatesReviewed by:
Jan Piotr Goleñ, Institute of Geological Sciences (PAN), PolandManuel F. G. Weinkauf, Charles University, Czechia
Copyright © 2020 van Dijk, Raitzsch, Brummer and Bijma. This is an open-access article distributed under the terms of the Creative Commons Attribution License (CC BY). The use, distribution or reproduction in other forums is permitted, provided the original author(s) and the copyright owner(s) are credited and that the original publication in this journal is cited, in accordance with accepted academic practice. No use, distribution or reproduction is permitted which does not comply with these terms.
*Correspondence: Inge van Dijk, SW5nZS52YW4uRGlqa0Bhd2kuZGU=; SW5nZS52YW4uZGlqa0BuaW96Lm5s
 Inge van Dijk
 Markus Raitzsch2
 Geert-Jan A. Brummer