 Hengyou Zhang
 Thomas Mitchell-Olds
 Ibro Mujacic3
 Bao-Hua Song
94% of researchers rate our articles as excellent or good
Learn more about the work of our research integrity team to safeguard the quality of each article we publish.
Find out more
DATA REPORT article
Front. Ecol. Evol. , 23 October 2020
Sec. Phylogenetics, Phylogenomics, and Systematics
Volume 8 - 2020 | https://doi.org/10.3389/fevo.2020.550936
Climate change and many adverse consequences caused by human disturbance have led to the potential and continuing extinction of many plant species (Tilman and Lehman, 2001). These adverse effects are magnified when they are imposed on rare or endangered plants, especially those with small population size and restricted gene flow (Ellstrand and Elam, 1993; Ouborg and Vriezen, 2007). In this regard, there have been increasing emphasis on dissecting the adaptive diversity and prioritizing the conservation of rare, threatened, and endangered plants (Zhang et al., 2017). Some small plant populations have shown adaptation to local or distinct environment conditions (McKay et al., 2001; Song and Mitchell-Olds, 2007), which has been reflected by strong correlations between phenotypic and/or physiological traits and relevant environmental variables (McKay et al., 2001; Blanquart et al., 2013), and adaptive genetic variation has demonstrated a role in contributing to the evolution of plant species (Gehan et al., 2015; Yeaman, 2015). Despite the importance of this issue, the molecular mechanisms by which genetic variation causes local adaptation remains largely unknown. Thus, assembly and annotation of the genome sequences of these rare plant species represent a critical first step to understand plant adaptation mechanisms.
Boechera fecunda is rare and predominantly inbreeding. It is restricted to areas of calc-silicate soil outcrops in western Montana, United States (Figure 1A) (Song and Mitchell-Olds, 2007; Leamy et al., 2014). A total of 21 B. fecunda populations were found to be endemic to two geographic regions (WEST and EAST) in southwestern Montana, separated by a distance of ~100 km with different climatic variables and soil water availability (Figure 1A). Briefly, the mean elevation of the WEST region (1525 m) is much lower than that of the EAST region (2195 m), while WEST region (46° 21′) is located at higher longitude than EAST region (45° 42′). McKay et al. (2001) found that B. fecunda populations growing in the low-elevation region (WEST) experienced higher drought stress than those in high-elevation habitats (EAST), and plants growing in these two highly divergent regions, respectively, are adapted to their local environments (Song and Mitchell-Olds, 2007). This local adaptation was evidenced by the observations of higher mean water use efficiency (WUE), larger leaf area, and greater rosette diameter for populations from the drier, low-elevation habitat compared with those from the EAST region (McKay et al., 2001). Bottleneck analysis suggests that B. fecunda populations grown in these two distinct environments have experienced very different evolutionary histories (Song and Mitchell-Olds, 2007; Leamy et al., 2014). These observations and results suggest that B. fecunda, a wild relative of Arabidopsis, is an exemplary system that can be used to address a variety of ecological, evolutionary, and conservation question.
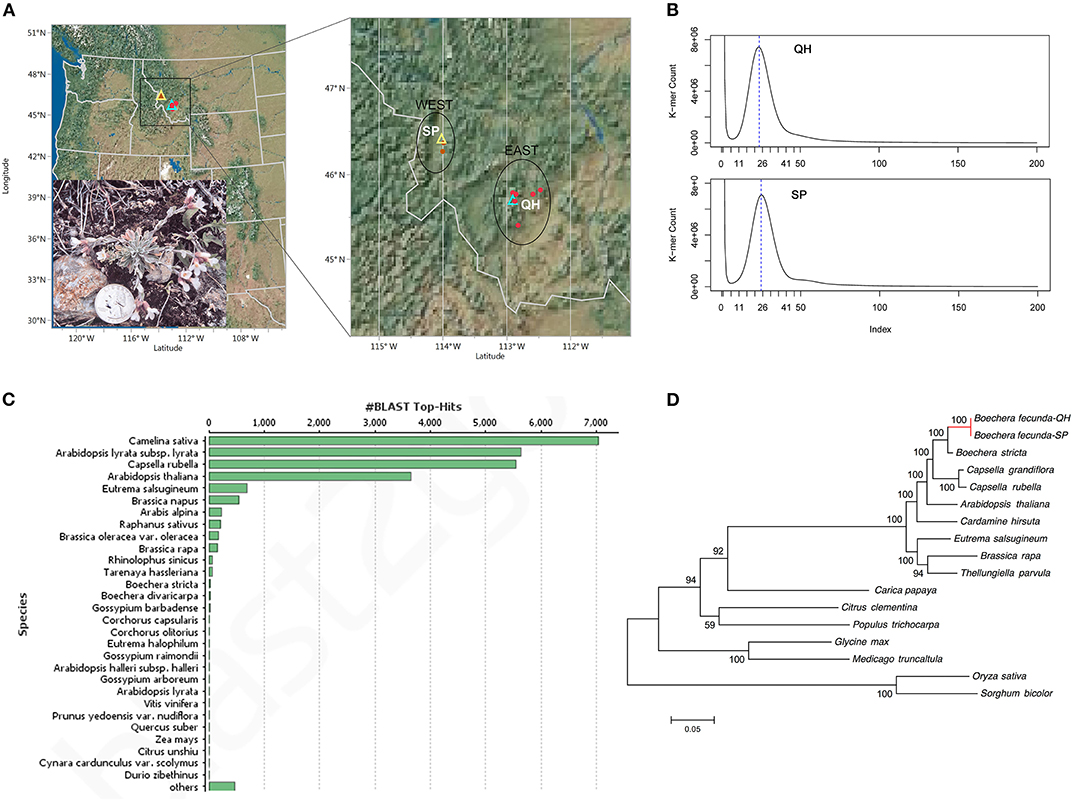
Figure 1. (A) Geographic location of two ecotypes of B. fecunda. The left panel shows locations of the populations in Montana, United States. The zoomed-in region is illustrated in the right panel. Red solid dots represent all 29 accessions of B. fecunda described in McKay et al. (2001) and Song and Mitchell-Olds (2007), of which QH and SP were highlighted with cyan and yellow hollow triangles, respectively. This figure was prepared with JMP pro 13.0.0 (SAS Institute Inc., Cary, NC, United States). The imbedded photo shows a Quarter-size B. fecunda plant at the stage of flowering in the wild. (B) Distribution of 17-mer frequency for QH and SP sequencing reads. (C) A list of species to which most sequence was aligned. (D). Phylogenetic tree across 14 plant species including the SP and QH ecotypes of B. fecunda. The numbers above the branches indicate the bootstrap value.
Given the importance of the two populations (EAST and WEST) with morphological and physiological traits adapted to two distinct habitats (McKay and Latta, 2002) but lack of the genomic information, we present the de novo assemblies and annotation of the two genomes, the QH and SP ecotypes, locally adapted to the EAST and WEST regions. We also identified polymorphisms in these two highly divergent lineages of B. fecunda. Subsequently we conducted genome annotation for each of the two genomes and identified the DNA variants (SNPs and Indels) between them. The genome assemblies and the annotation data will be valuable resources for further dissecting the genetic basis of the ecologically adaptive traits and the evolutionary mechanisms underlying local adaptation in plants.
Seeds of two B. fecunda (NCBI: txid93887) ecotypes (SP and QH) were collected from their natural habitats located at Spooner (46° 25′ N, 114° 01′ W, 1,326 meter elevation, WEST) and Quartz Hill (45° 42′ N, 112° 54′ W, 2,438 meter elevation, EAST), respectively, in southwestern Montana, United States (Figure 1A). (According to the Montana Natural Heritage Program (MNHP), there are no legal protections or limitations on research for B. fecunda [MNHP, personal communication]). Seeds of each genotype were placed on moist filter paper in a petri dish and cultured in the dark in an environmental chamber (Percival Scientific, United States) at 27°C. Germinated plants were grown in a chamber with 27°C and 12 h/12 h L/D at the University of North Carolina at Charlotte. Leaf tissues were collected, flash frozen with liquid nitrogen, and then stored at −80°C until use.
Genomic DNA was extracted with DNeasy Plant Mini Kit (Qiagen, MD, United States) according to the manufacturer-provided Quick Start Protocol. Genomic DNA quality was determined by running the samples on an agarose gel to show the integrity of the genomic DNA. The DNA concentration was quantified using a PicoGreen assay following the manufacturer's protocol. The two paired-end (PE) libraries containing 100 base pair fragments were constructed following the Illumina TruSeq genomic DNA library prep protocol (Illumina Inc, San Diego, CA, United States) using genomic DNA samples. Each library was indexed and quantified using real-time PCR. The two PE libraries were pooled on an equimolar basis, and run on a single lane. Clusters were then generated to load onto a PE read flowcell and sequenced on an Illumina HiSeq 2000 platform at David H. Murdock Research Institute (Kannapolis, NC, United States). The Illumina sequencing produced 47.5 Gb of raw data.
The quality of the raw sequence data was assessed using FastQC software, version 0.11.5 (https://www.bioinformatics.babraham.ac.uk/projects/fastqc/). The graphical reports generated by FastQC were reviewed, and sequence trimming was subsequently performed as needed using Trimmomatic version 0.36 (Bolger et al., 2014) following the manual. The following steps were performed for quality control: (1) the sequencing center-provided adaptor sequences and overrepresented sequences were removed; (2) the leading and trailing low-quality or N bases below 2 were removed by setting up the LEADING and TRAILING options; (3) all reads were scanned (SLIDINGWINDOW:4:15); (4) read lengths below 36 after the above steps were dropped (MINLEN:36). The trimmed reads were reassessed using FastQC to verify improved data quality. Prior to conducting de novo genome assembly, we performed error correction for the QC-passing reads using the program BayesHammer (Nikolenko et al., 2013). The error-corrected reads for each species (QH: 92,280,436 reads; SP: 96,802,022 reads) were used for further study.
The genome size of the two B. fecunda genotypes was estimated by K-mer frequency based Jellyfish (Marcais and Kingsford, 2011) and GenomeScope (Vurture et al., 2017). Clean and error-corrected reads from two libraries were used to determine the distribution of 17-mer (Xiao et al., 2017; Gao et al., 2018) and a frequency graphs (Figure 1B) were generated. The results showed the highest peaks occurring at depths of 24 and 25 for QH and SP, respectively, further revealing approximately 25 and 26-fold coverage of QH and SP genomes, respectively. According to 17-mer analysis, the genome size of both genomes is estimated to be 188.8 Mb and 185.0 Mb for QH and SP, respectively (Table 1), which is comparable to the recent release pseudomolecule genome size (183.3 Mb) of Boechera stricta (Lee et al., 2017), a closely related congener of B. fecunda. GenomeScope was used to analyse the heterozygosity (Vurture et al., 2017), and it showed that both genotypes contains consistent unique (single-copy) regions of the genome assemblies (63.8–62.7%), with fairly low heterozygosity levels (0.0155–0.0101%), and error rates (0.0973–0.0582%). These results indicate that our sequencing data contains extensive data that is appropriate for genome assembly and the follow-up characterization.
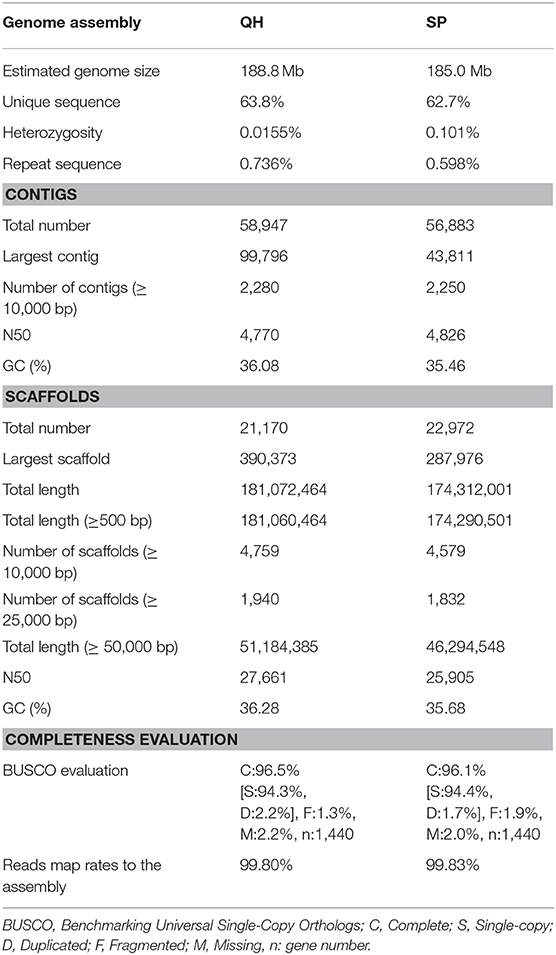
Table 1. Summary of sequencing reads and statistics for genome assembly and SNPs.
The genome assembly was done using the program SOAPdenovo-127mer in SOAPdenovo2 v2.04.4 (Luo et al., 2012) with the following parameters: (1) the average insert size of the library was 290 (avg_ins = 290); (2) the PE libraries were forward-reverse sequenced (revers_seq = 0); (3) both contig and scaffold assembly were performed (asm_flags = 3); (4) all reads were used for assembly (rd_len_cutoff = 100); (5) the order the reads were used while scaffolding (rank = 1); and (6) the minimum length aligned to contigs for a reliable read location was 32 (map_len = 32). SOAPdenovo2 was run using the recommended options with the additional use of the options—R (resolve repeats by reads) and—F (fill gaps in scaffold). To obtain an optimized k-mer for accurate assembly, different k values ranging from 33- to 83-mers with an increase of k = 2 were used. After assessing different k-mer sizes using the quality assessment tool QUAST (Gurevich et al., 2013), we found that 63-mers and 59-mers provided the best tradeoff for QH and SP, respectively. With the selected k-mers, the error-corrected reads were assembled into 21,170 scaffolds of 181 Mb total (N50 length = 27,661 bp) for QH and 22,972 scaffolds of 174 Mb total (N50 length = 25,905) for SP. The size of both assemblies is slightly smaller than the newly released assembly (183.3 Mb) of B. stricta (Lee et al., 2017). Statistics of sequencing depth, assembly, the percentage of reads mapping to assembly, largest and average scaffold, GC percentage, and coverage of assembled scaffolds of the two B. stricta genomes studied are presented in Table 1.
To further evaluate the assembly quality, the error-corrected reads were aligned back to the respective assembled scaffolds using the algorithm BWA-MEM of the aligner BWA (Li and Durbin, 2009), and the percentage of reads aligned was calculated using SAMtools (Li et al., 2009). Over 99% of the corrected reads were aligned to the assembly. On the other hand, the program Benchmarking Universal Single-Copy Orthologs (BUSCOs) (Simao et al., 2015) [embryophyta_odb9, blast+ v.2.3.0 (Camacho et al., 2009), Augustus v.3.3.2 (Stanke et al., 2008), and Hmmer v.3.2.1 (Johnson et al., 2010)] was used to evaluate the completeness of the assemblies by comparing their predicted gene content with conserved single-copy orthologs in A. thaliana. More than 96% of core A. thaliana were successfully identified in both assemblies. The percentage of genes (n) for complete (C), complete and single-copy (S), complete and duplicated (D), fragmented (F), and missing (M) BUSCOs are shown in Table 1. The BUSCO result indicates a high completeness of the B. fecunda genome assemblies.
The polymorphism estimate between the two divergent ecotypes of B. fecunda (QH vs. SP), as well as between the two congener species (B. fecunda vs. B. stricta) was shown in Supplementary Table 1. The resultant genome assemblies were used for repetitive sequences and transposable elements (TEs) annotation. We adopted two strategies, de novo identification of repeat families using RepeatScout (Price et al., 2005) and library-based search using RepeatMasker v.4.0.8 (http://www.repeatmasker.org). First, we used RepeatModeler v. 1.0.11 (http://www.repeatmasker.org/RepeatModeler/) to identify the de novo types of repetitive elements in QH or SP ecotypes. For each genotype, the resultant repeat library was then combined with the latest updated library (RepBase RepeatMasker-Edition) from the repeat database, Repbase Update, to generate a combined genotype-based repeat library. Repbase Update was hosted at the Genetic Information Research Institute (GIRI, https://www.girinst.org/). The de novo, Repbase, and combined library was then, respectively, used in RepeatMasker to identify the type, content, number, subfamily of TEs in QH or SP (Supplementary Table 2). Overall, RepeatModeler (32%) predicted two times more than by Repbase (16%). The combined analysis identified appropriately 35% (60 Mb) repetitive sequence in both genomes. The predominant elements were LTR elements, which accounted for an average of 9.23% (16 Mb) of the genomes.
The gene prediction of the two ecotypes was done by homolog-based and de novo methods. For homolog-based prediction, protein sequence from closely related plant species (Arabidopsis thaliana, Brassica rapa, Phaseolus vulgaris, Medicago truncatula, Solanum lycopersicum, Solanum tuberosum) were downloaded from Phytozome database (https://phytozome.jgi.doe.gov) and aligned against with QH and SP assemblies using BLASTp software (Camacho et al., 2009). Two gene annotation tools, GeneID (version 1.4.4) and Exonerate (version 2.2.0) (Slater and Birney, 2005), were used to define gene models. Augustus (version 3.3.2) (Hoff and Stanke, 2019) was used for de novo prediction based on the parameter trained from Arabidopsis annotation. All the resultant annotation files were integrated into a consensus gene set using EVidenceModeler (EVM, version 1.1.1) (Haas et al., 2008). We found 28,501 and 27,342 genes (amino acid ≥50) predicted to be present in QH and SP ecotypes (amino acid ≥50). We also provide the sequences of predicted gene models, protein sequences, and the corresponding gene annotation file (gff3) in this study.
To obtain functional annotation of the protein-encoding genes, we performed functional annotation of the two ecotypes based on the best match from the alignments between predicted proteins and NCBI non-redundant (nr) protein database and Uniprot using BLASTp (Camacho et al., 2009), with an E-value of 1e-5. The reason we used this relatively relaxed E-value is that B. fecunda is closely related to the well-annotated model species Arabidopsis thaliana. The output of Blastp were loaded into BLAST2GO (Gotz et al., 2008) for annotation including Gene Ontology (GO) mapping, InterProScan, Kyoto Encyclopedia of Genes and Genomes (KEGG) mapping. The best hits of each annotation were used to describe the predicted genes. The top-hit species for both B. fecunda ecotypes were all from the Brassicaceae family including Camelina sativa, Arabidopsis, and Capsella rubella, Eutrema salsugineum (formerly Thellungiella haplohila) (Figure 1C). Overall, 74.4% (21,208) and 73.8% (20,173) of the total genes in QH and SP were annotated with at least one GO term (Supplementary Figure 1). The statistics of the annotation was illustrated in Supplementary Figure 1.
Gene family analysis was performed using OrthoFinder (Emms and Kelly, 2015) on all the protein-coding genes of QH and SP and 15 additional species (A. thaliana, B. rapa, B. stricta, Cardamine hirsuta, Citrus clementina, Capsella grandiflora, Carica papaya, Capsella rubella, Eutrema salsugineum, Glycine max, Medicago truncatula, Oryza sativa, Populus trichocarpa, Sorghum bicolor, Thellungiella parvula). Among the total identified genes in both ecotypes, 89.4 and 92.9% could be classified into 16850 and 16833 families in QH and SP, respectively (Supplementary Table 3). The amount of the gene families identified for the both ecotypes of B. fecunda is comparable with those closely related species, B. stricta and A. thaliana.
To examine the evolutionary position of both ecotypes of B. fecunda, we downloaded entire protein sequences of 13 plant species from Phytozome V12 and constructed a phylogenetic tree. These 13 species include Boechera stricta, Capsella rubella, Capsella grandiflora, Arabidopsis thaliana, Cardamine hirsute, Eutrema salsugineum, Thellunigiella parvula, Brassica rapa, Carica papaya, Citrus clementia, Populus trichocarpa, Glycine max, and Medicago truncatula. The 167 single orthologous genes across the selected species that were identified from OrthoFinder (described above) were used to construct the tree employing the built-in program MAFFT with Maximum likelihood model (Katoh et al., 2002). The phylogenetic relationship of the two studied ecotypes of B. fecunda and the other plant species is shown in Figure 1D.
All sequencing raw reads for both B. fecunda ecotypes have been deposited in the National Center for Biotechnology Information (NCBI, https://www.ncbi.nlm.nih.gov) Sequence Read Archive (SRA) (BioProject PRJNA6574120). The assembled genome sequences (QH and SP), VCF files containing all the sequence variants, the annotation files comprising predicted transcripts/CDSs/genes and proteins have been deposited in GigaDB (http://gigadb.org/) (All data will be available upon acceptance).
To ensure high quality of the genome assembly, we performed a series of evaluations as the experiment was carried out. We obtained good integrity and adequate concentration of the genomic DNA, which is essential for genome sequencing with desired sequencing depth and followed-up accurate genome assembly. Prior to genome assembly, raw read trimming and error correction were carried out to obtain high quality sequencing reads (QC ≥30) with the adaptors. Low-quality bases/reads were removed, which is extremely important for creating correct kmer overlaps for de novo genome assembly. The kmer test from 33- to 83-mers allows us to select the best kmers for genome assembly, which is 63-mers and 59-mers for QH and SP, respectively. Genome completeness analysis using BUSCO/ GenomeScope showed more than 96% of core A. thaliana were successfully identified in both assemblies, indicating a high completeness of the B. fecunda genome assembly. The completeness of the assemblies was further supported by the comparable amount of gene families and protein-encoding gene models, compared with its congener species B. stricta and close relative Arabidopsis thaliana.
Trimmomatic version (v. 0.36): LEADING 2 TRAILING 2 SLIDINGWINDOW:4:15 MINLEN:36; RepeatMasker: de novo: RepeatMasker –pa 2 –s –lib lib –dir directory –html –gff –e ncbi FILE, Repbase: RepeatMasker –pa 2 –s –lib Repbase_library –dir directory –html –gff –e ncbi FILE; Augustus: –outfile=FILE –gff3=on –strand=both –genemodel=partial –species=Arabidopsis; BLASTp: blastp –db database –outfmt 5 –evalue 1e–5 –number_alignments 5 –num_threads 16 –show_gis –out FILE –query protein.fasta; EVidenceModeler (EVM): refer https://evidencemodeler.github.io; GATK: version 3.70, bwa mem –t 12, java –jar picard.jar SortSam I=FILE O=FILE SORT_ORDER=coordinate, java –jar picard.jar AddOrReplaceReadGroups I=FILE O=FILE ID=X1 LB=X2 PL=Illumina PU=hiseq SM=X3, java –jar picard.jar MarkDuplicates I=FILE O=FILE METRICS_FILE=FILENAME ASSUME_SORTED=ture, GenomeAnalysisTK.jar –T IndelRealiger –R REFERENCEFILE –I INPUT –O OUTFILE, GenomeAnalysisTK.jar –T HaplotypeCaller –R REFERENCEFILE –I FILE –O FILE –stand_call_conf 30 –min_base_quality_score 10 –minReadsPerAlignmentStart 10 –ploidy 2, GenomeAnalysisTK.jar –T SelecVariants –R FILE –V FILE E –selectType SNP –o FILE, GenomeAnalysisTK.jar –T VariantFilteration –R FILE –V FILE –filterExpression “QD<2.0 || MQ<40.0 || FS>60.0 || SOR>3.0 || MQRankSum<–12.5 || ReadPosRankSum<–8.0” –filterName FILE –O OUTFILE; BUSCO: version3.0.2, –i FILE –o FILE –m geno –l Database –sp FILE –c 16; OrthoFinder (v.2.27): –f FILE –S diamond –t 16 –M msa; “FILE” in the code indicates the input or output files following the software manual.
The datasets presented in this study can be found in online repositories. The names of the repository/repositories and accession number(s) can be found at: https://www.ncbi.nlm.nih.gov/bioproject/PRJNA657412.
B-HS initiated the study, designed the experiment, and collected the data. HZ and IM conducted the data analysis. HZ, TM-O, and B-HS wrote the manuscript. All authors approved the final manuscript. All authors contributed to the article and approved the submitted version.
B-HS was supported by the University of North Carolina at Charlotte. The National Institute of General Medical Sciences of the National Institutes of Health, Award Number: R15GM122029; and North Carolina Biotechnology Center, Award Numbers: 2019-BIG-6507 and 2020-FLG-3806. TM-O was supported by grant R01 GM086496 from the National Institutes of Health.
The authors declare that the research was conducted in the absence of any commercial or financial relationships that could be construed as a potential conflict of interest.
The Supplementary Material for this article can be found online at: https://www.frontiersin.org/articles/10.3389/fevo.2020.550936/full#supplementary-material
Blanquart, F., Kaltz, O., Nuismer, S. L., and Gandon, S. (2013). A practical guide to measuring local adaptation. Ecol. Lett. 16, 1195–1205. doi: 10.1111/ele.12150
Bolger, A. M., Lohse, M., and Usadel, B. (2014). Trimmomatic: a flexible trimmer for Illumina sequence data. Bioinformatics 30, 2114–2120. doi: 10.1093/bioinformatics/btu170
Camacho, C., Coulouris, G., Avagyan, V., Ma, N., Papadopoulos, J., Bealer, K., et al. (2009). BLAST plus: architecture and applications. BMC Bioinformatics 10:421. doi: 10.1186/1471-2105-10-421
Ellstrand, N. C., and Elam, D. R. (1993). Population genetic consequences of small population-size - Implications for plant conservation. Ann. Rev. Ecol. Syst. 24, 217–242. doi: 10.1146/annurev.es.24.110193.001245
Emms, D. M., and Kelly, S. (2015). OrthoFinder: solving fundamental biases in whole genome comparisons dramatically improves orthogroup inference accuracy. Genome Biol. 16:157. doi: 10.1186/s13059-015-0721-2
Gao, Y., Wang, H. B., Liu, C., Chu, H. L., Dai, D. Q., Song, S. N., et al. (2018). De novo genome assembly of the red silk cotton tree (Bombax ceiba). Gigascience 7, 1–7. doi: 10.1093/gigascience/giy051
Gehan, M. A., Park, S., Gilmour, S. J., An, C. F., Lee, C. M., and Thomashow, M. F. (2015). Natural variation in the C-repeat binding factor cold response pathway correlates with local adaptation of Arabidopsis ecotypes. Plant J. 84, 682–693. doi: 10.1111/tpj.13027
Gotz, S., Garcia-Gomez, J. M., Terol, J., Williams, T. D., Nagaraj, S. H., Nueda, M. J., et al. (2008). High-throughput functional annotation and data mining with the Blast2GO suite. Nucleic Acids Res. 36, 3420–3435. doi: 10.1093/nar/gkn176
Gurevich, A., Saveliev, V., Vyahhi, N., and Tesler, G. (2013). QUAST: quality assessment tool for genome assemblies. Bioinformatics 29, 1072–1075. doi: 10.1093/bioinformatics/btt086
Haas, B. J., Salzberg, S. L., Zhu, W., Pertea, M., Allen, J. E., Orvis, J., et al. (2008). Automated eukaryotic gene structure annotation using evidence modeler and the program to assemble spliced alignments. Genome Biol. 9:R7. doi: 10.1186/gb-2008-9-1-r7
Hoff, K. J., and Stanke, M. (2019). Predicting genes in single genomes with AUGUSTUS. Curr. Protoc. Bioinform. 65:e57. doi: 10.1002/cpbi.57
Johnson, L. S., Eddy, S. R., and Portugaly, E. (2010). Hidden Markov model speed heuristic and iterative HMM search procedure. BMC Bioinform. 11:431. doi: 10.1186/1471-2105-11-431
Katoh, K., Misawa, K., Kuma, K., and Miyata, T. (2002). MAFFT: a novel method for rapid multiple sequence alignment based on fast Fourier transform. Nucleic Acids Res. 30, 3059–3066. doi: 10.1093/nar/gkf436
Leamy, L. J., Lee, C. R., Cousins, V., Mujacic, I., Manzaneda, A. J., Prasad, K., et al. (2014). Large-scale adaptive divergence in Boechera fecunda, an endangered wild relative of Arabidopsis. Ecol. Evol. 4, 3175–3186. doi: 10.1002/ece3.1148
Lee, C. R., Wang, B. S., Mojica, J. P., Mandakova, T., Prasad, K. Y. S. K., Goicoechea, J. L., et al. (2017). Young inversion with multiple linked QTLs under selection in a hybrid zone. Nat. Ecol. Evol. 1:0119. doi: 10.1038/s41559-017-0310-8
Li, H., and Durbin, R. (2009). Fast and accurate short read alignment with burrows-wheeler transform. Bioinformatics 25, 1754–1760. doi: 10.1093/bioinformatics/btp324
Li, H., Handsaker, B., Wysoker, A., Fennell, T., Ruan, J., Homer, N., et al. (2009). The sequence alignment/map format and SAMtools. Bioinformatics 25, 2078–2079. doi: 10.1093/bioinformatics/btp352
Luo, R. B., Liu, B. H., Xie, Y. L., Li, Z. Y., Huang, W. H., Yuan, J. Y., et al. (2012). SOAPdenovo2: an empirically improved memory-efficient short-read de novo assembler. Gigascience 1:18. doi: 10.1186/2047-217X-1-18
Marcais, G., and Kingsford, C. (2011). A fast, lock-free approach for efficient parallel counting of occurrences of k-mers. Bioinformatics 27, 764–770. doi: 10.1093/bioinformatics/btr011
McKay, J. K., Bishop, J. G., Lin, J. Z., Richards, J. H., Sala, A., and Mitchell-Olds, T. (2001). Local adaptation across a climatic gradient despite small effective population size in the rare sapphire rockcress. Proc. R. Soc. B Biol. Sci. 268, 1715–1721. doi: 10.1098/rspb.2001.1715
McKay, J. K., and Latta, R. G. (2002). Adaptive population divergence: markers, QTL and traits. Trends Ecol. Evol. 17, 285–291. doi: 10.1016/S0169-5347(02)02478-3
Nikolenko, S. I., Korobeynikov, A. I., and Alekseyev, M. A. (2013). BayesHammer: Bayesian clustering for error correction in single-cell sequencing. BMC Genomics 14:S7. doi: 10.1186/1471-2164-14-S1-S7
Ouborg, N. J., and Vriezen, W. H. (2007). An ecologist's guide to ecogenomics. J. Ecol. 95, 8–16. doi: 10.1111/j.1365-2745.2006.01197.x
Price, A. L., Jones, N. C., and Pevzner, P. A. (2005). De novo identification of repeat families in large genomes. Bioinformatics 21, I351–I358. doi: 10.1093/bioinformatics/bti1018
Simao, F. A., Waterhouse, R. M., Ioannidis, P., Kriventseva, E. V., and Zdobnov, E. M. (2015). BUSCO: assessing genome assembly and annotation completeness with single-copy orthologs. Bioinformatics 31, 3210–3212. doi: 10.1093/bioinformatics/btv351
Slater, G. S., and Birney, E. (2005). Automated generation of heuristics for biological sequence comparison. BMC Bioinformatics 6:31. doi: 10.1186/1471-2105-6-31
Song, B. H., and Mitchell-Olds, T. (2007). High genetic diversity and population differentiation in Boechera fecunda, a rare relative of Arabidopsis. Mol. Ecol. 16, 4079–4088. doi: 10.1111/j.1365-294X.2007.03500.x
Stanke, M., Diekhans, M., Baertsch, R., and Haussler, D. (2008). Using native and syntenically mapped cDNA alignments to improve de novo gene finding. Bioinformatics 24, 637–644. doi: 10.1093/bioinformatics/btn013
Tilman, D., and Lehman, C. (2001). Human-caused environmental change: Impacts on plant diversity and evolution. Proc. Natl. Acad. Sci. U.S.A. 98, 5433–5440. doi: 10.1073/pnas.091093198
Vurture, G. W., Sedlazeck, F. J., Nattestad, M., Underwood, C. J., Fang, H., Gurtowski, J., et al. (2017). GenomeScope: fast reference-free genome profiling from short reads. Bioinformatics 33, 2202–2204. doi: 10.1093/bioinformatics/btx153
Xiao, Y., Xu, P. W., Fan, H. K., Baudouin, L., Xia, W., Bocs, S., et al. (2017). The genome draft of coconut (Cocos nucifera). Gigascience 6, 1–11. doi: 10.1093/gigascience/gix095
Yeaman, S. (2015). Local adaptation by alleles of small effect. Am. Nat. 186, S74–S89. doi: 10.1086/682405
Keywords: conservation, ecological adaptation, evolution, genome sequence, polymorphism, SNP
Citation: Zhang H, Mitchell-Olds T, Mujacic I and Song B-H (2020) De novo Genome Assembly, Annotation, and SNP Identification of an Endangered Rockcress, Boechera fecunda. Front. Ecol. Evol. 8:550936. doi: 10.3389/fevo.2020.550936
Received: 06 May 2020; Accepted: 11 September 2020;
Published: 23 October 2020.
Edited by:
Dapeng Wang, University of Leeds, United KingdomReviewed by:
Diego San Mauro, Complutense University of Madrid, SpainCopyright © 2020 Zhang, Mitchell-Olds, Mujacic and Song. This is an open-access article distributed under the terms of the Creative Commons Attribution License (CC BY). The use, distribution or reproduction in other forums is permitted, provided the original author(s) and the copyright owner(s) are credited and that the original publication in this journal is cited, in accordance with accepted academic practice. No use, distribution or reproduction is permitted which does not comply with these terms.
*Correspondence: Bao-Hua Song, YnNvbmc1QHVuY2MuZWR1; orcid.org/0000-0003-3537-7783
†Present address: Hengyou Zhang, Donald Danforth Plant Science Center, Saint Louis, MO, United States
Disclaimer: All claims expressed in this article are solely those of the authors and do not necessarily represent those of their affiliated organizations, or those of the publisher, the editors and the reviewers. Any product that may be evaluated in this article or claim that may be made by its manufacturer is not guaranteed or endorsed by the publisher.
Research integrity at Frontiers
Learn more about the work of our research integrity team to safeguard the quality of each article we publish.