 Sophie L. Gilbert
 Kris J. Hundertmark
 Mark S. Lindberg2
 David K. Person
 Mark S. Boyce
- 1Department of Fish and Wildlife Sciences, University of Idaho, Moscow, ID, United States
- 2Institute of Arctic Biology, University of Alaska Fairbanks, Fairbanks, AK, United States
- 3Alaska Department of Fish and Game, Braintree, VT, United States
- 4Department of Biological Sciences, Faculty of Science, University of Alberta, Edmonton, AB, Canada
The pathways through which environmental variability affects population dynamics remain poorly understood, limiting ecological inference and management actions. Here, we use matrix-based population models to examine the vital rate responses to environmental variability and individual traits, and subsequent transient dynamics of the population in response to the environment. Using Sitka black-tailed deer (Odocoileus hemionus sitkensis) in Southeast Alaska as a study system, we modeled effects of inter-annual process variance of covariates on female survival, pregnancy rate, and fetal rate, and summer and winter fawn survival. To examine the influence of environmental variance on population dynamics, we compared asymptotic and transient perturbation analysis (elasticity analysis, a life-table response experiment, and transience simulation). We found that summer fawn survival was primarily determined by black bear (Ursus americanus) predation and was positively influenced by mass at birth and female sex. Winter fawn survival was determined by malnutrition in deep-snow winters and was influenced by an interaction between date of birth and snow depth, with late-born fawns at greater risk in deep-snow winters. Adult female survival was the most influential vital rate based on classic elasticity analysis, however, elasticity analysis based on process variation indicated that winter and summer fawn survival were most variable and thus most influential to variability in population growth. Transient dynamics produced by non-stable stage distributions produced realized annual growth rates different from predicted asymptotic growth rates in all years, emphasizing the importance of winter perturbations to population dynamics of this species.
Introduction
Identifying key environmental factors that dictate animal population dynamics is a primary goal of ecologists, yet linking changes in environmental conditions to population-level responses remains a central challenge (Gamelon et al., 2014; Maldonado-Chaparro et al., 2018). Environments are complex and many features vary across time and space. Consequently, the effects of environmental variables on dynamics of populations can differ annually, seasonally, and spatially in magnitude and direction (Coulson et al., 2005). Moreover, those effects may be manifested differently in life history stages within the population, dependent on the species’ biology (Gamelon et al., 2014). Because of difficulties in measuring population responses to environmental influences across all life history stages, inference regarding population responses to environmental change is frequently drawn from studies of a single important life history phase, and important covariates of fitness for this life history phase are then assumed to also be the primary factors influencing population dynamics. Yet even strong effects of the environment on life history phase may not matter in the context of population dynamics if those vital rates are relatively unimportant in determining population growth (Gaillard et al., 1998). Likewise, highly influential life-history phases in theory may not vary much in the real world due to evolutionary canalization of life-history patterns (i.e., reduced phenotypic variation due to unknown developmental mechanisms; Gaillard and Yoccoz, 2003).
Animal populations going through an abrupt change in size due to environmental or management actions often have different proportions of animals of each age (i.e., population stage) than populations not going through such perturbations, because the effects of the perturbation on age-specific vital rates often differs. Yet long-standing approaches to prospective and retrospective population analysis (i.e., sensitivity and elasticity analysis and life table response experiments), which are often used to analyze the effects of perturbations on population growth rates, assume the population has reached an asymptotic equilibrium where proportions of population stages are constant (i.e., stable age distribution). Importantly, perturbed populations with a non-stable age distribution often can result in very different annual population growth rates and population abundance than predicted by asymptotic analysis, which is referred to as population momentum (Koons et al., 2006).
Advances in modeling have led to substantial progress in understanding the effects of covariates on vital rates, such as survival (Pollock et al., 1989; Tsai et al., 1999; Blums et al., 2005; Monteith et al., 2013) and reproductive success (Delgiudice et al., 2007; Therrien et al., 2008; Tollefson et al., 2010). In parallel, our understanding of how vital rates affect population dynamics in variable environments has also improved dramatically with the advent of stochastic and density-dependent population models (Grant and Benton, 2000; Hunter et al., 2010; Boyce et al., 2012), life table response experiments (LTREs; Caswell, 2001, 2010), integrated population models (Schaub and Abadi, 2011), and increasingly in recent years, transient population analysis (Koons et al., 2005; Caswell, 2007; Ezard et al., 2010; Maldonado-Chaparro et al., 2018). Yet for many species, such analyses remain elusive due to data limitations, because data on all important life-history phases are required.
In this study, we examined the response of Sitka black-tailed deer (Odocoileus hemionus sitkensis) vital rates to environmental and individual-level predictor variables, then compare asymptotic and transient analysis of population dynamics to better understand the importance of transience for this population. Sitka black-tailed deer in the coastal temperate rainforest of North America provide an excellent system for such an examination of transience in response to the environment. Like many ungulates inhabiting temperate and higher latitudes, they are strongly influenced by seasonality and winter stochasticity. As expected for a sub-species of mule deer, Sitka black-tailed deer breed in fall (primary rut occurs in late October through early November, although secondary and tertiary rut cycles can occur for females not bred during the initial cycle), and produce 1 or 2 offspring per litter the following spring, first fawning as 2-year-olds (Johnson, 1987). They are the primary herbivore in the coastal temperate rainforest of Southeast Alaska, and an important source of protein for subsistence hunters, wolves (Canis lupus), and black bears (Ursus americanus). Winter is thought to limit deer populations in this system (Klein and Olson, 1960; Doerr et al., 2005; Farmer et al., 2006; Person et al., 2009), and industrial-scale timber harvest creates even-aged seral stands with poor winter forage (Alaback, 1982; Farmer and Kirchhoff, 2007), reducing the resilience of deer populations to severe winters, and possibly to predation as well (Farmer et al., 2006; Person et al., 2009). Previous studies have focused almost exclusively on adult female survival (Farmer et al., 2006; Person et al., 2009), without studying reproduction and subsequent fawn survival. This is a troubling gap in knowledge, because juvenile survival drives most observed variation in population growth rates for ungulates (Gaillard et al., 1998, 2000).
Here, we ask the following questions: Which environmental and individual variables are most predictive of survival for adult females and fawns? How do transient versus asymptotic population dynamics differ? And what do environmental effects and the resulting transient population dynamics imply for Sitka black-tailed deer ecology and management, and for ungulate populations in stochastic environments more generally? To answer these questions, we tested a series of hypotheses (Table 1) for each adult vital rate (pregnancy, fetal rate, and annual survival), and fawn vital rate (summer and winter survival). For fawn vital rates, we hypothesized that fawn survival should be influenced by maternal quality, and thus maternal age, mass, and body fat should increase fawn survival in summer and winter. Likewise, mass at birth should increases summer survival by reducing predation risk (Lomas and Bender, 2007; Johnstone-Yellin et al., 2009; Hurley et al., 2011), and increase winter survival if early mass deficits persist (Loison et al., 1999; Whiting et al., 2010). Similarly, litter size should reduce summer survival through decreased maternal investment, or potentially increased vulnerability to predation (Johnstone-Yellin et al., 2009; Van Vuren et al., 2013). In addition, birth synchrony should increase summer survival through reduced predation risk (but could have a negative effect instead; Sinclair et al., 2000) and enhanced overlap with peak plant nutrition (Langvatn et al., 2004; Parker et al., 2009). W also hypothesized that female fawns would survive at higher rates than males due to less-conspicuous behavior and slower growth rates (Jackson et al., 1972; Loison et al., 1999). In contrast, late-born fawns should be less vulnerable to bear predation as bears focus on salmon in late summer (Hilderbrand et al., 2004), but more vulnerable to winter starvation due to small body size (Loison et al., 1999; Whiting et al., 2010). Finally, we hypothesized that timber harvest would reduce summer fawn survival by concentrating deer and bears in young productive clearcuts; and winter severity and timber harvest could interactively reduce winter fawn survival, as young clearcuts with deep snow provide poor forage, while older clearcuts support little plant biomass (Alaback, 1982; Hanley, 2005; Farmer and Kirchhoff, 2007). For adult female deer, we predicted that all vital rates would respond positively to age, body mass, and body fat (Mueller and Sadleier, 1979; Delgiudice et al., 2006, 2007; Johnstone-Yellin et al., 2009), and negatively to timber harvest and winter severity, with potential lagged negative effects of winter in following years (Robinette et al., 1957; Verme, 1977; Fryxell et al., 1991). In terms of overall population dynamics, we expected that adult female survival would have the largest relative influence on population dynamics based on classic elasticity analysis, but that process variation in juvenile survival (i.e., recruitment) should be the highest of all the vital rates, and have the greatest influence on observed population fluctuations between years. Moreover, we predicted that non-stable stage distributions would result in transient dynamics that are quite different than those predicted by asymptotic growth rates.
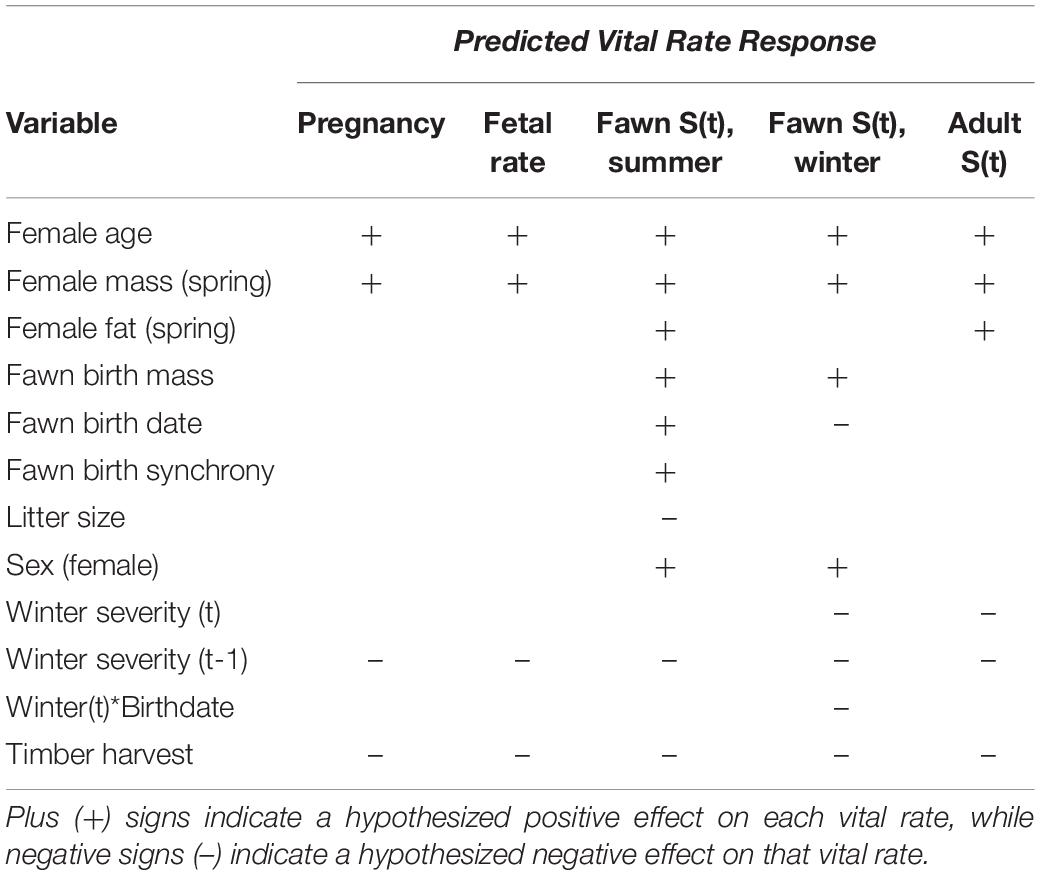
Table 1. Hypothesized effects of covariates on vital rates for Sitka black-tailed deer, Prince of Wales Island, AK, United States (2010–2013).
Materials and Methods
Study Area
Our study was conducted from 2010 to 2013, on central Prince of Wales Island, the largest among the many islands of the Alexander Archipelago of Southeast Alaska (Figure 1). The ∼420 km2 study area is typical of the coastal temperate rainforest of the region, although with gentler topography, milder winter conditions (Figure 2), and more productive forests than many other islands. Nevertheless, topography can be quite rugged due to the limestone and granite bedrock underlying much of the landscape, ranging from 0 to 1200 m above sea level. Due to moderate annual temperature variation, year-round plentiful precipitation (>3 m per year) falls as rain in summer, and as rain and snow in winter, dependent on temperatures that often fluctuate around freezing. As a result, winter snowfall is highly variable, sometimes persisting at depths < 1 m for weeks at a time even at sea level, but more often quite low at sea-level and increasing with elevation (White et al., 2009; Shanley et al., 2015). Relative to these long-term trends, our study period represented typical summer conditions in all summers (2010, 2011, and 2012), and a mild, moderately severe, and mild series of winters (2010–2011, 2011–2012, and 2012–2013, respectively). Natural habitat types are widely varied, including old-growth forest, numerous lakes, rivers and estuaries, alpine and subalpine vegetation above ∼400 m, and muskeg heaths (Alaback and Saunders, 2013).
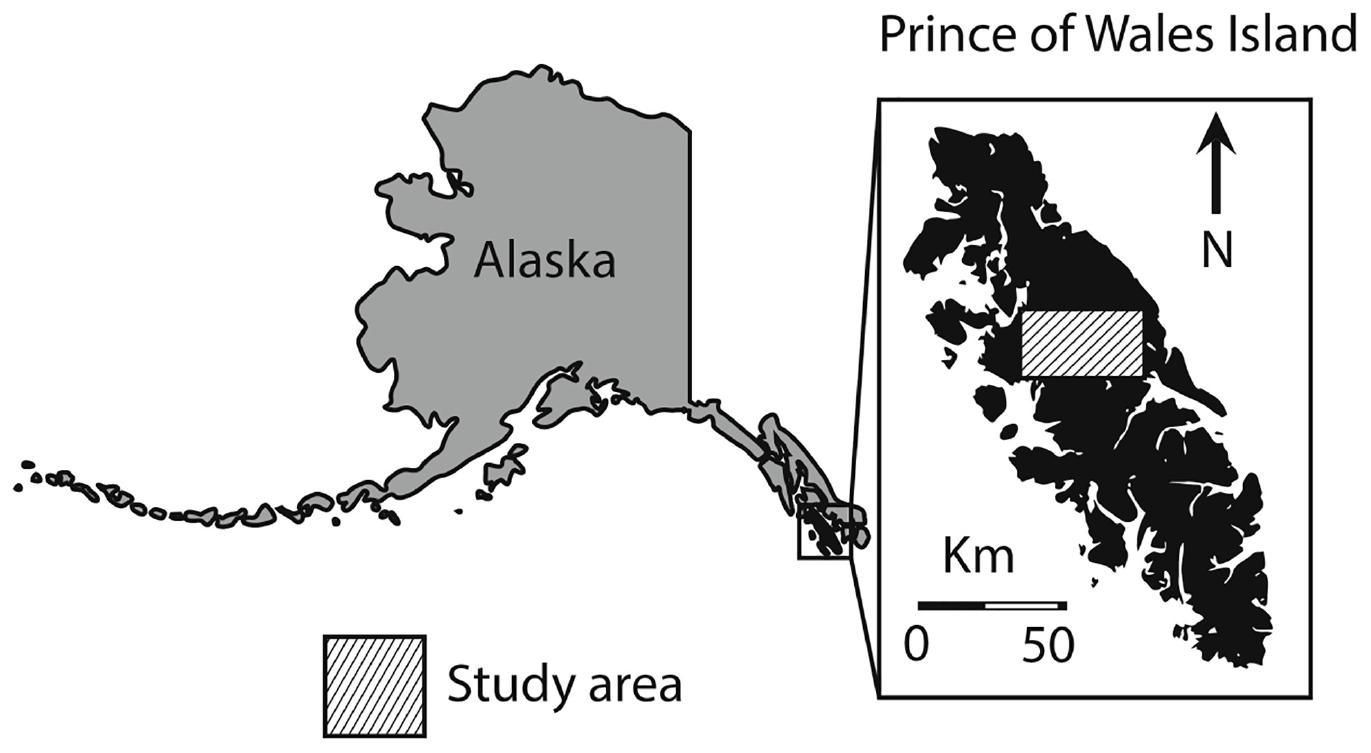
Figure 1. The study area for Sitka black-tailed deer monitored from 2010 to 2013, located in the central portion of Prince of Wales Island in Southeast Alaska within the Tongass National Forest, United States.
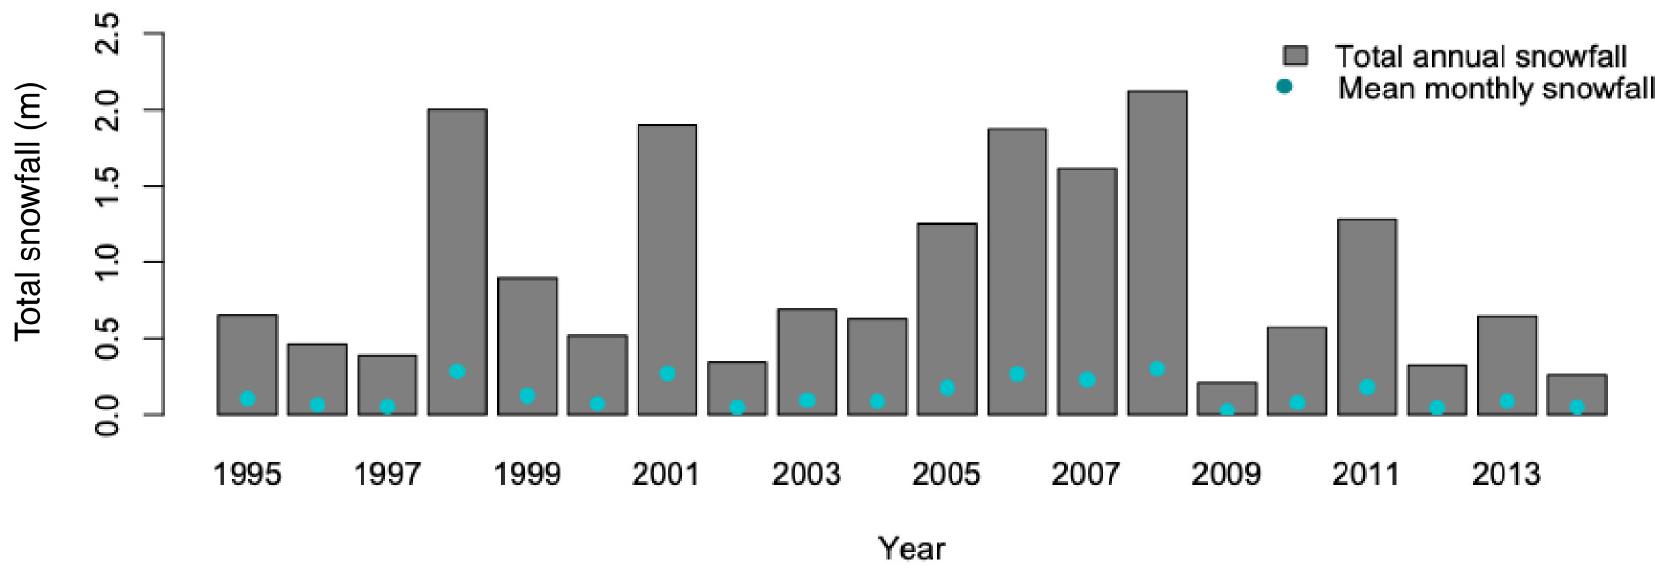
Figure 2. Total annual snowfall recorded at Annette Island, the closest long-term weather station to the study area in Southeast Alaska, United States, where Sitka black-tailed deer were monitored from 2010 to 2013.
The favorable environmental conditions relative to the region as a whole have traditionally supported abundant populations of key species, such as Sitka black-tailed deer, black bears, wolves, bald eagles (Haliaeetus leucocephalus), and salmon (Oncorhynchus spp.) that comprise a predator-prey system that also includes human hunters. In addition, central Prince of Wales continues to be the focus for industrial timber harvest in the Tongass National Forest, including in the study area (U.S. Forest Service, 2008), resulting in disproportionate harvest of productive old-growth forests via large-scale industrial clearcuts, particularly in our study area (Albert and Schoen, 2013). Historical patterns of timber harvest in our study area have produced a fragmented landscape, with some watersheds consisting entirely of old-growth forest, but most watersheds consisting of forest in a variety of seral stages. Timber harvest produces even-aged stands that gradually gain canopy cover and correspondingly lose forage biomass through successional stages, regaining old-growth properties after more than 200 years (Alaback, 1982; Alaback and Saunders, 2013). Of particular importance for deer in our study area is the abundance and large total area of seral stands > 30 years old, now in the stem exclusion stage, resulting in reductions to deer nutritional carrying capacity that are likely to persist for decades across forest management scenarios (Albert and Schoen, 2013; Gilbert et al., 2015). Notably, on northern Prince of Wales Island, where our study area is located, contiguous patches of high-quality old-growth forest have been reduced by over 90%, with average patch size of these contiguous old-growth patches reduced from 264 ha in 1954 to 73 ha in 2004 (Albert and Schoen, 2013), an area comparable to the average female deer’s home range (Schoen and Kirchhoff, 1985; Yeo and Peek, 1992).
Deer Capture and Monitoring
All animal capture and handling was carried out in accordance with the University of Alaska Fairbanks Institutional Animal Care and Use Committee (IACUC #136040-14) regulations.
From 2010 to 2012, 61 adult female deer (age 2 years and older) were captured from mid-April through mid-May of each year, and from July 5–25th during 2010 (n = 20 in 2010, n = 20 in 2011, and n = 21 in 2012). We did not capture yearling (age 1 year) animals during this study, but Farmer et al. (2006) and Person et al. (2009) studied deer in adjacent and overlapping study areas and found no difference in survival or causes of mortality between adult and yearling females. At capture, morphological measurements (i.e., heart girth, body length, hind foot length) were measured, blood collected, and body condition and pregnancy assessed using a portable ultrasound machine (Sonosite Titan®, Sonosite, Bothel, WA, United States). We estimated female body mass based on measured hearth girth (Parker, 1987), and ingesta-free body fat based on body mass and measurements from ultrasonography (Cook et al., 2010). Adult females were classified as 2, 3, and 4-plus years old based on tooth wear (Hamlin et al., 2000), but we collapsed 3 and 4-plus year-old animals into a single, adult age class. Adult survival was monitored weekly in summer (April–August 1) and every 2 weeks during the remainder of the year.
If adult females captured pre-parturition (n = 53) were pregnant, we attempted to fit them with vaginal implant transmitters (VITs; Advanced Telemetry Systems, Isanti, MN), allowing us to monitor females with VITs daily prior to parturition, locate the birth site, and capture neonates (Carstensen et al., 2003; Gilbert et al., 2014). Of the adult females successfully fitted with VITs (n = 49), we attempted to capture neonates by searching the birth site until 2 fawns were located, or for ≥2 h if fewer fawns were located. Neonates were gently restrained with eyes covered to reduce agitation, and were weighed, gendered, measured, and fitted with VHF (all years) and GPS (2012) break-away expandable collars, which fell off after approximately 1–1.5 years. Fawns were subsequently monitored 1-2 times per day from birth until August 1, then every 2 weeks until 1 year of age. The mortality signal was activated after 5 h of collar inactivity, and mortality events were investigated promptly (within 24 h of discovery during monitoring) to determine cause of death.
In total, 45 neonatal deer were captured at birth, while an additional 109 neonates were captured opportunistically along roads and trails and when spotted in meadows and clearcuts. Because mortality is highly age-dependent for neonatal deer, resulting in more vulnerable animals dying at birth or shortly thereafter, we excluded opportunistically captured neonates from our analysis of summer survival to avoid left truncation of data (Gilbert et al., 2014). In addition, we lacked information on maternal covariates such as maternal age, body mass, and body fat for opportunistically captured fawns. Therefore, because daily survival rates and thus left truncation bias converge in our system at approximately 30 days of age, we included opportunistically captured fawns in our winter fawn survival estimates, increasing our winter sample size to 81 individuals.
Effects of Covariates on Vital Rates
We estimated vital rates, including mean rates across the 3 years of the study and for each year. Vital rates estimated were pregnancy and fetal rates (i.e., number of neonatal fawns per female), summer and winter survival rates for fawns, and annual survival rates for adults. Pregnancy and fetal rate were modeled using generalized linear models in program R (R Core Development Team, 2019) and were treated as binomial and Poisson response variables, respectively (Caswell, 2001; Morris and Doak, 2002).
Only 6 adult female deer died among the 63 monitored over 3 years. This low number of events limited the number of parameters that could be tested simultaneously. Models with fewer than 10 events per variable can produce biased model estimates and Type I predictor selection error (Vittinghoff and McCulloch, 2006). As a result, we only examined the univariate effects of age, mass, bodyfat, and timber harvest regime on adult survival.
Responses of fawn and adult female survival to environmental and individual covariates were modeled using known-fates survival models, implemented in the RMark package in program R (Laake, 2013). We modeled fawn survival in separate summer and winter periods, because vulnerability to predation, sources of mortality, and therefore effects of covariates change from birth through the first year of life. The neonatal period began at birth and continued to 90 days of age, by which age most summer fawn mortality had occurred (Figure 3). During this period, survival was modeled in weekly intervals, with a linear effect of time as survival increases markedly with fawn age (Gilbert et al., 2014). The fall and winter period, henceforth referred to as the over-winter period, extended from 91 to 365 days of age, and survival was considered in 2-week intervals, without an effect of time.
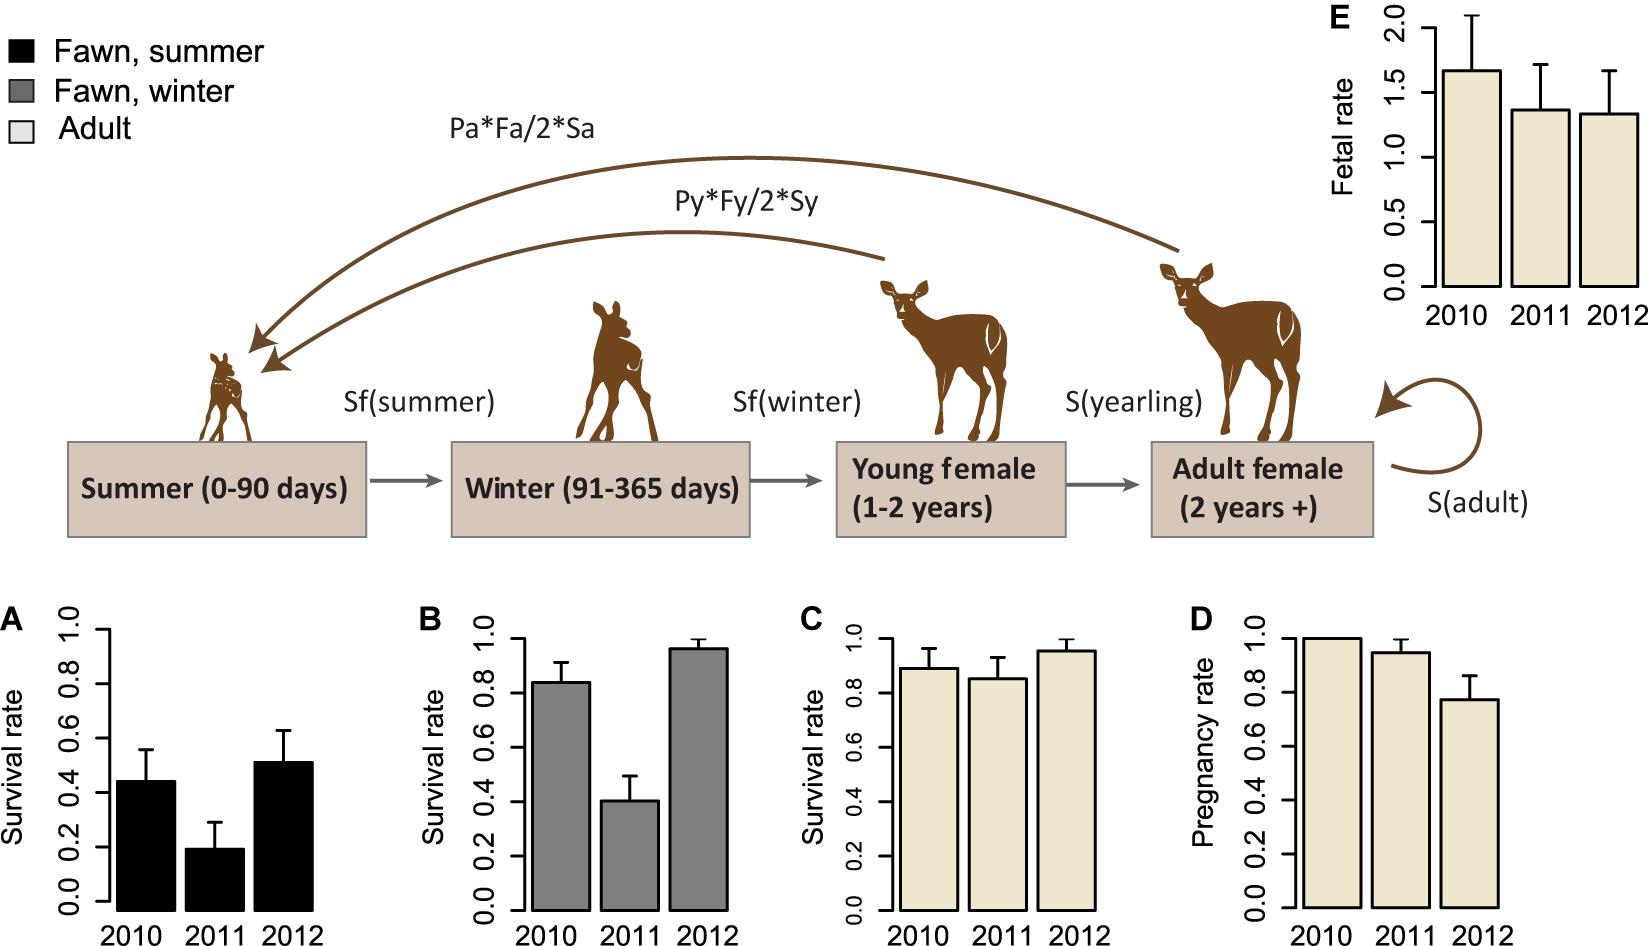
Figure 3. Interannual variability in vital rates throughout the life cycle of Sitka black-tailed deer (monitored 2010–2013). Inter-annual variability in vital rates, with standard error bars, is shown for 2010–2012, comprised of (A) summer survival rate of fawns (0–90 days old); (B) winter survival rate of fawns (91–365 days old); (C) annual survival rate of adult females, (D) pregnancy rate of adult and yearling females, and (E) fetal rate of adult and yearling females. The study was conducted on Prince of Wales Island, AK, United States.
We did not consider adult female body fat as a covariate for pregnancy or fetal rate because body condition was measured in early spring, after pregnancy and fetal rate had already been determined. In addition, we did not have any measures of nutritional condition of fawns prior to winter because they were not re-captured. Therefore, with respect to winter survival of fawns, we included an effect of mass at birth, and back-calculated mass at birth for opportunistically captured fawns by assuming a universal age of 5 days at capture. Many studies age opportunistically captured fawns based on new hoof growth (Sams et al., 1996; Haskell et al., 2007); however, existing hoof growth equations were recently demonstrated to be inaccurate for mule deer (Grovenburg et al., 2014). Instead, we empirically generated a potential capture age window by re-capturing fawns caught at birth up until the age at which they could no longer be recaptured (11 days), and assigned the median of this period (5 days) as the age at capture (Johnson et al., 2004; Gilbert et al., 2014).
To identify top and competing models for inference, we began with a global covariate model for each vital rate, based on hypothesized ecological relationships described previously. We reduced the global model for each vital rate into subset models with a maximum of 3 covariates per model for fawns and 1 covariate per model for adult females due to our limited sample sizes and numbers of mortality events. Variables that were highly correlated with each other (r > | 0.6|) were not included in the same sub-models to prevent coefficient bias. For each vital rate, a competitive model set was formed of models with Akiake’s Information Critereon adjusted for small sample size (AICc) scores that differed ≤ 2 from the model with the lowest AICc score. We then discarded models with uninformative covariates from the competing model set (Arnold, 2010), defined as models where the model was simply an hierarchical expansion by a single covariate of the top-ranked model with no reduction in log likelihood (Burnham and Anderson, 2002; Arnold, 2010). We did not conduct model validation, as hypothesis-testing rather than prediction was the primary goal of this study, and sample size was limited.
Estimation of Process Variance in Vital Rates and Predictive Variables
Temporal process variation in the vital rates was estimated by fitting a model without covariates for each vital rate, but with a group (strata) effect of year, which we then used to estimate the mean and standard error for each vital rate in each year (i.e., raw variation in vital rates across years; Morris and Doak, 2002; White, 2000). Then, we followed the approach proposed by White (2000) to partition process from sampling variance, implemented in program R. The resulting mean vital rates, with variance partitioned into sampling and process components, were used in subsequent matrices. Temporal process variance in covariates of vital rates was estimated using different approaches for environmental and individual covariates. Variation in individual covariates between years was assumed to contain both process and sampling variance, as estimates depended on the animals sampled. For individual-level predictive variables, we estimated the inter-annual process variance by constructing generalized linear models of each covariate with an effect of year in the model, then used the maximization approach of White (2000) to partition process from sampling variance, as before. To quantify winter severity, we examined variation in total annual snowfall at Annette Island from 1995 to 2014 (Figure 2) as a measure of inter-annual variability and assumed that all observed variance was process variance.
Effects of Vital Rates and Covariates on Population Dynamics
To determine the effects of each covariate on vital rates, we used the fitted relationships from the top model for each vital rate identified based on AICc score to generate predicted vital rates across a range of each of two times the standard deviation of each predictive variable (calculated as the square root of process variance). If a variable occurred in more than one vital rate model, we perturbed all vital rates affected by that variable simultaneously so that the combined effects of each variable were incorporated into covariate elasticity calculations. For each variable perturbation, we then used the predicted vital rate responses as inputs into a matrix-based population model. The post-breeding model structure included 3 age classes (Figure 3), fawns, yearlings, and adults, with the transition probability for the first age class composed of multiplicative summer and winter survival rates, as discussed above. The matrix structure was specified as follows:
Where Nj is the number of individuals in age class j at time t,Nj(t + 1), is the number of individuals in age class j at time t + 1, Sj is the survival probability of age class j, and Pj and Fj are the pregnancy rate and fecundity (as females per female) respectively, of an individual of age class j. Because we did not capture any yearling individuals, we assumed that survival of yearlings was equal to that of adult females, as found in a previous study adjacent to our study area (Farmer et al., 2006). Pregnancy and fecundity of yearlings was measured during the course of this study, despite the fact that no yearlings were captured, because animals that were captured in the spring and aged as 2 years old were primiparous yearlings about to turn 2 (Figure 3).
For comparison with the perturbed matrix for each variable, we constructed a baseline matrix, with mean vital rates calculated from the top-ranked models and covariates held at mean values. We then calculated the covariate elasticity of each vital rate as the percent difference in the dominant eigenvalues (i.e., growth rates, λ) of the two matrices:
Where Ec is the covariate elasticity,λbase is the dominant eigenvalue of the baseline matrix, and λpert is the dominant eigenvalue of the perturbed matrix [which is wonderfully dynamic like transient abundances]. We examined the effects of a positive versus negative perturbation to each covariate, resulting in positive and negative changes to λpert depending on the sign of the covariate coefficient. We calculated elasticities of the vital rates, and contributions of vital rates to observed inter-annual variability in growth rate (LTRE; Caswell, 2001; Morris and Doak, 2002), using the popbio package (Stubben et al., 2012) in program R. Elasticities of vital rates were calculated from the baseline matrix, λbase. Contributions of vital rates to variation in growth rate (i.e., LTRE; Caswell, 2001) were based on sensitivity analysis of vital rates within the mean matrix between a treatment matrix and the baseline matrix. In this case, the vital rates for the treatment matrix where simply baseline vital rates reduced by 2 standard deviations, with SDs calculated from estimated process variance for each vital rate (Table 2). If a vital rate had zero estimated process variance, it was not perturbed.
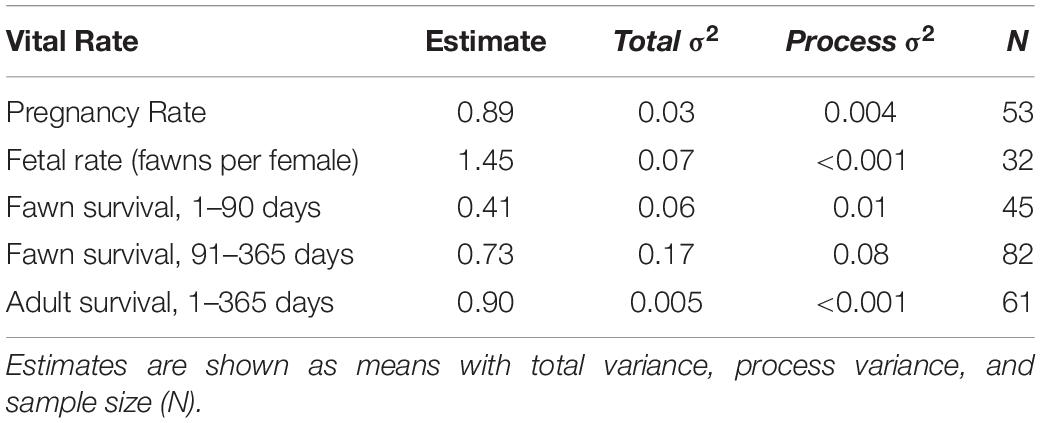
Table 2. Estimates of vital rates for across the period of the study (2010–2013) for Sitka black-tailed deer, Prince of Wales Island, AK, United States.
Sex was a covariate of fawn survival, yet we used a single-sex, all-female model for prediction of the effects of covariates, including sex. Perturbing the frequency of male versus female fawns would affect fawn survival and would therefore change the fecundity terms in our population model (i.e., number of female fawns per female at birth) in our population model. Because as we found no process variance (<0.001) in sex ratio between the years of our study, we not vary the sex ratio of fawns in our models.
Transient Analysis
Because our population was thought to be strongly affected by winter severity, which differentially affects stage class, and because we do not know how density dependence affects vital rates included in our population matrices, it is highly unlikely that the population ever achieves the stable stage distributions dictated by asymptotic analysis of our three annual Leslie matrices. To better understand how important such non-stable-stage effects on population growth might be, we conducted transient analysis. First we, constructed a simulation, in which we stochastically generated 10,000 initial stage distributions for the first year of our study (2008-09, a mild winter year following 3 successive severe winters), then projected this population structure through the subsequent annual matrices, which represented a year with a mild winter in year t (2010–2011), followed by a year with a severe winter (2011–2012), followed by a year with a mild winter (2012–2013). For each population run, we calculated population size for each stage in each year, transient population growth [simply N(t+1)/N(t)], reactivity (a measure of population density in the first year following perturbation, calculated as transient growth divided by asymptotic growth of the annual matrix), and inertia, a similar metric indicating the ratio of maximum population size achieved due to both transient and population dynamics compared to that achieved via asymptotic growth alone (Koons et al., 2007; Stott et al., 2012). Following initial analysis, inertia was revealed to be equivalent to reactivity for this population, since maximum transient population size relative to asymptotic dynamics was achieved in year t = 1, and inertia was therefore not included in our final analysis. These resulting distributions of population size, transient growth, and reactivity were used to generate the median and 95% confidence intervals for these metrics. In addition, we examined the minimum and maximum potential influences of transient dynamics for each annual matrix using the minimum attenuation and maximum amplification metrics described in Stott et al. (2012), which also allows for calculation of which population stage contributed most to attenuation and amplification relative to asymptotic dynamics.
Results
Vital Variability and Response to Predictive Variables
Pregnancy and Fetal Rate
The average pregnancy rate for adult female deer was 0.89 (Total variance = 0.03, process variance = 0.009). Vital rates varied across years (Table 2 and Figure 3). Females had pregnancy rates of 1.0 in 2010, 0.95 in 2011, and 0.77 in 2012.
The average fertility rate for pregnant females was 1.45 fawns per female (total variance = 0.07, process variance < 0.001), implying a rate of 0.72 female fawns per female if a 1:1 gender ratio is assumed. The rate of female fawns per female measured from our captured fawns was 0.625 female fawns per female (SE = 0.10), with an upper 95% confidence interval of 0.82, leading us to accept the 1:1 gender ratio assumption. Among years, the fertility rate was 1.67 fawns per female (SE = 0.43) in 2010, 1.36 (SE = 0.35) in 2011, and 1.33 (SE = 0.33) in 2012.
Variables that affected probability of pregnancy were the severity of the proceeding winter as measured by total snowfall [winter(t-1)], adult female age, and timber harvest of the watershed, with the best-supported model including winter (t-1) and timber harvest (Table 3). Adult female age had a positive effect on probability of pregnancy, as did occupancy of a timber-harvested watershed, while a winter with greater total snowfall reduced the probability of pregnancy in the following spring. Fetal rate was not strongly affected by any covariates; the null model was top-ranked, although a positive effect of female age (ΔAICc = 1.24; Table 3) and female mass (ΔAICc = 1.83) also received support. Female age and female mass were positively correlated for pregnant females (r = 0.60, p < 0.01) and for females where fawns were captured (r = 0.57, p < 0.01), and as a result, female age and female mass were not simultaneously included as covariates in any vital rate models. Based on the univariate analysis of covariates of female survival, there was support for negative effects of female mass and age on survival (i.e., younger, lighter-weight females survived with higher probability; Table 3).
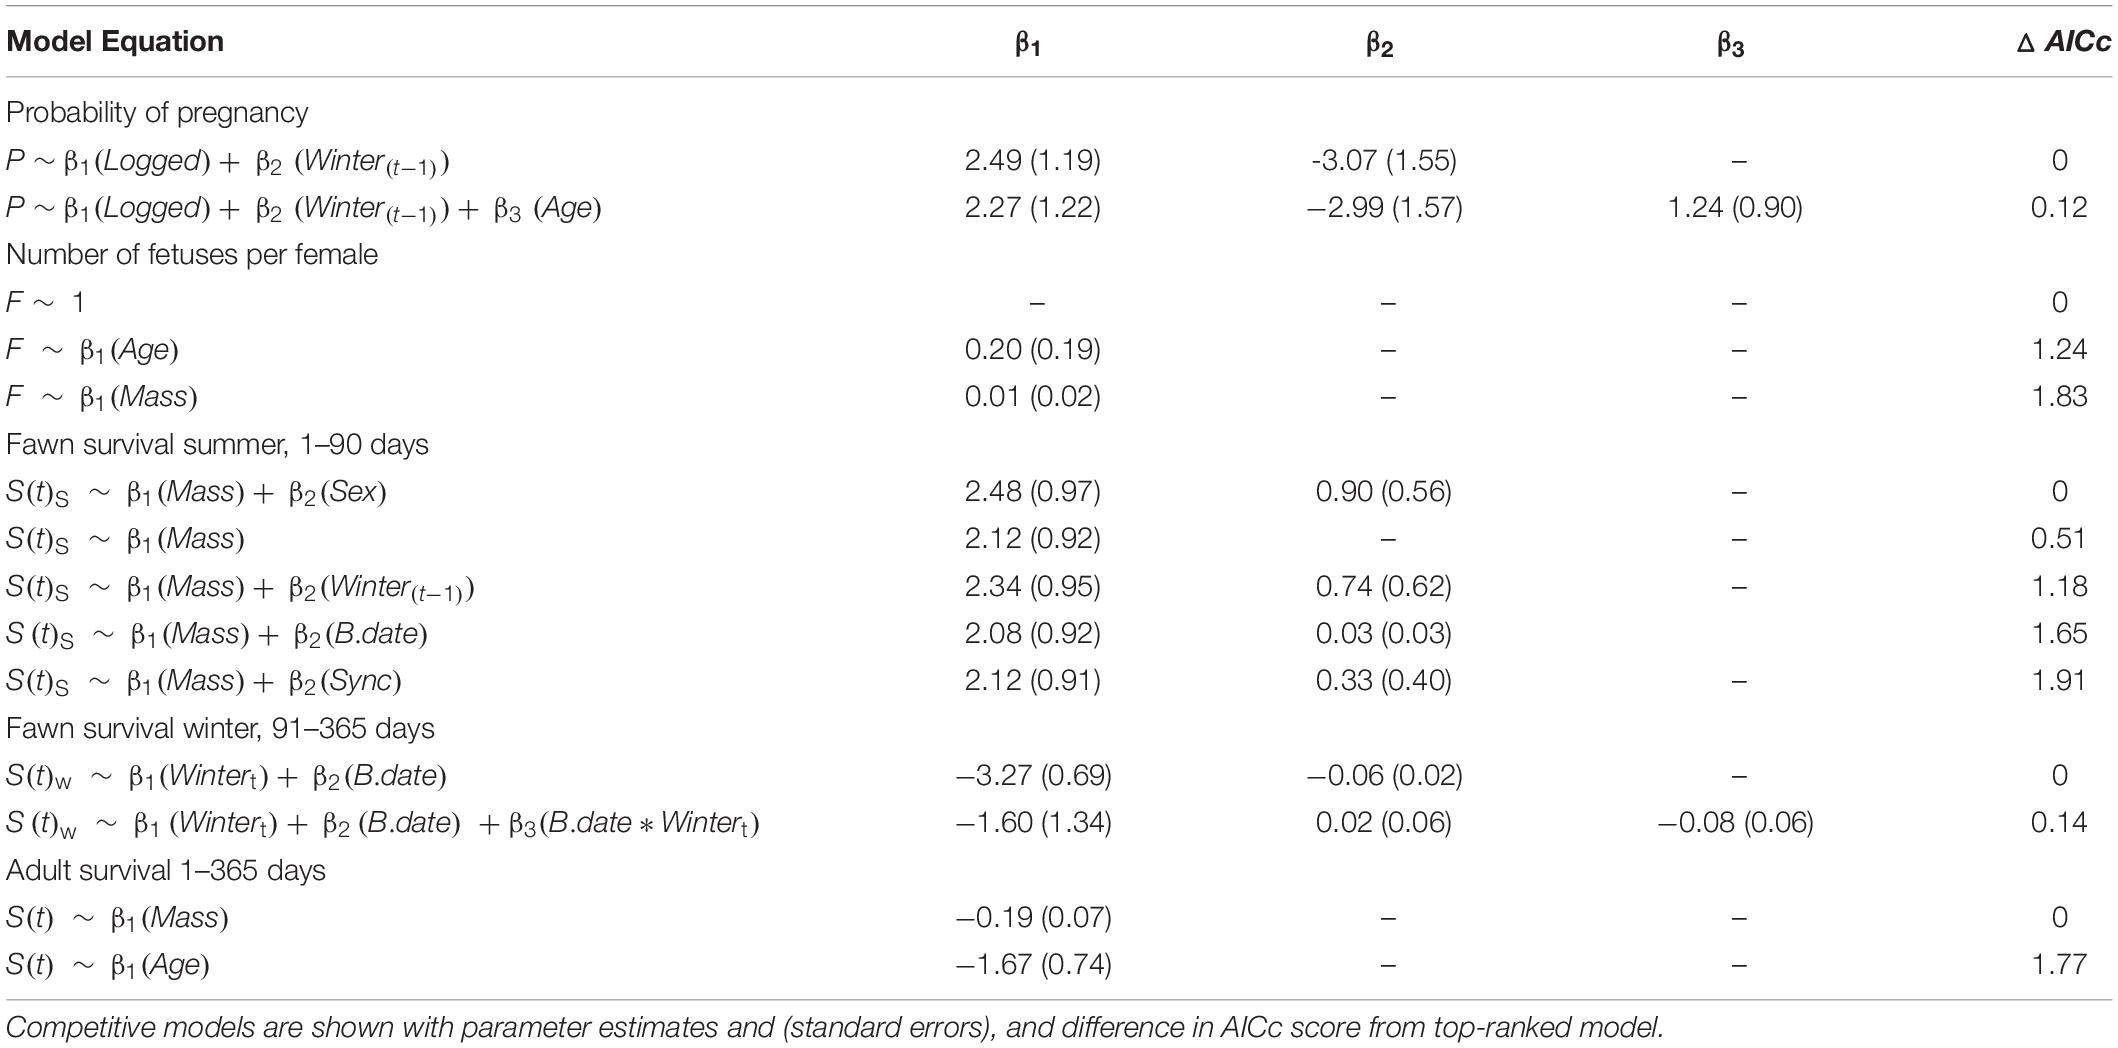
Table 3. Ranked vital rate models within 2 AICc units of the top models of vital rates for Sitka black-tailed deer during the period of the study (2010–2013), Prince of Wales Island, AK, United States.
Adult Survival Rate
As previously discussed, annual adult survival was high and showed little process variance, averaging 0.90 (total variance = 0.005, process variance < 0.001) for the study period, and varying little between years, and was estimated as 0.89 (SE = 0.07) in 2010, 0.85 (SE = 0.08) in 2011), and 0.95 (SE = 0.04) in 2012. The largest source of mortality (n = 3) was from hunting, with an average mortality rate of 0.05 (SE = 0.03), followed by a 0.03 (SE = 0.02) mortality rate from malnutrition (n = 2), and a 0.02 mortality rate form black bear predation (n = 1, SE = 0.02). Wolf mortality was not recorded for any adult deer monitored during this study, despite wolf predation acting as a major source of mortality for deer monitored in the same study area 10 years previously (Person et al., 2009; Alaska Department of Fish and Game, unpublished data). Wolves were at low numbers and restricted distributions during the course of this study due to high harvest pressure (Gilbert et al., 2015; Alaska Department of Fish and Game, 2017).
Fawn Survival Rate
Fawn survival was lowest during the summer, due primarily to predation by black bears, and highly variable between years. Average survival in summer was 0.41 across years (total variance = 0.06, process variance = 0.01), and annual summer survival rates were 0.47 in 2010 (SE = 0.13), 0.23 in 2011 (SE = 0.11), and 0.54 in 2012 (SE = 0.13). Across all years, mortality rates were 0.46 (n = 21, SE = 0.08) due to black bear predation, and 0.11 (n = 6, SE = 0.05) due to other causes. Other causes of mortality included unknown predation (n = 1), eagle predation (n = 1), drowning (n = 1), and premature birth (n = 3). As before, because maternal mass and age were correlated among the fawns sampled (r = 0.56), they were not included in the same models. In addition, synchrony of births was lower in timber harvested watersheds (p = 0.015), although the two variables were only moderately correlated (r = 0.36).
Summer fawn survival, from birth through 90 days of age, was affected by gender and birth mass. In the top-ranked survival model, female fawns had a higher survival probability male fawns, as did fawns that weighed more at birth (Table 3 and Figure 4A). Other competitive models included a positive effect of birth asynchrony on survival, indicating that fawns born more synchronously survived at lower rates, and a positive effect of winter severity in the previous year, indicating that fawns produced following a severe winter survived better. While there were no strongly correlated covariates, there was a statistical relationship between timber harvest of watershed and birth synchrony, with more asynchronous births in timber harvested watersheds (r = 0.34, p = 0.015).
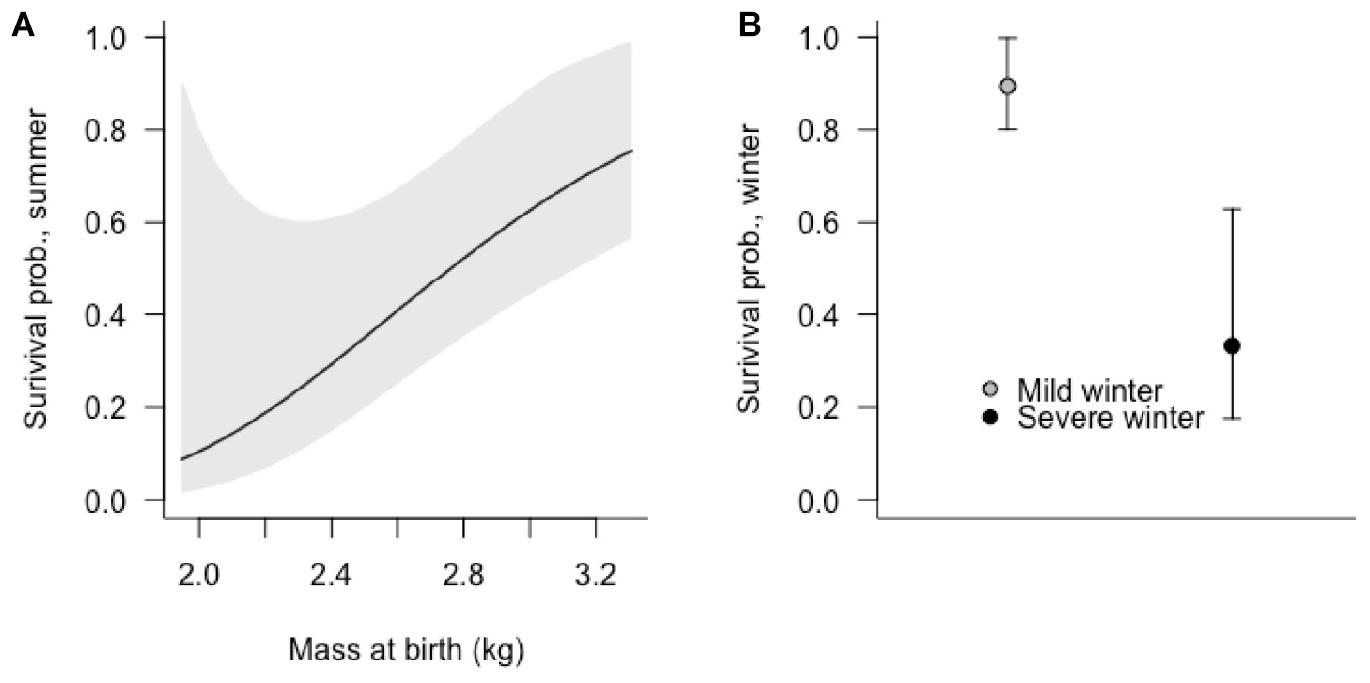
Figure 4. The effects of (A) birth mass of Sitka black-tailed deer fawns on summer survival (0–90 days old), and of (B) occurrence of a severe winter on fawn winter survival (91–365 days old), shown with 95% confidence intervals. The study was conducted 2010–2013, on Prince of Wales Island, AK, United States.
During the winter months, fawn survival was determined primarily by malnutrition-caused mortality, which occurred only during the winter of 2011. Across the three years of the study, the average winter survival rate was 0.73 (total variance = 0.17, process variance = 0.08), due to a mortality rate of 0.21 (n = 16, SE = 0.05) from malnutrition, 0.03 (n = 2, SE = 0.02) from wolf predation, 0.02 (n = 1, SE = 0.02) from bear predation (in late September), and 0.03 (n = 2, SE = 0.02) due to other causes (n = 1 car collision, n = 1 illegal hunting). Among years, winter survival rates were high in 2010 (M = 0.84, SE = 0.07) and 2012 (M = 0.96, SE = 0.04), and quite low in 2011 (M = 0.40, SE = 0.09).
Winter fawn survival, from 91 through 365 days of age, was strongly affected by winter severity and birthdate. The top-ranked model supported negative effects of winter severity and birthdate, indicating that late-born fawns were at greater risk of mortality, as were fawns during high-snowfall winters. In addition, a competing model supported an interactive, negative effect of winter severity and birthdate, indicating lower survival during severe winters and for late-born fawns (Table 3 and Figure 4B).
Effects of Vital Rates on Asymptotic Population Dynamics
Analysis of the baseline population model indicated that the average population growth rate for the study period was distinctly positive, with λ = 1.08, despite the harsh winter of 2011. Annual estimates of deterministic population growth rates were 1.17 in 2010, 0.92 in 2011, and 1.18 in 2012. The most influential vital rate based on deterministic elasticity values (Figure 5 and Supplementary Table 1) was adult female survival, followed by summer and winter fawn survival, survival of yearlings, fertility of adults and yearling, and pregnancy of adults and yearlings. In contrast, when vital rates were perturbed based on process variation, relatively high levels of process variation resulted in winter fawn survival contributing most to variation in inter-annual growth rate, followed closely by summer fawn survival, then by adult and yearling pregnancy rate, with other vital rates contributing much less due to almost no process variation (Figure 5 and Supplementary Table 1).
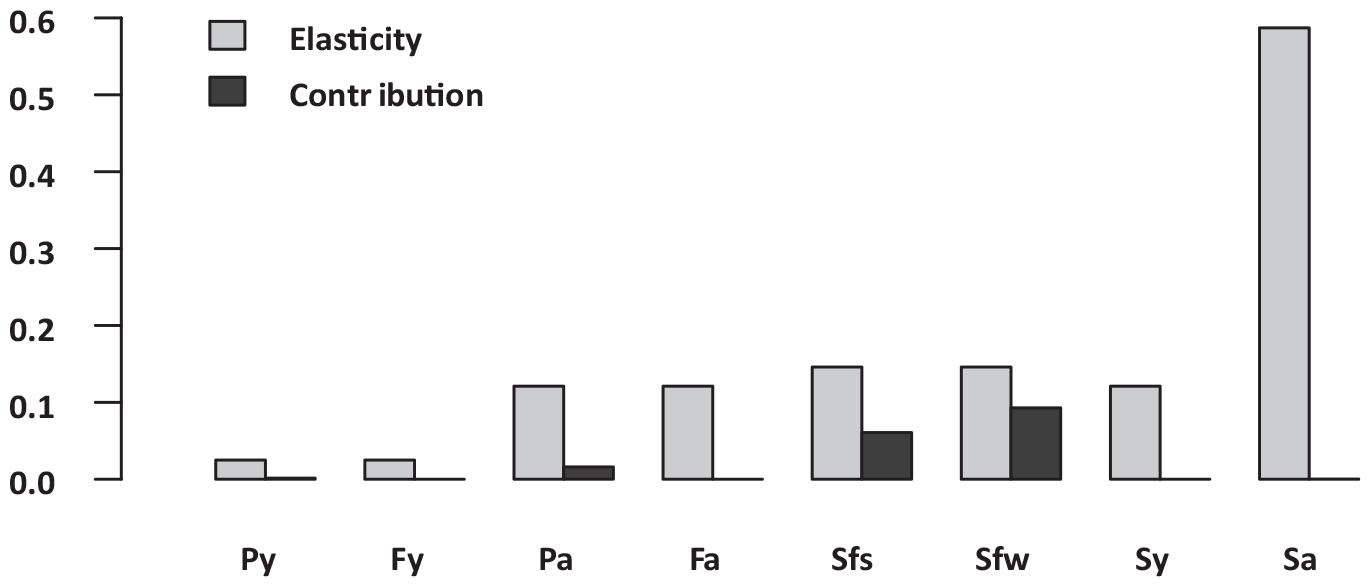
Figure 5. Sitka black-tailed deer vital rate elasticity versus contributions to observed annual variability in asymptotic growth rate, where Py and Fa denotes pregnancy of yearlings and adults, Fy and Fa denoted fertility (females per fawn) of yearling and adults, and Sf(s), Sf(w), Sy, and Sa denote survival of age classes fawn (days 1–90), fawn (days 91–365), yearling, and adults. The study was conducted 2010–2013, on Prince of Wales Island, AK, United States.
Transient Population Dynamics
Transient simulation analysis indicated that initial stage structure can cause differences in realized growth compared to growth predicted from asymptotic analysis (Figure 5). Realized median growth rate was 1.29 (95% CI = 1.13, 1.43) in 2010, 0.92 (95% CI = 0.89, 0.95) in 2011, and 1.12 (95% CI = 1.11, 1.12) in 2012, indicating that the initial uncertainty we included in stage structure attenuated with time. These transient growth rates were different from those predicted by asymptotic dynamics, resulting in reactivity ratios relative to asymptotic dynamics of 1.10 (95% CI = 0.96, 1.22) in 2010, 0.99 (95% CI = 0.97, 1.04) in 2011, and 0.93 (95% CI = 0.93, 0.94) in 2012. This simulation did not include uncertainty in yearly vital rate values, so potential variability of growth rates could be considerably higher. Analysis of population inertia indicated that both maximum attenuation and amplification relative to asymptotic growth rate occurred in the first time-step following perturbation of all annual matrices. For the 2010, 2011, and 2012 annual matrices, maximum attenuation was 1.49, 1.73, and 1.36 respectively, resulting in a realized growth rate of 1.75, 1.58, and 1.62, and with the adult female stage, fawn stage, and fawn stage contributing most to amplification differences. Yearly matrix maximum attenuations for 2010, 2011, and 2012 were 0.34, 0.08, and 0.41 respectively, resulting in realized growth rates of 0.40, 0.07, and 0.49, and with the highest level of contributions coming from fawns for all matrices (Table 4).
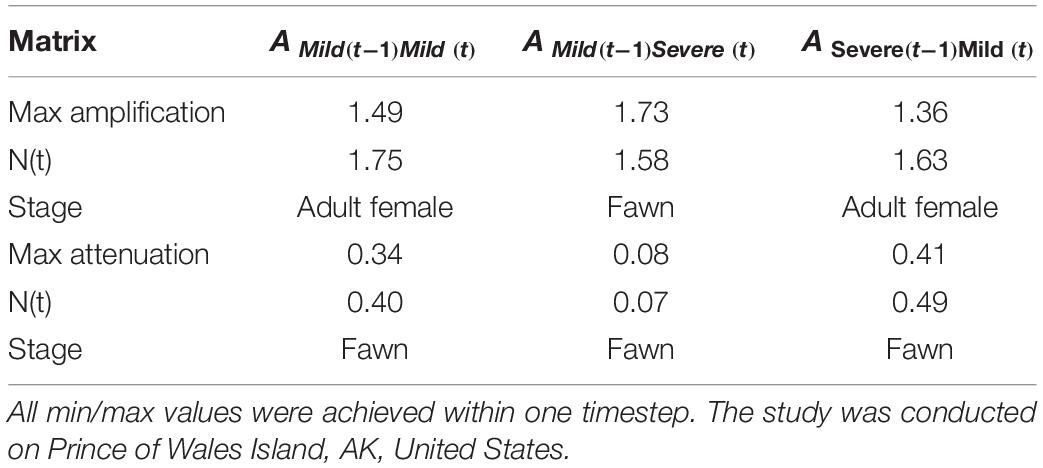
Table 4. Maximum possible amplifications and attenuations of Sitka black-tailed deer population projection matrices observed during this study (2010–2013), along with number achieved at max/min [N(t)], and stage making the greatest contribution.
Discussion
Winter severity emerged as a dominant influence on population dynamics for Sitka black-tailed deer, based on vital rate models and analysis of population dynamics, and resulting from high vulnerability of fawns to mortality in severe winter conditions. While many of our hypotheses regarding the primary influences on deer vital rates and population dynamics followed expectations for a northern ungulate, there were also some intriguing and unexpected outcomes from our analyses. For adult females, probability of pregnancy and fetal rate were higher for older females, as predicted, while adult female mass positively affected fetal rate. These results agree with life-history theory, in which older and larger females of long-lived species typically produce more offspring at more frequent intervals (Hamel et al., 2009; Lindberg et al., 2013). While reproductive senescence is thought to occur in Sitka black-tailed deer (Johnson, 1987), our study was not longitudinal across the lifetime of a deer, so the importance of senescence was not possible to determine. Interestingly, there was a mild positive effect of the binary timber harvest variable on probability of pregnancy; in addition, synchrony of births was negatively affected by timber harvest, indicating that some feature of these altered watersheds affected deer conception probability and timing and suggesting the need for further inquiry. Based on our univariate analysis of covariates of adult survival, female mass negatively affected survival of adult females, likely because hunters selected for larger individuals. Hunting was the primary cause of death for adult females in our study, and larger animals are typically preferred by hunters (Milner et al., 2007; Brinkman et al., 2009). Thus, large body mass could decrease adult female risk from natural causes (as has been documented in many other systems) but increase risk from human hunting.
Summer fawn survival was the lowest survival rate, with more than half of all fawns dying before 3 months of age on average (Table 2), primarily from black bear predation. Summer fawn mortality risk was negatively affected by birth mass and fawn gender, with larger fawns and female fawns surviving with higher probability. Behavioral differences between male and female fawns have been observed, with male fawns engaging in more conspicuous behaviors (i.e., active more of the time; Jackson et al., 1972), likely increasing detection probability by bears. In addition, synchrony of birth decreased summer survival, possibly because bears actively search for fawns only during the peak of births. Surprisingly, the severity of the previous winter positively affected summer fawn survival, possibly because low-quality adult females were selectively removed from the population, along with their unborn offspring, or lost fetuses prematurely and did not give birth at all (as evidenced by the low pregnancy rate in 2012). Bear predation risk appears to be linked to nutrition of fawns, given the strong effect of fawn mass at birth on summer survival, and thus is likely partially compensatory. Yet other expected nutritional effects were not supported; maternal spring body fat did not predict subsequent fawn survival, suggesting that perhaps females conserve body fat at the expense of fawn mass at birth (i.e., the “selfish cow” hypothesis, Clutton-Brock et al., 1989; Therrien et al., 2008; Parker et al., 2009).
In contrast, overwinter fawn mortality varied greatly from year to year, and was almost entirely driven by malnutrition in the single harsh winter, with very high fawn survival during the other years, beyond our expectations. Late-born fawns, which enter winter at smaller sizes and with fewer body reserves, were at greater risk of malnutrition during the harsh winter but not during other winters. Intriguingly, we recorded no effect of birth mass, demonstrating that fawns were likely able to recover from early deficits in body mass. While there was no support for an effect of timber harvest regime of watershed on winter survival, the connection between timber harvest and birth asynchrony indicates that timber harvest can affect birth timing, and merits further investigation given the importance of birthdate for surviving harsh winters.
While timber harvest did have a negative effect on fawn and adult female survival based on coefficient values in models in which it occurred, the standard errors of the term were high, leading to the exclusion of the term from final models. Timber harvest regime of watersheds is a very coarse variable, homogenizing variation in seral stage and corresponding nutrition within deer home ranges. In addition, deer select habitat from within the home range (Johnson, 1980), and may be able to increase access to nutrition through selection (Parker, 2003). Age and configuration of harvested stands, and quality and size of remaining old-growth forest patches, interactively drive deer selection in this study area in winter (Gilbert et al., 2017), and are likely important in determining winter survival. For example, Brinkman et al. (2011) found that deer density declined by 30% after 3 successive severe winters, using a study area overlapping ours and with largest declines in timber-harvested watersheds. A detailed analysis of winter habitat selection that included stand-level variation in seral stage, biomass, and snow depth was conducted in 2017 (Gilbert et al., 2017), and efforts to better characterize timber-harvested habitat and its effects on deer are ongoing (Shanley et al., in review; Gilbert et al., 2015), but linking habitat selection or use to fitness outcomes and population dynamics is an important next step.
Major limitations of this study are its relatively short duration compared to the lifetime of a deer, the correspondingly small number of winters observed, the lack of knowledge regarding population structure or density, and the lack of detailed information available regarding timber harvest for the different age classes sampled. The negative effects of winter we document here are the result of only 3 years of study, which were by no means as extreme as previously documented severe winters (Brinkman et al., 2011). In such very severe winters, adult female survival can be greatly reduced (Alaska Department of Fish and Game, 2013), whereas we documented only 2 deaths from malnutrition during the severe winter in our study, with no statistical effect on adult female survival. For example, Brinkman et al. (2011) documented a 30% decline in deer density over 3 years, equivalent to a mean annual growth rate of 0.89, lower than our lowest calculated annual growth rate of 0.92. In addition, winter severity could interact with deer density relative to carrying capacity to influence survival and growth rate response (Bowyer et al., 2014), which we were not able to measure during the course of this study. Therefore, it is likely that the effects of severe winters on population growth can be much greater than documented here, due to reduced adult female survival, a highly influential vital rate in the population, and also dependent on stage structure entering the winter, as indicated by a minimum possible transient growth rate from our harsh winter matrix of 0.07 (i.e., drastic population decline). Likewise, a larger wolf population, typical during years prior to our study, likely would reduce winter survival of fawns and adults, particularly during severe winters, but we were unable to document such winter-predation interactions due to a greatly reduced wolf population size during our study (Person et al., 2009; Gilbert et al., 2015; Alaska Department of Fish and Game, 2017). Wolf abundance also may affect the influence of habitat covariates on vital rates if deer alter behavior and select lower-nutrition habitats to avoid risk of predation at higher wolf densities (Chamaillé-Jammes et al., 2014). In addition, while timber harvest is the dominant disturbance mechanism in the temperate rainforest ecosystem of our study area, which has been disproportionately harvested compared to other parts of the region (Albert and Schoen, 2013), our sampling methods did not allow us to conduct detailed analysis of habitat use for all deer included in the study (e.g., fawns sampled opportunistically did not have GPS-collared mothers to provide spatial locations). As a result, we were only able to include timber harvest as a binary, watershed-level predictive variable in our models, which undoubtedly greatly reduces our ability to make inference about how this important source of disturbance affects deer.
Both asymptotic and transient analysis of growth yielded broadly similar pictures of depressed growth during harsh winters (Figure 6), but with differences in stage structure contributing to considerable divergence in transient versus predicted asymptotic growth. While adult female survival is highly influential in determining inter-annual differences in asymptotic population growth in theory, it is neither highly variable nor highly responsive to environmental influences in our system, nor does it contribute substantially to variability in population growth rate. This conforms to other studies of ungulate population dynamics (Gaillard et al., 1998, 2000). In contrast, juvenile survival is strongly influenced by environmental and individual covariates, primarily by mass at birth and thus presumably nutrition during summer and early fall, and winter severity during the winter. Thus, variation in environmental covariates can influence population growth rate most strongly through changes in fawn survival rather than adult survival. It is important to note, however, that when an extreme event (i.e., very deep, persistent snow in winter) does reduce adult survival, the same event is likely to reduce juvenile survival and pregnancy rates much more, resulting in a compounded negative impact to the transient population growth rate via a change in stage structure and a change in vital rates (Coulson et al., 2005; Figure 5).
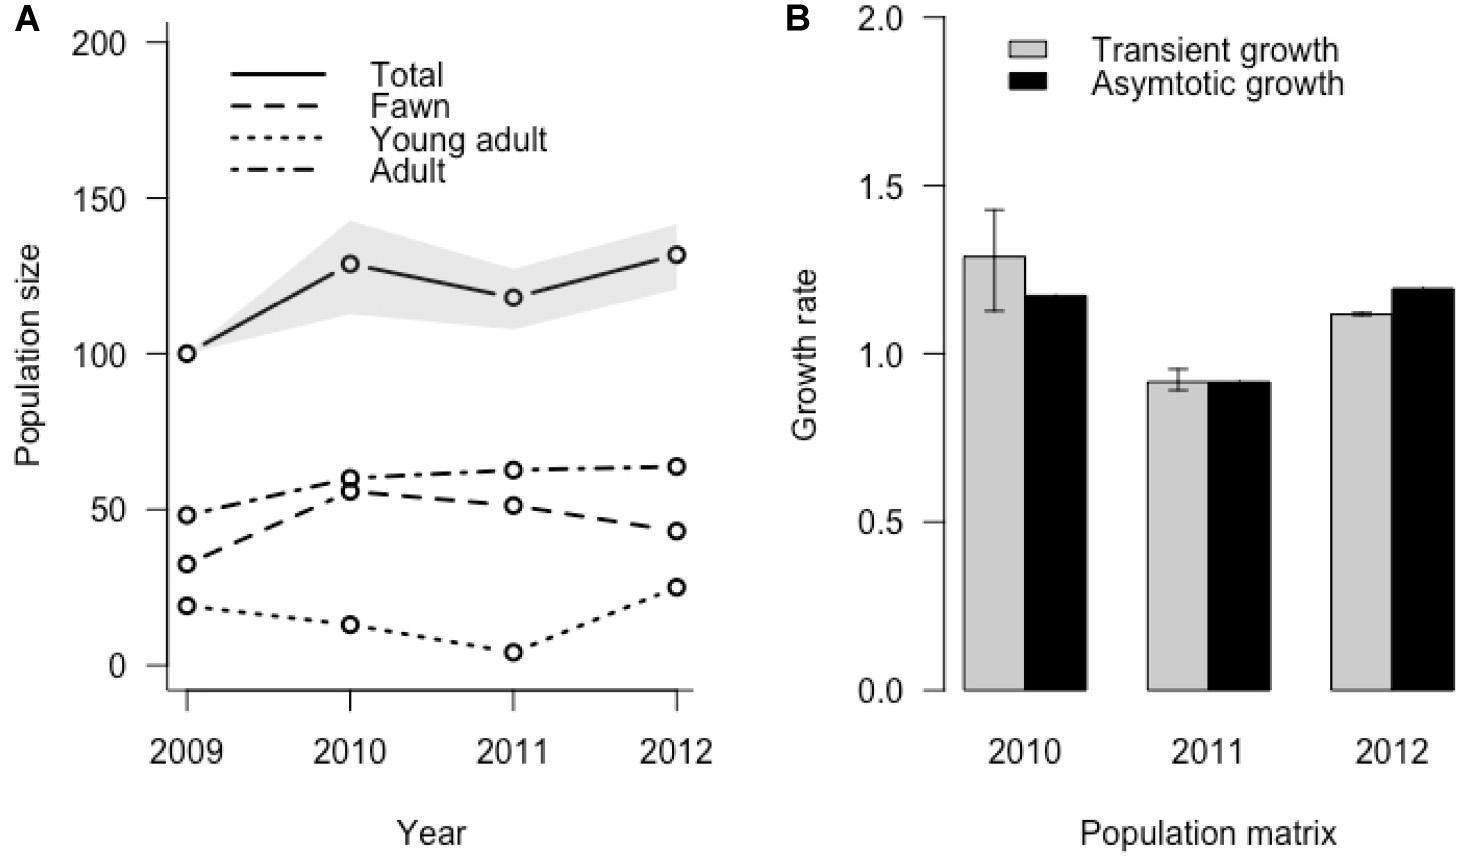
Figure 6. Realized population change for the Sitka black-tailed deer population, incorporating simulated uncertainty in initial stage distribution in 2009 and based on a starting size of 100 individuals; (A) shows population size in total and in each stage, and (B) shows transient versus asymotic growth rate produced by each year’s projection matrix, during the years of the study (2010–2013) on Prince of Wales Island, AK, United States.
We were unable to fully investigate the demographic impact of extreme weather events in this study, because such an extreme event did not occur during the three years of this work. Given projections for increased stochasticity and severity of weather under future climate change scenarios, such compounding, multi-vital-rate effects of stochastic weather should prove highly influential for ungulate populations. In this ecosystem, average winter snowfall is projected to decrease, while severity of stochastically occurring major storms may increase (Shanley et al., 2015), potentially leading to greater swings in deer population size as series of mild winters lead to high population densities, which then experience density-dependent negative impacts of occasional severe winters. Although survival of adult female ungulates is evolutionarily canalized against environmental variation (Gaillard and Yoccoz, 2003), extreme events can overwhelm the resilience of this key vital rate (Brinkman et al., 2011), causing large demographic impacts through joint reductions of adult and juvenile survival. Understanding and predicting the effects of increased frequency of extreme events, and the interactive role that other environmental influences such an anthropogenic habitat change could play in determining population response, is therefore an emerging challenge for population ecology and management.
Data Availability Statement
The datasets generated for this study are available on request to the corresponding author.
Ethics Statement
The animal study was reviewed and approved by Institutional Animal Care and Use Committee University of Alaska Fairbanks.
Author Contributions
All authors carried out the study design. SG and DP carried out the data collection. SG carried out the data analysis with planning and feedback from all other authors. SG wrote the manuscript with editing by all other authors.
Funding
This work was funded primarily by a grant from the Alaska Department of Fish and Game. Additional support came from the National Science Foundation, in the form of an NSF GK-12 graduate fellowship. Publication of this article was funded in part by the University of Idaho – Open Access Publishing Fund, and in part by the Institute of Arctic Biology Director’s Fund at the University of Alaska Fairbanks.
Conflict of Interest
The authors declare that the research was conducted in the absence of any commercial or financial relationships that could be construed as a potential conflict of interest.
Acknowledgments
We thank the Alaska Department of Fish and Game, the U.S. Forest Service, and the National Science Foundation’s GK-12 Fellowship program for support of this work. In addition, we thank Jim Baichtal, Ray Slayton, Kris Larsen, Doug Larsen, Rod Flynn, Casey Pozzanghera, Kathleen Miles, Tess Ruswick, and Moira Hughes for their invaluable assistance with field data collection. This manuscript was originally a chapter in the dissertation of SG, but has not been published in peer-reviewed form elsewhere, and is accessible online (Gilbert, 2015).
Supplementary Material
The Supplementary Material for this article can be found online at: https://www.frontiersin.org/articles/10.3389/fevo.2020.531027/full#supplementary-material
References
Alaback, P. B. (1982). Dynamics of understory biomass in Sitka spruce-western hemlock forests of southeast Alaska. Ecology 63, 1932–1948. doi: 10.2307/1940131
Alaback, P. G., and Saunders, S. (2013). “Disturbance ecology of the temperate rainforests of Southeast Alaska and adjacent British Columbia,” in North Temperate Rainforests: Ecology and Conservation, eds J. W. Shoen and G. Orians (Seattle, WA: University of Washington Press), 73–88.
Alaska Department of Fish and Game (2013). Operational Plan for Intensive Management of Sitka Black-Tailed Deer in a Portion of Game Management Unit 3. Juneau, AK: Alaska Department of Fish and Game.
Alaska Department of Fish and Game (2017). GMU 2 Wolf Population Update, Autumnt 2016. Juneau, AK: Alaska Department of Fish and Game.
Albert, D. M., and Schoen, J. W. (2013). Use of historical logging patterns to identify disproportionately logged ecosystems within temperate rainforests of southeastern Alaska. Conserv. Biol. 27, 774–784. doi: 10.1111/cobi.12109
Arnold, T. W. (2010). Uninformative parameters and model selection using Akaike’s information criterion. J. Wildl. Manage. 74, 1175–1178. doi: 10.1111/j.1937-2817.2010.tb01236.x
Blums, P., Nichols, J. D., Hines, J. E., Lindberg, M. S., and Mednis, A. (2005). Individual quality, survival variation and patterns of phenotypic selection on body condition and timing of nesting in birds. Oecologia 143, 365–376. doi: 10.1007/s00442-004-1794-x
Bowyer, R. T., Bleich, V. C., Stewart, K. M., Whiting, J. C., and Monteith, K. L. (2014). Density dependence in ungulates: a review of causes, and concepts with some clarifications. J. Wildl. Manage. 100, 550–572.
Boyce, M. S., Baxter, P. W. J., and Possingham, H. P. (2012). Managing moose harvests by the seat of your pants. Theor. Popul. Biol. 82, 340–347. doi: 10.1016/j.tpb.2012.03.002
Brinkman, T. J., Chapin, T., Kofinas, G., and Person, D. K. (2009). Linking hunter knowledge with forest change to understand changing deer harvest opportunities in intensively logged landscapes. Ecol. Soc. 14:36. Available online at: http://www.ecologyandsociety.org/vol14/iss1/art36/
Brinkman, T. J., Person, D. K., Chapin, F. S. III, Smith, W., and Hundertmark, K. J. (2011). Estimating abundance of Sitka black-tailed deer using DNA from fecal pellets. J. Wildl. Manage. 75, 232–242. doi: 10.1002/jwmg.22
Burnham, K. P., and Anderson, D. R. (2002). Model Selection and Multimodel Inference: a Practical Information-Theoretic Approach, 2nd Edn. New York, NY: Springer.
Carstensen, M., Delgiudice, G. D., and Sampson, B. A. (2003). Using doe behavior and vaginal-implant transmitters to capture neonate white-tailed deer in north-central Minnesota. Wildl. Soc. Bull. 31, 634–641.
Caswell, H. (2001). Matrix Population Models: Construction, Analysis, and Interpretation, 2nd Edn. Sunderland, MA: Sinauer Associates, Inc.
Caswell, H. (2007). Sensitivity analysis of transient population dynamics. Ecol. Lett. 10, 1–15. doi: 10.1111/j.1461-0248.2006.01001.x
Caswell, H. (2010). Life table response experiment analysis of the stochastic growth rate. J. Ecol. 98, 324–333. doi: 10.1111/j.1365-2745.2009.01627.x
Chamaillé-Jammes, S., Malcuit, H., Le Saout, S., and Martin, J. L. (2014). Innate threat-sensitive foraging: black-tailed deer remain more fearful of wolf than of the less dangerous black bear even after 100 years of wolf absence. Oecologia 174, 1151–1158. doi: 10.1007/s00442-013-2843-0
Clutton-Brock, T. H., Albon, S. D., and Guinness, F. E. (1989). Fitness costs of gestation and lactation in wild mammals. Nature 337, 260–262. doi: 10.1038/337260a0
Cook, R. C., Cook, J. G., Stephenson, T. R., Myers, W. L., Mccorquodale, S. M., Vales, D. J., et al. (2010). Revisions of rump fat and body scoring indices for deer, elk, and moose. J. Wildl. Manage. 74, 880–896. doi: 10.2193/2009-031
Coulson, T., Gaillard, J. M., and Festa-Bianchet, M. (2005). Decomposing the variation in population growth into contributions from multiple demographic rates. J. Anim. Ecol. 74, 789–801. doi: 10.1111/j.1365-2656.2005.00975.x
Delgiudice, G. D., Fieberg, J., Riggs, M. R., Carstensen Powell, M., and Pan, W. (2006). A long-term age-specific survival analysis of female white-tailed deer. J. Wildl. Manage. 70, 1556–1568. doi: 10.2193/0022-541X(2006)70[1556:ALASAO]2.0.CO;2
Delgiudice, G. D., Lenarz, M. S., and Carstensen Powell, M. (2007). Age-specific fertility and fecundity of northern free-ranging white-tailed deer: evidence for reproductive senescence? J. Mammal. 88, 427–435. doi: 10.1644/06-MAMM-A-164R.1
Doerr, J. G., Degayer, E. J., and Ith, G. (2005). Winter habitat selection by Sitka black-tailed deer. J. Wildl. Manage. 69, 322–331. doi: 10.2193/0022-541X(2005)069<0322:WHSBSB>2.0.CO;2
Ezard, T. H. G., Bullock, J. M., Dalgleish, H. J., Millon, A., Pelletier, F., Ozgul, A., et al. (2010). Matrix models for a changeable world: the importance of transient dynamics in population management. J. Appl. Ecol. 47, 515–523. doi: 10.1111/j.1365-2664.2010.01801.x
Farmer, C. J., and Kirchhoff, M. D. (2007). Ecological classification of deer habitat in the Tongass National Forest, Alaska. Northwest. Nat. 88, 73–84. doi: 10.1898/1051-1733(2007)88[73:ECODHI]2.0.CO;2
Farmer, C. J., Person, D. K., and Bowyer, R. T. (2006). Risk factors and mortality of black-tailed deer in a managed forest landscape. J. Wildl. Manage. 70, 1403–1415. doi: 10.2193/0022-541X(2006)70[1403:RFAMOB]2.0.CO;2
Fryxell, J. M., Hussell, D. J. T., Lambert, A. B., and Smith, P. C. (1991). Time lags and population fluctuations in white-tailed deer. J. Wildl. Manage. 55, 377–385. doi: 10.2307/3808963
Gaillard, J. M., Festa-Bianchet, M., and Yoccoz, N. G. (1998). Population dynamics of large herbivores: variable recruitment with constant adult survival. Trends Ecol. Evol. 13, 58–63. doi: 10.1016/S0169-5347(97)01237-8
Gaillard, J.-M., Festa-Bianchet, N. G., Yoccoz, N. G., Loison, A., and Toïgo, C. (2000). Temporal variation in fitness components and population dynamics of large herbivores. Annu. Rev. Ecol. Syst. 31, 367–393. doi: 10.1146/annurev.ecolsys.31.1.367
Gaillard, J.-M., and Yoccoz, N. G. (2003). Temporal variation in survival of mammals: a case of environmental canalization? Ecology 84, 3294–3306. doi: 10.1890/02-0409
Gamelon, M., Gimenez, O., Baubet, E., Coulson, T., Tuljapurkar, S., and Gaillard, J. (2014). Influence of life-history tactics on transient dynamics: a comparative analysis across mammalian populations. Am. Nat. 184, 673–683. doi: 10.1086/677929
Gilbert, S. L. (2015). Environmental Drivers of Deer Population Dynamics and Spatial Selection in Southeast Alaska. Available online at: http://hdl.handle.net/11122/6088 (accessed August 2015).
Gilbert, S. L., Haynes, T., Lindberg, M. S., Albert, D. M., and Kissling, M. (2015). Future Population Trends and Drivers of change for Alexander Archipelago Wolves on and Near Prince of Wales Island, Alaska. Final Report for Cooperative Agreement No. F15AC000206. Anchorage, AK: Alaska Department of Fish and Game. doi: 10.7287/peerj.preprints.1934
Gilbert, S. L., Hundertmark, K. J., Person, D. K., Lindberg, M. S., and Boyce, M. S. (2017). Behavioral plasticity in a variable environment?: snow depth and habitat interactions drive deer movement in winter. J. Wildl. Manage. 98, 246–259. doi: 10.1093/jmammal/gyw167
Gilbert, S. L., Lindberg, M. S., Hundertmark, K. J., and Person, D. K. (2014). Dead before detection: addressing the effects of left truncation on survival estimation and ecological inference for neonates. Methods Ecol. Evol. 5, 992–1001. doi: 10.5061/dryad.p1r40
Grant, A., and Benton, T. G. (2000). Elasticity analysis for density-dependent populations in stochastic environments. Ecology 81, 680–693. doi: 10.1890/0012-9658(2000)081[0680:EAFDDP]2.0.CO;2
Grovenburg, T., Monteith, K., Jaques, C., Klaver, R., DePerno, C., Brinkman, T., et al. (2014). Re-evaluating neonatal age models for ungulates: does model choice affect survival estimates? PLoS One 9:e108797. doi: 10.1371/journal.pone.0108797
Hamel, S., Garel, M., Festa-Bianchet, M., Gaillard, J. M., and Côté, S. D. (2009). Spring normalized difference vegetation index (NDVI) predicts annual variation in timing of peak faecal crude protein in mountain ungulates. J. Appl. Ecol. 46, 582–589. doi: 10.1111/j.1365-2664.2009.01643.x
Hamlin, K. L., Pac, D. F., Sime, C. A., DeSimone, R. M., and Dusek, G. L. (2000). Evaluating the accuracy of ages obtained by two methods for Montana ungulates. J. Wildl. Manage. 64, 441–449. doi: 10.2307/3803242
Hanley, T. A. (2005). Potential management of young-growth stands for understory vegetation and wildlife habitat in southeastern Alaska. Landsc. Urban Plan. 72, 95–112. doi: 10.1016/j.landurbplan.2004.09.015
Haskell, S. P., Ballard, W. B., Butler, D. A., Tatman, N. M., Wallace, M. C., Kochanny, C. O., et al. (2007). Observations on capturing and aging deer fawns. J. Mammal. 88, 1482–1487. doi: 10.1644/07-MAMM-A-004R.1
Hilderbrand, G. V., Farley, S. D., Schwartz, C. C., Charles, T., and Robbins, C. T. (2004). Importance of salmon to wildlife: implications for integrated management. BioOne 15, 1–9. doi: 10.2192/1537-6176(2004)015<0001:IOSTWI>2.0.CO;2
Hunter, C. M., Caswell, H., Runge, M. C., Regehr, E. V., Armstrup, S., and Stirling, I. (2010). Climate change threatens polar bear populations: a stochastic demographic analysis. Ecology 91, 2883–2897. doi: 10.1890/09-1641.1
Hurley, M. A., Unsworth, J. W., Zager, P., Hebblewhite, M., Garton, E. O., Montgomery, D. M., et al. (2011). Demographic response of mule deer to experimental reduction of coyotes and mountain lions in Southeastern Idaho. Wildl. Monogr. 178, 1–33. doi: 10.1002/wmon.4
Jackson, R. M., White, M., and Knowlton, F. F. (1972). Activity patterns of young white-tailed deer fawns in South texas. Ecology 53, 262–270. doi: 10.2307/1934080
Johnson, D. H. (1980). The comparison of usage and availability measurements for evaluating resource preference. Ecology 61, 65–71. doi: 10.2307/1937156
Johnson, D. S., Barry, R. P., and Bowyer, R. T. (2004). Estimating timing of life-history events with coarse data. J. Mammal. 85, 932–939. doi: 10.1644/BFW-009
Johnson, L. J. (1987). Reproductive Potential of Sitka Black-Tailed Deer in Southeast Alaska. Juneau, AK: Alaska Department of Fish and Game.
Johnstone-Yellin, T. L., Shipley, L. A., Myers, W. L., and Robinson, H. S. (2009). To twin or not to twin? Trade-offs in litter size and fawn survival in mule deer. J. Mammal. 90, 453–460. doi: 10.1644/08-MAMM-A-030.1
Klein, D. R., and Olson, S. T. (1960). Natural mortality patterns of deer in Southeast Alaska. J. Wildl. Manage. 24, 80–88. doi: 10.2307/3797359
Koons, D. N., Grand, J. B., Zinner, B., and Rockwell, R. F. (2005). Transient population dynamics: relations to life history and initial population state. Ecol. Modell. 185, 283–297. doi: 10.1016/j.ecolmodel.2004.12.011
Koons, D. N., Holmes, R. R., and Grand, J. B. (2007). Population inertia and sensitivity to changes in vital rates and population structure. Ecology 88, 2857–2867. doi: 10.1890/06-1801.1
Koons, D. N., Rockwell, R. F., and Grand, J. B. (2006). Population momentum: implications for wildlife management. J. Wildl. Manage. 70, 19–26. doi: 10.2193/0022-541X(2006)70[19:PMIFWM]2.0.CO;2
Laake, J. L. (2013). RMark: an R Interface for Analysis of Capture-Recapture Data with MARK. Silver Spring, MD: National Marine Fisheries Service, 1–25.
Langvatn, R., Mysterud, A., Stenseth, N. C., and Yoccoz, N. G. (2004). Timing and synchrony of ovulation in red deer constrained by short northern summers. Am. Nat. 163, 763–772. doi: 10.1086/383594
Lindberg, M. S., Sedinger, J. S., and Lebreton, J.-D. (2013). Individual heterogeneity in black brant survival and recruitment with implications for harvest dynamics. Ecol. Evol. 3, 4045–4056. doi: 10.1002/ece3.767
Loison, A., Langvatn, R., and Solberg, E. J. (1999). Body mass and winter mortality in red deer calves: disentangling sex and climate effects. Ecography 22, 20–30. doi: 10.1111/j.1600-0587.1999.tb00451.x
Lomas, L. A., and Bender, L. C. (2007). Survival and cause-specific mortality of neonatal mule deer fawns, north-central New Mexico. J. Wildl. Manage. 71, 884–894. doi: 10.2193/2006-203
Maldonado-Chaparro, A., Blumstein, D. T., Armitage, K., and Childs, D. Z. (2018). Transient LTRE analysis reveals the demographic and trait- mediated processes that buffer population growth. Ecol. Lett. 21, 1693–1703. doi: 10.1111/ele.13148
Milner, J. M., Nilsen, E. B., and Andreassen, H. P. (2007). Demographic side effects of selective hunting in ungulates and carnivores. Conserv. Biol. 21, 36–47. doi: 10.1111/j.1523-1739.2006.00591.x
Monteith, K. L., Bleich, V. C., Stephenson, T. R., Pierce, B. M., Conner, M. M., Kie, J. G., et al. (2013). Life-history characteristics of mule deer: effects of nutrition in a variable environment. Wildl. Monogr. 186, 1–62. doi: 10.1002/wmon.1011
Morris, B., and Doak, D. (2002). Quantitative Conservation Biology. Sunderland, MA: Sinauer Associates, Inc.
Mueller, C. C., and Sadleier, R. M. F. S. (1979). Age at first conception in black-tailed deer. Biol. Reprod. 21, 1099–1104. doi: 10.1095/biolreprod21.5.1099
Parker, K. L. (1987). Body-surface measurements of mule deer and elk. J. Wildl. Manage. 51, 630–633. doi: 10.2307/3801281
Parker, K. L. (2003). Advances in the nutritional ecology of cervids at different scales. Ecoscience 10, 395–411. doi: 10.1080/11956860.2003.11682788
Parker, K. L., Barboza, P. S., and Gillingham, M. P. (2009). Nutrition integrates environmental responses of ungulates. Funct. Ecol. 23, 57–69. doi: 10.1111/j.1365-2435.2008.01528.x
Person, D. K., Farmer, C., O’Connor, P., and Doerr, J. (2009). Habitat use and Survivorship of Sitka Black-Tailed Deer in Southeast Alaska: a Regional Meta-Analysis and Synthesis. Juneau, AK: Alaska Department of Fish and Game.
Pollock, K. H., Winterstein, S. R., Bunck, C. M., Curtis, P. D., The, S., Management, W., et al. (1989). Survival analysis in telemetry studies: the staggered entry design. J. Wildl. Manage. 53, 7–15. doi: 10.2307/3801296
R Core Development Team (2019). R.: a Language and Environment for Statistical Computing. Available online at: http://www.r-project.org (accessed August 1, 2019).
Robinette, W. L., Gashwiler, J. S., Low, J. B., and Jones, D. A. (1957). Differential mortality by sex and age among mule deer. J. Wildl. Manage. 21, 1–16. doi: 10.2307/3797671
Sams, M. G., Lochmiller, R. L., Hellgren, E. C., Warde, W. D., Varner, L. W., and Warde, D. (1996). Morphometric predictors of neonatal age for white-tailed deer. Wildl. Soc. Bull. 24, 53–57.
Schaub, M., and Abadi, F. (2011). Integrated population models?: a novel analysis framework for deeper insights into population dynamics. J. Ornithol. 152, 227–237. doi: 10.1007/s10336-010-0632-7
Schoen, J. W., and Kirchhoff, M. D. (1985). Seasonal distribution and home-range patterns of Sitka black-tailed deer on Admiralty Island, Southeast Alaska. J. Wildl. Manage. 49, 96–103. doi: 10.2307/3801852
Shanley, C. S., Pyare, S., Goldstein, M. I., Alaback, P. B., Albert, D. M., Beier, C. M., et al. (2015). Climate change implications in the northern coastal temperate rainforest of North America. Clim. Change 130, 155–170. doi: 10.1007/s10584-015-1355-9
Sinclair, A. R. E., Mduma, S. A. R., and Arcese, P. (2000). What determines phenology and synchrony of ungulate breeding in Serengeti? Ecology 81, 2100–2111. doi: 10.1890/0012-9658(2000)081[2100:WDPASO]2.0.CO;2
Stott, I., Hodgson, D. J., and Townley, S. (2012). Popdemo: an R package for population demography using projection matrix analysis. Methods Ecol. Evol. 3, 797–802. doi: 10.1111/j.2041-210X.2012.00222.x
Stubben, C., Miligan, B., and Nantel, P. (2012). Popbio: Construction and Analysis of Matrix Population Models. Available online at: https://CRAN.R-project.org/package=popbio (accessed August 1, 2019)
Therrien, J.-F., Cote, S. D., Festa-Bianchet, M., and Ouellet, J.-P. (2008). Maternal care in white-tailed deer: trade-off between maintenance and reproduction under food restriction. Anim. Behav. 75, 235–243. doi: 10.1016/j.anbehav.2007.04.030
Tollefson, T. N., Shipley, L. A., Myers, W. L., Keisler, D. H., and Dasgupta, N. (2010). Influence of summer and autumn nutrition on body condition and reproduction of lactating mule deer. J. Wildl. Manage. 74, 974–986. doi: 10.2193/2008-529
Tsai, K., Pollock, K. H., and Brownie, C. (1999). Effects of violation of assumptions for survival analysis methods in radiotelemetry studies. J. Wildl. Manage. 63, 1369–1375. doi: 10.2307/3802856
U.S. Forest Service (2008). Tongass Land and Resource Management Plan. R10-MB-338dd. Juneau, AK: Alaska Department of Fish and Game.
Van Vuren, D. H., Bray, M. P., and Heltzel, J. M. (2013). Differential investment in twin offspring by female pronghorns (Antilocapra americana). J. Mammal. 94, 155–161. doi: 10.1644/12-MAMM-A-107.1
Verme, L. J. (1977). Assessment of natal mortality in upper Michigan deer. J. Wildl. Manage. 41, 700–708. doi: 10.2307/3799992
Vittinghoff, E., and McCulloch, C. E. (2006). Relaxing the rule of ten events per variable in logistic and Cox regression. Am. J. Epidemiol. 165, 710–718. doi: 10.1093/aje/kwk052
White, G. C. (2000). “Population viability analysis: data requirements and essential analyses,” in Research Techniques in Animal Ecology: Controversies and Consequences, eds L. Boitani and T. K. Fuller (New York, NY: Columbia University Press), 288–331.
White, K. S., Pendleton, G. W., and Hood, E. (2009). Effects of snow on Sitka black-tailed deer browse availability and nutritional carrying capacity in southeastern Alaska. J. Wildl. Manage. 73, 481–487. doi: 10.2193/2007-499
Whiting, J. C., Stewart, K. M., Bowyer, R. T., and Flinders, J. T. (2010). Reintroduced bighorn sheep: do females adjust maternal care to compensate for late-born young? Eur. J. Wildl. Res. 56, 349–357. doi: 10.1007/s10344-009-0323-y
Keywords: transient population dynamics, ungulate, Sitka black-tailed deer, winter severity, environmental stochasticity, survival, population growth
Citation: Gilbert SL, Hundertmark KJ, Lindberg MS, Person DK and Boyce MS (2020) The Importance of Environmental Variability and Transient Population Dynamics for a Northern Ungulate. Front. Ecol. Evol. 8:531027. doi: 10.3389/fevo.2020.531027
Received: 30 January 2020; Accepted: 09 October 2020;
Published: 17 December 2020.
Edited by:
Paul Richard Krausman, University of Arizona, United StatesReviewed by:
Inger Suzanne Prange, Appalachian Wildlife Research Institute, United StatesLin Zhang, Hangzhou Normal University, China
Copyright © 2020 Gilbert, Hundertmark, Lindberg, Person and Boyce. This is an open-access article distributed under the terms of the Creative Commons Attribution License (CC BY). The use, distribution or reproduction in other forums is permitted, provided the original author(s) and the copyright owner(s) are credited and that the original publication in this journal is cited, in accordance with accepted academic practice. No use, distribution or reproduction is permitted which does not comply with these terms.
*Correspondence: Sophie L. Gilbert, c29waGllZ2lsYmVydEB1aWRhaG8uZWR1